Embed Size (px)
Citation preview

Modeling of CO2 capture by using monoethanolamine (MEA) in rotating packed bed
(RPB)
Tohid N.Borhani and Meihong Wang
Department of Chemical and Biological Engineering
12th ECCRIA Conference, Cardiff University, UK
5-7 September 2018

26/11/2018 © The University of Sheffield
2
Contents1. Introduction
1.1 Background
1.2 Motivation
1.3 Process intensification (PI)
1.4 Aim and objectives
2. Model development
2.1 Governing equations
2.2 Chemical reactions and their effects
2.3 Equilibrium calculations
2.3 Physical properties and other parameters
3. Results and discussion
3.1 Model results and validation
3.2 Effects of kinetic reaction and enhancement factor
3.3 Process analysis
3.4 Multivariable sensitivity analysis
4. Conclusions

26/11/2018 © The University of Sheffield
3
1. Introduction
1.1 Background
StripperAbsorber
Gas Stream
Treated
Gas
Rich
Solution
Lean
Solution
Lean
Solution
Reflux
Condenser
CO2
Pump
o Flowsheet of solvent-based capture Process
26/11/2018 © The University of Sheffield
4
1. Introduction
1.2 Motivation
o Large volume of CO2 to capture (E.g. a 500 MWe coal-fired power plant with about
600 kg/s flue gas flowrate emits over 8000 tons of CO2 daily) and poor mass transfer
performance in the packed beds
o Packed columns inevitably large (E.g. for 90% capture from 500 MWe coal-fired
power plant, absorber column of up to 25 m in diameter and over 27 m in height will be
needed)
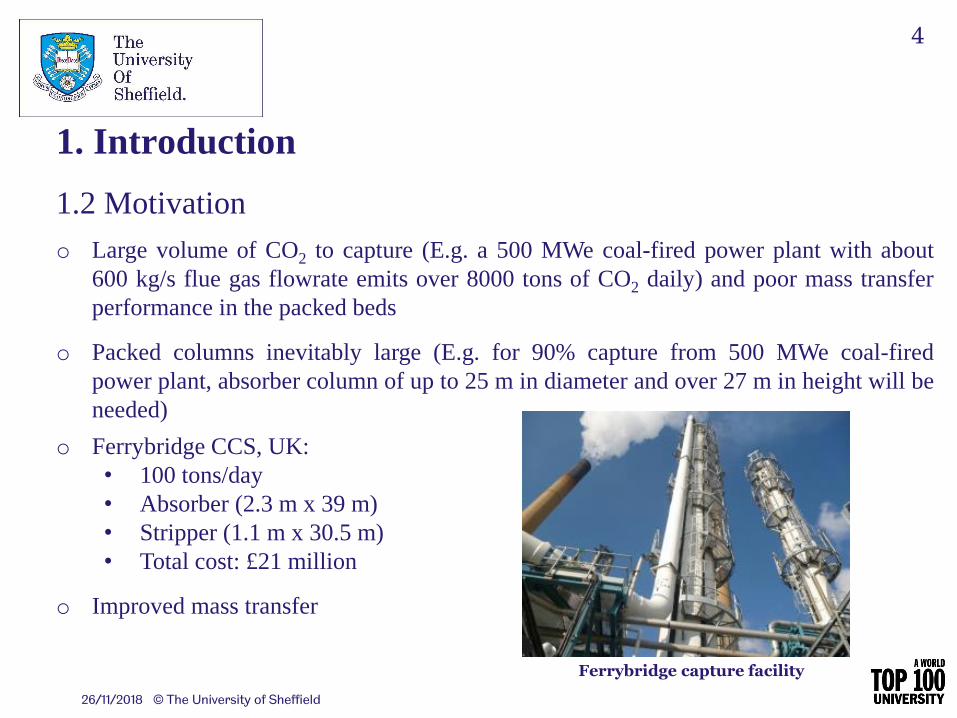
o Ferrybridge CCS, UK:
• 100 tons/day
• Absorber (2.3 m x 39 m)
• Stripper (1.1 m x 30.5 m)
• Total cost: £21 million
o Improved mass transfer
Ferrybridge capture facility

26/11/2018 © The University of Sheffield
5
1. Introduction
1.3 Process intensification
26/11/2018 © The University of Sheffield
6
1. Introduction
1.3 Process intensification
o Rotating packed bed (RPB) is the most suitable PI tool for application in
solvent-based capture process [1].
o Intensified mass transfer by centrifugal acceleration equivalent to several
gravitational acceleration (HiGee)
• Considerable increase in the mass transfer rate leading to significant reduction in
size and weight of the rigs (12 times smaller than PBs for CO2 absorber [2])
• Reduction in energy consumption
• Wider flooding limit
• Due to the short residence time in RPB, this system is proper for cases that
require short contact time

26/11/2018 © The University of Sheffield
7
1. Introduction
1.4 Aim and objectives
o Rate-base mass transfer with enhancement factor was considered to model the RPB
absorber using MEA in gPROMS
o Impact of using eight different kinetic models on the prediction of CCL is
evaluated.
o Five different enhancement factor relations are utilized to evaluate the effect of
these kinetic models.
o Process analysis is performed to find the effect of different operating factors on the
CCL.
o The orthogonal array design (OAD) method is applied to perform multivariable
sensitivity analysis

26/11/2018 © The University of Sheffield
8
2. Model development
2.1 Governing equations
o Mass balance for liquid and gas phases
o Energy balance for liquid and gas phases
𝜕 𝐹𝑔𝐶𝑝𝑔𝑇𝑔
𝜕𝑟= 𝑎𝑔𝑙𝑞𝑔𝐴𝑐 𝐵. 𝐶. :
at 𝑟 = 𝑅𝑜 ∶ 𝑇𝑔 = 𝑇𝑔,0
at 𝑟 = 𝑅𝑖 ∶𝜕(𝐹𝑔𝐶𝑝𝑔𝑇𝑔)
𝜕r= 0
𝜕 𝐹𝑙𝐶𝑝𝑙𝑇𝑙
𝜕𝑟= 𝑎𝑔𝑙𝑞𝑙𝐴𝑐 𝐵. 𝐶. :
at 𝑟 = 𝑅𝑖 ∶ 𝑇𝑙 = 𝑇𝑙,0
𝑎𝑡 𝑟 = 𝑅𝑜 ∶ 𝜕(𝐹𝑙𝐶𝑝𝑙𝑇𝑙
𝜕r= 0
𝜕 𝐹𝑔𝑦𝑖
𝜕𝑟= 𝑎𝑔𝑙𝑁𝑖 𝐴𝑐 𝐵. 𝐶. :
at 𝑟 = 𝑅𝑜 ∶ 𝑦𝑖 = 𝑦0
𝑎𝑡 𝑟 = 𝑅𝑖 ∶ 𝜕(𝐹𝑔𝑦𝑖
𝜕r= 0
𝜕 𝐹𝑙𝑥𝑖
𝜕𝑟= 𝑎𝑔𝑙𝑁𝑖𝐴𝑐 𝐵. 𝐶. :
at 𝑟 = 𝑅𝑖 ∶ 𝑥𝑖 = 𝑥0
𝑎𝑡 𝑟 = 𝑅𝑜 ∶)𝜕(𝐹𝑙𝑥𝑖
𝜕r= 0

26/11/2018 © The University of Sheffield
9
2. Model development
2.1 Governing equations
o Mass transfer rate
o Heat transfer rate for liquid and gas phases
𝑞𝑔 = ℎ𝑔𝑙 𝑇𝑙 − 𝑇𝑔
𝑞𝑙 = ℎ𝑔𝑙 𝑇𝑙 − 𝑇𝑔 − ∆𝐻𝐶𝑂2𝑁𝐶𝑂2
− ∆𝐻𝑣𝑎𝑝𝑁𝐻2𝑂
𝑁𝑖 = 𝐾𝑔,𝑖 𝑃𝑖 − 𝑃𝑖∗
1
𝐾𝑔,𝑖=
𝑅𝑔𝑇𝑔
𝑘𝑔,𝑖+
𝐻𝑒𝑙,𝑖𝐸𝑖𝑘𝑙,𝑖

26/11/2018 © The University of Sheffield
10
2. Model development
2.2 Chemical reactions and their effects
o Main reaction between CO2 and MEA [3]
o Mechanisms
• Zwitterion [4]:
• Termolecular [5]:
o Reaction rates of CO2 with MEA [6]
CO2 + 2MEA ⇄ MEACOO− + MEAH+
CO2 + MEA𝑘𝑟
⇌𝑘−𝑟
MEAH+COO−
MEAH+COO− + MEA𝑘𝐵
MEACOO− + BH+
CO2 + MEA…MEA ⇌ MEACOO− …MEAH+
𝑟𝐶𝑂2
𝑍 = 𝑘𝑜𝑏𝑠𝑍 𝐶𝑙,𝐶𝑂2
= 𝑘𝑟𝐶𝑙,𝑀𝐸𝐴𝐶𝑙,𝐶𝑂2
𝑟𝐶𝑂2
𝑇 = 𝑘𝑜𝑏𝑠𝑇 𝐶𝑙,𝐶𝑂2
= (𝑘𝑀𝐸𝐴𝑇 𝐶𝑙,𝑀𝐸𝐴 + 𝑘𝐻2𝑂
𝑇 𝐶𝑙,𝐻2𝑂)𝐶𝑙,𝑀𝐸𝐴𝐶𝑙,𝐶𝑂2

26/11/2018 © The University of Sheffield
11
2. Model development
2.2 Chemical reactions and their effects
o Kinetic modelsNo Mechanism Formula Valid condition Reference
(1) Zwitterion 𝑘𝑟 = 4.14 × 10¹¹ exp −5399
𝑇𝑙
MEA conc.TempCO2 loading
: 0.5-12 M: 298-323 K: NA
(Ying and Eimer, 2013)
(2) Zwitterion 𝑘𝑟 = 4.4 × 10¹¹ exp −5400
𝑇𝑙
MEA conc.TempCO2 loading
: 0-3.2 M: 313 K: NA
(Versteeg et al., 1996)
(3) Termolecular
𝑘𝑀𝐸𝐴 = 4.61 × 10⁹ exp −4412
𝑇𝑙
𝑘𝐻2𝑂 = 4.55 × 10⁶ exp −3287
𝑇𝑙
MEA conc.TempCO2 loading
: 3-9 M: 293-333 K: 0.1-0.49 mol/mol
(Aboudheir et al., 2003)
(4) Zwitterion 𝑘𝑟 = 3.376 × 10¹² exp −6018
𝑇𝑙
MEA conc.TempCO2 loading
: 0.5-5 M: 293-343 K: unloaded liquid
(Luo et al., 2012)
(5) Termolecular
𝑘𝑀𝐸𝐴 = 8.07 × 10¹² exp −4503
𝑇𝑙
𝑘𝐻2𝑂 = 3.51 × 10⁹ exp −3055
𝑇𝑙
MEA conc.Temp CO2 loading
: 0.5-5 M: 293-343 K: unloaded liquid
(Luo et al., 2012)
(6) Zwitterion 𝑘𝑟 = 4.396 × 10⁹ exp −3693
𝑇𝑙
MEA conc.TempCO2 loading
: 1-5 M: 298-343 K: 0-0.4 mol/mol
(Luo et al., 2015)
(7) Termolecular
𝑘𝑀𝐸𝐴 = 1.844 × 10¹⁰ exp −4112
𝑇𝑙
𝑘𝐻2𝑂 = 2.064 × 10⁵ exp −1766
𝑇𝑙
MEA conc.TempCO2 loading
: 1-5 M: 298-343 K: 0-0.4 mol/mol
(Luo et al., 2015)
(8) Termolecular
𝑘𝑀𝐸𝐴 = 2.003 × 10¹⁰ exp −4742
𝑇𝑙
𝑘𝐻2𝑂 = 4.147 × 10⁶ exp −3110
𝑇𝑙
MEA conc.TempCO2 loading
: 1-5 M: 298-343 K: 0-0.4 mol/mol
(Luo et al., 2015)

26/11/2018 © The University of Sheffield
12
2. Model development
2.2 Chemical reactions and their effects
o Enhancement factorNo Formula Description Reference
1 𝐸𝐶𝑂2= 𝐻𝑎 =
𝑘𝑜𝑏𝑠𝐷𝑙,𝐶𝑂2
𝑘𝑙,𝐶𝑂2
The pseudo first order
reaction regime enhancement
factor
(Danckwerts, 1970)
2
𝐸𝐶𝑂2= 1+
1
1𝐸𝑖 − 1
1.35
+1
𝐸1 − 1
1.351
1.35Explicit form second order
reactions(Wellek et al., 1978)
3 𝐸𝐶𝑂2= 1+ (𝐸2 − 1) 1 − exp −
𝐻𝑎 − 1
𝐸2 − 1
Explicit form second order
reactions(Porter, 1966)
4 𝐸𝐶𝑂2=
𝐻𝑎 2𝐸𝑖 − 𝐸𝐶𝑂2
𝐸𝑖 − 1
tanh 𝐻𝑎 2𝐸𝑖 − 𝐸𝐶𝑂2
𝐸𝑖 − 1
,Implicit form second order
reactions
(van Krevelen and
Hoftijzer, 1948)
5 𝐸𝐶𝑂2=
𝐸12
2 𝐸𝑖 − 11 +
4 𝐸𝑖 − 1 𝐸𝑖
𝐸12 − 1
Explicit form second order
reactions(Yeramian et al., 1970)
𝐻𝑎 =𝑘𝑜𝑏𝑠𝐷𝑙,𝐶𝑂2
𝑘𝑙,𝐶𝑂2
, 𝐸𝑖 = 1 +𝐷𝑙,𝑀𝐸𝐴𝐶𝑙,𝑀𝐸𝐴
2𝐷𝑙,𝐶𝑂2𝐶𝑙,𝐶𝑂2
𝐼 , 𝐸1 =𝐻𝑎
tanh 𝐻𝑎, 𝐸2 =
𝐷𝑙,𝐶𝑂2
𝐷𝑙,𝑀𝐸𝐴+
𝐷𝑙,𝑀𝐸𝐴
𝐷𝑙,𝐶𝑂2
𝐶𝑙,𝑀𝐸𝐴
2𝐶𝑙,𝐶𝑂2
𝐼

26/11/2018 © The University of Sheffield
13
2. Model development
2.3 Equilibrium calculations
o Chemical equilibrium
The well-known non-iterative and simple method, originally presented by
Danckwert (1970), revisited by Gabrielsen et al. (2005),
o Physical equilibrium
𝑃𝑖∗ = 𝛾𝑖𝑥𝑖𝑃𝑖
𝑣 𝑖= MEA and H2O
𝑃𝐶𝑂2
∗ = 𝛾𝐶𝑂2𝐶𝑙,𝐶𝑂2
𝐻𝑒𝑙,𝐶𝑂2

26/11/2018 © The University of Sheffield
14
2. Model development
2.4 Physical properties and other parameters Property Symbol Reference
Gas Viscosity 𝜇𝑔 Multiflash package in gPROMS
Liquid Viscosity 𝜇𝑙 (Weiland et al., 1998)
Gas density 𝜌𝑔 Multiflash package in gPROMS
Liquid density𝜌𝑙 (Weiland et al., 1998)
Gas heat capacity 𝐶𝑝𝑔 (Harun, 2012)
Liquid heat capacity 𝐶𝑝𝑙 (Agbonghae et al., 2014)
Gas side mass transfer 𝑘𝑔,𝑖 (Onda et al., 1968)
Liquid side mass transfer 𝑘𝑙,𝑖 (Tung and Mah, 1985), (Hanley and Chen, 2012), (Billet and Schultes, 1999)
Interfacial area 𝑎𝑔𝑙 (Onda et al., 1968)
Henry’s constant 𝐻𝑒𝑙,𝐶𝑂2(Ying et al., 2012)
Liquid diffusivity 𝐷𝑙,𝐶𝑂2(Ying and Eimer, 2012)
Gas diffusivity 𝐷𝑔,𝑖(Fairbanks and Wilke, 1950)
Thermal conductivity 𝜆𝑔 Multiflash package in gPROMS
Pressure drop ∆𝑃 (Llerena-Chavez and Larachi, 2009)
Heat transfer coefficient ℎ𝑔𝑙 (Chilton and Colburn, 1934)
Vapor pressure 𝑃𝑖𝑣 (Harun, 2012)
Activity coefficient 𝛾𝑖 Multiflash package in gPROMS/(Prausnitz et al., 1998)

26/11/2018 © The University of Sheffield
15
3. Results and discussions
3.1 Model results and validation
o The RPB absorber characteristics [7]
o CO2 capture level (CCL)
o Absolute relative deviation
o Absolute deviation
Parameter Values
Rotor speed (rpm) 600, 1000
The diameter of RPB (m) 0.398 (OD), 0.156 (ID)
The porosity of packing (m3/m3) 0.76
Packing type Expanded stainless steel small mesh
Packing height (m) 0.025
Total surface area (at) (m2/m3) 2132
CCL% =yCO2
in − yCO2
out
yCO2
in× 100
ARD% =CCLExp − CCLPre
CCLExp× 100
AD% = yCO2
Exp− yCO2
Pre × 100

26/11/2018 © The University of Sheffield
16
3. Results and discussions
3.1 Model results and validationo Process conditions as input to the RPB absorber (Jassim, 2002)
MEA Case-Run Rotor Speed Pressure Flow rate Temperature Liquid mole fraction Gas mole fraction
wt.% rpm atm liquid (l/min) gas (kmol/h) gas in (˚C) liquid in (˚C) H2O CO2 MEA H2O CO2 N2
56.0 1-1 600 1 39.3 2.87 47 39.6 0.6970 0.0216 0.2814 0.1679 0.0471 0.7850
53.2 1-2 600 1 39.3 2.87 47 20.7 0.7171 0.0234 0.2595 0.1690 0.0460 0.7850
56.0 1-3 1000 1 39.3 2.87 47 40.1 0.6970 0.0216 0.2814 0.1702 0.0448 0.7850
55.0 1-5 600 1 21.1 2.87 47 39.5 0.6967 0.0277 0.2756 0.1707 0.0443 0.7850
56.0 1-6 600 1 21.1 2.87 47 22.3 0.6890 0.0274 0.2836 0.1703 0.0447 0.7850
55.0 1-7 1000 1 21.1 2.87 47 39.6 0.6969 0.0276 0.2755 0.1715 0.0435 0.7850
77.0 2-2 600 1 39.3 2.87 47 21.4 0.4688 0.0200 0.5112 0.1714 0.0436 0.7850
74.0 2-3 1000 1 39.3 2.87 47 40.2 0.5057 0.0229 0.4714 0.1714 0.0436 0.7850
75.1 2-4 1000 1 39.3 2.87 47 20.7 0.5008 0.0169 0.4823 0.1721 0.0429 0.7850
76.0 2-6 600 1 21.1 2.87 47 22.1 0.4795 0.0221 0.4984 0.1712 0.0438 0.7850
75.0 2-7 1000 1 21.1 2.87 47 39.4 0.4876 0.0256 0.4868 0.1712 0.0438 0.7850
78 2-8 1000 1 21.1 2.87 47 20.6 0.4515 0.0215 0.5270 0.1697 0.0453 0.7850

26/11/2018 © The University of Sheffield
17
3. Results and discussions
3.1 Model results and validation
o Model prediction results compared to the experimental values.
Case RunExp. CO2
capture level %
Pre. CO2
capture level %ARD% between Exp. & Pre. CCL AD% between Exp. & Pre. 𝐲𝐂𝐎𝟐
1 1 94.9 90.98 4.13 0.18
1 2 83 86.86 4.65 0.18
1 3 95.4 97.58 2.28 0.10
1 5 87 88.77 2.03 0.08
1 6 84.1 84.95 1.01 0.04
1 7 89.9 93.41 3.90 0.15
2 2 84.2 90.06 6.97 0.26
2 3 97.5 98.54 1.07 0.05
2 4 91.2 97.05 6.41 0.25
2 6 84.3 87.20 3.45 0.13
2 7 98.1 97.32 0.79 0.03
2 8 91 95.88 5.36 0.22

26/11/2018 © The University of Sheffield
18
3. Results and discussions
3.2 Effects of kinetic reaction and enhancement factor
E18 E28 E38 E48 E58
27.97 28.82 27.86 27.65 27.67
MEA wt. % 𝑘𝑜𝑏𝑠1 𝑘𝑜𝑏𝑠2 𝑘𝑜𝑏𝑠3 𝑘𝑜𝑏𝑠4 𝑘𝑜𝑏𝑠5 𝑘𝑜𝑏𝑠6 𝑘𝑜𝑏𝑠7 𝑘𝑜𝑏𝑠8
55 (case 1 run 5) 74506 78928 168008 80864 219718 205574 195957 249800
74 (case 2 run 3) 110908 117491 346078 121167 452343 300530 391575 515844
CCL% (case 1 run 5) 73.61 74.49 84.21 74.54 87.44 88.09 86.45 88.77
CCL% (case 2 run 3) 87.27 87.97 97.19 88.27 98.17 96.55 97.70 98.54

26/11/2018 © The University of Sheffield
19
3. Results and discussions
3.3 Process analysis
o Effect of rotor speed
o Effect of MEA concentration in lean MEA solution
75
80
85
90
95
100
400 600 800 1000 1200
CO
2 C
aptu
re L
evel
Rotor Speed (rpm)
20 C
40 C
80
85
90
95
100
400 600 800 1000 1200
CO
2 C
aptu
re L
evel
Rotor Speed (rpm)
20 C
40 C
80
85
90
95
100
55 60 65 70 75
CO
2 C
aptu
re L
evel
%
MEA wt.% in lean MEA solution
600 RPM
1000 RPM
80
85
90
95
100
55 60 65 70 75
CO
2 C
aptu
re L
evel
%
MEA wt.% in lean MEA solution
600 RPM
1000 RPM
55 wt.% 75 wt.%
20 oC40 oC

26/11/2018 © The University of Sheffield
20
3. Results and discussions
3.3 Process analysis
o Effect lean MEA solution temperature
o Effect of lean MEA solution flow rate
80
85
90
95
100
20.00 30.00 40.00 50.00 60.00
CO
2 C
aptu
re L
evel
%
Lean MEA solution Temperature ºC
600 RPM
1000 RPM
80
85
90
95
100
20.00 30.00 40.00 50.00 60.00
CO
2 C
aptu
re L
evel
%Lean MEA solution Temperature ºC
600 RPM
1000 RPM
80
85
90
95
100
20 25 30 35 40
CO
2 C
aptu
re L
evel
%
Lean MEA solution flow rate L/min
600 RPM
1000 RPM
80
85
90
95
100
20 25 30 35 40
CO
2 C
aptu
re L
evel
%
Lean MEA solution flow rate L/min
600 RPM
1000 RPM
55 wt.% 75 wt.%
55 wt.% 75 wt.%

26/11/2018 © The University of Sheffield
21
3. Results and discussions
3.3 Multivariable sensitivity analysis
o The OAD method (Taguchi et al., 1987) is a statistical method that canbe used to find the desired operating condition of a system with respectto different input conditions
o The selected factors and their levels of CCL% and motor power.
Factors Level 1 Level 2 Level 3 Level 4 Level 5
Rotor Speed (RPM) 400 600 800 1000 1200
MEA Concentration (wt.%) 55 60 65 70 75
Liquid temperature (oC) 20 30 40 50 60
Liquid flow rate (L/min) 20 25 30 35 40

26/11/2018 © The University of Sheffield
22
3. Results and discussions
3.3 Multivariable sensitivity analysis
o The amount of power that consumed by the motor of RPB absorber(Singh et al., 1992):
• 𝑃𝑚𝑜𝑡𝑜𝑟 is motor power (kW),
• 𝜌𝑙 is the density of liquid phase (kg/m3),
• 𝑅𝑜 is the outer radius of RPB (m),
• 𝜔 is angular velocity (rad/s),
• 𝑄𝑙′ is the volumetric flow rate of lean MEA solution (L/min)
𝑃𝑚𝑜𝑡𝑜𝑟 = 1.2 + 0.1833 × 10⁻⁷𝜌𝑙𝑅𝑜2𝜔2𝑄𝑙
′

26/11/2018 © The University of Sheffield
23
3. Results and discussions
3.3 Multivariable sensitivity analysisInputs to the gPROMS model Outputs of the gPROMS model
Run Rotor Speed (rpm) Cl, MEA (wt.%) Tl (oC) 𝑸𝒍′ (L/min) Pmotor (kW) CCL% SNR
1 400 55 20 20 145.595 65.94 36.38
2 400 60 30 25 180.391 73.77 37.36
3 400 65 40 30 214.668 80.68 38.14
4 400 70 50 35 247.891 86.67 38.76
5 400 75 60 40 280.154 91.39 39.22
6 600 60 20 30 486.449 85.88 38.68
7 600 65 30 35 563.418 90.47 39.13
8 600 70 40 40 637.896 94.09 39.47
9 600 75 50 20 318.285 91.46 39.22
10 600 55 60 25 401.214 89.40 39.03
11 800 65 20 40 1146.863 95.10 39.56
12 800 70 30 20 573.305 92.26 39.30
13 800 75 40 25 707.737 95.92 39.64
14 800 55 50 30 857.805 93.36 39.40
15 800 60 60 35 988.983 97.30 39.76
16 1000 70 20 25 1120.574 95.78 39.63
17 1000 75 30 30 1330.073 97.86 39.81
18 1000 55 40 35 1562.720 97.01 39.74
19 1000 60 50 40 1770.769 98.63 39.88
20 1000 65 60 20 885.988 97.63 39.79
21 1200 75 20 35 2240.795 98.84 39.90
22 1200 55 30 40 2580.760 98.32 39.85
23 1200 60 40 20 1291.131 97.08 39.74
24 1200 65 50 25 1596.318 98.85 39.90
25 1200 70 60 30 1894.319 99.59 39.96

26/11/2018 © The University of Sheffield
24
4. Conclusion
o ARD% between the experimental and the predicted CCL% value is changing
between 0.79 and 6.97 and the AARD% for them is 3.50
o AD% between the experimental and the predicted fractions of CO2 in the gas
phase is changing between 0.03 and 0.26, and the AAD% for them is 0.14.
o The kinetic model has a significant effect on the model results but the
enhancement factor relation is not much influential
o The OAD method can provide different scenario and combination of factors
affecting on CCL% and motor power and help to find the proper combination of
four factors that resulted in the low motor power

References
26/11/2018 © The University of Sheffield
25
1.Wang, M., et al., Process intensification for post-combustion CO2 capture with chemical absorption: A critical
review. Applied Energy, 2015. 158: p. 275-291.
2.Joel, A.S., et al., Process analysis of intensified absorber for post-combustion CO2 capture through modelling and
simulation. International Journal of Greenhouse Gas Control, 2014. 21: p. 91-100.
3.Luo, X., et al., Mass transfer and kinetics of carbon dioxide absorption into loaded aqueous monoethanolamine
solutions. Chemical Engineering Science, 2015. 123(Supplement C): p. 57-69.
4.Caplow, M., Kinetics of carbamate formation and breakdown. Journal of the American Chemical Society, 1968.
90(24): p. 6795-6803.
5.Crooks, J.E. and J.P. Donnellan, Kinetics and mechanism of the reaction between carbon dioxide and amines in
aqueous solution. Journal of the Chemical Society, Perkin Transactions 2, 1989(4): p. 331-333.
6.Vaidya, P.D. and E.Y. Kenig, A Study on CO2 Absorption Kinetics by Aqueous Solutions of N,N-
Diethylethanolamine and N-Ethylethanolamine. Chemical Engineering & Technology, 2009. 32(4): p. 556-563.
7.Jassim, M.S., et al., Carbon Dioxide Absorption and Desorption in Aqueous Monoethanolamine Solutions in a
Rotating Packed Bed. Industrial & Engineering Chemistry Research, 2007. 46(9): p. 2823-2833.

26/11/2018 © The University of Sheffield
26
Acknowledgement

Thank you for your Attention!
Prof Meihong Wang Dept of Chemical and Biological EngineeringUniversity of Sheffield, [email protected]
Dr Tohid N.BorhaniDept of Chemical and Biological EngineeringUniversity of Sheffield, [email protected]