Embed Size (px)
Citation preview
1
1.2.4.E - Drainage System
3. (c) Access/drainage easements and access drives are required for those detention,
retention and water quality facilities for single-family or duplex residential development and/or for such facilities that will be maintained by the City. Access drives shall have a longitudinal slope not to exceed 15%, a transverse slope not to exceed 5%, no vertical grade break greater than 12%, no vertical curve with grade change greater than 1% per horizontal foot, a centerline turning radius of no less than 50 feet, and a minimum width of 12 feet. The access drive shall include a means for equipment to turn around when located more than 200 feet from a paved public roadway. Access drives shall be cleared, graded and stabilized with stones in accordance with Figure 1-2 in Appendix D of this manual Standard Detail 662S- 2, Pond Maintenance Access Typical Cross Section.
10. Points of access to water quality and detention facilities for single-family or duplex residential development and/or for such facilities that will be maintained by the City shall have a standard City of Austin Type II concrete driveway approach and curb cut on the abutting street. A pipe gate is required at the end of the driveway at the ROW limits. See Figure 1-3 in Appendix D of the Drainage Criteria Manual for details in accordance with Standard Detail 662S-1, Standard Pipe Gate.
12. Section 1.6.3.B of the ECM shall apply to all drainage facilities for single-family or duplex residential development and/or for such facilities that will be maintained by the City.Environmental Criteria Manual Section 1.6.3 shall apply to all Stormwater Control Measures (SCMs), detention, and retention facilities and their appurtenances.
16. Signs stating "Stormwater Facility - No Vehicles Allowed. No Dumping. Violators will be prosecuted. For information call the City of Austin." Signs are required on each side of a single-family residential, duplex residential, and/or City-maintained stormwater pondcontrol measure. See in accordance with Standard Detail 662S-3 – Stormwater Drainage Facility Sign.
8.5.0 - DETENTION BASIN MAINTENANCE AND EQUIPMENT ACCESS REQUIREMENTS
Refer to Section 1.6.3.C of the Environmental Criteria Manual and1.2.4. For subsurface ponds see Environmental Criteria Manual Section 1.6.2(E).
APPENDIX E - CRITERIA FOR ESTABLISHING AN EROSION HAZARD ZONE
Purpose
City of Austin, Watershed Protection Department
This document serves as criteria for delineation of an Erosion Hazard Zone (EHZ), defined as:
An area where stream channel erosion is likely to result in damage to or loss of property, buildings, infrastructure, utilities or other valued resources.
An Erosion Hazard Zone provides a boundary outside of which resources are not expected to be threatened as a result of future stream erosion. This document provides criteria to planners, designers and regulators in evaluating the potential impact from erosion for proposed development near defined waterways.
The following criteria provides a 'Level 1', analysis that was developed based on observed erosion rates in Austin to predict an Erosion Hazard Zone that is considered sufficient without a high level of site-specific hydrologic, soil, and geomorphic information. An applicant may opt to perform a 'Level 2' analysis using more robust technical procedures and detailed site-specific information, as approved by the Watershed Protection Department.
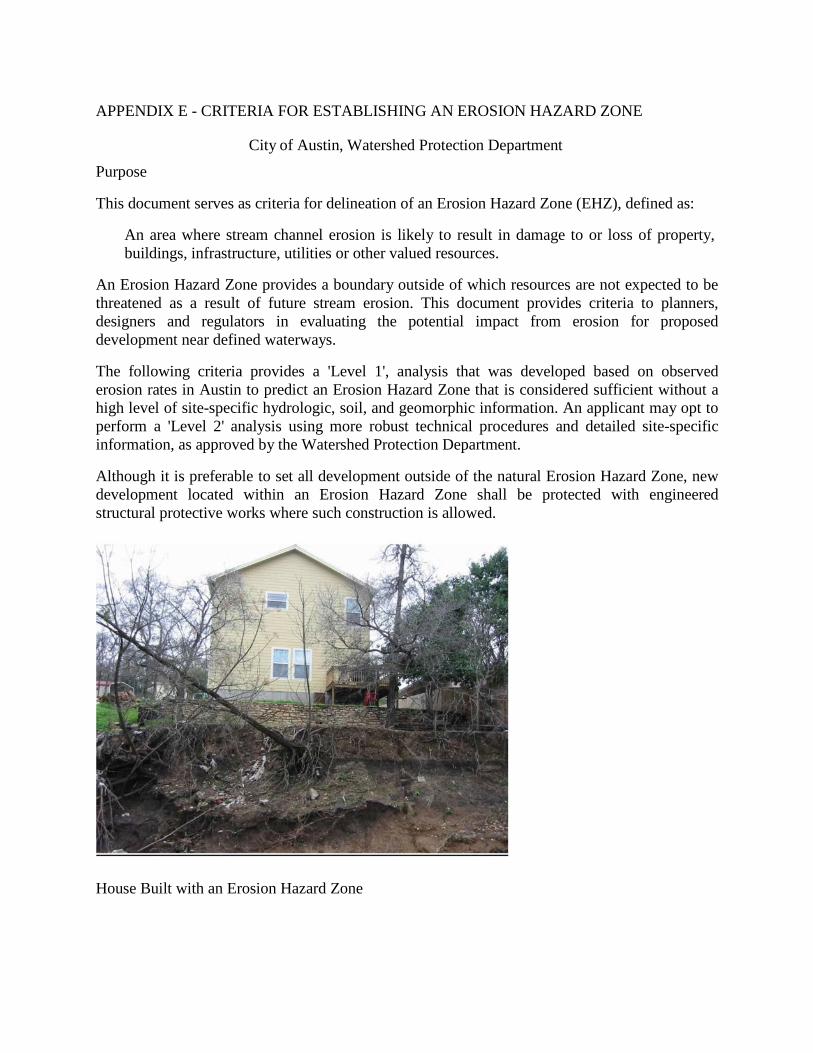
Although it is preferable to set all development outside of the natural Erosion Hazard Zone, new development located within an Erosion Hazard Zone shall be protected with engineered structural protective works where such construction is allowed.
House Built with an Erosion Hazard Zone
Page 2
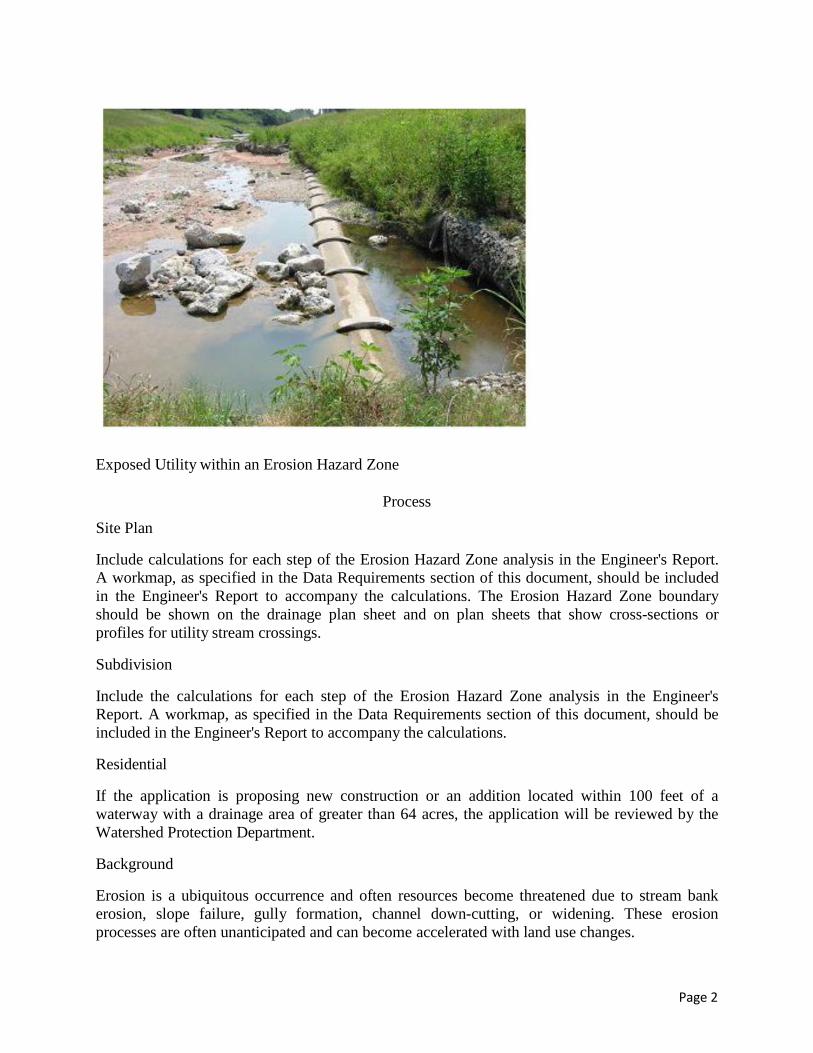
Exposed Utility within an Erosion Hazard Zone
Site Plan
Process
Include calculations for each step of the Erosion Hazard Zone analysis in the Engineer's Report. A workmap, as specified in the Data Requirements section of this document, should be included in the Engineer's Report to accompany the calculations. The Erosion Hazard Zone boundary should be shown on the drainage plan sheet and on plan sheets that show cross-sections or profiles for utility stream crossings.
Subdivision
Include the calculations for each step of the Erosion Hazard Zone analysis in the Engineer's Report. A workmap, as specified in the Data Requirements section of this document, should be included in the Engineer's Report to accompany the calculations.
Residential
If the application is proposing new construction or an addition located within 100 feet of a waterway with a drainage area of greater than 64 acres, the application will be reviewed by the Watershed Protection Department.
Background
Erosion is a ubiquitous occurrence and often resources become threatened due to stream bank erosion, slope failure, gully formation, channel down-cutting, or widening. These erosion processes are often unanticipated and can become accelerated with land use changes.
Page 3
The City of Austin spends millions of dollars to stabilize channels where houses, fences, streets, utility lines, and other resources that are threatened by erosion. In most cases, determination of an Erosion Hazard Zone based on anticipated channel changes would have protected these resources from harm.
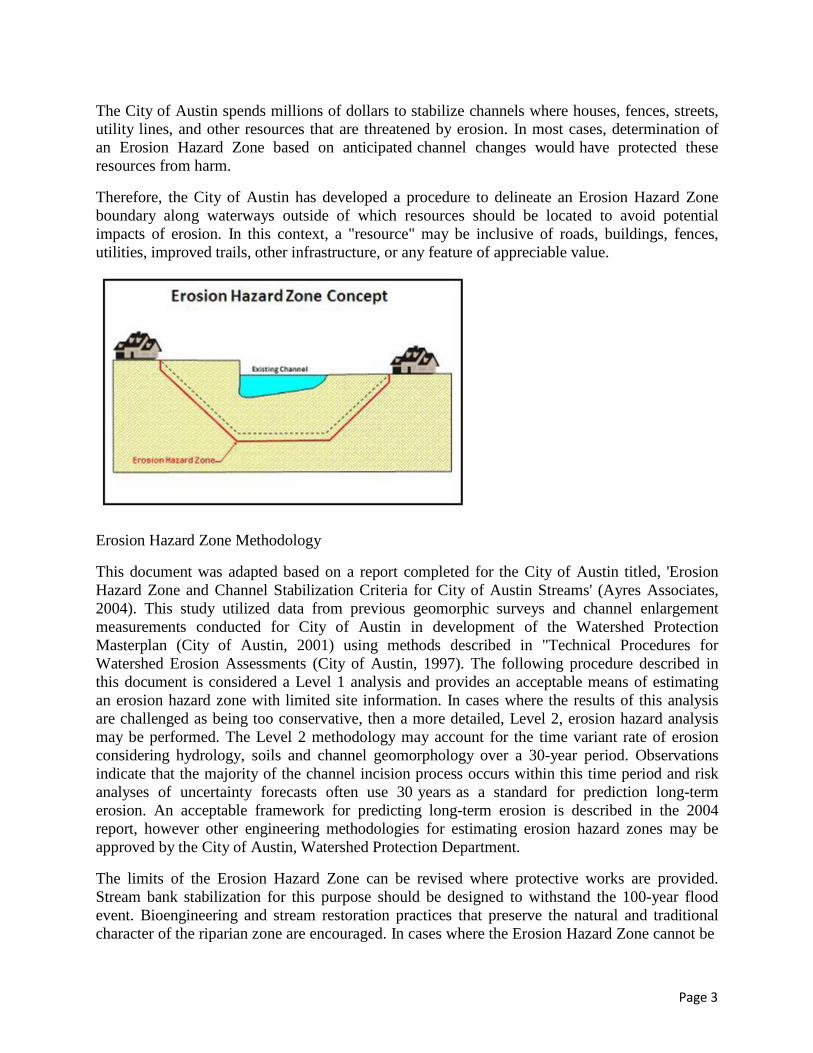
Therefore, the City of Austin has developed a procedure to delineate an Erosion Hazard Zone boundary along waterways outside of which resources should be located to avoid potential impacts of erosion. In this context, a "resource" may be inclusive of roads, buildings, fences, utilities, improved trails, other infrastructure, or any feature of appreciable value.
Erosion Hazard Zone Methodology
This document was adapted based on a report completed for the City of Austin titled, 'Erosion Hazard Zone and Channel Stabilization Criteria for City of Austin Streams' (Ayres Associates, 2004). This study utilized data from previous geomorphic surveys and channel enlargement measurements conducted for City of Austin in development of the Watershed Protection Masterplan (City of Austin, 2001) using methods described in "Technical Procedures for Watershed Erosion Assessments (City of Austin, 1997). The following procedure described in this document is considered a Level 1 analysis and provides an acceptable means of estimating an erosion hazard zone with limited site information. In cases where the results of this analysis are challenged as being too conservative, then a more detailed, Level 2, erosion hazard analysis may be performed. The Level 2 methodology may account for the time variant rate of erosion considering hydrology, soils and channel geomorphology over a 30-year period. Observations indicate that the majority of the channel incision process occurs within this time period and risk analyses of uncertainty forecasts often use 30 years as a standard for prediction long-term erosion. An acceptable framework for predicting long-term erosion is described in the 2004 report, however other engineering methodologies for estimating erosion hazard zones may be approved by the City of Austin, Watershed Protection Department.
The limits of the Erosion Hazard Zone can be revised where protective works are provided. Stream bank stabilization for this purpose should be designed to withstand the 100-year flood event. Bioengineering and stream restoration practices that preserve the natural and traditional character of the riparian zone are encouraged. In cases where the Erosion Hazard Zone cannot be
Page 4
avoided or revised via channel stabilization, the structural design of proposed improvements within the EHZ boundary must be adequate to withstand loadings for the eroded conditions during the 100-year flood event and not create a public health and safety hazard if exposed. Stream stabilization and protected features within the Erosion Hazard Zone must comply with all other LDC requirements and shall not create adverse impact by redirecting flow, reducing conveyance, collecting debris, degrading water quality, or damaging ecological health in the riparian zone.
Erosion Hazard Zone Analysis
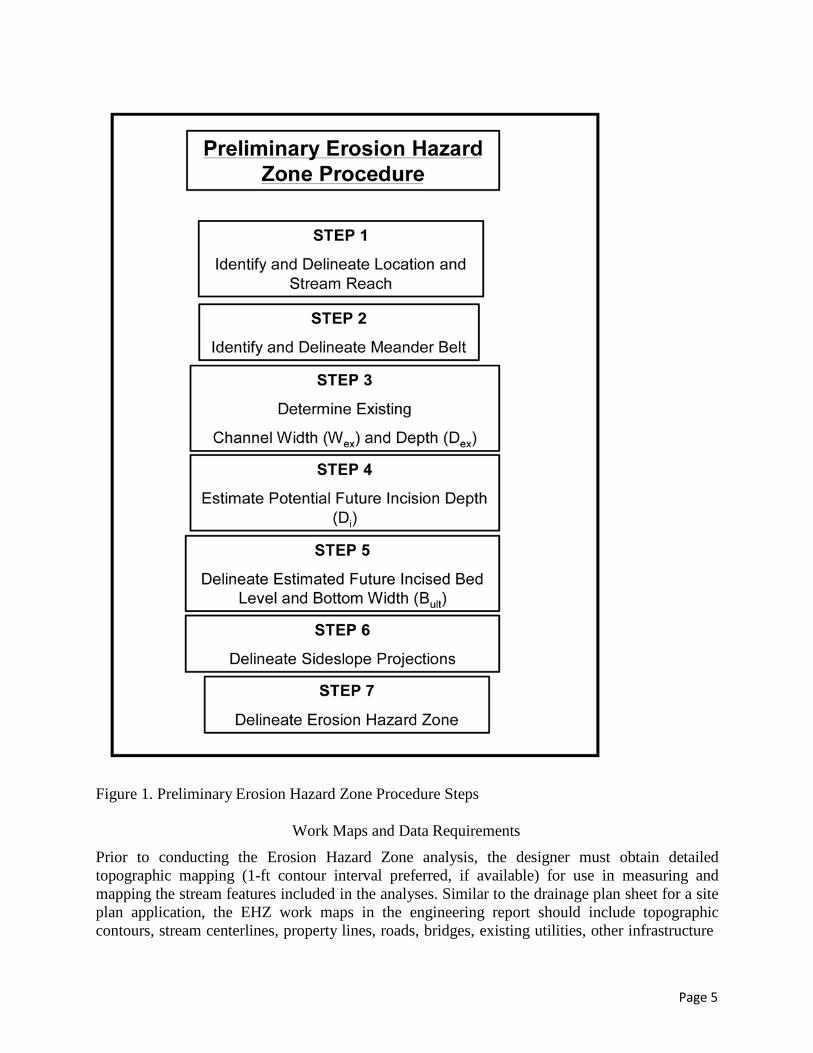
There are seven steps to be conducted in the determination of the Level 1 Erosion Hazard Zone analysis, as outlined in Figure 1.
Page 5
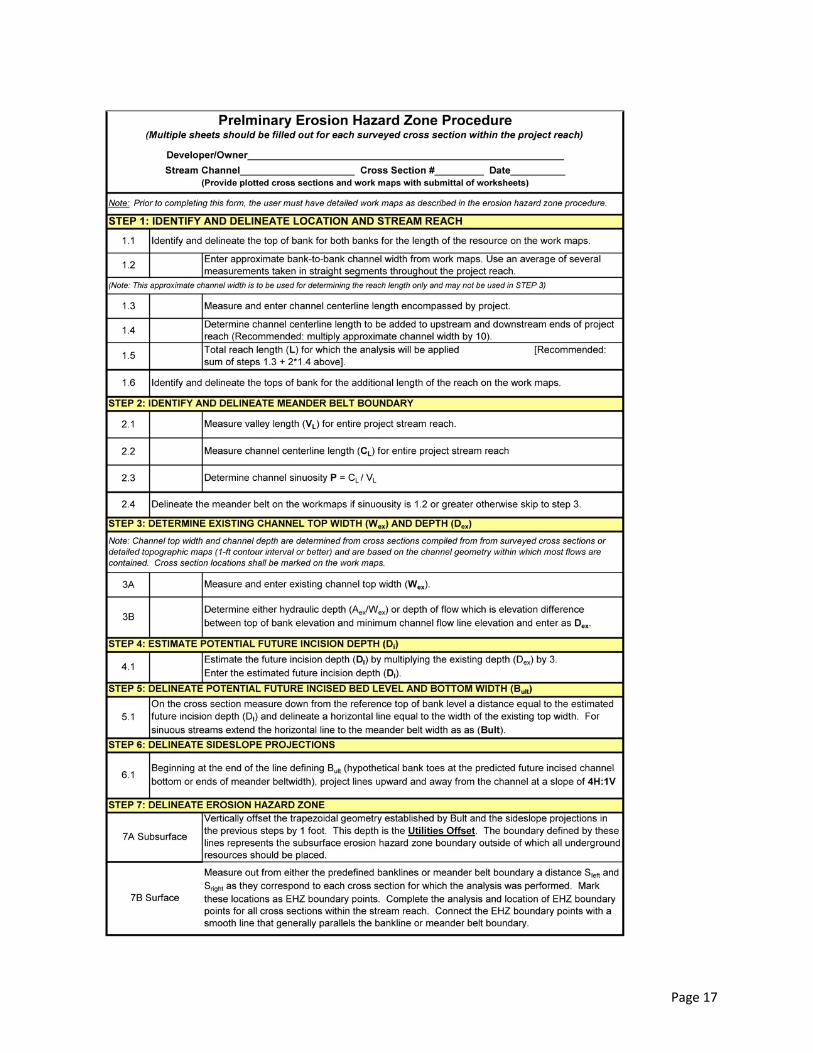
Figure 1. Preliminary Erosion Hazard Zone Procedure Steps
Work Maps and Data Requirements
Prior to conducting the Erosion Hazard Zone analysis, the designer must obtain detailed topographic mapping (1-ft contour interval preferred, if available) for use in measuring and mapping the stream features included in the analyses. Similar to the drainage plan sheet for a site plan application, the EHZ work maps in the engineering report should include topographic contours, stream centerlines, property lines, roads, bridges, existing utilities, other infrastructure
Page 6
and resources of interest. Current aerial photography is also useful in identifying riparian vegetation and geomorphic features affecting stream stability. The work maps will be used to delineate the planimetric limits of the Erosion Hazard Zone.
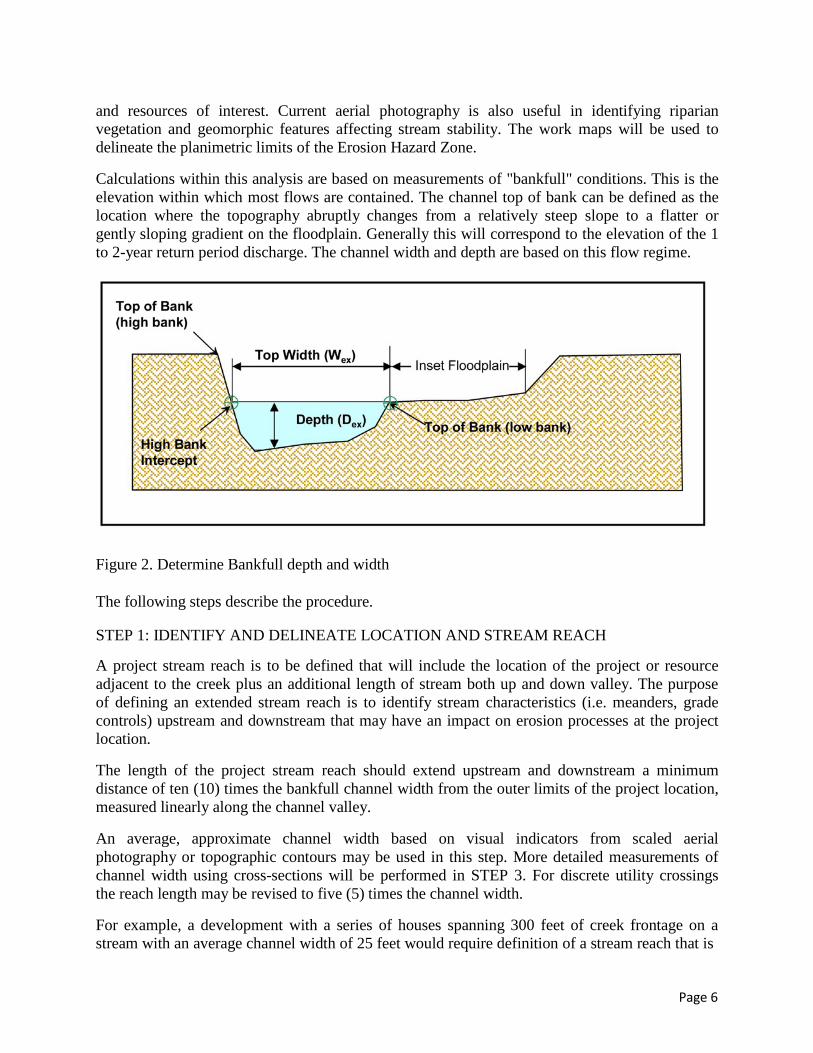
Calculations within this analysis are based on measurements of "bankfull" conditions. This is the elevation within which most flows are contained. The channel top of bank can be defined as the location where the topography abruptly changes from a relatively steep slope to a flatter or gently sloping gradient on the floodplain. Generally this will correspond to the elevation of the 1 to 2-year return period discharge. The channel width and depth are based on this flow regime.
Figure 2. Determine Bankfull depth and width
The following steps describe the procedure.
STEP 1: IDENTIFY AND DELINEATE LOCATION AND STREAM REACH
A project stream reach is to be defined that will include the location of the project or resource adjacent to the creek plus an additional length of stream both up and down valley. The purpose of defining an extended stream reach is to identify stream characteristics (i.e. meanders, grade controls) upstream and downstream that may have an impact on erosion processes at the project location.
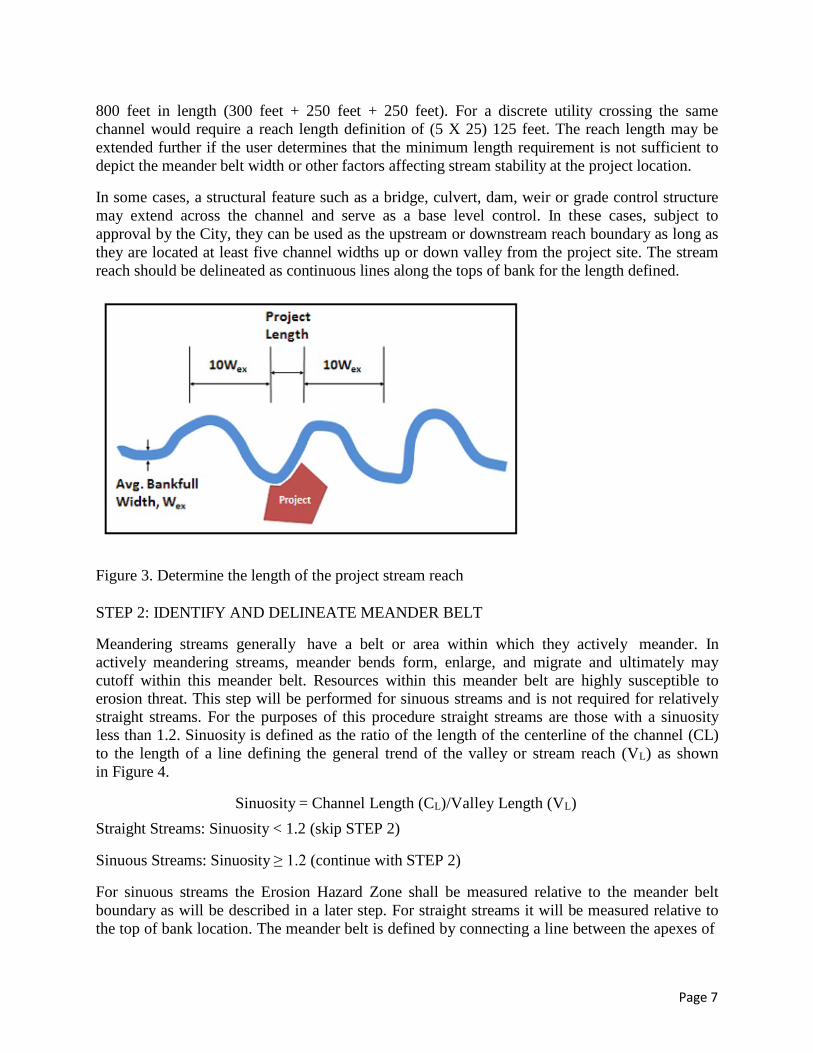
The length of the project stream reach should extend upstream and downstream a minimum distance of ten (10) times the bankfull channel width from the outer limits of the project location, measured linearly along the channel valley.
An average, approximate channel width based on visual indicators from scaled aerial photography or topographic contours may be used in this step. More detailed measurements of channel width using cross-sections will be performed in STEP 3. For discrete utility crossings the reach length may be revised to five (5) times the channel width.
For example, a development with a series of houses spanning 300 feet of creek frontage on a stream with an average channel width of 25 feet would require definition of a stream reach that is
Page 7
800 feet in length (300 feet + 250 feet + 250 feet). For a discrete utility crossing the same channel would require a reach length definition of (5 X 25) 125 feet. The reach length may be extended further if the user determines that the minimum length requirement is not sufficient to depict the meander belt width or other factors affecting stream stability at the project location.
In some cases, a structural feature such as a bridge, culvert, dam, weir or grade control structure may extend across the channel and serve as a base level control. In these cases, subject to approval by the City, they can be used as the upstream or downstream reach boundary as long as they are located at least five channel widths up or down valley from the project site. The stream reach should be delineated as continuous lines along the tops of bank for the length defined.
Figure 3. Determine the length of the project stream reach
STEP 2: IDENTIFY AND DELINEATE MEANDER BELT
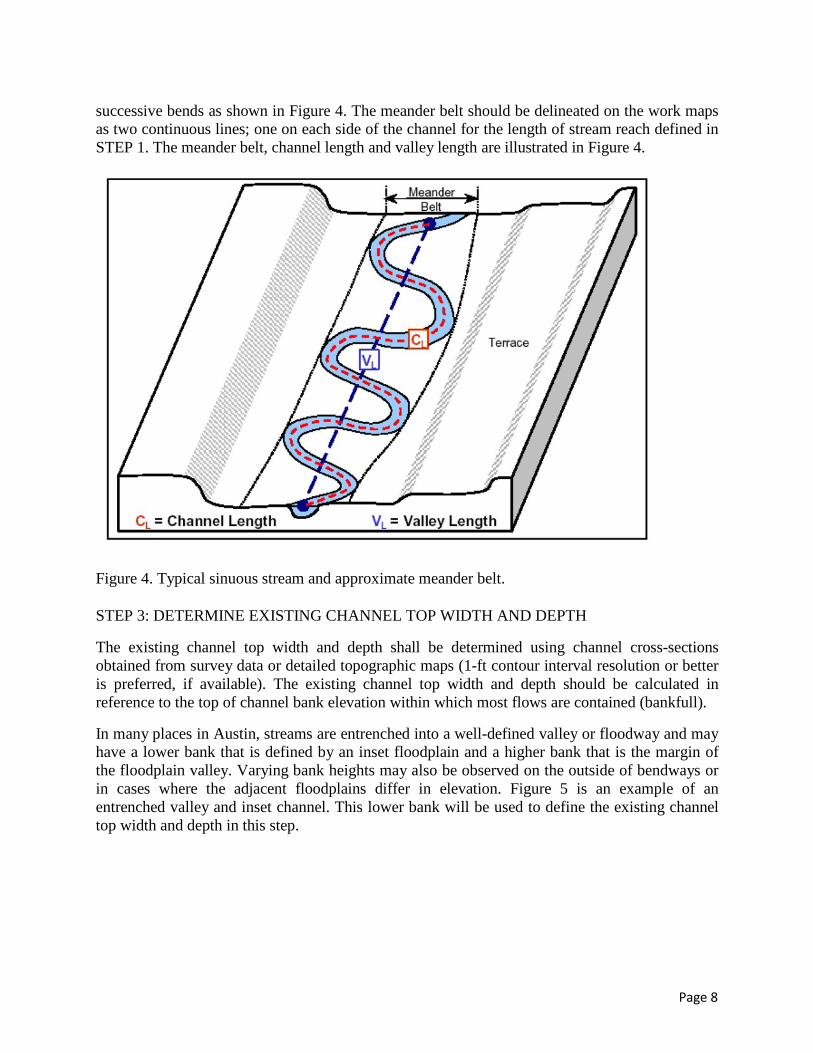
Meandering streams generally have a belt or area within which they actively meander. In actively meandering streams, meander bends form, enlarge, and migrate and ultimately may cutoff within this meander belt. Resources within this meander belt are highly susceptible to erosion threat. This step will be performed for sinuous streams and is not required for relatively straight streams. For the purposes of this procedure straight streams are those with a sinuosity less than 1.2. Sinuosity is defined as the ratio of the length of the centerline of the channel (CL) to the length of a line defining the general trend of the valley or stream reach (VL) as shown in Figure 4.
Sinuosity = Channel Length (CL)/Valley Length (VL) Straight Streams: Sinuosity < 1.2 (skip STEP 2)
Sinuous Streams: Sinuosity ≥ 1.2 (continue with STEP 2)
For sinuous streams the Erosion Hazard Zone shall be measured relative to the meander belt boundary as will be described in a later step. For straight streams it will be measured relative to the top of bank location. The meander belt is defined by connecting a line between the apexes of
Page 8
successive bends as shown in Figure 4. The meander belt should be delineated on the work maps as two continuous lines; one on each side of the channel for the length of stream reach defined in STEP 1. The meander belt, channel length and valley length are illustrated in Figure 4.
Figure 4. Typical sinuous stream and approximate meander belt.
STEP 3: DETERMINE EXISTING CHANNEL TOP WIDTH AND DEPTH
The existing channel top width and depth shall be determined using channel cross-sections obtained from survey data or detailed topographic maps (1-ft contour interval resolution or better is preferred, if available). The existing channel top width and depth should be calculated in reference to the top of channel bank elevation within which most flows are contained (bankfull).
In many places in Austin, streams are entrenched into a well-defined valley or floodway and may have a lower bank that is defined by an inset floodplain and a higher bank that is the margin of the floodplain valley. Varying bank heights may also be observed on the outside of bendways or in cases where the adjacent floodplains differ in elevation. Figure 5 is an example of an entrenched valley and inset channel. This lower bank will be used to define the existing channel top width and depth in this step.
Page 9
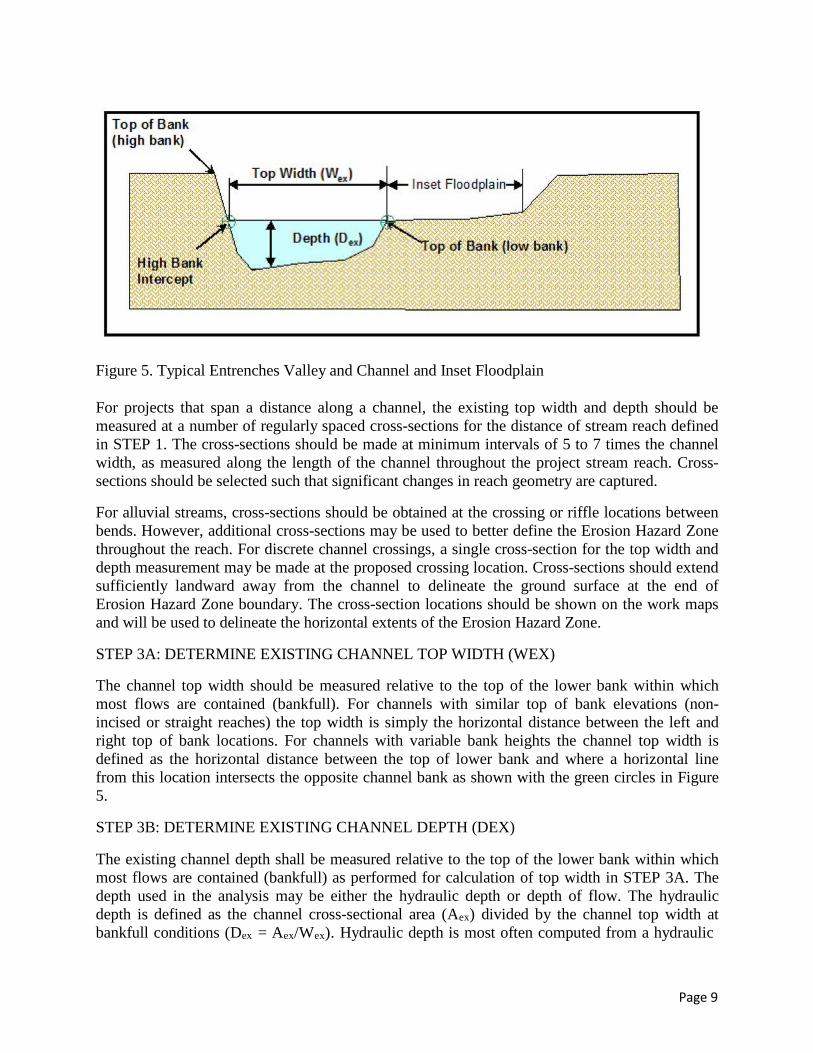
Figure 5. Typical Entrenches Valley and Channel and Inset Floodplain For projects that span a distance along a channel, the existing top width and depth should be measured at a number of regularly spaced cross-sections for the distance of stream reach defined in STEP 1. The cross-sections should be made at minimum intervals of 5 to 7 times the channel width, as measured along the length of the channel throughout the project stream reach. Cross- sections should be selected such that significant changes in reach geometry are captured.
For alluvial streams, cross-sections should be obtained at the crossing or riffle locations between bends. However, additional cross-sections may be used to better define the Erosion Hazard Zone throughout the reach. For discrete channel crossings, a single cross-section for the top width and depth measurement may be made at the proposed crossing location. Cross-sections should extend sufficiently landward away from the channel to delineate the ground surface at the end of Erosion Hazard Zone boundary. The cross-section locations should be shown on the work maps and will be used to delineate the horizontal extents of the Erosion Hazard Zone.
STEP 3A: DETERMINE EXISTING CHANNEL TOP WIDTH (WEX)
The channel top width should be measured relative to the top of the lower bank within which most flows are contained (bankfull). For channels with similar top of bank elevations (non- incised or straight reaches) the top width is simply the horizontal distance between the left and right top of bank locations. For channels with variable bank heights the channel top width is defined as the horizontal distance between the top of lower bank and where a horizontal line from this location intersects the opposite channel bank as shown with the green circles in Figure 5.
STEP 3B: DETERMINE EXISTING CHANNEL DEPTH (DEX)
The existing channel depth shall be measured relative to the top of the lower bank within which most flows are contained (bankfull) as performed for calculation of top width in STEP 3A. The depth used in the analysis may be either the hydraulic depth or depth of flow. The hydraulic depth is defined as the channel cross-sectional area (Aex) divided by the channel top width at bankfull conditions (Dex = Aex/Wex). Hydraulic depth is most often computed from a hydraulic
Page 10
model or cross-section analysis program. The depth of flow is simply the vertical distance between the channel top of bank elevation and the minimum channel flow line elevation and does not require calculation of channel area. Generally, the depth of flow is larger than the hydraulic depth and will provide a more conservative estimate of the potential future incision depth and a larger erosion hazard zone.
STEP 4: ESTIMATE POTENTIAL FUTURE INCISION DEPTH (DI)
The potential future incision depth represents the anticipated depth to which a channel may erode over time. Urbanization of natural streams can result in significant channel down-cutting and observations in the Austin area show that the incision depth may be as much as or greater than three times the pre-development depth. Therefore, for the purposes of the Level 1 Erosion Hazard Zone analysis, the future incision depth (Di) will be calculated as 3 times the existing average depth (Dex).
Di = Dex * 3 For example, a channel with an initial depth of 2 feet may ultimately achieve a total depth of 6 feet following erosion.
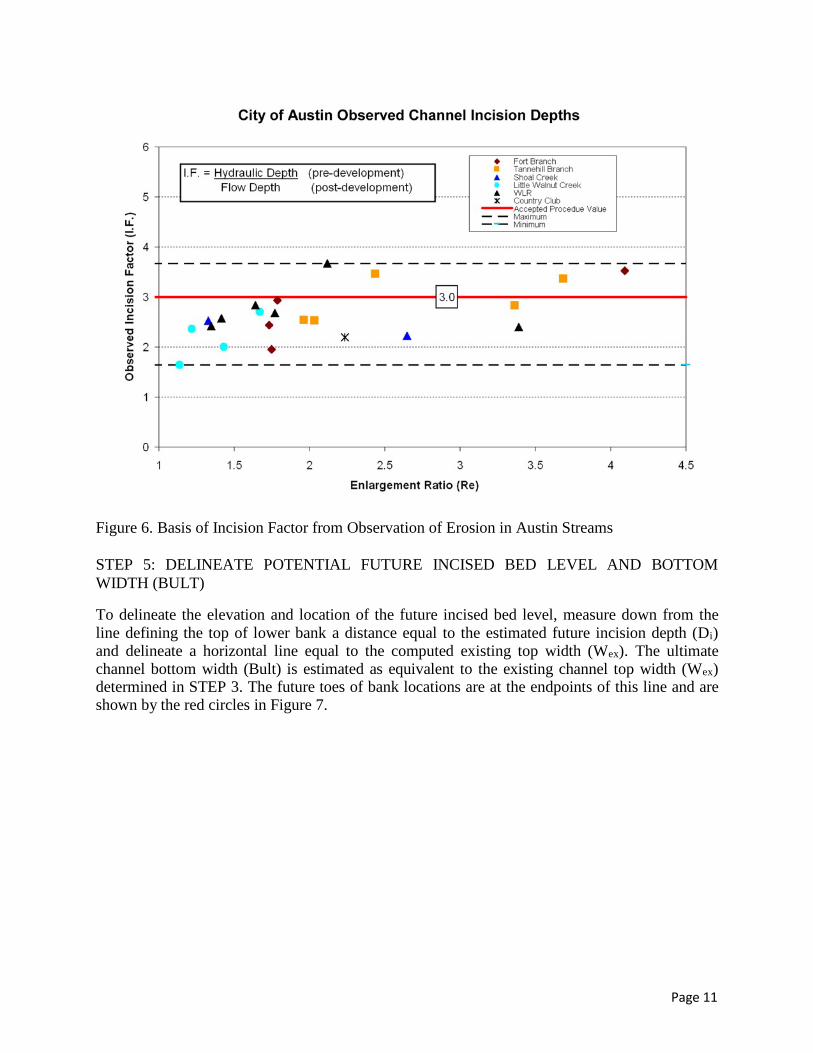
The scale value of three (3) represents an "incision factor" that was based on evaluation of observed erosion in Austin streams. Comparison of historic channel cross section geometry changes at utility line crossings was performed throughout the City during development of the Watershed Masterplan. Figure 6 illustrates individual measurements for various watersheds. The observed change in channel depth varies for each site, but a reasonable yet slightly conservative value of three (3) was selected for broad application in the Level 1 analysis.
There are numerous factors that can influence the incision depth potential including channel type, geology, soils, land use, existing state of channel evolution and other structural controls. A hard bedrock channel bottom may have minimal potential for channel incision. Local grade controls may reduce the incision factor. Where hard bedrock and/or grade control exists throughout the stream reach designated for the proposed developed, the incision factor may be reduced to a factor of 1.0. Soft rock, shale, marls and clays can be more resistant to erosion temporally, but generally have a similar long-term response to alluvial materials, but over a longer time scale. Where channel incision may have occurred in response to land use changes, the incision factor can be discounted to account for the historical erosion. The design life of the project may also influence the incision factor utilized where soft rock to cohesive materials exist as the time rate of erosion is more important. For these conditions and other cases where a more precise incision factor is proposed, a Level 2 or alternative analysis should be provided.
Page 11
Figure 6. Basis of Incision Factor from Observation of Erosion in Austin Streams STEP 5: DELINEATE POTENTIAL FUTURE INCISED BED LEVEL AND BOTTOM WIDTH (BULT)
To delineate the elevation and location of the future incised bed level, measure down from the line defining the top of lower bank a distance equal to the estimated future incision depth (Di) and delineate a horizontal line equal to the computed existing top width (Wex). The ultimate channel bottom width (Bult) is estimated as equivalent to the existing channel top width (Wex) determined in STEP 3. The future toes of bank locations are at the endpoints of this line and are shown by the red circles in Figure 7.
Page 12
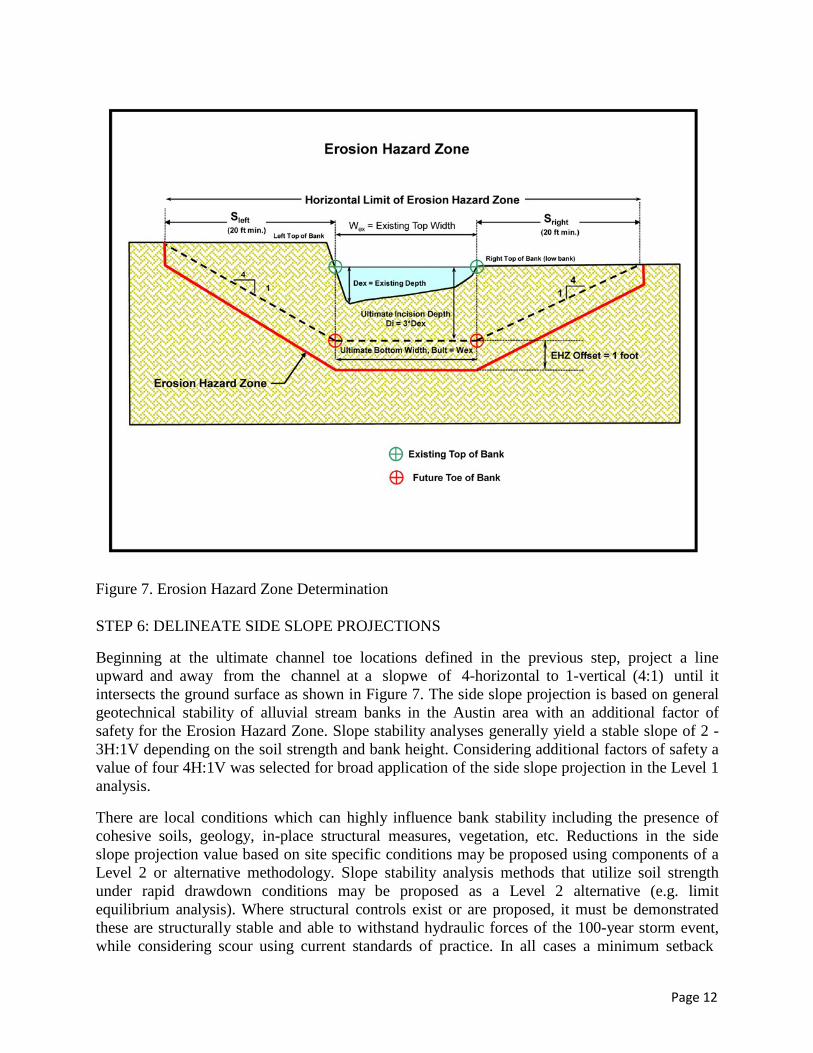
Figure 7. Erosion Hazard Zone Determination STEP 6: DELINEATE SIDE SLOPE PROJECTIONS
Beginning at the ultimate channel toe locations defined in the previous step, project a line upward and away from the channel at a slopwe of 4-horizontal to 1-vertical (4:1) until it intersects the ground surface as shown in Figure 7. The side slope projection is based on general geotechnical stability of alluvial stream banks in the Austin area with an additional factor of safety for the Erosion Hazard Zone. Slope stability analyses generally yield a stable slope of 2 - 3H:1V depending on the soil strength and bank height. Considering additional factors of safety a value of four 4H:1V was selected for broad application of the side slope projection in the Level 1 analysis.
There are local conditions which can highly influence bank stability including the presence of cohesive soils, geology, in-place structural measures, vegetation, etc. Reductions in the side slope projection value based on site specific conditions may be proposed using components of a Level 2 or alternative methodology. Slope stability analysis methods that utilize soil strength under rapid drawdown conditions may be proposed as a Level 2 alternative (e.g. limit equilibrium analysis). Where structural controls exist or are proposed, it must be demonstrated these are structurally stable and able to withstand hydraulic forces of the 100-year storm event, while considering scour using current standards of practice. In all cases a minimum setback
Page 13
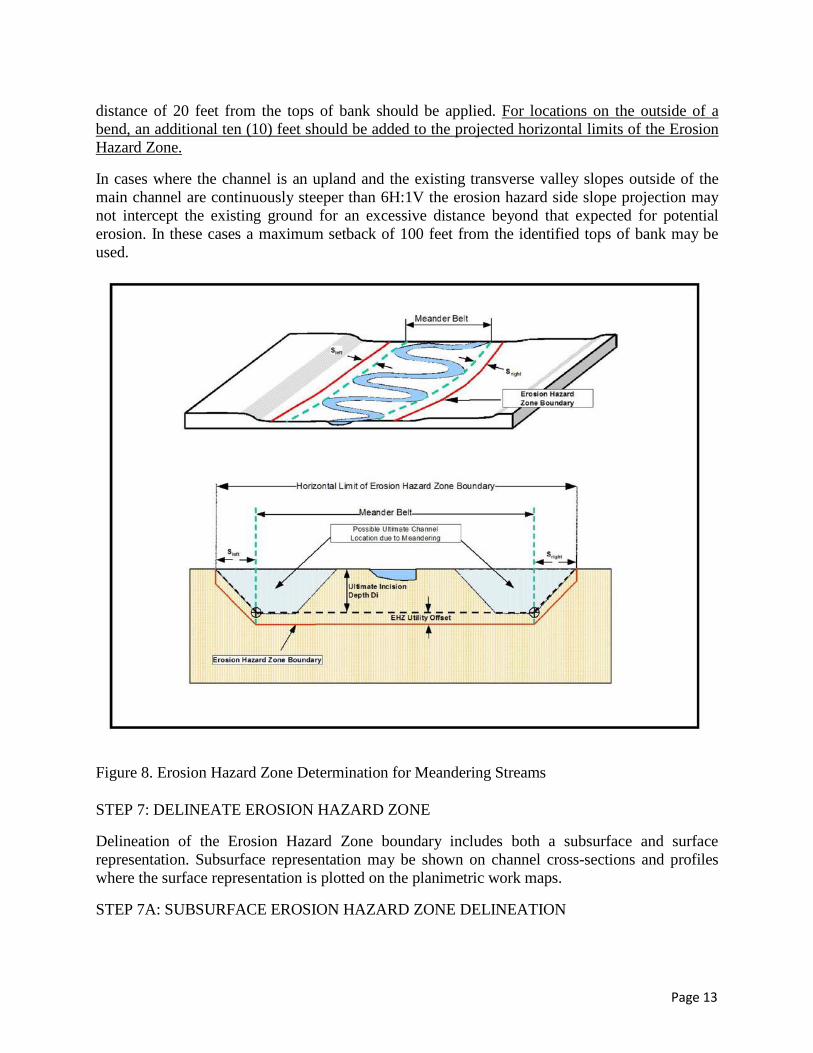
distance of 20 feet from the tops of bank should be applied. For locations on the outside of a bend, an additional ten (10) feet should be added to the projected horizontal limits of the Erosion Hazard Zone.
In cases where the channel is an upland and the existing transverse valley slopes outside of the main channel are continuously steeper than 6H:1V the erosion hazard side slope projection may not intercept the existing ground for an excessive distance beyond that expected for potential erosion. In these cases a maximum setback of 100 feet from the identified tops of bank may be used.
Figure 8. Erosion Hazard Zone Determination for Meandering Streams
STEP 7: DELINEATE EROSION HAZARD ZONE
Delineation of the Erosion Hazard Zone boundary includes both a subsurface and surface representation. Subsurface representation may be shown on channel cross-sections and profiles where the surface representation is plotted on the planimetric work maps.
STEP 7A: SUBSURFACE EROSION HAZARD ZONE DELINEATION
Page 14
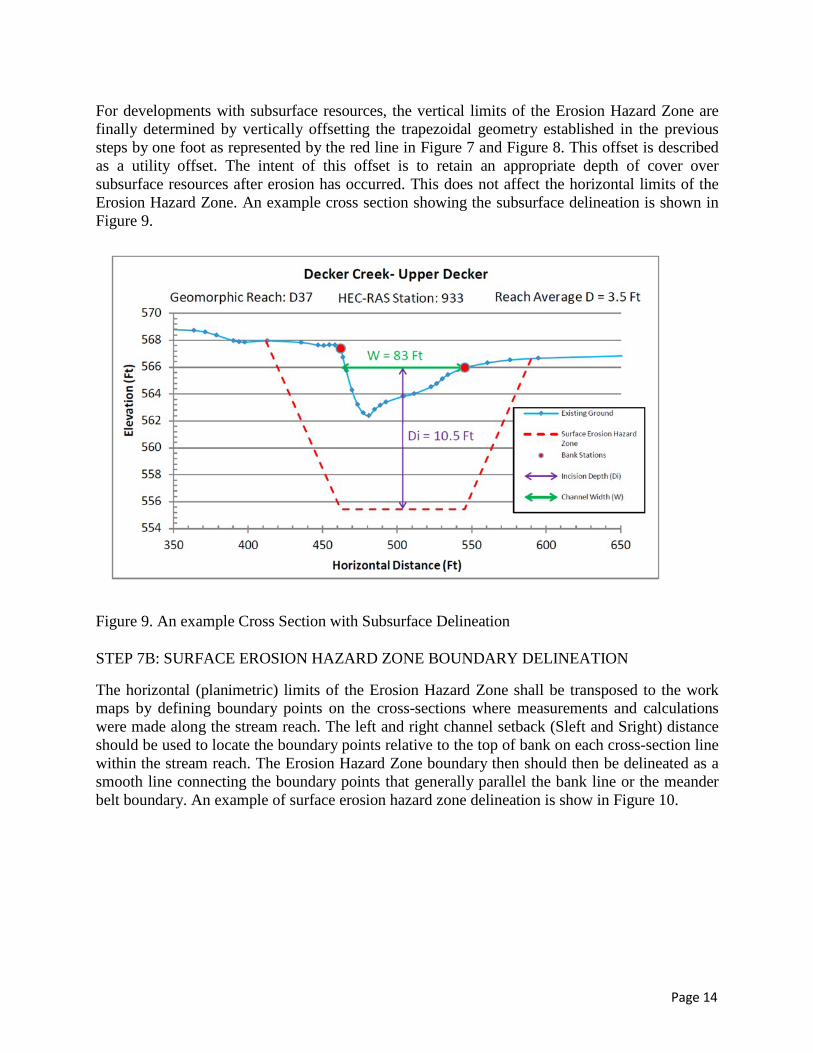
For developments with subsurface resources, the vertical limits of the Erosion Hazard Zone are finally determined by vertically offsetting the trapezoidal geometry established in the previous steps by one foot as represented by the red line in Figure 7 and Figure 8. This offset is described as a utility offset. The intent of this offset is to retain an appropriate depth of cover over subsurface resources after erosion has occurred. This does not affect the horizontal limits of the Erosion Hazard Zone. An example cross section showing the subsurface delineation is shown in Figure 9.
Figure 9. An example Cross Section with Subsurface Delineation
STEP 7B: SURFACE EROSION HAZARD ZONE BOUNDARY DELINEATION
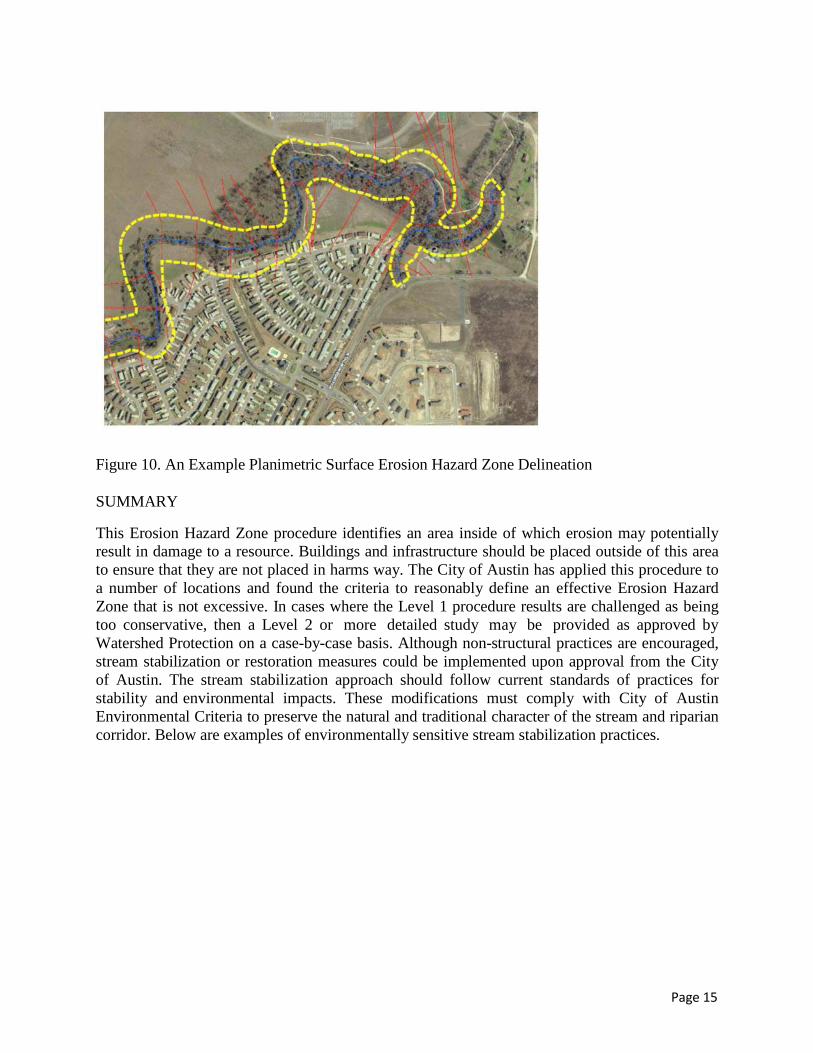
The horizontal (planimetric) limits of the Erosion Hazard Zone shall be transposed to the work maps by defining boundary points on the cross-sections where measurements and calculations were made along the stream reach. The left and right channel setback (Sleft and Sright) distance should be used to locate the boundary points relative to the top of bank on each cross-section line within the stream reach. The Erosion Hazard Zone boundary then should then be delineated as a smooth line connecting the boundary points that generally parallel the bank line or the meander belt boundary. An example of surface erosion hazard zone delineation is show in Figure 10.
Page 15
Figure 10. An Example Planimetric Surface Erosion Hazard Zone Delineation SUMMARY
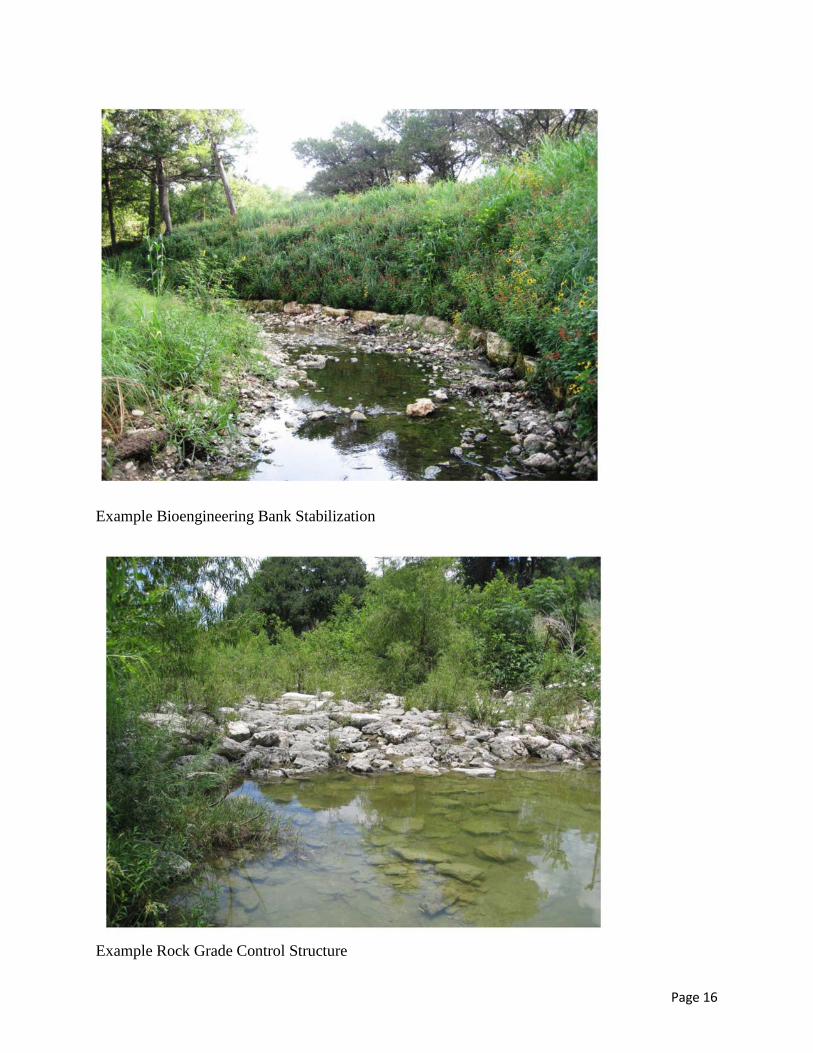
This Erosion Hazard Zone procedure identifies an area inside of which erosion may potentially result in damage to a resource. Buildings and infrastructure should be placed outside of this area to ensure that they are not placed in harms way. The City of Austin has applied this procedure to a number of locations and found the criteria to reasonably define an effective Erosion Hazard Zone that is not excessive. In cases where the Level 1 procedure results are challenged as being too conservative, then a Level 2 or more detailed study may be provided as approved by Watershed Protection on a case-by-case basis. Although non-structural practices are encouraged, stream stabilization or restoration measures could be implemented upon approval from the City of Austin. The stream stabilization approach should follow current standards of practices for stability and environmental impacts. These modifications must comply with City of Austin Environmental Criteria to preserve the natural and traditional character of the stream and riparian corridor. Below are examples of environmentally sensitive stream stabilization practices.
Page 16
Example Bioengineering Bank Stabilization
Example Rock Grade Control Structure
Page 17
Page 18
References
Ayres Associates, 2004, "Erosion Hazard Zone and Channel Stabilization Criteria for City of Austin Streams" Fort Collins, Colorado, prepared for the City of Austin Watershed Protection and Development Review Department.
City of Austin Watershed Protection Department, 2001, "Watershed Protection Masterplan", Austin, Texas
City of Austin Drainage Utility, 1997, "Technical Procedures for the Watershed Erosion Assessments,", Austin, Texas.
Page 19
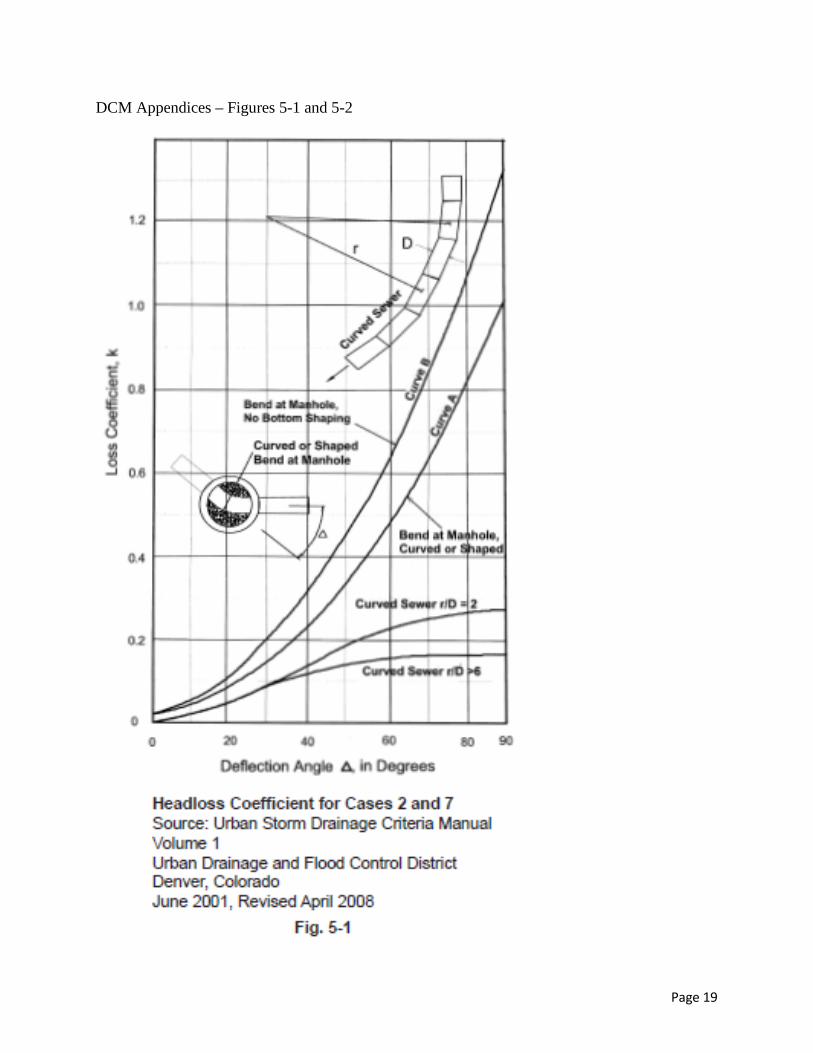
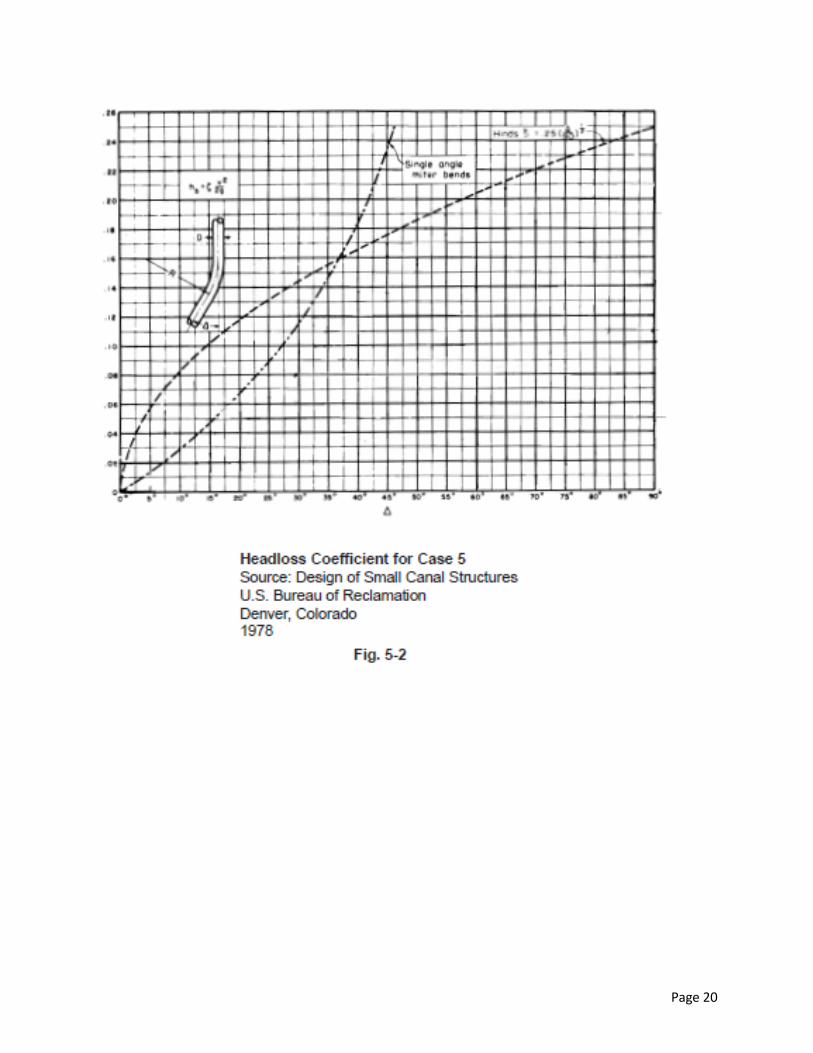
DCM Appendices – Figures 5-1 and 5-2
Page 20