Embed Size (px)
Citation preview
1248 IEEE TRANSACTIONS ON NUCLEAR SCIENCE, VOL. 53, NO. 3, JUNE 2006
Aligning Emission Tomography and MRI Imagesby Optimizing the Emission-Tomography Image
Reconstruction Objective FunctionJames E. Bowsher, Member, IEEE, David M. DeLong, Timothy G. Turkington, Member, IEEE, and
Ronald J. Jaszczak, Fellow, IEEE
Abstract—An important approach to reconstructing PET andSPECT (PET/SPECT) radiotracer images is to utilize high-reso-lution information from registered MRI or CT (MRI/CT) images.These methods depend on accurate registration of PET/SPECTand MRI/CT images. Herein, we consider registration via opti-mization of a PET/SPECT image-reconstruction objective func-tion which includes the registration parameters. Potential bene-fits of this approach include 1) modeling, within the registrationprocess, of PET/SPECT noise and PET/SPECT acquisition effectssuch as limited spatial resolution, perhaps resulting in more accu-rate registration and 2) a natural framework for calculating jointuncertainties in registration parameters and radiotracer activity.In cases where the structures imaged by MRI/CT (e.g., gray matterand white matter in the brain) strongly influence the radiotracerdistribution, the relatively small number of variables comprisedof alignment parameters and regional radiotracer mean activitiesmay account for, not all, but much of the estimable radiotracer dis-tribution, and it may be useful to develop methods for rapid, highlyaccurate estimation of these few parameters, ultimately embeddingsuch estimation within more general estimation of the full radio-tracer distribution. Herein we develop Levenberg–Marquardt si-multaneous estimation of regional radiotracer mean activities andthe six 3D rigid body translation and rotation alignment parame-ters. The method is tested by a computer-simulation study. Witha PET/SPECT scanner spatial resolution of 0.2 cm FWHM, thisstudy shows translational registration errors of about 0.002 cm androtational errors which are fractions of a degree. For small regions,estimates of regional mean activities are much closer to true valuesthan are estimates obtained by OSEM using PET/SPECT projec-tion data only.
Index Terms—CT, image reconstruction, MRI, PET, registra-tion, SPECT.
I. INTRODUCTION
EMISSION tomography, which includes positron emissiontomography (PET) and single photon emission computed
tomography (SPECT), is important for its ability to imagebiological and molecular processes. However, PET/SPECTimaging has limited spatial resolution and is noisy. In order to
Manuscript received January 16, 2004; revised July 9, 2005. This workwas supported in part by NIH/NCI under Grants 5R24 CA092656 and 5R01CA076006 and in part by NIH/NCRR under Grant P41 RR005959.
J. E. Bowsher is with the Departments of Radiation Oncology and Radiology,Duke University Medical Center, Durham, NC 27710 USA (e-mail: [email protected]).
D. M. DeLong is with the Department of Biostatistics and Bioinformatics,Duke University Medical Center, Durham, NC 27710 USA.
T. G. Turkington, and R. J. Jaszczak are with the Departments of Radiologyand Biomedical Engineering, Duke University, Durham, NC 27710 USA.
Digital Object Identifier 10.1109/TNS.2006.875467
improve the estimation of radiotracer distribution over distancescales comparable to or smaller than the spatial resolution ofPET/SPECT scanners, methods have been developed for in-cluding high-resolution, low-noise magnetic resonance (MRI)or x-ray computed tomography (CT) information within theestimation of radiotracer distribution, e.g., [1]–[15] and ref-erences therein. In these methods, the MRI/CT image entersinto the radiotracer-image-reconstruction objective function.For example, the objective function may smooth estimatedradiotracer activities between nearby voxels only if thosevoxels are in the same MRI/CT region (e.g., [3], [10]), or itmay smooth estimated voxel activities toward the mean activityof each MRI/CT region (e.g., [7], [8], [10]). Such methodsrequire accurate alignment of MRI/CT and PET/SPECT imagecoordinates.
Given the rapid growth of multi-modality imaging and multi-modality systems (e.g., PET/CT), image registration is highlyimportant and is an area of extensive research, e.g., [16]. Evenwith sequential imaging systems such as PET/CT, patient mo-tion is possible between the two scans. Here we aim towardmethods which may usefully correct even minor mis-registra-tions, as well as the greater mis-alignments associated with sep-arated systems such as PET and MRI. One characteristic of mostwork on registering MRI/CT with PET/SPECT is that the reg-istration procedures are based on the PET/SPECT radiotracerimage, rather than the PET/SPECT projection data, and theseregistration procedures do not have knowledge of the spatial res-olution and variance and covariance characteristics of the PET/SPECT image. Consequently, these registration procedures arerelatively limited in their capacity to determine whether a struc-ture in the PET/SPECT image is strongly supported by the PET/SPECT projection data and thus likely to correspond to structurein the real radiotracer distribution, or if instead, the PET/SPECTimage structure is likely to be due to noise. It may be that sub-stantially improved registration can be obtained by registrationprocedures which do incorporate resolution and noise informa-tion.
Within the framework of methods such as [1]–[15] thisadditional information can be introduced into the registrationprocedure by including MRI/CT—PET/SPECT registration pa-rameters within the radiotracer-image-reconstruction objectivefunction. This approach to cross-modality image registrationhas several potential advantages over more-widespread reg-istration methods. First, iterative statistical reconstruction iswell-suited to modeling PET and SPECT projection acquisition
0018-9499/$20.00 © 2006 IEEE
BOWSHER et al.: ALIGNING EMISSION TOMOGRAPHY AND MRI IMAGES 1249
effects such as Poisson noise, spatially varying spatial resolu-tion, and non-uniform attenuation. These effects are included inthe likelihood component of the image-reconstruction objectivefunction. When registration is performed by also includingalignment parameters in the objective function, the registrationprocess inherently utilizes this modeling information. Forexample, it factors in the spatial resolution model when con-sidering whether two different alignments provide significantlydifferent likelihoods. Use of this modeling information mayimprove registration accuracy and precision. Second, inclusionof alignment parameters in the objective function provides anatural framework for calculating joint uncertainties in align-ment and radiotracer-activity parameters. For example,at themaximum likelihood (ML) estimate of these parameters, theirvariances and covariances may be well approximated by theinverse of the Fisher information matrix, where the Fisher in-formation matrix is comprised of the negatives of the expectedvalues of the second derivatives of the log likelihood function[17]. With regard to the first point above, note that since thesevariances and covariances are implicit in the shape of theobjective function, and since the alignment is estimated bysearching for the peak in this objective function, it follows thatthe registration process inherently and implicitly utilizes thesevariances and covariances. In contrast, alignment methods thatwork directly with an estimated PET/SPECT image generallydo not utilize knowledge of these variances and covariances.
Previous work on estimating the alignment of high-resolu-tion information directly from projection data includes [5], [6],[18]–[21]. Estimation methods have included gradient ascent[18], [21], Levenberg–Marquardt [5], [6], and variable metricmethods using adjoint differentiation [19][20]. The computa-tional efficiency of the methods in [19][20] is notable. Here wefocus on Levenberg–Marquardt estimation. The considerationof Levenberg–Marquardt methodology is motivated by the di-rect calculation, which it enables, of exact second-derivativesof the log likelihood with respect to regional radiotracer activ-ities, as well as approximate second-derivatives with respect toalignment parameters, where this approximation may be quiteaccurate as the parameter estimates approach convergence. Lev-enberg–Marquardt optimization was also investigated in [5], [6]for two 2D translation parameters, along with parameters forangle-dependent radial location of inner and outer heart walls, ina surface-based model of cardiac boundaries. Here we considerthe six 3D rigid-body translation and rotation parameters anda more general, segmentation-based model for the high-resolu-tion information. The method provides accurate simultaneousestimation of registration parameters and of the mean activitiesof multiple radiotracer regions.
As in [5], [6], [19]–[21], the present work assumes uniformradiotracer concentration within each tissue type. This assump-tion is unrealistic for most applications, and the methods devel-oped here are not intended as stand-alone PET/SPECT imagereconstruction methods. Instead, these methods are being devel-oped and evaluated as one stage in a program that will ultimatelyembed these techniques within PET/SPECT image reconstruc-tion which does allow for within-region variation in radiotraceractivity. The motivation for this approach and a plan for esti-mating within-region variation are discussed in Section IV.
II. MODEL AND ESTIMATION
A. Model and Alignment Parameters
A general framework for estimating a radiotracer activitydistribution from PET/SPECT projection data is to op-timize a log likelihood or a penalized log likelihood
. Methods for limiting noise in theestimate of include use of a penalty function and choiceof the parameterization of . Here, we consider a model for theradiotracer distribution in which each point in three-dimen-sional space is assumed to belong to a single MRI/CT regionand radiotracer activity is assumed to be constant within eachMRI/CT region. We do not utilize a penalty function .The objective function to be optimized is thus the log likeli-hood , considered as a function of regional radiotraceractivities and the alignment parameters. This radiotracer modeldoes not imply piecewise flat radiotracer images, since theMRI/CT image may be specified on much smaller voxels. Forexample, in the studies presented here, at least 64 MRI/CTvoxels overlap each PET/SPECT voxel, allowing variablemixing of MRI/CT regions within each PET/SPECT voxel. Formost realistic applications, a more general model is neededwhich allows for continual variation of radiotracer activitythroughout each MRI/CT region. The present, more-restrictedradiotracer model serves in part as a test bench for investigatingMRI/CT—PET/SPECT alignment via optimization of theobjective function. However, the larger purpose in developingthis model and the corresponding estimation procedures is fortheir use within more general models and estimation methodswhich do account for within-region variations in radiotraceractivity, as discussed in Section IV.
The Poisson log likelihood is
(1)
where is the number of detector bins, and and arerespectively the expected and measured numbers of events atprojection bin . Let be coordinates of a pointin a frame that is fixed relative to the PET/SPECT scanner. Also,let be coordinates of a point in a frame thatis fixed with respect to the MRI/CT image, and let be theradiotracer activity per unit volume, specified as a function of
. In the present image model , where isthe radiotracer activity per unit volume within MRI/CT region
, and is the region classification at location . Coor-dinates for a given point in space can be generally expressed as
or , so . The ex-pected number of events is
(2)
where is the probability that a photon emitted at locationwill be detected at bin . A discretized (voxelized) version of
1250 IEEE TRANSACTIONS ON NUCLEAR SCIENCE, VOL. 53, NO. 3, JUNE 2006
(2) is formed as follows: For a given MRI/CT segmentationand alignment, each radiotracer voxel, i.e. each voxel associatedwith the coordinate frame , will in general contain a mixtureof MRI/CT regions. A vector isassociated with each radiotracer voxel , where indicatesthe volume of voxel that is in region . Thus ,where is the volume of voxel . From (2)
(3)
where the symbol indicates integration over voxel is theaverage value of over voxel , and (3) makes the usualassumption that voxels are sufficiently small relative to PET/SPECT scanner spatial resolution, such that the distribution ofactivity within the voxel has no significant influence on , andconsequently the same detection probability can be usedfor all points within a given voxel. Elaborating (3)
(4)
(5)
where if and 0 otherwise, and
(6)
For this paper, the quantities are computed by multiple pe-riodically-spaced samples for values of within each voxel .Equation (6) compares to (31) in the Discussion. The expectednumber of photons emitted from voxel is
(7)
so that (5) is a case of . Arranging (5) differ-ently gives the dependence of on
(8)
where
(9)
where depends on the MRI/CT alignment. It representsthe expected number of events at a projection bin per unitradiotracer activity per unit volume in region . Equations
(8) and (9) also constitute a tissue-composition model, in thatthey account for mixtures of tissue type within individualPET/SPECT voxels. (Other tissue composition models include[10][13]). Both the continuous form (2) and discrete form (8)are important for the discussion below.
For fixed-scale, rigid-body transformation
(10)
where specifies displacement of the coor-dinate frame relative to the coordinate frame, and specifiesa rotation of the coordinate frame. is characterized by 3angles . This paper utilizes the “xyz” Euler angle con-vention described in [22] (pp. 608–610), in which the first ro-tation is the yaw angle about the initial axis, the secondrotation is the pitch angle about the intermediary axis, andthe third rotation is the bank or roll about the final axis.The columns of (rows of ) are
(11)
(12)
(13)
and are summarized by. All parameters within the model are
indicated by , where .
B. Estimation
Since the number of registration parameters is six and sincethe number of MRI/CT regions would typically be well underone hundred, candidate methods for optimizing the objec-tive function with respect to these parameters might includeNewton–Raphson, Levenberg–Marquardt, variable metric, andconjugate-gradient techiques [23]. Newton–Raphson tech-niques would involve the computational burden of forwardprojecting second derivatives of theradiotracer distribution with respect to alignment parameters.Accordingly, we have chosen instead a Levenberg–Mar-quardt approach with a Gauss–Newton approximation to
. This approach avoids forward projectingwhile still utilizing information about
the second derivatives , information carriedin products of first derivative terms . Theseproducts are exact for second derivatives with respect to regionmean activities. For second derivatives involving alignment pa-rameters, these products may dominate as thealignment converges and the fit to the measured PET/SPECTprojection data becomes quite good.
BOWSHER et al.: ALIGNING EMISSION TOMOGRAPHY AND MRI IMAGES 1251
The derivatives of with respect to are
(14)
(15)The Gauss–Newton approximation to (15) is obtained by ig-noring second derivatives of
(16)
thus estimating the first and second derivatives of fromthe first derivatives . Equation (15) indicates that ap-proximation (16) may be quite accurate when the fit to themeasured data is good, e.g., as the estimate of alignment andof regional mean activities approaches convergence.
1) Derivatives With Respect to Alignment: The derivative ofwith respect to an alignment parameter is
(17)
which can be expanded as
(18)
where the subscript on the brackets indicates that bothterms within the brackets are evaluated at . The de-tection-probability function in (18) includes a model ofPET/SPECT spatial resolution and other acquisition effects, and(18) shows explicitly that this model is incorporated into imageregistration. For (18), is computed using thesegmentation which is fixed with respect to the M coor-dinates. Three derivatives images arecomputed in the M-coordinate frame. Each derivative is com-puted numerically as the difference in radiotracer activity be-tween two adjacent voxels and is located midway between thosetwo voxels. For example, the array of derivativesis stored on a voxel grid which is shifted by half a voxel width inthe -direction, relative to the grid on which is stored. Forpurposes of evaluating (18), these derivatives images are thenexpressed in the E-coordinate frame according to the transfor-mation (10).
The terms can be evaluated by differentiating bothsides of . When is a displacement param-eter, , the derivatives are
(19)
On the right-hand side, when and 1 when, so the vector of derivatives , is
equal to the negative of column of . Thus, the derivatives
are independent of and . Therefore they can bemoved outside of the integration over in (18), leaving threeforward projections of the form
(20)
For displacement parameters, (18) can then be computed as
(21)
where notation such as “ ” indicates “ ” as a subscript forand “1” as a subscript for . Equation (21) indicates that theweight factors of (19) are applied in the projectionspace after forward projection.
When is a rotation parameter, , the deriva-tives are
(22)
The 3 3 matrices , are independentof and can be moved outside of the integral (18). However thefactors remain within the integral (18) andrequire nine forward projections of the form
(23)
where and . For rotation parameters, (18)can then be computed as
(24)
Thus the evaluation of (18) for all six alignment parame-ters can be accomplished by 12 forward projections, three un-weighted (20) and nine weighted (23). Each set of four forwardprojections specified by a given can be computed simultane-ously since all four are on the same shifted grid. This may re-duce computation cost. For example, calculation or storage of
may constitute a significant portion of the computationalburden and need be performed only once for each group of fourforward projections.
2) Derivatives With Respect to Regional Radiotracer MeanActivities: From (8), and ,so that, via (14) and (15), the first and second derivatives ofwith respect to regional radiotracer activities are
(25)
(26)
For (26), the Gauss–Newton approximation is exact.
1252 IEEE TRANSACTIONS ON NUCLEAR SCIENCE, VOL. 53, NO. 3, JUNE 2006
3) Cross Derivatives: By (16), Gauss–Newton approxima-tions for the cross derivatives are
(27)
where is obtained by (18).4) Levenberg–Marquardt Estimation: The derivatives de-
scribed above allow for Levenberg–Marquardt estimation [23]of local maxima in the objective function with respect toalignment parameters and regional radiotracer activities .At a maximum (that is not on the boundary of the parameterspace), and , where is specified by(14) and (17) and is specified by (25). More concisely,
. Consider current parameter values. A single Levenberg–Mar-
quardt update (e.g., a single subset in Section III) involves thefollowing steps.Step 1) Compute by (9) using to determine
.Step 2) Compute by (8) using , and compute
by (1).Step 3) Compute using , and com-
pute by (18) using .Step 4) Compute a Hessian matrix according to (15)
and (16), using the Gauss–Newton approximationsprovided by (16) and (18) for alignment parametersand (27) for cross derivatives, and using the exactform (26) for region means.
Step 5) Compute by (14), (18), and (25).Step 6) The equation expresses
the notion that for second derivatives (15) whichare constant in , the maximum value of wouldbe located at
. Solve this system of linear equations for(we used the CLAPACK routine DSYSV), therebyobtaining .
Step 7) If any region mean activities are less than zero,reset these mean activities to ,thereby assuring non-negative values for all compo-nents of .
Step 8) Compute by (7) using and obtainingfrom .
Step 9) Compute .Step 10) Compute the log likelihood by (1).Step 11) If , this Levenberg–Marquardt
iteration is complete. Set , and re-turn to Step 1 to perform another Levenberg–Mar-quardt update.
Step 12) If , loop over the ridging pro-cedure described in Steps 13 and 14 below, startingwith and incrementing by 1 until
.Step 13) Subtract a positive constant (e.g., the results pre-
sented here use ) from the diagonal of ,providing a new system of equations
. Solve these equations to obtain a
new parameter update .Enforce non-negativity as in Step 7 above.
Step 14) Using the new parameter values , compute ,as described in Steps 8 through 10
above.Step 15) Once , the Levenberg–Mar-
quardt iteration is complete. Reset, and return to Step 1 to perform another Lev-
enberg–Marquardt update.Regarding the ridging procedure, with sufficiently high
powers of , is approximately diagonal, and. Hence the Levenberg–Mar-
quardt updates range between Gauss-Newton updates, (i.e.Newton–Raphson estimates using the approximation (16) to
) and steepest ascent updates [23].5) Computational Burden: The computation cost of the pro-
posed method is determined largely by the number of forwardprojections. In the absence of ridging, each Levenberg–Mar-quardt update involves about 14 forward projections: The cal-culation of in Step 1 of Section II-B-4 has a computationcost somewhat greater than that of a single forward projection.Step 3 of Section II-B-4 utilizes 12 forward-projections in eval-uating by (18), as described in Section II-B-1. The cal-culation of in Step 9 of Section II-B-4 is one forward pro-jection. In addition, Step 14 of Section II-B-4 involves one for-ward projection for each ridging, this occuring during the cal-culation of . For the example in Section III, there were onlytwo ridgings over 24 updates, so that the computational expenseof ridging was minimal.
Iterative reconstruction of PET/SPECT images generallyinvolves one forward projection and one equally burdensomebackprojection for each image update. Hence the computationburden of forward projection in one Levenberg–Marquardtupdate (with 14 forward projections) may approximately equalthe burden of seven image updates in a typical iterative recon-struction algorithm. This burden may be mitigated somewhatby the simultaneous implementation of each group of fourforward-projections in Step 3 of Section II-B-4. There can alsobe significant cost in estimating if the number of sam-ples-per-voxel is large. These points concern the per-updatecomputation burden. It is possible that overall computation costfor image reconstruction is less when MRI/CT information isincorporated and simultaneously aligned, due to convergence infewer iterations. The computer-simulation studies of Section IIIillustrate this point.
III. EVALUATIONS
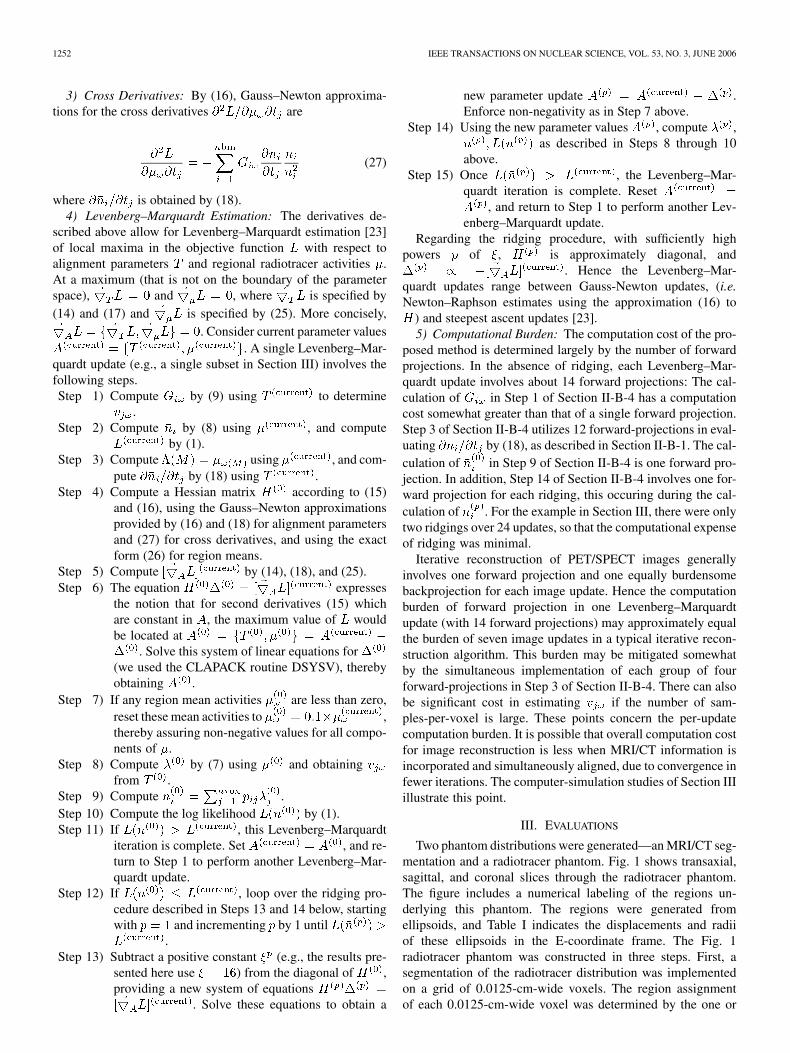
Two phantom distributions were generated—an MRI/CT seg-mentation and a radiotracer phantom. Fig. 1 shows transaxial,sagittal, and coronal slices through the radiotracer phantom.The figure includes a numerical labeling of the regions un-derlying this phantom. The regions were generated fromellipsoids, and Table I indicates the displacements and radiiof these ellipsoids in the E-coordinate frame. The Fig. 1radiotracer phantom was constructed in three steps. First, asegmentation of the radiotracer distribution was implementedon a grid of 0.0125-cm-wide voxels. The region assignmentof each 0.0125-cm-wide voxel was determined by the one or
BOWSHER et al.: ALIGNING EMISSION TOMOGRAPHY AND MRI IMAGES 1253
Fig. 1. Transaxial (left), coronal (top), and sagittal (bottom) slices through theradiotracer-activity phantom from which projection data were simulated. Voxelsare 0.025 cm wide. Numerical labels indicate regions !. The lines “T” indicatethe approximate location of the transverse slice. The line “S” (“C”) indicates theapproximate location of the sagittal (coronal) slice. Regions 17 and 18 do notintersect the planes shown.
TABLE IDISPLACEMENTS AND RADII FOR THE ELLIPSOIDS WHICH SPECIFY THE
MRI/CT AND RADIOTRACER PHANTOMS. (PLEASE SEE TEXT.) THE FINAL
COLUMN GIVES THE VOLUME OF EACH REGION
more ellipsoids which enclosed the center of the voxel. Centerswhich were within more than one ellipsoid were assigned tothe region corresponding to the highest-numbered of theseellipsoids. Second, a radiotracer phantom was implemented on0.0125 cm-wide voxels by assigning the phantom regional ra-diotracer activities given in Table II to each voxel in accord withthe region classification of that voxel. Finally, a phantom with0.025 cm-wide voxels—the phantom shown in Fig. 1—wasformed by averaging the activities over the corresponding2 2 2 0.0125 cm-wide voxels. The phantom MRI/CT seg-mentation was implemented in a manner similar to step-1 ofthe construction of the radiotracer phantom, with the differencebeing that the ellipsoid dimensions of Table I were evaluatedin a coordinate frame which was translated and rotated by
relative to the coordinate frame in which the radiotracerphantom was constructed. Thus, the entries in Table I are thecoordinates for ellipsoids of the radiotracer phantom, and the
coordinates for the ellipsoids of the MRI/CT phantom areobtained by (10).
TABLE IITRUE AND ESTIMATED REGION ACTIVITIES. COLUMNS “!” AND “TRUE”
INDICATE THE REGION NUMBER (FIG. 1) AND THE TRUE, PHANTOM ACTIVITY
� . THE TWO COLUMNS UNDER “REGION-BASED” ARE ESTIMATED
ACTIVITIES FROM THE RECONSTRUCTION OF FIG. 3(E). PLEASE SEE TEXT
FOR “TC,” “ROI,” AND “N.” THE THREE COLUMNS UNDER “VOXEL-BASED”ARE ESTIMATED ACTIVITIES FROM THE RECONSTRUCTIONS OF FIG. 2(A,B,D),
RESPECTIVELY. THE NUMBERS IN PARENTHESES ARE PERCENT ERRORS,DEFINED AS 100� (estimated� true)=true. ACTIVE REGIONS (! = 9 . . . 3)ARE LISTED FIRST, FOLLOWED BY COLD REGIONS (! = 10 . . . 2). WITHIN
EACH GROUP, REGIONS ARE ORDERED BY ERROR IN COLUMN “ML”
Parallel-beam SPECT projections of the Fig. 1 phantom wereanalytically simulated for 120 angles evenly spaced over 360 de-grees. Projection bins were 0.05 cm wide. Scatter and attenua-tion were not modeled. The projection of each voxel was blurredby a 0.2 cm-FWHM Gaussian kernel. Although the specific ge-ometry is more characteristic of SPECT acquisition, the widthof the kernel was chosen to represent approximately the spa-tial resolution of our small-animal PET scanner (Concorde Mi-crosystems, MicroPET R4, Knoxville, TN, USA), in order toobtain some indication of the degree of partial volume correc-tion that can be provided to small-animal PET imaging throughthe use of high-resolution MRI/CT images. The blurring was ap-plied by the methods of [24][25], in which integrals of the blur-ring kernel over the detector bins are pre-computed and storedas a function of voxel-to-collimator distance and as a functionof the location of a voxel’s projection within the detector binthat contains that projection. Here 32 within-bin locations wereconsidered across the transaxial dimension of the bin, providingfor an upper limit of cm on er-rors in the transaxial placement of the blurring kernel. In theaxial direction, two within-bin locations were utilized, therebyexactly modeling the axial projection-locations of the two 0.025cm-wide image slices that overlap each 0.05 cm-wide projectionslice. This method accurately represents the generally-assumedinvariance of SPECT collimator and detector-crystal responseto translations of a radiotracer source within any given plane
1254 IEEE TRANSACTIONS ON NUCLEAR SCIENCE, VOL. 53, NO. 3, JUNE 2006
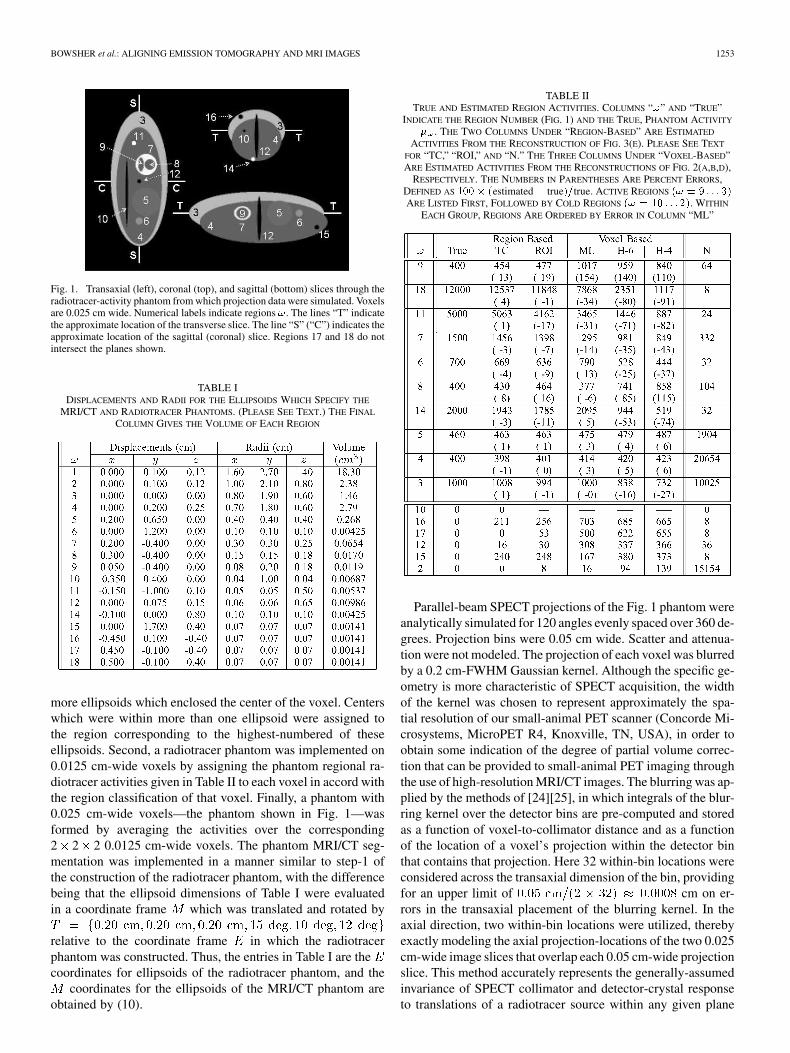
Fig. 2. Voxel-based OSEM reconstruction without high-resolution region in-formation. (a) Iteration 500 (200 iterations of 8 subsets followed by 100 itera-tions each of 4, 2, 1 subsets). (b-f) Results of Hann filter applied to iteration 500.Filter cut-off frequencies are 6, 5, 4, 3, and 2 cycles per cm in b-f, respectively.The transaxial slice shown occupies the volume 0 <= e < 0:05 cm which isapproximately indicated by the lines “T” in Fig. 1.
parallel to the plane of the collimator surface. (Although an in-variant 0.2 cm-FWHM kernel is utilized here, the methods justas readily model a dependence of the kernel on voxel-to-colli-mator distance.) Noisy projection data were generated, at thelevel of 2 million total events over all angles and slices, bypseudo-random Poisson sampling of the analytically-simulatedprojections.
Images were reconstructed by OSEM [26] with post-filteringand by the region-based methods developed here. Both recon-structions were onto a 64 108 57 grid of 0.05 cm-widevoxels, with the image-reconstruction support given by theunion of regions 1–18 (Table I). Spatial resolution effectswere included in the detection probabilities by the sametechnique [24][25] as described above for simulating projectiondata, in this case using 32 within-bin locations transaxially andone axially. The blurring kernel was obtained by convolvingthe aforementioned 0.2 cm-FWHM Gaussian with the 0.05cm-wide voxel size, thus modeling the larger voxel size used inreconstruction as compared to projection data simulation.
For OSEM reconstruction, the initial activity estimate was400 for all voxels in the support. In order to allow for contrast re-covery in small regions, OSEM was run for 500 iterations [27],with 200 iterations of 8 subsets followed by 100 iterations eachof 4, 2, and 1 subsets. Fig. 2(a) shows the approximation, pro-vided by iteration 500, to the voxel-based ML estimate of radio-tracer activity. Fig. 2(b–f) shows the results of applying varyingdegrees of 3D Hann filtering to the Fig. 2(a) 3D image, wherethe Hann filter is defined as for andzero otherwise. Cut-off frequencies were , andcycles/cm for Fig. 2(b–f) respectively.
For region-based reconstruction, there were 2 iterations with8 subsets, followed by 2 iterations with 2 subsets, followed by
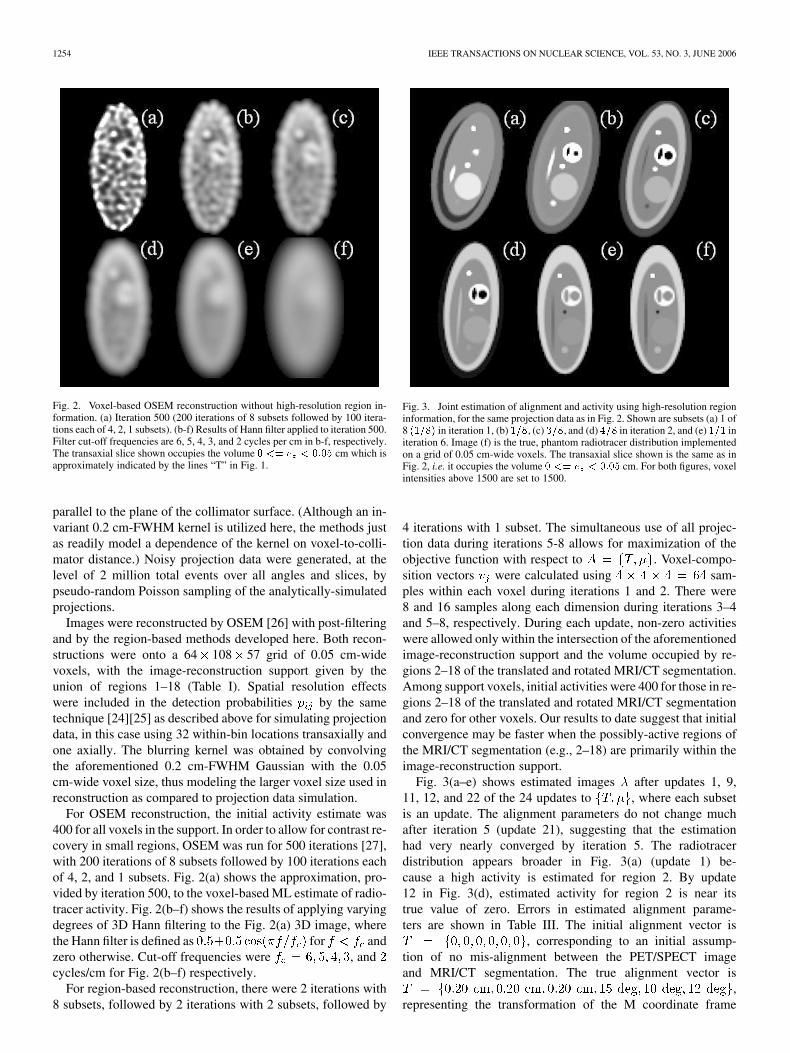
Fig. 3. Joint estimation of alignment and activity using high-resolution regioninformation, for the same projection data as in Fig. 2. Shown are subsets (a) 1 of8 (1=8) in iteration 1, (b) 1=8, (c) 3=8, and (d) 4=8 in iteration 2, and (e) 1=1 initeration 6. Image (f) is the true, phantom radiotracer distribution implementedon a grid of 0.05 cm-wide voxels. The transaxial slice shown is the same as inFig. 2, i.e. it occupies the volume 0 <= e < 0:05 cm. For both figures, voxelintensities above 1500 are set to 1500.
4 iterations with 1 subset. The simultaneous use of all projec-tion data during iterations 5-8 allows for maximization of theobjective function with respect to . Voxel-compo-sition vectors were calculated using sam-ples within each voxel during iterations 1 and 2. There were8 and 16 samples along each dimension during iterations 3–4and 5–8, respectively. During each update, non-zero activitieswere allowed only within the intersection of the aforementionedimage-reconstruction support and the volume occupied by re-gions 2–18 of the translated and rotated MRI/CT segmentation.Among support voxels, initial activities were 400 for those in re-gions 2–18 of the translated and rotated MRI/CT segmentationand zero for other voxels. Our results to date suggest that initialconvergence may be faster when the possibly-active regions ofthe MRI/CT segmentation (e.g., 2–18) are primarily within theimage-reconstruction support.
Fig. 3(a–e) shows estimated images after updates 1, 9,11, 12, and 22 of the 24 updates to , where each subsetis an update. The alignment parameters do not change muchafter iteration 5 (update 21), suggesting that the estimationhad very nearly converged by iteration 5. The radiotracerdistribution appears broader in Fig. 3(a) (update 1) be-cause a high activity is estimated for region 2. By update12 in Fig. 3(d), estimated activity for region 2 is near itstrue value of zero. Errors in estimated alignment parame-ters are shown in Table III. The initial alignment vector is
, corresponding to an initial assump-tion of no mis-alignment between the PET/SPECT imageand MRI/CT segmentation. The true alignment vector is
,representing the transformation of the M coordinate frame
BOWSHER et al.: ALIGNING EMISSION TOMOGRAPHY AND MRI IMAGES 1255
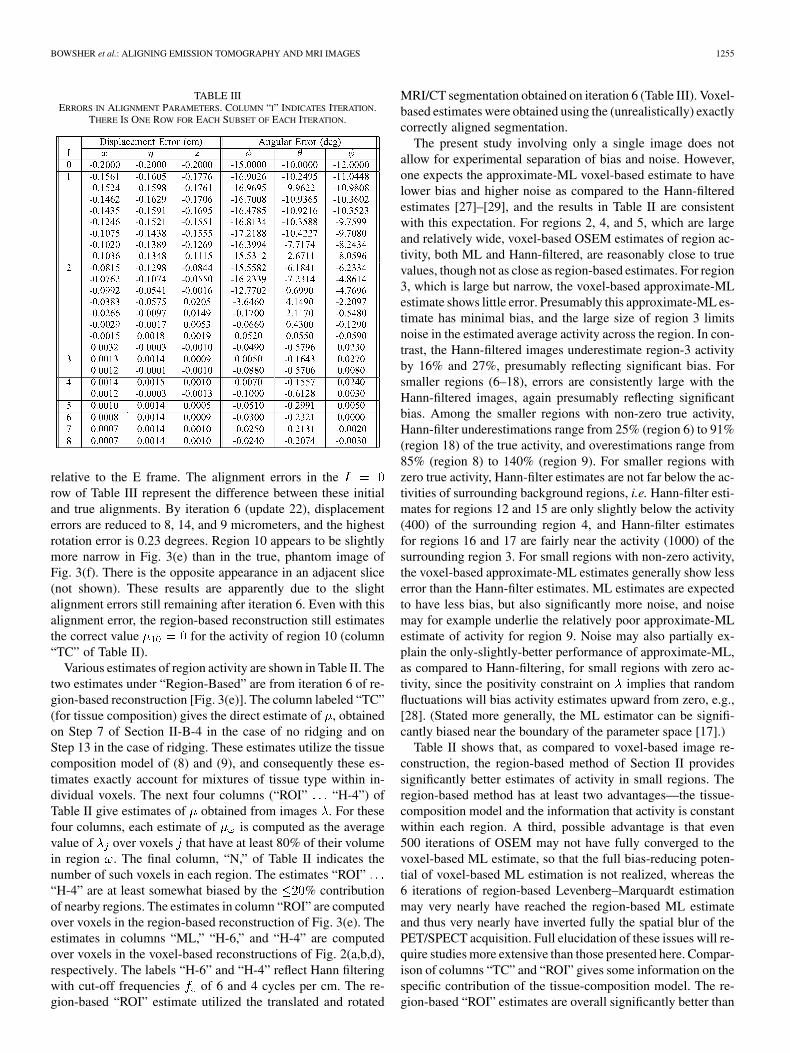
TABLE IIIERRORS IN ALIGNMENT PARAMETERS. COLUMN “I” INDICATES ITERATION.
THERE IS ONE ROW FOR EACH SUBSET OF EACH ITERATION.
relative to the E frame. The alignment errors in therow of Table III represent the difference between these initialand true alignments. By iteration 6 (update 22), displacementerrors are reduced to 8, 14, and 9 micrometers, and the highestrotation error is 0.23 degrees. Region 10 appears to be slightlymore narrow in Fig. 3(e) than in the true, phantom image ofFig. 3(f). There is the opposite appearance in an adjacent slice(not shown). These results are apparently due to the slightalignment errors still remaining after iteration 6. Even with thisalignment error, the region-based reconstruction still estimatesthe correct value for the activity of region 10 (column“TC” of Table II).
Various estimates of region activity are shown in Table II. Thetwo estimates under “Region-Based” are from iteration 6 of re-gion-based reconstruction [Fig. 3(e)]. The column labeled “TC”(for tissue composition) gives the direct estimate of , obtainedon Step 7 of Section II-B-4 in the case of no ridging and onStep 13 in the case of ridging. These estimates utilize the tissuecomposition model of (8) and (9), and consequently these es-timates exactly account for mixtures of tissue type within in-dividual voxels. The next four columns (“ROI” “H-4”) ofTable II give estimates of obtained from images . For thesefour columns, each estimate of is computed as the averagevalue of over voxels that have at least 80% of their volumein region . The final column, “N,” of Table II indicates thenumber of such voxels in each region. The estimates “ROI”“H-4” are at least somewhat biased by the % contributionof nearby regions. The estimates in column “ROI” are computedover voxels in the region-based reconstruction of Fig. 3(e). Theestimates in columns “ML,” “H-6,” and “H-4” are computedover voxels in the voxel-based reconstructions of Fig. 2(a,b,d),respectively. The labels “H-6” and “H-4” reflect Hann filteringwith cut-off frequencies of 6 and 4 cycles per cm. The re-gion-based “ROI” estimate utilized the translated and rotated
MRI/CT segmentation obtained on iteration 6 (Table III). Voxel-based estimates were obtained using the (unrealistically) exactlycorrectly aligned segmentation.
The present study involving only a single image does notallow for experimental separation of bias and noise. However,one expects the approximate-ML voxel-based estimate to havelower bias and higher noise as compared to the Hann-filteredestimates [27]–[29], and the results in Table II are consistentwith this expectation. For regions 2, 4, and 5, which are largeand relatively wide, voxel-based OSEM estimates of region ac-tivity, both ML and Hann-filtered, are reasonably close to truevalues, though not as close as region-based estimates. For region3, which is large but narrow, the voxel-based approximate-MLestimate shows little error. Presumably this approximate-ML es-timate has minimal bias, and the large size of region 3 limitsnoise in the estimated average activity across the region. In con-trast, the Hann-filtered images underestimate region-3 activityby 16% and 27%, presumably reflecting significant bias. Forsmaller regions (6–18), errors are consistently large with theHann-filtered images, again presumably reflecting significantbias. Among the smaller regions with non-zero true activity,Hann-filter underestimations range from 25% (region 6) to 91%(region 18) of the true activity, and overestimations range from85% (region 8) to 140% (region 9). For smaller regions withzero true activity, Hann-filter estimates are not far below the ac-tivities of surrounding background regions, i.e. Hann-filter esti-mates for regions 12 and 15 are only slightly below the activity(400) of the surrounding region 4, and Hann-filter estimatesfor regions 16 and 17 are fairly near the activity (1000) of thesurrounding region 3. For small regions with non-zero activity,the voxel-based approximate-ML estimates generally show lesserror than the Hann-filter estimates. ML estimates are expectedto have less bias, but also significantly more noise, and noisemay for example underlie the relatively poor approximate-MLestimate of activity for region 9. Noise may also partially ex-plain the only-slightly-better performance of approximate-ML,as compared to Hann-filtering, for small regions with zero ac-tivity, since the positivity constraint on implies that randomfluctuations will bias activity estimates upward from zero, e.g.,[28]. (Stated more generally, the ML estimator can be signifi-cantly biased near the boundary of the parameter space [17].)
Table II shows that, as compared to voxel-based image re-construction, the region-based method of Section II providessignificantly better estimates of activity in small regions. Theregion-based method has at least two advantages—the tissue-composition model and the information that activity is constantwithin each region. A third, possible advantage is that even500 iterations of OSEM may not have fully converged to thevoxel-based ML estimate, so that the full bias-reducing poten-tial of voxel-based ML estimation is not realized, whereas the6 iterations of region-based Levenberg–Marquardt estimationmay very nearly have reached the region-based ML estimateand thus very nearly have inverted fully the spatial blur of thePET/SPECT acquisition. Full elucidation of these issues will re-quire studies more extensive than those presented here. Compar-ison of columns “TC” and “ROI” gives some information on thespecific contribution of the tissue-composition model. The re-gion-based “ROI” estimates are overall significantly better than
1256 IEEE TRANSACTIONS ON NUCLEAR SCIENCE, VOL. 53, NO. 3, JUNE 2006
the voxel-based estimates, but significant further improvementis provided by the tissue-composition estimate. For region 10,which is the most narrow region, there were no voxels with 80%(or even 50%) of their volume in region 10, so that a tissue-com-position approach was essential.
Reconstructions were performed on a 3.2 GHz Intel P4 Xeonprocessor. The 500 iterations of OSEM required 682 minutes.Reconstruction times for region-based reconstruction were 21minutes for the 2 iterations 1–2 (10.5 minutes per iteration), 33minutes for the 2 iterations 3–4, and 107 minutes for the 2 it-erations 5–6. Increased times at later iterations are presumablydue to finer sampling when estimating . There are specificcoding steps which would significantly reduce the time requiredfor sampling in this initial software implementation of the Sec-tion II methods. Also, the time required for estimating mightbe reduced by interpolation methods [16].
IV. DISCUSSION
All of the radiotracer image reconstructions presented hereincluded accurate modeling of the spatial resolution kernelused to simulate the PET/SPECT projection data. This mod-eling enables the inversion of blurring effects within imagereconstruction [27]–[30], as in the voxel-based [Fig. 2(a)] andregion-based [Fig. 3(e)] approximate-ML estimates of Table II.Accurate spatial resolution modeling is thus one key to accuratequantification and partial volume correction. A second factorwhich contributes to image quality is the model of uniform ac-tivity within each region. Since activity is truely uniform withineach region of the Section III phantom, introducing that unifor-mity during image reconstruction reduces noise without losingany true signal. Also, the recovery of contrasts between regionsis not hampered. For more realistic activity distributions, itwill generally be necessary for image reconstruction to allowfor low- and some-mid-frequency within-region variations inestimated activity. Mid- and high-frequency within-region vari-ations—both from true signal and from noise—will, as usual,be limited, e.g., by penalties on within-region variation.Thus noise reduction may cause some loss of true within-regionsignal variation. Yet, analogous to the results obtained here,these penalties on within-region variation presumably will nothamper the recovery of contrasts between regions. The resultsof Section III show improved recovery of contrasts betweenregions, and presumably such improvements will persist whenlow- to mid-frequency within-region variations are allowed.Furthermore, a general notion underlying the use of MRI/CTwithin radiotracer image reconstruction is that variations of ra-diotracer activity are relatively gradual within MRI/CT regions,and when this is case, within-region penalties may haverelatively little effect on true within-region variations. A thirdfactor which may improve quantification is that ML estimationof directly from PET/SPECT projection data is much fastercomputationally than estimation of via regional averages overan ML estimate of . The results of Section III suggest that thevoxel-based ML estimates may often not be practical. Estima-tion of from PET/SPECT projection data may be much betterconditioned than estimation of , and this may partly explain itsbetter performance. Accelerated image reconstruction through
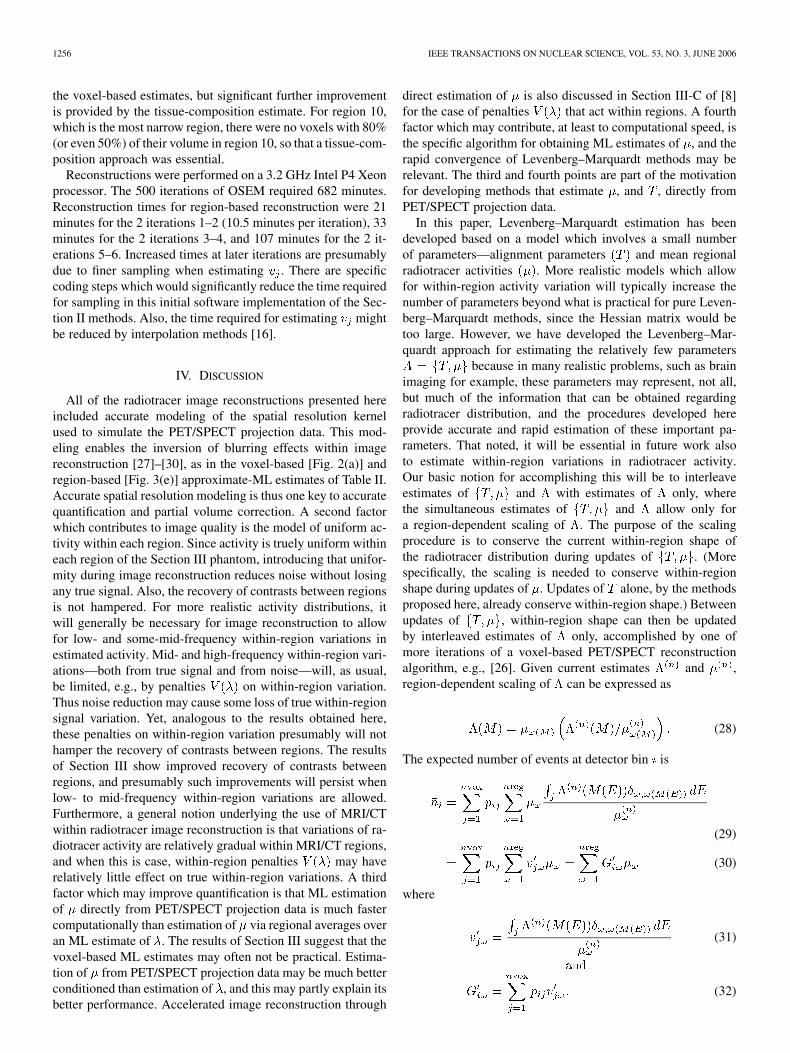
direct estimation of is also discussed in Section III-C of [8]for the case of penalties that act within regions. A fourthfactor which may contribute, at least to computational speed, isthe specific algorithm for obtaining ML estimates of , and therapid convergence of Levenberg–Marquardt methods may berelevant. The third and fourth points are part of the motivationfor developing methods that estimate , and , directly fromPET/SPECT projection data.
In this paper, Levenberg–Marquardt estimation has beendeveloped based on a model which involves a small numberof parameters—alignment parameters and mean regionalradiotracer activities . More realistic models which allowfor within-region activity variation will typically increase thenumber of parameters beyond what is practical for pure Leven-berg–Marquardt methods, since the Hessian matrix would betoo large. However, we have developed the Levenberg–Mar-quardt approach for estimating the relatively few parameters
because in many realistic problems, such as brainimaging for example, these parameters may represent, not all,but much of the information that can be obtained regardingradiotracer distribution, and the procedures developed hereprovide accurate and rapid estimation of these important pa-rameters. That noted, it will be essential in future work alsoto estimate within-region variations in radiotracer activity.Our basic notion for accomplishing this will be to interleaveestimates of and with estimates of only, wherethe simultaneous estimates of and allow only fora region-dependent scaling of . The purpose of the scalingprocedure is to conserve the current within-region shape ofthe radiotracer distribution during updates of . (Morespecifically, the scaling is needed to conserve within-regionshape during updates of . Updates of alone, by the methodsproposed here, already conserve within-region shape.) Betweenupdates of , within-region shape can then be updatedby interleaved estimates of only, accomplished by one ofmore iterations of a voxel-based PET/SPECT reconstructionalgorithm, e.g., [26]. Given current estimates and ,region-dependent scaling of can be expressed as
(28)
The expected number of events at detector bin is
(29)
(30)
where
(31)
(32)
BOWSHER et al.: ALIGNING EMISSION TOMOGRAPHY AND MRI IMAGES 1257
An expression similar to that for of (32) was suggestedin (15) of [5], for purposes of modeling heterogeneity of ra-diotracer concentration within the large background region sur-rounding the ventricle and myocardium in the model of [5], [6].Reference [5] also notes a related concept in [31]. Equation (32)is an analog to (9) and is a basis for estimating alongwith simultaneous region-dependent scaling of , while inter-leaving less restricted updates of so as to adjust the within-re-gion shape of the radiotracer distribution. The less-restricted,high-dimensional search along is intended to extract what-ever additional components of that can be estimated from thePET/SPECT projection data. These additional components ofmay involve only the usual relatively low frequencies estimablefrom PET/SPECT projection data alone, and numerous algo-rithms are available for reasonably fast estimation of these rela-tively low frequencies. However, such algorithms may be slowfor those higher-frequency components that can be estimatedwith the benefit of well-aligned high-resolution MRI/CT. Thepurpose of this paper has been to develop methods which con-verge rapidly to accurate and precise estimates of the few pa-rameters which underlie these higher-frequencycomponents.
Previous studies using statistical ensembles of reconstructedimages have demonstrated the ability of high-resolution,low-noise non-radiotracer images to improve the detection andquantification of radiotracer structure [10]–[15], provided thatsimilarity in radiotracer concentrations at different locationsis correlated with similarity in MRI/CT image amplitudes (orsegmentation labels) at those locations. The anecdotal examplepresented here in Section III is consistent with those previousresults, again illustrating the potential for markedly improvedquantification and detection of small radiotracer regions. Herethis potential is suggested even for the case in which the truealignment of the high-resolution image is unknown and mustbe estimated.
The region-based results obtained here benefitted fromthe particularly strong and known correlation between radio-tracer and non-radiotracer structure: Radiotracer concentrationwas uniform within each high-resolution region, and exactknowledge of this was included in the reconstruction. Otherscenarios involving less correlation—e.g., significant varia-tion of radiotracer concentration within each high-resolutionregion—would presumably result in radiotracer image qualitysomewhere between that obtainable from PET/SPECT projec-tion data only and that obtainable with very strong informationsuch as has been employed here. Regarding alignment, as withany registration method, the effectiveness of the present methodpresumably also depends on the nature of the relation betweenradiotracer distribution and MRI/CT image.
The discussion of the previous paragraph suggests theimportance of establishing the nature of the high-resolution,low-noise information that may be available. The use ofMRI/CT images within radiotracer image reconstruction can bethought of as involving image-reconstruction, biological, andhigh-resolution-imaging principles and methods. Biologicalprinciples establish the relation between radiotracer distribu-tion and non-radiotracer structure. High-resolution-imagingmethods are then needed in order to provide high-resolution,
low-noise images of that non-radiotracer structure. For ex-ample, a biological principle underlying the use of MRI/CTimages in brain radiotracer imaging is that variations of ra-diotracer concentration within gray matter, white matter, andcerebrospinal fluid are much less, or are much more gradual,than differences in radiotracer concentration between thesetissue types [2]–[4], [7]–[11], [13], [15], [32]–[34]. Recentwork [35] has utilized small-animal studies to investigatebiological and high-resolution-imaging principles and methodsfor utilizing MRI/CT within radiotracer imaging of tumors.Image reconstruction principles and methods are needed foraccurately and effectively incorporating the biological princi-ples and the high-resolution, low-noise images into radiotracerimage estimation. The present paper develops an aspect ofthe image-reconstruction principles and methods, addressingunified estimation of alignment parameters and radiotraceractivities.
ACKNOWLEDGMENT
The authors would like to thank K. Greer for assistance withthe computer system and D. Gilland for use of the Hann-filteringcode FIL3D.
REFERENCES
[1] C. T. Chen, X. Ouyang, W. H. Wong, X. Hu, V. E. Johnson, C. Or-donez, and C. E. Metz, “Sensor fusion in image reconstruction,” IEEETrans. Nucl. Sci., vol. 38, no. 2, pp. 687–692, Apr. 1991.
[2] R. Leahy and X. Yan, “Incorporation of anatomical MR data for im-proved functional imaging with PET,” in Information Processing inMedical Imaging, A. C. F. Colchester and D. J. Hawkes, Eds. NewYork: Springer-Verlag, 1991, pp. 105–120.
[3] J. A. Fessler, N. H. Clinthorne, and W. L. Rogers, “Regularizedemission image reconstruction using imperfect side information,”IEEE Trans. Nucl. Sci., vol. 39, no. 5, pp. 1464–1471, Oct. 1992.
[4] G. Gindi, M. Lee, A. Rangarajan, and I. G. Zubal, “Bayesian recon-struction of functional images using anatomical information as priors,”IEEE Trans. Med. Imag., vol. 12, no. 4, pp. 670–680, Dec. 1993.
[5] P. C. Chiao, W. L. Rogers, N. H. Clinthorne, J. A. Fessler, and A.O. Hero, “Model-based estimation for dynamic cardiac studies usingECT,” IEEE Trans. Med. Imag., vol. 13, no. 2, pp. 217–226, Jun. 1994.
[6] P. C. Chiao, W. L. Rogers, J. A. Fessler, N. H. Clinthorne, and A.O. Hero, “Model-based estimation with boundary side information orboundary regularization,” IEEE Trans. Med. Imag., vol. 13, no. 2, pp.227–234, Jun. 1994.
[7] V. E. Johnson, J. E. Bowsher, R. J. Jaszczak, and T. G. Turkington,“Analysis and reconstruction of medical images using prior informa-tion,” in Case Studies in Bayesian Statistics, C. Gatsonis, J. S. Hodges,R. E. Kass, and N. D. Singpurwalla, Eds. New York: Springer-Verlag,1995, vol. II, pp. 149–218.
[8] J. E. Bowsher, V. E. Johnson, T. G. Turkington, R. J. Jaszczak, C.E. Floyd, Jr., and R. E. Coleman, “Bayesian reconstruction and useof anatomical a priori information for emission tomography,” IEEETrans. Med. Imag., vol. 15, no. 5, pp. 673–686, Oct. 1996.
[9] B. A. Ardekani, M. Braun, B. F. Hutton, I. Kanno, and H. Iida,“Minimum cross-entropy reconstruction of PET images using prioranatomical information,” Physics in Medicine and Biology, vol. 41,pp. 2497–2517, 1996.
[10] S. Sastry and R. E. Carson, “Multimodality Bayesian algorithm forimage reconstruction in positron emission tomography: A tissue com-position model,” IEEE Trans. Med. Imag., vol. 16, no. 6, pp. 750–761,Dec. 1997.
[11] A. Rangarajan, I.-T Hsiao, and G. Gindi, “A Bayesian joint mixtureframework for the integration of anatomical information in functionalimage reconstruction,” J. Math. Imaging and Vision, vol. 12, no. 3, pp.199–217, 2000.
[12] C. Comtat, P. E. Kinahan, J. A. Fessler, T. Beyer, D. W. Townsend,M. Defrise, and C. Michel, “Clinically feasible reconstruction of 3Dwhole-body PET/CT data using blurred anatomical labels,” Physics inMedicine and Biology, vol. 47, pp. 1–20, 2002.
1258 IEEE TRANSACTIONS ON NUCLEAR SCIENCE, VOL. 53, NO. 3, JUNE 2006
[13] K. Baete, J. Nuyts, K. Van Laere, W. Van Paesschen, S. Ceyssens, L.De Ceuninck, O. Gheysens, A. Kelles, J. Van den Eynden, P. Suetens,and P. Dupont, “Evaluation of anatomy based reconstruction for partialvolume correction in brain FDG-PET,” NeuroImage, vol. 23, no. 1, pp.305–317, 2004.
[14] P. P. Bruyant, H. C. Gifford, G. Gindi, and M. A. King, “Numericalobserver study of MAP-OSEM regularization methods with anatomicalpriors for lesion detection in Ga-67 images,” IEEE Trans. Nucl. Sci.,vol. 51, no. 1, pp. 193–197, Feb. 2004.
[15] J. Nuyts, K. Baete, D. Beque, and P. Dupont, “Comparison betweenMAP and postprocessed ML for image reconstruction in emission to-mography when anatomical knowledge is available,” IEEE Trans. Med.Imag., vol. 24, no. 5, pp. 667–675, May 2005.
[16] J. P. W. Pluim, J. B. A. Maintz, and M. A. Viergever, “Mutual-infor-mation-based registration of medical images: A survey,” IEEE Trans.Med. Imag., vol. 22, no. 8, pp. 986–1004, Aug. 2003.
[17] P. McCullagh and J. A. Nelder, Generalized Linear Models. NewYork: Chapman and Hall, 1989.
[18] K. M. Hanson, “Bayesian reconstruction based on flexible priormodels,” J. Optical. Soc. Amer. A, vol. 10, pp. 997–1004, 1993.
[19] X. L. Battle, G. S. Cunningham, and K. M. Hanson, “Tomographicreconstruction using 3D deformable models,” Physics in Medicine andBiology, vol. 43, no. 4, pp. 983–990, 1998.
[20] G. S. Cunningham, K. M. Hanson, and X. L. Battle, “Three-dimen-sional reconstructions from low-count SPECT data using deformablemodels,” Optics Express, vol. 2, no. 6, pp. 227–236, 1998.
[21] R. T. Whitaker and V. Elangovan, “A direct approach to estimatingsurfaces in tomographic data,” Medical Image Analysis, vol. 6, no. 3,pp. 235–249, 2002.
[22] H. Goldstein, Classical Mechanics. Reading, Massachusetts: Ad-dison-Wesley, 1980.
[23] P. E. Gill, W. Murray, and M. H. Wright, Practical Optimization. SanDiego: Academic Press, 1981.
[24] A. R. Formiconi, A. Pupi, and A. Passeri, “Compensation of spatialsystem response in SPECT with conjugate gradient reconstructiontechnique,” Phys. Med. Biol., vol. 34, pp. 68–84, 1989.
[25] J. E. Bowsher, D. R. Gilland, C. E. Floyd, Jr., R. J. Jaszczak, V. E.Johnson, and R. E. Coleman, “Three-dimensional iterative reconstruc-tion for SPECT,” Journal of Nuclear Medicine, vol. 33, p. 879, 1992,(abstract).
[26] H. M. Hudson and R. S. Larkin, “Accelerated image reconstructionusing ordered subsets of projection data,” IEEE Trans. Med. Imag., vol.13, no. 4, pp. 601–609, Dec. 1994.
[27] R. E. Carson, Y. Yan, B. A. Chodkowski, T. K. Yap, and M. E. Daube-Witherspoon, “Precision and accuracy of regional radioactivity quan-titation using the maximum likelihood EM reconstruction algorithm,”IEEE Trans. Med. Imag., vol. 13, no. 3, pp. 526–537, Sep. 1994.
[28] J. E. Bowsher and C. E. Floyd, Jr., “Treatment of Compton scatteringin maximum-likelihood, expectation-maximization reconstructions ofSPECT images,” J. Nucl. Med., vol. 32, no. 6, pp. 1285–1291, Jun.1991.
[29] D. S. Lalush and B. M. W. Tsui, “Mean-variance analysis of block-iterative reconstruction algorithms modeling 3D detector response inSPECT,” IEEE Trans. Nucl. Sci., vol. 45, no. 3, pp. 1280–1287, Jun.1998.
[30] R. E. Carson, “A maximum likelihood method for region-of-interestevaluation in emission tomography,” Journal of Computer Assisted To-mography, vol. 10, pp. 654–663, 1986.
[31] J. M. Ollinger and D. L. Snyder, “An evaluation of an improvedmethod for computing histograms in dynamic tracer studies usingpositron emission tomography,” IEEE Trans. Nucl. Sci., vol. NS-33,pp. 435–438, 1986.
[32] C. Meltzer, J. Leal, H. Mayberg, H. Wagner, Jr., and J. Frost, “Correc-tion of PET data for partial volume effects in human cerebral cortex byMR imaging,” Journal of Computer Assisted Tomography, vol. 14, no.4, pp. 561–570, 1990.
[33] H. W. Muller-Gartner, J. M. Links, J. L. Prince, R. N. Bryan, E.McVeigh, J. P. Leal, C. Davatzikos, and J. J. Frost, “Measurement ofradiotracer concentration in brain gray matter using positron emissiontomography: MRI-based correction for partial volume effects,” Journalof Cerebral Blood Flow Metabolism, vol. 12, no. 4, pp. 571–583, 1992.
[34] O. G. Rousset, Y. L. Ma, and A. C. Evans, “Correction for partialvolume effects in PET: Principle and validation,” Journal of NuclearMedicine, vol. 39, no. 5, pp. 904–911, 1998.
[35] J. E. Bowsher, H. Yuan, L. W. Hedlund, T. G. Turkington, G. Akabani,A. Badea, W. C. Kurylo, C. T. Wheeler, G. P. Cofer, M. W. Dewhirst,and G. A. Johnson, “Using MRI information to estimate F18-FDG dis-tributions in rat flank tumors,” in Conference Record of the 2004 IEEENuclear Science Symposium and Medical Imaging Conference, Rome,Italy, Oct. 16–22, 2004.