Embed Size (px)
Citation preview
1242 IEEE JOURNAL OF BIOMEDICAL AND HEALTH INFORMATICS, VOL. 21, NO. 5, SEPTEMBER 2017
A Robust Motion Artifact Detection Algorithm forAccurate Detection of Heart Rates FromPhotoplethysmographic Signals Using
Time–Frequency Spectral FeaturesDuy Dao, S. M. A. Salehizadeh, Yeonsik Noh, Jo Woon Chong, Chae Ho Cho, Dave McManus,
Chad E. Darling, Yitzhak Mendelson, and Ki H. Chon, Senior Member, IEEE
Abstract—Motion and noise artifacts (MNAs) impose lim-its on the usability of the photoplethysmogram (PPG), par-ticularly in the context of ambulatory monitoring. MNAs candistort PPG, causing erroneous estimation of physiologicalparameters such as heart rate (HR) and arterial oxygen sat-uration (SpO2). In this study, we present a novel approach,“TifMA,” based on using the time–frequency spectrum ofPPG to first detect the MNA-corrupted data and next discardthe nonusable part of the corrupted data. The term “nonus-able” refers to segments of PPG data from which the HRsignal cannot be recovered accurately. Two sequential clas-sification procedures were included in the TifMA algorithm.The first classifier distinguishes between MNA-corruptedand MNA-free PPG data. Once a segment of data is deemedMNA-corrupted, the next classifier determines whether theHR can be recovered from the corrupted segment or not. Asupport vector machine (SVM) classifier was used to builda decision boundary for the first classification task usingdata segments from a training dataset. Features from time–frequency spectra of PPG were extracted to build the de-tection model. Five datasets were considered for evaluatingTifMA performance: (1) and (2) were laboratory-controlledPPG recordings from forehead and finger pulse oximetersensors with subjects making random movements, (3) and(4) were actual patient PPG recordings from UMass Memo-rial Medical Center with random free movements and (5) wasa laboratory-controlled PPG recording dataset measured atthe forehead while the subjects ran on a treadmill. The firstdataset was used to analyze the noise sensitivity of the al-gorithm. Datasets 2-4 were used to evaluate the MNA detec-tion phase of the algorithm. The results from the first phase
Manuscript received April 26, 2016; revised August 16, 2016; acceptedSeptember 18, 2016. Date of publication October 21, 2016; date ofcurrent version September 1, 2017. This work was supported in partby the US Army Medical Research and Materiel Command under GrantW81XWH-12-1-0541 and the NSF award #1522087.
D. Dao, S. M. A. Salehizadeh, Y. Noh, and K. H. Chon arewith the University of Connecticut, Storrs, CT 06269 USA (e-mail:[email protected]; [email protected]; [email protected]; [email protected]).
J. W. Chong and C. H. Cho are with Texas Tech University, Lubbock,TX 79409 USA (e-mail: [email protected]; [email protected]).
D. McManus and C. E. Darling are with the University of Mas-sachusetts Medical School, Worcester, MA 01655 USA (e-mail:[email protected]; [email protected]).
Y. Mendelson is with Worcester Polytechnic Institute, Worcester, MA01609 USA (e-mail: [email protected]).
Digital Object Identifier 10.1109/JBHI.2016.2612059
of the algorithm (MNA detection) were compared to resultsfrom three existing MNA detection algorithms: the Hjorth,kurtosis-Shannon entropy, and time-domain variability-SVMapproaches. This last is an approach recently developed inour laboratory. The proposed TifMA algorithm consistentlyprovided higher detection rates than the other three meth-ods, with accuracies greater than 95% for all data. Moreover,our algorithm was able to pinpoint the start and end times ofthe MNA with an error of less than 1 s in duration, whereasthe next-best algorithm had a detection error of more than2.2 s. The final, most challenging, dataset was collected toverify the performance of the algorithm in discriminatingbetween corrupted data that were usable for accurate HRestimations and data that were nonusable. It was found thaton average 48% of the data segments were found to haveMNA, and of these, 38% could be used to provide reliableHR estimation.
Index Terms—Complex demodulation (CDM), heart rate(HR) estimation, motion and noise artifacts (MNAs), photo-plethysmography, time–frequency (TF).
I. INTRODUCTION
PULSE oximeter (PO) is a noninvasive, low-cost device thatis widely used in hospitals and clinics to monitor heart rate
(HR) and arterial oxygen saturation (SpO2). Recently, therehave been efforts to derive other physiological parameters fromphotoplethysmogram (PPG), as recorded by a PO [1]–[3]. Thefluctuations observed in a PPG are influenced by arterial andvenous blood flow, as well as the autonomic and respiratorysystems of the peripheral circulation. Such information couldbe used more comprehensively for phenotyping cardiovascularhealth. Due to increasing health care costs, a single sensor fromwhich multiple clinical data points can be derived such as a POis very attractive from a financial perspective. Moreover, using aPO as a multipurpose vital sign monitor has clinical appeal, sincethe device is widely accepted by clinicians and patients becauseof its ease of use, comfort, and accuracy in providing reliablevital signs. Knowledge of respiratory rate and HR patterns wouldprovide useful clinical information in many situations where aPO is the sole available monitor. However, extraction of vitalsigns and other physiological parameters using pulse oximetryis predicated on motion artifact-free PPG data. It is well known
2168-2194 © 2016 IEEE. Personal use is permitted, but republication/redistribution requires IEEE permission.See http://www.ieee.org/publications standards/publications/rights/index.html for more information.
DAO et al.: ROBUST MOTION ARTIFACT DETECTION ALGORITHM FOR ACCURATE DETECTION OF HR FROM PHOTOPLETHYSMOGRAPHIC 1243
that the PPG is highly sensitive to artifacts, particularly thosegenerated while the patient is in motion [4]. This imposes a hugelimitation on the usability of the PPG for ambulatory monitoringapplications. Motion and noise artifacts (MNAs) distorting PPGrecordings can cause erroneous estimation of HR and SpO2[5]. Although the intelligent design of sensor attachment, formfactors, and packaging can help to reduce the impact of motiondisturbances by making sure that the sensor is securely mounted,they are not sufficient for complete MNA removal. CombatingMNAs in PPG data has been the core focus of research for manyyears.
Although there are techniques which have been proposedto alleviate the effects of MNAs, the solution to this problemstill remains unsatisfactory in practice. Several algorithm-basedMNA reduction methods were proposed, such as time- andfrequency-domain filtering, power spectrum analysis, and blindsource separation techniques [6]–[12]. These techniques recon-struct noise-contaminated PPG data so that a noise-reducedsignal is obtained. However, the reconstructed signal typicallycontains incomplete dynamic features of the uncorrupted PPGsignal, and some algorithms are solely designed to capture onlythe HR and SpO2 information instead of the signal’s morphol-ogy and its amplitudes, which are needed for other physiologicalderivations [13]. Moreover, these reconstruction algorithms op-erate even on clean PPG portions where MNA reduction is notneeded. This introduces unnecessary computation burdens anddistorts the signal integrity of the clean portion of the data.Hence, an accurate MNA detection algorithm, which distin-guishes clean PPG recording portions from corrupted portions,is essential to not distort the noncorrupted data segments [14].
MNA detection methods are mostly based on a signal qual-ity index (SQI) which quantifies the severity of the artifacts.Some approaches calculate the SQI using waveform morpholo-gies [15]–[17] or filtered output [18], [19], while others derivethe SQI with the help of additional hardware such as an ac-celerometer and electrocardiogram (ECG) [20], [21]. In somecommercially available POs, accelerometers are not provided,or even if they are available, access to the raw data is not usu-ally feasible; hence, they cannot be used for MNA cancellation.Moreover, traditional approaches to cancellation of MNA usingadaptive noise filtering do not always yield accurate results.
Statistical measures, such as skewness, kurtosis (K), andquadratic phase coupling [22], Shannon entropy (SE), andRenyi’s entropy [23], have been shown to be helpful in determin-ing the SQI. These statistical algorithms discriminate amplitudedistributions between PPG segments with an assumption thatclean and corrupt segments would form two separate groups.However, PPG morphology varies among patients, thus yield-ing a multitude of amplitude distributions. Therefore, it wouldbe difficult to obtain high accuracy from these algorithms inpractice. Another approach, using Hjorth parameters, where H1and H2 represent central frequency and half of the bandwidth ofa signal, respectively, were proposed as means to quantify thedegree of oscillation in a signal [24], [25]. They were employedfor MNA discrimination in PPG by Gil et al. [26] with a hy-pothesis that MNA-derived H1 and H2 would largely differ fromH1 and H2 derived from the noise-free PPG signal. However,due to the time-varying dynamic nature of PPG signals, fre-
quency features such as H1 and H2 alone would not be sufficientfor accurate detection of MNA. Our recently published MNAdetection method for PPG uses time-domain features such asvariability in HR, amplitude, and waveform morphology, withthe help of the support vector machine (SVM) classifier, fordetection [27]. The algorithm, which we termed time-domainvariability (TDV) SVM, was shown to be more robust than otherstatistical-based algorithms as it uses successive difference andvariability measures. However, this method is highly dependenton accuracy of the peak amplitude detection. Unlike the ECG,the PPG waveform does not have distinctive peaks which makeaccurate peak detection challenging. The dependence on a peakdetection subroutine is a drawback of the TDV algorithm andinevitably affects its performance.
Time–frequency (TF) techniques such as smoothed pseudoWigner–Ville, short-time Fourier transform, continuous wavelettransform, Hilbert–Huang transform, and variable frequencycomplex demodulation (VFCDM) received considerable atten-tion as a means to analyze the signal of interest in both temporaland spectral domains [28]–[30]. Yan et al. used a smoothedpseudo Wigner–Ville TF technique for MNA reduction albeitwith limited success [10]. In this paper, we introduce a novel al-gorithm for MNA detection using a TF representation producedby VFCDM. It is hypothesized in the design of our proposedMNA detection algorithm that TF information would providemeaningful dynamic features for improved differentiation ofMNAs.
In this paper, we present a new MNA detection algorithm,“TifMA,” which not only detects MNA-corrupted PPG segmentsbut also is able to discriminate between usable versus nonusablePPG segments. The TifMA algorithm was developed based onthe features from the time–frequency spectrum (TFS) of a PPGsignal. The variable frequency demodulation technique was usedto derive the TFS of PPG. The proposed algorithm includestwo phases: 1) MNA detection; and 2) deciding whether or notan MNA-corrupted data segment can be used. The algorithmperformance was evaluated at each phase using different PPGrecordings. We show that features from TF spectra of PPG havegood accuracy in discriminating between MNA-corrupted andclean PPG data; in addition, the algorithm can provide an abilityto determine if the corrupted data are usable or not for estimatingHR. In this work, features that are extracted from VFCDM TFwere used as inputs for the machine-learning classifier algorithmwhich utilized the SVM. The results of the MNA detection phaseof TifMA were compared to three other existing MNA detectionalgorithms: the Hjorth [26], kurtosis-SE [23], and the TDV-SVMapproach, an approach recently developed in our laboratory [27].The output of the usability detection stage of the algorithm wasobtained according to a fixed threshold value and was evaluatedby comparing the reference HR to the estimated HR from aVFCDM TFS.
II. MATERIALS AND EXPERIMENTS
A. Experimental Protocol and Preprocessing
To develop, analyze, and evaluate the proposed TifMA algo-rithm, we used five different datasets. Datasets (1) and (2) wererecorded in controlled conditions from ten subjects in the Chon
1244 IEEE JOURNAL OF BIOMEDICAL AND HEALTH INFORMATICS, VOL. 21, NO. 5, SEPTEMBER 2017
TABLE IPPG DATASETS AND EXPERIMENTS SETTINGS
No. subjects Dataset Electrode type Subject’s age/sex
11 1 (Chon Lab) Forehead PO 23–58 y (10 male, 1 female)11 2 (Chon Lab) Finger PO 23–58 y (10 male, 1 female)10 3 (UMMC) Forehead PO 18–38 y (5 female, 5 male)10 4 (UMMC) Finger PO 18–45 y (4 female, 6 male)10 5 (Chon Lab) Forehead PO 23–58 y (9 male, 1 female)
Lab and datasets (3) and (4) were provided by UMASS Hos-pital, recorded from ten patients. Dataset (5) was also recordedin the Chon Lab, but during a treadmill experiment. This studywas approved by both Worcester Polytechnic Institute’s (WPI)and UMass Memorial Medical Center’s (UMMC) IRBs andall subjects provided informed consent prior to data recording.All laboratory recordings were performed in a quiet room witha temperature of 70 °F. There are two versions with differentform factors to capture PPG at the user’s forehead and finger.The forehead sensor is termed 6PD-forehead since it consists ofsix photodetectors concentric around the center-paired LEDs,which have peak wavelengths of 660 nm (red) and 940 nm(infrared). The finger sensor, due to space constraints, consistsof three photodetectors concentric around center-paired LEDswith the same specifications as those of the 6PD-forehead sen-sor. The PPGs were sampled at 80 Hz. The scope of this studywas to evaluate the efficacy of our proposed TifMA algorithm.Therefore, only one infrared PPG channel, deemed to containthe best signal quality data, was used for analysis. Details of thisstudy’s database including demographics of subjects are givenin Table I.
The details of experiments and data collection protocols areas follows.
1) Datasets: (1) and (2) Chon Lab dataset: For thelaboratory-controlled environment, both forehead and fingerworn PO sensor data were collected from healthy subjects re-cruited from the student community of WPI. Laboratory dataallow us to have more control over the duration of the MNAgenerated, to ensure that the detection phase of the algorithmwas tested on a wide range of MNA durations. In laboratory-controlled PPG data, motion artifacts were induced by head andfinger movements for specific time intervals in both horizontaland vertical directions. For head movement data, 11 volunteerswere asked to wear our PO on their foreheads along with areference Masimo Radical (Masimo SET) finger type transmit-tance PO. The subjects were all healthy with no past historiesof cardiovascular disease. After baseline recording for 5 minwithout any movement, subjects were instructed to introducemotion artifacts for specific time intervals varying from 10%to 50% within a 1 min segment. For example, if a subject wasinstructed to perform left–right random movements for 6 s, a1 min segment of data would contain 10% noise. The laboratoryfinger movement data were recorded in a similar way as the headdata using our custom-made PPG finger sensor on the movingfinger and the reference Masimo PO on the stationary hand.
TABLE IIAVERAGED COHEN’S κ COEFFICIENTS REPRESENTING THE AGREEMENT
BETWEEN INSPECTORS’ DECISIONS ON PPG LABELS
Lab. head Lab. finger UMass. head UMass. finger
Cohan’s κ 0.823 0.935 0.732 0.791# of subjects 11 11 10 10Duration (min) 5 5 10 10
TABLE IIIMEAN ± STD. DEVIATION OF PERFORMANCE METRICS OF OUR PROPOSED
TIFMA USING VARIOUS WINDOW LENGTHS
L2 3 s 4 s 5 s 6 s
Lab. head Accuracy 86.8 ± 5.52 95.7 ± 0.82 86.9 ± 4.27 85.5 ± 6.96Sensitivity 82.0 ± 9.59 93.0 ± 5.75 81.5 ± 8.47 79.8 ± 9.58Specificity 89.1 ± 5.86 96.6 ± 1.48 81.5 ± 3.19 90.0 ± 5.97
(3) and (4) UMMC dataset: The next dataset was acquiredfrom patients who were admitted to our partner hospital at theUMMC. Data from patients provided the most realistic infor-mation on the motion artifacts since the patients were allowedto move freely as long as the sensors were positioned prop-erly. The patient PPG data were recorded from ten subjectsadmitted to emergency department at UMMC. Similar to thelaboratory-controlled dataset, each patient was fitted with ourcustom-made sensors (both forehead and finger) and the MasimoPOs on the finger of opposite hand. One subject had hyperten-sion and two subjects suffered from hypercholesterolemia andhyperlipidemia; the remaining subjects were considered freefrom cardiovascular diseases. All recording were performed inthe Emergency Department with a room temperature of 68 °F.The patients were admitted due to pain symptoms and werenot restrained from making natural movements. Therefore, theywould have generated many different but natural characteristicsof MNA in their recorded PPG data.
(5) Chon Lab dataset: This dataset was also recorded in theChon Lab from ten healthy subjects, with ages ranging from26 to 55. For each subject, the PPG signal was recorded fromtheir forehead using a PO. The lead II ECG signal was recordedas a reference from the chest using ECG sensors, sampled at400 Hz. During data recording, subjects walked, jogged, andran on a treadmill with speeds of 3, 5, and 7 m/h, respectively,for 9 min. At the end, all experimental subjects were asked toperform random arbitrary movements. The activity durationswere 1 min rest, 1 min walking (3 m/h), 1 min rest, 2 minjogging (5 m/h), 1 min rest, 2 min running (7 m/h), 1 min rest,1 min arbitrary movement. The ECG-based reference HR wasrecorded in order to assess the performance of the second phaseof the TifMA algorithm.
All PPG data were preprocessed by a sixth-order infiniteimpulse response (IIR) band pass filter with cutoff frequenciesof 0.1 and 10 Hz. Zero-phase forward and reverse filtering wasapplied to account for the nonlinear phase of the IIR filter.
DAO et al.: ROBUST MOTION ARTIFACT DETECTION ALGORITHM FOR ACCURATE DETECTION OF HR FROM PHOTOPLETHYSMOGRAPHIC 1245
TABLE IVPERFORMANCE METRICS (MEAN ± STD.) OF OUR PROPOSED TIFMA MNA DETECTION ALGORITHM VERSUS OTHER METHODS
TifMA Hjorth TDV KSE
Lab. head Accuracy 95.7 ± 0.82 72.5 ± 10.74∗ 93.4 ± 3.50∗ 83.1 ± 7.31∗Sensitivity 93.0 ± 5.75 47.2 ± 28.80∗ 88.8 ± 7.90∗ 56.6 ± 17.88∗Specificity 96.6 ± 1.48 84.4 ± 4.63∗ 96.7 ± 300 91.5 ± 1.14∗
Umass. head Accuracy 95.3 ± 1.34 69.5 ± 21.83∗ 89.9 ± 1.45∗ 85.1 ± 8.34∗Sensitivity 90.8 ± 2.83 53.8 ± 26.05∗ 84.6 ± 2.89∗ 68.7 ± 17.72∗Specificity 98.7 ± 1.07 84.5 ± 8.83∗ 94.3 ± 3.95∗ 86.4 ± 7.82∗
Lab. finger Accuracy 97.5 ± 1.50 91.1 ± 6.87∗ 94.4 ± 3.30∗ 58.5 ± 20.67∗Sensitivity 96.4 ± 2.34 83.5 ± 2104∗ 94.7 ± 3.40 34.6 ± 12.23∗Specificity 98.1 ± 1.43 96.2 ± 3.02 94.7 ± 3.00∗ 86.3 ± 15.65∗
Umass. finger Accuracy 94.3 ± 1.64 71.0 ± 18.96∗ 89.6 ± 2.34∗ 88.3 ± 2.68∗Sensitivity 88.5 ± 2.23 41.1 ± 27.57∗ 85.2 ± 3.75∗ 71.5 ± 8.83∗Specificity 96.9 ± 1.86 88.4 ± 7.52∗ 95.1 ± 0.79 93.6 ± 1.52∗
(∗) indicates statistically significant difference (p<0.05) between TifMA and the others.
B. Reference Signal for MNA Detection
Many recent publications on MNA detection used human vi-sual inspection by experts who were familiar with PPG, andtheir decisions are regarded as the gold standard for markingMNA-corrupted data [22], [23], [27]. In our work, we also usehuman visual inspection to establish a MNA reference for ourdatasets. Three inspectors individually marked MNA-corruptedportions of the PPG. Disagreements about the marked portionswere resolved by majority votes. Cohen’s κ was used to deter-mine if there was agreement between three inspectors’ judg-ments on whether PPG segments were declared to be clean orcorrupted. For each dataset, the average Cohan’s κ was reportedin Table II over three runs computed from each distinct inspec-tor pair. Overall, the Cohan’s κ showed substantial agreementbetween the inspectors with 95% CI and p < 0.0005.
C. Reference Signal for Data Usability Detection
A usability index (UI) was calculated to measure the usabil-ity of MNA-corrupted segments of PPG recordings. In order toverify the performance of the index, it was compared to the ref-erence usability measurements. The reference was determinedaccording to the deviation of reference HR from the chest ECG,and the estimated HR obtained from phase 2 of the TifMAalgorithm.
D. TifMA
As mentioned above, the TifMA algorithm consists of twomajor phases: 1) MNA detection; and 2) usability detection.Both phases of the algorithm were developed based on a TFtechnique named VFCDM. VFCDM is a method for estimatingthe TFS of a time-varying signal. This method was shown toprovide concomitant high time and frequency resolution as wellas preservation of the amplitude distribution of the signal [31].VFCDM has two steps: 1) constructing an initial TFS (iTFS)using a method developed in our laboratory, termed fixed fre-quency complex demodulation (FFCDM); and 2) doing furthercomplex demodulation (CDM) using the center frequencies ofthe iTFS to obtain even more accurate TFS and amplitude of the
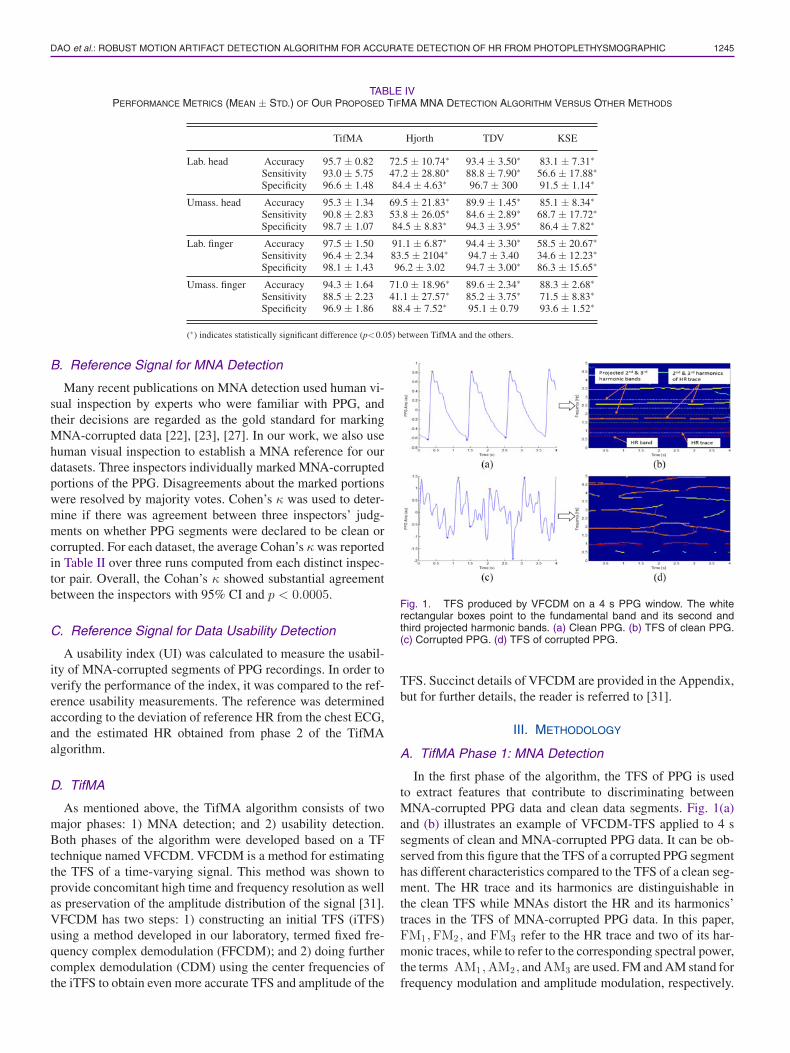
Fig. 1. TFS produced by VFCDM on a 4 s PPG window. The whiterectangular boxes point to the fundamental band and its second andthird projected harmonic bands. (a) Clean PPG. (b) TFS of clean PPG.(c) Corrupted PPG. (d) TFS of corrupted PPG.
TFS. Succinct details of VFCDM are provided in the Appendix,but for further details, the reader is referred to [31].
III. METHODOLOGY
A. TifMA Phase 1: MNA Detection
In the first phase of the algorithm, the TFS of PPG is usedto extract features that contribute to discriminating betweenMNA-corrupted PPG data and clean data segments. Fig. 1(a)and (b) illustrates an example of VFCDM-TFS applied to 4 ssegments of clean and MNA-corrupted PPG data. It can be ob-served from this figure that the TFS of a corrupted PPG segmenthas different characteristics compared to the TFS of a clean seg-ment. The HR trace and its harmonics are distinguishable inthe clean TFS while MNAs distort the HR and its harmonics’traces in the TFS of MNA-corrupted PPG data. In this paper,FM1 ,FM2 , and FM3 refer to the HR trace and two of its har-monic traces, while to refer to the corresponding spectral power,the terms AM1 ,AM2 , and AM3 are used. FM and AM stand forfrequency modulation and amplitude modulation, respectively.
1246 IEEE JOURNAL OF BIOMEDICAL AND HEALTH INFORMATICS, VOL. 21, NO. 5, SEPTEMBER 2017
Since respiratory-induced fluctuations in PPG are highly dy-namic and not trivial to characterize in a TFS, regions associatedwith respiratory frequencies are removed from the TFS by set-ting their powers to zero. The respiratory frequencies are definedto be between 0 and 0.5 Hz. Our algorithm first determines thedominant frequency in the PPG segment, termed f1 , predicatedupon the assumption that PPG is dominantly driven by cardiaccycles. To determine instantaneous f1 , total power within thenarrow-band spectral window Wk = [ fk − BW, fk + BW]is computed, where BW = 0.2Hz is the bandwidth of the bandand fk is the center frequency of the window ranging from 0.6to 2.4 Hz with increment of 0.1 Hz. BW was determined basedon an assumption that within a short time HR does not fluctuatemore than 12 beat per minute. f1 is estimated as fk at whichWk is maximum.
The TFS of the segment is normalized by the total powerin the f1 band. From the normalized TFS, we then extractFM1 and AM1 within [f1 − BW, f1 + BW] . Note that eachpoint in the TFS has three instantaneous values: time, fre-quency, and spectral power. The maximal power in each timeinstance is taken to form AM1 = AM1(t) : t = 1, . . . , N − 2where N is the number of data points in the PPG seg-ment. Its corresponding FM1 is also extracted. Once lo-cated, AM1 is removed from the TFS by setting its powerto zero. Similarly, {AM2 , FM2} ∈ [2f1 − BW, 2f1 + BW]and {AM3,FM3} ∈ [3f1 − BW, 3f1 + BW] are found andremoved. Note that the algorithm assumes that corrupted PPGsegments would exhibit irregularity in the time series waveform.Thus, the TFS of a corrupted segment would have broadbanddynamics. In this case, the proposed fundamental frequency es-timation method would probably yield inaccurate result. How-ever, an arbitrary estimation of HR (fundamental frequency andits harmonics) in such cases would remove only a portion of thenoise power within the defined bands, but would retain the rest.
From the extracted TFS and {FMi ,AMi : i = 1, 2, 3}, threeTF features were derived to quantify the noise level betweenclean versus corrupted PPG segments. These will be henceforthtermed, collectively, the TF features.
1) Residual Noise Power (Pnoise): After extracting thefirst three dominant traces, the remaining power in the TFS isconsidered the residual noise power Pnoise and is denoted asfollows:
Pnoise = PTFS −3∑
i=1
∑
t
AMi,t (1)
where PTFS is the total power in the TFS. In a clean PPG seg-ment as illustrated in Fig. 1(b), the first three harmonics wouldbe located within the predetermined narrow band. Thus, extract-ing their power would effectively remove most of the spectralpower from the TFS. The remaining noise power would be neg-ligibly small. On the other hand, artifacts in the corrupted PPGsegment produce spectral power at various frequency locationswhich are often not associated with the harmonics’ frequencybands as illustrated in Fig. 1(d). Some of this spectral poweris outside of the bands and/or there are multiple power within
a band. Therefore, the power would not be extracted which inturn yields high Pnoise level.
2) Projected Frequency Modulation Difference (dfFM ):Projected difference is defined as the difference in frequencybetween the fundamental HR trace and its harmonic traces andis computed as follows:
dfFM =3∑
i=2
∑
t
|FMi,t − i × FM1,t | . (2)
Similar to the previous assumption, the frequency locations ofthe harmonic traces are expected to be proportional to that of thefundamental trace, which would result in a low dfFM for a cleansegment. For an artifact-corrupted segment, the proportionalityin the frequency of the harmonics would no longer hold, thusdriving dfFM value to be high.
3) HR Frequency Difference (dfHR ): HR frequency dif-ference is defined as the difference between the fundamentalfrequency modulation FM1 and HR computed from the time-domain peak calculation. This feature measures the agreementbetween the fundamental frequencies detected from the TFSand from the time-domain signal. It is assumed that the fre-quencies would be in agreement in a clean PPG segment. Ina noise-corrupted segment, however, there could even be largedifferences in the values. We compute dfHR as follows:
dfHR =∑
t
∣∣∣∣FM1,t − median(
1PP
)∣∣∣∣ (3)
where PP (second) are the peak-to-peak intervals in a PPG seg-ment.
As mentioned above, the results of the MNA detection phaseof TifMA were compared to three other existing MNA detectionalgorithms: the Hjorth [26], kurtosis-SE [23] and TDV-SVMapproach, an approach recently developed in our laboratory [27].
Feature extraction from PPG data was done on a sliding win-dow segment of length L1 = 8 s with 50% overlap. Each seg-ment was transformed using VFCDM into TFS, of which onlythe middle portion of length L2 = 4 s was considered for furtherprocessing. This is because, as shown in Table III, the middle4 s of data out of the full L1 = 8 s provided the best accuracy indetection of MNAs.
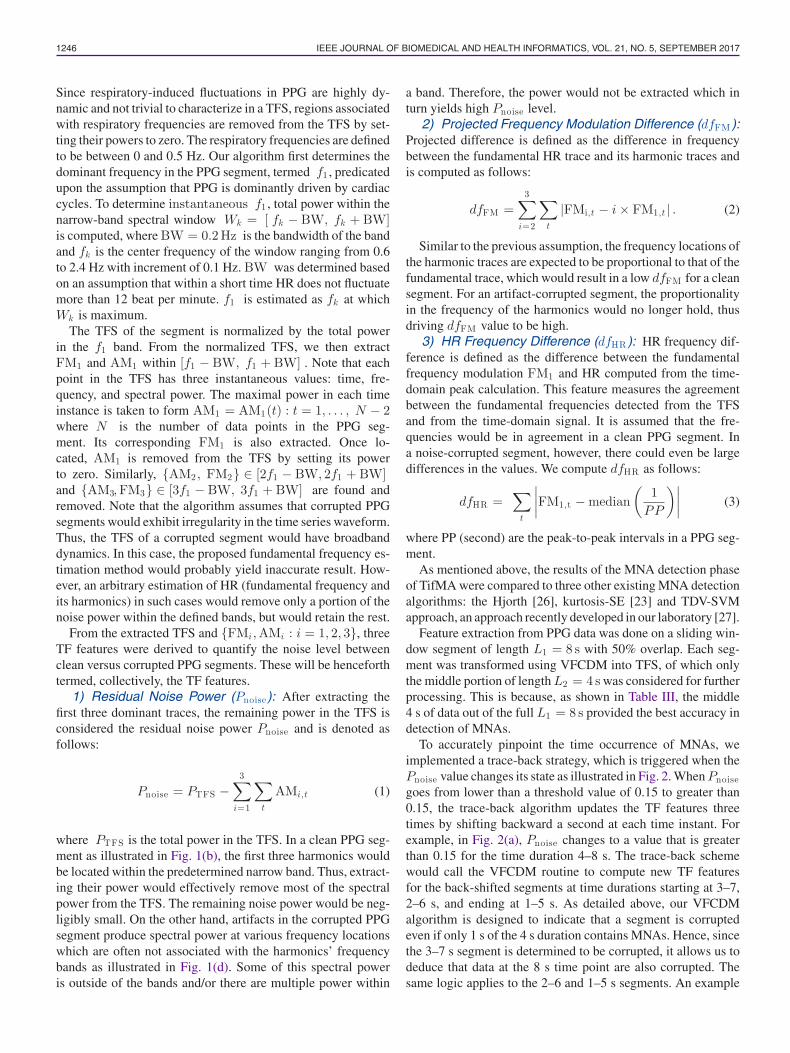
To accurately pinpoint the time occurrence of MNAs, weimplemented a trace-back strategy, which is triggered when thePnoise value changes its state as illustrated in Fig. 2. When Pnoisegoes from lower than a threshold value of 0.15 to greater than0.15, the trace-back algorithm updates the TF features threetimes by shifting backward a second at each time instant. Forexample, in Fig. 2(a), Pnoise changes to a value that is greaterthan 0.15 for the time duration 4–8 s. The trace-back schemewould call the VFCDM routine to compute new TF featuresfor the back-shifted segments at time durations starting at 3–7,2–6 s, and ending at 1–5 s. As detailed above, our VFCDMalgorithm is designed to indicate that a segment is corruptedeven if only 1 s of the 4 s duration contains MNAs. Hence, sincethe 3–7 s segment is determined to be corrupted, it allows us todeduce that data at the 8 s time point are also corrupted. Thesame logic applies to the 2–6 and 1–5 s segments. An example
DAO et al.: ROBUST MOTION ARTIFACT DETECTION ALGORITHM FOR ACCURATE DETECTION OF HR FROM PHOTOPLETHYSMOGRAPHIC 1247
Fig. 2. Trace-back strategy to find (a) start and (b) end points of MNA.
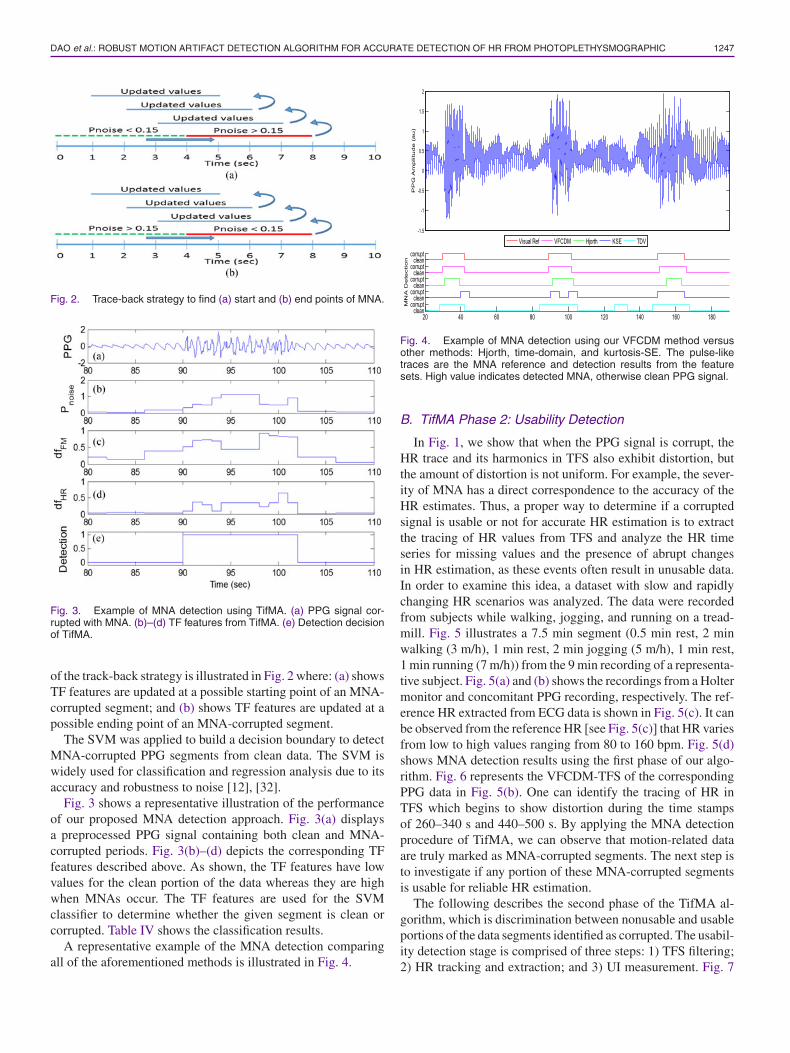
Fig. 3. Example of MNA detection using TifMA. (a) PPG signal cor-rupted with MNA. (b)–(d) TF features from TifMA. (e) Detection decisionof TifMA.
of the track-back strategy is illustrated in Fig. 2 where: (a) showsTF features are updated at a possible starting point of an MNA-corrupted segment; and (b) shows TF features are updated at apossible ending point of an MNA-corrupted segment.
The SVM was applied to build a decision boundary to detectMNA-corrupted PPG segments from clean data. The SVM iswidely used for classification and regression analysis due to itsaccuracy and robustness to noise [12], [32].
Fig. 3 shows a representative illustration of the performanceof our proposed MNA detection approach. Fig. 3(a) displaysa preprocessed PPG signal containing both clean and MNA-corrupted periods. Fig. 3(b)–(d) depicts the corresponding TFfeatures described above. As shown, the TF features have lowvalues for the clean portion of the data whereas they are highwhen MNAs occur. The TF features are used for the SVMclassifier to determine whether the given segment is clean orcorrupted. Table IV shows the classification results.
A representative example of the MNA detection comparingall of the aforementioned methods is illustrated in Fig. 4.
Fig. 4. Example of MNA detection using our VFCDM method versusother methods: Hjorth, time-domain, and kurtosis-SE. The pulse-liketraces are the MNA reference and detection results from the featuresets. High value indicates detected MNA, otherwise clean PPG signal.
B. TifMA Phase 2: Usability Detection
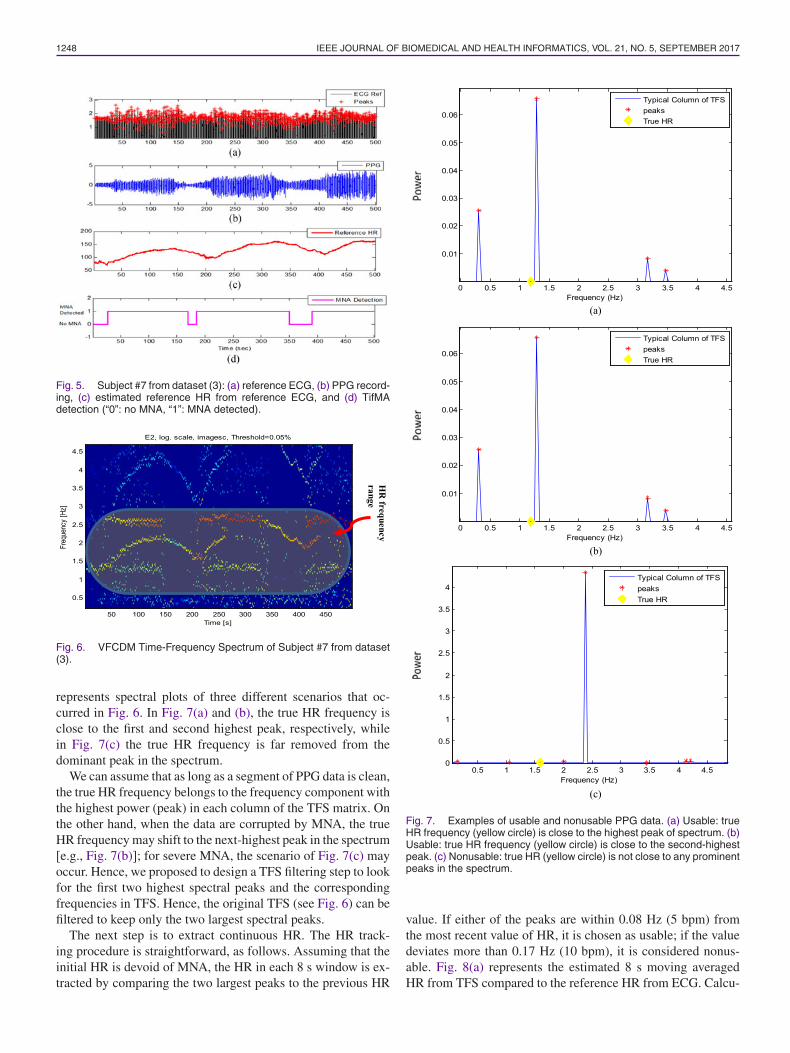
In Fig. 1, we show that when the PPG signal is corrupt, theHR trace and its harmonics in TFS also exhibit distortion, butthe amount of distortion is not uniform. For example, the sever-ity of MNA has a direct correspondence to the accuracy of theHR estimates. Thus, a proper way to determine if a corruptedsignal is usable or not for accurate HR estimation is to extractthe tracing of HR values from TFS and analyze the HR timeseries for missing values and the presence of abrupt changesin HR estimation, as these events often result in unusable data.In order to examine this idea, a dataset with slow and rapidlychanging HR scenarios was analyzed. The data were recordedfrom subjects while walking, jogging, and running on a tread-mill. Fig. 5 illustrates a 7.5 min segment (0.5 min rest, 2 minwalking (3 m/h), 1 min rest, 2 min jogging (5 m/h), 1 min rest,1 min running (7 m/h)) from the 9 min recording of a representa-tive subject. Fig. 5(a) and (b) shows the recordings from a Holtermonitor and concomitant PPG recording, respectively. The ref-erence HR extracted from ECG data is shown in Fig. 5(c). It canbe observed from the reference HR [see Fig. 5(c)] that HR variesfrom low to high values ranging from 80 to 160 bpm. Fig. 5(d)shows MNA detection results using the first phase of our algo-rithm. Fig. 6 represents the VFCDM-TFS of the correspondingPPG data in Fig. 5(b). One can identify the tracing of HR inTFS which begins to show distortion during the time stampsof 260–340 s and 440–500 s. By applying the MNA detectionprocedure of TifMA, we can observe that motion-related dataare truly marked as MNA-corrupted segments. The next step isto investigate if any portion of these MNA-corrupted segmentsis usable for reliable HR estimation.
The following describes the second phase of the TifMA al-gorithm, which is discrimination between nonusable and usableportions of the data segments identified as corrupted. The usabil-ity detection stage is comprised of three steps: 1) TFS filtering;2) HR tracking and extraction; and 3) UI measurement. Fig. 7
1248 IEEE JOURNAL OF BIOMEDICAL AND HEALTH INFORMATICS, VOL. 21, NO. 5, SEPTEMBER 2017
Fig. 5. Subject #7 from dataset (3): (a) reference ECG, (b) PPG record-ing, (c) estimated reference HR from reference ECG, and (d) TifMAdetection (“0”: no MNA, “1”: MNA detected).
Fig. 6. VFCDM Time-Frequency Spectrum of Subject #7 from dataset(3).
represents spectral plots of three different scenarios that oc-curred in Fig. 6. In Fig. 7(a) and (b), the true HR frequency isclose to the first and second highest peak, respectively, whilein Fig. 7(c) the true HR frequency is far removed from thedominant peak in the spectrum.
We can assume that as long as a segment of PPG data is clean,the true HR frequency belongs to the frequency component withthe highest power (peak) in each column of the TFS matrix. Onthe other hand, when the data are corrupted by MNA, the trueHR frequency may shift to the next-highest peak in the spectrum[e.g., Fig. 7(b)]; for severe MNA, the scenario of Fig. 7(c) mayoccur. Hence, we proposed to design a TFS filtering step to lookfor the first two highest spectral peaks and the correspondingfrequencies in TFS. Hence, the original TFS (see Fig. 6) can befiltered to keep only the two largest spectral peaks.
The next step is to extract continuous HR. The HR track-ing procedure is straightforward, as follows. Assuming that theinitial HR is devoid of MNA, the HR in each 8 s window is ex-tracted by comparing the two largest peaks to the previous HR
Fig. 7. Examples of usable and nonusable PPG data. (a) Usable: trueHR frequency (yellow circle) is close to the highest peak of spectrum. (b)Usable: true HR frequency (yellow circle) is close to the second-highestpeak. (c) Nonusable: true HR (yellow circle) is not close to any prominentpeaks in the spectrum.
value. If either of the peaks are within 0.08 Hz (5 bpm) fromthe most recent value of HR, it is chosen as usable; if the valuedeviates more than 0.17 Hz (10 bpm), it is considered nonus-able. Fig. 8(a) represents the estimated 8 s moving averagedHR from TFS compared to the reference HR from ECG. Calcu-

DAO et al.: ROBUST MOTION ARTIFACT DETECTION ALGORITHM FOR ACCURATE DETECTION OF HR FROM PHOTOPLETHYSMOGRAPHIC 1249
Fig. 8. Reference UI. (a) Comparison of TifMA-estimated HR to refer-ence HR from ECG. (b) Reference UI as an indicator of the fidelity of HRestimate from TFS during motion. (c) TifMA MNA detection result. (d)TifMA usability detection, “0” indicates no MNA and “1” indicates MNAdetected.
lation of the reference UI (useable if within 5 bpm, otherwisenot usable) is performed according to the deviation of TifMA-estimated HR from the true reference HR [see Fig. 8(a) and (b)].Fig. 8(c) shows the results of MNA detection, the first phase ofthe algorithm. It can be observed from this figure that segmentsof PPG recordings during movement (walking/jogging/running)have been mostly detected as being corrupted by MNA. Fig. 8(d)shows the UI derived by the second phase of TifMA. One can ob-serve by comparing the reference UI [see Fig. 8(b)] and TifMA’sUI [see Fig. 8(d)] that TifMA detects the usable/nonusable por-tions of the data for HR estimations quite well. More impor-tantly, we observe that significant portions of the corrupted data[see Fig. 8(c)], as identified according to the first phase of ouralgorithm, are found to be usable as shown in Fig. 8(d). Theaccuracy, specificity, and sensitivity of the proposed algorithmon all ten of the recordings from dataset #5 are presented in thefollowing section.
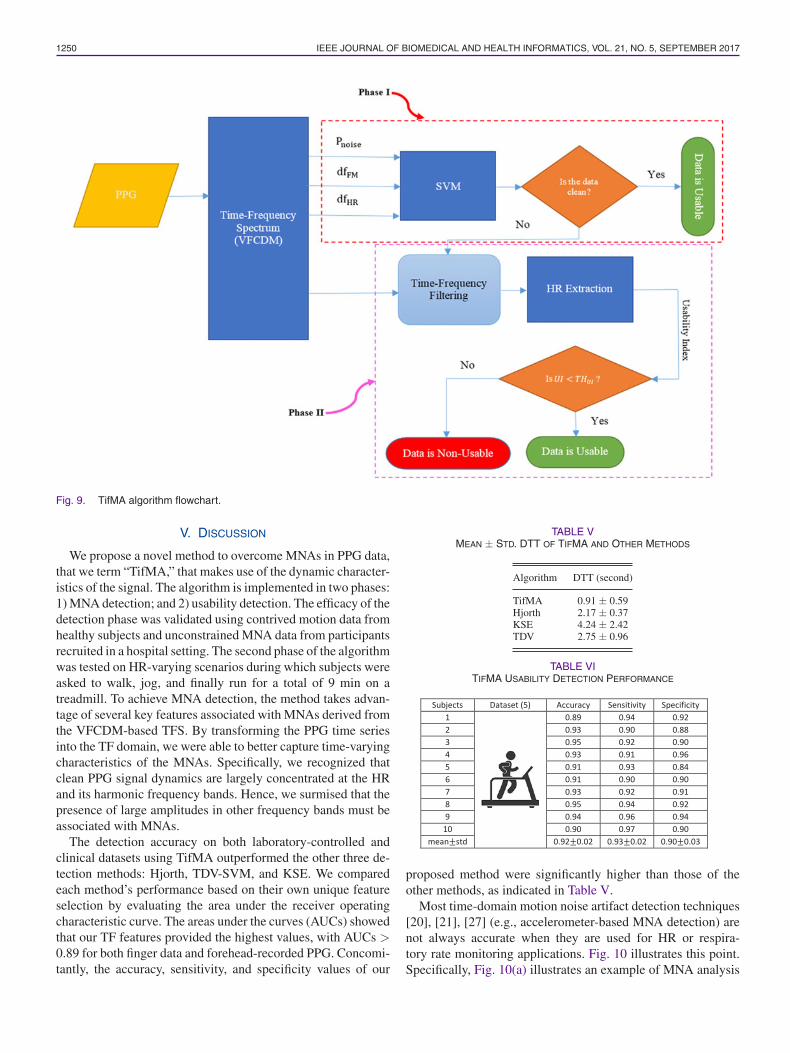
The overall TifMA algorithm flowchart is depicted in Fig. 9.
IV. RESULTS
We evaluated the performance of the TifMA algorithm on fivedatasets. The first four datasets (laboratory controlled, and hos-pital patients with motion-corrupted PPGs) were used to mea-sure the performance of the first phase of the algorithm (MNAdetection) and the fifth (treadmill experiment) was used to eval-uate the second phase of the algorithm (usability detection).
A. MNA Detection Results
Leave-one-out cross validation was adopted to evaluate theperformance of the MNA detection phase [33].
In addition to accurate MNA detection, the other attractivefeature of our proposed algorithm is that it is able to accuratelylocate the start and end points of MNA occurrences. Accu-rate detection of the start and end times of the MNA-corruptedsegments is important for the subsequent reconstruction of theMNA-corrupted data as we do not want to miss the MNA por-tion of data for reconstruction or avoid having to reconstruct thenoisy portion of the PPG when the segment is designated to beclean.
To evaluate the algorithm’s effectiveness in pinpointing thestart and end times of the MNAs, we computed the time differ-ence of start and end points between the visual reference anddetection algorithm’s results. The time difference is termed de-tection transition time, DTT, which reflects how accurately onaverage an MNA algorithm detects the start and end times ofthe MNAs. Table V provides a comparison DTT values fromthe TifMA algorithm and from other detection algorithms. Asshown in Table V, our algorithm’s detection accuracy of the du-ration of the MNAs is significantly better than the accuracy ofthe three other methods we compared. Our algorithm’s DTT isless than 1 s off whereas the second best algorithm, the Hjorth,is off by more than 2 s and the least accurate method, the KSE,is off by more than 4 s.
B. Usability Detection Results
By applying the first phase of the TifMA algorithm, weshowed that the algorithm is able to determine if a PPG datasegment is clean or is corrupted with MNA. However, beingcorrupted by movement does not necessarily suggest that theentire noisy data segment is nonusable in terms of HR estima-tion. It was shown that HR frequency changes can be trackedusing VFCDM TF plot as long as the signal is usable and thelevel of motion corruption is not too severe.
Nonusable data can usually be attributed to abrupt or fastmovements that make tracking of frequency especially difficult.To this end, the second phase of the algorithm was tested onPPG recordings from ten subjects who performed a 9 min ex-periment, during which they walked, jogged, and ran. The datainitially were fed into the MNA detection algorithm and whena corrupted data segment was obtained, the second phase ofthe algorithm performed usability determination of data, thatis whether the corrupted signal is usable or not for HR esti-mation. Table VI presents the accuracy, sensitivity, and speci-ficity of the usability detection calculated by comparing to thereference UI.
As can be seen from Table VII, TifMA initially identified48% of the data corrupted by MNA as nonusable HR data,but after the second phase of our algorithm, only 10% of PPGrecordings during the treadmill experiment were determined tobe so severely corrupted that they could not be used for reliableHR estimation.
1250 IEEE JOURNAL OF BIOMEDICAL AND HEALTH INFORMATICS, VOL. 21, NO. 5, SEPTEMBER 2017
Fig. 9. TifMA algorithm flowchart.
V. DISCUSSION
We propose a novel method to overcome MNAs in PPG data,that we term “TifMA,” that makes use of the dynamic character-istics of the signal. The algorithm is implemented in two phases:1) MNA detection; and 2) usability detection. The efficacy of thedetection phase was validated using contrived motion data fromhealthy subjects and unconstrained MNA data from participantsrecruited in a hospital setting. The second phase of the algorithmwas tested on HR-varying scenarios during which subjects wereasked to walk, jog, and finally run for a total of 9 min on atreadmill. To achieve MNA detection, the method takes advan-tage of several key features associated with MNAs derived fromthe VFCDM-based TFS. By transforming the PPG time seriesinto the TF domain, we were able to better capture time-varyingcharacteristics of the MNAs. Specifically, we recognized thatclean PPG signal dynamics are largely concentrated at the HRand its harmonic frequency bands. Hence, we surmised that thepresence of large amplitudes in other frequency bands must beassociated with MNAs.
The detection accuracy on both laboratory-controlled andclinical datasets using TifMA outperformed the other three de-tection methods: Hjorth, TDV-SVM, and KSE. We comparedeach method’s performance based on their own unique featureselection by evaluating the area under the receiver operatingcharacteristic curve. The areas under the curves (AUCs) showedthat our TF features provided the highest values, with AUCs >0.89 for both finger data and forehead-recorded PPG. Concomi-tantly, the accuracy, sensitivity, and specificity values of our
TABLE VMEAN ± STD. DTT OF TIFMA AND OTHER METHODS
Algorithm DTT (second)
TifMA 0.91 ± 0.59Hjorth 2.17 ± 0.37KSE 4.24 ± 2.42TDV 2.75 ± 0.96
TABLE VITIFMA USABILITY DETECTION PERFORMANCE
proposed method were significantly higher than those of theother methods, as indicated in Table V.
Most time-domain motion noise artifact detection techniques[20], [21], [27] (e.g., accelerometer-based MNA detection) arenot always accurate when they are used for HR or respira-tory rate monitoring applications. Fig. 10 illustrates this point.Specifically, Fig. 10(a) illustrates an example of MNA analysis
DAO et al.: ROBUST MOTION ARTIFACT DETECTION ALGORITHM FOR ACCURATE DETECTION OF HR FROM PHOTOPLETHYSMOGRAPHIC 1251
TABLE VII(CONTINUED) TIFMA USABILITY DETECTION PERFORMANCE
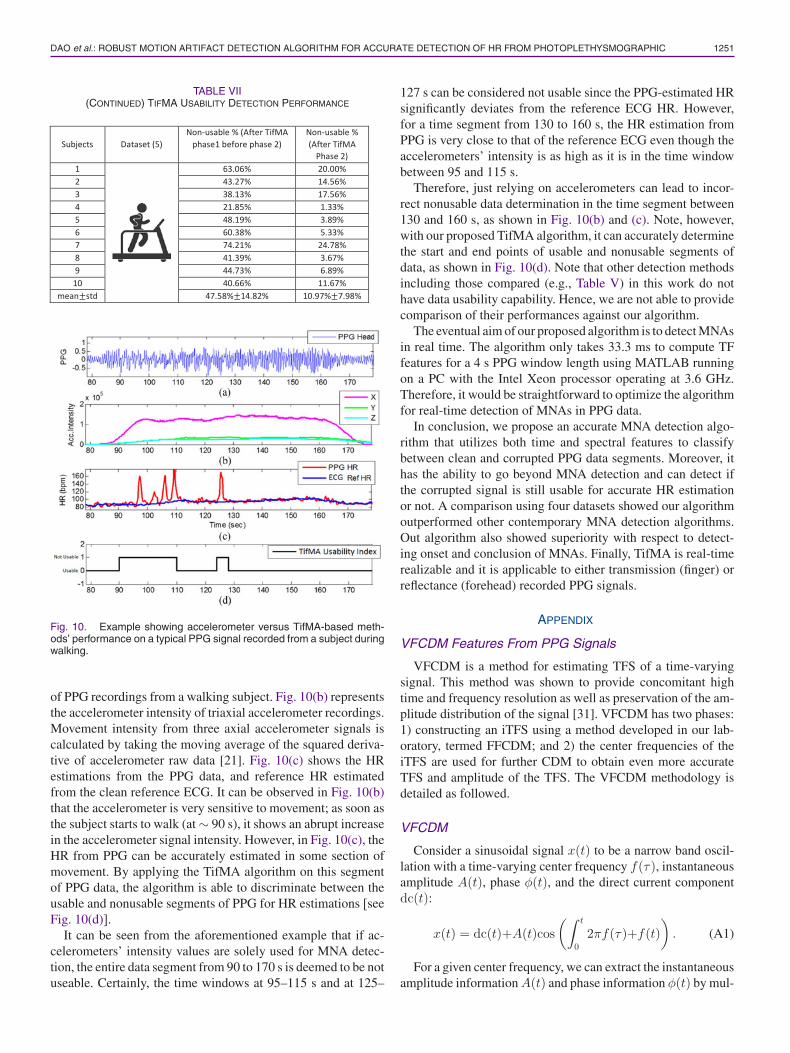
Fig. 10. Example showing accelerometer versus TifMA-based meth-ods’ performance on a typical PPG signal recorded from a subject duringwalking.
of PPG recordings from a walking subject. Fig. 10(b) representsthe accelerometer intensity of triaxial accelerometer recordings.Movement intensity from three axial accelerometer signals iscalculated by taking the moving average of the squared deriva-tive of accelerometer raw data [21]. Fig. 10(c) shows the HRestimations from the PPG data, and reference HR estimatedfrom the clean reference ECG. It can be observed in Fig. 10(b)that the accelerometer is very sensitive to movement; as soon asthe subject starts to walk (at ∼ 90 s), it shows an abrupt increasein the accelerometer signal intensity. However, in Fig. 10(c), theHR from PPG can be accurately estimated in some section ofmovement. By applying the TifMA algorithm on this segmentof PPG data, the algorithm is able to discriminate between theusable and nonusable segments of PPG for HR estimations [seeFig. 10(d)].
It can be seen from the aforementioned example that if ac-celerometers’ intensity values are solely used for MNA detec-tion, the entire data segment from 90 to 170 s is deemed to be notuseable. Certainly, the time windows at 95–115 s and at 125–
127 s can be considered not usable since the PPG-estimated HRsignificantly deviates from the reference ECG HR. However,for a time segment from 130 to 160 s, the HR estimation fromPPG is very close to that of the reference ECG even though theaccelerometers’ intensity is as high as it is in the time windowbetween 95 and 115 s.
Therefore, just relying on accelerometers can lead to incor-rect nonusable data determination in the time segment between130 and 160 s, as shown in Fig. 10(b) and (c). Note, however,with our proposed TifMA algorithm, it can accurately determinethe start and end points of usable and nonusable segments ofdata, as shown in Fig. 10(d). Note that other detection methodsincluding those compared (e.g., Table V) in this work do nothave data usability capability. Hence, we are not able to providecomparison of their performances against our algorithm.
The eventual aim of our proposed algorithm is to detect MNAsin real time. The algorithm only takes 33.3 ms to compute TFfeatures for a 4 s PPG window length using MATLAB runningon a PC with the Intel Xeon processor operating at 3.6 GHz.Therefore, it would be straightforward to optimize the algorithmfor real-time detection of MNAs in PPG data.
In conclusion, we propose an accurate MNA detection algo-rithm that utilizes both time and spectral features to classifybetween clean and corrupted PPG data segments. Moreover, ithas the ability to go beyond MNA detection and can detect ifthe corrupted signal is still usable for accurate HR estimationor not. A comparison using four datasets showed our algorithmoutperformed other contemporary MNA detection algorithms.Out algorithm also showed superiority with respect to detect-ing onset and conclusion of MNAs. Finally, TifMA is real-timerealizable and it is applicable to either transmission (finger) orreflectance (forehead) recorded PPG signals.
APPENDIX
VFCDM Features From PPG Signals
VFCDM is a method for estimating TFS of a time-varyingsignal. This method was shown to provide concomitant hightime and frequency resolution as well as preservation of the am-plitude distribution of the signal [31]. VFCDM has two phases:1) constructing an iTFS using a method developed in our lab-oratory, termed FFCDM; and 2) the center frequencies of theiTFS are used for further CDM to obtain even more accurateTFS and amplitude of the TFS. The VFCDM methodology isdetailed as followed.
VFCDM
Consider a sinusoidal signal x(t) to be a narrow band oscil-lation with a time-varying center frequency f(τ), instantaneousamplitude A(t), phase φ(t), and the direct current componentdc(t):
x(t) = dc(t)+A(t)cos(∫ t
02πf(τ)+f(t)
). (A1)
For a given center frequency, we can extract the instantaneousamplitude information A(t) and phase information φ(t) by mul-
1252 IEEE JOURNAL OF BIOMEDICAL AND HEALTH INFORMATICS, VOL. 21, NO. 5, SEPTEMBER 2017
tiplying (1) by e−∫ t
0 2πf (τ )dτ which results in the following:
z(t) = x(t)e−j∫ t
0 2πf (τ )dτ
= dc(t)e−j∫ t
0 2π f (τ )dτ +A(t)
2ejf(t)
+A(t)
2e−j(
∫ t0 4πf (τ )+f (t)). (A2)
From (2), if z(t) is filtered with an ideal low-pass filter (LPF)with a cutoff frequency fc < f0 , where f0 is the center fre-quency of interest. Then, the filtered signal zlp(t) will containonly the component of interest:
zlp(t) =A(t)
2ejf (t) . (A3-A)
The instantaneous frequency is given by
f(t) = f0+12π
df(t)dt
. (A3-B)
By changing the center frequency followed by using the vari-able frequency approach as well as the LPF, the signal, x(t),will be decomposed into the sinusoid modulations, di , by theCDM technique as follows:
x(t) =∑
i
di
= dc(t) +∑
i
Ai(t)cos(∫ t
02πfi(τ)dτ+fi(t)
). (A4)
The instantaneous frequency and amplitude of di can be cal-culated using the Hilbert transform
A(t) = 2|zlp(t)| =[X2(t)+ Y 2(t)
]1/2
X(t) = real (zlp(t)) (A5-A)
Y (t) = imag (zlp(t)) = H [X(t)] =1π
∫X (t′)t − t′
dt′
φ(t) = arctan(
imag (zlp(t))real (zlp(t))
)= arctan
(Y (t)X(t)
). (A5-B)
FFCDM operates by performing CDM on fixed frequency f0within confined bandwidth and repeat it over entire frequencyband. In order to obtain even higher resolution TFS, centerfrequencies in iTFS obtained from FFCDM were used for sub-sequent CDM with finer bandwidth.
REFERENCES
[1] S. Dash, K. H. Chon, S. Lu, and E. A. Raeder, “Automatic real timedetection of atrial fibrillation,” Ann. Biomed. Eng., vol. 37, no. 9, pp. 1701–1709, Sep. 2009.
[2] L. P. Antonsen and K. A. Kirkebøen, “Evaluation of fluid responsiveness:Is photoplethysmography a noninvasive alternative?” Anesthesiol. Res.Pract., vol. 2012, 2012, Art. no. 617380.
[3] F. Camacho, “Statistical analysis of central aortic blood pressure parame-ters derived from the peripheral pulse,” Ph.D. dissertation, Biomed. Eng.,Univ. New South Wales, Sydney, NSW, Australia, 2005.
[4] M. T. Petterson, V. L. Begnoche, and J. M. Graybeal, “The effect of motionon pulse oximetry and its clinical significance,” Anesthesia Analgesia,vol. 105, no. 6 Suppl, pp. S78–S84, Dec. 2007.
[5] R. Sahni, A. Gupta, K. Ohira-Kist, and T. Rosen, “Motion resistant pulseoximetry in neonates,” Arch. Dis. Childhood Fetal Neonatal Ed., vol. 88,no. 6, pp. F505–F508, Nov. 2003.
[6] M. R. Ram, K. V. Madhav, E. H. Krishna, N. R. Komalla, and K. A.Reddy, “A novel approach for motion artifact reduction in PPG signalsbased on AS-LMS adaptive filter,” IEEE Trans. Instrum. Meas., vol. 61,no. 5, pp. 1445–1457, May 2012.
[7] T. L. Rusch, R. Sankar, and J. E. Scharf, “Signal processing methodsfor pulse oximetry,” Comput. Biol. Med., vol. 26, no. 2, pp. 143–159,Mar. 1996.
[8] R. Hong Enrıquez, M. Sautie Castellanos, J. Falcon Rodrıguez, and J. L.Hernandez Caceres, “Analysis of the photoplethysmographic signal bymeans of the decomposition in principal components,” Physiol. Meas.,vol. 23, no. 3, pp. N17–N29, Aug. 2002.
[9] S. M. A. Salehizadeh et al., “Photoplethysmograph signal reconstructionbased on a novel hybrid motion artifact detection-reduction approach. PartII: Motion and noise artifact detection,” Ann. Biomed. Eng., vol. 42, no. 11,pp. 2251–2263, Nov. 2014.
[10] Y. Yan, C. C. Poon, and Y. Zhang, “Reduction of motion artifact in pulseoximetry by smoothed pseudo Wigner-Ville distribution,” J. Neuroeng.Rehabil., vol. 2, pp. 1–9, Mar. 2005.
[11] J. Lee, W. Jung, I. Kang, Y. Kim, and G. Lee, “Design of filter to rejectmotion artifact of pulse oximetry,” Comput. Stand. Interfaces, vol. 26,no. 3, pp. 241–249, May 2004.
[12] K. V. P. Naraharisetti, M. Bawa, and M. Tahernezhadi, “Comparison ofdifferent signal processing methods for reducing artifacts from photo-plethysmograph signal,” in Proc. 2011 IEEE Int. Conf. Electro/Inf. Tech-nol., 2011, pp. 1–8.
[13] M. R. Ram, K. V. Madhav, E. H. Krishna, K. N. Reddy, and K. A.Reddy, “Computation of SpO2 using non-parametric spectral estimationmethods from wavelet based motion artifact reduced PPG signals,” inProc. 2011 Int. Conf. Signal Process. Commun. Comput. Netw. Technol.,2011, pp. 776–780.
[14] R. Krishnan, B. Natarajan, and S. Warren, “Two-stage approach for de-tection and reduction of motion artifacts in photoplethysmographic data,”IEEE Trans. Biomed. Eng., vol. 57, no. 8, pp. 1867–1876,Aug. 2010.
[15] J. A. Sukor, S. J. Redmond, and N. H. Lovell, “Signal quality measures forpulse oximetry through waveform morphology analysis,” Physiol. Meas.,vol. 32, no. 3, pp. 369–384, Mar. 2011.
[16] K. Li, S. Warren, and B. Natarajan, “Onboard tagging for real-time qualityassessment of photoplethysmograms acquired by a wireless reflectancepulse oximeter,” IEEE Trans. Biomed. Circuits Syst., vol. 6, no. 1, pp. 54–63, Feb. 2012.
[17] Q. Li, R. G. Mark, and G. D. Clifford, “Robust heart rate estimation frommultiple asynchronous noisy sources using signal quality indices and aKalman filter,” Physiol. Meas., vol. 29, no. 1, pp. 15–32, Jan. 2008.
[18] K. Nakajima, T. Tamura, and H. Miike, “Monitoring of heart and respi-ratory rates by photoplethysmography using a digital filtering technique,”Med. Eng. Phys., vol. 18, no. 5, pp. 365–372, Jul. 1996.
[19] W. Karlen, K. Kobayashi, J. M. Ansermino, and G. A. Dumont, “Photo-plethysmogram signal quality estimation using repeated Gaussian filtersand cross-correlation,” Physiol. Meas., vol. 33, no. 10, pp. 1617–1629,Oct. 2012.
[20] B. Lee, J. Han, H. J. Baek, J. H. Shin, K. S. Park, and W. J. Yi, “Improvedelimination of motion artifacts from a photoplethysmographic signal usinga Kalman smoother with simultaneous accelerometry,” Physiol. Meas.,vol. 31, no. 12, pp. 1585–1603, Dec. 2010.
[21] J. Y. A. Foo and S. J. Wilson, “A computational system to optimisenoise rejection in photoplethysmography signals during motion or poorperfusion states,” Med. Biol. Eng. Comput., vol. 44, nos. 1/2, pp. 140–145,Mar. 2006.
[22] R. Krishnan, B. Natarajan, and S. Warren, “Analysis and detection of mo-tion artifact in photoplethysmographic data using higher order statistics,”in Proc. 2008 IEEE Int. Conf. Acoust., Speech, Signal Process., 2008,pp. 613–616.
[23] N. Selvaraj, Y. Mendelson, K. H. Shelley, D. G. Silverman, and K. H.Chon, “Statistical approach for the detection of motion/noise artifacts inphotoplethysmogram,” in Proc. Annu. Int. Conf. IEEE Eng. Med. Biol.Soc., vol. 2011, 2011, pp. 4972–4975.
[24] B. Hjorth, “The physical significance of time domain descriptors in EEGanalysis,” Electroencephalogr. Clin. Neurophysiol., vol. 34, no. 3, pp. 321–325, Mar. 1973.
[25] B. Hjorth, “EEG analysis based on time domain properties,” Elec-troencephalogr. Clin. Neurophysiol., vol. 29, no. 3, pp. 306–310, Sep.1970.

DAO et al.: ROBUST MOTION ARTIFACT DETECTION ALGORITHM FOR ACCURATE DETECTION OF HR FROM PHOTOPLETHYSMOGRAPHIC 1253
[26] E. Gil, J. Marıa Vergara, and P. Laguna, “Detection of decreases in theamplitude fluctuation of pulse photoplethysmography signal as indicationof obstructive sleep apnea syndrome in children,” Biomed. Signal Process.Control, vol. 3, no. 3, pp. 267–277, Jul. 2008.
[27] J. W. Chong et al., “Photoplethysmograph signal reconstruction basedon a novel hybrid motion artifact detection-reduction approach. Part I:Motion and noise artifact detection,” Ann. Biomed. Eng., vol. 42, no. 11,pp. 2238–2250, Nov. 2014.
[28] C. G. Scully et al., “Using time-frequency analysis of the photoplethys-mographic waveform to detect the withdrawal of 900 mL of blood,” Anes-thesia Analgesia, vol. 115, no. 1, pp. 74–81, Jul. 2012.
[29] N. Selvaraj, J. Lee, and K. H. Chon, “Time-varying methods for charac-terizing nonstationary dynamics of physiological systems,” Methods Inf.Med., vol. 49, no. 5, pp. 435–442, 2010.
[30] N. Selvaraj et al., “A novel approach using time-frequency analysis ofpulse-oximeter data to detect progressive hypovolemia in spontaneouslybreathing healthy subjects,” IEEE Trans. Biomed. Eng., vol. 58, no. 8,pp. 2272–2279, Aug. 2011.
[31] H. Wang, K. Siu, K. Ju, and K. H. Chon, “A high resolution approachto estimating time-frequency spectra and their amplitudes,” Ann. Biomed.Eng., vol. 34, no. 2, pp. 326–338, Feb. 2006.
[32] C. Hsu and C. Chang, A Practical Guide to Support Vector Classification.Taipei City, Taiwan: Dept. Comput. Sci., Nat. Taiwan Univ., 2003.
[33] M. Kearns and D. Ron, “Algorithmic stability and sanity-check bounds forleave-one-out cross-validation,” Neural Comput., vol. 11, no. 6, pp. 1427–1453, Aug. 1999.
Authors’ photographs and biographies not available at the time ofpublication.


![3.Biomedical IEEE[1][1]](https://img.pdfslide.us/doc/110x75/5474cde5b4af9f1e268b45df/3biomedical-ieee11.jpg)
