Embed Size (px)
Citation preview

0

1

※
→
※

13.414.5 14.9
15.816.4 16.3 16.5
17.3 17.2 17.717.0 17.4 17.9
20.5 20.5
22.8
25.1
26.9
25.1
26.5
28.0
31.9 31.9
37.5
38.9
40.3
3.7 3.7 2.9
2.7 2.8 2.9 3.1 3.1 3.4 3.2
3.2 3.1
0.6 0.7 0.7
0.7 0.8
1.0 0.8 1.0 1.2 1.2
1.3 1.5
1.7
1.7 1.8
1.9
2.0
1.9
1.7
2.1 2.1
2.0
0.2 0.2 0.2
0.3 0.6 0.9 1.2
1.8 1.3 1.4 1.4 1.6
1.7
1.8 2.1
1.5
1.5
1.7
2.2
2.2
2.0
1.9
1.8
1.6
1.8 1.0
18.0 19.3 18.8
19.7 20.8 21.2
21.7 23.2 23.3 23.6
23.0 23.7
21.4
24.2 24.6
26.3
28.7
30.6
29.1
30.9 32.1
35.9
33.7
39.2
40.8 41.3
38.0
42.2
43.7
52.4
0.0
20.0
40.0
1Q 2Q 3Q 4Q 1Q 2Q 3Q 4Q 1Q 2Q 3Q 4Q 1Q 2Q 3Q 4Q 1Q 2Q 3Q 4Q 1Q 2Q 3Q 4Q 1Q 2Q 3Q 4Q 1Q 2Q
FY2007 FY2008 FY2009 FY2010 FY2011 FY2012 FY2013 FY2014
(Unit: billion yen)
Quarterly Consolidated Sales
Sales of FX business
Sales of VOYAGE GROUP, Inc.
Sales of netprice.com, Ltd.
Sale under the current conditions
※※※※※※

1
※
0.6 0.9
1.6
3.1
4.3
7.3
9.5
15.9
20.1
22.5 22.6
26.3
28.0
36.1
2.2%3.2%
5.7%
10.3%
13.6%
20.5%
28.2%
40.7%
49.2%
54.5%
59.4%
62.3%64.1%
68.9%
0%
20%
40%
60%
0.0
20.0
1Q 2Q 3Q 4Q 1Q 2Q 3Q 4Q 1Q 2Q 3Q 4Q 1Q 2Q
FY2011 FY2012 FY2013 FY2014
(Unit: billion yen)
Quarterly Sales from Smartphone
Sales from smartphone
Smartphone ratio
1
※
0.40 0.570.11
0.621.08
1.46 1.431.77 1.88
1.53
0.38
-0.34
-3.06
-1.49
-2.64
-1.04
0.03
1.350.43
0.59
0.46
0.77
0.98
0.86
0.30
0.27
0.92
2.17
1.25
0.660.97
2.17
2.822.48
2.15
2.46
0.48
0.94
0.80
0.65
1.13
1.20
0.86
0.88
1.34
1.92
1.47
2.09
2.06
2.25
1.782.18
2.03
2.93
1.00
1.05
1.20
0.58
0.53
0.64
0.99
1.02
1.09
0.90
0.95
0.69
1.07
0.61
-0.06 -0.17 -0.06 -0.06 -0.06
0.05
-0.07 -0.16 -0.07 -0.07
0.02
-0.10
0.62
0.10
-0.05
0.02
0.05
-0.16
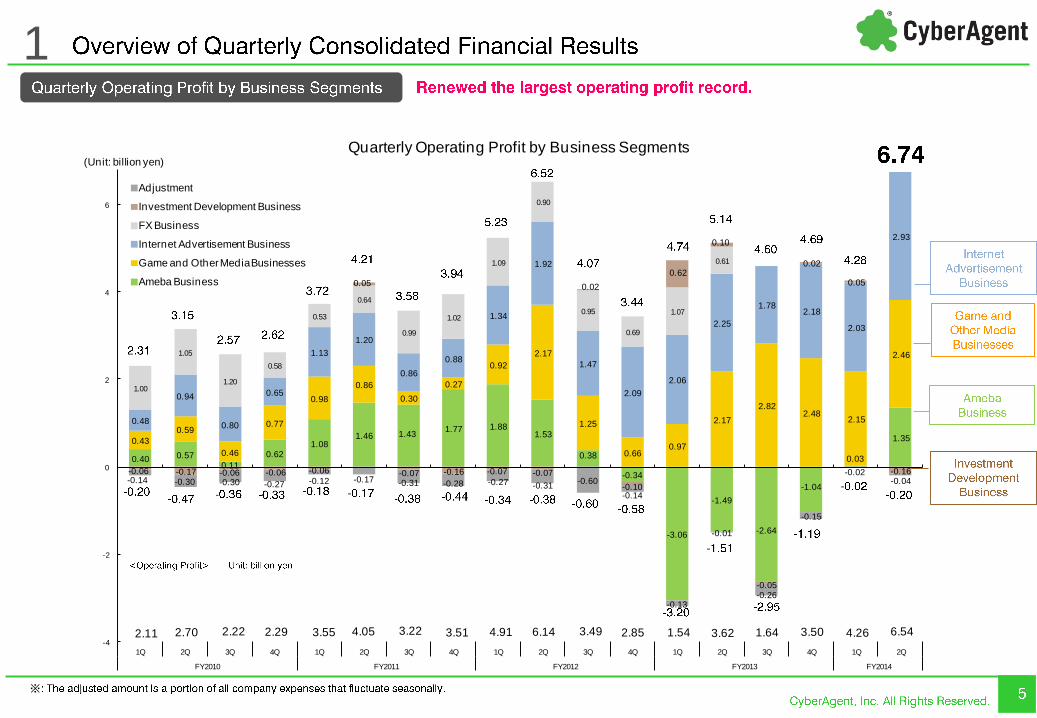
2.11 2.70 2.22 2.29 3.55 4.05 3.22 3.51 4.91 6.14 3.49 2.85 1.54 3.62 1.64 3.50 4.26 6.54
-0.14 -0.30 -0.30 -0.27 -0.12 -0.17 -0.31 -0.28 -0.27 -0.31-0.60
-0.14
-0.13
-0.01
-0.26
-0.15
-0.02-0.04
-4
-2
0
2
4
6
1Q 2Q 3Q 4Q 1Q 2Q 3Q 4Q 1Q 2Q 3Q 4Q 1Q 2Q 3Q 4Q 1Q 2Q
FY2010 FY2011 FY2012 FY2013 FY2014
(Unit: billion yen)
Quarterly Operating Profit by Business Segments
Adjustment
Investment Development Business
FX Business
Internet Advertisement Business
Game and Other Media Businesses
Ameba Business

1
※
186 188 229 229 231 236 282 298 295 306407 438
658765
956 976 993 1,0021,142 1,098 1,058 1,026
586 574630 622 594 577
621 623 632 671
732 676
504
497
572 582 598 587
660668 726 777
616 638
648 638 639529
540 536 538563
612 610621
636
778804 801 767
828 858905 920
14 13
12 12 12
12
13 16 1818
1920
22
23
2524 27
22
30 3033
32
64 68
74 74 75
74
70 71 7172
6562
70
72
9293
92111
117 110103 107
1,466 1,481
1,593 1,575 1,551
1,428
1,526 1,544 1,5541,630
1,835 1,8061,875
1,993
2,4232,479 2,511
2,489
2,777 2,7642,825
2,862
0
1,000
2,000
1Q 2Q 3Q 4Q 1Q 2Q 3Q 4Q 1Q 2Q 3Q 4Q 1Q 2Q 3Q 4Q 1Q 2Q 3Q 4Q 1Q 2Q
FY2009 FY2010 FY2011 FY2012 FY2013 FY2014
(Unit: person) Quarterly Number of Employees in Consolidated Company
Headquarters (management)
Investment development
Game/Other media
Internet ad business
Ameba

1
1.15 0.93 0.99 0.89 0.70 0.68 1.42
1.01 1.29 1.26 1.72 1.48 1.24
1.72 1.86 2.17
4.35
2.40 2.96
1.75 2.25
2.85
3.41 3.31 3.40 3.47
3.03 3.09
3.20
3.19 3.33 3.36
3.71 3.51 3.72
4.01 3.99 3.68
3.75
3.66
3.87
3.83
3.94
4.36 0.66 0.64
0.69 0.67
0.30 0.31
0.35 0.47
0.54 0.59
0.58 0.70 0.84
1.11 1.21
1.74
1.76
1.76
1.53
1.51
1.06
1.20
0.65 0.70
0.69 0.70
0.56 0.46
0.38 0.41
0.40 0.43
0.46 0.51 0.54
0.60 0.64
0.79
0.82
0.87
0.87
0.86 0.92
0.90
0.09 0.09
0.08 0.07
0.07 0.08
0.07 0.07
0.08 0.07
0.07 0.08 0.08
0.09 0.09
0.10
0.09
0.10
0.10
0.11 0.10
0.10
1.39 1.47
1.43 1.39
1.18 1.45
1.24 1.46
1.34 1.49
1.50 1.80 1.66
1.99
2.43
2.48
2.53
2.25
2.30
2.33
2.41
2.41
0.86
1.03
0.51
0.79
7.387.16 7.30 7.22
5.856.09
6.68
7.50
7.017.22
8.07
9.15
8.11
9.53
10.25
11.50
13.34
11.06
11.6511.19
10.71
11.84
0.00
5.00
10.00
1Q 2Q 3Q 4Q 1Q 2Q 3Q 4Q 1Q 2Q 3Q 4Q 1Q 2Q 3Q 4Q 1Q 2Q 3Q 4Q 1Q 2Q
FY2009 FY2010 FY2011 FY2012 FY2013 FY2014
(Unit: billion yen) Quarterly SG&A Expenses
Earnings Incentives
Others
Consolidated adjustment
Office costs
Sales related costs
Personnel
Advertisement costs

Change from the
previous quarter
+ +
1
※

1

2

3.26.3
10.8
16.2
26.7
43.2
60.1
76.0
87.0
93.896.6
119.5
141.1
162.4
180.0
1.7
2.6
4.3
5.5
4.6 4.4
9.3
14.3
17.4
10.3
20.0
0.0
10.0
20.0
0.0
90.0
180.0
FY2000 FY2001 FY2002 FY2003 FY2004 FY2005 FY2006 FY2007 FY2008 FY2009 FY2010 FY2011 FY2012 FY2013 FY2014
Sales Operating profit

0% 50% 100%
Current net prof it
Ordinary prof it
Operating prof it
Net sales
Progress Rate with Respect to the Forecast for FY2014
Progress rate Forecast
2
Unit: yen Dividend per share Dividend increase rate
(from the previous term) Total dividend
Estimated dividend for FY2014 2.4 billion yen
Dividend for FY2013 2.1 billion yen
Dividend for FY2012 2.2 billion yen
※Trading unit was changed to 100 shares on Oct. 1, 2013.
The past dividends were expressed in accordance with the above standard.

3 Internet Advertisement Business
Internet Advertisement Business
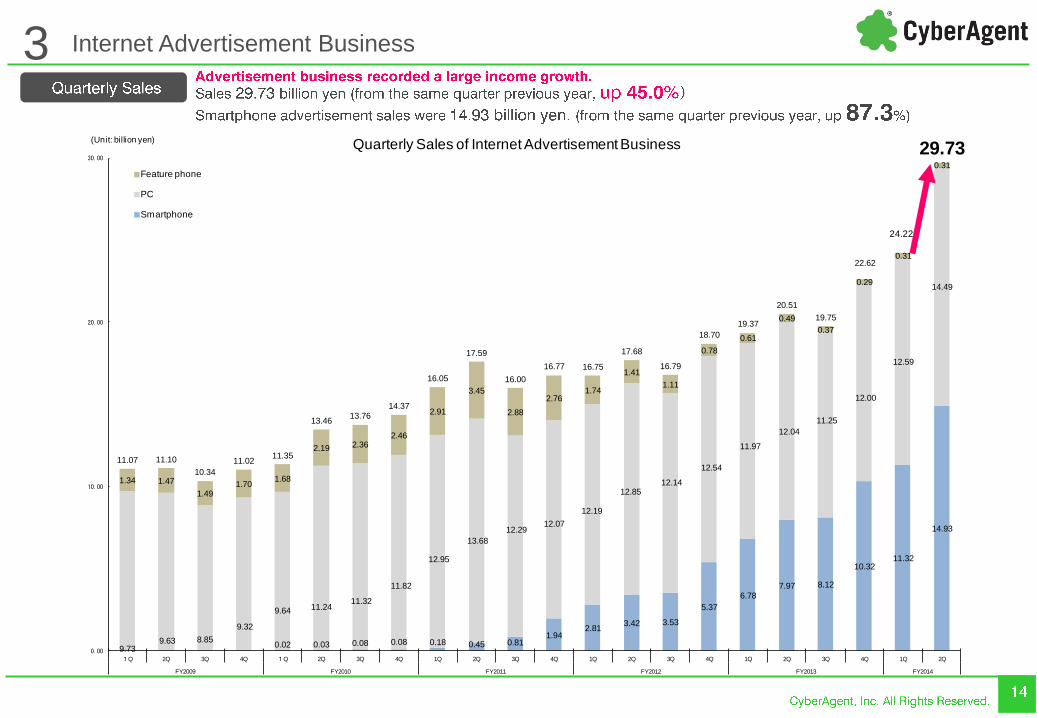
0.02 0.03 0.08 0.08 0.18 0.45 0.811.94
2.813.42 3.53
5.37
6.787.97 8.12
10.3211.32
14.93
9.739.63 8.85
9.32
9.64 11.2411.32
11.82
12.95
13.68
12.2912.07
12.19
12.8512.14
12.54
11.97
12.04
11.25
12.00
12.59
14.49
1.34 1.47
1.491.70
1.68
2.19 2.362.46
2.91
3.45
2.88
2.761.74
1.41
1.11
0.78
0.61
0.49
0.37
0.29
0.31
0.31
11.07 11.10
10.34
11.0211.35
13.4613.76
14.37
16.05
17.59
16.00
16.77 16.75
17.68
16.79
18.70
19.37
20.51
19.75
22.62
24.22
29.73
0.00
10.00
20.00
30.00
1Q 2Q 3Q 4Q 1Q 2Q 3Q 4Q 1Q 2Q 3Q 4Q 1Q 2Q 3Q 4Q 1Q 2Q 3Q 4Q 1Q 2Q
FY2009 FY2010 FY2011 FY2012 FY2013 FY2014
(Unit: billion yen) Quarterly Sales of Internet Advertisement Business
Feature phone
PC
Smartphone
Internet Advertisement Business 3

Internet Advertisement Business 3
0.48
0.94
0.80
0.65
1.131.20
0.86 0.88
1.34
1.92
1.47
2.092.06
2.25
1.78
2.18
2.03
2.93
4.2%
7.0%
5.9%
4.6%
7.0%
6.9%
5.4% 5.3%
8.0%
10.9%
8.8%
11.2%
10.6%11.0%
9.0% 9.7%8.4%
9.9%
0.0%
10.0%
20.0%
0.00
1.00
2.00
3.00
1Q 2Q 3Q 4Q 1Q 2Q 3Q 4Q 1Q 2Q 3Q 4Q 1Q 2Q 3Q 4Q 1Q 2Q
FY2010 FY2011 FY2012 FY2013 FY2014
(Unit: billion yen) Quarterly Operating Profit of Internet Advertisement Business
Operating profit
Operating profit margin

Internet Advertisement Business 3
0.8
1.1 1.2 1.4 1.5
1.8 1.6
1.8 1.9
2.3
0.3
0.5 0.5
0.6
0.7
0.6
0.6
0.6
0.7
1.1
0.3
0.30.4
0.5
0.9
1.1
0.9
1.0
1.3
1.6
0.03
0.05
0.04
0.06
0.05
0.05
0.05
0.05
0.05
0.05
1.5
2.1
2.3
2.7
3.3
3.7
3.3
3.6
4.0
5.1
0.0
2.0
4.0
1Q 2Q 3Q 4Q 1Q 2Q 3Q 4Q 1Q 2Q
2,012 2013 2014
(Unit: billion yen) Quarterly Adtech related sales
Advertising ef fect measurement tool
Reward Advertisement
Ad network
RTB

Internet Advertisement Business
※※※
3
※※※※※※
※※※

4

0.04 0.08 0.15 0.320.56
0.64 0.821.16
1.71
2.22
2.50
3.16
3.75
4.12 3.76
3.84
3.95
4.624.64
5.60
5.37
6.82
0.570.65 0.68
0.80
1.021.15
1.10
1.40
1.78
1.79
1.87
2.34
2.32
2.49
2.44
2.68
2.14
2.012.12
2.442.61
3.34
0.620.73 0.83
1.12
1.591.80
1.92
2.56
3.49
4.02
4.37
5.50
6.07
6.61
6.21
6.52
6.55
6.987.04
8.237.98
10.16
-
3
6
9
1Q 2Q 3Q 4Q 1Q 2Q 3Q 4Q 1Q 2Q 3Q 4Q 1Q 2Q 3Q 4Q 1Q 2Q 3Q 4Q 1Q 2Q
FY2009 FY2010 FY2011 FY2012 FY2013 FY2014
(Unit: billion yen)
Quarterly Sales of Ameba Business
Advertisement fee, etc.
Virtual content sales
4

4
-3.0
-1.4
-2.6
-1.0
0.034
1.35
-3.0
-1.0
1.0
1Q 2Q 3Q 4Q 1Q 2Q
FY2013 FY2014
Quarterly Operating Profit of Ameba Business (Unit: billion yen)

0.2 0.2 0.3 0.4 0.6 0.7 0.7 0.9
1.1 1.4
1.7 1.8
2.3 2.5 2.9
3.7 3.9
5.1
5.6
6.3
6.9
7.6
8.1
8.8 8.8 8.9
9.9
10.7 10.6
11.9 11.4
12.3 12.2 12.0 12.4
12.9 13.0
12.4
13.4
15.4
15.0
16.7
0.0
5.0
10.0
15.0
Oct Nov Dec Jan Feb Mar Apr May Jun Jul Aug Sep Oct Nov Dec Jan Feb Mar Apr May Jun Jul Aug Sep Oct Nov Dec Jan Feb Mar Apr May Jun Jul Aug Sep Oct Nov Dec Jan Feb Mar
FY2011 FY2012 FY2013 FY2014
(Unit: billion PV) Monthly page views of “Ameba”
4

0.570.65
0.68
0.80
1.02
1.151.10
1.40
1.78 1.79
1.87
2.34 2.32
2.492.44
2.68
2.14
2.01
2.12
2.44
2.61
3.34
0.0
1.5
3.0
1Q 2Q 3Q 4Q 1Q 2Q 3Q 4Q 1Q 2Q 3Q 4Q 1Q 2Q 3Q 4Q 1Q 2Q 3Q 4Q 1Q 2Q
FY2009 FY2010 FY2011 FY2012 FY2013 FY2014
(Unit: billion yen)Quarterly Sales of Advertising Business
4

2.42 2.36
2.90
3.43
3.13
3.97
2.00
3.00
4.00
Oct Nov Dec Jan Feb Mar
Smartphone Monthly Coin Spent Amount
Smartphone
4
0.06 0.25 0.40 0.66
1.45
4.24
5.78
8.19 7.68
10.54
0.008 0.02 0.11 0.29 0.51 0.60 0.84 1.07 1.64 1.84 1.78
2.38
2.96
3.21 2.70 2.76
2.68
2.41
2.04
2.25
2.13
2.17
0.02 0.07 0.10 0.15
0.25
0.46
0.89 1.17
1.32
1.41
1.49
1.34 1.26
1.07
0.91
0.67
0.61
0.53
0.47
0.31 0.58 0.71
1.00 1.33
2.10
2.73 2.95
3.71
4.43
4.96
4.45 4.69
5.22
7.57
8.51
11.05 10.35
13.19
0
5
10
1Q 2Q 3Q 4Q 1Q 2Q 3Q 4Q 1Q 2Q 3Q 4Q 1Q 2Q 3Q 4Q 1Q 2Q 3Q 4Q 1Q 2Q
FY2009 FY2010 FY2011 FY2012 FY2013 FY2014
(Unit: billion virtual currency)
Quarterly Coin Spent Amount in Ameba Business
Feature phone
PC
Smartphone

※
4
※

※
4

4
※※※

※
4

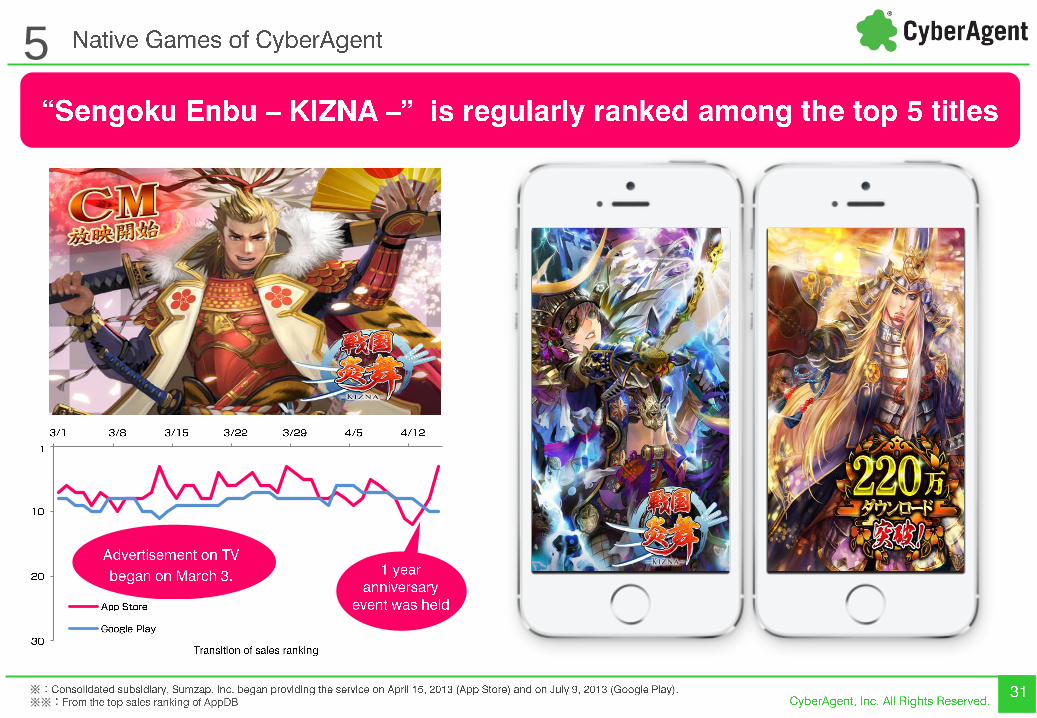
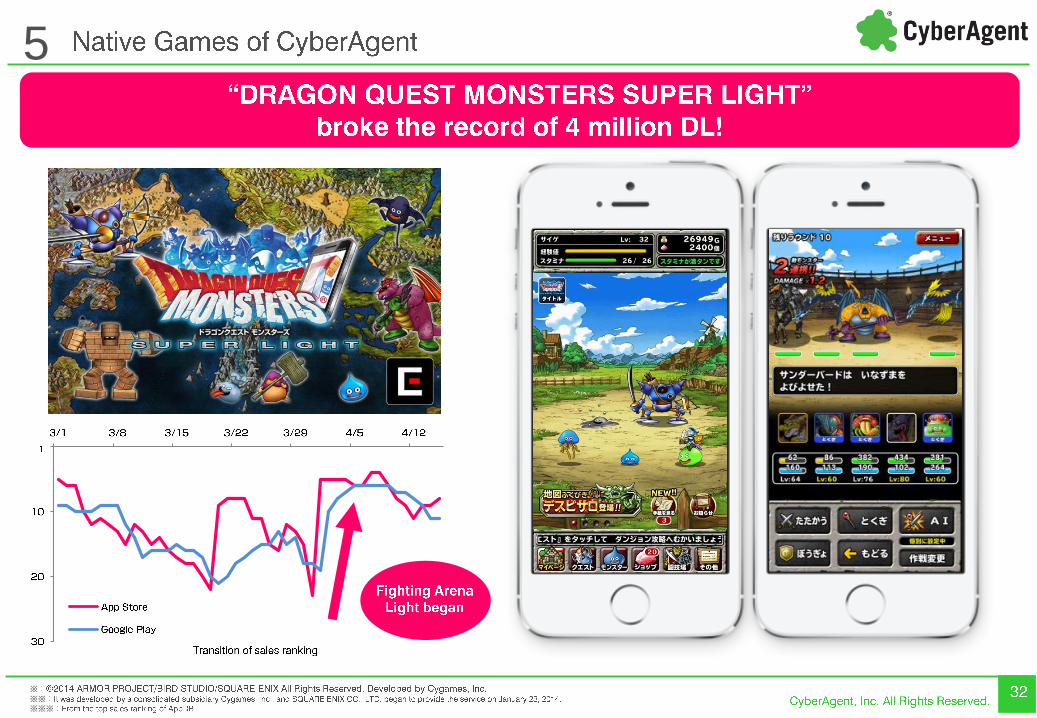
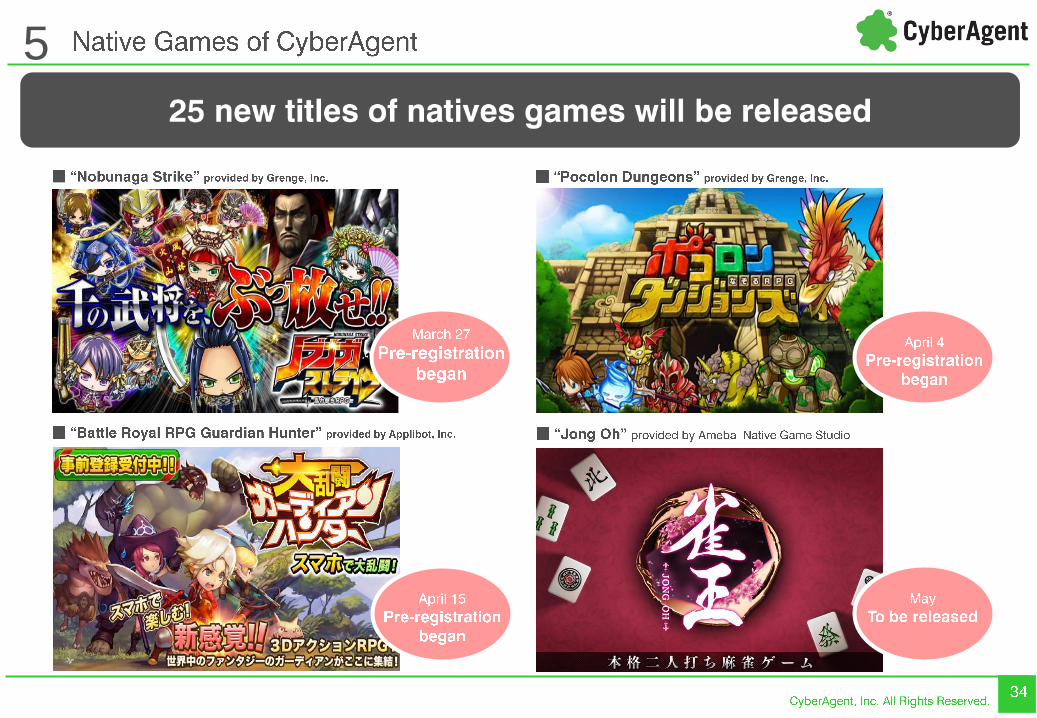
5

0.19
0.93
2.64
3.91 3.95 3.84 4.03
5.27
6.87
0.11
0.20
0.97
0.030.19
0.93
2.64
3.91 3.95 3.844.14
5.48
78.4
0.00
2.00
4.00
6.00
8.00
1Q 2Q 3Q 4Q 1Q 2Q 3Q 4Q 1Q 2Q
FY2012 FY2013 FY2014
(Unit: billion yen) Native Game Sales
Ameba business
Game business
5

5
※
※※※
5
※
※※※※※
5

5
※
5

6

※
6
0.01 0.002 0.01 0.02 0.03 0.19 0.93
2.64
3.91 3.95 3.84 4.03
5.27
6.87
0.009 0.02 0.281.97
2.72
4.66
4.975.75
5.25 5.24
4.84
4.94
6.36 6.54 6.19
7.30 7.39 7.14 6.77 6.676.97
7.94
7.52
7.73
6.876.06
5.08 5.07
4.58
4.85
6.36 6.546.19
7.30 7.407.14
6.79 6.72
7.29
10.11
11.18
15.04
15.75 15.77
14.17 14.3514.71
16.66
0.00
5.00
10.00
15.00
1Q 2Q 3Q 4Q 1Q 2Q 3Q 4Q 1Q 2Q 3Q 4Q 1Q 2Q 3Q 4Q 1Q 2Q
FY2010 FY2011 FY2012 FY2013 FY2014
(Unit: billion yen) Quarterly Sales of Game and Other Media Businesses
Other
Browser game
Native game

7

“Native Game of
CyberAgent”
7