Embed Size (px)
Citation preview

nutrients
Article
Caffeine Use among Active Duty Navy and MarineCorps Personnel
Joseph J. Knapik 1,2,3,*, Daniel W. Trone 4, Susan McGraw 1, Ryan A. Steelman 2,Krista G. Austin 1,3 and Harris R. Lieberman 1
1 Military Nutrition Division, US Army Research Institute of Environmental Medicine, Natick, MA 01760,USA; [email protected] (S.M.); [email protected] (K.G.A.);[email protected] (H.R.L.)
2 US Army Public Health Center, Aberdeen Proving Ground, MD 21010, USA; [email protected] Oak Ridge Institute for Science and Education, Belcamp, MD 21017, USA4 Naval Health Research Center, San Diego, CA 92152, USA; [email protected]* Correspondence: [email protected]; Tel.: +1-443-752-3350
Received: 8 August 2016; Accepted: 28 September 2016; Published: 9 October 2016
Abstract: Data from the National Health and Nutrition Examination Survey (NHANES) indicate89% of Americans regularly consume caffeine, but these data do not include military personnel.This cross-sectional study examined caffeine use in Navy and Marine Corps personnel, includingprevalence, amount of daily consumption, and factors associated with use. A random sample ofNavy and Marine Corps personnel was contacted and asked to complete a detailed questionnairedescribing their use of caffeine-containing substances, in addition to their demographic, military,and lifestyle characteristics. A total of 1708 service members (SMs) completed the questionnaire.Overall, 87% reported using caffeinated beverages ≥1 time/week, with caffeine users consuminga mean ± standard error of 226 ± 5 mg/day (242 ± 7 mg/day for men, 183 ± 8 mg/day forwomen). The most commonly consumed caffeinated beverages (% users) were coffee (65%), colas(54%), teas (40%), and energy drinks (28%). Multivariable logistic regression modeling indicated thatcharacteristics independently associated with caffeine use (≥1 time/week) included older age, whiterace/ethnicity, higher alcohol consumption, and participating in less resistance training. Prevalence ofcaffeine use in these SMs was similar to that reported in civilian investigations, but daily consumption(mg/day) was higher.
Keywords: coffee; tea; cola; energy drink; alcohol; sleep; exercise; demographics; lifestyle characteristics
1. Introduction
Caffeine is a widely consumed psychoactive substance. Recent data from nationally representativesamples indicate about 89% of American adults consume caffeinated products daily with virtuallyno difference between men and women in how frequently the products are used [1,2]. There hasbeen some concern regarding the potential adverse health effects of caffeine, especially with regardto cardiovascular disease and diabetes mellitus risk. Acute caffeine consumption increases bloodpressure and plasma lipids, and these effects led to speculation that chronic caffeine consumptionwould increase cardiovascular disease risk [3–5]; however, epidemiological studies have generallyconcluded that caffeine consumption is not associated with higher cardiovascular risk [6–9]. Short-termmetabolic studies have suggested caffeine has adverse effects on glucose tolerance and whole-bodyglucose management [10,11] which could increase diabetes risk, but longer-term investigations foundthat coffee consumption was associated with a lower risk of Type 2 diabetes [7,12,13]. Other studiessuggested there were positive effects of caffeinated products, including reduced liver dysfunction [14],slower age-related cognitive declines [15], improvement in some types of athletic performances [16],
Nutrients 2016, 8, 620; doi:10.3390/nu8100620 www.mdpi.com/journal/nutrients
Nutrients 2016, 8, 620 2 of 27
and reduced intensity of exercise-induced delayed onset muscle soreness [17]. A comprehensivereview of the health effects of caffeine concluded that adult consumption ≤400 mg/day (6 mg/kgbody weight for a 65 kg person) was not associated with adverse effects on cardiovascular health, bonestatus, male reproductive systems, adult behavior, or cancer risk, although it was recommended thatwomen of reproductive age should consume <300 mg/day because of possible effects on fertility andconception [18].
Investigations that have obtained representative data on caffeine intake in Americans [1,2,19]have not provided information on United States (US) military service members (SMs). One previousstudy did report on caffeine use in Army personnel [20]. That investigation found that the prevalenceof caffeine use was slightly lower than the general US population (82%), but among caffeine consumers,daily intake was considerably higher (347 mg/day). Factors associated with higher caffeine useincluded male sex, race/ethnicity other than black, and tobacco use.
The physical demands of the military, such as early morning physical training and limitedsleep during training, operations, and deployments, may lead SMs to consume more caffeinatedsubstances than the general population. The aim of this report was to examine the caffeine consumptionof active-duty Navy and Marine Corps personnel and investigate characteristics associated withconsumption. This is the second of a series of studies [20] designed to examine caffeine use in themilitary services.
2. Materials and Methods
This investigation was a cross-sectional survey of caffeine use among US active-duty Navyand Marine Corps personnel and was approved by the Naval Health Research Center’s (NHRC)institutional review board. Investigators requested information from the Defense Manpower DataCenter (DMDC) on a random sample of 4000 Navy personnel (3000 men and 1000 women) and6000 Marine Corps personnel (4500 men and 1500 women) currently on active duty and with at least6 months of service as of February 2014 (10,000 personnel in total). Data obtained from DMDC includedthe SM’s name, branch of service, pay grade (rank), postal address, e-mail address, gender, age, maritalstatus, and education level. National Change of Address records provided by the United States PostalService were referenced to ensure the most up-to-date postal address was used. The random samplerequest to DMDC was based on previous experience with similar NHRC questionnaire investigationsindicating an approximate 20% response rate from Navy and Marine Corps personnel [21] andstatistical power considerations. SMs were eligible for inclusion in the study if they were on the listprovided by DMDC and were on active duty in the Navy or Marine Corps.
2.1. Recruitment Procedures
Recruitment of participants in the random sample involved a maximum of six sequential contacts.The prospective participant was first sent an introductory postal letter including information about thepurpose of the study, the investigators and their command affiliations, the sponsors, and the reasonfor conducting the study. The introductory letter provided the SM with a pre-incentive $10 gift cardto nationally available businesses to encourage participation. The letter also included a descriptionof the survey, a link to a secure website, and a subject identification number that could be used toaccess the survey and electronically sign the consent form. A follow-up email message after 10 daysand postcard after three weeks were sent as reminders to those who did not initially complete thesurvey. If no response was received after sending the postcard, up to three additional email reminderswere sent over three months, after which contact with the SM ended. Those who responded were senta “Thank You” email message. All postal and on-line contacts stated that at any time the SM coulddecline participation and be removed from the contact list. Recruitment began in August 2014, and nofurther recruitment efforts were conducted or surveys accepted after December 2014.
Nutrients 2016, 8, 620 3 of 27
2.2. Survey (Questionnaire) Description
The first section of the questionnaire was designed to characterize participants. Questionsincluded items regarding demographic (gender, age, education level, marital status, race/ethnicity,height, weight), lifestyle (alcohol consumption, frequency and duration of aerobic and resistancetraining, average hours of sleep per night), and military (pay grade [rank], special operations status,military service branch) characteristics. This descriptive section was followed by a multipart questionlisting 31 types of caffeine-containing beverages, including coffee, teas, soft drinks, energy drinks,and caffeinated gums and medications. The latter category included Jolt Gum, Stay Alert Gum,Vivarin, No Doz Maximum, No Doz Regular, Generic Caffeine Pills, Dexatrim or other weight controlaids, Bayer Headache Relief, Excedrin, and others. The survey used a standard food frequencyquestionnaire method in which SMs selected among names of commonly used products or could typein caffeine-containing products that were not listed. SMs were asked to provide the number of timesthey used the product (per day, week, or month) in the last six months and the serving size. Servingsizes were as follows: for coffee, teas and soft drinks, 8, 12, 16, 20, and ≥24 fl oz; for energy drinks,the number of cans or bottles with serving size listed for the beverage; and for gums and medications,sticks of gum or number of pills. The questionnaire also asked the SM to record the typical amountof beer, wine, and liquor they consumed. They could select either a small, medium, or large servingsize for each of the three beverage types, with a medium serving size anchored at 12 oz for beer,one medium glass for wine, and one shot for liquor. They subsequently listed the number of timesper day, week, month, or year they consumed the alcoholic beverage.
2.3. Data Analysis
Caffeine consumption (mg/day) was calculated based on the self-reported product, its servingsize, and frequency of use. Sources of information on caffeine content of specific products includedproduct and company websites and a database of caffeine in coffees, teas, sodas, and energydrinks [22]. Body mass index (BMI) was calculated as weight/height2 (kg/m2). Weekly duration ofaerobic and resistance training (min/week) was calculated by multiplying weekly exercise frequency(sessions/week) by the duration of training (min/session). Alcohol consumption was estimated usingstandards provided by National Institutes of Health [23]. A medium drink was defined as a 12 ozbeer, 5 oz glass of wine, or a shot of liquor, each containing 14 gm of alcohol. SMs were categorizedinto five alcohol consumption groups which included non-users and users divided into quartiles(four approximately equal groups) based on their reported daily alcohol consumption.
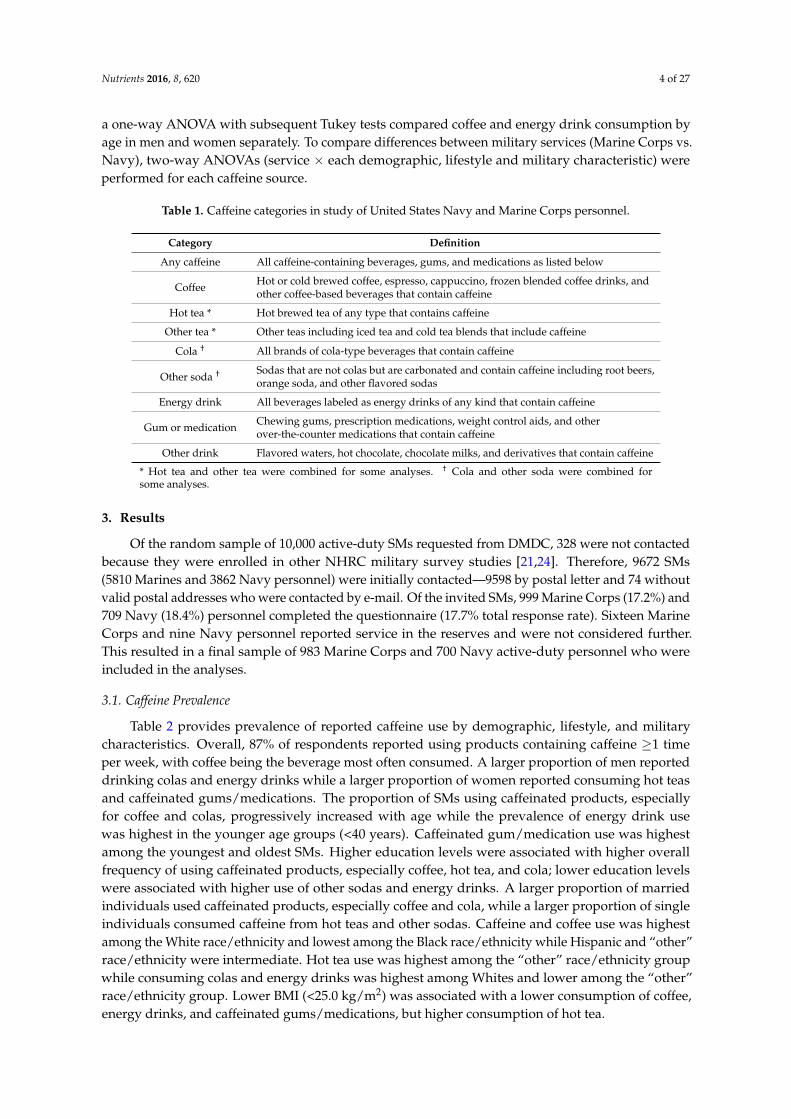
Statistical analysis was conducted using the Statistical Package for the Social Sciences (SPSS;Version 19.0.0, SPSS Inc., IBM Corporation, Armonk, NY, USA). Caffeine products were grouped intoeight categories that included (1) coffee; (2) hot tea; (3) other tea-based beverages; (4) colas; (5) othersodas; (6) energy drinks; (7) caffeinated gums and medications; and (8) other drinks containing caffeine.All categories were combined to arrive at an aggregated caffeine intake. Definitions of these categoriesare shown in Table 1.
Prevalence of use ≥1 time/week (%) and standard errors (SE) were calculated. Chi-squarestatistics were used to examine prevalence differences across various strata of demographic (gender,age, education level, marital status, race/ethnicity, BMI), lifestyle (alcohol consumption, weeklyduration of aerobic and resistance training, sleep duration) and military (rank, special operationsstatus, military service branch) characteristics. A one-way analysis of variance (ANOVA) was used toexamine differences in daily average caffeine consumption across strata of these same characteristics.Since some participants did not complete all of the questions, the number of subjects is shown for eachvariable. Multivariable logistic regression was used to examine associations between the dependentvariable “caffeine consumer” (≥1 time/week) and independent variables that included demographic,military, and lifestyle characteristics. Six separate regression models were developed for specificcaffeine sources including any caffeine, coffee, tea, cola, energy drinks, and caffeinated gums andmedications. A two-way ANOVA compared overall caffeine consumption by age and gender while
Nutrients 2016, 8, 620 4 of 27
a one-way ANOVA with subsequent Tukey tests compared coffee and energy drink consumption byage in men and women separately. To compare differences between military services (Marine Corps vs.Navy), two-way ANOVAs (service × each demographic, lifestyle and military characteristic) wereperformed for each caffeine source.
Table 1. Caffeine categories in study of United States Navy and Marine Corps personnel.
Category Definition
Any caffeine All caffeine-containing beverages, gums, and medications as listed below
Coffee Hot or cold brewed coffee, espresso, cappuccino, frozen blended coffee drinks, andother coffee-based beverages that contain caffeine
Hot tea * Hot brewed tea of any type that contains caffeine
Other tea * Other teas including iced tea and cold tea blends that include caffeine
Cola † All brands of cola-type beverages that contain caffeine
Other soda † Sodas that are not colas but are carbonated and contain caffeine including root beers,orange soda, and other flavored sodas
Energy drink All beverages labeled as energy drinks of any kind that contain caffeine
Gum or medication Chewing gums, prescription medications, weight control aids, and otherover-the-counter medications that contain caffeine
Other drink Flavored waters, hot chocolate, chocolate milks, and derivatives that contain caffeine
* Hot tea and other tea were combined for some analyses. † Cola and other soda were combined forsome analyses.
3. Results
Of the random sample of 10,000 active-duty SMs requested from DMDC, 328 were not contactedbecause they were enrolled in other NHRC military survey studies [21,24]. Therefore, 9672 SMs(5810 Marines and 3862 Navy personnel) were initially contacted—9598 by postal letter and 74 withoutvalid postal addresses who were contacted by e-mail. Of the invited SMs, 999 Marine Corps (17.2%) and709 Navy (18.4%) personnel completed the questionnaire (17.7% total response rate). Sixteen MarineCorps and nine Navy personnel reported service in the reserves and were not considered further.This resulted in a final sample of 983 Marine Corps and 700 Navy active-duty personnel who wereincluded in the analyses.
3.1. Caffeine Prevalence
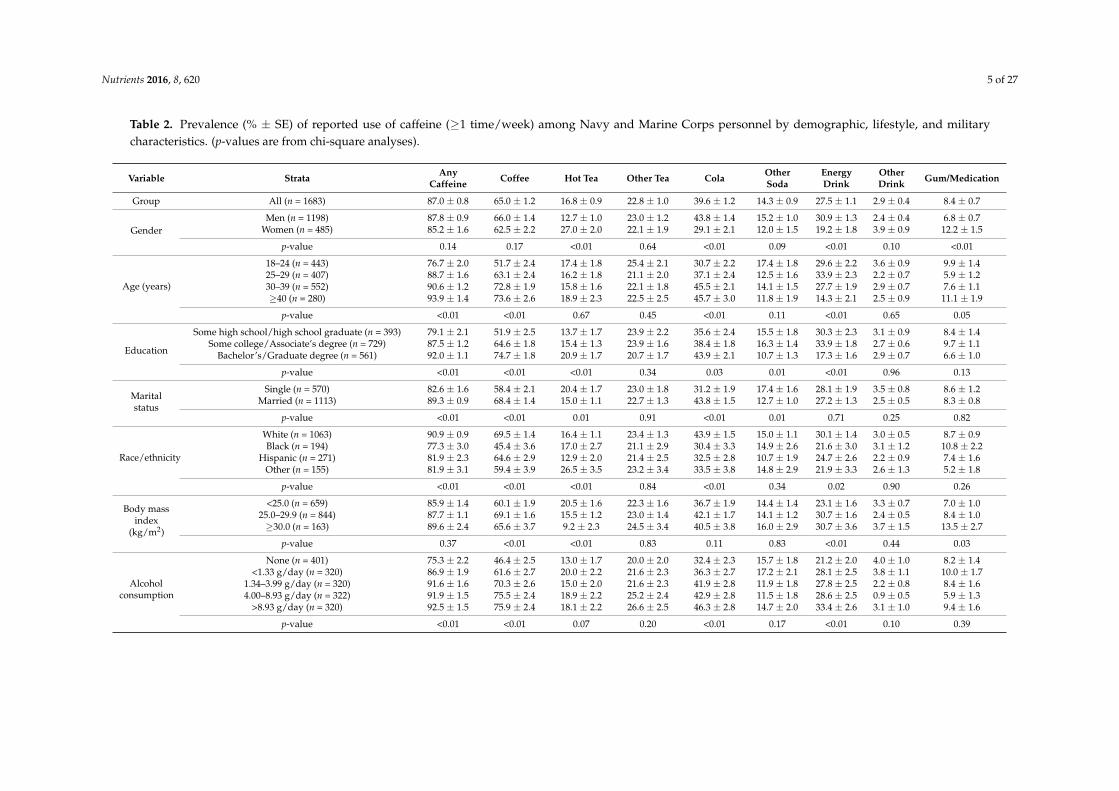
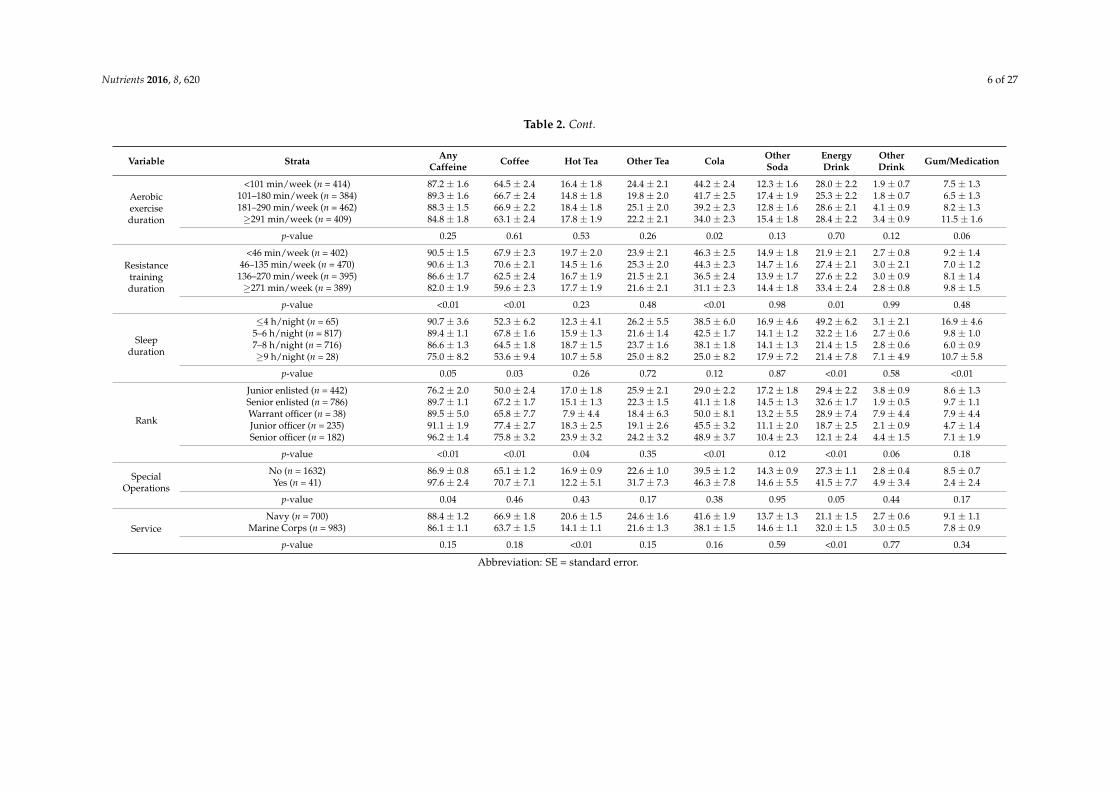
Table 2 provides prevalence of reported caffeine use by demographic, lifestyle, and militarycharacteristics. Overall, 87% of respondents reported using products containing caffeine ≥1 timeper week, with coffee being the beverage most often consumed. A larger proportion of men reporteddrinking colas and energy drinks while a larger proportion of women reported consuming hot teasand caffeinated gums/medications. The proportion of SMs using caffeinated products, especiallyfor coffee and colas, progressively increased with age while the prevalence of energy drink usewas highest in the younger age groups (<40 years). Caffeinated gum/medication use was highestamong the youngest and oldest SMs. Higher education levels were associated with higher overallfrequency of using caffeinated products, especially coffee, hot tea, and cola; lower education levelswere associated with higher use of other sodas and energy drinks. A larger proportion of marriedindividuals used caffeinated products, especially coffee and cola, while a larger proportion of singleindividuals consumed caffeine from hot teas and other sodas. Caffeine and coffee use was highestamong the White race/ethnicity and lowest among the Black race/ethnicity while Hispanic and “other”race/ethnicity were intermediate. Hot tea use was highest among the “other” race/ethnicity groupwhile consuming colas and energy drinks was highest among Whites and lower among the “other”race/ethnicity group. Lower BMI (<25.0 kg/m2) was associated with a lower consumption of coffee,energy drinks, and caffeinated gums/medications, but higher consumption of hot tea.
Nutrients 2016, 8, 620 5 of 27
Table 2. Prevalence (% ± SE) of reported use of caffeine (≥1 time/week) among Navy and Marine Corps personnel by demographic, lifestyle, and militarycharacteristics. (p-values are from chi-square analyses).
Variable Strata AnyCaffeine Coffee Hot Tea Other Tea Cola Other
SodaEnergyDrink
OtherDrink Gum/Medication
Group All (n = 1683) 87.0 ± 0.8 65.0 ± 1.2 16.8 ± 0.9 22.8 ± 1.0 39.6 ± 1.2 14.3 ± 0.9 27.5 ± 1.1 2.9 ± 0.4 8.4 ± 0.7
GenderMen (n = 1198) 87.8 ± 0.9 66.0 ± 1.4 12.7 ± 1.0 23.0 ± 1.2 43.8 ± 1.4 15.2 ± 1.0 30.9 ± 1.3 2.4 ± 0.4 6.8 ± 0.7
Women (n = 485) 85.2 ± 1.6 62.5 ± 2.2 27.0 ± 2.0 22.1 ± 1.9 29.1 ± 2.1 12.0 ± 1.5 19.2 ± 1.8 3.9 ± 0.9 12.2 ± 1.5
p-value 0.14 0.17 <0.01 0.64 <0.01 0.09 <0.01 0.10 <0.01
Age (years)
18–24 (n = 443) 76.7 ± 2.0 51.7 ± 2.4 17.4 ± 1.8 25.4 ± 2.1 30.7 ± 2.2 17.4 ± 1.8 29.6 ± 2.2 3.6 ± 0.9 9.9 ± 1.425–29 (n = 407) 88.7 ± 1.6 63.1 ± 2.4 16.2 ± 1.8 21.1 ± 2.0 37.1 ± 2.4 12.5 ± 1.6 33.9 ± 2.3 2.2 ± 0.7 5.9 ± 1.230–39 (n = 552) 90.6 ± 1.2 72.8 ± 1.9 15.8 ± 1.6 22.1 ± 1.8 45.5 ± 2.1 14.1 ± 1.5 27.7 ± 1.9 2.9 ± 0.7 7.6 ± 1.1≥40 (n = 280) 93.9 ± 1.4 73.6 ± 2.6 18.9 ± 2.3 22.5 ± 2.5 45.7 ± 3.0 11.8 ± 1.9 14.3 ± 2.1 2.5 ± 0.9 11.1 ± 1.9
p-value <0.01 <0.01 0.67 0.45 <0.01 0.11 <0.01 0.65 0.05
Education
Some high school/high school graduate (n = 393) 79.1 ± 2.1 51.9 ± 2.5 13.7 ± 1.7 23.9 ± 2.2 35.6 ± 2.4 15.5 ± 1.8 30.3 ± 2.3 3.1 ± 0.9 8.4 ± 1.4Some college/Associate’s degree (n = 729) 87.5 ± 1.2 64.6 ± 1.8 15.4 ± 1.3 23.9 ± 1.6 38.4 ± 1.8 16.3 ± 1.4 33.9 ± 1.8 2.7 ± 0.6 9.7 ± 1.1
Bachelor’s/Graduate degree (n = 561) 92.0 ± 1.1 74.7 ± 1.8 20.9 ± 1.7 20.7 ± 1.7 43.9 ± 2.1 10.7 ± 1.3 17.3 ± 1.6 2.9 ± 0.7 6.6 ± 1.0
p-value <0.01 <0.01 <0.01 0.34 0.03 0.01 <0.01 0.96 0.13
Maritalstatus
Single (n = 570) 82.6 ± 1.6 58.4 ± 2.1 20.4 ± 1.7 23.0 ± 1.8 31.2 ± 1.9 17.4 ± 1.6 28.1 ± 1.9 3.5 ± 0.8 8.6 ± 1.2Married (n = 1113) 89.3 ± 0.9 68.4 ± 1.4 15.0 ± 1.1 22.7 ± 1.3 43.8 ± 1.5 12.7 ± 1.0 27.2 ± 1.3 2.5 ± 0.5 8.3 ± 0.8
p-value <0.01 <0.01 0.01 0.91 <0.01 0.01 0.71 0.25 0.82
Race/ethnicity
White (n = 1063) 90.9 ± 0.9 69.5 ± 1.4 16.4 ± 1.1 23.4 ± 1.3 43.9 ± 1.5 15.0 ± 1.1 30.1 ± 1.4 3.0 ± 0.5 8.7 ± 0.9Black (n = 194) 77.3 ± 3.0 45.4 ± 3.6 17.0 ± 2.7 21.1 ± 2.9 30.4 ± 3.3 14.9 ± 2.6 21.6 ± 3.0 3.1 ± 1.2 10.8 ± 2.2
Hispanic (n = 271) 81.9 ± 2.3 64.6 ± 2.9 12.9 ± 2.0 21.4 ± 2.5 32.5 ± 2.8 10.7 ± 1.9 24.7 ± 2.6 2.2 ± 0.9 7.4 ± 1.6Other (n = 155) 81.9 ± 3.1 59.4 ± 3.9 26.5 ± 3.5 23.2 ± 3.4 33.5 ± 3.8 14.8 ± 2.9 21.9 ± 3.3 2.6 ± 1.3 5.2 ± 1.8
p-value <0.01 <0.01 <0.01 0.84 <0.01 0.34 0.02 0.90 0.26
Body massindex
(kg/m2)
<25.0 (n = 659) 85.9 ± 1.4 60.1 ± 1.9 20.5 ± 1.6 22.3 ± 1.6 36.7 ± 1.9 14.4 ± 1.4 23.1 ± 1.6 3.3 ± 0.7 7.0 ± 1.025.0–29.9 (n = 844) 87.7 ± 1.1 69.1 ± 1.6 15.5 ± 1.2 23.0 ± 1.4 42.1 ± 1.7 14.1 ± 1.2 30.7 ± 1.6 2.4 ± 0.5 8.4 ± 1.0≥30.0 (n = 163) 89.6 ± 2.4 65.6 ± 3.7 9.2 ± 2.3 24.5 ± 3.4 40.5 ± 3.8 16.0 ± 2.9 30.7 ± 3.6 3.7 ± 1.5 13.5 ± 2.7
p-value 0.37 <0.01 <0.01 0.83 0.11 0.83 <0.01 0.44 0.03
Alcoholconsumption
None (n = 401) 75.3 ± 2.2 46.4 ± 2.5 13.0 ± 1.7 20.0 ± 2.0 32.4 ± 2.3 15.7 ± 1.8 21.2 ± 2.0 4.0 ± 1.0 8.2 ± 1.4<1.33 g/day (n = 320) 86.9 ± 1.9 61.6 ± 2.7 20.0 ± 2.2 21.6 ± 2.3 36.3 ± 2.7 17.2 ± 2.1 28.1 ± 2.5 3.8 ± 1.1 10.0 ± 1.7
1.34–3.99 g/day (n = 320) 91.6 ± 1.6 70.3 ± 2.6 15.0 ± 2.0 21.6 ± 2.3 41.9 ± 2.8 11.9 ± 1.8 27.8 ± 2.5 2.2 ± 0.8 8.4 ± 1.64.00–8.93 g/day (n = 322) 91.9 ± 1.5 75.5 ± 2.4 18.9 ± 2.2 25.2 ± 2.4 42.9 ± 2.8 11.5 ± 1.8 28.6 ± 2.5 0.9 ± 0.5 5.9 ± 1.3
>8.93 g/day (n = 320) 92.5 ± 1.5 75.9 ± 2.4 18.1 ± 2.2 26.6 ± 2.5 46.3 ± 2.8 14.7 ± 2.0 33.4 ± 2.6 3.1 ± 1.0 9.4 ± 1.6
p-value <0.01 <0.01 0.07 0.20 <0.01 0.17 <0.01 0.10 0.39
Nutrients 2016, 8, 620 6 of 27
Table 2. Cont.
Variable Strata AnyCaffeine Coffee Hot Tea Other Tea Cola Other
SodaEnergyDrink
OtherDrink Gum/Medication
Aerobicexerciseduration
<101 min/week (n = 414) 87.2 ± 1.6 64.5 ± 2.4 16.4 ± 1.8 24.4 ± 2.1 44.2 ± 2.4 12.3 ± 1.6 28.0 ± 2.2 1.9 ± 0.7 7.5 ± 1.3101–180 min/week (n = 384) 89.3 ± 1.6 66.7 ± 2.4 14.8 ± 1.8 19.8 ± 2.0 41.7 ± 2.5 17.4 ± 1.9 25.3 ± 2.2 1.8 ± 0.7 6.5 ± 1.3181–290 min/week (n = 462) 88.3 ± 1.5 66.9 ± 2.2 18.4 ± 1.8 25.1 ± 2.0 39.2 ± 2.3 12.8 ± 1.6 28.6 ± 2.1 4.1 ± 0.9 8.2 ± 1.3≥291 min/week (n = 409) 84.8 ± 1.8 63.1 ± 2.4 17.8 ± 1.9 22.2 ± 2.1 34.0 ± 2.3 15.4 ± 1.8 28.4 ± 2.2 3.4 ± 0.9 11.5 ± 1.6
p-value 0.25 0.61 0.53 0.26 0.02 0.13 0.70 0.12 0.06
Resistancetrainingduration
<46 min/week (n = 402) 90.5 ± 1.5 67.9 ± 2.3 19.7 ± 2.0 23.9 ± 2.1 46.3 ± 2.5 14.9 ± 1.8 21.9 ± 2.1 2.7 ± 0.8 9.2 ± 1.446–135 min/week (n = 470) 90.6 ± 1.3 70.6 ± 2.1 14.5 ± 1.6 25.3 ± 2.0 44.3 ± 2.3 14.7 ± 1.6 27.4 ± 2.1 3.0 ± 2.1 7.0 ± 1.2
136–270 min/week (n = 395) 86.6 ± 1.7 62.5 ± 2.4 16.7 ± 1.9 21.5 ± 2.1 36.5 ± 2.4 13.9 ± 1.7 27.6 ± 2.2 3.0 ± 0.9 8.1 ± 1.4≥271 min/week (n = 389) 82.0 ± 1.9 59.6 ± 2.3 17.7 ± 1.9 21.6 ± 2.1 31.1 ± 2.3 14.4 ± 1.8 33.4 ± 2.4 2.8 ± 0.8 9.8 ± 1.5
p-value <0.01 <0.01 0.23 0.48 <0.01 0.98 0.01 0.99 0.48
Sleepduration
≤4 h/night (n = 65) 90.7 ± 3.6 52.3 ± 6.2 12.3 ± 4.1 26.2 ± 5.5 38.5 ± 6.0 16.9 ± 4.6 49.2 ± 6.2 3.1 ± 2.1 16.9 ± 4.65–6 h/night (n = 817) 89.4 ± 1.1 67.8 ± 1.6 15.9 ± 1.3 21.6 ± 1.4 42.5 ± 1.7 14.1 ± 1.2 32.2 ± 1.6 2.7 ± 0.6 9.8 ± 1.07–8 h/night (n = 716) 86.6 ± 1.3 64.5 ± 1.8 18.7 ± 1.5 23.7 ± 1.6 38.1 ± 1.8 14.1 ± 1.3 21.4 ± 1.5 2.8 ± 0.6 6.0 ± 0.9≥9 h/night (n = 28) 75.0 ± 8.2 53.6 ± 9.4 10.7 ± 5.8 25.0 ± 8.2 25.0 ± 8.2 17.9 ± 7.2 21.4 ± 7.8 7.1 ± 4.9 10.7 ± 5.8
p-value 0.05 0.03 0.26 0.72 0.12 0.87 <0.01 0.58 <0.01
Rank
Junior enlisted (n = 442) 76.2 ± 2.0 50.0 ± 2.4 17.0 ± 1.8 25.9 ± 2.1 29.0 ± 2.2 17.2 ± 1.8 29.4 ± 2.2 3.8 ± 0.9 8.6 ± 1.3Senior enlisted (n = 786) 89.7 ± 1.1 67.2 ± 1.7 15.1 ± 1.3 22.3 ± 1.5 41.1 ± 1.8 14.5 ± 1.3 32.6 ± 1.7 1.9 ± 0.5 9.7 ± 1.1Warrant officer (n = 38) 89.5 ± 5.0 65.8 ± 7.7 7.9 ± 4.4 18.4 ± 6.3 50.0 ± 8.1 13.2 ± 5.5 28.9 ± 7.4 7.9 ± 4.4 7.9 ± 4.4Junior officer (n = 235) 91.1 ± 1.9 77.4 ± 2.7 18.3 ± 2.5 19.1 ± 2.6 45.5 ± 3.2 11.1 ± 2.0 18.7 ± 2.5 2.1 ± 0.9 4.7 ± 1.4Senior officer (n = 182) 96.2 ± 1.4 75.8 ± 3.2 23.9 ± 3.2 24.2 ± 3.2 48.9 ± 3.7 10.4 ± 2.3 12.1 ± 2.4 4.4 ± 1.5 7.1 ± 1.9
p-value <0.01 <0.01 0.04 0.35 <0.01 0.12 <0.01 0.06 0.18
SpecialOperations
No (n = 1632) 86.9 ± 0.8 65.1 ± 1.2 16.9 ± 0.9 22.6 ± 1.0 39.5 ± 1.2 14.3 ± 0.9 27.3 ± 1.1 2.8 ± 0.4 8.5 ± 0.7Yes (n = 41) 97.6 ± 2.4 70.7 ± 7.1 12.2 ± 5.1 31.7 ± 7.3 46.3 ± 7.8 14.6 ± 5.5 41.5 ± 7.7 4.9 ± 3.4 2.4 ± 2.4
p-value 0.04 0.46 0.43 0.17 0.38 0.95 0.05 0.44 0.17
ServiceNavy (n = 700) 88.4 ± 1.2 66.9 ± 1.8 20.6 ± 1.5 24.6 ± 1.6 41.6 ± 1.9 13.7 ± 1.3 21.1 ± 1.5 2.7 ± 0.6 9.1 ± 1.1
Marine Corps (n = 983) 86.1 ± 1.1 63.7 ± 1.5 14.1 ± 1.1 21.6 ± 1.3 38.1 ± 1.5 14.6 ± 1.1 32.0 ± 1.5 3.0 ± 0.5 7.8 ± 0.9
p-value 0.15 0.18 <0.01 0.15 0.16 0.59 <0.01 0.77 0.34
Abbreviation: SE = standard error.
Nutrients 2016, 8, 620 7 of 27
As alcohol consumption increased so did the overall use of caffeinated products, especially coffeeand colas. Energy drink use was lowest among the alcohol nondrinkers and highest among thehighest alcohol consumption group with other alcohol categories showing intermediate use. Longerweekly duration of aerobic exercise was associated with a lower prevalence of cola use. Longer weeklyduration of resistance training was associated with a lower overall caffeine use, especially coffee andcolas, but a higher consumption of energy drinks. Shorter nightly sleep duration was associated withhigher consumption of any caffeinated products, especially energy drinks, but prevalence of coffeeconsumption was lowest in the shortest and longest sleep duration categories. SMs reporting theshortest nightly sleep duration also had the highest use of caffeinated gums/medications.
Higher military rank was generally associated with a higher prevalence of consuming anycaffeinated product; junior and senior officers reported consuming coffee more frequently than warrantofficers and enlisted SMs. Prevalence of hot tea use was lowest for warrant officers and highest forsenior officers, with other ranks intermediate. Prevalence of cola consumption was lowest for thejunior enlisted and highest among warrant officers. Enlisted personnel and warrant officers reportedconsuming energy drinks more frequently than officers. Those who reported special operationsassignments had a higher prevalence of consuming caffeinated products, especially energy drinks.A larger proportion of Navy personnel consumed hot teas while Marines were more likely to useenergy drinks.
3.2. Caffeine Consumption
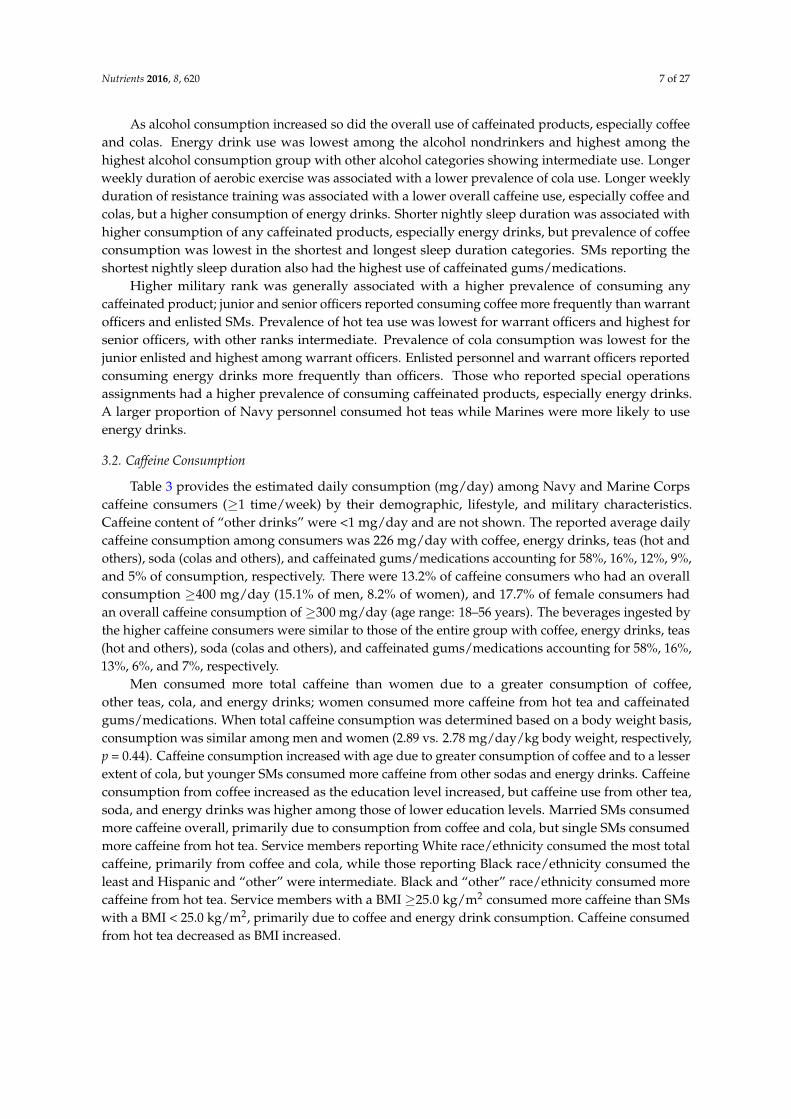
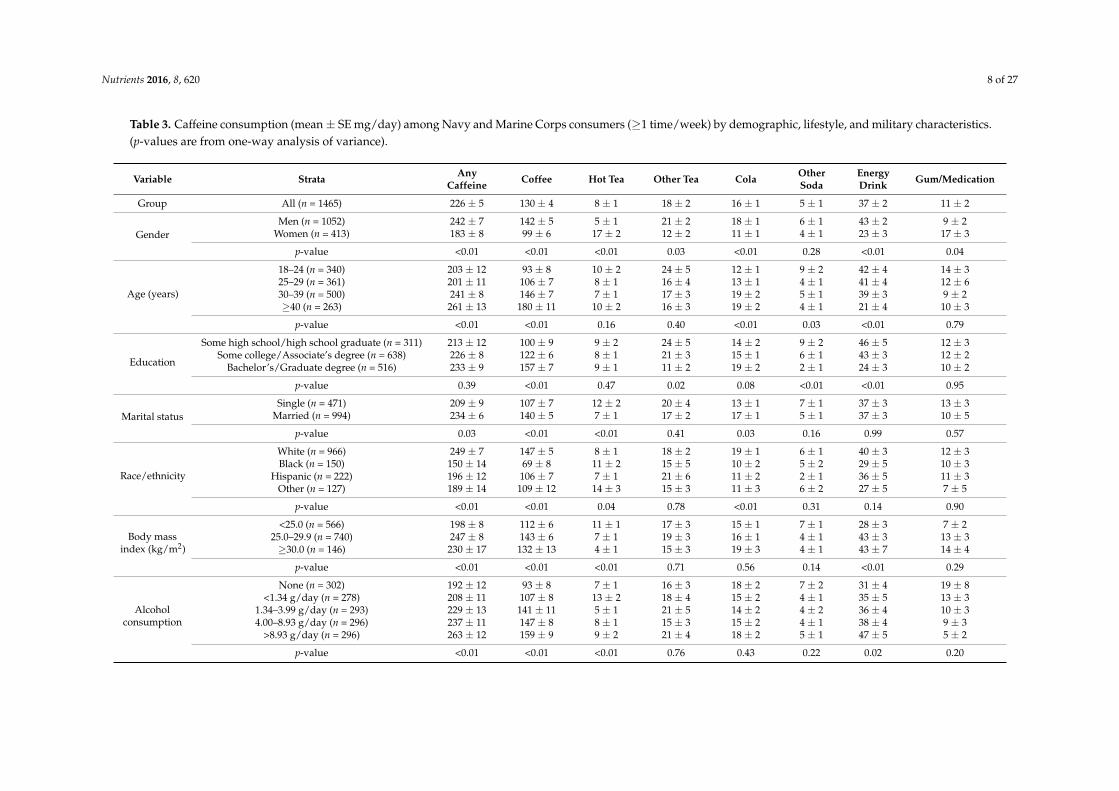
Table 3 provides the estimated daily consumption (mg/day) among Navy and Marine Corpscaffeine consumers (≥1 time/week) by their demographic, lifestyle, and military characteristics.Caffeine content of “other drinks” were <1 mg/day and are not shown. The reported average dailycaffeine consumption among consumers was 226 mg/day with coffee, energy drinks, teas (hot andothers), soda (colas and others), and caffeinated gums/medications accounting for 58%, 16%, 12%, 9%,and 5% of consumption, respectively. There were 13.2% of caffeine consumers who had an overallconsumption ≥400 mg/day (15.1% of men, 8.2% of women), and 17.7% of female consumers hadan overall caffeine consumption of ≥300 mg/day (age range: 18–56 years). The beverages ingested bythe higher caffeine consumers were similar to those of the entire group with coffee, energy drinks, teas(hot and others), soda (colas and others), and caffeinated gums/medications accounting for 58%, 16%,13%, 6%, and 7%, respectively.
Men consumed more total caffeine than women due to a greater consumption of coffee,other teas, cola, and energy drinks; women consumed more caffeine from hot tea and caffeinatedgums/medications. When total caffeine consumption was determined based on a body weight basis,consumption was similar among men and women (2.89 vs. 2.78 mg/day/kg body weight, respectively,p = 0.44). Caffeine consumption increased with age due to greater consumption of coffee and to a lesserextent of cola, but younger SMs consumed more caffeine from other sodas and energy drinks. Caffeineconsumption from coffee increased as the education level increased, but caffeine use from other tea,soda, and energy drinks was higher among those of lower education levels. Married SMs consumedmore caffeine overall, primarily due to consumption from coffee and cola, but single SMs consumedmore caffeine from hot tea. Service members reporting White race/ethnicity consumed the most totalcaffeine, primarily from coffee and cola, while those reporting Black race/ethnicity consumed theleast and Hispanic and “other” were intermediate. Black and “other” race/ethnicity consumed morecaffeine from hot tea. Service members with a BMI ≥25.0 kg/m2 consumed more caffeine than SMswith a BMI < 25.0 kg/m2, primarily due to coffee and energy drink consumption. Caffeine consumedfrom hot tea decreased as BMI increased.
Nutrients 2016, 8, 620 8 of 27
Table 3. Caffeine consumption (mean ± SE mg/day) among Navy and Marine Corps consumers (≥1 time/week) by demographic, lifestyle, and military characteristics.(p-values are from one-way analysis of variance).
Variable Strata AnyCaffeine Coffee Hot Tea Other Tea Cola Other
SodaEnergyDrink Gum/Medication
Group All (n = 1465) 226 ± 5 130 ± 4 8 ± 1 18 ± 2 16 ± 1 5 ± 1 37 ± 2 11 ± 2
GenderMen (n = 1052) 242 ± 7 142 ± 5 5 ± 1 21 ± 2 18 ± 1 6 ± 1 43 ± 2 9 ± 2
Women (n = 413) 183 ± 8 99 ± 6 17 ± 2 12 ± 2 11 ± 1 4 ± 1 23 ± 3 17 ± 3
p-value <0.01 <0.01 <0.01 0.03 <0.01 0.28 <0.01 0.04
Age (years)
18–24 (n = 340) 203 ± 12 93 ± 8 10 ± 2 24 ± 5 12 ± 1 9 ± 2 42 ± 4 14 ± 325–29 (n = 361) 201 ± 11 106 ± 7 8 ± 1 16 ± 4 13 ± 1 4 ± 1 41 ± 4 12 ± 630–39 (n = 500) 241 ± 8 146 ± 7 7 ± 1 17 ± 3 19 ± 2 5 ± 1 39 ± 3 9 ± 2≥40 (n = 263) 261 ± 13 180 ± 11 10 ± 2 16 ± 3 19 ± 2 4 ± 1 21 ± 4 10 ± 3
p-value <0.01 <0.01 0.16 0.40 <0.01 0.03 <0.01 0.79
Education
Some high school/high school graduate (n = 311) 213 ± 12 100 ± 9 9 ± 2 24 ± 5 14 ± 2 9 ± 2 46 ± 5 12 ± 3Some college/Associate’s degree (n = 638) 226 ± 8 122 ± 6 8 ± 1 21 ± 3 15 ± 1 6 ± 1 43 ± 3 12 ± 2
Bachelor’s/Graduate degree (n = 516) 233 ± 9 157 ± 7 9 ± 1 11 ± 2 19 ± 2 2 ± 1 24 ± 3 10 ± 2
p-value 0.39 <0.01 0.47 0.02 0.08 <0.01 <0.01 0.95
Marital statusSingle (n = 471) 209 ± 9 107 ± 7 12 ± 2 20 ± 4 13 ± 1 7 ± 1 37 ± 3 13 ± 3
Married (n = 994) 234 ± 6 140 ± 5 7 ± 1 17 ± 2 17 ± 1 5 ± 1 37 ± 3 10 ± 5
p-value 0.03 <0.01 <0.01 0.41 0.03 0.16 0.99 0.57
Race/ethnicity
White (n = 966) 249 ± 7 147 ± 5 8 ± 1 18 ± 2 19 ± 1 6 ± 1 40 ± 3 12 ± 3Black (n = 150) 150 ± 14 69 ± 8 11 ± 2 15 ± 5 10 ± 2 5 ± 2 29 ± 5 10 ± 3
Hispanic (n = 222) 196 ± 12 106 ± 7 7 ± 1 21 ± 6 11 ± 2 2 ± 1 36 ± 5 11 ± 3Other (n = 127) 189 ± 14 109 ± 12 14 ± 3 15 ± 3 11 ± 3 6 ± 2 27 ± 5 7 ± 5
p-value <0.01 <0.01 0.04 0.78 <0.01 0.31 0.14 0.90
Body massindex (kg/m2)
<25.0 (n = 566) 198 ± 8 112 ± 6 11 ± 1 17 ± 3 15 ± 1 7 ± 1 28 ± 3 7 ± 225.0–29.9 (n = 740) 247 ± 8 143 ± 6 7 ± 1 19 ± 3 16 ± 1 4 ± 1 43 ± 3 13 ± 3≥30.0 (n = 146) 230 ± 17 132 ± 13 4 ± 1 15 ± 3 19 ± 3 4 ± 1 43 ± 7 14 ± 4
p-value <0.01 <0.01 <0.01 0.71 0.56 0.14 <0.01 0.29
Alcoholconsumption
None (n = 302) 192 ± 12 93 ± 8 7 ± 1 16 ± 3 18 ± 2 7 ± 2 31 ± 4 19 ± 8<1.34 g/day (n = 278) 208 ± 11 107 ± 8 13 ± 2 18 ± 4 15 ± 2 4 ± 1 35 ± 5 13 ± 3
1.34–3.99 g/day (n = 293) 229 ± 13 141 ± 11 5 ± 1 21 ± 5 14 ± 2 4 ± 2 36 ± 4 10 ± 34.00–8.93 g/day (n = 296) 237 ± 11 147 ± 8 8 ± 1 15 ± 3 15 ± 2 4 ± 1 38 ± 4 9 ± 3
>8.93 g/day (n = 296) 263 ± 12 159 ± 9 9 ± 2 21 ± 4 18 ± 2 5 ± 1 47 ± 5 5 ± 2
p-value <0.01 <0.01 <0.01 0.76 0.43 0.22 0.02 0.20

Nutrients 2016, 8, 620 9 of 27
Table 3. Cont.
Variable Strata AnyCaffeine Coffee Hot Tea Other Tea Cola Other
SodaEnergyDrink Gum/Medication
Aerobicexerciseduration
<101 min/week (n = 361) 225 ± 10 129 ± 8 8 ± 1 16 ± 3 19 ± 2 5 ± 2 40 ± 5 7 ± 2101–180 min/week (n = 343) 225 ± 10 131 ± 8 8 ± 2 18 ± 4 19 ± 2 6 ± 1 34 ± 4 9 ± 2181–290 min/week (n = 408) 234 ± 10 139 ± 8 9 ± 1 21 ± 4 14 ± 1 5 ± 1 37 ± 4 10 ± 2≥291 min/week (n = 347) 219 ± 12 119 ± 8 8 ± 1 17 ± 3 12 ± 1 5 ± 1 37 ± 4 19 ± 7
p-value 0.79 0.39 0.95 0.71 <0.01 0.88 0.79 0.11
Resistancetrainingduration
<46 min/week (n = 364) 255 ± 11 157 ± 10 10 ± 2 17 ± 3 21 ± 2 7 ± 2 33 ± 4 10 ± 246–135 min/week (n = 426) 215 ± 9 126 ± 7 7 ± 1 19 ± 4 16 ± 1 5 ± 1 35 ± 4 7 ± 2
136–270 min/week (n = 342) 213 ± 10 128 ± 9 9 ± 2 15 ± 3 15 ± 2 4 ± 1 34 ± 4 9 ± 3≥271 min/week (n = 319) 222 ± 12 106 ± 7 8 ± 1 22 ± 5 11 ± 1 6 ± 1 48 ± 5 21 ± 7
p-value 0.02 <0.01 0.60 0.60 <0.01 0.45 0.03 0.06
Sleep duration
≤4 h/night (n = 55) 372 ± 46 149 ± 35 13 ± 6 67 ± 24 25 ± 6 10 ± 7 72 ± 13 35 ± 135–6 h/night (n = 730) 243 ± 8 138 ± 6 8 ± 1 19 ± 3 16 ± 1 6 ± 1 43 ± 3 13 ± 27–8 h/night (n = 620) 191 ± 6 118 ± 5 8 ± 1 13 ± 2 16 ± 1 4 ± 1 28 ± 3 4 ± 1≥9 h/night (n = 21) 148 ± 25 75 ± 20 11 ± 9 7 ± 2 9 ± 4 17 ± 8 28 ± 10 1 ± 1
p-value <0.01 0.03 0.52 <0.01 0.18 0.05 <0.01 <0.01
Rank
Junior enlisted (n = 337) 197 ± 11 93 ± 8 10 ± 2 23 ± 5 11 ± 1 8 ± 2 39 ± 4 12 ± 3Senior enlisted (n = 705) 235 ± 8 126 ± 6 8 ± 1 20 ± 3 16 ± 1 6 ± 1 44 ± 3 15 ± 4Warrant officer (n = 34) 263 ± 39 149 ± 26 5 ± 3 16 ± 9 24 ± 7 5 ± 3 40 ± 14 25 ± 17Junior officer (n = 214) 210 ± 11 145 ± 9 5 ± 1 7 ± 1 17 ± 2 2 ± 1 31 ± 6 3 ± 1Senior officer (n = 175) 256 ± 13 191 ± 12 14 ± 3 14 ± 3 22 ± 3 3 ± 2 10 ± 3 3 ± 1
p-value <0.01 <0.01 <0.01 0.06 <0.01 0.05 <0.01 0.09
SpecialOperations
No (n = 1419) 227 ± 5 130 ± 4 8 ± 1 18 ± 2 16 ± 1 5 ± 1 37 ± 2 11 ± 2Yes (n = 40) 198 ± 23 120 ± 22 5 ± 2 10 ± 3 17 ± 5 1 ± 0 41 ± 10 4 ± 4
p-value 0.38 0.69 0.49 0.45 0.82 0.22 0.72 0.52
ServiceNavy (n = 619) 217 ± 7 136 ± 6 10 ± 1 15 ± 2 17 ± 1 4 ± 1 29 ± 3 7 ± 1
Marine Corps (n = 846) 232 ± 7 125 ± 5 7 ± 1 21 ± 3 15 ± 1 6 ± 1 43 ± 2 14 ± 3
p-value 0.14 0.17 0.09 0.09 0.42 0.06 <0.01 0.07
Abbreviations: SE = standard error.
Nutrients 2016, 8, 620 10 of 27
There was a positive relationship between alcohol and caffeine consumption, driven primarilyby coffee and energy drink consumption. SMs who reported abstaining from alcohol consumedthe least amount of caffeine while the category of SMs who reported drinking the most alcohol(gm/day) consumed the most caffeine. In addition, SMs who reported performing the shortest weeklyduration of aerobic exercise consumed more caffeine from cola. Overall caffeine consumption washighest among those reporting the shortest weekly duration of resistance training due primarily tohigher consumption from coffee and cola, but energy drink consumption was highest among thosedoing the longest weekly duration of resistance exercise. There was an inverse relationship betweensleep duration and using any caffeine products. Overall caffeine consumption increased as nightlysleep duration decreased due to consumption from coffee, other teas, energy drinks, and caffeinatedgums/medications.
Senior enlisted, warrant officers, and senior officers consumed more caffeine products than juniorenlisted and junior officers, primarily due to differences in caffeine consumption from coffee and cola.Compared with those of other ranks, senior officers consumed more caffeine from hot tea and lessfrom energy drinks. Special operations assignments had little relationship with caffeine consumption.Marine Corps personnel consumed more caffeine from energy drinks than Navy personnel.
3.3. Characteristics Independently Associated with Caffeine Use
Table 4 shows the results of the multivariable logistic regression examining characteristicsassociated with caffeine use ≥1 time per week. Characteristics independently associated with overallcaffeine use included older age, White race/ethnicity, higher alcohol consumption, and shorterweekly duration of resistance training. Drinking coffee was independently associated with beingmale, older age, higher education level, race/ethnicity other than Black, higher BMI, and higheralcohol consumption. Drinking tea was independently associated with female gender and higheralcohol consumption. Drinking soda was associated with being male, older age, White and “Other”race/ethnicity, and a shorter weekly duration of resistance training. Consuming energy drinks wasassociated with being male, younger age, lower education level, White race/ethnicity, higher BMI,higher alcohol consumption, shorter sleep duration, and service in the Marine Corps. Caffeinatedgum/medication use was independently associated with being female, higher BMI, and a longerweekly duration of aerobic training.
3.4. Caffeine Consumption by Age and Gender
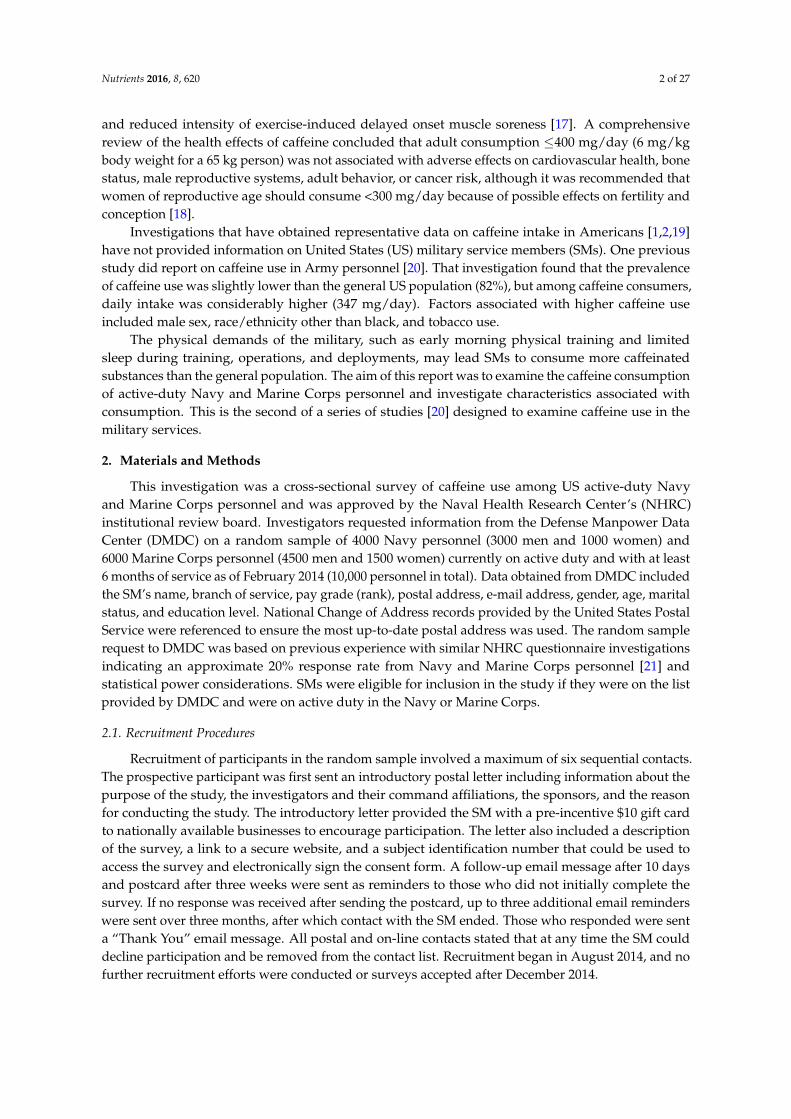
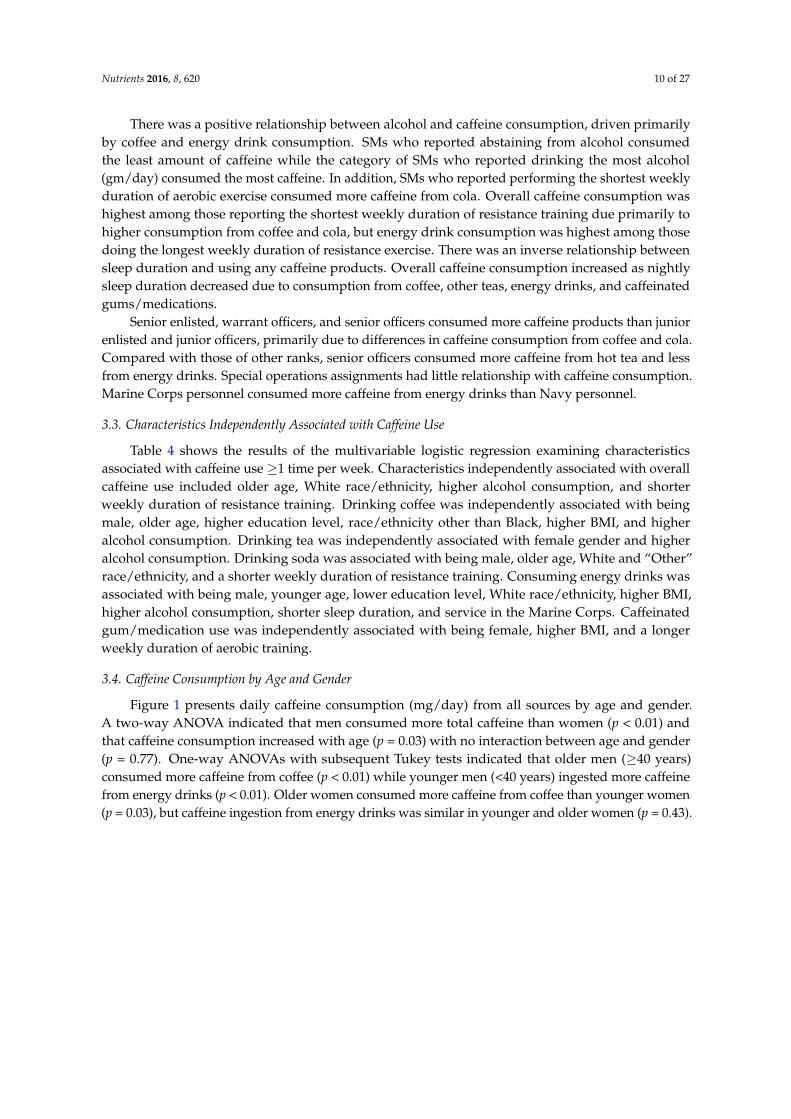
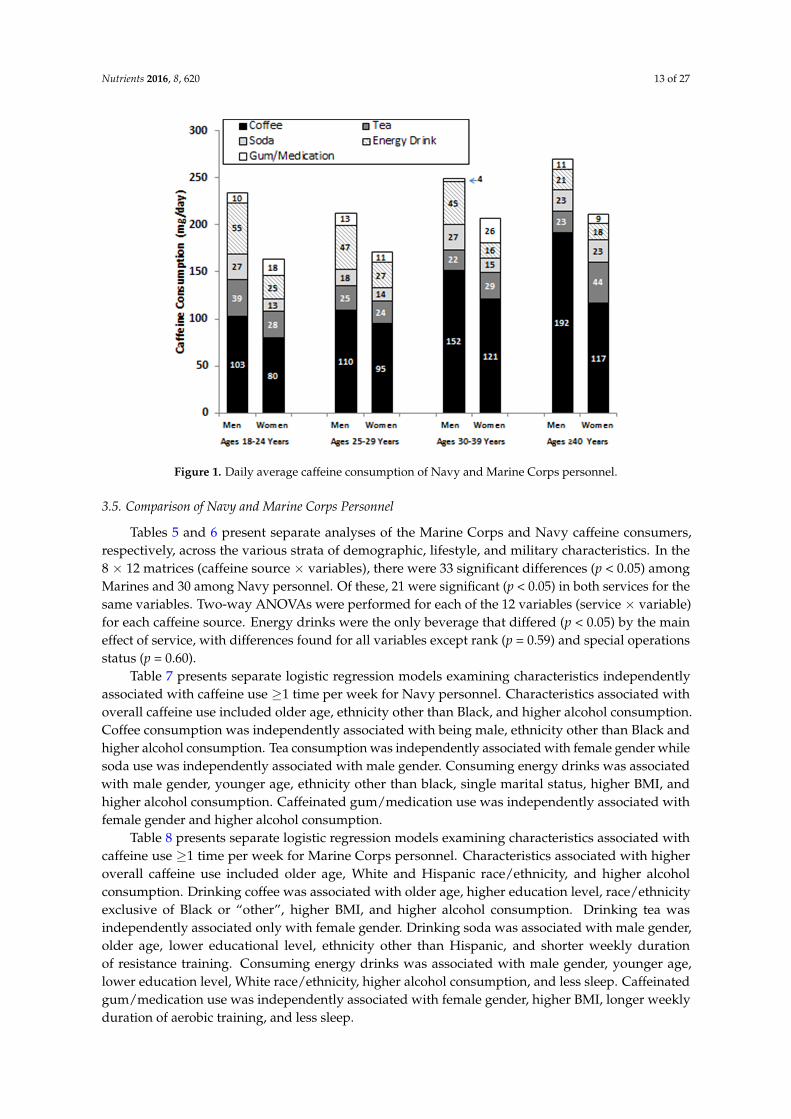
Figure 1 presents daily caffeine consumption (mg/day) from all sources by age and gender.A two-way ANOVA indicated that men consumed more total caffeine than women (p < 0.01) andthat caffeine consumption increased with age (p = 0.03) with no interaction between age and gender(p = 0.77). One-way ANOVAs with subsequent Tukey tests indicated that older men (≥40 years)consumed more caffeine from coffee (p < 0.01) while younger men (<40 years) ingested more caffeinefrom energy drinks (p < 0.01). Older women consumed more caffeine from coffee than younger women(p = 0.03), but caffeine ingestion from energy drinks was similar in younger and older women (p = 0.43).

Nutrients 2016, 8, 620 11 of 27
Table 4. Characteristics associated with use (≥1 time/week) of specific caffeine products among Navy and Marine Corps personnel. Multivariable logistic regressionwas used. Data are presented as odds ratios adjusted for other factors listed with 95% confidence intervals. The odds ratio 1.00 represents the reference group foreach variable.
Variable StrataCaffeine Beverage or Gum/Medication Consumed ≥1 Time/Week
Any Caffeine Coffee Tea * Soda † Energy Drink Gum/Medication
(Model 1) (Model 2) (Model 3) (Model 4) (Model 5) (Model 6)
GenderMen 1.00 1.00 1.00 1.00 1.00 1.00
Women 0.83 (0.57–1.20) 0.72 (0.55–0.94) 1.47 (1.14–1.91) 0.60 (0.46–0.77) 0.57 (0.42–0.78) 2.60 (1.67–4.06)
Age (years)
18–24 1.00 1.00 1.00 1.00 1.00 1.0025–29 2.01 (1.27–3.18) 1.19 (0.86–1.65) 0.96 (0.69–1.32) 1.09 (0.79–1.49) 1.28 (0.91–1.80) 0.63 (0.35–1.13)30–39 2.28 (1.40–3.70) 1.76 (1.25–2.49) 0.97 (0.70–1.35) 1.47 (1.06–2.02) 0.92 (0.64–1.32) 1.00 (0.57–1.74)≥40 3.30 (1.67–6.55) 1.56 (1.02–2.40) 1.06 (0.71–1.60) 1.23 (0.83–1.82) 0.43 (0.27–0.71) 1.70 (0.88–3.28)
EducationSome high school/high school graduate 1.00 1.00 1.00 1.00 1.00 1.00
Some college 1.09 (0.74–1.61) 1.29 (0.96–1.72) 0.98 (0.73–1.31) 0.87 (0.66–1.16) 1.27 (0.93–1.73) 1.21 (0.74–2.00)College degree 1.18 (0.70–2.00) 1.73 (1.21–2.48) 0.86 (0.61–1.21) 0.81 (0.58–1.13) 0.62 (0.42–0.91) 0.77 (0.41–1.43)
Marital statusSingle 1.00 1.00 1.00 1.00 1.00 1.00
Married 1.20 (0.84–1.71) 1.17 (0.91–1.52) 0.99 (0.77–1.27) 1.18 (0.93–1.50) 0.90 (0.69–1.18) 1.10 (0.72–1.68)
Race/ethnicity
White 1.00 1.00 1.00 1.00 1.00 1.00Black 0.31 (0.20–0.49) 0.34 (0.24–0.48) 0.96 (0.68–1.36) 0.70 (0.50–0.98) 0.52 (0.35–0.79) 0.86 (0.50–1.48)
Hispanic 0.56 (0.37–0.86) 1.00 (0.72–1.36) 0.89 (0.66–1.21) 0.61 (0.46–0.83) 0.56 (0.40–0.78) 0.74 (0.43–1.28)Other 0.47 (0.28–0.78) 0.68 (0.47–1.00) 1.39 (0.97–2.00) 0.76 (0.53–1.09) 0.62 (0.40–0.96) 0.52 (0.24–1.11)
Body mass index(kg/m2)
<25.0 1.00 1.00 1.00 1.00 1.00 1.0025.0–29.9 0.94 (0.66–1.35) 1.49 (1.16–1.91) 0.94 (0.74–1.19) 0.93 (0.73–1.17) 1.40 (1.08–1.83) 1.43 (0.93–2.21)≥30.0 1.37 (0.70–2.68) 1.40 (0.91–2.14) 0.84 (0.56–1.26) 0.81 (0.55–1.19) 1.55 (1.00–2.41) 2.22 (1.19–4.16)
Alcoholconsumption
None 1.00 1.00 1.00 1.00 1.00 1.00<1.33 g/day 1.73 (1.12–2.70) 1.53 (1.11–2.13) 1.22 (0.88–1.70) 1.07 (0.78–1.47) 1.75 (1.20–2.55) 1.29 (0.74–2.25)
1.33–3.99 g/day 2.52 (1.53–4.13) 2.20 (1.57–3.09) 1.15 (0.82–1.61) 1.10 (0.80–1.52) 1.40 (0.96–2.04) 1.18 (0.66–2.09)4.00–8.91 g/day 2.46 (1.48–4.08) 2.65 (1.86–3.76) 1.52 (1.09–2.13) 0.98 (0.71–1.35) 1.60 (1.09–2.35) 0.88 (0.47–1.65)≥8.92 g/day 3.26 (1.90–5.59) 3.07 (2.14–4.39) 1.33 (0.94–1.87) 1.30 (0.94–1.80) 1.82 (1.25–2.66) 1.57 (0.89–2.76)
Aerobic exerciseduration
<101 min/week 0.82 (0.54–1.33) 0.82 (0.58–1.16) 1.00 (0.72–1.38) 1.17 (0.86–1.61) 1.03 (0.72–1.47) 0.57 (0.33–0.99)101–180 min/week 0.95 (0.58–1.56) 0.80 (0.57–1.13) 0.84 (0.60–1.17) 1.21 (0.88–1.66) 0.94 (0.65–1.35) 0.53 (0.30–0.94)181–290 min/week 0.92 (0.57–1.47) 0.89 (0.64–1.24) 1.11 (0.81–1.52) 1.05 (0.77–1.42) 0.99 (0.70–1.39) 0.72 (0.43–1.19)≥291 min/week 1.00 1.00 1.00 1.00 1.00 1.00

Nutrients 2016, 8, 620 12 of 27
Table 4. Cont.
Variable StrataCaffeine Beverage or Gum/Medication Consumed ≥1 Time/Week
Any Caffeine Coffee Tea * Soda † Energy Drink Gum/Medication
(Model 1) (Model 2) (Model 3) (Model 4) (Model 5) (Model 6)
Resistance trainingduration
<46 min/week 1.69 (1.04–2.76) 1.07 (0.74–1.53) 0.99 (0.70–1.39) 1.60 (1.14–2.23) 0.78 (0.54–1.14) 0.98 (0.55–1.75)46–135 min/week 1.70 (1.05–2.77) 1.39 (0.99–1.96) 0.92 (0.66–1.27) 1.55 (1.13–2.12) 1.08 (0.76–1.53) 0.75 (0.43–1.33)
136–270 min/week 1.22 (0.77–1.93) 0.99 (0.70–1.39) 0.82 (0.59–1.15) 1.14 (0.83–1.58) 0.95 (0.67–1.36) 0.88 (0.50–1.55)≥271 min/week 1.00 1.00 1.00 1.00 1.00 1.00
Sleep duration
≤4 h/night 1.51 (0.46–4.90) 0.82 (0.31–2.16) 1.48 (0.55–4.00) 2.59 (0.96–7.00) 3.18 (1.08–9.38) 1.70 (0.41–7.04)5–6 h/night 1.90 (0.72–5.01) 1.30 (0.57–2.98) 1.27 (0.54–2.97) 2.14 (0.91–5.06) 1.65 (0.63–4.30) 0.98 (0.28–3.46)7–8 h/night 1.00 1.00 1.00 1.00 1.00 1.00≥9 h/night 1.30 (0.49–3.43) 1.06 (0.46–2.43) 1.38 (0.59–3.24) 1.70 (0.72–4.02) 0.92 (0.35–2.41) 0.56 (0.15–2.00)
ServiceMarine Corps 1.02 (0.72–1.46) 0.99 (0.78–1.27) 0.80 (0.64–1.01) 0.94 (0.75–1.17) 1.71 (1.32–2.22) 0.83 (0.56–1.24)
Navy 1.00 1.00 1.00 1.00 1.00 1.00
Nagelkerke R2 0.15 0.16 0.03 0.08 0.16 0.09
* Includes hot and other teas. † Includes cola-type beverages and other sodas.
Nutrients 2016, 8, 620 13 of 27
Nutrients 2016, 8, 620 13 of 29
Figure 1. Daily average caffeine consumption of Navy and Marine Corps personnel.
3.5. Comparison of Navy and Marine Corps Personnel
Tables 5 and 6 present separate analyses of the Marine Corps and Navy caffeine consumers,
respectively, across the various strata of demographic, lifestyle, and military characteristics. In the 8
× 12 matrices (caffeine source × variables), there were 33 significant differences (p < 0.05) among
Marines and 30 among Navy personnel. Of these, 21 were significant (p < 0.05) in both services for
the same variables. Two‐way ANOVAs were performed for each of the 12 variables (service × variable)
for each caffeine source. Energy drinks were the only beverage that differed (p < 0.05) by the main
effect of service, with differences found for all variables except rank (p = 0.59) and special operations
status (p = 0.60).
Table 7 presents separate logistic regression models examining characteristics independently
associated with caffeine use ≥1 time per week for Navy personnel. Characteristics associated with
overall caffeine use included older age, ethnicity other than Black, and higher alcohol consumption.
Coffee consumption was independently associated with being male, ethnicity other than Black and
higher alcohol consumption. Tea consumption was independently associated with female gender
while soda use was independently associated with male gender. Consuming energy drinks was
associated with male gender, younger age, ethnicity other than black, single marital status, higher
BMI, and higher alcohol consumption. Caffeinated gum/medication use was independently
associated with female gender and higher alcohol consumption.
Table 8 presents separate logistic regression models examining characteristics associated with
caffeine use ≥1 time per week for Marine Corps personnel. Characteristics associated with higher
overall caffeine use included older age, White and Hispanic race/ethnicity, and higher alcohol
consumption. Drinking coffee was associated with older age, higher education level, race/ethnicity
exclusive of Black or “other”, higher BMI, and higher alcohol consumption. Drinking tea was
independently associated only with female gender. Drinking soda was associated with male gender,
older age, lower educational level, ethnicity other than Hispanic, and shorter weekly duration of
resistance training. Consuming energy drinks was associated with male gender, younger age, lower
education level, White race/ethnicity, higher alcohol consumption, and less sleep. Caffeinated
gum/medication use was independently associated with female gender, higher BMI, longer weekly
duration of aerobic training, and less sleep.
Figure 1. Daily average caffeine consumption of Navy and Marine Corps personnel.
3.5. Comparison of Navy and Marine Corps Personnel
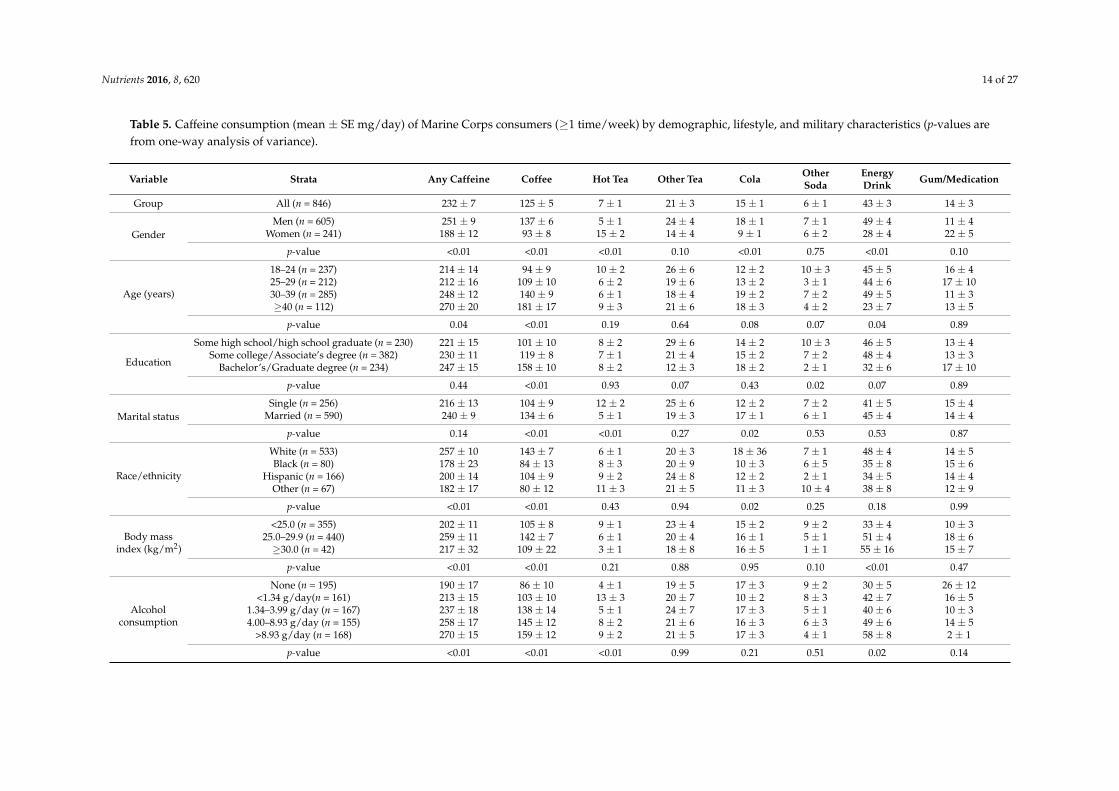
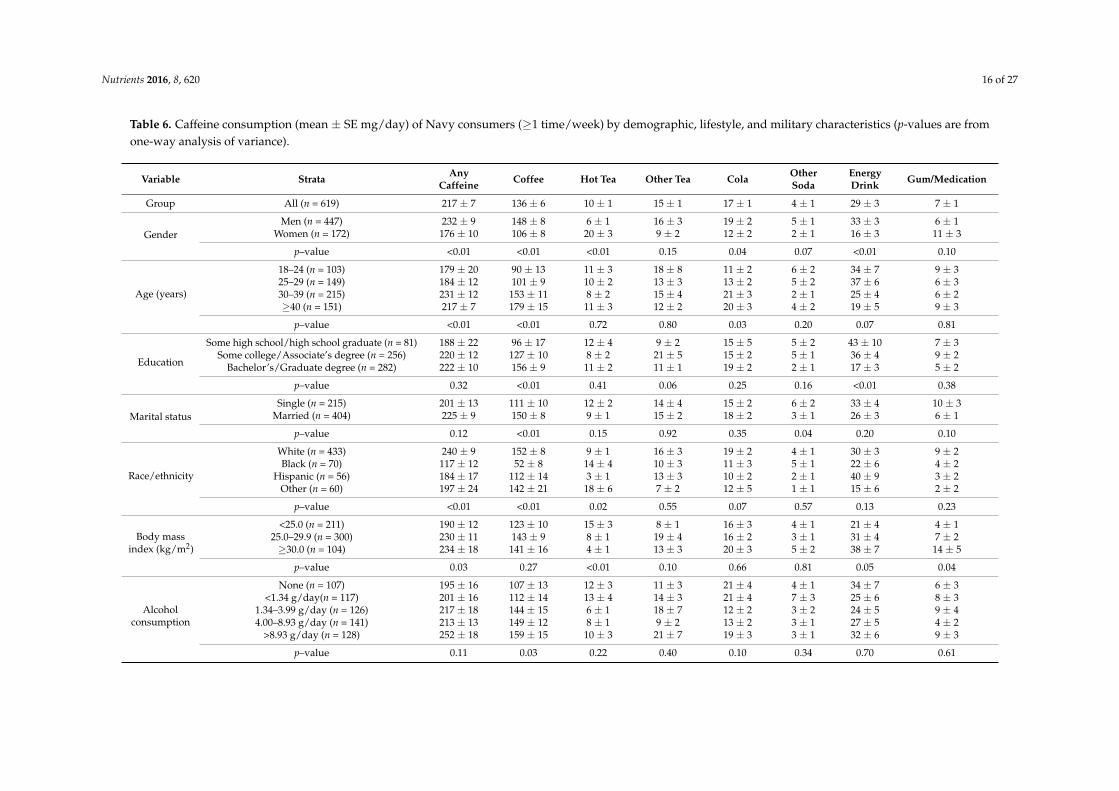
Tables 5 and 6 present separate analyses of the Marine Corps and Navy caffeine consumers,respectively, across the various strata of demographic, lifestyle, and military characteristics. In the8 × 12 matrices (caffeine source × variables), there were 33 significant differences (p < 0.05) amongMarines and 30 among Navy personnel. Of these, 21 were significant (p < 0.05) in both services for thesame variables. Two-way ANOVAs were performed for each of the 12 variables (service × variable)for each caffeine source. Energy drinks were the only beverage that differed (p < 0.05) by the maineffect of service, with differences found for all variables except rank (p = 0.59) and special operationsstatus (p = 0.60).
Table 7 presents separate logistic regression models examining characteristics independentlyassociated with caffeine use ≥1 time per week for Navy personnel. Characteristics associated withoverall caffeine use included older age, ethnicity other than Black, and higher alcohol consumption.Coffee consumption was independently associated with being male, ethnicity other than Black andhigher alcohol consumption. Tea consumption was independently associated with female gender whilesoda use was independently associated with male gender. Consuming energy drinks was associatedwith male gender, younger age, ethnicity other than black, single marital status, higher BMI, andhigher alcohol consumption. Caffeinated gum/medication use was independently associated withfemale gender and higher alcohol consumption.
Table 8 presents separate logistic regression models examining characteristics associated withcaffeine use ≥1 time per week for Marine Corps personnel. Characteristics associated with higheroverall caffeine use included older age, White and Hispanic race/ethnicity, and higher alcoholconsumption. Drinking coffee was associated with older age, higher education level, race/ethnicityexclusive of Black or “other”, higher BMI, and higher alcohol consumption. Drinking tea wasindependently associated only with female gender. Drinking soda was associated with male gender,older age, lower educational level, ethnicity other than Hispanic, and shorter weekly durationof resistance training. Consuming energy drinks was associated with male gender, younger age,lower education level, White race/ethnicity, higher alcohol consumption, and less sleep. Caffeinatedgum/medication use was independently associated with female gender, higher BMI, longer weeklyduration of aerobic training, and less sleep.
Nutrients 2016, 8, 620 14 of 27
Table 5. Caffeine consumption (mean ± SE mg/day) of Marine Corps consumers (≥1 time/week) by demographic, lifestyle, and military characteristics (p-values arefrom one-way analysis of variance).
Variable Strata Any Caffeine Coffee Hot Tea Other Tea Cola OtherSoda
EnergyDrink Gum/Medication
Group All (n = 846) 232 ± 7 125 ± 5 7 ± 1 21 ± 3 15 ± 1 6 ± 1 43 ± 3 14 ± 3
GenderMen (n = 605) 251 ± 9 137 ± 6 5 ± 1 24 ± 4 18 ± 1 7 ± 1 49 ± 4 11 ± 4
Women (n = 241) 188 ± 12 93 ± 8 15 ± 2 14 ± 4 9 ± 1 6 ± 2 28 ± 4 22 ± 5
p-value <0.01 <0.01 <0.01 0.10 <0.01 0.75 <0.01 0.10
Age (years)
18–24 (n = 237) 214 ± 14 94 ± 9 10 ± 2 26 ± 6 12 ± 2 10 ± 3 45 ± 5 16 ± 425–29 (n = 212) 212 ± 16 109 ± 10 6 ± 2 19 ± 6 13 ± 2 3 ± 1 44 ± 6 17 ± 1030–39 (n = 285) 248 ± 12 140 ± 9 6 ± 1 18 ± 4 19 ± 2 7 ± 2 49 ± 5 11 ± 3≥40 (n = 112) 270 ± 20 181 ± 17 9 ± 3 21 ± 6 18 ± 3 4 ± 2 23 ± 7 13 ± 5
p-value 0.04 <0.01 0.19 0.64 0.08 0.07 0.04 0.89
Education
Some high school/high school graduate (n = 230) 221 ± 15 101 ± 10 8 ± 2 29 ± 6 14 ± 2 10 ± 3 46 ± 5 13 ± 4Some college/Associate’s degree (n = 382) 230 ± 11 119 ± 8 7 ± 1 21 ± 4 15 ± 2 7 ± 2 48 ± 4 13 ± 3
Bachelor’s/Graduate degree (n = 234) 247 ± 15 158 ± 10 8 ± 2 12 ± 3 18 ± 2 2 ± 1 32 ± 6 17 ± 10
p-value 0.44 <0.01 0.93 0.07 0.43 0.02 0.07 0.89
Marital statusSingle (n = 256) 216 ± 13 104 ± 9 12 ± 2 25 ± 6 12 ± 2 7 ± 2 41 ± 5 15 ± 4
Married (n = 590) 240 ± 9 134 ± 6 5 ± 1 19 ± 3 17 ± 1 6 ± 1 45 ± 4 14 ± 4
p-value 0.14 <0.01 <0.01 0.27 0.02 0.53 0.53 0.87
Race/ethnicity
White (n = 533) 257 ± 10 143 ± 7 6 ± 1 20 ± 3 18 ± 36 7 ± 1 48 ± 4 14 ± 5Black (n = 80) 178 ± 23 84 ± 13 8 ± 3 20 ± 9 10 ± 3 6 ± 5 35 ± 8 15 ± 6
Hispanic (n = 166) 200 ± 14 104 ± 9 9 ± 2 24 ± 8 12 ± 2 2 ± 1 34 ± 5 14 ± 4Other (n = 67) 182 ± 17 80 ± 12 11 ± 3 21 ± 5 11 ± 3 10 ± 4 38 ± 8 12 ± 9
p-value <0.01 <0.01 0.43 0.94 0.02 0.25 0.18 0.99
Body massindex (kg/m2)
<25.0 (n = 355) 202 ± 11 105 ± 8 9 ± 1 23 ± 4 15 ± 2 9 ± 2 33 ± 4 10 ± 325.0–29.9 (n = 440) 259 ± 11 142 ± 7 6 ± 1 20 ± 4 16 ± 1 5 ± 1 51 ± 4 18 ± 6≥30.0 (n = 42) 217 ± 32 109 ± 22 3 ± 1 18 ± 8 16 ± 5 1 ± 1 55 ± 16 15 ± 7
p-value <0.01 <0.01 0.21 0.88 0.95 0.10 <0.01 0.47
Alcoholconsumption
None (n = 195) 190 ± 17 86 ± 10 4 ± 1 19 ± 5 17 ± 3 9 ± 2 30 ± 5 26 ± 12<1.34 g/day(n = 161) 213 ± 15 103 ± 10 13 ± 3 20 ± 7 10 ± 2 8 ± 3 42 ± 7 16 ± 5
1.34–3.99 g/day (n = 167) 237 ± 18 138 ± 14 5 ± 1 24 ± 7 17 ± 3 5 ± 1 40 ± 6 10 ± 34.00–8.93 g/day (n = 155) 258 ± 17 145 ± 12 8 ± 2 21 ± 6 16 ± 3 6 ± 3 49 ± 6 14 ± 5
>8.93 g/day (n = 168) 270 ± 15 159 ± 12 9 ± 2 21 ± 5 17 ± 3 4 ± 1 58 ± 8 2 ± 1
p-value <0.01 <0.01 <0.01 0.99 0.21 0.51 0.02 0.14

Nutrients 2016, 8, 620 15 of 27
Table 5. Cont.
Variable Strata Any Caffeine Coffee Hot Tea Other Tea Cola OtherSoda
EnergyDrink Gum/Medication
Aerobicexerciseduration
<101 min/week (n = 191) 234 ± 15 126 ± 10 7 ± 2 17 ± 5 18 ± 2 8 ± 3 50 ± 7 6 ± 3101–180 min/week (n = 192) 237 ± 14 130 ± 11 5 ± 1 24 ± 8 16 ± 3 7 ± 2 42 ± 6 13 ± 4181–290 min/week (n = 230) 238 ± 14 129 ± 11 9 ± 2 22 ± 5 16 ± 2 5 ± 2 44 ± 5 13 ± 4≥291 min/week (n = 229) 224 ± 16 117 ± 10 8 ± 2 20 ± 5 12 ± 2 5 ± 2 39 ± 5 23 ± 10
p-value 0.89 0.80 0.32 0.85 0.16 0.65 0.58 0.28
Resistancetrainingduration
<46 min/week (n = 173) 273 ± 19 155 ± 15 9 ± 2 23 ± 6 21 ± 3 11 ± 3 42 ± 7 12 ± 446–135 min/week (n = 222) 225 ± 14 123 ± 10 5 ± 1 25 ± 7 14 ± 2 6 ± 2 43 ± 6 9 ± 3
136–270 min/week (n = 219) 208 ± 12 122 ± 10 8 ± 2 12 ± 2 15 ± 2 4 ± 1 35 ± 4 11 ± 3≥271 min/week (n = 224) 235 ± 16 107 ± 8 9 ± 2 24 ± 6 12 ± 2 6 ± 2 52 ± 6 25 ± 11
p-value 0.03 0.02 0.22 0.26 0.03 0.21 0.22 0.21
Sleep duration
≤4 h/night (n = 41) 378 ± 53 151 ± 41 15 ± 8 67 ± 26 23 ± 6 12 ± 9 71 ± 15 39 ± 175–6 h/night (n = 437) 249 ± 10 132 ± 7 7 ± 1 22 ± 4 15 ± 1 7 ± 2 52 ± 4 15 ± 37–8 h/night (n = 333) 187 ± 9 111 ± 7 8 ± 1 14 ± 3 16 ± 2 4 ± 1 30 ± 4 4 ± 2≥9 h/night (n = 10) 141 ± 44 63 ± 19 0 ± 0 7 ± 3 7 ± 5 27 ± 15 35 ± 10 3 ± 3
p-value <0.01 0.08 0.14 <0.01 0.36 0.05 <0.01 <0.01
Rank
Junior enlisted (n = 222) 206 ± 15 89 ± 10 10 ± 2 30 ± 7 11 ± 2 9 ± 2 45 ± 5 13 ± 4Senior enlisted (n = 424) 243 ± 11 124 ± 7 7 ± 1 21 ± 4 17 ± 2 7 ± 2 48 ± 4 19 ± 6Warrant officer (n = 30) 283 ± 43 163 ± 28 6 ± 4 15 ± 10 24 ± 8 5 ± 4 44 ± 16 27 ± 19Junior officer (n = 104) 217 ± 17 154 ± 14 5 ± 1 6 ± 1 13 ± 2 2 ± 1 37 ± 10 1 ± 1Senior officer (n = 66) 253 ± 20 187 ± 19 11 ± 5 14 ± 8 23 ± 5 1 ± 1 18 ± 60 1 ± 1
p-value 0.13 <0.01 0.30 0.12 0.02 0.25 0.08 0.23
SpecialOperations
No (n = 827) 233 ± 8 125 ± 5 7 ± 1 21 ± 3 15 ± 1 6 ± 1 44 ± 3 14 ± 3Yes (n = 16) 216 ± 48 154 ± 42 7 ± 5 9 ± 5 21 ± 7 1 ± 1 24 ± 10 0 ± 0
p-value 0.75 0.45 0.99 0.54 0.50 0.43 0.36 0.53
Abbreviation: SE=standard error
Nutrients 2016, 8, 620 16 of 27
Table 6. Caffeine consumption (mean ± SE mg/day) of Navy consumers (≥1 time/week) by demographic, lifestyle, and military characteristics (p-values are fromone-way analysis of variance).
Variable Strata AnyCaffeine Coffee Hot Tea Other Tea Cola Other
SodaEnergyDrink Gum/Medication
Group All (n = 619) 217 ± 7 136 ± 6 10 ± 1 15 ± 1 17 ± 1 4 ± 1 29 ± 3 7 ± 1
GenderMen (n = 447) 232 ± 9 148 ± 8 6 ± 1 16 ± 3 19 ± 2 5 ± 1 33 ± 3 6 ± 1
Women (n = 172) 176 ± 10 106 ± 8 20 ± 3 9 ± 2 12 ± 2 2 ± 1 16 ± 3 11 ± 3
p–value <0.01 <0.01 <0.01 0.15 0.04 0.07 <0.01 0.10
Age (years)
18–24 (n = 103) 179 ± 20 90 ± 13 11 ± 3 18 ± 8 11 ± 2 6 ± 2 34 ± 7 9 ± 325–29 (n = 149) 184 ± 12 101 ± 9 10 ± 2 13 ± 3 13 ± 2 5 ± 2 37 ± 6 6 ± 330–39 (n = 215) 231 ± 12 153 ± 11 8 ± 2 15 ± 4 21 ± 3 2 ± 1 25 ± 4 6 ± 2≥40 (n = 151) 217 ± 7 179 ± 15 11 ± 3 12 ± 2 20 ± 3 4 ± 2 19 ± 5 9 ± 3
p–value <0.01 <0.01 0.72 0.80 0.03 0.20 0.07 0.81
Education
Some high school/high school graduate (n = 81) 188 ± 22 96 ± 17 12 ± 4 9 ± 2 15 ± 5 5 ± 2 43 ± 10 7 ± 3Some college/Associate’s degree (n = 256) 220 ± 12 127 ± 10 8 ± 2 21 ± 5 15 ± 2 5 ± 1 36 ± 4 9 ± 2
Bachelor’s/Graduate degree (n = 282) 222 ± 10 156 ± 9 11 ± 2 11 ± 1 19 ± 2 2 ± 1 17 ± 3 5 ± 2
p–value 0.32 <0.01 0.41 0.06 0.25 0.16 <0.01 0.38
Marital statusSingle (n = 215) 201 ± 13 111 ± 10 12 ± 2 14 ± 4 15 ± 2 6 ± 2 33 ± 4 10 ± 3
Married (n = 404) 225 ± 9 150 ± 8 9 ± 1 15 ± 2 18 ± 2 3 ± 1 26 ± 3 6 ± 1
p–value 0.12 <0.01 0.15 0.92 0.35 0.04 0.20 0.10
Race/ethnicity
White (n = 433) 240 ± 9 152 ± 8 9 ± 1 16 ± 3 19 ± 2 4 ± 1 30 ± 3 9 ± 2Black (n = 70) 117 ± 12 52 ± 8 14 ± 4 10 ± 3 11 ± 3 5 ± 1 22 ± 6 4 ± 2
Hispanic (n = 56) 184 ± 17 112 ± 14 3 ± 1 13 ± 3 10 ± 2 2 ± 1 40 ± 9 3 ± 2Other (n = 60) 197 ± 24 142 ± 21 18 ± 6 7 ± 2 12 ± 5 1 ± 1 15 ± 6 2 ± 2
p–value <0.01 <0.01 0.02 0.55 0.07 0.57 0.13 0.23
Body massindex (kg/m2)
<25.0 (n = 211) 190 ± 12 123 ± 10 15 ± 3 8 ± 1 16 ± 3 4 ± 1 21 ± 4 4 ± 125.0–29.9 (n = 300) 230 ± 11 143 ± 9 8 ± 1 19 ± 4 16 ± 2 3 ± 1 31 ± 4 7 ± 2≥30.0 (n = 104) 234 ± 18 141 ± 16 4 ± 1 13 ± 3 20 ± 3 5 ± 2 38 ± 7 14 ± 5
p–value 0.03 0.27 <0.01 0.10 0.66 0.81 0.05 0.04
Alcoholconsumption
None (n = 107) 195 ± 16 107 ± 13 12 ± 3 11 ± 3 21 ± 4 4 ± 1 34 ± 7 6 ± 3<1.34 g/day(n = 117) 201 ± 16 112 ± 14 13 ± 4 14 ± 3 21 ± 4 7 ± 3 25 ± 6 8 ± 3
1.34–3.99 g/day (n = 126) 217 ± 18 144 ± 15 6 ± 1 18 ± 7 12 ± 2 3 ± 2 24 ± 5 9 ± 44.00–8.93 g/day (n = 141) 213 ± 13 149 ± 12 8 ± 1 9 ± 2 13 ± 2 3 ± 1 27 ± 5 4 ± 2
>8.93 g/day (n = 128) 252 ± 18 159 ± 15 10 ± 3 21 ± 7 19 ± 3 3 ± 1 32 ± 6 9 ± 3
p–value 0.11 0.03 0.22 0.40 0.10 0.34 0.70 0.61

Nutrients 2016, 8, 620 17 of 27
Table 6. Cont.
Variable Strata AnyCaffeine Coffee Hot Tea Other Tea Cola Other
SodaEnergyDrink Gum/Medication
Aerobicexerciseduration
<101 min/week (n = 170) 216 ± 13 132 ± 11 9 ± 2 14 ± 2 21 ± 3 2 ± 1 29 ± 5 9 ± 3101–180 min/week (n = 151) 210 ± 13 132 ± 12 13 ± 3 11 ± 2 22 ± 4 5 ± 2 25 ± 5 4 ± 2181–290 min/week (n = 178) 229 ± 15 152 ± 12 9 ± 2 20 ± 7 11 ± 2 4 ± 2 27 ± 5 6 ± 2≥291 min/week (n = 118) 210 ± 18 124 ± 15 9 ± 2 12 ± 2 14 ± 2 5 ± 2 35 ± 6 12 ± 4
p–value 0.78 0.43 0.55 0.41 0.02 0.50 0.62 0.17
Resistancetrainingduration
<46 min/week (n = 191) 238 ± 13 159 ± 12 10 ± 2 13 ± 2 21 ± 3 3 ± 1 23 ± 5 9 ± 346–135 min/week (n = 204) 205 ± 11 129 ± 10 10 ± 2 13 ± 2 18 ± 2 5 ± 2 26 ± 4 4 ± 1
136–270 min/week (n = 123) 222 ± 20 137 ± 16 12 ± 3 20 ± 7 13 ± 3 2 ± 1 32 ± 6 7 ± 3≥271 min/week (n = 95) 192 ± 18 104 ± 11 6 ± 2 16 ± 9 10 ± 2 6 ± 3 40 ± 7 10 ± 4
p–value 0.14 0.03 0.44 0.66 0.04 0.28 0.16 0.46
Sleep duration
≤4 h/night (n = 14) 353 ± 93 143 ± 65 7 ± 7 69 ± 59 30 ± 13 3 ± 2 76 ± 29 24 ± 145–6 h/night (n = 293) 234 ± 11 148 ± 10 10 ± 2 15 ± 3 19 ± 2 4 ± 1 29 ± 3 10 ± 27–8 h/night (n = 287) 197 ± 9 127 ± 8 9 ± 1 12 ± 2 15 ± 2 4 ± 1 25 ± 4 4 ± 1≥9 h/night (n = 11) 155 ± 30 86 ± 34 20 ± 17 7 ± 3 10 ± 7 9 ± 6 22 ± 11 0 ± 0
p–value <0.01 0.29 0.53 <0.01 0.32 0.82 0.02 0.04
Rank
Junior enlisted(n = 115) 179 ± 17 101 ± 13 10 ± 2 11 ± 2 12 ± 2 6 ± 2 29 ± 6 9 ± 4Senior enlisted (n = 281) 223 ± 12 129 ± 9 9 ± 1 19 ± 4 16 ± 2 4 ± 1 38 ± 4 8 ± 2Warrant officer (n = 4) 112 ± 41 50 ± 43 0 ± 0 24 ± 23 24 ± 19 0 ± 0 3 ± 3 11 ± 11Junior officer (n = 110) 203 ± 15 137 ± 13 4 ± 1 8 ± 2 21 ± 4 1 ± 0 26 ± 6 6 ± 3Senior officer (n = 109) 257 ± 17 193 ± 16 16 ± 4 13 ± 3 21 ± 4 4 ± 2 6 ± 2 4 ± 2
p–value <0.01 <0.01 0.06 0.38 0.28 0.28 <0.01 0.71
SpecialOperations
No (n = 592) 217 ± 8 138 ± 6 9 ± 1 15 ± 2 17 ± 1 4 ± 1 28 ± 3 7 ± 1Yes (n = 24) 187 ± 22 98 ± 24 4 ± 2 11 ± 4 15 ± 7 0 ± 0 52 ± 15 6 ± 6
p-value 0.42 0.22 0.32 0.73 0.77 0.32 0.06 0.92
Abbreviation: SE = standard error.

Nutrients 2016, 8, 620 18 of 27
Table 7. Characteristics associated with use (≥1 time/week) of specific caffeine products among Navy personnel. Multivariable logistic regression was used. Data arepresented as odds ratios adjusted for other factors listed with 95% confidence intervals. The odd ratio 1.00 represents the reference group for each variable.
Variable StrataCaffeine Beverage or Gum/Medication Consumed ≥1 Time/Week
Any Caffeine Coffee Tea * Soda † Energy Drink Gum/Medication
(Model 1) (Model 2) (Model 3) (Model 4) (Model 5) (Model 6)
GenderMen 1.00 1.00 1.00 1.00 1.00 1.00
Women 0.69 (0.35–1.38) 0.55 (0.35–0.86) 1.56 (1.04–2.34) 0.61 (0.41–0.91) 0.43 (0.25–0.75) 2.57 (1.31–5.06)
Age (years)
18–24 1.00 1.00 1.00 1.00 1.00 1.0025–29 2.00 (0.82–4.87) 1.27 (0.72–2.24) 1.07 (0.63–1.83) 1.29 (0.77–2.19) 1.58 (0.84–2.96) 0.82 (0.33–2.06)30–39 2.23 (0.91–5.04) 1.77 (0.98–3.18) 1.14 (0.66–1.98) 1.15 (0.67–1.96) 0.86 (0.43–1.67) 1.12 (0.45–2.79)≥40 3.23 (1.01–5.45) 1.52 (0.78–2.96) 1.25 (0.67–2.32) 1.03 (0.56–1.89) 0.31 (0.18–0.98) 1.91 (0.71–5.14)
EducationSome high school/high school graduate 1.00 1.00 1.00 1.00 1.00 1.00
Some college 1.40 (0.63–3.07) 1.65 (0.96–2.84) 0.88 (0.53–1.48) 1.58 (0.95–2.64) 1.49 (0.80–2.78) 0.83 (0.36–1.88)College degree 1.10 (0.42–2.46) 1.79 (1.02–2.54) 0.71 (0.41–1.25) 1.36 (0.78–2.36) 0.78 (0.39–1.57) 0.57 (0.22–1.43)
Marital statusSingle 1.00 1.00 1.00 1.00 1.00 1.00
Married 1.11 (0.59–2.07) 1.13 (0.75–1.70) 1.25 (0.86–1.83) 1.13 (0.78–1.63) 0.54 (0.34–0.84) 0.90 (0.48–1.68)
Race/ethnicity
White 1.00 1.00 1.00 1.00 1.00 1.00Black 0.14 (0.07–0.28) 0.24 (0.14–0.40) 0.73 (0.44–1.21) 0.63 (0.39–1.03) 0.34 (0.17–0.71) 0.68 (0.30–1.53)
Hispanic 0.66 (0.27–1.60) 1.13 (0.60–2.13) 1.02 (0.58–1.80) 0.82 (0.47–1.44) 0.96 (0.48–1.89) 0.42 (0.12–1.46)Other 0.90 (0.29–2.80) 0.87 (0.46–1.67) 1.24 (0.71–2.20) 0.73 (0.41–1.29) 0.78 (0.36–1.68) 0.58 (0.19–1.74)
Body mass index(kg/m2)
<25.0 1.00 1.00 1.00 1.00 1.00 1.0025.0–29.9 1.07 (0.57–2.00) 1.41 (0.94–2.13) 1.00 (0.69–1.45) 1.05 (0.73–1.51) 1.79 (1.11–2.91) 1.19 (0.62–2.29)≥30.0 1.93 (0.75–4.93) 1.23 (0.71–2.16) 0.85 (0.50–1.44) 1.02 (0.61–1.68) 2.21 (1.16–4.23) 1.84 (0.80–4.23)
Alcoholconsumption
None 1.00 1.00 1.00 1.00 1.00 1.00<1.33 g/day 2.32 (1.08–4.97) 1.08 (0.63–1.86) 0.96 (0.56–1.64) 1.11 (0.67–1.86) 1.53 (0.77–3.05) 1.49 (0.58–3.82)
1.33–3.99 g/day 4.38 (1.82–10.56) 1.86 (1.06–3.25) 1.23 (0.72–2.10) 0.93 (0.56–1.56) 1.09 (0.54–2.18) 2.00 (0.79–5.07)4.00–8.91 g/day 2.96 (1.28–6.86) 2.49 (1.40–4.43) 1.57 (0.93–2.65) 0.83 (0.50–1.37) 1.58 (0.81–3.09) 0.82 (0.28–2.36)≥8.92 g/day 6.66 (2.35–18.90) 2.66 (1.49–4.75) 1.24 (0.73–2.11) 1.24 (0.74–2.08) 2.01 (1.05–3.86) 2.68 (1.11–6.52)
Aerobic exerciseduration
<101 min/week 0.63 (0.26–1.49) 0.70 (0.40–1.24) 0.91 (0.55–1.52) 1.19 (0.72–1.96) 0.89 (0.48–1.62) 0.82 (0.37–1.81)101–180 min/week 0.66 (0.26–1.69) 0.60 (0.33–1.07) 0.61 (0.36–1.05) 0.96 (0.57–1.60) 0.67 (0.35–1.30) 0.43 (0.18–1.05)181–290 min/week 0.74 (0.31–1.78) 0.88 (0.50–1.54) 0.91 (0.55–1.50) 1.00 (0.61–1.63) 0.63 (0.34–1.16) 0.55 (0.24–1.23)≥291 min/week 1.00 1.00 1.00 1.00 1.00 1.00
Resistance trainingduration
<46 min/week 1.99 (0.80–5.00) 1.31 (0.72–2.39) 1.03 (0.59–1.80) 1.36 (0.79–2.35) 0.63 (0.32–1.23) 1.10 (0.43–2.77)46–135 min/week 1.80 (0.76–4.28) 1.52 (0.85–2.72) 1.26 (0.74–2.16) 1.57 (0.93–2.65) 1.15 (0.61–2.14) 1.06 (0.43–2.60)136–270 min/week 1.45 (0.26–3.60) 1.28 (0.69–2.36) 1.07 (0.60–1.90) 1.00 (0.58–1.76) 1.08 (0.55–2.11) 0.89 (0.34–2.33)≥271 min/week 1.00 1.00 1.00 1.00 1.00 1.00
Sleep duration
≤4 h/night 2.35 (0.26–21.56) 0.45 (0.14–1.50) 0.74 (0.22–2.50) 0.98 (0.31–3.07) 2.20 (0.66–7.33) 2.53 (0.57–11.31)5–6 h/night 1.68 (0.94–2.99) 1.37 (0.94–1.99) 0.97 (0.69–1.35) 1.32 (0.95–1.82) 1.31 (0.86–1.99) 1.40 (0.79–2.49)7–8 h/night 1.00 1.00 1.00 1.00 1.00 1.00≥9 h/night 2.24 (0.24–20.98) 0.95 (0.27–3.40) 0.88 (0.25–3.09) 0.58 (0.16–2.08) 2.02 (0.54–7.64) 0.94 (0.10–8.61)
Nagelkerke R2 0.23 0.18 0.04 0.07 0.18 0.11
* Includes hot and other teas. † Includes cola-type beverages and other sodas.

Nutrients 2016, 8, 620 19 of 27
Table 8. Characteristics associated with use (≥1 time/week) of specific caffeine products among Marine Corps personnel. Multivariable logistic regression was used.Data are presented as odds ratios adjusted for other factors listed with 95% confidence intervals. The odds ratio 1.00 represents the reference group for each variable.
Variable StrataCaffeine Beverage or Gum/Medication Consumed ≥1 Time/Week
Any Caffeine Coffee Tea * Soda † Energy Drink Gum/Medication
(Model 1) (Model 2) (Model 3) (Model 4) (Model 5) (Model 6)
GenderMen 1.00 1.00 1.00 1.00 1.00 1.00
Women 1.08 (0.66–1.77) 1.17 (0.82–1.68) 1.45 (1.02–2.07) 0.58 (0.41–0.82) 0.64 (0.43–0.93) 3.15 (1.66–5.99)
Age (years)
18–24 1.00 1.00 1.00 1.00 1.00 1.0025–29 1.93 (1.11–3.38) 1.11 (0.74–1.67) 0.93 (0.62–1.41) 0.98 (0.65–1.47) 1.13 (0.74–1.72) 0.49 (0.22–1.09)30–39 3.59 (1.85–6.96) 1.76 (1.13–2.73) 0.91 (0.59–1.40) 1.81 (1.19–2.74) 0.93 (0.60–1.44) 0.77 (0.37–1.62)≥40 3.15 (1.22–8.11) 1.61 (0.88–2.93) 0.98 (0.55–1.75) 1.51 (0.87–2.62) 0.32 (0.17–0.62) 1.60 (0.62–4.13)
EducationSome high school/high school graduate 1.00 1.00 1.00 1.00 1.00 1.00
Some college 0.97 (0.61–1.55) 1.16 (0.82–1.65) 1.01 (0.71–1.45) 0.65 (0.46–0.92) 1.29 (0.90–1.87) 1.65 (0.87–3.15)College degree 1.39 (0.66–2.92) 1.83 (1.14–2.94) 0.93 (0.59–1.47) 0.64 (0.41–0.99) 0.58 (0.36–0.94) 0.88 (0.36–2.16)
Marital statusSingle 1.00 1.00 1.00 1.00 1.00 1.00
Married 1.32 (0.84–2.07) 1.22 (0.87–1.71) 0.86 (0.61–1.20) 1.22 (0.88–1.70) 1.24 (0.87–1.77) 1.56 (0.83–2.92)
Race/ethnicity
White 1.00 1.00 1.00 1.00 1.00 1.00Black 0.59 (0.35–0.96) 0.44 (0.27–0.73) 1.27 (0.77–2.08) 0.74 (0.44–1.21) 0.54 (0.31–0.89) 1.05 (0.48–2.29)
Hispanic 0.77 (0.37–1.58) 0.95 (0.65–1.38) 0.87 (0.60–1.27) 0.54 (0.38–0.78) 0.46 (0.31–0.70) 0.89 (0.47–1.68)Other 0.40 (0.22–0.75) 0.56 (0.34–0.93) 1.44 (0.88–2.35) 0.76 (0.47–1.24) 0.56 (0.32–0.96) 0.41 (0.13–1.24)
Body mass index(kg/m2)
<25.0 1.00 1.00 1.00 1.00 1.00 1.0025.0–29.9 0.77 (0.49–1.23) 1.40 (1.02–1.95) 0.86 (0.62–1.19) 0.81 (0.59–1.11) 1.21 (0.87–1.70) 1.64 (0.89–3.02)≥30.0 1.04 (0.35–3.04) 1.83 (0.88–3.81) 0.82 (0.41–1.67) 0.61 (0.31–1.18) 1.31 (0.66–2.59) 3.48 (1.24–9.74)
Alcoholconsumption
None 1.00 1.00 1.00 1.00 1.00 1.00<1.33 g/day 1.57 (0.89–2.76) 1.87 (1.23–2.86) 1.42 (0.92–2.18) 1.08 (0.71–1.64) 1.95 (1.23–3.10) 1.21 (0.58–2.49)
1.33–3.99 g/day 2.13 (1.14–3.98) 2.48 (1.59–3.84) 1.15 (0.73–1.80) 1.30 (0.85–1.98) 1.65 (1.03–2.63) 0.84 (0.38–1.84)4.00–8.91 g/day 2.25 (1.16–4.37) 2.75 (1.75–4.35) 1.49 (0.95–2.34) 1.45 (0.74–1.77) 1.65 (1.02–2.67) 1.07 (0.48–2.36)≥8.92 g/day 2.27 (1.18–4.39) 3.37 (2.12–5.36) 1.45 (0.92–2.27) 1.44 (0.94–2.21) 1.82 (1.13–2.92) 1.05 (0.46–2.36)
Aerobic exerciseduration
<101 min/week 0.92 (0.50–1.68) 0.81 (0.52–1.26) 1.01 (0.65–1.55) 1.10 (0.73–1.67) 1.09 (0.70–1.72) 0.35 (0.15–0.83)101–180 min/week 1.19 (0.64–2.19) 0.90 (0.58–1.40) 1.01 (0.65–1.55) 1.42 (0.94–2.15) 1.17 (0.75–1.83) 0.63 (0.29–1.37)181–290 min/week 0.99 (0.56–1.79) 0.83 (0.54–1.26) 1.20 (0.80–1.80) 1.07 (0.72–1.58) 1.26 (0.82–1.93) 0.93 (0.48–1.81)≥291 min/week 1.00 1.00 1.00 1.00 1.00 1.00
Resistance trainingduration
<46 min/week 1.35 (0.70–2.60) 1.02 (0.64–1.62) 1.09 (0.70–1.71) 1.81 (1.15–2.82) 0.87 (0.54–1.39) 0.84 (0.38–1.86)46–135 min/week 1.56 (0.83–2.91) 1.39 (0.89–2.16) 0.76 (0.50–1.18) 1.42 (0.94–2.15) 0.98 (0.63–1.52) 0.53 (0.24–1.16)136–270 min/week 0.98 (0.56–1.71) 0.88 (0.58–1.35) 0.74 (0.49–1.12) 1.17 (0.78–1.74) 0.87 (0.57–1.34) 0.83 (0.40–1.69)≥271 min/week 1.00 1.00 1.00 1.00 1.00 1.00
Sleep duration
≤4 h/night 0.85 (0.37–1.96) 0.82 (0.42–1.58) 1.15 (0.60–2.21) 1.80 (0.94–3.43) 4.17 (2.14–8.14) 4.16 (1.51–11.47)5–6 h/night 1.36 (0.88–2.11) 1.16 (0.85–1.59) 0.91 (0.68–1.23) 1.22 (0.91–1.63) 2.17 (1.57–3.00) 2.38 (1.30–4.36)7–8 h/night 1.00 1.00 1.00 1.00 1.00 1.00≥9 h/night 0.41 (0.13–1.29) 0.92 (0.30–2.77) 0.60 (0.18–1.94) 0.53 (0.16–1.72) 0.54 (0.11–2.53) 2.67 (0.52–13.96)
Nagelkerke R2 0.17 0.16 0.04 0.11 0.16 0.13
* Includes hot and other teas. † Includes cola-type beverages and other sodas.

Nutrients 2016, 8, 620 20 of 27
4. Discussion
The present study documented that 87% of Navy and Marine Corps survey respondents consumecaffeine ≥1 time per week with an estimated daily consumption of 226 mg/day. Among respondentswho reported regularly using caffeinated products, men consumed 32% more caffeine (mg/day)than women, and total consumption increased with age in both men and women. Coffee accountedfor the most caffeine consumption overall, but younger men consumed more caffeine from energydrinks compared with older men. Consuming any caffeinated beverage was independently associatedwith older age, White race/ethnicity, higher alcohol consumption, and a shorter weekly durationof resistance training. Energy drink consumption was independently associated with being male,younger age, lower education level, White race/ethnicity, higher BMI, higher alcohol consumption,less sleep, and service in the Marine Corps.
4.1. Caffeine Prevalence and Daily Consumption
A previous study on caffeine consumption of Army personnel [20] used a questionnaire andcaffeine beverage definitions that were very similar to those of the present study, although the Armystudy [20] used a weighted sample and different sampling technique. The present study employeda random sample while the Army study [20] enrolled soldiers at 11 installations based on locationand availability. Compared with the Army investigation [20], the overall prevalence of caffeineconsumption ≥1 time per week was somewhat higher in the present study (87% vs. 82%) while thedaily consumption of users was lower (226 mg/day in the present study vs. 347 mg/day in the Armyinvestigation). Compared with Navy and Marine Corps personnel, Army personnel consumed morecaffeine from coffee (155 vs. 130 mg/day), cola (32 vs. 16 mg/day), other soda (30 vs. 5 mg/day),and energy drinks (97 vs. 37 mg/day). In further contrast with the Navy and Marine Corps data, theArmy investigation [20] found little association between overall daily caffeine consumption and age,educational level, rank, BMI, or resistance training. The results of the two studies were similar in thatmen consumed more caffeine than women and those of White race/ethnicity consumed more caffeinethan SMs of Black race/ethnicity.
There are four previous population-based estimates of caffeine consumption in Americans. Datafrom National Health and Nutrition Survey (NHANES) [1,25] was collected from a 24 h dietary recallthat included foods and beverages (beverages provided 98% of caffeine consumed), but did not includemedications. One study [1] using NHANES data (2001–2010) indicated that 89% of men and 89% ofwomen consumed caffeine on any given day with an average consumption of 211 and 161 mg/day for≥19-year-old men and women, respectively. The second study [25], using NHANES data from 2011to 2012, found that men and women aged ≥20 years consumed an average of 196 and 151 mg/day,respectively. Caffeine intake data are also available from the US Department of Agriculture (USDA)Continuing Survey of Food Intakes by Individuals (1994 to 1996 and 1998) [19] and are based ontwo days of dietary intake data that included beverages and foods but did not include energy drinksand medications. These data indicated 89% of adult men and 91% of adult women (18–34 yearsof age) consumed caffeinated substances and averaged 199 and 166 mg/day for men and women,respectively. Another study provided corrected values for this survey based on an updated USDAnutrient database and reported caffeine consumptions of 193 and 149 mg/day for men and women≥20 years of age, respectively [26]. Data from the Kantar Worldwide Beverage Consumption Panel(involving US consumers only) was obtained from an online, seven-day beverage consumption recordand indicated that about 90% of individuals ≥18 years of age consumed caffeinated beverages with anaverage caffeine consumption of about 200 mg/day among caffeine users (males and females were notseparated) [2]. Despite differences in methods, prevalence values were similar to the 87% prevalenceobserved in the present study (≥1 week) but the average consumption of 242 and 183 mg/day for menand women, respectively, was higher.
The estimated average daily caffeine consumption for Navy and Marine Corps personnel was wellbelow the 400 mg/day for men and 300 mg/day for women of reproductive age that may be associated

Nutrients 2016, 8, 620 21 of 27
with adverse effects [18]. Nonetheless, the present study found about 15% of men and 18% of womenexceeded these recommended amounts. Beverages from which this caffeine was consumed did notdiffer from that of the entire group, and it may be that these high caffeine consumers did not realizethe amount of caffeine they were ingesting. Also, there are genetic differences that may influencehigher caffeine consumption. A genetic polymorphism (caffeine N3-demethylation) allows someindividuals to metabolize caffeine in the liver more rapidly than others, and another polymorphismmay be associated with higher caffeine tolerance and consumption [27–29].
The 28% energy drink use prevalence found in the present study (≥1 time/week) was lowerthan the 39% reported in the Army [20], the 31% in the Air Force [30], and the 38% in a sample ofSMs consisting of many professional military medical personnel and military college students [31].Among Soldiers and Marines deployed to Afghanistan, 45% reported using energy drinks daily [32].Studies of energy drink consumption among US college students found that 39% consumed an energydrink in the past week [33] and 36% within the past two weeks [34].
4.2. Characteristics Associated with Caffeine Use
In agreement with the present study, others [1,19,20,25] have reported men consumed greateramounts of caffeine than women. Nonetheless, this study found that when caffeine consumption wasdetermined on a per kg body weight basis, men and women consumed similar amounts, as found ina study of a representative US sample [19]. Acute caffeine consumption modestly affects moods, suchas vigor and fatigue, as well as hemodynamic measures (e.g., blood pressure, cardiac output) in bothmen and women [35–37], and it is plausible that both men and women consume caffeinated beveragesto provide similar behavioral and/or cardiovascular effects.
Investigations involving representative civilian samples [1,2,19,25] have reported that overallcaffeine consumption increases with age. In this study, coffee consumption accounted for most ofthe caffeine ingested in all age groups, but younger (aged <40 years) individuals consumed almosttwice as much caffeine from energy drinks compared with older (aged ≥40 years) individuals (40 vs.21 mg/day, p < 0.01) and were more than twice as likely to use them (30 vs. 14%, p < 0.01). Energydrinks are a relatively new source of caffeine introduced into the American market in 1997 [38].Advertising of these drinks is targeted at teenagers and individuals aged 18–34 years [39] and mayhave influenced energy drink consumption in the younger age groups in the present study. It is likelythat energy drink consumption will continue to increase in the future since the US energy drink marketis projected to grow by 52% between 2014 and 2019 [40].
An interesting finding was that, compared to those of White race/ethnicity, those of Blackrace/ethnicity had a lower prevalence of caffeine use and a lower total consumption among consumersas reported in other investigations [20,25]. Race/ethnic differences have been reported in dietaryintake [41,42]. These disparities do not appear to be explained by nutritional knowledge and briefs [42],but education level and income differences may explain some of the variance [42–44]. In the presentstudy, the racial/ethnic differences in caffeine prevalence remained after controlling for education,rank (a surrogate for income), and other factors in the multivariate logistic regression. The potentialreasons for the race/ethnic differences in caffeine prevalence and consumption are likely complex andmay differ in the military compared to the general population.
The relationship between alcohol consumption and caffeinated beverage use has been reportedelsewhere [45–49]. In the present investigation, both univariate and multivariable analyses showedthat alcohol consumption was positively associated with caffeine use, especially the consumptionof coffee and energy drinks. Studies of monozygotic and dizygotic twins suggest that there isa common genetic factor underlying this association of both alcohol and caffeine consumption,although substance-specific factors and environmental influences still seem to contribute to the variancein caffeine consumption [50–52]. Social and familial environmental factors appear to influence caffeineconsumption in adolescence, and genetic factors become progressively more important through earlyand middle adulthood [52].
Nutrients 2016, 8, 620 22 of 27
Epidemiological studies that have used convenience samples to examine associations betweencaffeine and sleep duration or sleep quality have found conflicting results [47,53–56]. On the otherhand, investigations using randomized, population-based samples have shown shorter sleep durationis associated with higher caffeine consumption [32,57,58]. Since it is well known that caffeine canreduce the tendency to sleep, individuals who need to stay awake often choose to consume caffeine.In fact caffeine is sold as an FDA-approved over-the-counter drug for this purpose. The present studyfound in univariate analysis that sleep duration was shorter among those who used more caffeine inthe form of coffee, teas, energy drinks, and caffeinated gums/medications; however, in multivariableanalysis shorter sleep duration was independently associated only with use of energy drinks andgums/medication, primarily among the Marine personnel. Other investigations have demonstratedthat less sleep is associated with energy drink use [32,57]. The biological basis of this association likelyrelates to caffeine’s primary mechanism of action—the modulation of central adenosine receptors.Adenosine is a neuromodulator that acts as a regulator of sleep and arousal [59,60]. Caffeine competeswith adenosine at adenosine receptor sites to increase arousal and reduce the propensity to sleep [60,61].Experimental studies indicate that caffeine can reduce sleep duration, likely in relation to the dosageand proximity to bedtime. Consumption of 200 mg of caffeine 16 h prior to sleep modestly shortenedsleep duration (11 min) [62]; a 100 mg dose administered 3 h and 1 h prior to bedtime (200 mg total)reduced sleep duration by about 30 min [63]; and a 400 mg dose taken 6 h prior to bedtime reducedsleep duration time by 72 min [64].
A previous study of Army personnel found that aerobic exercise duration was not associated withoverall caffeine consumption [20] and, in agreement, Navy and Marine Corp personnel demonstratedlittle relationship between caffeine consumption and aerobic exercise duration in univariate ormultivariable analyses. The Army study [20] found a nonsignificant trend indicating that thoseparticipating in resistance training consumed less caffeine. In the present study, a greater duration ofresistance training was independently associated with consuming less caffeine when the Navy andMarine Corps personnel were combined, but the relationship was diminished when the two groupswere analyzed separately. The Army study used only two categories (yes or no) to characterizeresistance training while the present study used four categories which may have more effectivelyquantified the training volume. In a previous study of Navy and Marine Corp personnel, dietarysupplement use was strongly associated with increasing resistance training duration [65]. Manydietary supplements contain caffeine, and the caffeine content of some of these can be very high [66,67].Accurately determining the caffeine content of dietary supplements is difficult because manufacturersare not required to list the amount of caffeine on their supplement facts labels, amounts are usuallynot available on company websites, and if the ingredients are proprietary the manufacturer is notrequired to list caffeine at all [67]. It is possible that SMs involved in resistance training consumedless caffeine from beverages to avoid adverse effects resulting from high dosages of caffeine in theirdietary supplements.
In univariate analysis and in multivariable analyses in the combined group, higher BMI wasassociated with a higher proportion of SMs consuming coffee, energy drinks, and caffeinatedgum/medications. It is possible these associations may have different explanations dependingon the specific caffeine-containing product. For example, many energy drinks contain sugars andother high-calorie carbohydrates that may contribute to weight gain or weight maintenance. Someindividuals may use large amounts of sugar in their coffee or tea that may have similar effects on bodyweight. On the other hand, caffeine has thermogenic properties that may reduce weight acutely [68] andin the longer term, but long-term effects on weight are relatively modest (<1 kg) [69]. Nonetheless, someindividuals with higher BMIs may consume caffeinated beverages for their thermogenic properties.There are strict weight standards for height and body fat in the Navy and Marine Corps [70,71], andSMs who do not meet these standards can receive adverse performance reports and be dischargedfrom service for repeated failures to achieve the standards.
Nutrients 2016, 8, 620 23 of 27
4.3. Limitations
This study has several limitations. All data were self-reported and suffer from the usual limitationsassociated with this method, including non-response bias, recall bias, social desirability, errors inself-observation, and inadequate recall [72,73]. These biases could account for errors in reportingserving sizes and how many times per week caffeinated products were consumed, and thus errorsin estimating the milligrams per day of caffeine consumption. Another limitation was the largenumber of statistical tests conducted examining relationships between caffeine use and amount andthe demographic, lifestyle, and military characteristics. The more effects investigated, the greaterthe chance of making a Type 1 error where a null hypothesis will turn up significant. However,it is important to show these relationships and their probability levels in this investigation for moreadequate comparisons with other investigations.
Caffeine data was only obtained from beverages and did not include caffeine from foods or dietarysupplements. However, a previous study [1] that did include caffeine in foods and beverages found thatbeverages accounted for 98% of caffeine consumption, so it is likely that omitting foods had only a smalleffect on caffeine estimates. On the other hand, the caffeine content of some dietary supplements canbe high [67], and many Navy and Marine Corps personnel use dietary supplements [65]. These factorsmight have led to an underestimation of the actual caffeine ingested. Finally, the caffeine contentof beverages was obtained from company websites, labels, and a database of caffeinated beverages.Although company websites and food labels are likely reliable, estimates of caffeine in coffees and teasmay be less so. Where the coffee beans or tea leaves are harvested and how they are processed andbrewed can affect their caffeine content [74–76].
5. Conclusions
The present investigation expands knowledge on the prevalence and amount of caffeine consumedin the military services, a group largely neglected in national surveys. Among Navy and Marine Corpspersonnel, 87% reported using caffeinated beverages ≥1 time/week, with male and female consumersingesting (mean ± standard error) 242 ± 7 and 183 ± 8 mg/day, respectively. The most commonlyconsumed caffeinated products (% using) were coffee (65%), soda (54%), tea (40%), and energy drinks(28%). The prevalence of energy drink consumption and caffeine ingested from energy drinks wasabout twice as high among those aged <40 years compared with those aged ≥40 years. Sources ofcaffeine were similar for Marine Corps and Navy personnel except that Marines obtained more caffeinefrom energy drinks. Characteristics independently associated with regular caffeine use included olderage, white race/ethnicity, higher alcohol consumption, and shorter weekly duration of resistancetraining. The prevalence of caffeine use by Navy and Marine Corps personnel was similar to thatreported from NHANES data, although total consumption of caffeine (mg/day) was higher in Navyand Marine Corps personnel. Characteristics associated with caffeine use in these SMs were similar tocivilian investigations. Future research should focus on the caffeine use of Air Force personnel whichhave not been investigated to date and reasons for use of caffeine-containing products.
Acknowledgments: This research was supported in part by an appointment to the Knowledge PreservationProgram at the US Army Research Institute of Environmental Medicine (USARIEM) and the Army Public HealthCenter (Provisional) (APHC-Prov) administered by the Oak Ridge Institute for Science and Education throughan interagency agreement between the US Department of Energy, USARIEM, and APHC-Prov. This report wasalso supported by the Bureau of Medicine and Surgery, under Work Unit No. N1335, and the Center Alliance forDietary Supplement Research.
Author Contributions: H.R.L. and K.G.A. conceived and designed the investigation. D.W.T. collected andprocessed the data. J.J.K., D.W.T., S.M., and R.A.S. analyzed the data. J.J.K., D.W.T., S.M., R.A.S., K.G.A., andH.R.L. wrote and edited the final manuscript.
Conflicts of Interest: The authors declare no conflicts of interests. Funding sponsors had no role in the design ofthe study; in the collection, analysis, or interpretation of the data; in writing of the manuscript; and in the decisionto publish the results.
Nutrients 2016, 8, 620 24 of 27
Disclaimers: The views expressed in this research are those of the authors and do not necessarily reflect theofficial policy or position of the Department of the Navy, Department of the Army, Department of the Air Force,Department of Veterans Affairs, Department of Defense, or the US Government. Approved for public release;distribution is unlimited. US Government Work (17 USC §105). Not copyrighted in the United States. Humansubjects participated in this study after giving their free and informed consent. This research has been conductedin compliance with all applicable federal regulations governing the protection of human subjects in research(Protocol NHRC.2013.0009).
References
1. Fulgoni, V.L.F.; Keast, D.R.; Lieberman, H.R. Trends in intake and sources of caffeine in the diet of US adults:2001–2010. Am. J. Clin. Nutr. 2015, 101, 1081–1087. [CrossRef] [PubMed]
2. Mitchell, D.C.; Knight, C.A.; Hokenberry, J.; Teplansky, R.; Hartman, T.J. Beverage caffeine intakes in the U.S.Food Chem. Toxicol. 2014, 63, 136–142. [CrossRef] [PubMed]
3. James, J.E. Critical review of dietary caffeine and blood pressure: A relationship that should be taken moreseriously. Psychosom. Med. 2004, 66, 63–71. [CrossRef] [PubMed]
4. Nurminen, M.L.; Niittynen, L.; Korpela, R.; Vapaatalo, H. Coffee, caffeine and blood pressure: A criticalreview. Europ. J. Clin. Nutr. 1999, 53, 831–839. [CrossRef]
5. Cai, L.; Ma, D.; Zhang, Y.; Lui, Z.; Wang, P. The effect of coffee consumption on serum lipids: A meta-analysisof randomized controlled trials. Eur. J. Clin. Nutr. 2012, 66, 872–877. [CrossRef] [PubMed]
6. Mostofsky, E.; Rice, M.S.; Levitan, E.B.; Mittleman, M.A. Habitual coffee consumption and risk of heartfailure: A dose-response meta-analysis. Circ. Heart Fail. 2012, 5, 401–405. [CrossRef] [PubMed]
7. Bohn, S.K.; Ward, N.C.; Hodgson, J.M.; Croft, K.D. Effects of tea and coffee on cardiovascular disease risk.Food Funct. 2012, 3, 575–591. [CrossRef] [PubMed]
8. Wilson, P.W.F.; Bloom, H.L. Caffeine consumption and cardiovascular risk: Little cause for concern. J. Am.Heart Assoc. 2016, 5, e003089. [CrossRef] [PubMed]
9. Eilat-Adar, S.; Sinai, T.; Yosefy, C.; Henkin, Y. Nutritional recommendations for cardiovascular diseaseprevention. Nutrients 2013, 5, 3646–3683. [CrossRef] [PubMed]
10. Thong, F.S.L.; Graham, T.E. Caffeine-induced impairment of glucose tolerance is abolished by b-adrenergicreceptor blockade in humans. J. Appl. Physiol. 2002, 92, 2347–2352. [CrossRef] [PubMed]
11. Shearer, J.; Graham, T.E. Performance effects and metabolic consequences of caffeine and caffeinated energydrink consumption on glucose disposal. Nutr. Rev. 2014, 72, 121–136. [CrossRef] [PubMed]
12. Ding, M.; Bhupathiraju, S.N.; Chen, M.; VanDam, R.M.; Hu, F.B. Caffeinated and decaffeinated coffeeconsumption and risk of Type 2 diabetes: A systematic review and a dose-response meta-analysis.Diabetes Care 2014, 37, 569–586. [CrossRef] [PubMed]
13. VanDam, R.M.; Hu, F.B. Coffee consumption and risk of Type 2 diabetes. JAMA 2005, 294, 97–104. [CrossRef][PubMed]
14. Feld, J.J.; Lavoie, E.G.; Fausther, M.; Dranoff, J.A. I drink for my liver, doc: Emerging evidence that coffeeprevents cirrhosis. F1000Research 2015, 4, 95. [CrossRef] [PubMed]
15. Arab, L.; Khan, F.; Lam, H. Epidemiological evidence of a relationship between tea, coffee, or caffeineconsumption and cognitive decline. Adv. Nutr. 2013, 4, 115–122. [CrossRef] [PubMed]
16. Spriet, L.L. Exercise and sports performance with low doses of caffeine. Sports Med. 2014, 44, S175–S184.[CrossRef] [PubMed]
17. Kim, J.; Lee, J. A review of nutritional intervention on delayed onset muscle soreness. Part 1. J. Exerc. Rehabil.2014, 10, 349–356. [CrossRef] [PubMed]
18. Nawrot, P.; Jordan, S.; Eastwood, J.; Rotstein, J.; Hugenholtz, A.; Feeley, M. Effects of caffeine on humanhealth. Food Addit. Contam. 2003, 20, 1–30. [CrossRef] [PubMed]
19. Frary, C.D.; Johnson, R.K.; Wang, M.Q. Food sources and intakes of caffeine in the diets of persons in theUnited States. J. Am. Diet. Assoc. 2005, 105, 110–113. [CrossRef] [PubMed]
20. Lieberman, H.R.; Stavinoha, T.; McGraw, S.; White, A.; Hadden, L.; Marriott, B.P. Caffeine use among activeduty US Army soldiers. J. Acad. Nutr. Diet. 2012, 112, 902–912. [CrossRef] [PubMed]
21. Smith, T.C. The US Department of Defense Millennium Cohort Study: Career span and beyond longitudinalfollow-up. J. Occup. Environ. Med. 2009, 51, 1193–1201. [CrossRef] [PubMed]
Nutrients 2016, 8, 620 25 of 27
22. CaffeineInformer. Caffeine Content of Drinks. Available online: http://www.caffeineinformer.com/the-caffeine-database (accessed on 12 December 2015).
23. National Institute of Health. Rethinking Drinking. Alcohol & Your Health. Available online:http://rethinkingdrinking.niaaa.nih.gov/How-much-is-too-much/What-counts-as-a-drink/Whats-A-Standard-Drink.aspx (accessed on 22 December 2015).
24. Ryan, M.A.; Smith, T.C.; Smith, B.; Amoroso, P.; Boyko, E.J.; Gray, G.C.; Gackstetter, D.G.; Riddle, J.R.;Wells, T.S.; Gumbs, G.; et al. Millennium cohort: Enrollment begins a 21-year contribution to understandingthe impact of military service. J. Clin. Epidemiol. 2007, 60, 181–191. [CrossRef] [PubMed]
25. Drewnowski, A.; Rehm, C.D. Sources of caffeine in diets of US children and adults: Trends by beverage typeand purchase location. Nutrients 2016, 8, 154. [CrossRef] [PubMed]
26. Ahuja, J.K.C.; Goldman, J.D.; Perloff, B.P. The effect of improved composition data on intake estimates in theUnited States of America. J. Food Compost. Anal. 2006, 19, S7–S13. [CrossRef]
27. Cornelis, M.C.; Al-Sohemy, A.; Campos, H. Genetic polymorphism of the adenosine a2a receptor is associatedwith habitual caffeine consumption. Am. J. Clin. Nutr. 2007, 86, 240–244. [PubMed]
28. Sachse, C.; Brockmoller, J.; Bauer, S.; Roots, I. Functional significance of a c to a polymorphism in intron 1 ofthe cytochrome p450 cyp1a2gene tested with caffeine. Br. J. Clin. Pharmacol. 1999, 47, 445–449. [CrossRef][PubMed]
29. Huang, Z.L.; Qu, W.M.; Eguchi, N.; Chen, J.F.; Schwarzschild, M.A.; Fredholm, B.B.; Urade, Y.; Hayaishi, O.Adenosine a2a but not a1 receptors mediate the arousal effect of caffeine. Nat. Neurosci. 2005, 8, 858–859.[CrossRef] [PubMed]
30. Schmidt, R.M.; McIntire, L.K.; Caldwell, J.A.; Hallman, C. Prevalence of Energy-Drink and Supplement Usage ina Sample of Air Force Personnel; AFRL-RH-WP-TP-2010-0010; Air Force Research Laboratory: Wright-PattersonAir Force Base, OH, USA, 2008.
31. Stephens, M.B.; Attipoe, A.S.; Jones, D.; Ledford, C.J.W.; Deuster, P.A. Energy drink and energy shot use inthe military. Nutr. Rev. 2014, 72, 72–77. [CrossRef] [PubMed]
32. Toblin, R.L.; Clarke-Walper, K.; Kok, B.C.; Sipos, M.L.; Thomas, J.L. Energy drink consumption and itsassociation with sleep problems among U.S. Service members on a combat deployment—Afghanistan, 2010.MMWR 2012, 61, 895–898.
33. Skewes, M.C.; Decou, C.R.; Gonzalez, V.M. Energy drink use, problem drinking and drinking motives in adiverse sample of Alaska college students. Int. J. Circumpolar Health 2013, 72, 21204. [CrossRef] [PubMed]
34. Marczinski, C.A. Alcohol mixed with energy drinks: Consumption patterns and motivations for use in U.S.College students. Int. J. Environ. Res. Public Health 2011, 8, 3232–3245. [CrossRef] [PubMed]
35. Hartley, T.R.; Lovallo, W.R.; Whitsett, T.L. Cardiovascular effects of caffeine in men and women. Am. J. Cardiol.2004, 93, 1022–1026. [CrossRef] [PubMed]
36. Farag, N.H.; Whitsett, T.L.; McKey, B.S.; Wilson, M.F.; Vincent, A.S.; Everson-Rose, S.A.L.; Lovallo, W.R.Caffeine and blood pressure response: Sex, age and hormonal status. J. Women’s Health 2010, 19, 1171–1176.[CrossRef] [PubMed]
37. Amendola, C.A.; Gabrieli, J.D.E.; Lieberman, H.R. Caffeine’s effect on performance and mood areindependent of age and gender. Nutr. Neurosci. 1998, 1, 269–280. [CrossRef] [PubMed]
38. Heckman, M.A.; Sherry, K.; GonzalezDeMejia, E. Energy drinks: Assessment of their market size, consumerdemographics, ingredient profile, functionality, and regulations in the United States. Comp. Rev. Food Sci.Food Saf. 2010, 9, 303–317. [CrossRef]
39. Lal, G.G. Getting specific with functional beverages. Food Technol. 2007, 61, 25–31.40. Market Realist. Mintel Forecasts Strong Growth in the US Energy Drink Market. Available online:
http://marketrealist.com/2015/06/mintel-forecasts-strong-growth-us-energy-drink-market/ (accessedon 14 January 2016).
41. Hiza, H.A.B.; Casavale, K.O.; Guenther, P.M.; Davis, C.A. Diet quality of americans differ by age, sex,race/ethnicity, income and educational level. J. Acad. Nutr. Diet. 2013, 113, 297–306. [CrossRef] [PubMed]
42. Wang, Y.; Chen, X. How much of racial/ethnic disparities in dietary intake, exercise, and weight statuscan be explained by nutrition- and health-related psychosocial factors and socioeconomic status among USadults. J. Am. Diet. Assoc. 2011, 111, 1904–1991. [CrossRef] [PubMed]
Nutrients 2016, 8, 620 26 of 27
43. Raffensperger, S.; Kuczmarski, M.F.; Hotchkiss, L.; Cotugna, N.; Evans, M.K.; Zonderman, A.B. The effect ofrace and predictors of socioeconomic status on diet quality in the in the healthy aging in neighborhoods ofdiversity across the life span (handls) study sample. J. Natl. Med. Assoc. 2010, 102, 923–930. [CrossRef]
44. Bahr, P.R. Race and nutrition: An investigation of black-white differences in health-related nutrition behaviors.Soc. Health Illness 2007, 29, 831–856. [CrossRef] [PubMed]
45. Istvan, J.; Matarazzo, J.D. Tobacco, alcohol, and caffeine use: A review of their interrelationships. Psychol. Bull.1984, 95, 301–326. [CrossRef] [PubMed]
46. Kozlowski, L.T.; Henningfield, J.E.; Keenan, R.M.; Lei, H.; Jelinek, L.C.; Leigh, G.; Pope, M.A.; Haertzen, C.A.Patterns of alcohol, cigarette, and caffeine and other drug use in two drug abusing populations. J. Subst.Abuse Treat. 1993, 10, 171–179. [CrossRef]
47. Lund, H.G.; Reider, B.D.; Whiting, A.B.; Pritchard, J.R. Sleep patterns and predictors of disturbed sleep ina large population of college students. J. Adolesc. Health 2010, 46, 124–132. [CrossRef] [PubMed]
48. Miller, K.E. Energy drinks, race, and problem behaviors among college students. J. Adolesc. Health 2008, 43,490–497. [CrossRef] [PubMed]
49. Velazquez, C.E.; Poulos, N.S.; Latimer, L.A.; Pasch, K.E. Associations between energy drink consumptionand alcohol use behaviors among college students. Drug Alcohol Depend. 2012, 123, 167–172. [CrossRef][PubMed]
50. Swan, G.E.; Carmelli, D.; Cardon, L.R. The consumption of tobacco, alcohol, and coffee in Caucasian maletwins: A multivariate genetic analysis. J. Subst. Abuse 1996, 8, 19–31. [CrossRef]
51. Hettema, J.M.; Corey, L.A.; Kendler, K.S. A multivariate genetic analysis of the use of tobacco, alcohol andcaffeine in a population based sample of male and female twins. Drug Alcohol Depend. 1999, 57, 69–78.[CrossRef]
52. Kendler, K.S.; Schmitt, E.; Aggen, S.H.; Prescott, C.A. Genetic and environmental influences on alcohol,caffeine, cannabis and nicotine use from early adolescence to middle adulthood. Arch. Gen. Psychiatry 2008,65, 674–682. [CrossRef] [PubMed]
53. Lohsoonthorn, V.; Khidir, H.; Casillas, G.; Lertmaharit, S.; Tadesse, M.G.; Pensuksan, W.C.; Rattananupong, T.;Gelaye, B.; Williams, M.A. Sleep quality and sleep patterns in relation to consumption of energy drinks,caffeinated beverages and other stimulants among thai college students. Sleep Breath. 2013, 17, 1017–1028.[CrossRef] [PubMed]
54. Brick, C.A.; Seely, D.L.; Palermo, T.M. Association between sleep hygiene and sleep quality in medicalstudents. Behav. Sleep Med. 2010, 8, 113–121. [CrossRef] [PubMed]
55. Sanchez-Ortuno, M.; Moore, N.; Taillard, J.; Valtat, C.; Leger, D.; Bioulac, B.; Philip, P. Sleep duration andcaffeine consumption in a French middle-aged working population. Sleep Med. 2005, 6, 247–251. [CrossRef][PubMed]
56. Waits, W.M.; Ganz, M.B.; Schillreff, T.; Dell, P.J. Sleep and the use of energy products in a combat environment.US Army Med. Dep. J. 2014, Oct-Dec, 22–28.
57. Jacobson, I.G.; Horton, J.L.; Smith, B.; Wells, T.S.; Boyko, E.J.; Lieberman, H.R.; Ryan, M.A.K.; Smith, T.C.Bodybuilding, energy, and weight loss supplements are associated with deployment and physical activity inU.S. Military personnel. Ann. Epidemiol. 2012, 22, 318–330. [CrossRef] [PubMed]
58. Kant, A.K.; Graubard, B.I. Association between self-reported sleep duration with eating behaviors ofAmerican adults: NHANES 2005–2010. Am. J. Clin. Nutr. 2014, 100, 938–947. [CrossRef] [PubMed]
59. Ribiro, J.A.; Sebastiao, A.M. Caffeine and adenosine. J. Alzheimer’s Dis. 2010, 20, S3–S15.60. Huang, Z.L.; Zhang, Z.; Qu, W.M. Roles of adenosine and its receptors in sleep-wake regulation.
Int. Rev. Neurobiol. 2014, 119, 349–371. [PubMed]61. Urry, E.; Landolt, H.P. Adenosine, caffeine and performance: From cognitive neuroscience of sleep to sleep
pharmacogenetics. Curr. Top. Behav. Neurosci. 2015, 25, 331–366. [PubMed]62. Landolt, H.P.; Werth, E.; Borbeely, A.A.; Dijk, D.J. Caffeine intake (200 mg) in the morning affects human
sleep and EEG power spectra at night. Brain Res. 1995, 675, 67–74. [CrossRef]63. Drapeau, C.; Hamel-Herbrt, I.; Robillard, R.; Selmaoui, B.; Filipini, D.; Carrier, J. Challenging sleep in aging:
The effect of 200 mg of caffeine during the evening in young and middle-aged moderate caffeine consumers.J. Sleep Res. 2006, 15, 133–141. [CrossRef] [PubMed]
64. Drake, C.; Roehrs, T.; Shambroom, J.; Roth, T. Caffeine effects on sleep taken 0, 3, or 6 hours before going tobed. J. Clin. Sleep Med. 2013, 9, 1195–1200. [CrossRef] [PubMed]

Nutrients 2016, 8, 620 27 of 27
65. Knapik, J.J.; Trone, D.W.; Austin, K.G.; Steelman, R.A.; Farina, E.K.; Lieberman, H.R. Prevalence, adverseeffects, and factors associated with dietary supplement and nutritional supplement use by United StatesNavy and Marine Corps personnel. J. Acad. Nutr. Diet. 2016, in press. [CrossRef] [PubMed]
66. Gurley, B.J.; Steelman, S.C.; Thomas, S.L. Multi-ingredient, caffeine containing dietary supplements: History,safety, and efficacy. Clin. Ther. 2015, 37, 275–301. [CrossRef] [PubMed]
67. Andrews, K.W.; Schweitzer, A.; Zhao, C.; Holden, J.M.; Roseland, J.M.; Brandt, M.; Dwyer, J.T.; Picciano, M.F.;Saldanha, L.G.; Fisher, K.D.; et al. The caffeine contents of dietary supplements commonly purchased in theUS: Analysis of 53 products with caffeine-containing ingredients. Anal. Bioanal. Chem. 2007, 389, 231–239.[CrossRef] [PubMed]
68. Hursel, R.; Westerterp-Plantenga, M.S. Thermogenic ingredients and body weight regulation. Int. J. Obes.2010, 34, 659–669. [CrossRef] [PubMed]
69. Lopez-Garcia, E.; VanDam, R.M.; Rajpathak, S.; Willett, W.C.; Manson, J.E.; Hu, F.B. Changes in caffeineintake and long-term weight change in men and women. Am. J. Clin. Nutr. 2006, 83, 674–680. [PubMed]
70. Marine Corps. Marine Corps Body Composition and Military Appearance Program, Marine Corps Order6110.3Headquarters; United States Marine Corps: Washington, DC, USA, 2008.
71. OPNAV Instruction 6110.1j—Physical Readiness Program. Available online: http://navy-fitness.com/2011/07/opnavinst-6110-1j-physical-readiness-program-policy-changes/ (accessed on 1 August 2016).
72. Podsakoff, P.M.; MacKenzie, S.B.; Lee, J.Y.; Podsakoff, N.P. Common method biases in behavioral research:A critical review of the literature and recommended remedies. J. Appl. Psychol. 2003, 88, 879–903. [CrossRef][PubMed]
73. Furnham, A. Response bias, social desirability and dissimulation. Person. Individ. Diff. 1985, 7, 385–400.[CrossRef]
74. Hecimovic, I.; Belscak-Cvitanovic, A.; Horzic, D.; Komes, D. Comparative study of polyphenols and caffeinein different coffee varieties affected by the degree of roasting. Food Chem. 2011, 129, 991–1000. [CrossRef][PubMed]
75. Barone, J.J.; Roberts, H.R. Caffeine consumption. Food Chem. Toxicol. 1996, 34, 119–129. [CrossRef]76. Chin, J.M.; Merves, M.L.; Goldberg, B.A.; Sampson-Cone, A.; Cone, E.J. Caffeine content of brewed teas.
J. Anal. Toxicol. 2008, 32, 702–704. [CrossRef] [PubMed]
© 2016 by the authors; licensee MDPI, Basel, Switzerland. This article is an open accessarticle distributed under the terms and conditions of the Creative Commons Attribution(CC-BY) license (http://creativecommons.org/licenses/by/4.0/).

Standard Form 298 (Rev. 8/98)
REPORT DOCUMENTATION PAGE
Prescribed by ANSI Std. Z39.18
Form Approved OMB No. 0704-0188
The public reporting burden for this collection of information is estimated to average 1 hour per response, including the time for reviewing instructions, searching existing data sources, gathering and maintaining the data needed, and completing and reviewing the collection of information. Send comments regarding this burden estimate or any other aspect of this collection of information, including suggestions for reducing the burden, to Department of Defense, Washington Headquarters Services, Directorate for Information Operations and Reports (0704-0188), 1215 Jefferson Davis Highway, Suite 1204, Arlington, VA 22202-4302. Respondents should be aware that notwithstanding any other provision of law, no person shall be subject to any penalty for failing to comply with a collection of information if it does not display a currently valid OMB control number. PLEASE DO NOT RETURN YOUR FORM TO THE ABOVE ADDRESS. 1. REPORT DATE (DD-MM-YYYY) 2. REPORT TYPE 3. DATES COVERED (From - To)
4. TITLE AND SUBTITLE 5a. CONTRACT NUMBER
5b. GRANT NUMBER
5c. PROGRAM ELEMENT NUMBER
5d. PROJECT NUMBER
5e. TASK NUMBER
5f. WORK UNIT NUMBER
6. AUTHOR(S)
7. PERFORMING ORGANIZATION NAME(S) AND ADDRESS(ES) 8. PERFORMING ORGANIZATION REPORT NUMBER
9. SPONSORING/MONITORING AGENCY NAME(S) AND ADDRESS(ES) 10. SPONSOR/MONITOR'S ACRONYM(S)
11. SPONSOR/MONITOR'S REPORT NUMBER(S)
12. DISTRIBUTION/AVAILABILITY STATEMENT
13. SUPPLEMENTARY NOTES
14. ABSTRACT
15. SUBJECT TERMS
16. SECURITY CLASSIFICATION OF: a. REPORT b. ABSTRACT c. THIS PAGE
17. LIMITATION OF ABSTRACT
18. NUMBER OF PAGES
19a. NAME OF RESPONSIBLE PERSON
19b. TELEPHONE NUMBER (Include area code)
26-04-2016 Journal article 2014
Caffeine Use Among Active Duty Navy and Marine Corps Personnel
NHRC.2013.0009
N1335
Knapik, Joseph J; Trone, Daniel W; McGraw, S; Steelman, Ryan A; Austin,Krista G; Lieberman, Harris R
Commanding OfficerNaval Health Research Center140 Sylvester RdSan Diego, CA 92106-3521
16-62
Commanding Officer Chief, Bureau of Medicine and SurgeryNaval Medical Research Center (MED 00), Navy Dept503 Robert Grant Ave 7700 Arlington Blvd Ste 5113Silver Spring, MD 20910-7500 Falls Church, VA 22042-5113
BUMED/NMRC
Approved for public release; distribution is unlimited.
Open access publication. Nutrients, 8(10):620, 2016 Oct 9, doi:10.3390/nu8100620
Data from the National Health and Nutrition Examination Survey (NHANES) indicated that 89% of Americans regularly consume caffeine, butthese data do not include military personnel. This cross-sectional study examined caffeine use in Navy and Marine Corps personnel, includingprevalence, amount of daily consumption, and factors associated with use. A random sample of Navy and Marine Corps personnel were contactedand asked to complete a detailed questionnaire describing their use of caffeine-containing substances, in addition to their demographic, military,and lifestyle characteristics. A total of 1,708 service members (SMs) completed the questionnaire. Overall, 87% reported using caffeinatedbeverages 1 time/week with caffeine users consuming a mean ± standard error of 226 ± 5 mg/day (242 ± 7 mg/day for men, 183 ± 8 mg/day forwomen). The most commonly consumed caffeinated beverages (% users) were coffee (65%), colas (54%), teas (40%), and energy drinks (28%).Multivariable logistic regression modeling indicated that characteristics independently associated with caffeine use ( 1 time/week) included olderage, White race/ethnicity, higher alcohol consumption, and less resistance training. Frequency of caffeine use in these SMs was similar to thatreported in civilian investigations, but daily consumption (mg/day) was higher.
coffee, tea, cola, energy drink, alcohol, sleep, exercise, demographics, lifestyle characteristics
U U U UU 27
Commanding Officer
COMM/DSN: (619) 553-8429