Embed Size (px)
Citation preview
Feature Selection Based on Mutual Information:Criteria of Max-Dependency, Max-Relevance,
and Min-RedundancyHanchuan Peng, Member, IEEE, Fuhui Long, and Chris Ding
Abstract—Feature selection is an important problem for pattern classification systems.We study how to select good features according
to the maximal statistical dependency criterion based on mutual information. Because of the difficulty in directly implementing the
maximal dependency condition, we first derive an equivalent form, called minimal-redundancy-maximal-relevance criterion (mRMR), for
first-order incremental feature selection. Then, we present a two-stage feature selection algorithm by combining mRMR and other more
sophisticated feature selectors (e.g., wrappers). This allows us to select a compact set of superior features at very low cost. We perform
extensive experimental comparison of our algorithm and other methods using three different classifiers (naive Bayes, support vector
machine, and linear discriminate analysis) and four different data sets (handwritten digits, arrhythmia, NCI cancer cell lines, and
lymphoma tissues). The results confirm that mRMR leads to promising improvement on feature selection and classification accuracy.
Index Terms—Feature selection, mutual information, minimal redundancy, maximal relevance, maximal dependency, classification.
�
1 INTRODUCTION
IN many pattern recognition applications, identifying themost characterizing features (or attributes) of the ob-
served data, i.e., feature selection (or variable selection,among many other names) [30], [14], [17], [18], [15], [12],[11], [19], [31], [32], [5], is critical to minimize the classifica-tion error. Given the input data D tabled as N samples andM features X ¼ fxi; i ¼ 1; . . . ;Mg, and the target classifica-tion variable c, the feature selection problem is to find fromthe M-dimensional observation space, RM , a subspace ofm features, Rm, that “optimally” characterizes c.
Given a condition defining the “optimal characteriza-tion,” a search algorithm is needed to find the best subspace.Because the total number of subspaces is 2M , and thenumber of subspaces with dimensions no larger than m is�m
i¼1Mi
� �, it is hard to search the feature subspace exhaus-
tively. Alternatively, many sequential-search-based approx-imation schemes have been proposed, including bestindividual features, sequential forward search, sequentialforward floating search, etc., (see [30], [14], [13] for a detailedcomparison.).
The optimal characterization condition often means theminimal classification error. Inanunsupervisedsituationwheretheclassifiersarenotspecified,minimalerrorusuallyrequiresthemaximal statistical dependency of the target class c on thedata distribution in the subspace Rm (and vice versa). Thisscheme ismaximal dependency (Max-Dependency).
One of the most popular approaches to realize Max-Dependency is maximal relevance (Max-Relevance) featureselection: selecting the features with the highest relevance tothe target class c. Relevance is usually characterized in termsof correlation ormutual information, ofwhich the latter is oneof the widely used measures to define dependency ofvariables. In this paper, we focus on the discussion ofmutual-information-based feature selection.
Given two random variables x and y, their mutualinformation is defined in terms of their probabilistic densityfunctions pðxÞ, pðyÞ, and pðx; yÞ:
Iðx; yÞ ¼ZZ
pðx; yÞ log pðx; yÞpðxÞpðyÞ dxdy: ð1Þ
In Max-Relevance, the selected features xi are required,individually, to have the largest mutual information Iðxi; cÞwith the target class c, reflecting the largest dependency onthe target class. In terms of sequential search, the m bestindividual features, i.e., the top m features in the descentordering of Iðxi; cÞ, are often selected as the m features.
In feature selection, it has been recognized that thecombinations of individually good features do not necessa-rily lead to good classification performance. In other words,“them best features are not the bestm features” [4], [3], [14],[30]. Some researchers have studied indirect or direct meansto reduce the redundancy among features1 (e.g., [4], [14], [19],[15], [22], [12], [5]) and select features with the minimalredundancy (Min-Redundancy). For example, in the sequen-tial forward floating search [25], the joint dependency offeatures on the target class ismaximized; as a by-product, theredundancy among featuresmight be reduced. In [12], Jaegeret al. presentedaprefilteringmethod togroupvariables, thus,redundant variables within each group can be removed. In
1226 IEEE TRANSACTIONS ON PATTERN ANALYSIS AND MACHINE INTELLIGENCE, VOL. 27, NO. 8, AUGUST 2005
. H. Peng and F. Long are with the Lawrence Berkeley National Laboratory,University of California at Berkeley, 1 Cyclotron Road, MS. 84-171,Berkeley, CA 94720. E-mail: {hpeng, flong}@lbl.gov.
. C. Ding is with the Computational Research Division, Lawrence BerkeleyNational Laboratory, 1 Cyclotron Road, Berkeley, CA 94720.E-mail: [email protected].
Manuscript received 6 Aug. 2003; revised 1 May 2004; accepted 3 Dec. 2004;published online 13 June 2005.Recommended for acceptance by A. Del Bimbo.For information on obtaining reprints of this article, please send e-mail to:[email protected], and reference IEEECS Log Number TPAMI-0215-0803.
1. Minimal redundancy has also been studied in feature extraction,which aims to find good features in a transformed domain. For instance, ithas been well addressed in various techniques such as principal componentanalysis and independent component analysis [10], neural network featureextractors (e.g., [22]), etc.
0162-8828/05/$20.00 � 2005 IEEE Published by the IEEE Computer Society
[5], we proposed a heuristic minimal-redundancy-maximal-relevance (mRMR) framework to minimize redundancy, andused a series of intuitive measures of relevance andredundancy to select promising features for both continuousand discrete data sets.
Our work in this paper focuses on three issues that havenot been touched in earlier work. First, although both Max-Relevance and Min-Redundancy have been intuitively usedfor feature selection, no theoretical analysis is given on whythey can benefit selecting optimal features for classification.Thus, the first goal of this paper is to present a theoreticalanalysis showing that mRMR is equivalent to Max-Depen-dency for first-order feature selection, but is more efficient.
Second, we investigate how to combine mRMR withother feature selection methods (such as wrappers [18], [15])into a two-stage selection algorithm. By doing this, we showthat the space of candidate features selected by mRMR ismore characterizing. This property of mRMR facilitates theintegration of other feature selection schemes to find acompact subset of superior features at very low cost.
Third, through comprehensive experiments we comparemRMR, Max-Relevance, Max-Dependency, and the two-stage feature selection algorithm, using three differentclassifiers and four data sets. The results show that mRMRand our two-stage algorithm are very effective in a widerange of feature selection applications.
This paper is organized as follows: Section 2 presents thetheoretical analysis of the relationships of Max-Dependency,Max-Relevance, andMin-Redundancy. Section 3presents thetwo-stage feature selection algorithm, including schemes tointegrate wrappers to select a squeezed subset of features.Section 4 discusses implementation issues of density estima-tion for mutual information and several different classifiers.Section 5 gives experimental results on four data sets,including handwritten characters, arrhythmia, NCI cancercell lines, and lymphoma tissues. Sections 6 and 7 arediscussions and conclusions, respectively.
2 RELATIONSHIPS OF MAX-DEPENDENCY,MAX-RELEVANCE, AND MIN-REDUNDANCY
2.1 Max-Dependency
In terms of mutual information, the purpose of featureselection is to find a feature set Swithm features fxig, whichjointly have the largest dependency on the target class c. Thisscheme, called Max-Dependency, has the following form:
maxDðS; cÞ; D ¼ Iðfxi; i ¼ 1; . . . ;mg; cÞ: ð2ÞObviously, when m equals 1, the solution is the feature
that maximizes Iðxj; cÞð1 � j � MÞ. When m > 1, a simpleincremental search scheme is to add one feature at one time:given the set with m� 1 features, Sm�1, the mth feature canbe determined as the one that contributes to the largestincrease of IðS; cÞ, which takes the form of (3):
IðSm; cÞ ¼ZZ
pðSm; cÞ logpðSm; cÞpðSmÞpðcÞ
dSmdc
¼ZZ
pðSm�1; xm; cÞ logpðSm�1; xm; cÞpðSm�1; xmÞpðcÞ
dSm�1dxmdc
¼Z
� � �Z
pðx1; � � � ; xm; cÞ logpðx1; � � � ; xm; cÞpðx1; � � � ; xmÞpðcÞ
dx1 � � � dxmdc:
ð3Þ
Despite the theoretical value of Max-Dependency, it isoften hard to get an accurate estimation for multivariatedensity pðx1; . . . ; xmÞ and pðx1; . . . ; xm; cÞ, because of twodifficulties in the high-dimensional space: 1) the number ofsamples is often insufficient and 2) the multivariate densityestimation often involves computing the inverse of thehigh-dimensional covariance matrix, which is usually an ill-posed problem. Another drawback of Max-Dependency isthe slow computational speed. These problems are mostpronounced for continuous feature variables.
Even for discrete (categorical) features, the practicalproblems in implementing Max-Dependency cannot becompletely avoided. For example, suppose each feature hasthree categorical states and N samples. K features couldhave a maximum minð3K;NÞ joint states. When the numberof joint states increases very quickly and gets comparable tothe number of samples, N , the joint probability of thesefeatures, as well as the mutual information, cannot beestimated correctly. Hence, although Max-Dependencyfeature selection might be useful to select a very smallnumber of features when N is large, it is not appropriate forapplications where the aim is to achieve high classificationaccuracy with a reasonably compact set of features.
2.2 Max-Relevance and Min-Redundancy
As Max-Dependency criterion is hard to implement, analternative is to select features based on maximal relevancecriterion (Max-Relevance). Max-Relevance is to searchfeatures satisfying (4), which approximates DðS; cÞ in (2)with the mean value of all mutual information valuesbetween individual feature xi and class c:
maxDðS; cÞ; D ¼ 1
jSjXxi2S
Iðxi; cÞ: ð4Þ
It is likely that features selected according to Max-Relevance could have rich redundancy, i.e., the dependencyamong these features could be large. When two featureshighly depend on each other, the respective class-discrimi-native power would not change much if one of them wereremoved. Therefore, the following minimal redundancy (Min-Redundancy) condition can be added to select mutuallyexclusive features [5]:
minRðSÞ; R ¼ 1
jSj2X
xi;xj2SIðxi; xjÞ: ð5Þ
The criterion combining the above two constraints iscalled “minimal-redundancy-maximal-relevance” (mRMR)[5]. We define the operator �ðD;RÞ to combineD and R andconsider the following simplest form to optimize D and Rsimultaneously:
max�ðD;RÞ;� ¼ D�R: ð6Þ
Inpractice, incremental searchmethods canbeused to findthenear-optimal featuresdefinedby�ð:Þ.Supposewealreadyhave Sm�1, the feature set with m� 1 features. The task is toselect themth feature fromthe setfX � Sm�1g. This isdonebyselecting the feature that maximizes �ð:Þ. The respectiveincremental algorithm optimizes the following condition:
maxxj2X�Sm�1
Iðxj; cÞ � 1m�1
Xxi2Sm�1
Iðxj;xiÞ" #
: ð7Þ
PENG ET AL.: FEATURE SELECTION BASED ON MUTUAL INFORMATION: CRITERIA OF MAX-DEPENENCY, MAX-RELEVANCE, AND... 1227
The computational complexity of this incremental searchmethod is OðjSj �MÞ.
2.3 Optimal First-Order Incremental Selection
We prove in the following that the combination of Max-
Relevance and Min-Redundancy criteria, i.e., the mRMR
criterion, is equivalent to the Max-Dependency criterion if
one feature is selected (added) at one time. We call this type
of selection the “first-order” incremental search. We have
the following theorem:
Theorem. For the first-order incremental search, mRMR isequivalent to Max-Dependency (2).
Proof. By definition of the first-order search, we assumethat Sm�1, i.e., the set of m� 1 features, has already beenobtained. The task is to select the optimal mth feature xm
from set fX � Sm�1g.The dependency D in (2) and (3) is represented by
mutual information, i.e., D ¼ IðSm; cÞ, where Sm ¼fSm�1; xmg can be treated as a multivariate variable.Thus, by the definition of mutual information, we have:
IðSm; cÞ ¼ HðcÞ þHðSmÞ �HðSm; cÞ¼ HðcÞ þHðSm�1; xmÞ �HðSm�1; xm; cÞ;
ð8Þ
where Hð:Þ is the entropy of the respective multivariate(or univariate) variables.
Now, we define the following quantity JðSmÞ ¼Jðx1; . . . ; xmÞ for scalar variables x1; . . . ; xm,
Jðx1; x2; . . . ; xmÞ ¼Z� � �
Zpðx1; . . . ; xmÞ log
pðx1; x2; . . . ; xmÞpðx1Þ � � � pðxmÞ
dx1 � � � dxm:ð9Þ
Similarly, we define JðSm; cÞ ¼ Jðx1; . . . ; xm; cÞ as
Jðx1; x2; . . . ; xm; cÞ ¼Z� � �
Zpðx1; . . . ; xm; cÞ log
pðx1; x2; . . . ; xm; cÞpðx1Þ � � � pðxmÞpðcÞ
dx1 � � � dxmdc:
ð10Þ
We can easily derive (11) and (12) from (9) and (10),
HðSm�1; xmÞ ¼ HðSmÞ ¼Xmi¼1
HðxiÞ � JðSmÞ; ð11Þ
HðSm�1; xm; cÞ ¼ HðSm; cÞ ¼ HðcÞ þXmi¼1
HðxiÞ � JðSm; cÞ:
ð12Þ
By substituting them to the corresponding terms in(8), we have
IðSm; cÞ ¼ JðSm; cÞ � JðSmÞ¼ JðSm�1; xm; cÞ � JðSm�1; xmÞ:
ð13Þ
Obviously, Max-Dependency is equivalent to simul-taneously maximizing the first term and minimizing thesecond term.
We can use the Jensen’s Inequality [16] to show thesecond term JðSm�1; xmÞ is lower-bounded by 0. A
related and slightly simpler proof is to consider theinequality logðzÞ � z� 1 with the equality if and only ifz ¼ 1. We see that
� Jðx1; x2; . . . ; xmÞ
¼Z� � �Z
pðx1; . . . ; xmÞ logpðx1Þ � � � pðxmÞpðx1; . . . ; xmÞ
dx1 � � � dxm
�Z� � �Z
pðx1; . . . ; xmÞpðx1Þ � � � pðxmÞpðx1; . . . ; xmÞ
� 1
� �dx1 � � � dxm
¼Z� � �Z
pðx1Þ � � � pðxmÞdx1 � � � dxm
�Z� � �Z
pðx1; � � � ; xmÞdx1 � � � dxm
¼1� 1 ¼ 0:
ð14Þ
It is easy to verify that the minimum is attained when
pðx1; . . . ; xmÞ ¼ pðx1Þ � � � pðxmÞ, i.e., all the variables are
independent of each other. As all the m� 1 features have
been selected, this pair-wise independence condition
means that the mutual information between xm and any
selected feature xiði ¼ 1; . . . ;m� 1Þ is minimized. This isthe Min-Redundancy criterion.
We can also derive the upper bound of the first term in
(13), JðSm�1; c; xmÞ. For simplicity, let us first show the
upper bound of the general form Jðy1; . . . ; ynÞ, assuming
there are n variables y1; . . . ; yn. This can be seen as follows:
Jðy1; y2; . . . ; ynÞ
¼Z� � �Z
pðy1; . . . ; ynÞ logpðy1; . . . ; ynÞpðy1Þ � � � pðynÞ
dy1 � � � dyn
¼Z� � �Z
pðy1; . . . ; ynÞ logpðy1 jy2 ;...;ynÞpðy2 jy3 ;...;ynÞ���pðyn�1 jynÞpðynÞ
pðy1Þ���pðyn�1ÞpðynÞdy1 � � � dyn
¼Xn�1
i¼1
HðyiÞ�Hðy1jy2; . . . ; ynÞ�Hðy2jy3; . . . ; ynÞ�Hðyn�1jynÞ
�Xn�1
i¼1
HðyiÞ:
ð15Þ
Equation (15) can be easily extended as
Jðy1; y2; . . . ; ynÞ � min
Xni¼2
HðyiÞ;Xn
i¼1;i 6¼2
HðyiÞ; � � � ;Xn
i¼1;i6¼n�1
HðyiÞ;Xn�1
i¼1
HðyiÞ( )
:
ð16Þ
It is easy to verify the maximum of Jðy1; . . . ; ynÞ or,similarly, the first term in (13), JðSm�1; c; xmÞ, is attainedwhen all variables are maximally dependent. When Sm�1
has been fixed, this indicates that xm and c should have themaximaldependency.This is theMax-Relevance criterion.
Therefore, according to (13), as a combination of Max-
Relevance and Min-Redundancy, mRMR is equivalent to
Max-Dependency for first-order selection. tuNote that the quantity Jð:Þ in (9) and (10) has also been
called“mutual information” formultiple scalarvariables [10].
We have the following observations:
1228 IEEE TRANSACTIONS ON PATTERN ANALYSIS AND MACHINE INTELLIGENCE, VOL. 27, NO. 8, AUGUST 2005
1. Minimizing JðSmÞ only is equivalent to searchingmutually exclusive (independent) features.2 This isinsufficient for selecting highly discriminativefeatures.
2. Maximizing JðSm; cÞ only leads to Max-Relevance.Clearly, the difference between mRMR and Max-Relevance is rooted in the different definitions ofdependency (in terms of mutual information). Equa-tion (10)doesnot consider the joint effect of featuresonthe target class.Onthecontrary,Max-Dependency ((2)and (3)) considers the dependency between the datadistribution in subspaceRm and the target class c. Thisdifference is critical in many circumstances.
3. The equivalence between Max-Dependency andmRMR indicates mRMR is an optimal first-orderimplementation scheme of Max-Dependency.
4. Compared to Max-Dependency, mRMR avoids theestimation of multivariate densities pðx1; . . . ; xmÞand pðx1; . . . ; xm; cÞ. Instead, calculating the bivariatedensity pðxi; xjÞ and pðxi; cÞ could be much easierand more accurate. This also leads to a more efficientfeature selection algorithm.
3 FEATURE SELECTION ALGORITHMS
Our goal is to design efficient algorithms to select a compact
set of features. In Section 2, we propose a fast mRMR
feature selection scheme (7). A remaining issue is how to
determine the optimal number of features m. Since a
mechanism to remove potentially redundant features from
the already selected features has not been considered in the
incremental selection, according to the idea of mRMR, we
need to refine the results of incremental selection.We present a two-stage feature selection algorithm. In
the first stage, we find a candidate feature set using the
mRMR incremental selection method. In the second stage,
we use other more sophisticated schemes to search a
compact feature subset from the candidate feature set.
3.1 Selecting the Candidate Feature Set
To select the candidate feature set, we compute the cross-
validation classification error for a large number of features
and find a relatively stable range of small error. This range
is called �. The optimal number of features (denoted as n�)
of the candidate set is determined within �. The whole
process includes three steps:
1. Use mRMR incremental selection (7) to select n (apreset large number) sequential features from theinput X. This leads to n sequential feature setsS1 � S2 � . . . � Sn�1 � Sn.
2. Compare all the n sequential feature sets S1; . . . ;Sk; . . . ; Sn; ð1 � k � nÞ to find the range of k, called �,within which the respective (cross-validation classifi-cation) error ek is consistently small (i.e., has bothsmall mean and small variance).
3. Within �, find the smallest classification errore� ¼ min ek. The optimal size of the candidate featureset,n�, ischosenasthesmallestk thatcorrespondstoe�.
3.2 Selecting Compact Feature Subsets
Many sophisticated schemes can be used to search thecompact feature subsets from the candidate set Sn� . Toillustrate that mRMR can produce better candidate features,which favors better combination with other methods, weuse wrappers to search the compact feature subsets.
A wrapper [15], [18] is a feature selector that convolveswith a classifier (e.g., naive Bayes classifier), with the directgoal to minimize the classification error of the particularclassifier. Usually, wrappers can yield high classificationaccuracy for a particular classifier at the cost of highcomputational complexity and less generalization of theselected features onother classifiers. This is different from themRMR method introduced above, which does not optimizethe classification error directly. The latter type of approach(e.g., mRMR and Max-Relevance), sometimes called “filter”[18], [15], often selects features by testing whether somepreset conditions about the features and the target class aresatisfied. In practice, the filter approach has much lowercomplexity than wrappers; the features thus selected oftenyield comparable classification errors for different classifiers,because such features often form intrinsic clusters in therespective subspace.
By using mRMR feature selection in the first-stage, weintend to find a small set of candidate features, in which thewrappers can be applied at a much lower cost in the second-stage. We will continue our discussion on this point inSection 3.3.
In this paper, we consider two selection schemes ofwrapper, i.e., the backward and forward selections:
1. The backward selection tries to exclude one redun-dant feature at a time from the current feature set Sk
(initially, k is set ton� obtained in Section 3.1), with theconstraint that the resultant feature set Sk�1 leads to aclassification error ek�1 no worse than ek. Becauseevery feature inSk canbe considered in removal, thereare k different configurations of Sk�1. For eachpossible configuration, the respective classificationerror ek�1 is calculated. If, for every configuration, thecorresponding ek�1 is larger than ek, there is no gain ineither classification accuracy or feature dimensionreduction (i.e., every existing feature in Sk appears tobe useful), thus, the backward selection terminates(accordingly, the sizeof the compact feature subset,m,is set to k). Otherwise, among the k configurations ofSk�1, the one that leads to the largest error reduction ischosen as the new feature set. If there are multipleconfigurations leading to the same error reduction,one of them is chosen randomly. This decrementalselection procedure is repeated until the terminationcondition is satisfied.
2. The forward selection tries to select a subset ofm features from Sn� in an incremental manner.Initially, the classification error is set to the numberof samples, i.e., N . The wrapper first searches for thefeature subset with one feature, denoted as Z1, byselecting the feature x�
1 that leads to the largest errorreduction. Then, from the set fSn � Z1g, the wrapperselects the feature x�
2 so that the feature set Z2 ¼fZ1; x
�2g leads to the largest error reduction. This
incremental selection repeats until the classificationerror begins to increase, i.e., ekþ1 > ek. Note that we
PENG ET AL.: FEATURE SELECTION BASED ON MUTUAL INFORMATION: CRITERIA OF MAX-DEPENENCY, MAX-RELEVANCE, AND... 1229
2. In the field of feature extraction, minimizing JðSmÞ has led to analgorithm of independent component analysis [10].
allow the incremental search to continue when ekþ1
equals ek, becausewewant to search a space as large aspossible. Once the termination condition is satisfied,the selected number of features, m, is chosen as thedimension for which the lowest error is first reached.For example, suppose the sequence of classificationerrors of the first six features is [10, 8, 4, 4, 4, 7]. Theforward selection will terminate at five features, butonly return the first three features as the result; in thisway we obtain a more compact set of features thatminimizes the error.
3.3 Characteristic Feature Space
Given two feature sets S1n and S2
n both containing n features,and a classifier �, we say the feature space of S1
n is morecharacteristic if the classification error (using classifier�) onS1
n
issmaller thanonS2n.Thisdefinitionofcharacteristicspacecan
be extended recursively to the subsets (subspaces) of S1n and
S2n. Supposewehave a feature selectionmethodF to generate
a series of feature subsets in S1n : S1
1 � S12 � . . . � S1
k �. . . � S1
n�1 � S1n, and, similarly, a series of subsets in
S2n : S2
1 � . . . � S2k � . . . � S2
n. We say S1n is recursively more
characteristic (RM-characteristic) than S2n on the range
� ¼ ½klower; kupper�ð1 � klower < kupper � nÞ, if for every k 2 �,the classificationerroronS1
k is consistently smaller thanonS2k .
To determine which one of the feature sets S1n and S2
n issuperior, it is often insufficient to compare the classificationerrors for a specific size of the feature sets. A better way isto observe which set is RM-characteristic for a reasonablylarge range �. In the extreme case, we use � ¼ ½1; n�. Giventwo feature selection methods F 1 and F 2, if, the feature setsgenerated by F 1 are RM-characteristic than those generatedby F 2, we believe the method F 1 is better than F 2.
Let us consider the following example to comparemRMR and Max-Relevance based on the concept of RM-characteristic feature space. As a comprehensive study, weconsider both the sequential and nonsequential feature setsas follows (more details will be given in experiments):
1. A direct comparison is to examine whether themRMR sequential feature sets are RM-characteristicthan Max-Relevance sequential feature sets. We useboth methods to select n sequential feature sets S1 �. . . � Sk � . . . � Sn and compute the respectiveclassification errors. If, for most k 2 ½1; n�, we obtainsmaller errors on mRMR feature sets, we canconclude that mRMR is better than Max-Relevancefor the sequential (or incremental) feature selection.
2. We also use other feature selection methods (e.g.,wrappers) in the second stage of our feature-selectionalgorithmtoprobewhethermRMRisbetter thanMax-Relevance fornonsequential feature sets. For example,for the mRMR and Max-Relevance candidate featuresets with n� features, we use the backward-selection-wrapper to produce two series of feature sets withk ¼ n� � 1; n� � 2; . . . ;m features by removing somenonsequential features that arepotentially redundant.Then, the respective classification errors of thesefeature sets are computed. If, for most k, we find themRMR nonsequential feature subset leads to lowererror, we conclude themRMR candidate feature set is(approximately) RM-characteristic than the Max-Relevance candidate feature set.
3. Both the forward and backward selections ofwrapper are used. Different classifiers (as discussedlater in Section 4.2) are also considered in wrappers.We use both mRMR and Max-Relevance methods toselect the same number of candidate features andcompare the classification errors of the featuresubsets thereafter selected by wrappers. If all theobservations agree that the mRMR candidate featureset is RM-characteristic, we have high confidencethat mRMR is a superior feature selection method.
4. Given two feature sets, if S1n is RM-characteristic
than S2n, then it is faithful to compare the lowest
errors obtained for the subsets of S1n and S2
n.
Clearly, for feature spaces containing the same numberof features, wrappers can be applied more effectively on thespace that is RM-characteristic. This also indicates thatwrappers can be applied at a lower cost, by improving thecharacterizing strength of features and reducing thenumber of pre-selected features.
In real situations, it might not be possible to obtain e1k < e2kfor every k in �. Hence, we can define a confidence score 0 �� � 1 to indicate thepercentageofdifferentkvalues forwhichthe e1k < e2k condition is satisfied. For example, when � ¼ 0:90(90 percent k-values correspond to the e1k < e2k condition), it issafe to claim thatS1
n is approximatelyRM-characteristic thanS2n
on �. As can be seen in the experiments, usually thisapproximation is sufficient to compare two series of featuresubsets.
4 IMPLEMENTATION ISSUES
Before presenting the experimental results in Section 5, wediscuss two implementation issues regarding the experi-ments: 1) calculation of mutual information for both discreteand continuous data and 2) multiple types of classifiers usedin our experiments.
4.1 Mutual Information Estimation
We consider mutual-information-based feature selection forboth discrete and continuous data. For discrete (categorical)feature variables, the integral operation in (1) reduces tosummation. In this case, computing mutual information isstraightforward, because both joint and marginal probabil-ity tables can be estimated by tallying the samples ofcategorical variables in the data.
However, when at least one of variables x and y iscontinuous, their mutual information Iðx; yÞ is hard tocompute, because it is often difficult to compute the integralin thecontinuousspacebasedonalimitednumberofsamples.One solution is to incorporate data discretization as apreprocessing step. For some applications where it is unclearhow toproperlydiscretize the continuousdata, an alternativesolution is to use density estimation method (e.g., Parzenwindows)toapproximateIðx; yÞ,assuggestedbyearlierworkin medical image registration [7] and feature selection [17].
Given N samples of a variable x, the approximatedensity function ppðxÞ has the following form:
ppðxÞ ¼ 1
N
XNi¼1
�ðx� xðiÞ; hÞ; ð17Þ
where �ð:Þ is the Parzenwindow function as explainedbelow,xðiÞ is the ith sample, and h is the window width. Parzen has
1230 IEEE TRANSACTIONS ON PATTERN ANALYSIS AND MACHINE INTELLIGENCE, VOL. 27, NO. 8, AUGUST 2005
proven that, with the properly chosen �ð:Þ and h, theestimation ppðxÞ can converge to the true density pðxÞ whenN goes to infinity [21]. Usually, �ð:Þ is chosen as the Gaussianwindow:
�ðz; hÞ ¼ exp � zT��1z
2h2
� ��ð2�Þd=2hdj�j1=2
n o; ð18Þ
where z ¼ x� xðiÞ; d is the dimension of the sample x and� isthe covariance of z. When d ¼ 1, (17) returns the estimatedmarginal density; when d ¼ 2, we can use (17) to estimate thedensity of bivariate variable ðx; yÞ; pðx; yÞ, which is actuallythe joint density of x and y. For the sake of robust estimation,ford � 2,� isoftenapproximatedbyitsdiagonalcomponents.
4.2 Multiple Classifiers
Our mRMR feature selection method does not convolvewith specific classifiers. Therefore, we expect the featuresselected by this scheme have good performance on varioustypes of classifiers. To test this, we consider three widelyused classifiers, i.e., Naive Bayes (NB), Support VectorMachine (SVM), and Linear Discrimant Analysis (LDA).
NB [20] is one of the oldest classifiers. It is based on theBayes rule and assumes that feature variables are indepen-dent of each other given the target class. Given a samples ¼ fx1; x2; . . . ; xmg for m features, the posterior probabilitythat s belongs to class ck is
pðckjsÞ /Ymi¼1
pðxijckÞ; ð19Þ
where pðxijckÞ is the conditional probability table (ordensities) learned from examples in the training process.The Parzen-window density-approximation in (17) and (18)can be used to estimate pðxijckÞ for continuous features.Despite the conditional independence assumption, NB hasbeen shown to have good classification performance formany real data sets, on par with many more sophisticatedclassifiers [20].
SVM [29], [2] is a more modern classifier that uses kernelsto construct linear classification boundaries in higher dimen-sional spaces. We use the LIBSVM package [9], whichsupports both 2-class and multiclass classification.
As one of the earliest classifiers, LDA [30] learns a linearclassification boundary in the input feature space. It can beused for both 2-class and multiclass problems.
5 EXPERIMENTS
We tested our feature selection approach on two discreteand two continuous data sets. For these data sets, we usedmultiple ways to calculate the mutual information andtested the performance of the selected features based onthree classifiers introduced above. In this way, we provideda comprehensive study on the performance of our featureselection approach under different conditions.
This section is organized as follows: After a brief introduc-tion of data sets in Section 5.1, we compare mRMR againstMax-Dependency in terms of both feature selection complex-ity and feature classification accuracy in Section 5.2. Theseresults demonstrate the practical advantages of our mRMRscheme and provide a direct verification of the theoreticalanalysis in Section 2. Then, in Sections 5.3 and 5.4, we show adetailed comparison ofmRMRandMax-Relevance, the latter
ofwhichhasbeenwidelyused inpractice.Wedonot showthecomparison of mRMR with Min-Redundancy since Min-Redundancy alone usually leads to poor classification (and isseldomused to select features in real applications). Due to thespace limitation, in the following,wealwaysdemonstrate ourcomprehensive study with the most representative results.For simplicity, we use MaxDep to denote Max-DependencyandMaxRel todenoteMax-Relevance throughout the figures,tables, and texts in this section.
5.1 Data Sets
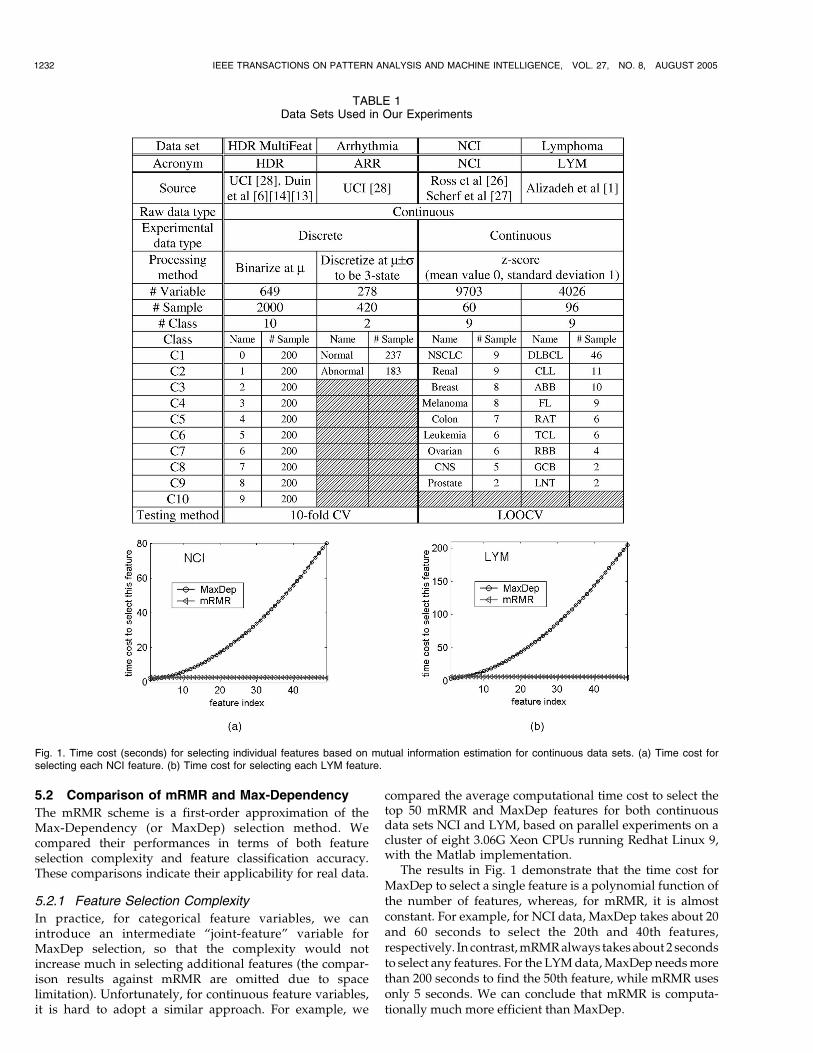
The four data sets we used are shown in Table 1. They havebeen extensively used in earlier studies [1], [13], [26], [27], [5].The first two data sets, HDR-MultiFeature (HDR) andArrhythmia (ARR), are also available on the UCI machinelearning archive [28]. The latter two, NCI and Lymphoma(LYM), are available on the respective authors’ Web sites. Allthe raw data are continuous. Each feature variable in the rawdata was preprocessed to have zero mean-value and unitvariance (i.e., transformed to their z-scores). To test ourapproaches on both discrete and continuous data, wediscretized the first two data sets, HDR and ARR. The othertwo data sets, NCI and LYM, were directly used forcontinuous feature selection.
The data set HDR [6], [14], [13], [28] contains 649 featuresfor 2,000 handwritten digits. The target class has 10 states,each ofwhich has 200 samples. Todiscretize the data set, eachfeaturevariablewasbinarizedat themeanvalue, i.e., it takes 1if it is larger than the mean value and -1 otherwise. Weselected and evaluated features using 10-fold Cross-Valida-tion (CV).
The data setARR [28] contains 420 samples of 278 features.The target class has two states with 237 and 183 samples,respectively. Each feature variable was discretized into threestates at the positions �� � (� is the mean value and � thestandarddeviation): it takes -1 if it is less than�� �, 1 if largerthan�þ �, and 0 if otherwise.Weused 10-foldCV for featureselection and testing.
The data set NCI [26], [27] contains 60 samples of9,703 genes; each gene is regarded as a feature. The targetclass has nine states corresponding to different types ofcancer; each type has two to nine samples. Since the samplenumber is small, we used the Leave-One-Out (LOO) CVmethod in testing.
The data set LYM [1] has 96 samples of 4,026 genefeatures. The target class corresponds to nine subtypes ofthe lymphoma. Each subtype has two to 46 samples. Thesample numbers for these subtypes are highly skewed,which makes it a hard classification problem.
Note that the feature numbers of these data sets are large(e.g.,NCIhasnearly10,000features).Thesedatasetsrepresentsome real applications where expensive feature selectionmethods (e.g., exhaustive search) cannot be used directly.They differ greatly in sample size, feature number, data type(discrete or continuous), data distribution, and target classtype (multiclass or 2-class). In addition, we studied differentmutual information calculation schemes for bothdiscrete andcontinuous data and provided results using different classi-fiers and different wrapper selection schemes. We believethese data andmethods provide a comprehensive testing suitfor feature selection methods under different conditions.
PENG ET AL.: FEATURE SELECTION BASED ON MUTUAL INFORMATION: CRITERIA OF MAX-DEPENENCY, MAX-RELEVANCE, AND... 1231
5.2 Comparison of mRMR and Max-Dependency
The mRMR scheme is a first-order approximation of theMax-Dependency (or MaxDep) selection method. Wecompared their performances in terms of both featureselection complexity and feature classification accuracy.These comparisons indicate their applicability for real data.
5.2.1 Feature Selection Complexity
In practice, for categorical feature variables, we canintroduce an intermediate “joint-feature” variable forMaxDep selection, so that the complexity would notincrease much in selecting additional features (the compar-ison results against mRMR are omitted due to spacelimitation). Unfortunately, for continuous feature variables,it is hard to adopt a similar approach. For example, we
compared the average computational time cost to select thetop 50 mRMR and MaxDep features for both continuousdata sets NCI and LYM, based on parallel experiments on acluster of eight 3.06G Xeon CPUs running Redhat Linux 9,with the Matlab implementation.
The results in Fig. 1 demonstrate that the time cost forMaxDep to select a single feature is a polynomial function ofthe number of features, whereas, for mRMR, it is almostconstant. For example, for NCI data, MaxDep takes about 20and 60 seconds to select the 20th and 40th features,respectively. In contrast,mRMRalways takesabout 2 secondsto select any features. For the LYMdata,MaxDep needsmorethan 200 seconds to find the 50th feature, while mRMR usesonly 5 seconds. We can conclude that mRMR is computa-tionally much more efficient than MaxDep.
1232 IEEE TRANSACTIONS ON PATTERN ANALYSIS AND MACHINE INTELLIGENCE, VOL. 27, NO. 8, AUGUST 2005
TABLE 1Data Sets Used in Our Experiments
Fig. 1. Time cost (seconds) for selecting individual features based on mutual information estimation for continuous data sets. (a) Time cost forselecting each NCI feature. (b) Time cost for selecting each LYM feature.
5.2.2 Feature Classification Accuracy
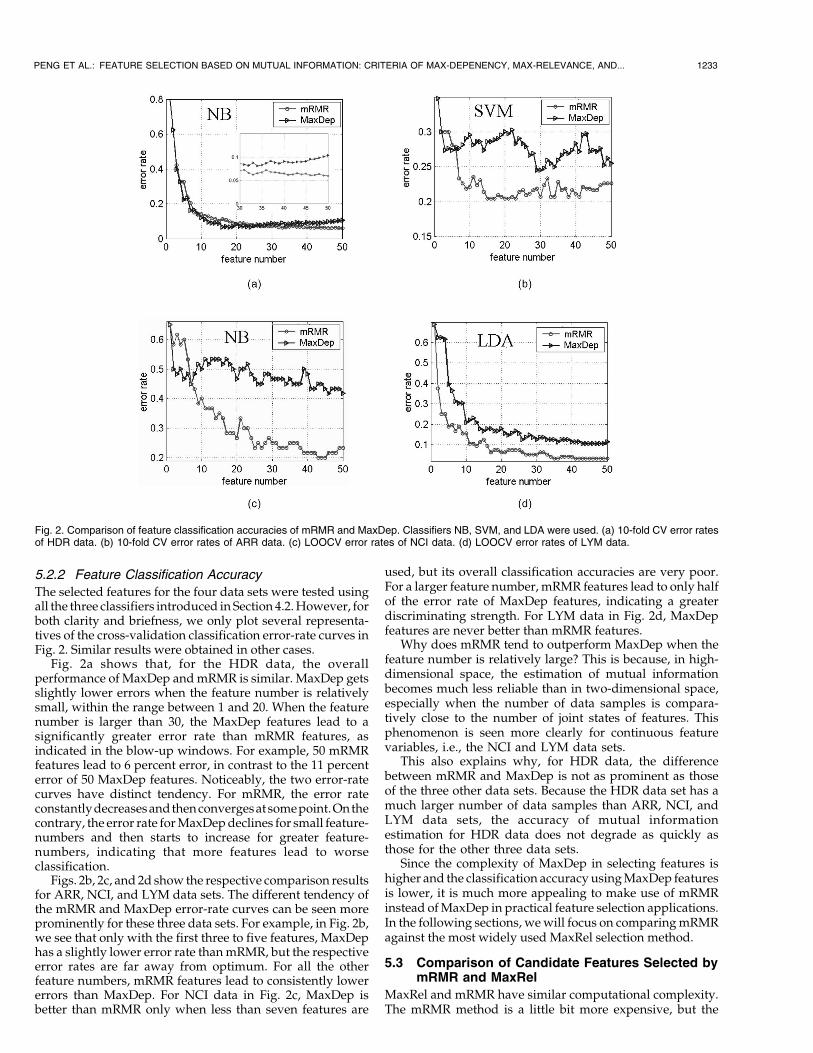
The selected features for the four data sets were tested usingall the three classifiers introduced in Section 4.2.However, forboth clarity and briefness, we only plot several representa-tives of the cross-validation classification error-rate curves inFig. 2. Similar results were obtained in other cases.
Fig. 2a shows that, for the HDR data, the overallperformance of MaxDep andmRMR is similar. MaxDep getsslightly lower errors when the feature number is relativelysmall, within the range between 1 and 20. When the featurenumber is larger than 30, the MaxDep features lead to asignificantly greater error rate than mRMR features, asindicated in the blow-up windows. For example, 50 mRMRfeatures lead to 6 percent error, in contrast to the 11 percenterror of 50 MaxDep features. Noticeably, the two error-ratecurves have distinct tendency. For mRMR, the error rateconstantlydecreasesandthenconvergesat somepoint.Onthecontrary, the error rate forMaxDepdeclines for small feature-numbers and then starts to increase for greater feature-numbers, indicating that more features lead to worseclassification.
Figs. 2b, 2c, and 2d show the respective comparison resultsfor ARR, NCI, and LYM data sets. The different tendency ofthe mRMR and MaxDep error-rate curves can be seen moreprominently for these three data sets. For example, in Fig. 2b,we see that only with the first three to five features, MaxDephas a slightly lower error rate thanmRMR, but the respectiveerror rates are far away from optimum. For all the otherfeature numbers, mRMR features lead to consistently lowererrors than MaxDep. For NCI data in Fig. 2c, MaxDep isbetter than mRMR only when less than seven features are
used, but its overall classification accuracies are very poor.For a larger feature number, mRMR features lead to only halfof the error rate of MaxDep features, indicating a greaterdiscriminating strength. For LYM data in Fig. 2d, MaxDepfeatures are never better than mRMR features.
Why does mRMR tend to outperform MaxDep when thefeature number is relatively large? This is because, in high-dimensional space, the estimation of mutual informationbecomes much less reliable than in two-dimensional space,especially when the number of data samples is compara-tively close to the number of joint states of features. Thisphenomenon is seen more clearly for continuous featurevariables, i.e., the NCI and LYM data sets.
This also explains why, for HDR data, the differencebetween mRMR and MaxDep is not as prominent as thoseof the three other data sets. Because the HDR data set has amuch larger number of data samples than ARR, NCI, andLYM data sets, the accuracy of mutual informationestimation for HDR data does not degrade as quickly asthose for the other three data sets.
Since the complexity of MaxDep in selecting features ishigher and the classification accuracy usingMaxDep featuresis lower, it is much more appealing to make use of mRMRinstead ofMaxDep in practical feature selection applications.In the following sections, wewill focus on comparingmRMRagainst the most widely used MaxRel selection method.
5.3 Comparison of Candidate Features Selected bymRMR and MaxRel
MaxRel and mRMR have similar computational complexity.The mRMR method is a little bit more expensive, but the
PENG ET AL.: FEATURE SELECTION BASED ON MUTUAL INFORMATION: CRITERIA OF MAX-DEPENENCY, MAX-RELEVANCE, AND... 1233
Fig. 2. Comparison of feature classification accuracies of mRMR and MaxDep. Classifiers NB, SVM, and LDA were used. (a) 10-fold CV error ratesof HDR data. (b) 10-fold CV error rates of ARR data. (c) LOOCV error rates of NCI data. (d) LOOCV error rates of LYM data.
difference is minor. Thus, we focus on comparing thefeature classification accuracies.
5.3.1 Discrete Data
Figs. 3 and 4 show results of the incremental featureselection and classification for discrete data sets. The featurenumber ranges from 1 to 50.
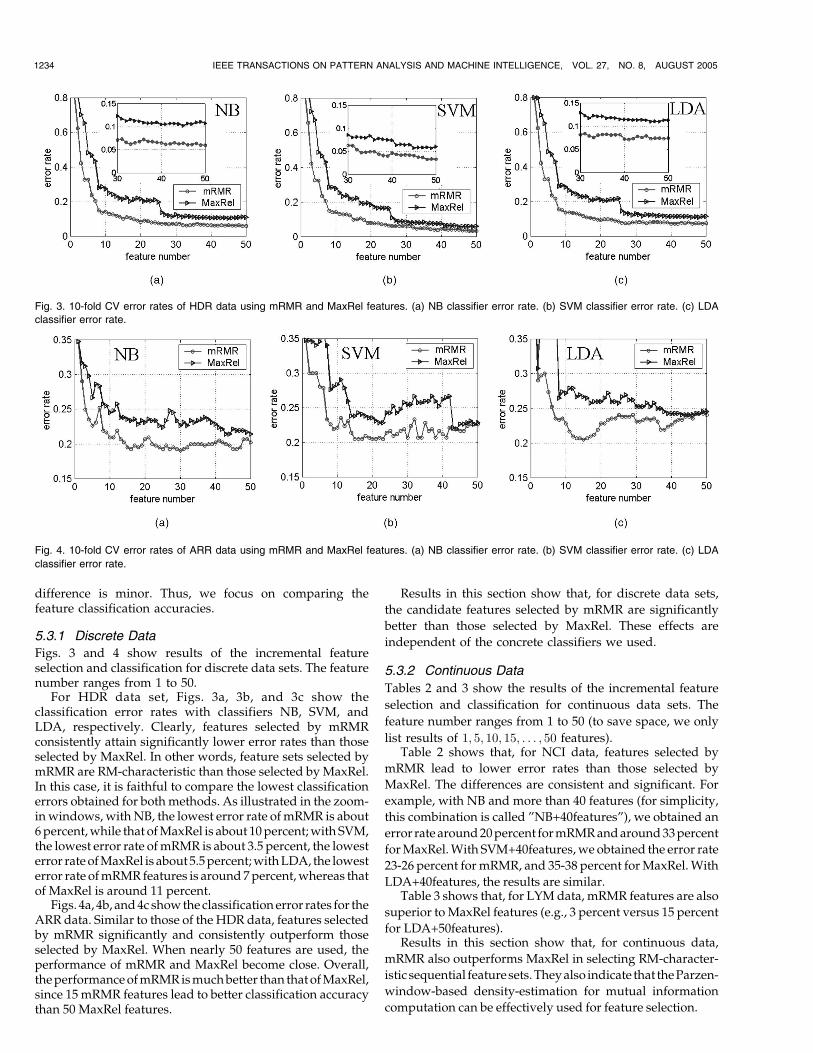
For HDR data set, Figs. 3a, 3b, and 3c show theclassification error rates with classifiers NB, SVM, andLDA, respectively. Clearly, features selected by mRMRconsistently attain significantly lower error rates than thoseselected by MaxRel. In other words, feature sets selected bymRMR are RM-characteristic than those selected by MaxRel.In this case, it is faithful to compare the lowest classificationerrors obtained for bothmethods. As illustrated in the zoom-inwindows, withNB, the lowest error rate ofmRMR is about6percent,while that ofMaxRel is about 10percent;with SVM,the lowest error rate ofmRMR is about 3.5 percent, the lowesterror rateofMaxRel is about5.5percent;withLDA, the lowesterror rate ofmRMR features is around7percent,whereas thatof MaxRel is around 11 percent.
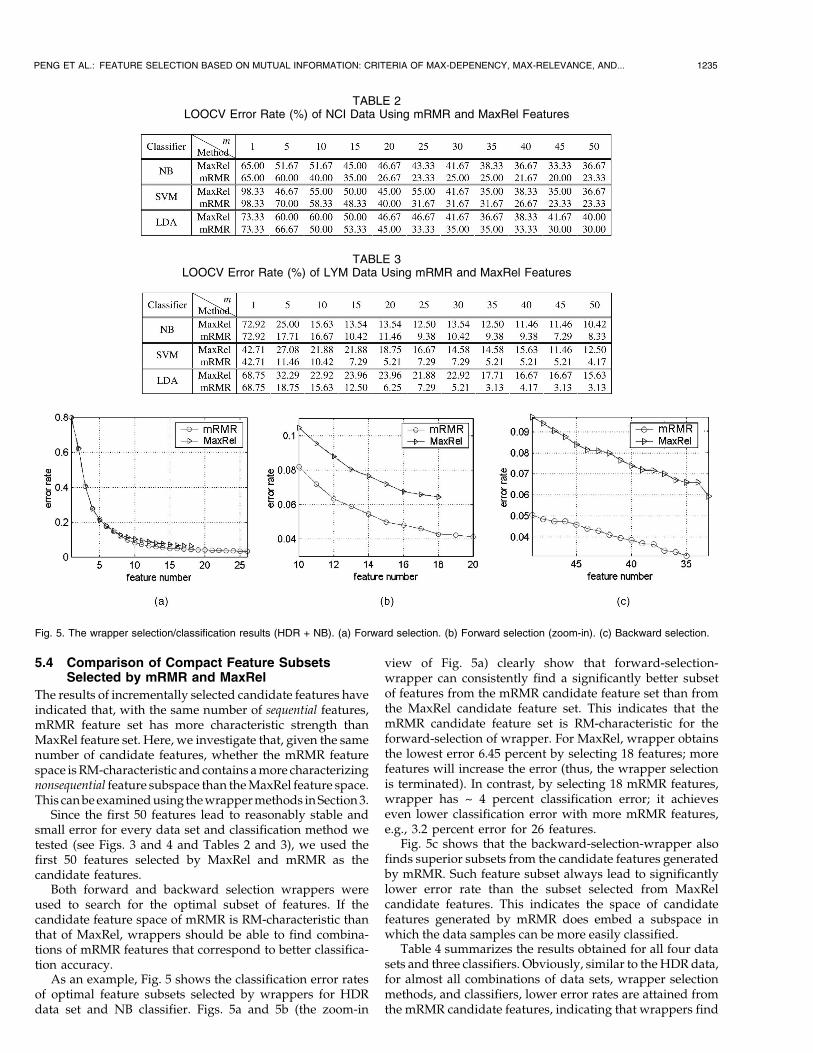
Figs. 4a, 4b, and4c showtheclassificationerror rates for theARR data. Similar to those of the HDR data, features selectedby mRMR significantly and consistently outperform thoseselected by MaxRel. When nearly 50 features are used, theperformance of mRMR and MaxRel become close. Overall,theperformanceofmRMRismuchbetter than thatofMaxRel,since 15 mRMR features lead to better classification accuracythan 50 MaxRel features.
Results in this section show that, for discrete data sets,
the candidate features selected by mRMR are significantly
better than those selected by MaxRel. These effects are
independent of the concrete classifiers we used.
5.3.2 Continuous Data
Tables 2 and 3 show the results of the incremental feature
selection and classification for continuous data sets. The
feature number ranges from 1 to 50 (to save space, we only
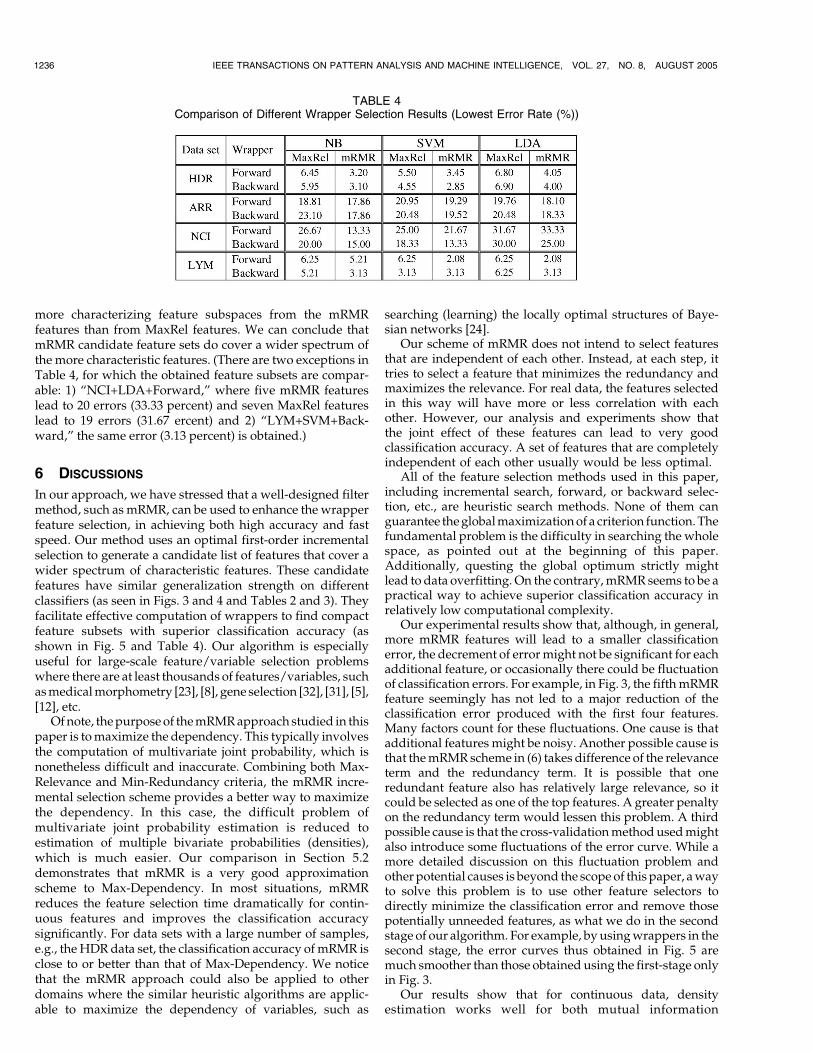
list results of 1; 5; 10; 15; . . . ; 50 features).Table 2 shows that, for NCI data, features selected by
mRMR lead to lower error rates than those selected by
MaxRel. The differences are consistent and significant. For
example, with NB and more than 40 features (for simplicity,
this combination is called ”NB+40features”), we obtained an
error rate around20percent formRMRandaround33percent
forMaxRel.With SVM+40features,we obtained the error rate
23-26 percent formRMR, and 35-38 percent forMaxRel.With
LDA+40features, the results are similar.Table 3 shows that, for LYMdata, mRMR features are also
superior toMaxRel features (e.g., 3 percent versus 15 percent
for LDA+50features).Results in this section show that, for continuous data,
mRMR also outperforms MaxRel in selecting RM-character-
istic sequential featuresets.Theyalso indicate that theParzen-
window-based density-estimation for mutual information
computation can be effectively used for feature selection.
1234 IEEE TRANSACTIONS ON PATTERN ANALYSIS AND MACHINE INTELLIGENCE, VOL. 27, NO. 8, AUGUST 2005
Fig. 3. 10-fold CV error rates of HDR data using mRMR and MaxRel features. (a) NB classifier error rate. (b) SVM classifier error rate. (c) LDA
classifier error rate.
Fig. 4. 10-fold CV error rates of ARR data using mRMR and MaxRel features. (a) NB classifier error rate. (b) SVM classifier error rate. (c) LDA
classifier error rate.
5.4 Comparison of Compact Feature SubsetsSelected by mRMR and MaxRel
The results of incrementally selected candidate features haveindicated that, with the same number of sequential features,mRMR feature set has more characteristic strength thanMaxRel feature set. Here, we investigate that, given the samenumber of candidate features, whether the mRMR featurespace isRM-characteristic and contains amore characterizingnonsequential feature subspace than theMaxRel feature space.This canbeexaminedusing thewrappermethods inSection3.
Since the first 50 features lead to reasonably stable andsmall error for every data set and classification method wetested (see Figs. 3 and 4 and Tables 2 and 3), we used thefirst 50 features selected by MaxRel and mRMR as thecandidate features.
Both forward and backward selection wrappers wereused to search for the optimal subset of features. If thecandidate feature space of mRMR is RM-characteristic thanthat of MaxRel, wrappers should be able to find combina-tions of mRMR features that correspond to better classifica-tion accuracy.
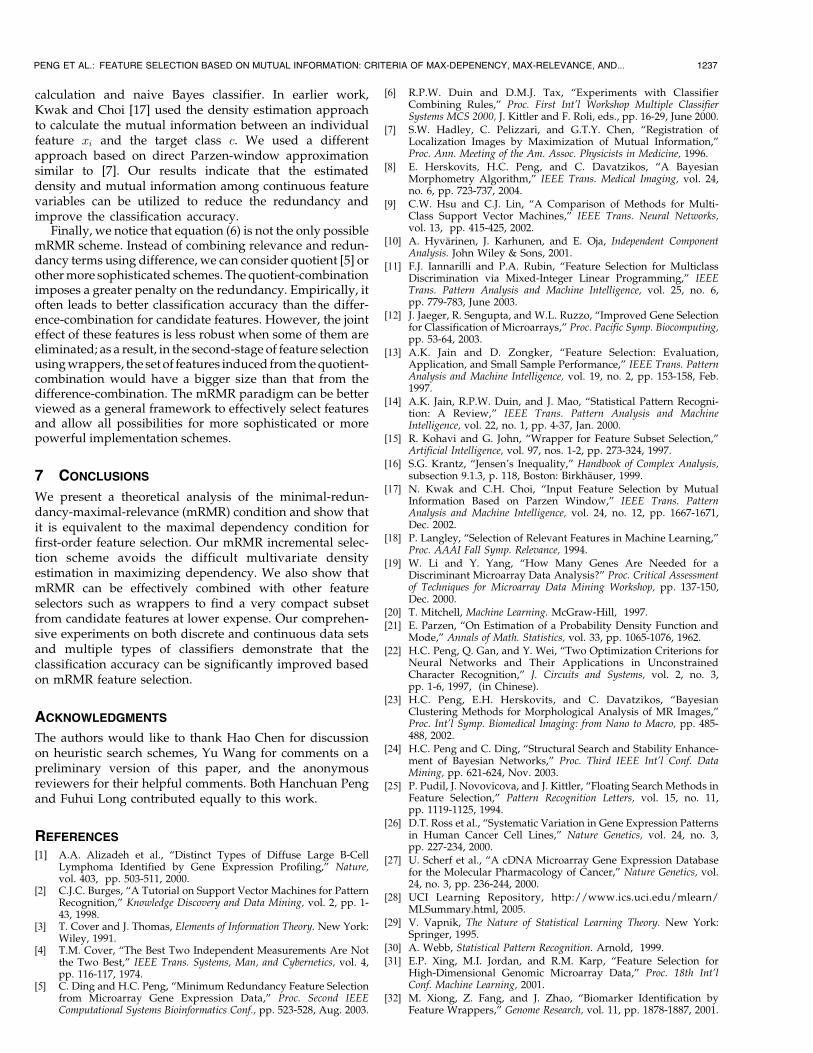
As an example, Fig. 5 shows the classification error ratesof optimal feature subsets selected by wrappers for HDRdata set and NB classifier. Figs. 5a and 5b (the zoom-in
view of Fig. 5a) clearly show that forward-selection-wrapper can consistently find a significantly better subsetof features from the mRMR candidate feature set than fromthe MaxRel candidate feature set. This indicates that themRMR candidate feature set is RM-characteristic for theforward-selection of wrapper. For MaxRel, wrapper obtainsthe lowest error 6.45 percent by selecting 18 features; morefeatures will increase the error (thus, the wrapper selectionis terminated). In contrast, by selecting 18 mRMR features,wrapper has ~ 4 percent classification error; it achieveseven lower classification error with more mRMR features,e.g., 3.2 percent error for 26 features.
Fig. 5c shows that the backward-selection-wrapper alsofinds superior subsets from the candidate features generatedby mRMR. Such feature subset always lead to significantlylower error rate than the subset selected from MaxRelcandidate features. This indicates the space of candidatefeatures generated by mRMR does embed a subspace inwhich the data samples can be more easily classified.
Table 4 summarizes the results obtained for all four datasets and three classifiers. Obviously, similar to theHDRdata,for almost all combinations of data sets, wrapper selectionmethods, and classifiers, lower error rates are attained fromthe mRMR candidate features, indicating that wrappers find
PENG ET AL.: FEATURE SELECTION BASED ON MUTUAL INFORMATION: CRITERIA OF MAX-DEPENENCY, MAX-RELEVANCE, AND... 1235
TABLE 2LOOCV Error Rate (%) of NCI Data Using mRMR and MaxRel Features
TABLE 3LOOCV Error Rate (%) of LYM Data Using mRMR and MaxRel Features
Fig. 5. The wrapper selection/classification results (HDR + NB). (a) Forward selection. (b) Forward selection (zoom-in). (c) Backward selection.
more characterizing feature subspaces from the mRMRfeatures than from MaxRel features. We can conclude thatmRMR candidate feature sets do cover a wider spectrum ofthe more characteristic features. (There are two exceptions inTable 4, for which the obtained feature subsets are compar-able: 1) “NCI+LDA+Forward,” where five mRMR featureslead to 20 errors (33.33 percent) and seven MaxRel featureslead to 19 errors (31.67 ercent) and 2) “LYM+SVM+Back-ward,” the same error (3.13 percent) is obtained.)
6 DISCUSSIONS
In our approach, we have stressed that a well-designed filtermethod, such as mRMR, can be used to enhance the wrapperfeature selection, in achieving both high accuracy and fastspeed. Our method uses an optimal first-order incrementalselection to generate a candidate list of features that cover awider spectrum of characteristic features. These candidatefeatures have similar generalization strength on differentclassifiers (as seen in Figs. 3 and 4 and Tables 2 and 3). Theyfacilitate effective computation of wrappers to find compactfeature subsets with superior classification accuracy (asshown in Fig. 5 and Table 4). Our algorithm is especiallyuseful for large-scale feature/variable selection problemswhere there are at least thousands of features/variables, suchasmedicalmorphometry [23], [8], gene selection [32], [31], [5],[12], etc.
Ofnote, thepurposeof themRMRapproach studied in thispaper is tomaximize the dependency. This typically involvesthe computation of multivariate joint probability, which isnonetheless difficult and inaccurate. Combining both Max-Relevance and Min-Redundancy criteria, the mRMR incre-mental selection scheme provides a better way to maximizethe dependency. In this case, the difficult problem ofmultivariate joint probability estimation is reduced toestimation of multiple bivariate probabilities (densities),which is much easier. Our comparison in Section 5.2demonstrates that mRMR is a very good approximationscheme to Max-Dependency. In most situations, mRMRreduces the feature selection time dramatically for contin-uous features and improves the classification accuracysignificantly. For data sets with a large number of samples,e.g., the HDRdata set, the classification accuracy of mRMR isclose to or better than that of Max-Dependency. We noticethat the mRMR approach could also be applied to otherdomains where the similar heuristic algorithms are applic-able to maximize the dependency of variables, such as
searching (learning) the locally optimal structures of Baye-sian networks [24].
Our scheme of mRMR does not intend to select featuresthat are independent of each other. Instead, at each step, ittries to select a feature that minimizes the redundancy andmaximizes the relevance. For real data, the features selectedin this way will have more or less correlation with eachother. However, our analysis and experiments show thatthe joint effect of these features can lead to very goodclassification accuracy. A set of features that are completelyindependent of each other usually would be less optimal.
All of the feature selection methods used in this paper,including incremental search, forward, or backward selec-tion, etc., are heuristic search methods. None of them canguarantee theglobalmaximizationof a criterion function.Thefundamental problem is the difficulty in searching the wholespace, as pointed out at the beginning of this paper.Additionally, questing the global optimum strictly mightlead to data overfitting. On the contrary,mRMRseems to be apractical way to achieve superior classification accuracy inrelatively low computational complexity.
Our experimental results show that, although, in general,more mRMR features will lead to a smaller classificationerror, the decrement of errormight not be significant for eachadditional feature, or occasionally there could be fluctuationof classification errors. For example, in Fig. 3, the fifthmRMRfeature seemingly has not led to a major reduction of theclassification error produced with the first four features.Many factors count for these fluctuations. One cause is thatadditional features might be noisy. Another possible cause isthat themRMRscheme in (6) takes difference of the relevanceterm and the redundancy term. It is possible that oneredundant feature also has relatively large relevance, so itcould be selected as one of the top features. A greater penaltyon the redundancy term would lessen this problem. A thirdpossible cause is that the cross-validationmethodusedmightalso introduce some fluctuations of the error curve. While amore detailed discussion on this fluctuation problem andother potential causes is beyond the scope of this paper, awayto solve this problem is to use other feature selectors todirectly minimize the classification error and remove thosepotentially unneeded features, as what we do in the secondstage of our algorithm. For example, byusingwrappers in thesecond stage, the error curves thus obtained in Fig. 5 aremuch smoother than those obtained using the first-stage onlyin Fig. 3.
Our results show that for continuous data, densityestimation works well for both mutual information
1236 IEEE TRANSACTIONS ON PATTERN ANALYSIS AND MACHINE INTELLIGENCE, VOL. 27, NO. 8, AUGUST 2005
TABLE 4Comparison of Different Wrapper Selection Results (Lowest Error Rate (%))
calculation and naive Bayes classifier. In earlier work,Kwak and Choi [17] used the density estimation approachto calculate the mutual information between an individualfeature xi and the target class c. We used a differentapproach based on direct Parzen-window approximationsimilar to [7]. Our results indicate that the estimateddensity and mutual information among continuous featurevariables can be utilized to reduce the redundancy andimprove the classification accuracy.
Finally, we notice that equation (6) is not the only possiblemRMR scheme. Instead of combining relevance and redun-dancy terms using difference, we can consider quotient [5] orothermore sophisticated schemes. The quotient-combinationimposes a greater penalty on the redundancy. Empirically, itoften leads to better classification accuracy than the differ-ence-combination for candidate features. However, the jointeffect of these features is less robust when some of them areeliminated; as a result, in the second-stage of feature selectionusingwrappers, the set of features induced fromthequotient-combination would have a bigger size than that from thedifference-combination. The mRMR paradigm can be betterviewed as a general framework to effectively select featuresand allow all possibilities for more sophisticated or morepowerful implementation schemes.
7 CONCLUSIONS
We present a theoretical analysis of the minimal-redun-dancy-maximal-relevance (mRMR) condition and show thatit is equivalent to the maximal dependency condition forfirst-order feature selection. Our mRMR incremental selec-tion scheme avoids the difficult multivariate densityestimation in maximizing dependency. We also show thatmRMR can be effectively combined with other featureselectors such as wrappers to find a very compact subsetfrom candidate features at lower expense. Our comprehen-sive experiments on both discrete and continuous data setsand multiple types of classifiers demonstrate that theclassification accuracy can be significantly improved basedon mRMR feature selection.
ACKNOWLEDGMENTS
The authors would like to thank Hao Chen for discussionon heuristic search schemes, Yu Wang for comments on apreliminary version of this paper, and the anonymousreviewers for their helpful comments. Both Hanchuan Pengand Fuhui Long contributed equally to this work.
REFERENCES
[1] A.A. Alizadeh et al., “Distinct Types of Diffuse Large B-CellLymphoma Identified by Gene Expression Profiling,” Nature,vol. 403, pp. 503-511, 2000.
[2] C.J.C. Burges, “A Tutorial on Support Vector Machines for PatternRecognition,” Knowledge Discovery and Data Mining, vol. 2, pp. 1-43, 1998.
[3] T. Cover and J. Thomas, Elements of Information Theory. New York:Wiley, 1991.
[4] T.M. Cover, “The Best Two Independent Measurements Are Notthe Two Best,” IEEE Trans. Systems, Man, and Cybernetics, vol. 4,pp. 116-117, 1974.
[5] C. Ding and H.C. Peng, “Minimum Redundancy Feature Selectionfrom Microarray Gene Expression Data,” Proc. Second IEEEComputational Systems Bioinformatics Conf., pp. 523-528, Aug. 2003.
[6] R.P.W. Duin and D.M.J. Tax, “Experiments with ClassifierCombining Rules,” Proc. First Int’l Workshop Multiple ClassifierSystems MCS 2000, J. Kittler and F. Roli, eds., pp. 16-29, June 2000.
[7] S.W. Hadley, C. Pelizzari, and G.T.Y. Chen, “Registration ofLocalization Images by Maximization of Mutual Information,”Proc. Ann. Meeting of the Am. Assoc. Physicists in Medicine, 1996.
[8] E. Herskovits, H.C. Peng, and C. Davatzikos, “A BayesianMorphometry Algorithm,” IEEE Trans. Medical Imaging, vol. 24,no. 6, pp. 723-737, 2004.
[9] C.W. Hsu and C.J. Lin, “A Comparison of Methods for Multi-Class Support Vector Machines,” IEEE Trans. Neural Networks,vol. 13, pp. 415-425, 2002.
[10] A. Hyvarinen, J. Karhunen, and E. Oja, Independent ComponentAnalysis. John Wiley & Sons, 2001.
[11] F.J. Iannarilli and P.A. Rubin, “Feature Selection for MulticlassDiscrimination via Mixed-Integer Linear Programming,” IEEETrans. Pattern Analysis and Machine Intelligence, vol. 25, no. 6,pp. 779-783, June 2003.
[12] J. Jaeger, R. Sengupta, and W.L. Ruzzo, “Improved Gene Selectionfor Classification of Microarrays,” Proc. Pacific Symp. Biocomputing,pp. 53-64, 2003.
[13] A.K. Jain and D. Zongker, “Feature Selection: Evaluation,Application, and Small Sample Performance,” IEEE Trans. PatternAnalysis and Machine Intelligence, vol. 19, no. 2, pp. 153-158, Feb.1997.
[14] A.K. Jain, R.P.W. Duin, and J. Mao, “Statistical Pattern Recogni-tion: A Review,” IEEE Trans. Pattern Analysis and MachineIntelligence, vol. 22, no. 1, pp. 4-37, Jan. 2000.
[15] R. Kohavi and G. John, “Wrapper for Feature Subset Selection,”Artificial Intelligence, vol. 97, nos. 1-2, pp. 273-324, 1997.
[16] S.G. Krantz, “Jensen’s Inequality,” Handbook of Complex Analysis,subsection 9.1.3, p. 118, Boston: Birkhauser, 1999.
[17] N. Kwak and C.H. Choi, “Input Feature Selection by MutualInformation Based on Parzen Window,” IEEE Trans. PatternAnalysis and Machine Intelligence, vol. 24, no. 12, pp. 1667-1671,Dec. 2002.
[18] P. Langley, “Selection of Relevant Features in Machine Learning,”Proc. AAAI Fall Symp. Relevance, 1994.
[19] W. Li and Y. Yang, “How Many Genes Are Needed for aDiscriminant Microarray Data Analysis?” Proc. Critical Assessmentof Techniques for Microarray Data Mining Workshop, pp. 137-150,Dec. 2000.
[20] T. Mitchell, Machine Learning. McGraw-Hill, 1997.[21] E. Parzen, “On Estimation of a Probability Density Function and
Mode,” Annals of Math. Statistics, vol. 33, pp. 1065-1076, 1962.[22] H.C. Peng, Q. Gan, and Y. Wei, “Two Optimization Criterions for
Neural Networks and Their Applications in UnconstrainedCharacter Recognition,” J. Circuits and Systems, vol. 2, no. 3,pp. 1-6, 1997, (in Chinese).
[23] H.C. Peng, E.H. Herskovits, and C. Davatzikos, “BayesianClustering Methods for Morphological Analysis of MR Images,”Proc. Int’l Symp. Biomedical Imaging: from Nano to Macro, pp. 485-488, 2002.
[24] H.C. Peng and C. Ding, “Structural Search and Stability Enhance-ment of Bayesian Networks,” Proc. Third IEEE Int’l Conf. DataMining, pp. 621-624, Nov. 2003.
[25] P. Pudil, J. Novovicova, and J. Kittler, “Floating Search Methods inFeature Selection,” Pattern Recognition Letters, vol. 15, no. 11,pp. 1119-1125, 1994.
[26] D.T. Ross et al., “Systematic Variation in Gene Expression Patternsin Human Cancer Cell Lines,” Nature Genetics, vol. 24, no. 3,pp. 227-234, 2000.
[27] U. Scherf et al., “A cDNA Microarray Gene Expression Databasefor the Molecular Pharmacology of Cancer,” Nature Genetics, vol.24, no. 3, pp. 236-244, 2000.
[28] UCI Learning Repository, http://www.ics.uci.edu/mlearn/MLSummary.html, 2005.
[29] V. Vapnik, The Nature of Statistical Learning Theory. New York:Springer, 1995.
[30] A. Webb, Statistical Pattern Recognition. Arnold, 1999.[31] E.P. Xing, M.I. Jordan, and R.M. Karp, “Feature Selection for
High-Dimensional Genomic Microarray Data,” Proc. 18th Int’lConf. Machine Learning, 2001.
[32] M. Xiong, Z. Fang, and J. Zhao, “Biomarker Identification byFeature Wrappers,” Genome Research, vol. 11, pp. 1878-1887, 2001.
PENG ET AL.: FEATURE SELECTION BASED ON MUTUAL INFORMATION: CRITERIA OF MAX-DEPENENCY, MAX-RELEVANCE, AND... 1237
Hanchuan Peng received the PhD degree inbiomedical engineering from Southeast Univer-sity, China, in 1999. He is a researcher with theLawrence Berkeley National Laboratory, Univer-sity of California at Berkeley. His researchinterests include image data mining, bioinfor-matics and medical informatics, pattern recogni-tion and computer vision, signal processing,artificial intelligence and machine learning, andbiocomputing. He has published about 50 peer-
reviewed research papers and won several awards including thechampion of national computer software competition in 1997, coa-warded by Ministry of Education, China, and Ministry of ElectronicIndustry, China. He is the program chair of the 2005 IEEE InternationalWorkshop on BioImage Data Mining and Informatics. His Web page ishttp://hpeng.net. He is a member of the IEEE.
Fuhui Long received the PhD degree inelectronic and information engineering fromXi’an Jiaotong University, China, in 1998. Sheworked as a research associate at the MedicalCenter and the Center for Cognitive Neu-roscience at Duke University (Durham, NorthCarolina) from 2001 to 2004. She is now aresearcher at the Lawrence Berkeley NationalLaboratory, University of California at Berkeley.Her research interests include bioimaging, image
processing, computer vision, data mining, and pattern recognition. Sheis a member of Sigma Xi, Vision Science Society, and Imaging Scienceand Technology society.
Chris Ding received the PhD degree fromColumbia University and worked at the Califor-nia Institute of Technology and Jet PropulsionLaboratory. He is a staff computer scientist atLawrence Berkeley National Laboratory, Uni-versity of California at Berkeley. He started workon biomolecule simulations in 1992 and compu-tational genomics research in 1998. He is thefirst to use support vector machines for protein3D structure prediction. He’s written 10 bioinfor-
matics papers and also published extensively on machine learning, datamining, text, and Web analysis. He’s given invited seminars at Stanford,Carnegie Mellon, UC Berkeley, UC Davis, and many conferences,workshops, and panel discussions. He has given a tutorial onbioinformatics and data mining in ICDM ’03 and a tutorial on spectralclustering in ICML ’04. He is on the program committee in ICDM ’03,’04, and SDM ’04. He is a referee on many journals and has also servedon US National Science Foundation panels. For more details visit:http://crd.lbl.gov/~cding.
. For more information on this or any other computing topic,please visit our Digital Library at www.computer.org/publications/dlib.
1238 IEEE TRANSACTIONS ON PATTERN ANALYSIS AND MACHINE INTELLIGENCE, VOL. 27, NO. 8, AUGUST 2005