Embed Size (px)
Citation preview
122. PROFILE ON THE PRODUCTION OF SANITARY
NAPKIN
122-1
TABLE OF CONTENTS
PAGE
I. SUMMARY 122-2
II. PRODUCT DESCRIPTION & APPLICATION 122-2
III. MARKET STUDY AND PLANT CAPACITY 122-3
A. MARKET STUDY 122-3
B. PLANT CAPACITY & PRODUCTION PROGRAMME 122-6
IV. MATERIALS AND INPUTS 122-6
A. RAW & AUXILIARY MATERIALS 122-6
B. UTILITIES 122-7
V. TECHNOLOGY & ENGINEERING 122-7
A. TECHNOLOGY 122-7
B. ENGINEERING 122-8
VI. HUMAN RESOURCE & TRAINING REQUIREMENT 122-12
A. HUMAN RESOURCE REQUIREMENT 122-12
B. TRAINING REQUIREMENT 122-13
VII. FINANCIAL ANLYSIS 122-13
A. TOTAL INITIAL INVESTMENT COST 122-14
B. PRODUCTION COST 122-15
C. FINANCIAL EVALUATION 122-15
D. ECONOMIC AND SOCIAL BENEFITS 122-17
122-2
I. SUMMARY
This profile envisages the establishment of a plant for the production of sanitary napkin with a
capacity of 241 tons per annum. Sanitary napkin is a piece of soft paper used for wiping the lips
or finger after a meal
The demand for sanitary napkin is entirely met through domestic production and import. The
present (2012) demand for sanitary napkin is estimated at 15,748 tones. The demand for sanitary
napkin is projected to reach 22,088 tons and 30,979 tons by the year 2017 and 2022, respectively.
The principal raw materials required are tissue paper (2 ply), core paper, wrapping paper (45
gm/m2), all of which have to be imported.
The total investment cost of the project including working capital is estimated at Birr 6.67
million. From the total investment cost the highest share (Birr 5.28 million or 79.23%) is
accounted by fixed investment cost followed by pre operation cost (Birr 917.65 thousand or
13.75%) and initial working capital (Birr 468.25 thousand or 7.02%). From the total investment
cost Birr 2.42 million or 36.38% is required in foreign currency.
The project is financially viable with an internal rate of return (IRR) of 31.07% and a net present
value (NPV) of Birr 6.90 million discounted at 10%.
The project can create employment for 23 persons. The establishment of such factory will have
a foreign exchange saving effect to the country by substituting the current imports. The project
will and also generates income for the Government in terms of tax revenue and payroll tax.
II. PRODUCT DESCRIPTION AND APPLICATION
Sanitary napkin is a piece of soft paper used for wiping the lips or finger after a meal. As a
result, the proposed product has a wide application and use by middle and upper class citizens.
Sanitary napkin is also widely used in occasional ceremonies like wedding, birth day party and
other farewells. The product has also considerable demand by hotels, restaurants and pastries.
122-3
Toilet paper is a product prepared from soft paper usually in roll form of specified dimension.
The normal size of the roll toilet paper is width 115 mm + 10 mm, inner diameter of winding 37-
39 mm. The substance of the paper is 21-23 gm/cm2. The raw material can be either clean soft
paper or waste paper. Toilet paper is getting high demand in offices, restaurants, hotels,
commercial centers, schools, homes, etc.
Standard size of sanitary napkin is as follows.
Width 70 mm
Length 190 mm
Thickness 8 mm or more
Weight 6 gm
III. MARKET STUDY AND PLANT CAPACITY
A. MAREKET STUDY
1. Past Supply and Present Demand
Data on the domestic production of napkins and toilet papers is not available as the local
production data on different types of paper and paper products is not organized in a
disaggregated form by different types of paper products. On the other hand, data on the imported
quantity of napkins and toilet papers, which indicates the unsatisfied demand, is presented in
Table 3.1.
122-4
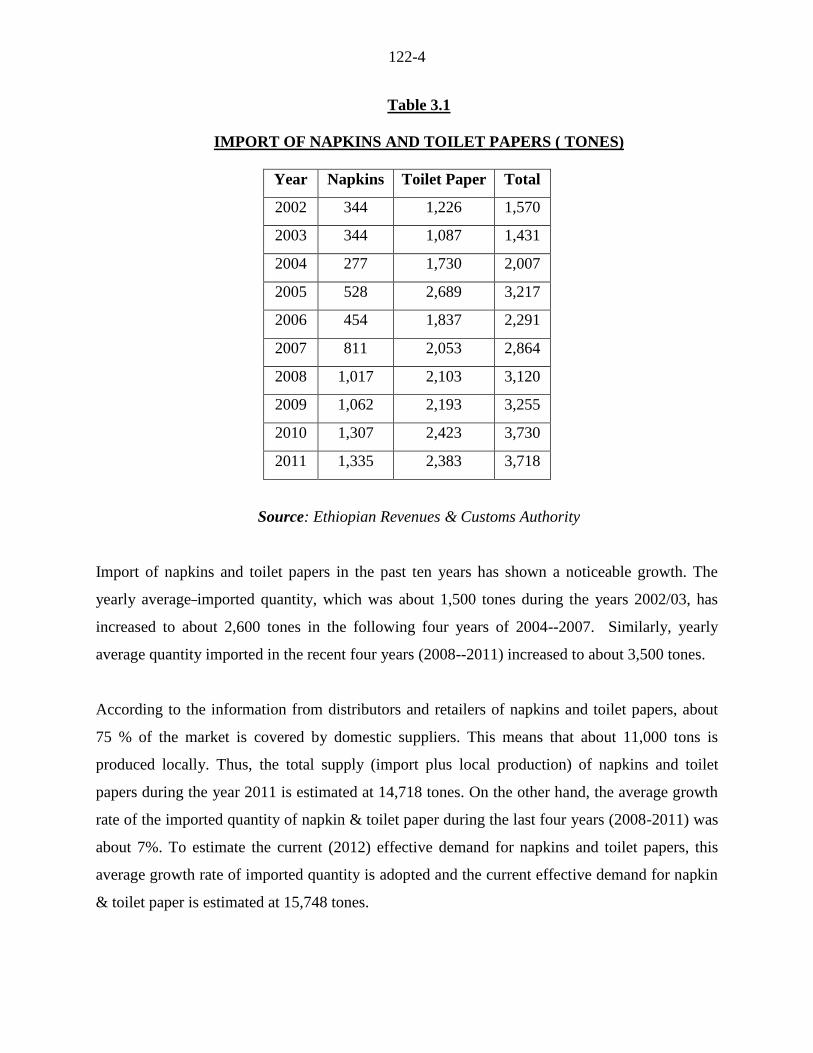
Table 3.1
IMPORT OF NAPKINS AND TOILET PAPERS ( TONES)
Year Napkins Toilet Paper Total
2002 344 1,226 1,570
2003 344 1,087 1,431
2004 277 1,730 2,007
2005 528 2,689 3,217
2006 454 1,837 2,291
2007 811 2,053 2,864
2008 1,017 2,103 3,120
2009 1,062 2,193 3,255
2010 1,307 2,423 3,730
2011 1,335 2,383 3,718
Source: Ethiopian Revenues & Customs Authority
Import of napkins and toilet papers in the past ten years has shown a noticeable growth. The
yearly average imported quantity, which was about 1,500 tones during the years 2002/03, has
increased to about 2,600 tones in the following four years of 2004--2007. Similarly, yearly
average quantity imported in the recent four years (2008--2011) increased to about 3,500 tones.
According to the information from distributors and retailers of napkins and toilet papers, about
75 % of the market is covered by domestic suppliers. This means that about 11,000 tons is
produced locally. Thus, the total supply (import plus local production) of napkins and toilet
papers during the year 2011 is estimated at 14,718 tones. On the other hand, the average growth
rate of the imported quantity of napkin & toilet paper during the last four years (2008-2011) was
about 7%. To estimate the current (2012) effective demand for napkins and toilet papers, this
average growth rate of imported quantity is adopted and the current effective demand for napkin
& toilet paper is estimated at 15,748 tones.
122-5
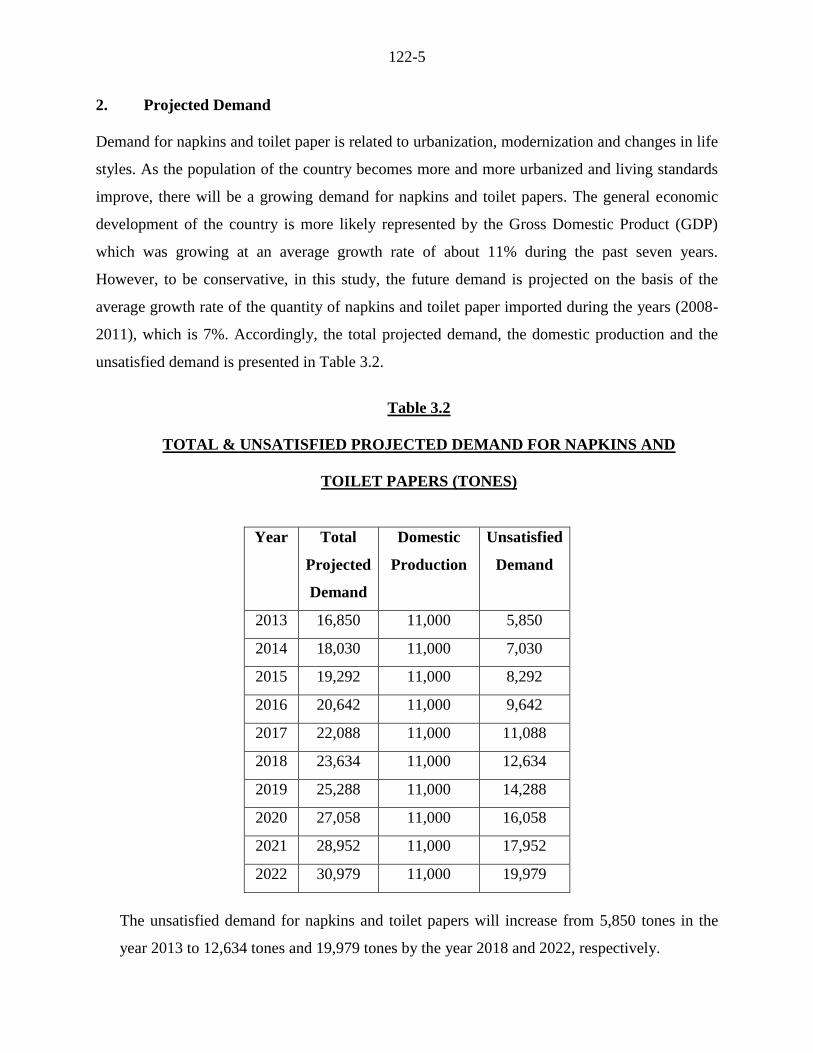
2. Projected Demand
Demand for napkins and toilet paper is related to urbanization, modernization and changes in life
styles. As the population of the country becomes more and more urbanized and living standards
improve, there will be a growing demand for napkins and toilet papers. The general economic
development of the country is more likely represented by the Gross Domestic Product (GDP)
which was growing at an average growth rate of about 11% during the past seven years.
However, to be conservative, in this study, the future demand is projected on the basis of the
average growth rate of the quantity of napkins and toilet paper imported during the years (2008-
2011), which is 7%. Accordingly, the total projected demand, the domestic production and the
unsatisfied demand is presented in Table 3.2.
Table 3.2
TOTAL & UNSATISFIED PROJECTED DEMAND FOR NAPKINS AND
TOILET PAPERS (TONES)
Year Total
Projected
Demand
Domestic
Production
Unsatisfied
Demand
2013 16,850 11,000 5,850
2014 18,030 11,000 7,030
2015 19,292 11,000 8,292
2016 20,642 11,000 9,642
2017 22,088 11,000 11,088
2018 23,634 11,000 12,634
2019 25,288 11,000 14,288
2020 27,058 11,000 16,058
2021 28,952 11,000 17,952
2022 30,979 11,000 19,979
The unsatisfied demand for napkins and toilet papers will increase from 5,850 tones in the
year 2013 to 12,634 tones and 19,979 tones by the year 2018 and 2022, respectively.
122-6
3. Pricing and Distribution
The price of different types of napkins and toilet papers vary based on their quality and size.
The recommended price for the new project is, therefore, Birr 3.75 for table napkins and Birr
1.25 for small napkins. Toilet papers of the new project will have the ex-factory price of Birr
3.75.
The products will be distributed through the existing outlets and direct delivery to major
distributors.
B. PLANT CAPACITY AND PRODUCTION PROGRAMME
1. Plant Capacity
Based on demand projection indicated in the market study, the suggested plant capacity is
241 tons per annum. The plant is envisaged to operate in double shift of 16 hours a day for
270 days a year. This is excluding 13 holidays and 52 Sundays, and assigning 30 days for
executing repair and maintenance programme of the production equipment.
2. Production Programme
The plant is expected to operate 75% and 85% of the installed capacity in the first and second
years, respectively. The plant will reach full capacity on the third year. The rationale
behind such production build-up is that the production equipment are new, and operators
usually take sometime to develop the specific skills and knowhow.
IV. MATERIALS AND INPUTS
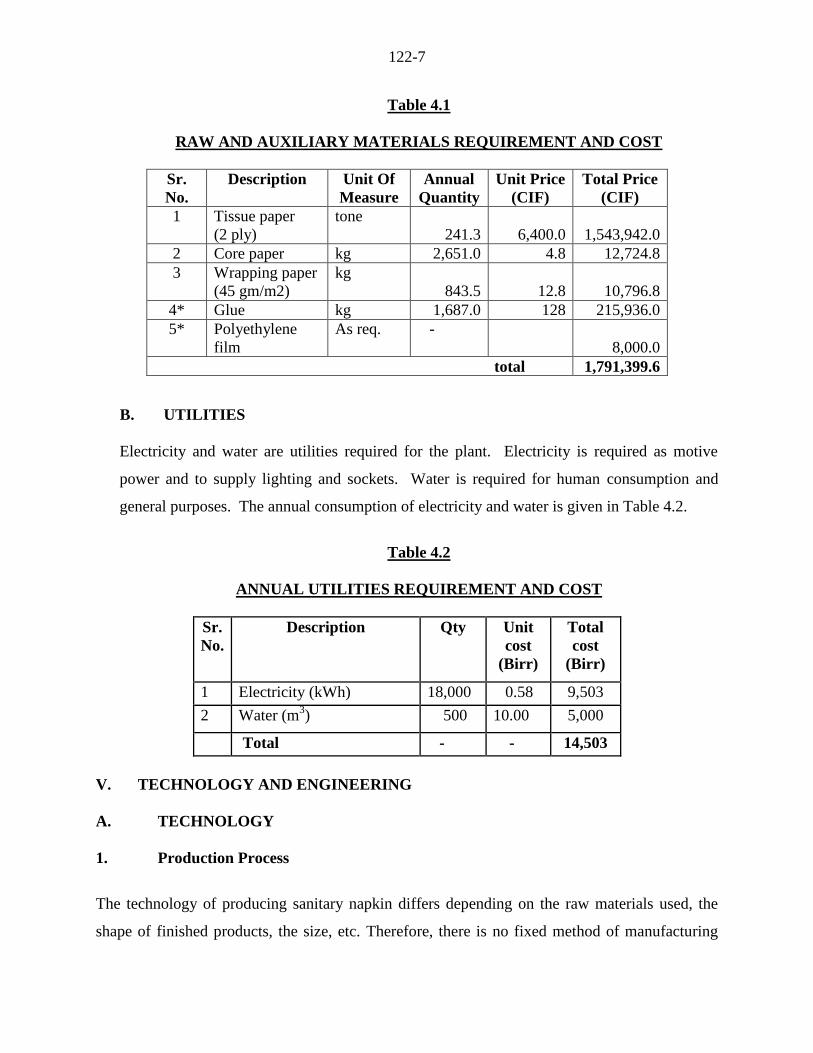
A. RAW AND AUXILIARY MATERIALS
The major raw materials and auxiliaries required for the production of sanitary napkins and
toilet papers are shown in Table 4.1 below. All the raw and auxiliary materials are to be
imported.
122-7
Table 4.1
RAW AND AUXILIARY MATERIALS REQUIREMENT AND COST
Sr.
No.
Description Unit Of
Measure
Annual
Quantity
Unit Price
(CIF)
Total Price
(CIF)
1 Tissue paper
(2 ply)
tone
241.3 6,400.0 1,543,942.0
2 Core paper kg 2,651.0 4.8 12,724.8
3 Wrapping paper
(45 gm/m2)
kg
843.5 12.8 10,796.8
4* Glue kg 1,687.0 128 215,936.0
5* Polyethylene
film
As req. -
8,000.0
total 1,791,399.6
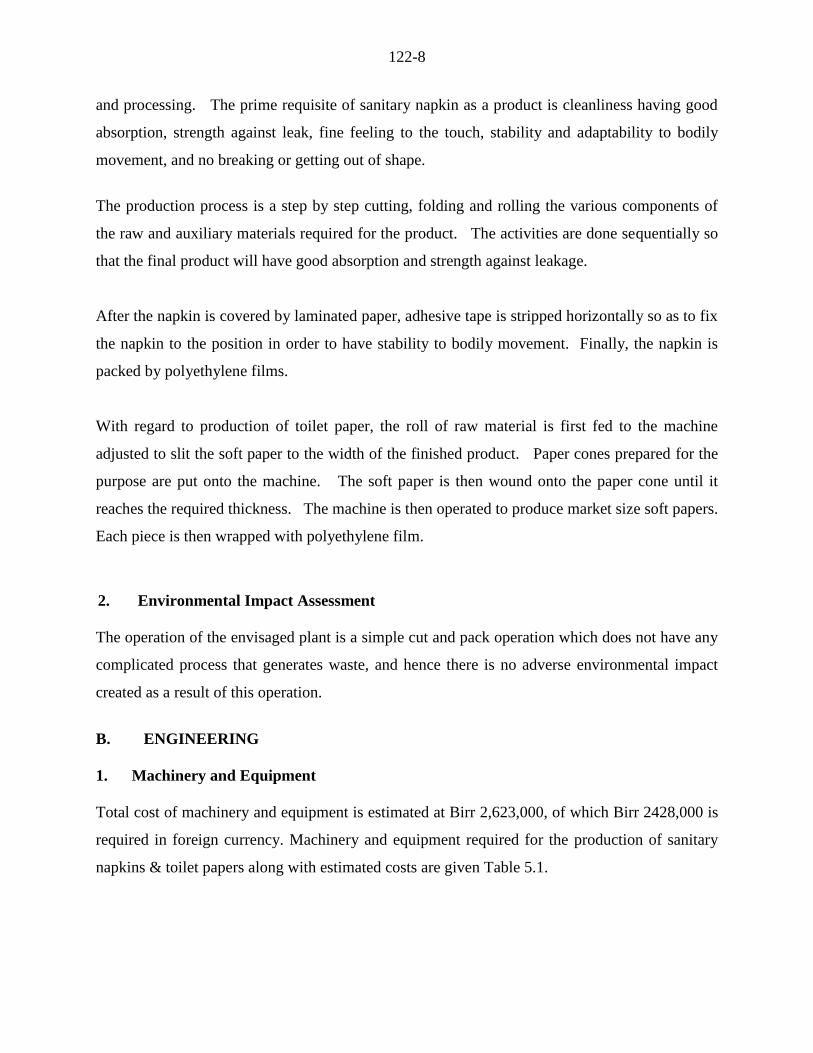
B. UTILITIES
Electricity and water are utilities required for the plant. Electricity is required as motive
power and to supply lighting and sockets. Water is required for human consumption and
general purposes. The annual consumption of electricity and water is given in Table 4.2.
Table 4.2
ANNUAL UTILITIES REQUIREMENT AND COST
Sr.
No.
Description Qty Unit
cost
(Birr)
Total
cost
(Birr)
1 Electricity (kWh) 18,000 0.58 9,503
2 Water (m3) 500 10.00 5,000
Total - - 14,503
V. TECHNOLOGY AND ENGINEERING
A. TECHNOLOGY
1. Production Process
The technology of producing sanitary napkin differs depending on the raw materials used, the
shape of finished products, the size, etc. Therefore, there is no fixed method of manufacturing
122-8
and processing. The prime requisite of sanitary napkin as a product is cleanliness having good
absorption, strength against leak, fine feeling to the touch, stability and adaptability to bodily
movement, and no breaking or getting out of shape.
The production process is a step by step cutting, folding and rolling the various components of
the raw and auxiliary materials required for the product. The activities are done sequentially so
that the final product will have good absorption and strength against leakage.
After the napkin is covered by laminated paper, adhesive tape is stripped horizontally so as to fix
the napkin to the position in order to have stability to bodily movement. Finally, the napkin is
packed by polyethylene films.
With regard to production of toilet paper, the roll of raw material is first fed to the machine
adjusted to slit the soft paper to the width of the finished product. Paper cones prepared for the
purpose are put onto the machine. The soft paper is then wound onto the paper cone until it
reaches the required thickness. The machine is then operated to produce market size soft papers.
Each piece is then wrapped with polyethylene film.
2. Environmental Impact Assessment
The operation of the envisaged plant is a simple cut and pack operation which does not have any
complicated process that generates waste, and hence there is no adverse environmental impact
created as a result of this operation.
B. ENGINEERING
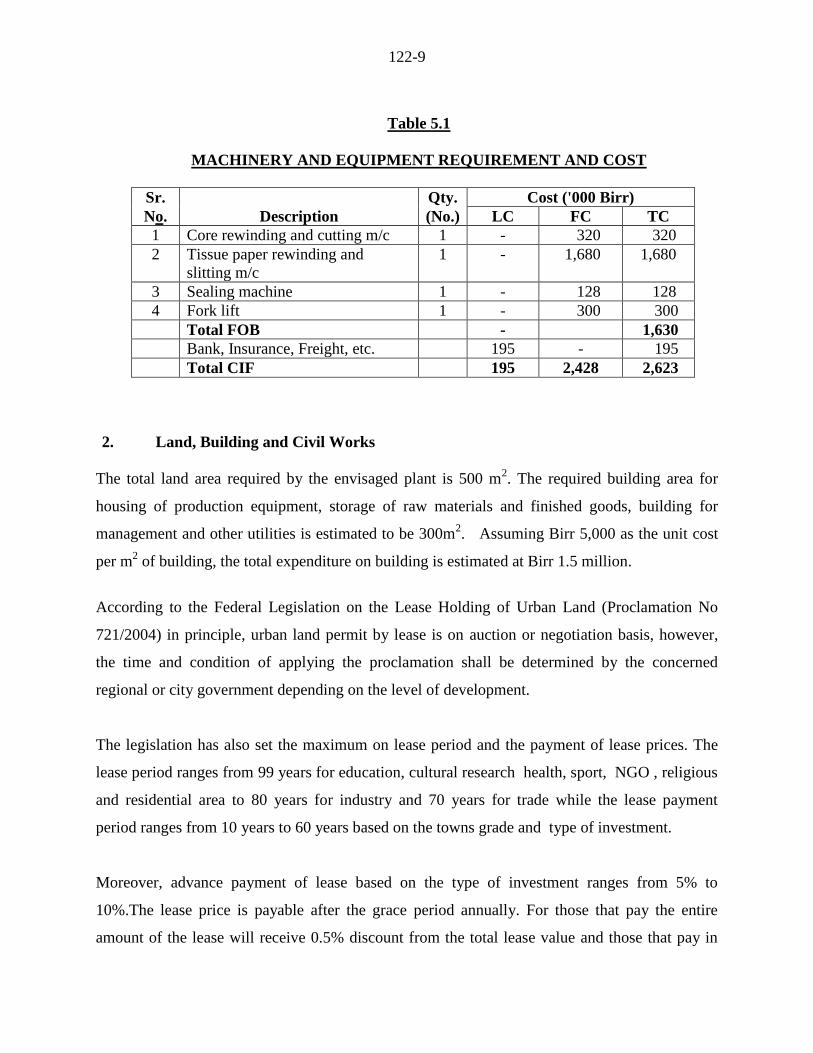
1. Machinery and Equipment
Total cost of machinery and equipment is estimated at Birr 2,623,000, of which Birr 2428,000 is
required in foreign currency. Machinery and equipment required for the production of sanitary
napkins & toilet papers along with estimated costs are given Table 5.1.
122-9
Table 5.1
MACHINERY AND EQUIPMENT REQUIREMENT AND COST
Sr. Qty. Cost ('000 Birr)
No. Description (No.) LC FC TC
1 Core rewinding and cutting m/c 1 - 320 320
2 Tissue paper rewinding and
slitting m/c
1 - 1,680 1,680
3 Sealing machine 1 - 128 128
4 Fork lift 1 - 300 300
Total FOB - 1,630
Bank, Insurance, Freight, etc. 195 - 195
Total CIF 195 2,428 2,623
2. Land, Building and Civil Works
The total land area required by the envisaged plant is 500 m2. The required building area for
housing of production equipment, storage of raw materials and finished goods, building for
management and other utilities is estimated to be 300m2. Assuming Birr 5,000 as the unit cost
per m2 of building, the total expenditure on building is estimated at Birr 1.5 million.
According to the Federal Legislation on the Lease Holding of Urban Land (Proclamation No
721/2004) in principle, urban land permit by lease is on auction or negotiation basis, however,
the time and condition of applying the proclamation shall be determined by the concerned
regional or city government depending on the level of development.
The legislation has also set the maximum on lease period and the payment of lease prices. The
lease period ranges from 99 years for education, cultural research health, sport, NGO , religious
and residential area to 80 years for industry and 70 years for trade while the lease payment
period ranges from 10 years to 60 years based on the towns grade and type of investment.
Moreover, advance payment of lease based on the type of investment ranges from 5% to
10%.The lease price is payable after the grace period annually. For those that pay the entire
amount of the lease will receive 0.5% discount from the total lease value and those that pay in
122-10
installments will be charged interest based on the prevailing interest rate of banks. Moreover,
based on the type of investment, two to seven years grace period shall also be provided.
However, the Federal Legislation on the Lease Holding of Urban Land apart from setting the
maximum has conferred on regional and city governments the power to issue regulations on the
exact terms based on the development level of each region.
In Addis Ababa, the City’s Land Administration and Development Authority is directly
responsible in dealing with matters concerning land. However, regarding the manufacturing
sector, industrial zone preparation is one of the strategic intervention measures adopted by the
City Administration for the promotion of the sector and all manufacturing projects are assumed
to be located in the developed industrial zones.
Regarding land allocation of industrial zones if the land requirement of the project is below
5,000 m2,
the land lease request is evaluated and decided upon by the Industrial Zone
Development and Coordination Committee of the City’s Investment Authority. However, if the
land request is above 5,000 m2 the request is evaluated by the City’s Investment Authority and
passed with recommendation to the Land Development and Administration Authority for
decision, while the lease price is the same for both cases.
Moreover, the Addis Ababa City Administration has recently adopted a new land lease floor
price for plots in the city. The new prices will be used as a benchmark for plots that are going to
be auctioned by the city government or transferred under the new “Urban Lands Lease Holding
Proclamation.”
The new regulation classified the city into three zones. The first Zone is Central Market District
Zone, which is classified in five levels and the floor land lease price ranges from Birr 1,686 to
Birr 894 per m2. The rate for Central Market District Zone will be applicable in most areas of the
city that are considered to be main business areas that entertain high level of business activities.
122-11
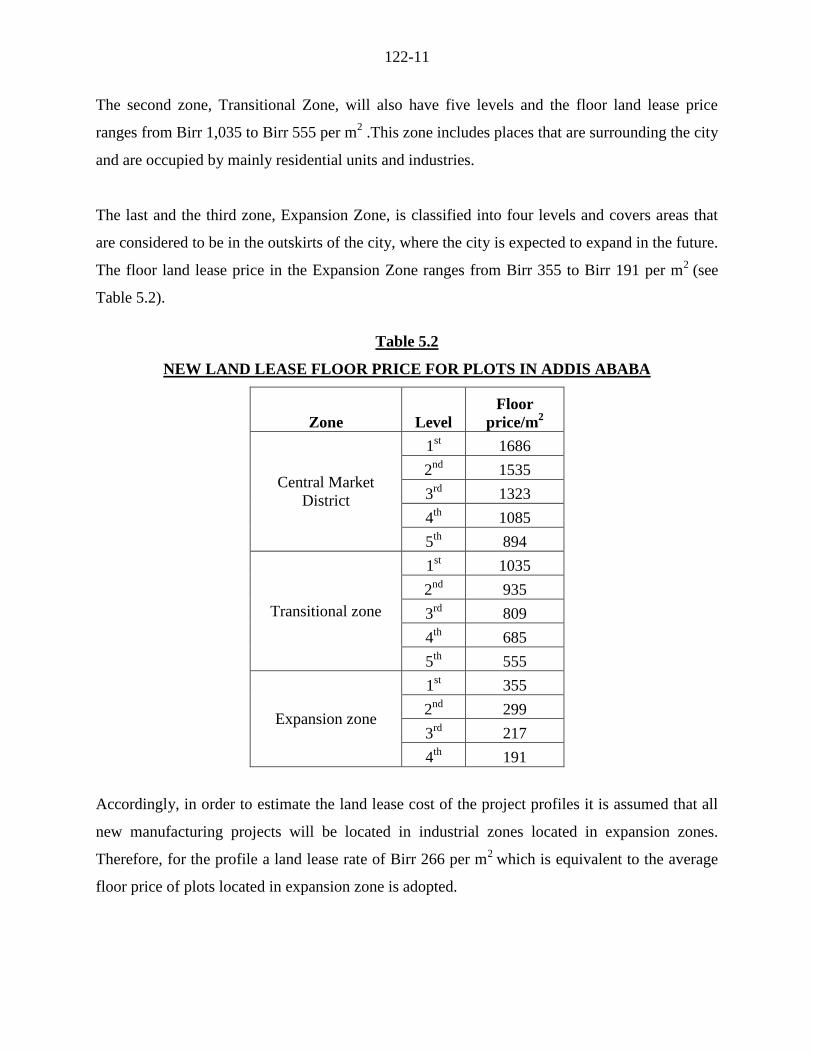
The second zone, Transitional Zone, will also have five levels and the floor land lease price
ranges from Birr 1,035 to Birr 555 per m2 .This zone includes places that are surrounding the city
and are occupied by mainly residential units and industries.
The last and the third zone, Expansion Zone, is classified into four levels and covers areas that
are considered to be in the outskirts of the city, where the city is expected to expand in the future.
The floor land lease price in the Expansion Zone ranges from Birr 355 to Birr 191 per m2
(see
Table 5.2).
Table 5.2
NEW LAND LEASE FLOOR PRICE FOR PLOTS IN ADDIS ABABA
Zone Level
Floor
price/m2
Central Market
District
1st 1686
2nd
1535
3rd
1323
4th
1085
5th
894
Transitional zone
1st 1035
2nd
935
3rd
809
4th
685
5th
555
Expansion zone
1st 355
2nd
299
3rd
217
4th
191
Accordingly, in order to estimate the land lease cost of the project profiles it is assumed that all
new manufacturing projects will be located in industrial zones located in expansion zones.
Therefore, for the profile a land lease rate of Birr 266 per m2
which is equivalent to the average
floor price of plots located in expansion zone is adopted.
122-12
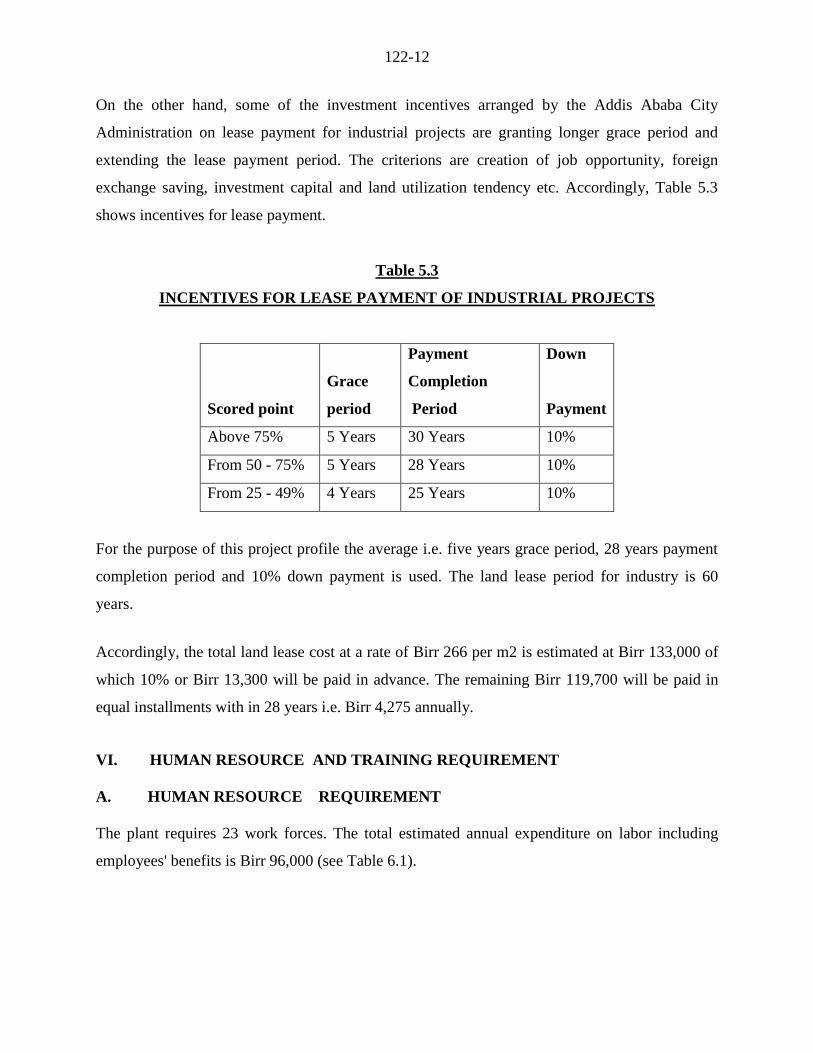
On the other hand, some of the investment incentives arranged by the Addis Ababa City
Administration on lease payment for industrial projects are granting longer grace period and
extending the lease payment period. The criterions are creation of job opportunity, foreign
exchange saving, investment capital and land utilization tendency etc. Accordingly, Table 5.3
shows incentives for lease payment.
Table 5.3
INCENTIVES FOR LEASE PAYMENT OF INDUSTRIAL PROJECTS
Scored point
Grace
period
Payment
Completion
Period
Down
Payment
Above 75% 5 Years 30 Years 10%
From 50 - 75% 5 Years 28 Years 10%
From 25 - 49% 4 Years 25 Years 10%
For the purpose of this project profile the average i.e. five years grace period, 28 years payment
completion period and 10% down payment is used. The land lease period for industry is 60
years.
Accordingly, the total land lease cost at a rate of Birr 266 per m2 is estimated at Birr 133,000 of
which 10% or Birr 13,300 will be paid in advance. The remaining Birr 119,700 will be paid in
equal installments with in 28 years i.e. Birr 4,275 annually.
VI. HUMAN RESOURCE AND TRAINING REQUIREMENT
A. HUMAN RESOURCE REQUIREMENT
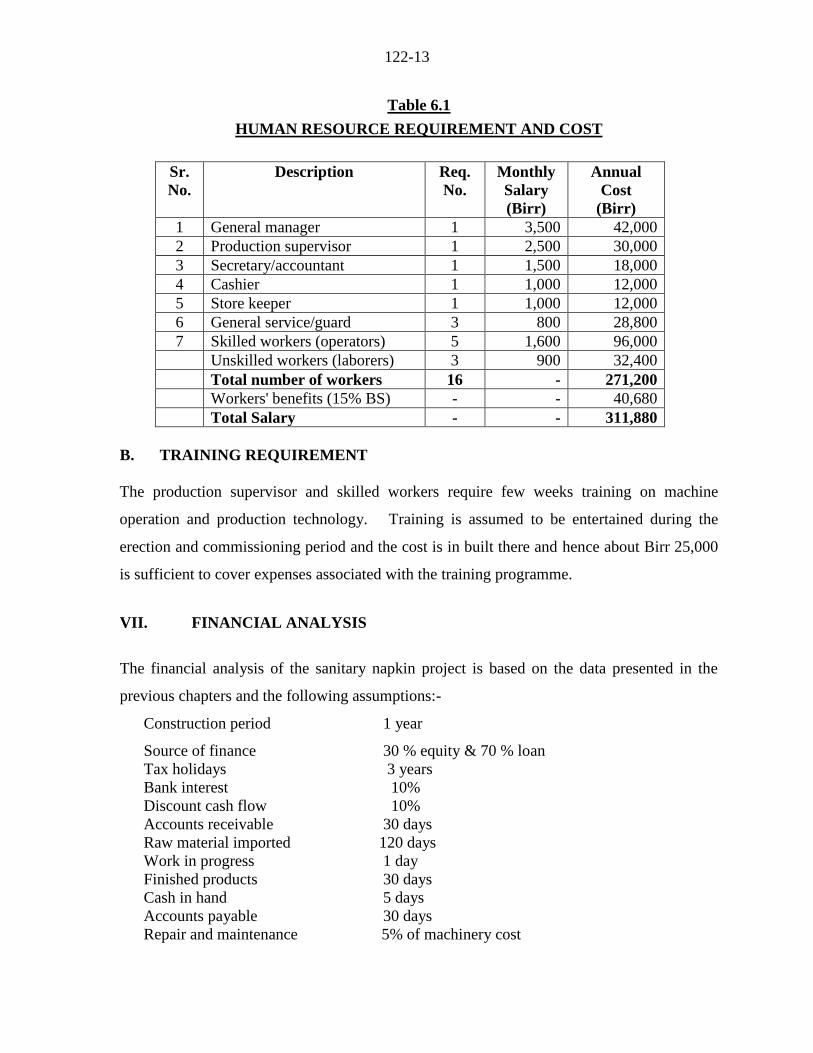
The plant requires 23 work forces. The total estimated annual expenditure on labor including
employees' benefits is Birr 96,000 (see Table 6.1).
122-13
Table 6.1
HUMAN RESOURCE REQUIREMENT AND COST
Sr.
No.
Description Req.
No.
Monthly
Salary
(Birr)
Annual
Cost
(Birr)
1 General manager 1 3,500 42,000
2 Production supervisor 1 2,500 30,000
3 Secretary/accountant 1 1,500 18,000
4 Cashier 1 1,000 12,000
5 Store keeper 1 1,000 12,000
6 General service/guard 3 800 28,800
7 Skilled workers (operators) 5 1,600 96,000
Unskilled workers (laborers) 3 900 32,400
Total number of workers 16 - 271,200
Workers' benefits (15% BS) - - 40,680
Total Salary - - 311,880
B. TRAINING REQUIREMENT
The production supervisor and skilled workers require few weeks training on machine
operation and production technology. Training is assumed to be entertained during the
erection and commissioning period and the cost is in built there and hence about Birr 25,000
is sufficient to cover expenses associated with the training programme.
VII. FINANCIAL ANALYSIS
The financial analysis of the sanitary napkin project is based on the data presented in the
previous chapters and the following assumptions:-
Construction period 1 year
Source of finance 30 % equity & 70 % loan
Tax holidays 3 years
Bank interest 10%
Discount cash flow 10%
Accounts receivable 30 days
Raw material imported 120 days
Work in progress 1 day
Finished products 30 days
Cash in hand 5 days
Accounts payable 30 days
Repair and maintenance 5% of machinery cost
122-14
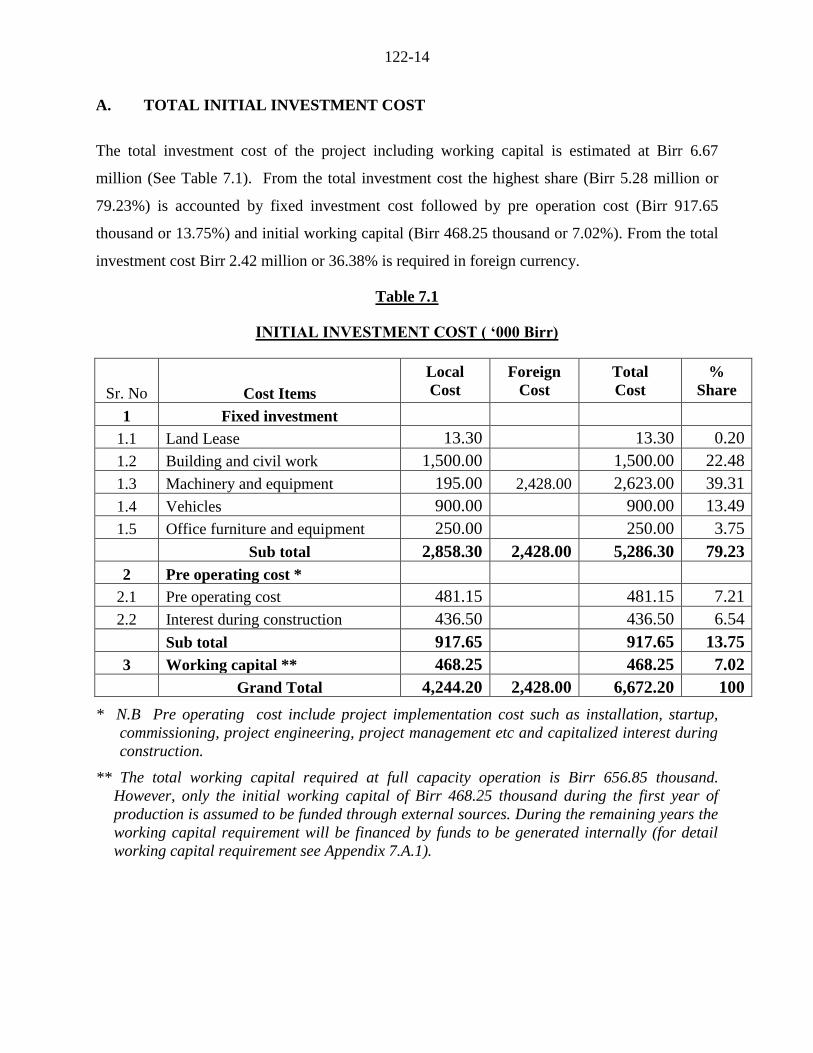
A. TOTAL INITIAL INVESTMENT COST
The total investment cost of the project including working capital is estimated at Birr 6.67
million (See Table 7.1). From the total investment cost the highest share (Birr 5.28 million or
79.23%) is accounted by fixed investment cost followed by pre operation cost (Birr 917.65
thousand or 13.75%) and initial working capital (Birr 468.25 thousand or 7.02%). From the total
investment cost Birr 2.42 million or 36.38% is required in foreign currency.
Table 7.1
INITIAL INVESTMENT COST ( ‘000 Birr)
Sr. No Cost Items
Local
Cost
Foreign
Cost
Total
Cost
%
Share
1 Fixed investment
1.1 Land Lease 13.30 13.30 0.20
1.2 Building and civil work 1,500.00 1,500.00 22.48
1.3 Machinery and equipment 195.00 2,428.00 2,623.00 39.31
1.4 Vehicles 900.00 900.00 13.49
1.5 Office furniture and equipment 250.00 250.00 3.75
Sub total 2,858.30 2,428.00 5,286.30 79.23
2 Pre operating cost *
2.1 Pre operating cost 481.15 481.15 7.21
2.2 Interest during construction 436.50 436.50 6.54
Sub total 917.65 917.65 13.75
3 Working capital ** 468.25 468.25 7.02
Grand Total 4,244.20 2,428.00 6,672.20 100
* N.B Pre operating cost include project implementation cost such as installation, startup,
commissioning, project engineering, project management etc and capitalized interest during
construction.
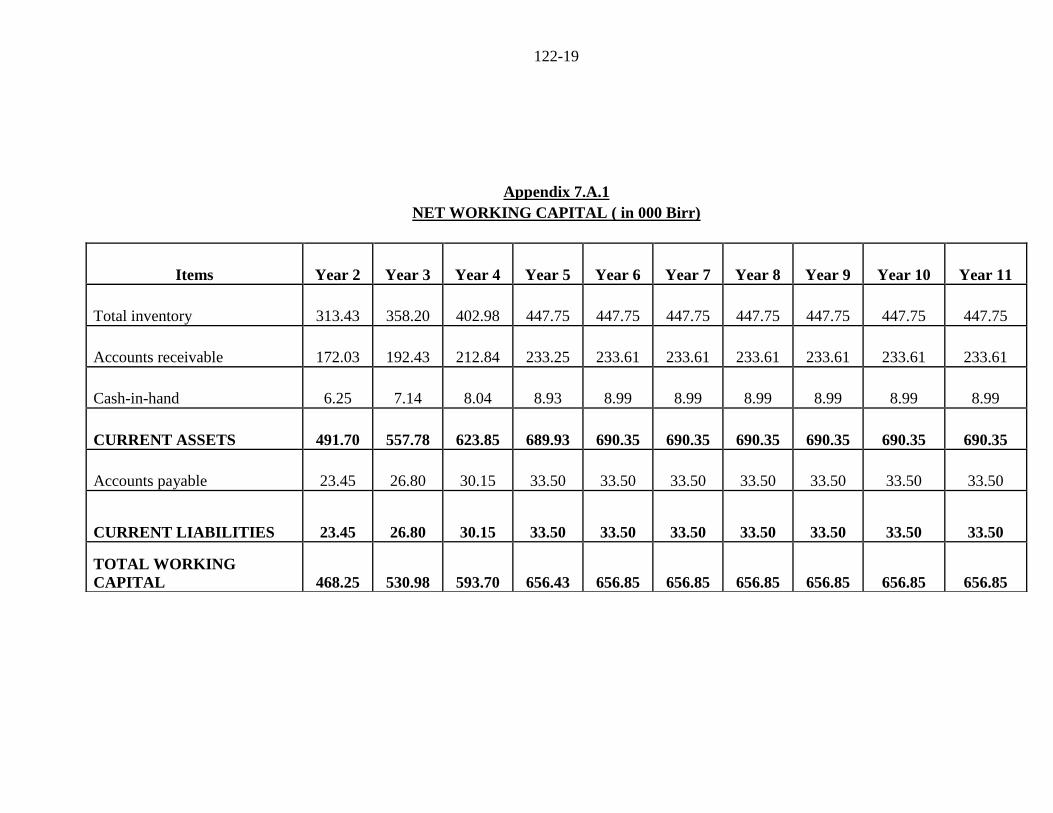
** The total working capital required at full capacity operation is Birr 656.85 thousand.
However, only the initial working capital of Birr 468.25 thousand during the first year of
production is assumed to be funded through external sources. During the remaining years the
working capital requirement will be financed by funds to be generated internally (for detail
working capital requirement see Appendix 7.A.1).
122-15
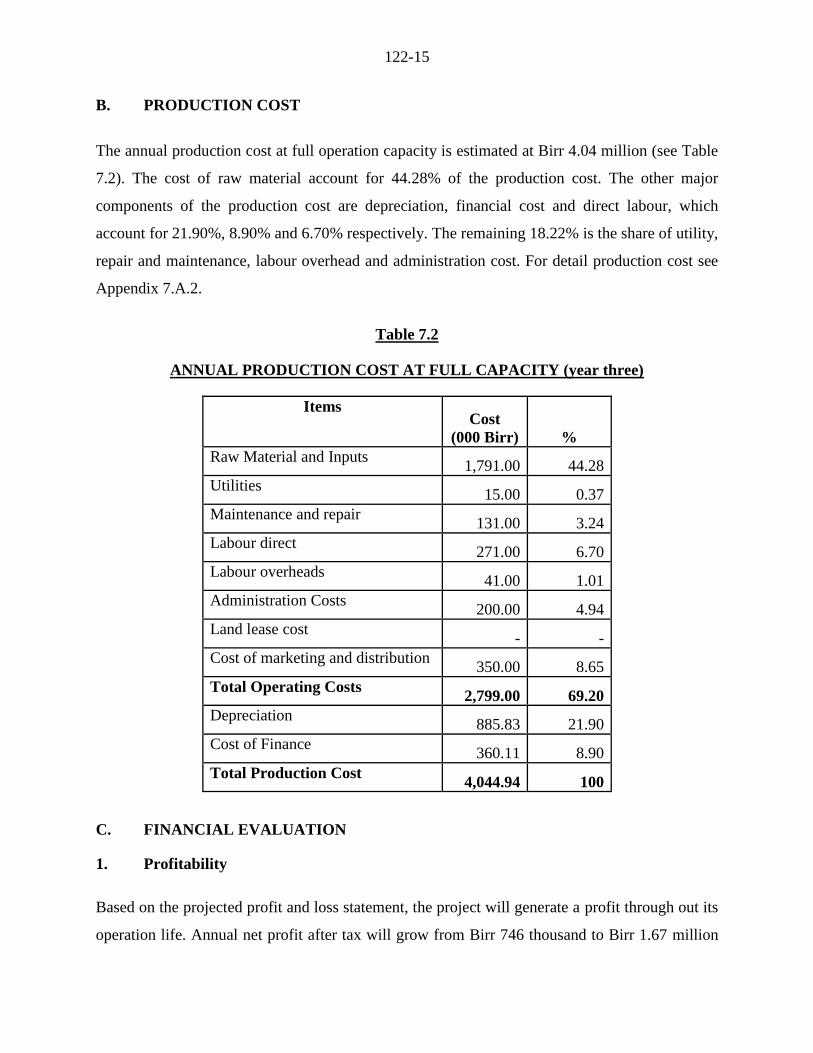
B. PRODUCTION COST
The annual production cost at full operation capacity is estimated at Birr 4.04 million (see Table
7.2). The cost of raw material account for 44.28% of the production cost. The other major
components of the production cost are depreciation, financial cost and direct labour, which
account for 21.90%, 8.90% and 6.70% respectively. The remaining 18.22% is the share of utility,
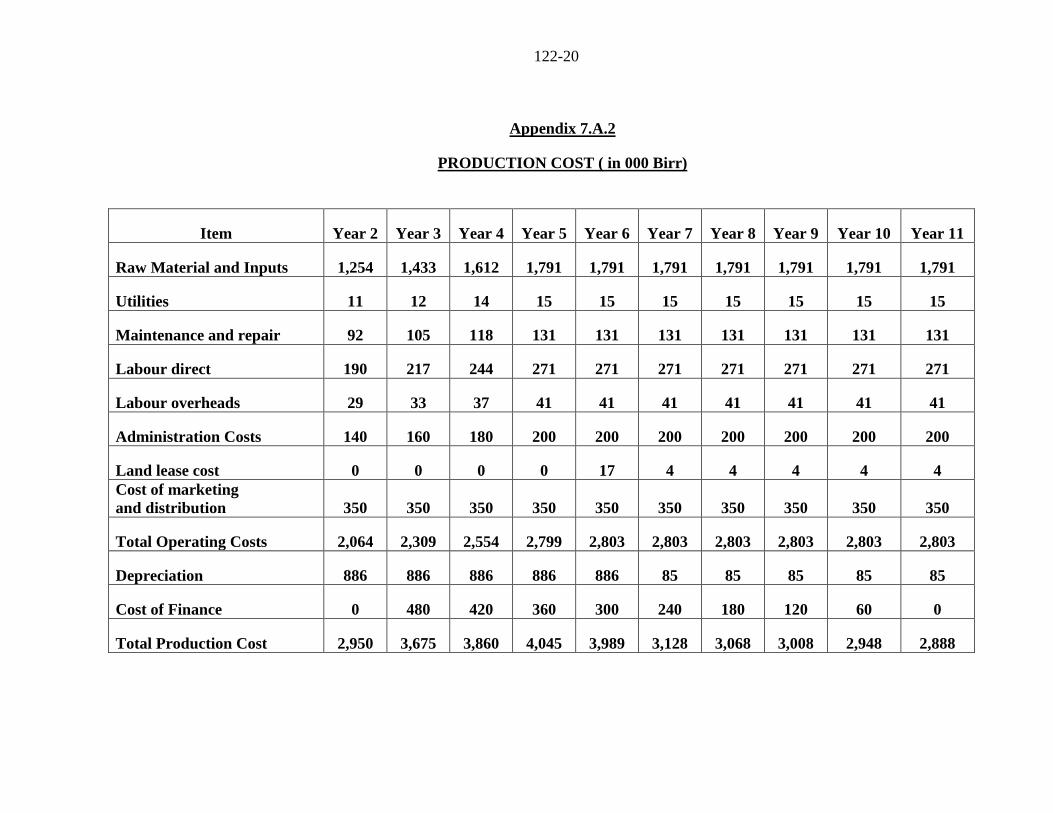
repair and maintenance, labour overhead and administration cost. For detail production cost see
Appendix 7.A.2.
Table 7.2
ANNUAL PRODUCTION COST AT FULL CAPACITY (year three)
Items Cost
(000 Birr) %
Raw Material and Inputs 1,791.00 44.28
Utilities 15.00 0.37
Maintenance and repair 131.00 3.24
Labour direct 271.00 6.70
Labour overheads 41.00 1.01
Administration Costs 200.00 4.94
Land lease cost - -
Cost of marketing and distribution 350.00 8.65
Total Operating Costs 2,799.00 69.20
Depreciation 885.83 21.90
Cost of Finance 360.11 8.90
Total Production Cost 4,044.94 100
C. FINANCIAL EVALUATION
1. Profitability
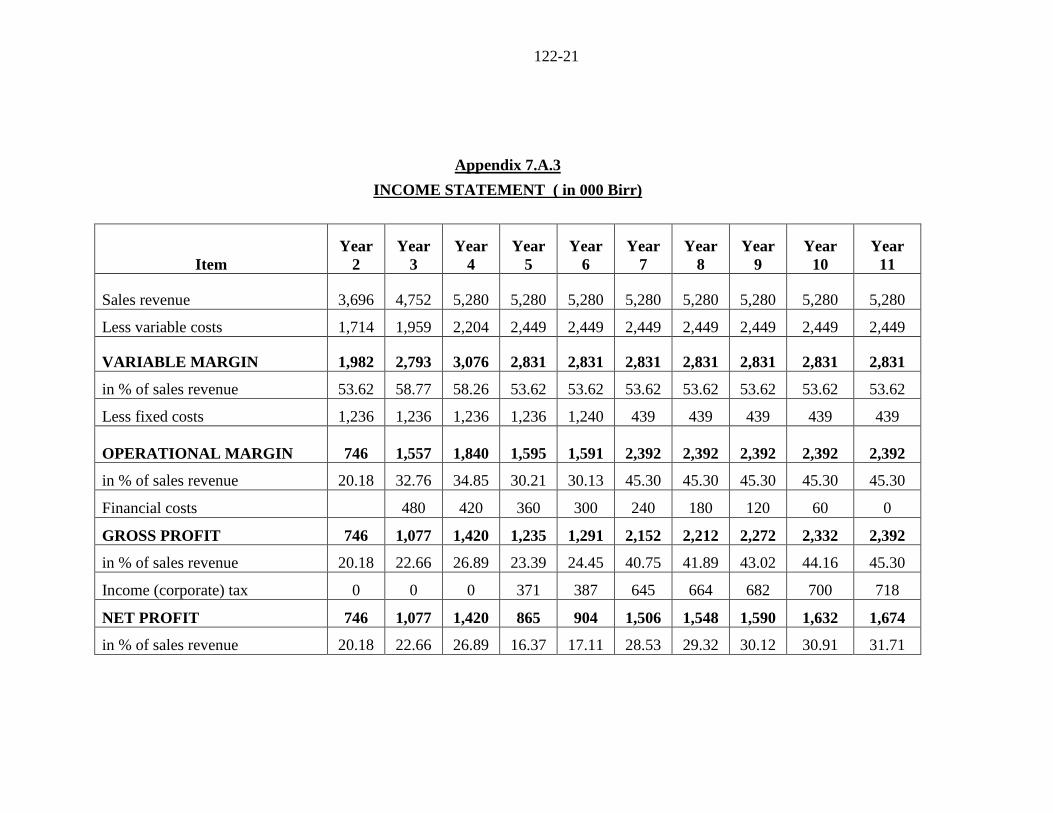
Based on the projected profit and loss statement, the project will generate a profit through out its
operation life. Annual net profit after tax will grow from Birr 746 thousand to Birr 1.67 million
122-16
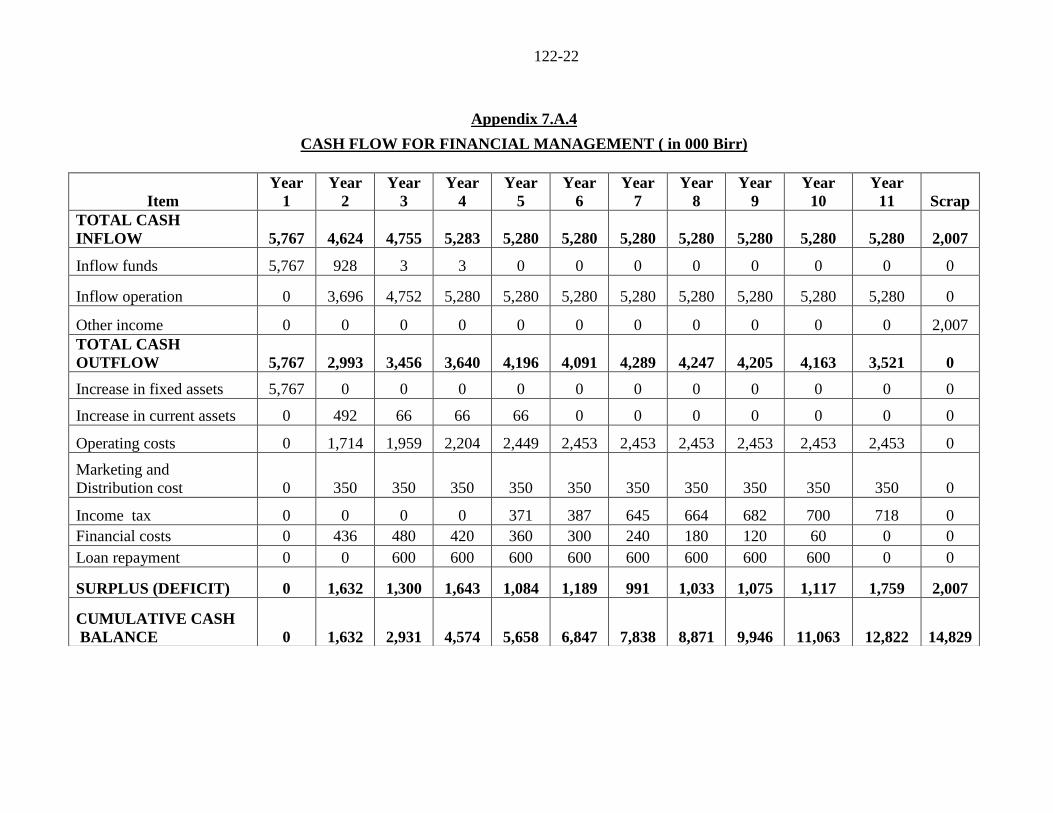
during the life of the project. Moreover, at the end of the project life the accumulated net cash
flow amounts to Birr 14.82 million. For profit and loss statement and cash flow projection see
Appendix 7.A.3 and 7.A.4, respectively.
2. Ratios
In financial analysis financial ratios and efficiency ratios are used as an index or yardstick for
evaluating the financial position of a firm. It is also an indicator for the strength and weakness of
the firm or a project. Using the year-end balance sheet figures and other relevant data, the most
important ratios such as return on sales which is computed by dividing net income by revenue,
return on assets (operating income divided by assets), return on equity (net profit divided by
equity) and return on total investment (net profit plus interest divided by total investment) has
been carried out over the period of the project life and all the results are found to be satisfactory.
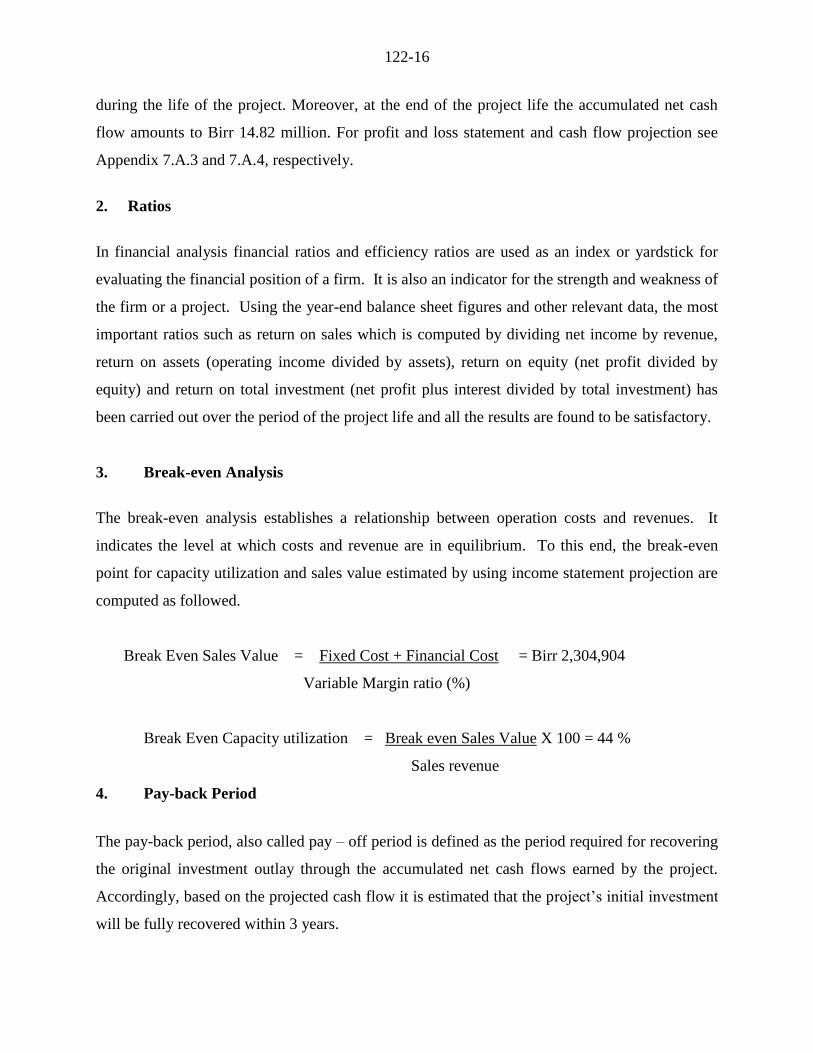
3. Break-even Analysis
The break-even analysis establishes a relationship between operation costs and revenues. It
indicates the level at which costs and revenue are in equilibrium. To this end, the break-even
point for capacity utilization and sales value estimated by using income statement projection are
computed as followed.
Break Even Sales Value = Fixed Cost + Financial Cost = Birr 2,304,904
Variable Margin ratio (%)
Break Even Capacity utilization = Break even Sales Value X 100 = 44 %
Sales revenue
4. Pay-back Period
The pay-back period, also called pay – off period is defined as the period required for recovering
the original investment outlay through the accumulated net cash flows earned by the project.
Accordingly, based on the projected cash flow it is estimated that the project’s initial investment
will be fully recovered within 3 years.
122-17
5. Internal Rate of Return
The internal rate of return (IRR) is the annualized effective compounded return rate that can be
earned on the invested capital, i.e., the yield on the investment. Put another way, the internal rate
of return for an investment is the discount rate that makes the net present value of the
investment's income stream total to zero. It is an indicator of the efficiency or quality of an
investment. A project is a good investment proposition if its IRR is greater than the rate of return
that could be earned by alternate investments or putting the money in a bank account.
Accordingly, the IRR of this project is computed to be 31.07% indicating the viability of the
project.
6. Net Present Value
Net present value (NPV) is defined as the total present (discounted) value of a time series of cash
flows. NPV aggregates cash flows that occur during different periods of time during the life of a
project in to a common measuring unit i.e. present value. It is a standard method for using the
time value of money to appraise long-term projects. NPV is an indicator of how much value an
investment or project adds to the capital invested. In principle, a project is accepted if the NPV is
non-negative.
Accordingly, the net present value of the project at 10% discount rate is found to be Birr 6.90
million which is acceptable. For detail discounted cash flow see Appendix 7.A.5.
D. ECONOMIC AND SOCIAL BENEFITS
The project can create employment for 23 persons. The project will generate Birr 4.16 million in
terms of tax revenue. The establishment of such factory will have a foreign exchange saving
effect to the country by substituting the current imports. The project will also generate other
income for the Government.
122-18
Appendix 7.A
FINANCIAL ANALYSES SUPPORTING TABLES
122-19
Appendix 7.A.1
NET WORKING CAPITAL ( in 000 Birr)
Items Year 2 Year 3 Year 4 Year 5 Year 6 Year 7 Year 8 Year 9 Year 10 Year 11
Total inventory 313.43 358.20 402.98 447.75 447.75 447.75 447.75 447.75 447.75 447.75
Accounts receivable 172.03 192.43 212.84 233.25 233.61 233.61 233.61 233.61 233.61 233.61
Cash-in-hand 6.25 7.14 8.04 8.93 8.99 8.99 8.99 8.99 8.99 8.99
CURRENT ASSETS 491.70 557.78 623.85 689.93 690.35 690.35 690.35 690.35 690.35 690.35
Accounts payable 23.45 26.80 30.15 33.50 33.50 33.50 33.50 33.50 33.50 33.50
CURRENT LIABILITIES 23.45 26.80 30.15 33.50 33.50 33.50 33.50 33.50 33.50 33.50
TOTAL WORKING
CAPITAL 468.25 530.98 593.70 656.43 656.85 656.85 656.85 656.85 656.85 656.85
122-20
Appendix 7.A.2
PRODUCTION COST ( in 000 Birr)
Item Year 2 Year 3 Year 4 Year 5 Year 6 Year 7 Year 8 Year 9 Year 10 Year 11
Raw Material and Inputs 1,254 1,433 1,612 1,791 1,791 1,791 1,791 1,791 1,791 1,791
Utilities 11 12 14 15 15 15 15 15 15 15
Maintenance and repair 92 105 118 131 131 131 131 131 131 131
Labour direct 190 217 244 271 271 271 271 271 271 271
Labour overheads 29 33 37 41 41 41 41 41 41 41
Administration Costs 140 160 180 200 200 200 200 200 200 200
Land lease cost 0 0 0 0 17 4 4 4 4 4
Cost of marketing
and distribution 350 350 350 350 350 350 350 350 350 350
Total Operating Costs 2,064 2,309 2,554 2,799 2,803 2,803 2,803 2,803 2,803 2,803
Depreciation 886 886 886 886 886 85 85 85 85 85
Cost of Finance 0 480 420 360 300 240 180 120 60 0
Total Production Cost 2,950 3,675 3,860 4,045 3,989 3,128 3,068 3,008 2,948 2,888
122-21
Appendix 7.A.3
INCOME STATEMENT ( in 000 Birr)
Item
Year
2
Year
3
Year
4
Year
5
Year
6
Year
7
Year
8
Year
9
Year
10
Year
11
Sales revenue 3,696 4,752 5,280 5,280 5,280 5,280 5,280 5,280 5,280 5,280
Less variable costs 1,714 1,959 2,204 2,449 2,449 2,449 2,449 2,449 2,449 2,449
VARIABLE MARGIN 1,982 2,793 3,076 2,831 2,831 2,831 2,831 2,831 2,831 2,831
in % of sales revenue 53.62 58.77 58.26 53.62 53.62 53.62 53.62 53.62 53.62 53.62
Less fixed costs 1,236 1,236 1,236 1,236 1,240 439 439 439 439 439
OPERATIONAL MARGIN 746 1,557 1,840 1,595 1,591 2,392 2,392 2,392 2,392 2,392
in % of sales revenue 20.18 32.76 34.85 30.21 30.13 45.30 45.30 45.30 45.30 45.30
Financial costs 480 420 360 300 240 180 120 60 0
GROSS PROFIT 746 1,077 1,420 1,235 1,291 2,152 2,212 2,272 2,332 2,392
in % of sales revenue 20.18 22.66 26.89 23.39 24.45 40.75 41.89 43.02 44.16 45.30
Income (corporate) tax 0 0 0 371 387 645 664 682 700 718
NET PROFIT 746 1,077 1,420 865 904 1,506 1,548 1,590 1,632 1,674
in % of sales revenue 20.18 22.66 26.89 16.37 17.11 28.53 29.32 30.12 30.91 31.71
122-22
Appendix 7.A.4
CASH FLOW FOR FINANCIAL MANAGEMENT ( in 000 Birr)
Item
Year
1
Year
2
Year
3
Year
4
Year
5
Year
6
Year
7
Year
8
Year
9
Year
10
Year
11 Scrap
TOTAL CASH
INFLOW 5,767 4,624 4,755 5,283 5,280 5,280 5,280 5,280 5,280 5,280 5,280 2,007
Inflow funds 5,767 928 3 3 0 0 0 0 0 0 0 0
Inflow operation 0 3,696 4,752 5,280 5,280 5,280 5,280 5,280 5,280 5,280 5,280 0
Other income 0 0 0 0 0 0 0 0 0 0 0 2,007
TOTAL CASH
OUTFLOW 5,767 2,993 3,456 3,640 4,196 4,091 4,289 4,247 4,205 4,163 3,521 0
Increase in fixed assets 5,767 0 0 0 0 0 0 0 0 0 0 0
Increase in current assets 0 492 66 66 66 0 0 0 0 0 0 0
Operating costs 0 1,714 1,959 2,204 2,449 2,453 2,453 2,453 2,453 2,453 2,453 0
Marketing and
Distribution cost 0 350 350 350 350 350 350 350 350 350 350 0
Income tax 0 0 0 0 371 387 645 664 682 700 718 0
Financial costs 0 436 480 420 360 300 240 180 120 60 0 0
Loan repayment 0 0 600 600 600 600 600 600 600 600 0 0
SURPLUS (DEFICIT) 0 1,632 1,300 1,643 1,084 1,189 991 1,033 1,075 1,117 1,759 2,007
CUMULATIVE CASH
BALANCE 0 1,632 2,931 4,574 5,658 6,847 7,838 8,871 9,946 11,063 12,822 14,829
122-23
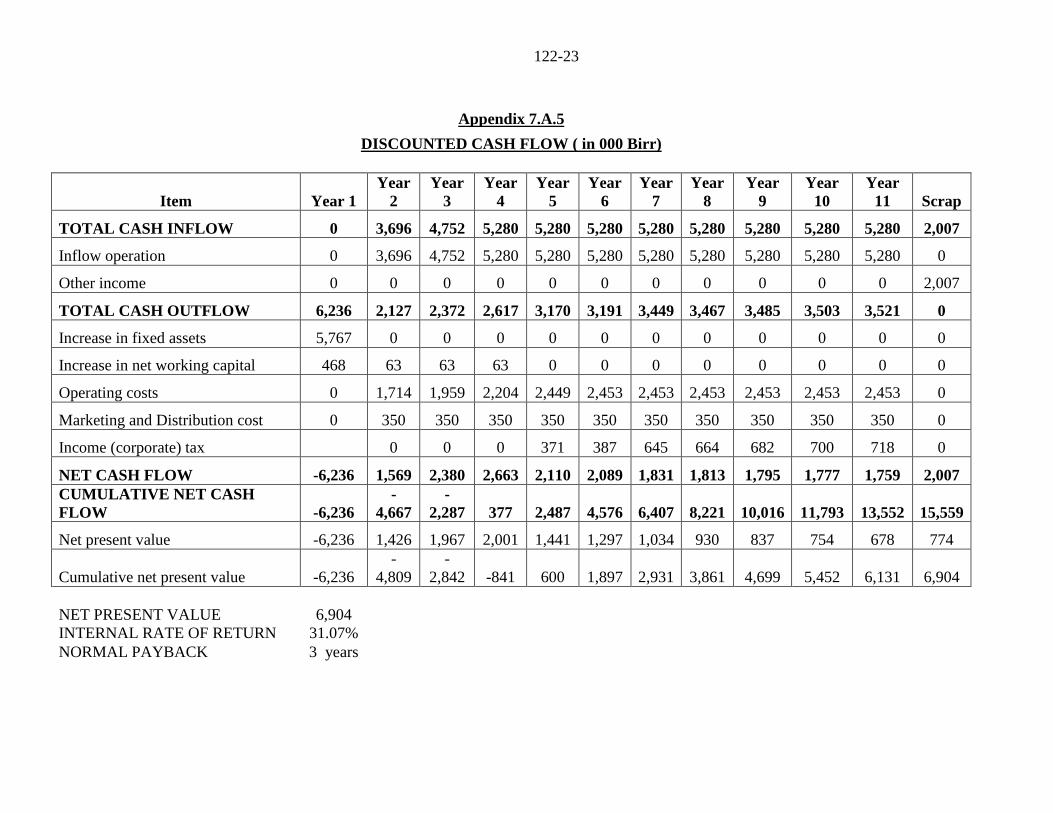
Appendix 7.A.5
DISCOUNTED CASH FLOW ( in 000 Birr)
Item Year 1
Year
2
Year
3
Year
4
Year
5
Year
6
Year
7
Year
8
Year
9
Year
10
Year
11 Scrap
TOTAL CASH INFLOW 0 3,696 4,752 5,280 5,280 5,280 5,280 5,280 5,280 5,280 5,280 2,007
Inflow operation 0 3,696 4,752 5,280 5,280 5,280 5,280 5,280 5,280 5,280 5,280 0
Other income 0 0 0 0 0 0 0 0 0 0 0 2,007
TOTAL CASH OUTFLOW 6,236 2,127 2,372 2,617 3,170 3,191 3,449 3,467 3,485 3,503 3,521 0
Increase in fixed assets 5,767 0 0 0 0 0 0 0 0 0 0 0
Increase in net working capital 468 63 63 63 0 0 0 0 0 0 0 0
Operating costs 0 1,714 1,959 2,204 2,449 2,453 2,453 2,453 2,453 2,453 2,453 0
Marketing and Distribution cost 0 350 350 350 350 350 350 350 350 350 350 0
Income (corporate) tax 0 0 0 371 387 645 664 682 700 718 0
NET CASH FLOW -6,236 1,569 2,380 2,663 2,110 2,089 1,831 1,813 1,795 1,777 1,759 2,007
CUMULATIVE NET CASH
FLOW -6,236
-
4,667
-
2,287 377 2,487 4,576 6,407 8,221 10,016 11,793 13,552 15,559
Net present value -6,236 1,426 1,967 2,001 1,441 1,297 1,034 930 837 754 678 774
Cumulative net present value -6,236
-
4,809
-
2,842 -841 600 1,897 2,931 3,861 4,699 5,452 6,131 6,904
NET PRESENT VALUE 6,904
INTERNAL RATE OF RETURN 31.07%
NORMAL PAYBACK 3 years