Embed Size (px)
Citation preview


12/17/2012: EPA Enforcement in 2012 Protects Communities From Harmful Pollution
http://yosemite.epa.gov/opa/admpress.nsf/bd4379a92ceceeac8525735900400c27/10950aa41c147d3385257ad7006d61e1!OpenDocument[10/1/2014 11:03:06 AM]
Contact UsNewsroomYou are here: EPA Home Newsroom News Releases from Headquarters EPA Enforcement in 2012 Protects Communities From ....
EPA Enforcement in 2012 Protects Communities From Harmful Pollution
Release Date: 12/17/2012Contact Information: Stacy Kika, [email protected], 202-564-0906, 202-564-4355; En español: Lina Younes, [email protected], 202-564-9924, 202-564-4355
WASHINGTON - The U.S. Environmental Protection Agency (EPA) today released its annual enforcement results, showing significant environmental and public health protections achieved – a reduction of 2.2 billion pounds of air, water and land pollution, as well as 4.4 billion pounds of hazardous waste, and $252 million in civil and criminal penalties levied – while also focusing on enforcement efforts that reduce smaller amounts of pollution but have substantial health impacts in communities.
“Enforcement plays a vital role in protecting communities from harmful pollution,” said Cynthia Giles, assistant administrator for EPA’s Office of Enforcement and Compliance Assurance. “We are using vigorous enforcement, as well as innovations in monitoring and transparency, to reduce pollution violations, protect and empower communities and focus on the environmental problems that matter most.”
FY 2012 results include:
- Sustained and focused enforcement attention on serious violators of clean drinking water standards has resulted in improvements in compliance. The number of systems with serious violations has declined by more than 60 percent in the past three years as a result of combined federal and state enforcement work, protecting people’s health through safer drinking water.
- More than 67 percent of large combined sewer systems serving people across the country are implementing clean water solutions to reduce raw sewage and contaminated stormwater and more are underway. EPA is working with communities to design integrated solutions to these water quality problems, and incorporating innovative and cost effective green infrastructure to save money and achieve multiple community benefits.
- EPA is bringing criminal prosecutions where criminal activity threatens public health, like failing to use required pollution control equipment or knowingly violating pollution rules resulting in death or serious harm or falsifying pollution information. See a case example in Louisiana.
- EPA is advancing environmental justice by incorporating fenceline monitoring, which requires companies to monitor their air emissions and make that data available public, into settlements, ensuring that local residents have access to critical information about pollution that may be affecting their community. EPA also secured $44 million in additional investments through settlements for supplemental environmental projects that benefit impacted communities. See an oil refinery case example.
- EPA is increasing transparency to use the power of public accountability to help improve environmental compliance. EPA’s 2012 enforcement actions map provides information about violators in communities. EPA’s state dashboards and Clean Water Act pollutant loading tool provides the public with information about local pollution that may affect them and allows the public to take a closer look at how government is responding to pollution problems.
More information about EPA’s FY 2012 enforcement results: http://www.epa.gov/enforcement/data/eoy2012/index.html
Search this collection of releases | or search all news releases
Get news releases by email
View selected historical press releases from 1970 to 1998 in the EPA History website.
Recent additions09/30/2014 EPA Releases
Greenhouse Gas Emissions Data from Large Facilities
09/30/2014 EPA Honors Manufacturers with ENERGY STAR Award / Eastman Chemical, Janssen R and D, and Merck use Combined Heat and Power systems to cut carbon pollution, save money, and combat climate change
09/29/2014 ADVISORY: EPA Administrator to Deliver Keynote Speech at Water Environment Federation’s Annual Conference
09/25/2014 EPA Proposes Standards to Reduce Mercury Discharges from Dental Offices
09/25/2014 ADVISORY: Remarks by EPA Administrator Gina McCarthy at Resources for the Future
News Releases from Headquarters
A-Z Index Advanced Search

Notes:
11/12/14 – Page 28 of this file was revised. The bulleted information explaining the slide was revised. “FY2012 Enforcement & Compliance Annual Results, Estimated Environmental Benefits”

Enforcement Annual Results for Fiscal Year 2012 | Enforcement | US EPA
http://www2.epa.gov/enforcement/enforcement-annual-results-fiscal-year-2012[10/1/2014 10:48:59 AM]
Contact UsEnforcement
Overview Case Map Accomplishments Regional Results Analysis and Trends
MOEX Offshore Settlement: EPA’s investigation of MOEX, one of the companies involved in the Deepwater Horizon oil spill, led to a $90 million penalty and commitments to help restore the Gulf Coast.
EPA’s civil and criminal enforcement against the Scotts Miracle-Gro Company resulted in a $12 million combined penalty, the largest ever in a pesticides case.
Advancing environmental justice: EPA incorporated fenceline monitoring into settlements
Map of enforcement cases concluded in FY 2012
You are here: EPA Home » Enforcement » Enforcement Annual Results for Fiscal Year 2012
Enforcement Annual Results for Fiscal Year 2012
EPA enforcement of the nation’s environmental laws protects families and communities from harmful pollution that can cause serious health issues. In fiscal year 2012, EPA took on high priority cases to reduce large sources of pollution and deter violators, addressed pollution problems that have significant health impacts and implemented innovative solutions to protect the environment upon which healthy communities depend.
EPA enforcement accomplishments in FY 2012, include:
$252 million in criminal fnes and civil penaltiesassessed to deter pollution
6.6 billion pounds of pollution and hazardous waste reduced, eliminated, properly disposed of or treated
$44 million in additional investments for supplemental environmental projects that benefit communities
Improving compliance with drinking water regulations by 60%: Sustained and focused enforcement attention on serious violators of clean drinking water standards has resulted in dramatic improvements in compliance.
Progress cleaning up raw sewage and stormwater: 67% of large municipalities with combined sewer overflows are now on track to address their local water issues, many using innovations like green infrastructure to help reduce stormwater flows.
Bringing criminal prosecutions where criminal activity threatens public health: EPA is taking
criminal enforcement action against companies or individuals who fail to use required pollution control equipment, knowingly violate pollution rules, resulting in death or serious harm, or falsify pollution information. See a case example in Louisiana.
ensuring that local residents have access to critical information about pollution that may be affecting their community. See an oil refinery case example.
Enforcement Home
Enforcement Basics
Air Enforcement
Water Enforcement
Waste, Chemical and Cleanup Enforcement
Criminal Enforcement
Data and Results
Policy, Guidance and Publications
United States Environmental Protection Agency

Enforcement Annual Results for Fiscal Year 2012 | Enforcement | US EPA
http://www2.epa.gov/enforcement/enforcement-annual-results-fiscal-year-2012[10/1/2014 10:48:59 AM]
Increasing transparency: EPA’s enforcement and compliance online history tools, including the map of enforcement cases in 2012, state dashboards, and Clean Water Act pollutant loadings tool, provide the public with critical access to environmental information.
See the FY 2012 National Enforcement Initiative accomplishments.
Read the news release - Dec. 17, 2012
Contact Us to ask a question, provide feedback, or report a problem.
Learn the Issues Science & Technology Laws & Regulations About EPA
Español中文: 繁體版中文: 简体版Tiếng Việt한국어
EPA Home Privacy and Security Notice Accessibility
Last updated on March 16, 2014
Hotline News Blog Apps Widgets
Social sites:
More social media at EPA »

Enforcement Annual Results FY 2012 Concluded Cases Map | Enforcement | US EPA
http://www2.epa.gov/enforcement/enforcement-annual-results-fy-2012-concluded-cases-map[10/1/2014 11:07:03 AM]
Overview Case Map Accomplishments Regional Results Analysis and Trends
Enforcement Annual Results FY 2012 Concluded Cases Map
Concluded EPA Enforcement Cases MapThis interactive map shows information on concluded enforcement actions and cases from fiscal year (FY) 2012. They include civil enforcement actions taken by EPA at facilities, criminal cases prosecuted by EPA under federal statutes and the U.S. Criminal Code, and cases in which EPA provided significant support to cases prosecuted under state criminal laws. The indicators on the map generally mark the location of the site or facility where the violations occurred or were discovered.
How to Use the MapAdd or subtract EPA enforcement actions to and from the map by checking or un-checking the box next to the program of interest (water, air, etc). Zoom the map to an exact location. Enter a city and state in the search box, then press the [Enter] key on your keyboard or use the zoom bar in the map's upper left corner. Click on the indicator to get information on the environmental enforcement case. See "Questions About the Maps" for additional information and needs accommodations related to a disability.
Find address or place: Enter city and state. Press [Enter] on your keyboard.
|
Civil enforcement actions at facilities and criminal enforcement actions concluded in FY 2012.
Notes:
For civil enforcement cases not represented on this map see: Facilities not mapped
Cleanup cases are civil enforcement actions taken under the Superfund program and the RCRA corrective action and leaking underground storage tank programs.:
United States Environmental Protection Agency

Enforcement Annual Results FY 2012 Concluded Cases Map | Enforcement | US EPA
http://www2.epa.gov/enforcement/enforcement-annual-results-fy-2012-concluded-cases-map[10/1/2014 11:07:03 AM]
Learn the Issues Science & Technology Laws & Regulations About EPA
Español中文: 繁體版中文: 简体版Tiếng Việt한국어
EPA Home Privacy and Security Notice Accessibility
Last updated on May 12, 2014
Hotline News Blog Apps Widgets
Criminal enforcement cases include those prosecuted by EPA under federal statutes, the U.S. Criminal Code (Title 18), and cases in which EPA provided significant support
to cases prosecuted under state criminal laws.:
Federal - Includes federal agencies and contractors at federal facilities:
Social sites:
More social media at EPA »

Enforcement Annual Results FY 2012 Accomplishments | Enforcement | US EPA
http://www2.epa.gov/enforcement/enforcement-annual-results-fy-2012-accomplishments[10/1/2014 11:10:04 AM]
Overview Case Map Accomplishments Regional Results Analysis and Trends
Enforcement Annual Results FY 2012 Accomplishments
AccomplishmentsThe following is a list of key results of compliance and enforcement activities.
Civil Enforcement Results
Concluded Cases
Pollution Reduced, Treated or Eliminated (Pounds) 22,728
Wetlands Protected or Restored (Acres) 1,500
People Protected by Safe Drinking Water Act Enforcement (# of People) 38,785,812
Hazardous Waste Prevented from Release (pounds) 155,892,581
Liquid in Underground Storage Tanks Prevented from Release (Gallons) 5,203,398
Underground Injection Wells Prevented from Leaking (# of Wells) 155
Toxic Substance Contamination Prevented (# of Housing Units, Schools, Buildings) 1,102
Volume of Oil Spills Prevented (in Gallons) 139,117,294
Toxic Chemicals and Pesticides Prevented from Misuse/Environmental Release (Pounds)21,898,187
Civil Enforcement Monetary Commitments
Concluded Cases
Estimated Value of Complying Actions to be Taken in Response to EPA's Concluded Enforcement Actions (Injunctive Relief) $9,135,543,769
Estimated Investments in Projects that Benefit the Environment and Public Health (Supplemental Environmental Projects) $43,606,036
Administrative Penalties Assessed $52,022,612
Judicial Penalties Assessed $155,539,269
State/Local Judicial Penalties Assessed From Joint Federal-State/Local Enforcement Actions $49,231,052
Stipulated Penalties Paid $4,658,059
Cleanup Enforcement
Amount Committed by Liable Parties to Clean up Superfund Sites $657,000,000
Amount Committed by Liable Parties to Pay for Government Oversight of Superfund Cleanups $67,000,000
Amount Committed by Liable Parties to Reimburse the Government for Money Spent Cleaning up Superfund Sites $172,000,000
** See Cleanup Enforcement Program Accomplishments
Civil Enforcement and Compliance Activities
Referrals of Civil Judicial Enforcement Cases to Department of Justice (DOJ) 179
Supplemental Referrals of Civil Judicial Enforcement Cases to DOJ 36
Civil Judicial Complaints Filed with Court 115
United States Environmental Protection Agency
1

Enforcement Annual Results FY 2012 Accomplishments | Enforcement | US EPA
http://www2.epa.gov/enforcement/enforcement-annual-results-fy-2012-accomplishments[10/1/2014 11:10:04 AM]
Learn the Issues Science & Technology Laws & Regulations About EPA
Español中文: 繁體版中文: 简体版Tiếng Việt한국어
EPA Home Privacy and Security Notice Accessibility
Last updated on May 12, 2014
Hotline News Blog Apps Widgets
Civil Judicial Enforcement Case Conclusions 144
Administrative Penalty Order Complaints 1,760
Final Administrative Penalty Orders 1,780
Administrative Compliance Orders 1,088
Cases with Supplemental Environmental Projects 124
Inspections/Evaluations 19,835
Criminal Enforcement Program
Environmental Crime Cases Opened 320
Defendants Charged 231
Years of Incarceration 79
Fines and Restitution $44,000,000
Value of Court Ordered Environmental Projects $14,000,000
** See Criminal Enforcement Major Case Highlights
National Environmental Policy Act (NEPA) Program
** See NEPA Program Annual Results
Where necessary to reflect EPA's understanding of the precision of the data, numbers in this document and elsewhere on this Web site have been rounded to two or three significant digits.
The primary source for the data displayed in this document is the EPA Regions certified FY 2012 end of year workbooks as of December 5, 2012. The official databases of record are: Integrated Compliance Information System (ICIS), Criminal Case Reporting System, Comprehensive Environmental Response, Compensation & Liability Information System (CERCLIS), Resource Conservation and Recovery Act Information (RCRAInfo), Air Facility System (AFS), and Permit Compliance System (PCS).
Top of Page
Social sites:
More social media at EPA »

Enforcement Annual Results FY 2012 Cleanup Enforcement Program Accomplishments | Enforcement | US EPA
http://www2.epa.gov/enforcement/enforcement-annual-results-fy-2012-cleanup-enforcement-program-accomplishments[10/1/2014 11:11:18 AM]
Enforcement Annual Results FY 2012 Cleanup Enforcement Program AccomplishmentsEach fiscal year, the Environmental Protection Agency (EPA) counts the total private party cleanup commitments of sites where cleanup activity should be performed and settlements have been successfully reached with the parties. EPA's cleanup enforcement program achieves prompt site cleanup and maximum liable party participation in performing and paying for cleanup in ways that promote environmental justice and fairness. The total dollar value of the commitment by private parties to cleanup Superfund sites is driven primarily by settlements and orders that require parties to either conduct or pay for the cleanup.
EPA's most often used and most powerful cleanup enforcement mechanism is the Comprehensive, Environmental Response, Compensation, and Liability Act (CERCLA or Superfund). Superfund is a cleanup authority only and does not otherwise regulate a facility's operations. The Resource Conservation and Recovery Act (RCRA), including the Underground Storage Tank (UST) program, contain both cleanup and regulatory authority. RCRA's cleanup authority is the RCRA Corrective Action program, which addresses cleanup activities at RCRA regulated facilities.
EPA's Superfund enforcement program continues an "enforcement first" (PDF) approach and also ensures a fair, more effective, and more efficient Superfund program by maximizing private party participation in performing and paying for site cleanup.
Fiscal year 2012 activities and accomplishments for cleanup enforcement includes:
$829 million in Private Party Commitments to Cleanup Sites and Recover CostsGPRA Target for Volume of Contaminated Media Addressed (VCMA) ExceededAssessment of the National Enforcement Strategy for RCRA Corrective ActionFederal Appeals Court Affirms District Court Ruling on Divisibility; Cleanup Continues at Fox River Site in Wis.
$829 million in Private Party Commitments to Cleanup Sites and Recover CostsIn FY 2012, EPA obtained $657 million in commitments from responsible parties for studying and cleaning up Superfund sites. Additionally, responsible parties committed to reimburse EPA $172 million for money it has spent cleaning up Superfund sites.
Since 1980, EPA has attained over $37 billion in commitments from responsible parties. Of this amount, over $31.0 billion has been committed to study and clean up of Superfund sites, and approximately $6.0 billion represents reimbursements to EPA for money it spent cleaning up Superfund sites.
In any given year, responsible party cleanup commitments are a function of which National Priorities List (NPL) sites are at the stage in the pipeline where remedial actions should be preformed and settlements can be successfully reached with the parties. Likewise, EPA ensures that where liable, viable responsible parties exist, the parties enter into an agreement to reimburse the Agency for past costs spent at their site. Cost recovery settlements vary each year due to the size and type of individual cost recovery cases.
Top of Page
GPRA Target for Volume of Contaminated Media Addressed (VCMA) ExceededFor FY 2012, EPA is reporting for the first time a combined total for contaminated soil and groundwater media cleanup commitments obtained based on concluded CERCLA and RCRA Corrective Action enforcement actions. EPA exceeded the 300 million cubic yards target under the Government Performance and Results Act (GPRA). The FY 2012 accomplishment is 416.7 million cubic yards. Four large cases totaling 314.6 million cubic yards accounted for 75% of the national total, as follows:
Johnny M Mine, 105.9 million cu. yds. – Region 6Montrose/Del Amo, 81.0 million cu. yds. – Region 9
United States Environmental Protection Agency

Enforcement Annual Results FY 2012 Cleanup Enforcement Program Accomplishments | Enforcement | US EPA
http://www2.epa.gov/enforcement/enforcement-annual-results-fy-2012-cleanup-enforcement-program-accomplishments[10/1/2014 11:11:18 AM]
Holden Mine, 86.9 million cu. yds. – Region 10Newmont Mining/Midnite Mine, 40.8 million cu. yds – Region 10
In addition to soil and groundwater media included in the VCMA GPRA measure, EPA achieved significant air VCMA results in a cleanup addressing vapor intrusion at the Middlefield-Ellis-Whisman (MEW) Study Area Superfund Site in Mountain View, Calif. In March 2012, the district court approved and entered a consent decree amendment for the MEW vapor intrusion remedy, which is one of the largest Superfund vapor intrusion cleanups to date. Under this settlement and a related amended unilateral administrative order, Intel Corporation, Raytheon Company, and several other parties will address human health risks caused by vapor intrusion of trichloroethene (TCE) into approximately 60 commercial and residential buildings. The vapor intrusion remedy supplements previous soil and groundwater cleanup work at the MEW site. The parties will also ensure future buildings in the MEW vapor intrusion study area are designed to prevent vapor intrusion of contamination above site cleanup levels.
Top of Page
Assessment of the National Enforcement Strategy for RCRA Corrective ActionOn April 27, 2010, EPA issued the National Enforcement Strategy for RCRA Corrective Action (PDF) (NESCA) to promote and communicate nationally consistent enforcement and compliance assurance principles, practices, and tools to help EPA and the states achieve the 2020 Corrective Action Goal (2020 CA Goal). This goal is to construct cleanup remedies at 95% of the 3,747 facilities in the 2020 Corrective Action Universe of facilities (the 2020 CA Universe) by the year 2020.
After 18 months of implementation, EPA and its state partners assessed the contribution of NESCA in achieving progress toward the 2020 CA Goal. In September 2012, EPA issued an Assessment of NESCA (PDF) which found that NESCA has been helpful in moving facilities further along the cleanup pipeline toward remedy construction. Based on data reviewed, in fiscal years (FY) 2010 and 2011, Regions issued more enforcement orders than in any year since 1999. Regions and states indicated that there is generally more consideration of enforcement and compliance assurance tools to address contamination at RCRA corrective action facilities during work planning and other meetings.
During FY 2012, 20 new federal RCRA Corrective Action enforcement orders were issued, compared to 23 orders in FY 2011 and 20 in FY 2010. Also in FY 2012, two previously issued final orders were amended and over 55 million cubic yards of contaminated media, including soil and groundwater, is estimated to be addressed because of these new and amended enforcement actions.
The Corrective Action order that addressed the largest amount of contaminated media is associated with the Walter Coke, Inc. site in North Birmingham, Ala. Walter Coke is an industrial coke operation that produces foundry and furnace coke and coke by-products located in North Birmingham, Ala. It has been in operation since 1907 and comprises a 400 acre property. An administrative order issued September 17, 2012 includes a phased approach to implement remedies at approximately 50 acres across the property. More information on NESCA is available on the Agency’s RCRA Corrective Action: NESCA website.
Top of Page
Federal Appeals Court Affrms District Court Ruling on Divisibility; Cleanup Continues at Fox River Site in Wis.On August 3, 2012, the Seventh Circuit Court of Appeals became the first federal circuit court to analyze a defendant’s divisibility defense since the Supreme Court’s decision in Burlington Northern & Santa Fe Railway Co. v. United States, 129 S. Ct. 1870 (2009) (“Burlington Northern”).
Burlington Northern addressed the imposition of joint and several liability on parties found liable under CERCLA. Some private practitioners predicted that Burlington Northern would make it easier for PRPs to succeed in proving divisibility as a defense to avoid CERCLA’s joint and several liability.
In United States v. NCR Corp., 688 F.3d 833 (7th Cir. 2012), the Seventh Circuit’s decision requires NCR to finish scheduled cleanup work in the Fox River under a 2007 unilateral administrative order. The court found that NCR failed to prove that the environmental harm at issue was capable of apportionment because NCR’s contribution to the contamination at the site alone was sufficient to warrant clean up. Thus, the first federal circuit court to address divisibility since Burlington Northern reached a decision favorable to the United States.
NCR argued that the district court’s decision that was the subject of the appeal was at odds with Burlington Northern because the

Enforcement Annual Results FY 2012 Cleanup Enforcement Program Accomplishments | Enforcement | US EPA
http://www2.epa.gov/enforcement/enforcement-annual-results-fy-2012-cleanup-enforcement-program-accomplishments[10/1/2014 11:11:18 AM]
Learn the Issues Science & Technology Laws & Regulations About EPA
Español中文: 繁體版中文: 简体版Tiếng Việt한국어
EPA Home Privacy and Security Notice Accessibility
Last updated on September 24, 2014
Hotline News Blog Apps Widgets
Supreme Court upheld a “rough apportionment calculation.” The Seventh Circuit disagreed. The Seventh Circuit distinguished the present case, noting that Burlington Northern failed to address sites with multiple parties that independently pollute at threshold levels. Whereas Burlington Northern involved one party that contributed to no more than 10% of the total site contamination, the 10% of the total amount of polychorinated biphenols (PCBs) that NCR contributed would require remediation regardless of the fact that it was merely a fraction of the total contamination.
In concluding that NCR’s pollution alone would have triggered cleanup, the Seventh Circuit described this case as an example of “multiple sufficient causes” of environmental harm. Had NCR been the only party to dump PCBs into the river, the river would still have to be dredged because PCB levels contributed by NCR exceeded EPA’s max safety threshold. In other words, there was no linear correlation between the cost of cleanup and the level of PCBs in the river. Once the PCBs reached a threshold level, cleanup became necessary.
More information on the cleanup activity and legal challenges are available from the Lower Fox River and Green Bay Superfund Site website.
Top of Page
Social sites:
More social media at EPA »

2012 Major Criminal Cases | Enforcement | US EPA
http://www2.epa.gov/enforcement/2012-major-criminal-cases[10/1/2014 11:12:35 AM]
Contact UsEnforcement
Pelican Refining uses a child's wading pool to hold waste
Truck containing ozone-depleting refrigerant gas that had been smuggled into the United States illegally.
You are here: EPA Home » Enforcement » 2012 Major Criminal Cases
2012 Major Criminal CasesClean Air Act (CAA)
Pelican Refning Co. (CAA, Title 18, Louisiana)
Pelican Refining Company pleaded guilty to felony violations of the Clean Air Act and to obstruction of justice charges in federal court in Lafayette, La. Pelican paid $12 million in criminal penalties, including $2 million in community service payments that will go toward various environmental projects in Louisiana, including air pollution monitoring. It marks the largest ever criminal fine in Louisiana for violations of the Clean Air Act. Pelican would also be banned from future refinery operations unless and until it implements an environmental compliance plan, which includes external auditing by independent firms and oversight by a court appointed monitor.
Officials of Pelican, headquartered in Houston and operating a refinery in Lake Charles, LA, admitted that the company had violated numerous aspects of its operating permit. The violations were discovered during a March 2006 inspection by the Louisiana Department of Environmental Quality (LDEQ) and EPA, which identified numerous unsafe operating conditions. Pelican also pleaded guilty to obstruction of justice for submitting materially false deviation reports to LDEQ, the agency that administers the federal Clean Air Act in Louisiana.
Two Pelican executives also pled guilty to negligently placing persons in imminent danger of death and serious bodily injury as a result of negligent releases at the refinery. (However, they each received only one day of incarceration in addition to small fines and probation or home confinement). For more information read the complete summary of the case.
Carlos Garcia (CAA, Title 18, Florida)
Carlos Garcia, 52, was sentenced to prison in Miami for his role in the illegal receipt, purchase, and sale of ozone-depleting refrigerant gas that had been smuggled into the United States contrary to the Clean Air Act, in violation of Title 18, United States Code, Section 545.He received a thirteen month term of imprisonment, followed by a two-year term of supervised release that includes four months of home confinement under electronic monitoring. Garcia previously pled guilty to a charge of knowingly receiving, buying, selling and facilitating the transportation, concealment, and sale of approximately 13,600 kilograms of the ozone-depleting substance hydrochlorofluorocarbon-22 (HCFC-22). HCFC-22 is a widely used refrigerant for residential heat pump and air-conditioning systems.
Garcia’s employer, Mar-Cone Appliance Parts Co. (Marcone), was previously convicted and sentenced for their role in the illicit conduct and ordered to pay a $500,000 criminal fine, a $400,000 community service payment, and was ordered to forfeit to the United States $190,534.70 in illegal proceeds. For more information read the complete summary of the case.
Enforcement Home
Enforcement Basics
Air Enforcement
Water Enforcement
Waste, Chemical and Cleanup Enforcement
Criminal Enforcement
Data and Results
Policy, Guidance and Publications
United States Environmental Protection Agency

2012 Major Criminal Cases | Enforcement | US EPA
http://www2.epa.gov/enforcement/2012-major-criminal-cases[10/1/2014 11:12:35 AM]
Remote dump site used by O'Malley to dispose of asbestos
Building slated for demolition involved in the bribery involving Morgan
Columbus Steel Castings Company, Inc. (CAA, Ohio)
Columbus Steel Castings, Columbus, Ohio, was sentenced to pay $825,000 and install additional devices to prevent air pollution after pleading guilty to six counts of violating the Clean Air Act. The violations include failing to operate air pollution controls, failing to report violations, failing to perform required monitoring, and failing to conduct stack testing to demonstrate compliance with the Clean Air Act.
The company admitted that between 2004 and 2007 it failed to operate air pollution controls for four different emission sources at the plant for varying periods of time. The company also failed to report malfunctions of air pollution control equipment. Daily visual emission checks, designed to determine if the plant was emitting excess dust or smoke, were not conducted on weekends while the facility was operating. The company also failed to submit accurate annual compliance certifications.
The company was sentenced to pay a $660,000 fine and a total of $165,000 to two different Columbus charitable organizations, Grange Insurance Audubon Center and Physicians Free Clinic, which serve residents who live near the plant. One project will fund a program that provides environmental education to students. The other project will provide medical services, medications, and transportation services for residents of the south side of Columbus with ailments, including, asthma, and treatments, including medications, related to respiratory illnesses. For more information read the complete summary of the case.
Duane O’Malley (CAA, Illinois)
Duane O’Malley, 59, of Bourbonnais, Ill., who was convicted by a federal jury on September 26, 2011, for the illegal removal, handling and disposal of asbestos from a Kankakee building in August 2009, was sentenced to 10 years in prison. O’Malley was also ordered to pay restitution of $47,086 to the U.S. Environmental Protection Agency (EPA) related to the clean-up of illegally disposed asbestos and ordered to pay a fine of $15,000. Asbestos is a mineral fiber that has been used commonly in a variety of building construction materials. When asbestos-containing materials are damaged or disturbed by repair, remodeling or demolition activities, microscopic fibers become airborne and can be inhaled into the lungs, where they can cause serious health problems, including lung cancer and mesothelioma. For more information read the complete summary of the case.
William Morgan (CAA, Title 18, Michigan)
William Morgan, the former supervisor of Royal Oak Township, a suburb of Detroit, was sentenced in federal court to three years in prison. Mr. Morgan had previously entered a guilty plea to charges that he conspired to defraud the U.S. Department of Housing and Urban Development (HUD), violate the Clean Air Act’s asbestos requirements, and commit bribery. Asbestos is a mineral fiber that has been used commonly in a variety of building construction materials. When asbestos-containing materials are damaged or disturbed by repair, remodeling or demolition activities, microscopic fibers become airborne and can be inhaled into the lungs, where they can cause serious health problems. For more information read the complete summary of the case.
Rodney Hailey [CAA, Title 18: Conviction Only, Sentenced Scheduled for October 2012 ( FY 2013)]
Rodney R. Hailey, owner of Clean Green Fuel, LLC, located in the Baltimore area. was convicted by a federal jury on June 25, 2012 of wire fraud, money laundering and a violation of the Clean Air Act, in connection with a scheme in which he sold $9 million in renewable fuel credits which he falsely claimed were produced by his company, Clean Green Fuel, LLC.
According to evidence presented at the six day trial, Hailey registered Clean Green Fuel with the EPA as

2012 Major Criminal Cases | Enforcement | US EPA
http://www2.epa.gov/enforcement/2012-major-criminal-cases[10/1/2014 11:12:35 AM]
Freedman Farms discharged hog waste into stream leading to Waccamaw River
Falsifying records to conceal discharges of oily wastewater from the ship directly into the sea
A teen-age employee was directed to illegally dispose of this type of hazardous chemicals down the company toilet
a producer of bio-diesel fuel Between March 2009 and December 2010, Hailey sold over 35 million RINs (representing 23 million gallons of bio-diesel fuel) to brokers and oil companies for at least $9 million, when in fact Clean Green Fuel had produced no fuel at all and Hailey did not have a facility capable of producing bio-diesel fuel. For more information read the DOJ press release.
Clean Water Act (CWA)Freedman Farms Inc. (CWA, North Carolina)
Freedman Farms, a CAFO, was sentenced to five years probation and ordered to pay $1.5 million in fines, restitution and community service payments for violating the Clean Water Act when they discharged hog waste into a stream that leads to the Waccamaw River. William B. Freedman, president of Freedman Farms, was sentenced to six months in prison to be followed by six months of home confinement. Freedman Farms also is required to implement a comprehensive environmental compliance program and institute an annual training program. For more information read the complete summary of the case.
Bottiglieri Shipping Company (Act to Prevent Pollution from Ships, AL)
Giusseppe Bottiglieri Shipping Company, headquartered in Italy, and the chief engineer of one of its ships, were sentenced in federal court in Mobile, Ala., for deliberately falsifying records to conceal discharges of oily wastewater from the ship directly into the sea. The company will pay a $1 million criminal fine, serve four years of probation, and make a $300,000 community service payment to the National Fish and Wildlife Foundation. The company must also fund and implement a comprehensive environmental compliance plan during the term of probation. Chief Engineer Vito La Forgia was sentenced by Judge Granade to one month in jail. Both pled previously to violating the Act to Prevent Pollution from Ships. For more information read the complete summary of the case.
Patrick Dooley (CWA, Washington)
Patrick Dooley, a Seattle business owner of Bargains, Inc., aka AAA Liquidating Services, Inc., who directed a teen-age employee to illegally dispose of hazardous chemicals, was sentenced to 33 months in prison, and three years of supervised release after being convicted of three counts of Clean Water Act violations and one count of witness tampering related to an August 2010 hazardous materials event. Two chemicals reacted to produce chlorine gas of a sufficient concentration to cause the juvenile employee to have difficulty breathing, resulting in emergency medical personnel taking him to a nearby hospital where he was treated and released. For more information read the complete summary of the case.
Federal Insecticide, Fungicide and Rodenticide Act (FIFRA)Scott’s Miracle-Gro Company (FIFRA, OHIO)
Scotts Miracle-Gro Company, a producer of pesticides for commercial and consumer lawn and garden uses, was sentenced in federal district court in Columbus, Ohio, to pay a $4 million fine and perform community service

2012 Major Criminal Cases | Enforcement | US EPA
http://www2.epa.gov/enforcement/2012-major-criminal-cases[10/1/2014 11:12:35 AM]
Pesticides for commercial and consumer lawn and garden uses
Utah home where 2 little girls died as a result of the illegal application of a registered pesticide
Hear Their Story
Edward Wyman illegal dump site
for eleven criminal violations of the Federal Insecticide, Fungicide, and Rodenticide Act (FIFRA), which governs the manufacture, distribution, and sale of pesticides. Scotts pleaded guilty to illegally applying insecticides to its wild bird food products that are toxic to birds, falsifying pesticide registration documents, distributing pesticides with misleading and unapproved labels, and distributing unregistered pesticides. Scotts also pleaded guilty to submitting false documents to EPA and to state regulatory agencies in an effort to deceive them into believing that numerous pesticides were registered with EPA when in fact they were not. This is the largest criminal penalty under FIFRA to date. For more information read the complete summary of the case.
Bugman Pest and Lawn, Inc. (FIFRA, Utah)
Bugman Pest and Lawn, and Coleman Nocks, were sentenced in federal court in Salt Lake City to a misdemeanor count of unlawful use of a registered pesticide. The convictions relate to the application of a registered pesticide at a home which resulted in the deaths of two children. Both defendants had previously pled guilty. The misdemeanor FIFRA charges in this case carry the same penalty as the crime of negligent homicide available under state law. Nocks, who was a licensed commercial applicator of pesticides and an employee of Bugman, admitted that he used Fumitoxin, a registered, restricted use pesticide, at the home of a customer of his employer. Nocks admitted that he applied Fumitoxin into a burrow system that was closer than 15 feet to the residence and that he exceeded dosage requirements for the pesticide. Nocks acknowledged in his plea agreement that his conduct caused the death of two minor children at the residence. Nocks was sentenced to three years' probation and 100 hours of community service. For more information read the complete summary of the case. (Note: The enforcement provisions of FIFRA only provide for misdemeanors.)
Resource Conservations and Recovery Act (RCRA)Edward Wyman (RCRA, California)
Edward Wyman was sentenced to five years in federal prison for illegally storing toxic and explosive hazardous wastes in his backyard, materials that posed an imminent danger to nearby residents. The sentence is the longest handed down by a California federal judge in a hazardous waste case. Wyman was also ordered to pay $800,000 to the United States Environmental Protection Agency’s Region 9 Emergency Response Office for costs associated with a 47-day clean-up.
Wyman was convicted by a federal jury following a five-day trial.

2012 Major Criminal Cases | Enforcement | US EPA
http://www2.epa.gov/enforcement/2012-major-criminal-cases[10/1/2014 11:12:35 AM]
Results of improper lead paint abatement at rental properties owned and managed by Murrell
In addition to convicting Wyman of violating the RCRA, the jury made a special finding that the defendant’s conduct knowingly placed another person in imminent danger of death or serious bodily injury. During the clean-up, EPA contractors were forced to call out the Los Angeles Police Department Bomb and Arson Squad seven times to deal with possible explosives mixed into the burned debris.
Wyman was charged in June 2009, after firefighters responded to a report of a fire and explosions at Wyman’s residence. Because of the ammunition that was being “cooked off” in the fire, firefighters had to wear bullet proof vests. Investigators at the scene discovered a large cache of toxic materials, including thousands of rounds of corroded ammunition, highly reactive lead-contaminated waste from shooting ranges, hundreds of pounds of decades-old gunpowder and military M6 cannon powder, and industrial solvents that contained 1,1,1-trichloroethane and tetrachloroethylene, two potent chemicals that are listed as hazardous substances under federal law. Wyman did not have a permit to store any of the materials. For more information read the complete summary of the case.
Toxic Substances Control Act (TSCA)Cephus Murrell
Cephus R. Murrell, age 69, of Catonsville, Maryland, was sentenced to a year and a day in prison, followed by six months of home detention as part of one year supervised release, for improper lead paint abatement at rental properties owned and managed by Murrell, as well as failure to disclose to tenants the presence of documented lead-based paint hazards. Murrell owns and manages approximately 175 rental housing units throughout Baltimore. Murrell had lead-abatement work proceed at apartments he owned without a supervisor on site to ensure the work was done properly and his company failed to disclose to tenants the presence of documented lead-based paint hazards when they rented units he owned and managed. For more information read the complete summary of the case.
Top of page
Complete Enforcement Annual Results for Fiscal Year 2012
Contact Us to ask a question, provide feedback, or report a problem.
Learn the Issues Science & Technology Laws & Regulations About EPA
Español中文: 繁體版中文: 简体版Tiếng Việt한국어
EPA Home Privacy and Security Notice Accessibility
Last updated on July 8, 2014
Hotline News Blog Apps Widgets
Social sites:
More social media at EPA »

National Environmental Policy Act (NEPA) 2012 Annual Results | Compliance and Enforcement | US EPA
http://www.epa.gov/compliance/nepa/2012annualresults.html[10/1/2014 11:13:39 AM]
You are here: EPA Home Compliance and Enforcement National Environmental Policy Act (NEPA)
National Environmental Policy Act (NEPA)Contact Us Search: All EPA Compliance and Enforcement
National Environmental Policy Act (NEPA) 2012 Annual ResultsIn fulfillment of our responsibilities under Section 309 of the Clean Air Act, EPA issued comment letters on 430 draft and final EISs. These included EISs concerning:
renewable energy - 25oil and gas exploration or extraction - 14mining - 15transmission lines - 12
EPA met its performance goals in FY 2012 for the NEPA program: 75% of the significant impacts identified in EPA's comment letters on Draft EISs were avoided, minimized, or compensated for ("mitigated") by the lead Agencies in the Final EISs published in FY 2012.
High Priority Infrastructure ProjectsEPA engaged with lead Federal Agencies during NEPA reviews to support work on a number of high priority infrastructure projects identified through the Presidential Memorandum on Speeding Infrastructure Development and the Executive Order on Improving Performance of Federal Permitting and Review of Infrastructure Projects. EPA also worked with federal agencies as a member of the Rapid Response Teams for Renewable Energy, Transmission Lines, and Transportation to improve federal agency coordination and timely completion of permits, reviews, and requirements for high priority infrastructure projects.
e-NEPAEPA implemented e-NEPA, an electronic filing system for Environmental Impact Statements (EIS) that will increase efficiency and transparency and save government resources. EPA conducted outreach efforts (webinars, conference calls and meetings) with Agencies to pilot electronic filing and educate them on the process and benefits of the system.
Air Quality Memorandum of UnderstandingWe continued our efforts to implement the interagency Memorandum of Understanding (MOU) with the Bureau of Land Management, the Forest Service, the National Park Service, and the Fish and Wildlife Service that established a mutually acceptable approach for addressing air quality analyses and mitigation for Federal oil and gas development actions.
NEPAssistEPA released the NEPAssist Public View, which was promoted as a Counsel on Environmental Quality (CEQ) NEPA pilot project to improve the efficiency of Federal Environmental Reviews. We demonstrated the benefits of this application to a broad audience through public webinars, press releases, help guides and Questions/Answers.
Environmental Justice and NEPAWe created Environmental Justice Considerations in the NEPA Process, which includes federal and agency guidance and best practices related to EJ and NEPA, methodologies that support EJ considerations, and on-line tools to support EJ Analyses.
Compliance and Enforcement Home
National Environmental Policy Act Home
Basic Information
Where You Live
Environmental Impact Statements - Notices of Availability
Submitting Environmental Impact Statements
Obtaining Environmental Impact Statements
EPA Comments on Environmental Impact Statements
EPA Compliance with NEPA

National Environmental Policy Act (NEPA) 2012 Annual Results | Compliance and Enforcement | US EPA
http://www.epa.gov/compliance/nepa/2012annualresults.html[10/1/2014 11:13:39 AM]
EPA Home Privacy and Security Notice FOIA Contact Us
Childrens Health and NEPAWe collaborated with the Office of Children's Health Protection to develop a joint memorandum "Addressing Children's Health through Reviews Conducted Pursuant to NEPA and Section 309 of the Clean Air Act". The memorandum includes a template for EPA's scoping comments and a list of projects that may affect children's health for use during the environmental review process.

Enforcement Annual Results FY 2012 Results by Region | Enforcement | US EPA
http://www2.epa.gov/enforcement/enforcement-annual-results-fy-2012-results-region[10/1/2014 11:14:41 AM]
Overview Case Map Accomplishments Results by Region Analysis and Trends
Enforcement Annual Results FY 2012 Results by Region
Accomplishments by EPA RegionEPA's regional offices work with state and tribal governments to ensure compliance with our nation's environmental laws. Our civil and criminal enforcement actions are focused on the most serious water, air and chemical hazards including those identified in EPA's national enforcement initiatives and advance environmental justice by protecting overburdened communities.
To see results of EPA's enforcement work in our regional areas, select your state from the list or map below to go to your state's EPA regional enforcement results.
Select a LinkAfter you select a link, press go to jump to that link.Alabama - Region 4
Choose Your State or Region.
EPA Region 1
Serving Connecticut, Maine, Massachusetts, New Hampshire, Rhode Island, and Vermont
Accomplishments:
Civil Cases
Estimated pollution reduced, treated or Eliminated (Pounds) 1,631,525
Estimated contaminated soil and water to be cleaned up (Cubic Yard) 4,233,948
Enforcement Activities
Case initiations 163
United States Environmental Protection Agency
1

Enforcement Annual Results FY 2012 Results by Region | Enforcement | US EPA
http://www2.epa.gov/enforcement/enforcement-annual-results-fy-2012-results-region[10/1/2014 11:14:41 AM]
Case conclusions 170
Find additional information on enforcement activities in Region 1
Top of page
EPA Region 2Serving New Jersey, New York, Puerto Rico, and the U.S. Virgin Islands.
Accomplishments:
Civil Cases
Estimated pollution reduced, treated or Eliminated (Pounds) 65,098,791
Estimated hazardous waste treated, minimized, or properly disposed of (Pounds) 226,400,209
Estimated contaminated soil and water to be cleaned up (Cubic Yard) 18,567,108
Enforcement Activities
Case initiations 463
Case conclusions 464
Find additional information on enforcement activities in Region 2
Top of page
EPA Region 3Serving Delaware, the District of Columbia, Maryland, Pennsylvania, Virginia, and West Virginia.
Accomplishments:
Civil Cases
Estimated pollution reduced, treated or Eliminated (Pounds) 27,259,954
Estimated hazardous waste treated, minimized, or properly disposed of (Pounds) 1,831,860
Estimated contaminated soil and water to be cleaned up (Cubic Yard) 3,147,247
Enforcement Activities
Case initiations 245
Case conclusions 234
Find additional information on enforcement activities in Region 3
Top of page
EPA Region 4Serving Alabama, Florida, Georgia, Kentucky, Mississippi, North Carolina, South Carolina, and Tennessee
Accomplishments:
Civil Cases
Estimated pollution reduced, treated or Eliminated (Pounds) 1,713,180,981
Estimated hazardous waste treated, minimized, or properly disposed of (Pounds) 191,645
Estimated contaminated soil and water to be cleaned up (Cubic Yard) 44,753,561
Enforcement Activities
1
1
1
1
1
1

Enforcement Annual Results FY 2012 Results by Region | Enforcement | US EPA
http://www2.epa.gov/enforcement/enforcement-annual-results-fy-2012-results-region[10/1/2014 11:14:41 AM]
Case initiations 492
Case conclusions 482
Find additional information on enforcement activities in Region 4
Top of page
EPA Region 5Serving Illinois, Indiana, Michigan, Minnesota, Ohio, and Wisconsin.
Accomplishments:
Civil Cases
Estimated pollution reduced, treated or Eliminated (Pounds) 87,909,210
Estimated hazardous waste treated, minimized, or properly disposed of (Pounds) 123,040
Estimated contaminated soil and water to be cleaned up (Cubic Yard) 890,529
Enforcement Activities
Case initiations 340
Case conclusions 351
Find additional information on enforcement activities in Region 5
Top of page
EPA Region 6Serving Arkansas, Louisiana, New Mexico, Oklahoma, and Texas
Accomplishments:
Civil Cases
Estimated pollution reduced, treated or Eliminated (Pounds) 13,204,060
Estimated hazardous waste treated, minimized, or properly disposed of (Pounds) 4,128,528,000
Estimated contaminated soil and water to be cleaned up (Cubic Yard) 108,532,477
Enforcement Activities
Case initiations 535
Case conclusions 508
Find additional information on enforcement activities in Region 6
Top of page
EPA Region 7Serving Iowa, Kansas, Missouri, and Nebraska.
Accomplishments:
Civil Cases
Estimated pollution reduced, treated or Eliminated (Pounds) 116,332,355
Estimated hazardous waste treated, minimized, or properly disposed of (Pounds) 28,851
Estimated contaminated soil and water to be cleaned up (Cubic Yard) 19,840,899
1
1
1
1
1
1

Enforcement Annual Results FY 2012 Results by Region | Enforcement | US EPA
http://www2.epa.gov/enforcement/enforcement-annual-results-fy-2012-results-region[10/1/2014 11:14:41 AM]
Enforcement Activities
Case initiations 211
Case conclusions 217
Find additional information on enforcement activities in Region 7
Top of page
EPA Region 8Serving Colorado, Montana, North Dakota, South Dakota, Utah, and Wyoming.
Accomplishments:
Civil Cases
Estimated pollution reduced, treated or Eliminated (Pounds) 7,493,673
Estimated contaminated soil and water to be cleaned up (Cubic Yard) 255
Enforcement Activities
Case initiations 154
Case conclusions 145
Find additional information on enforcement activities in Region 8
Top of page
EPA Region 9Serving Arizona, California, Hawaii, Nevada, American Samoa, Commonwealth of the Northern Mariana Islands, Federated States of Micronesia, Guam, Marshall Islands, and Republic of Palau.
Accomplishments:
Civil Cases
Estimated pollution reduced, treated or Eliminated (Pounds) 10,728,294
Estimated hazardous waste treated, minimized, or properly disposed of (Pounds) 10,783,345
Estimated contaminated soil and water to be cleaned up (Cubic Yard) 87,786,204
Enforcement Activities
Case initiations 182
Case conclusions 184
Find additional information on enforcement activities in Region 9
Top of page
EPA Region 10Serving Alaska, Idaho, Oregon, and Washington.
Accomplishments:
Civil Cases
Estimated pollution reduced, treated or Eliminated (Pounds) 139,874,129
Estimated contaminated soil and water to be cleaned up (Cubic Yard) 128,573,825
1
1
1
1

Enforcement Annual Results FY 2012 Results by Region | Enforcement | US EPA
http://www2.epa.gov/enforcement/enforcement-annual-results-fy-2012-results-region[10/1/2014 11:14:41 AM]
Learn the Issues Science & Technology Laws & Regulations About EPA
Español中文: 繁體版中文: 简体版Tiếng Việt한국어
EPA Home Privacy and Security Notice Accessibility
Last updated on September 9, 2014
Hotline News Blog Apps Widgets
Enforcement Activities
Case initiations 195
Case conclusions 187
Find additional information on enforcement activities in Region 10
Top of page
Sources for Data displayed in this document: Integrated Compliance Information System (ICIS), Comprehensive Environmental Response, Compensation & Liability Information System (CERCLIS).
Footnotes:1. Projected pollution reductions to be achieved during the one year period after all compliance actions have been completed.
(return to text)
Social sites:
More social media at EPA »

Enforcement Annual Results FY 2012 Analysis and Trends | Enforcement | US EPA
http://www2.epa.gov/enforcement/enforcement-annual-results-fy-2012-analysis-and-trends[10/1/2014 11:15:12 AM]
Overview Cases Map Accomplishments Regional Results Analysis and Trends
Enforcement Annual Results FY 2012 Analysis and Trends
Analysis and TrendsThese charts show key fiscal year 2012 compliance and enforcement results compared to other years.
You will need Adobe Reader to view some of the files on this page. See EPA's PDF page to learn more.
Government Performance and Results Act (GPRA)All 2012 Annual Results Data and Trend Charts (PDF)
Individual results charts are presented below.
EPA Environmental ResultsEstimated Environmental Benefits-Commitments to Reduce, Treat or Eliminate PollutionEstimated Value of Investments in Pollution ControlsCivil Penalities and Criminal Fines AssessedAdministrative and Civil Judicial Penalities Assessed (with statutory breakout), 2008 - 2012Supplemental Environmental Projects, 2008 - 2012Estimated Environmental Benefits Hazardous Waste Treated, Minimized or Properly Disposed Of Estimated Environmental Benefits Volume of Contaminated Soil and Water to be Cleaned UpEPA Civil Enforcement Case Initiations and Conclusions
EPA Civil Enforcement ProgramInspections/Evaluations (by statute) 2008 - 2012Superfund Results
EPA Criminal Enforcement ProgramNumber of Investigations Opened, Defendants Charged and Sentences Value of Fines and Restitution and Value of Court Ordered Environmental Projects
Top of Page
Government Performance and Results Act (GPRA) ResultsMeasure Number
GPRA External Performance MeasureFY 12 Target
FY 12 Actual
409 Number of federal inspections and evaluations 19,000 20,000
410 Number of civil judicial and administrative enforcement cases initiated 3,300 3,027
411 Number of civil judicial and administrative enforcement cases concluded 3,200 3,012
412 Percentage of open consent decrees reviewed for overall compliance status 100% 91%
418 Percentage of criminal cases having the most significant health, environmental, and deterrence impacts 43% 45%
420 Percentage of criminal cases with charges filed 40% 44%
United States Environmental Protection Agency

Enforcement Annual Results FY 2012 Analysis and Trends | Enforcement | US EPA
http://www2.epa.gov/enforcement/enforcement-annual-results-fy-2012-analysis-and-trends[10/1/2014 11:15:12 AM]
Learn the Issues Science & Technology Laws & Regulations About EPA
Español中文: 繁體版中文: 简体版Tiếng Việt한국어
EPA Home Privacy and Security Notice Accessibility
Last updated on May 12, 2014
Hotline News Blog Apps Widgets
419 Percentage of criminal cases with individual defendants 75% 70%
421 Percentage of conviction rate for criminal defendants 85% 95%
400 * Millions of pounds of air pollutants reduced, treated, or eliminated through concluded enforcement actions
480 M lbs 250 M
402 * Millions of pounds of water pollutants reduced, treated, or eliminated through concluded enforcement actions
320 M lbs 500 M
404 * Millions of pounds of toxic and pesticide pollutants reduced, treated, or eliminated through concluded enforcement actions
3.8 M lbs
1,400 M
405 Millions of pounds of hazardous waste pollutants reduced, treated, or eliminated through concluded enforcement actions
6,500 M lbs
4,400 M
417Millions of cubic yards of contaminated soil and groundwater media EPA has obtained commitments to clean up as a result of concluded CERCLA and RCRA corrective action enforcement actions.
300 M cu. yds.
417 M
285Percentage of Superfund sites having viable, liable responsible parties other than the federal government where EPA reaches a settlement or takes an enforcement action before starting a remedial action.
99% 100%
078 Percentage of all Superfund statute of limitations cases addressed at sites with unaddressed total past costs equal to or greater than $200,000. 100% 100%
* GPRA measures 400, 402, and 404 respectively quantify pollutant releases that are or will be reduced, treated or eliminated to air, water, and land as a result of EPA enforcement actions. Measure 404 includes reductions of pollutant releases to land (e.g., RCRA non-hazardous waste, oil, gasoline, or solvents), as well as reductions in distribution of illegal products, including pesticides and new and existing chemicals.
Top of Page
Social sites:
More social media at EPA »

U.S. Environmental Protection Agency 1
Fiscal Year 2012 EPA Enforcement & Compliance
Annual Results
Prepared by the Office of Enforcement and Compliance Assurance US Environmental Protection Agency
December 17, 2012

U.S. Environmental Protection Agency 2
FY2012 Enforcement & Compliance Annual Results Table of Contents
EPA Environmental Results Page Estimated Environmental Benefits-Commitments to reduce, treat or eliminate Pollution 3 Investments in Actions & Equipment to Reduce Pollution & Protect the Environment (Injunctive Relief) 4 Civil Penalties and Criminal Fines Assessed 5 Civil Penalties Assessed 6 Supplemental Environmental Projects 7 Estimated Environmental Benefits – Pounds of Hazardous Waste Treated, Minimized, or Properly Disposed Of 8 Estimated Environmental Benefits – Volume of Contaminated Soil & Water to be Cleaned Up 9 EPA Civil Enforcement Case Initiations and Conclusions 10 EPA Civil Enforcement Program Inspections/Evaluations 11 Superfund Results 12 EPA Criminal Enforcement Program Environmental Crime Cases Opened, Defendant Charged Sentencing Results – Years of Incarceration 13 Value of Fines and Restitution & Value of Court Ordered Environmental Projects 14 Acronyms – Statute and Abbreviations/Section Description 15

Estimated Environmental Benefits
Commitments to Reduce, Treat or Eliminate Pollution
U.S. Environmental Protection Agency 3
FY2012 Enforcement & Compliance Annual Results
3,900
580
1,500 1,800
2,200
0
1,000
2,000
3,000
4,000
5,000
6,000
FY08 FY09 FY10 FY11 FY12
Lbs.
(mill
ion)
FY2012 Data Source: Integrated Compliance Information System (ICIS); data source for previous fiscal years: ICIS.
1 Beginning in FY2002, EPA began using the current methodologies.
• In FY 2012, EPA enforcement actions requiredcompanies to reduce pollution by an estimated 2.2 billion pounds per year - the second highest amount since EPA began measuring pollutant reductions from enforcement cases using current methodologies.
• In FY08, the large result was primarily due to onehuge NSR/PSD power plant case, AEP(American Electric Power) involving multiple plants.

FY2008-2012 Enforcement & Compliance Annual Results
U.S. Environmental Protection Agency 4
Estimated Value of Investments in Pollution Controls
Note: All prior FY dollar figures in this report are adjusted to reflect the current value in FY 2012 dollars based on the monthly rate of inflation/deflation as determined by the U.S. Department of Labor Consumer Price Index for All Urban Consumers.
FY2012 Data Source: Integrated Compliance Information System (ICIS); data source for previous fiscal years: ICIS.
$0
$2
$4
$6
$8
$10
$12
$14
$16
$18
$20
08 09 10 11 12
Com
plyi
ng A
ctio
n Va
lue
Bill
ions
Fiscal Year
(Administrative and Civil Judicial Combined, with Statutory Breakout) (Inflation/Deflation Adjusted to FY 12 Dollars)
CAA
CERCLA
CWA
EPCRA
FIFRA
MPRSA
RCRA
SDWA
SDWA PWSS SDWA UIC
TSCA
• In FY 2012, EPA enforcement actions required companies to invest more than $9 billion in actions & equipment to control pollution (injunctive relief)
•The variability in the value of investments in pollution control is due in large part to the extremely large CAA settlements in 2008 and 2011 (AEP and TVA, respectively) and normal fluctuations in the timing of entry of settlements.

Civil Penalties & Criminal Fines Assessed
$132
$94 $106
$152
$208
$66 $100
$42 $35 $44
$0
$50
$100
$150
$200
$250
FY 2008 FY 2009 FY 2010 FY 2011 FY 2012
Pena
ltie
s &
Fin
es (i
n $m
illio
ns)
Fiscal Year
Administrative & Civil Penalties
Criminal Fines & Restitution
*Note: All prior FY dollar figures in this report are adjusted to reflect the current value in FY 2012 dollars based on the monthly rate of inflation/deflation as determined by the U.S. Department of Labor Consumer Price Index for All Urban Consumers. FY2012 Data Source: Integrated Compliance Information System (ICIS); data source for previous fiscal years: ICIS
Administrative/Civil Penalties & Criminal/Restitution Fines
6
FY2008-2012 Enforcement & Compliance Annual Results
U.S. Environmental Protection Agency
• Penalties – both civil and criminal – play an important role in deterring violations.
• In FY 2012, EPA enforcement actions required companies to pay over $200 million in civil penalties (administrative and judicial) – an all-time record amount.
• In FY 2012, EPA criminal prosecutions resulted in $44 million in criminal fines and restitution.

FY2012 Enforcement & Compliance Annual Results
$0
$50
$100
$150
$200
$250
08 09 10 11 12
Pena
lty V
alue
(in
Mill
ions
)
Fiscal Year
Administrative and Civil Judicial Penalties Assessed (with Statutory Breakout)
FY 2008-FY2012 (Inflation/Deflation Adjusted to FY 12 Dollars)
CAA CERCLA CWA EPCRA FIFRA MPRSA RCRA SDWA TSCA
U.S. Environmental Protection Agency 6
Note: All prior FY dollar figures in this report are adjusted to reflect the current value in FY 2012 dollars based on the monthly rate of inflation/deflation as determined by the U.S. Department of Labor Consumer Price Index for All Urban Consumers. FY2012 Data Source: Integrated Compliance Information System (ICIS); data source for previous fiscal years: ICIS
• In FY 2012, an increased focus on large cases and the deterrent message they send resulted in a record year for penalties including a settlement with MOEX ($90M) in settlement of its liability in the Deepwater Horizon oil spill. • In FY 2012, EPA enforcement actions required companies to pay over $200 million in civil penalties (administrative and judicial) . • Penalty results include a CAA mobile source judgement of $57.3 million against Volvo Truck Corporation for breach of a 1998 judicial Consent Decree.
• Penalty results in FY 2012 also include the largest penalty ever in a FIFRA case, The Scotts Miracle Gro Company ($6M).

FY2012 Enforcement & Compliance Annual Results
U.S. Environmental Protection Agency 7
Supplemental Environmental Projects FY 2008 – FY 2012
(Inflation/Deflation Adjusted to FY 12 Dollars)
1 Supplemental Environmental projects that a defendant/respondent agrees to undertake in settlement of an enforcement action, but which the defendant/ respondent is not otherwise legally required to perform. Note: All prior FY dollar figures in this report are adjusted to reflect the current value in FY 2012 dollars based on the monthly rate of inflation/deflation as determined by the U.S. Department of Labor Consumer Price Index for All Urban Consumers.
FY2012 Data Source: Integrated Compliance Information System (ICIS); data source for previous fiscal years: ICIS.
188
150
119 103
124
$0
$10
$20
$30
$40
$50
$60
$70
$80
$90
0
50
100
150
200
250
08 09 10 11 12
Valu
e of
SEP
s (M
illio
ns)
Num
ber o
f SEP
s
Fiscal Year
Value of Supplemental Environmental Projects (SEPs)
Value of SEPs (Millions)
Number of Cases with SEPs
$41M $43M
$24M $25M
$44M
• In FY 2012, EPA enforcement actions resulted in more than $44 million in Supplemental Environmental Projects1 – a five year high • In FY 2012, the settlement in MOEX accounted for approximately $20 million of the total value of SEPs.
U.S. Environmental Protection Agency 8
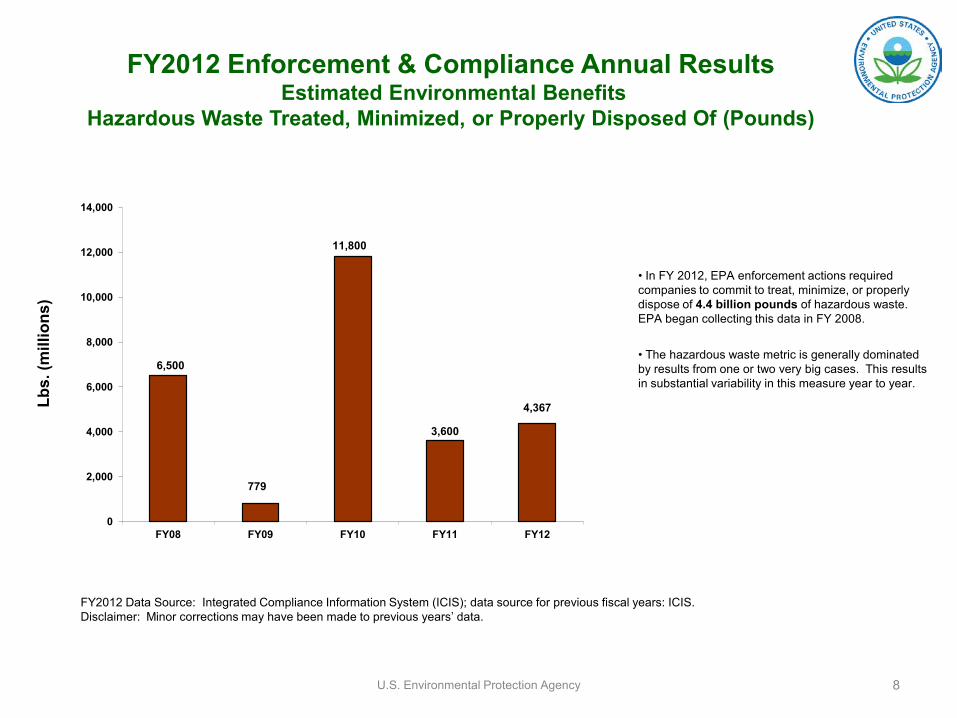
FY2012 Enforcement & Compliance Annual Results Estimated Environmental Benefits
Hazardous Waste Treated, Minimized, or Properly Disposed Of (Pounds)
6,500
779
11,800
3,600
4,367
0
2,000
4,000
6,000
8,000
10,000
12,000
14,000
FY08 FY09 FY10 FY11 FY12
Lbs.
(mill
ions
)
FY2012 Data Source: Integrated Compliance Information System (ICIS); data source for previous fiscal years: ICIS. Disclaimer: Minor corrections may have been made to previous years’ data.
• In FY 2012, EPA enforcement actions required companies to commit to treat, minimize, or properly dispose of 4.4 billion pounds of hazardous waste. EPA began collecting this data in FY 2008.
• The hazardous waste metric is generally dominated by results from one or two very big cases. This results in substantial variability in this measure year to year.

U.S. Environmental Protection Agency 9
FY2012 Enforcement & Compliance Annual Results Estimated Environmental Benefits
Volume of Contaminated Soil & Water to be Cleaned Up
FY2012 Data Source: Integrated Compliance Information System (ICIS); data source for previous fiscal years: ICIS. Disclaimer: Minor corrections may have been made to previous years’ data.
100,000 28,700 9,000 33,000 158,000
255,000
431,000
107,000
900,000
277,000
0
100,000
200,000
300,000
400,000
500,000
600,000
700,000
800,000
900,000
1,000,000
FY 08 FY 09 FY 10 FY 11 FY 12 Contaminated Soil to be cleaned Contaminated Water to be cleaned
Volu
me
(tho
usan
ds)
• An estimated 277 million cubic yards of contaminated water/aquifer are to be cleaned up as a result of EPA enforcement cases concluded in FY 2012. • An estimated 158 million cubic yards of contaminated soil are to be cleaned up as a result of EPA enforcement cases concluded in FY 2012.

U.S. Environmental Protection Agency 10
FY2012 Enforcement & Compliance Annual Results EPA Civil Enforcement Case Initiations and Conclusions
FY2012 Data Source: Integrated Compliance Information System (ICIS); data Source for previous fiscal years: ICIS.
1,390 1,588
1,302 1,324 1,088
2,084 1,916
1,830 1,735
1,780
192 201
200 182
144
0
500
1,000
1,500
2,000
2,500
3,000
3,500
4,000
FY 08 FY 09 FY 10 FY 11 FY 12
Civil Judicial Conclusions
Final Administrative Penalty Orders
Administrative Compliance Orders
Total Civil Initiations
• EPA continues to pursue larger more complex, risk-based enforcement cases leading to fewer initiations and conclusions in FY 11 and FY12.
• In FY 2012, EPA concluded 3,012 civil judicial and administrative cases. • EPA Initiated a total of 3,027 civil enforcement cases (judicial and administrative) in FY 2012.

U.S. Environmental Protection Agency 11
FY2012 Enforcement & Compliance Annual Results Compliance Monitoring
Number of Inspections - Evaluations Conducted by EPA
Note: The numbers of EPA Civil Investigations for the last five FYs are: 222 (FY 08), 246 (FY 09), 282 (FY 10), 177 (FY 11) and (237) FY12. Note: There are other compliance monitoring activities conducted by the EPA that are not reflected in this chart.
FY2012 Data Source: Integrated Compliance Information System (ICIS), legacy databases, and manual reporting. Data source for previous fiscal years: ICIS, legacy databases, and manual reporting.
0
5000
10000
15000
20000
25000
FY 08 FY 09 FY10 FY11 FY12
Insp
ectio
ns/E
valu
atio
ns
Fiscal Year
FY2008 - FY2012 Federal Inspections/Evaluations (by Statute)
CAA
CWA
EPCRA
FIFRA
MPRSA
RCRA
SWDA
TSCA
•EPA conducted approximately 20,000 inspections/evaluations in FY 2012. EPA inspections fluctuate somewhat from year to year, but have generally been in the 20,000 range over the past five years.

U.S. Environmental Protection Agency 1
FY2012 Enforcement & Compliance Annual Results Superfund Results
(Inflation/Deflation Adjusted to FY 12 Dollars)
$1,638
$2,082
$1,448
$3,000
$657
$79
$82
$84
$74
$67
$241
$387
$158
$300
$172
($100)
$400
$900
$1,400
$1,900
$2,400
$2,900
$3,400
FY08 FY09 FY10 FY11 FY12
Tota
l Val
ue ($
in m
illio
n)
Cost Recovery
Oversight
Site Study & Cleanup
Note: All prior FY dollar figures in this report are adjusted to reflect the current value in FY 2012 dollars based on the monthly rate of inflation/deflation as determined by the U.S. Department of Labor Consumer Price Index for All Urban Consumers.
FY2012 Data Source for Clean up and Cost Recovery: Comprehensive Environmental Response, Compensation & Liability Information System (CERCLIS), FY2012 Data Source for Oversight: Integrated Financial Management System (IFMS); Data source for previous fiscal years: CERCLIS and IFMS.
Private party cleanup commitments achieved between Fiscal Years 2008-2011 were unusually high and record breaking. However, private party cleanup commitments were lower in FY 2012. Superfund Enforcement results generally vary from year to year due to the size and number of cases in the case pipeline, and a few large settlements each year.
Unlike FY 2011 when the Hudson River cleanup settlement, valued at $2.1 billion, accounted for 70% of the total cleanup commitment, there were no similar, large dollar cases in FY 2012.
Cleanup negotiations completed with private parties in FY 2012, however, will result in increased cleanup commitments in FY 2013. For example the AVX consent decree, valued at $366.3 million , for the cleanup of the New Bedford Harbor site was lodged in October 2012 and should be entered in FY 2013.

U.S. Environmental Protection Agency 13
FY2012 Enforcement & Compliance Annual Results Criminal Enforcement
319 387
346
371
320
176 200
289 250
231
57 76 72
89.5 79.0
0
100
200
300
400
500
08 09 10 11 12
Tota
l Cou
nt
Fiscal Year
Criminal Enforcement Program Major Activities
# of Investigations Opened # of Defendants Charged Sentences (Years)
70% of the criminal cases charged in FY 2012 had at least one individual defendant. FY2012 Data Source: Criminal Case Reporting System; Source for previous years: annual Criminal Case Reporting System data.
In FY 2012,OCEFT had fewer case carrying agents than in FY 2011, which played a role in the decrease in new cases opened and (to a lesser degree) the number of defendants charged. The increased focus on tier 1 and tier 2 cases, which are generally more complex and more resource intensive, could also have contributed to fewer - but more significant - cases.

$66
$100
$42 $35
$44
$13 $10 $18
$2
$14
$0
$50
$100
$150
FY08 FY09 FY10 FY11 FY12
Tota
l Val
ues
($ in
Mill
ions
)
Value of Fines and Restitution
Value of Court Ordered Environmental Projects
U.S. Environmental Protection Agency 14
FY2012 Enforcement & Compliance Annual Results Criminal Enforcement
Value of Fines & Restitution and Court Ordered Environmental Projects (Inflation/Deflation Adjusted to FY 12 Dollars)
Note: All prior FY dollar figures in this report are adjusted to reflect the current value in FY 2012 dollars based on the monthly rate of inflation/deflation as determined by the U.S. Department of Labor Consumer Price Index for All Urban Consumers. FY2012 Data Source: Criminal Case Reporting System; Source for previous years: Annual Criminal Case Reporting System data.
Criminal fines and restitution punish misconduct, deter other violators and help to remedy the harm caused by the criminal conduct.

U.S. Environmental Protection Agency 15
FY2012 Enforcement & Compliance Annual Results
Acronyms – Statute and Abbreviations/Section Description
CAA Clean Air Act
CERCLA Comprehensive Environmental Response, Compensation and Liability Act (“Superfund”)
CWA Clean Water Act
EPCRA Emergency Planning & Community Right-to-Know Act
FIFRA Federal Insecticide, Fungicide and Rodenticide Act
MPRSA Marine Protection, Research, and Sanctuaries Act
RCRA Resource Conservation & Recovery Act
SDWA Safe Drinking Water Act
TSCA Toxic Substances Control Act
Title 18 U.S. Criminal Code - Crimes and Criminal Procedure