Embed Size (px)
Citation preview

Report on the
2010-11 ICT Benchmarking Survey

Report on the 2010-11 ICT Benchmarking Survey i
Table of Contents
Executive Summary 1
High Level Findings 1
Overview 2
About the Survey 2
Next Steps 3
Survey Findings 4
Total ICT Expenditure 4
ICT Capital Investment 5
ICT Investment Model 6
Applications Expenditure 7
ICT Personnel 9
ICT Management Personnel 10

Report on the 2010-11 ICT Benchmarking Survey 1
Executive Summary
The 2010-11 ICT Benchmarking Survey is the third round of data collection in relation
to NSW Government information and communications technology (ICT) expenditure.
The Benchmarking Survey is a comprehensive survey of ICT expenditure data that
facilitates comparison internally between different agencies and clusters or against
external benchmarks.
The Benchmarking Survey has been peer reviewed, but not audited.
High Level Findings
Total ICT expenditure
In 2010-11 NSW Government total ICT expenditure was approximately $2 billion. This
represents 3.1% of total agency expenditure of $65 billion.
ICT capital investment
In 2010-11 ICT capital expenditure was $596 million, representing 30% of total ICT
expenditure across government. The industry benchmark proportion of
capital/operational expenditure is 21% and 79% respectively. It is noted that there may
be a short term increase in capital expenditure during the transition to more ‘as a
service’ arrangements, including the consolidation of NSW Government data centres.
Applications expenditure
In 2010-11 applications expenditure accounted for 42% of the total ICT expenditure at
$831 million. Applications expenditure comprised 34% of the total ICT operating
expenditure and 60% of total ICT capital expenditure.
ICT management
In 2010-11 expenditure on ICT management personnel accounted for 6.6% of total ICT
expenditure. This proportion is below the local / state government benchmark of 8%,
and the external benchmark of 11%.

Report on the 2010-11 ICT Benchmarking Survey 2
Overview
The 2010-11 ICT Benchmarking Survey is the third round of data collection in relation
to NSW Government ICT expenditure. The Benchmarking Survey is a comprehensive
survey of ICT expenditure data that facilitates comparison internally between different
agencies and clusters or against external benchmarks. It will inform ICT governance
decisions and assist in identifying whole of government or inter-agency opportunities.
Cluster and agency level CIOs are using the survey data as a management tool to
compare performance and to target inefficiencies.
The ICT benchmarking program is designed to:
• Provide a baseline for improving performance and monitoring changes over time.
• Identify areas of best practice and opportunities for improvement, including through comparison between agencies, with other governments, and with industry benchmarks.
• Enable agencies to evaluate their performance through transparent, comparable expenditure reporting.
• Provide data to support informed investment decisions.
In April 2012, the NSW Government adopted the NSW ICT Strategy 2012. This
Benchmarking survey will be a key contribution to ongoing monitoring of its
implementation. The scope of this survey is limited to benchmarking expenditure. It
does not assess the quality or effectiveness of the delivery of services.
About the Survey
• The current survey covers the period 1 July 2010 to 30 June 2011. This report is based on the results of this survey and the previous two financial years’ data being 2008-09 and 2009-10.
• The benchmarking report shows NSW Government ICT expenditure, including both operational and capital expenditure, at a whole of government and cluster level.
• The survey covers 67 agencies across the nine principal departments. This equates to 95% of total agency expenditure (smaller agencies were exempted from the survey).
• All ICT expenditure is included - front office, back office and operational.
• The survey excludes embedded technology such as radiology scanners or CAT machines.
• Data is provided by agencies, validated internally and approved by the agency CIO.
Report on the 2010-11 ICT Benchmarking Survey 3
Survey Findings
Total ICT Expenditure
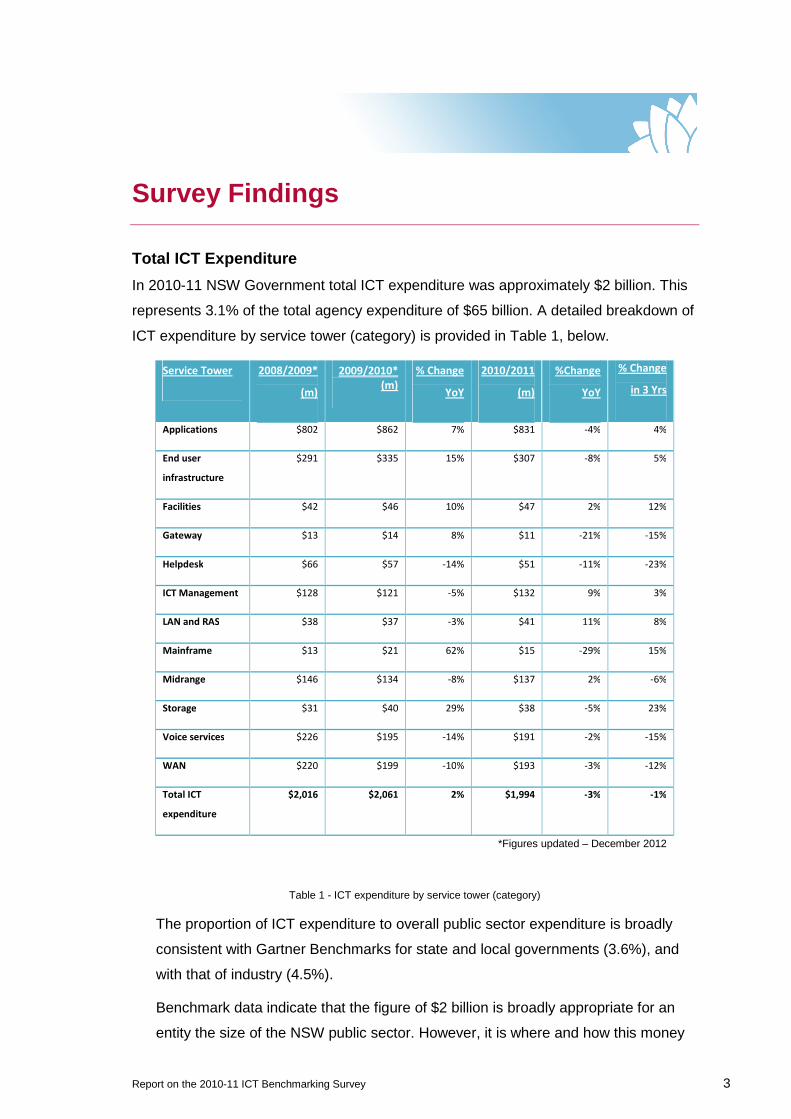
In 2010-11 NSW Government total ICT expenditure was approximately $2 billion. This
represents 3.1% of the total agency expenditure of $65 billion. A detailed breakdown of
ICT expenditure by service tower (category) is provided in Table 1, below.
Service Tower 2008/2009*
(m)
2009/2010*
(m)
% Change
YoY
2010/2011
(m)
%Change
YoY
% Change
in 3 Yrs
Applications $802 $862 7% $831 -4% 4%
End user
infrastructure
$291 $335 15% $307 -8% 5%
Facilities $42 $46 10% $47 2% 12%
Gateway $13 $14 8% $11 -21% -15%
Helpdesk $66 $57 -14% $51 -11% -23%
ICT Management $128 $121 -5% $132 9% 3%
LAN and RAS $38 $37 -3% $41 11% 8%
Mainframe $13 $21 62% $15 -29% 15%
Midrange $146 $134 -8% $137 2% -6%
Storage $31 $40 29% $38 -5% 23%
Voice services $226 $195 -14% $191 -2% -15%
WAN $220 $199 -10% $193 -3% -12%
Total ICT
expenditure
$2,016 $2,061 2% $1,994 -3% -1%
*Figures updated – December 2012
Table 1 - ICT expenditure by service tower (category)
The proportion of ICT expenditure to overall public sector expenditure is broadly
consistent with Gartner Benchmarks for state and local governments (3.6%), and
with that of industry (4.5%).
Benchmark data indicate that the figure of $2 billion is broadly appropriate for an
entity the size of the NSW public sector. However, it is where and how this money

Report on the 2010-11 ICT Benchmarking Survey 4
is spent that will provide government with opportunities for savings, efficiencies and
improvements to internal and external service delivery. The Commission of Audit
Report identifies that,
“The spend on projects and services is not as focussed on service
delivery as better practice would dictate. This is evident through a
low ratio of spend on front line service delivery as compared to back
office functions. The aim is usually to spend about 40% on back
office and 60% on frontline services or businesses. In the
government at present the spend ratio is 55% back office and only
45% frontline.”
ICT Capital Investment
The NSW Government ICT Strategy 2012 (ICT Strategy) positions government to take
advantage of two major industry trends that are driven by technology commodification
and the adoption of web services:
• a move to a service orientation by both vendors and buyers, and
• the deployment of cloud technologies into mainstream business operations.
The ICT Strategy details the benefits of moving to a service orientation, consolidating
infrastructure and using cloud based services – all areas in which government can
make significant capital savings, and increase efficiency and flexibility. The ICT
Strategy positions government to move to a model where it leverages third party
infrastructure and acquires software and other services on an agile, as needed, basis.
This will provide government with flexibility to address changing internal requirements
and align government services with customer needs and expectations, particularly in
relation to mobile and online service provision (anytime, anywhere).
The Commission of Audit Report notes that buying, owning and managing ICT in-
house is an outdated approach to ICT procurement, and is both inefficient and
inconsistent with new developments in service offerings.
In 2010-11, ICT capital expenditure was $596 million. This represents 30% of the total
ICT expenditure across government (see Figure 1, below).

Report on the 2010-11 ICT Benchmarking Survey 5
Figure 1 - NSW Government ICT expenditure - capital (capex) and operating (opex).
Note: FACS includes Businesslink and DFS includes ServiceFirst.
The industry benchmark proportion of capital and operating expenditure is 21% and
79% respectively. As identified in the ICT Strategy, and emphasised in the Commission
of Audit Report, there are opportunities to use as-a-service models to reduce capital
expenditure and increase efficiency and flexibility in internal and external service
delivery.
Across government, capital expenditure fell by 10% in the 2010-11 observed year. It is
noted that this fall pre-dates the adoption by government of the ICT Strategy. The
decrease could reflect deferred investment in advance of data centre reform, or to
support agency delivery of savings targets. However, in comparison to the industry
benchmark, this still represents a relatively heavy weighting to capital ICT investment.
Analysis of the data suggests that there is scope for the NSW public sector to further
lower its ICT capital expenditure as it moves from owning and operating hardware and
software, to the service model environment outlined above.
ICT Investment Model
The move from a reliance on government owned and operated infrastructure and
hardware to outsourced or as-a-service models is not well supported by traditional
approaches to investment, which are geared around capital funding.

Report on the 2010-11 ICT Benchmarking Survey 6
The full benefits of an as-a-service solution should be taken into account in the
assessment of an ICT project. These may include the flexibility to:
• move resources quickly and easily to take advantage of new technologies or
service offerings,
• redirect resources to where they are needed most – either within/across
agencies, or to address urgent or emerging service delivery priorities,
• avoid technology ‘lock in’ where costly and long term arrangements are not
delivering the right solutions, and
• allocate back office savings to front line service delivery.
The ICT Strategy provides for a whole of government approach to maximising
opportunities for collaboration and standardisation. This should also shift the balance
from capital to operating expenditure, thereby allowing for more flexibility in meeting
demand and achieving both internal and external service delivery priorities.
However, an effective mechanism for moving from capital to recurrent funding, in line
with modern ICT investment, will have to be developed to support government to be
able to take full advantage of cloud and managed services.
Applications expenditure
In 2010-11 Applications expenditure accounted for 42% of the total ICT expenditure at
$831m. Applications expenditure comprised 34% of the total ICT operating expenditure
and 60% of the total ICT capital expenditure. This is the most significant of all
categories of public sector ICT expenditure and represents a potential opportunity for
long term and sustainable efficiencies and cost reduction.
Figure 2 - NSW Government total ICT spend per service tower (combined capital and operating expenditure).

Report on the 2010-11 ICT Benchmarking Survey 7
The NSW ICT Strategy 2012 outlines a shift across the government to common
approaches, common standards and leveraging investment opportunities, including for
as-a-service solutions. At this time, it is unclear from the data what proportion of the
$831m spend on applications presents an opportunity for consolidation, sharing and
standardisation. That expenditure covers back-office applications (such as ERP and
Reporting) and common applications (such as email and office applications), as well as
unique, bespoke, dedicated line of business applications (such as Computer Aided
Dispatch (CAD) within AGJ, or Picture Archiving and Communication System (PACS)
within Health). Before developing an approach to improving the efficiency of the
applications spend, it is necessary to better understand the nature of the applications
themselves.
Figure 3 - Proportion of total ICT expenditure on applications by cost element (opex and capex).
The breakdown in Figure 3, above, shows the cost elements that comprise the current
spend on applications.

Report on the 2010-11 ICT Benchmarking Survey 8
ICT Personnel
In 2010-11, NSW Government expenditure on ICT personnel was $736 million ($571
million in operational and $165 million in capital expenditure). This accounts for more
than one third of total government ICT expenditure.
Figure 4 - ICT full-time equivalent (FTE) employees by service tower.
The average annualised cost per full-time equivalent (FTE) employee for internal
personnel across all service towers is $110,000, while the average annualised cost per
FTE for external personnel is $192,000.
The NSW public sector ICT workforce will need to adapt to ensure that Government
has the right mix of skills to deliver its strategic agenda. The development of ICT skills
and capabilities across the sector is a key strategic initiative under the ICT Strategy.
The Strategy identifies people as a key enabler of improved service delivery and better
value ICT investment. It forecasts an increasing demand across the public sector for
contract and vendor management capability as the Government transitions, where
appropriate, to as-a-service sourcing models.
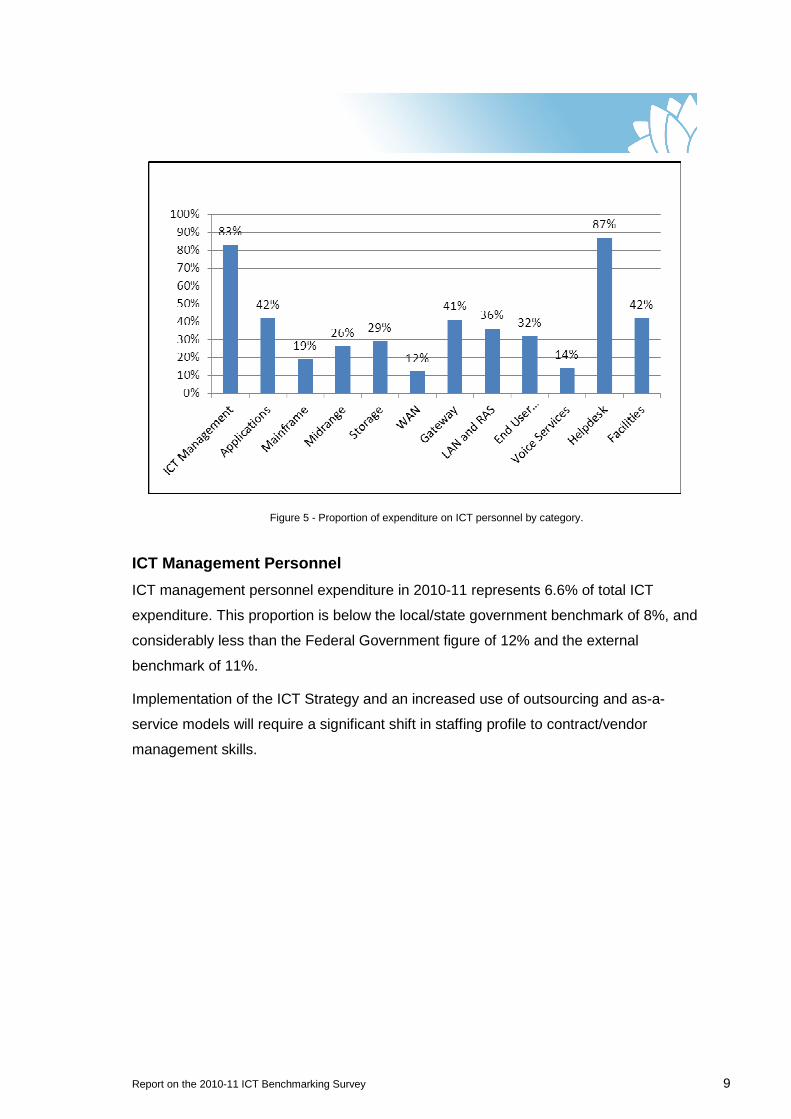
As shown in Figure 5, below, personnel are a significant cost element in each service
tower (component) of ICT expenditure.
Report on the 2010-11 ICT Benchmarking Survey 9
Figure 5 - Proportion of expenditure on ICT personnel by category.
ICT Management Personnel
ICT management personnel expenditure in 2010-11 represents 6.6% of total ICT
expenditure. This proportion is below the local/state government benchmark of 8%, and
considerably less than the Federal Government figure of 12% and the external
benchmark of 11%.
Implementation of the ICT Strategy and an increased use of outsourcing and as-a-
service models will require a significant shift in staffing profile to contract/vendor
management skills.

Department of Finance & Services
Policy and Executive Services 2 - 24 Rawson Place Sydney NSW 2000 www.services.nsw.gov.au