Embed Size (px)
Citation preview
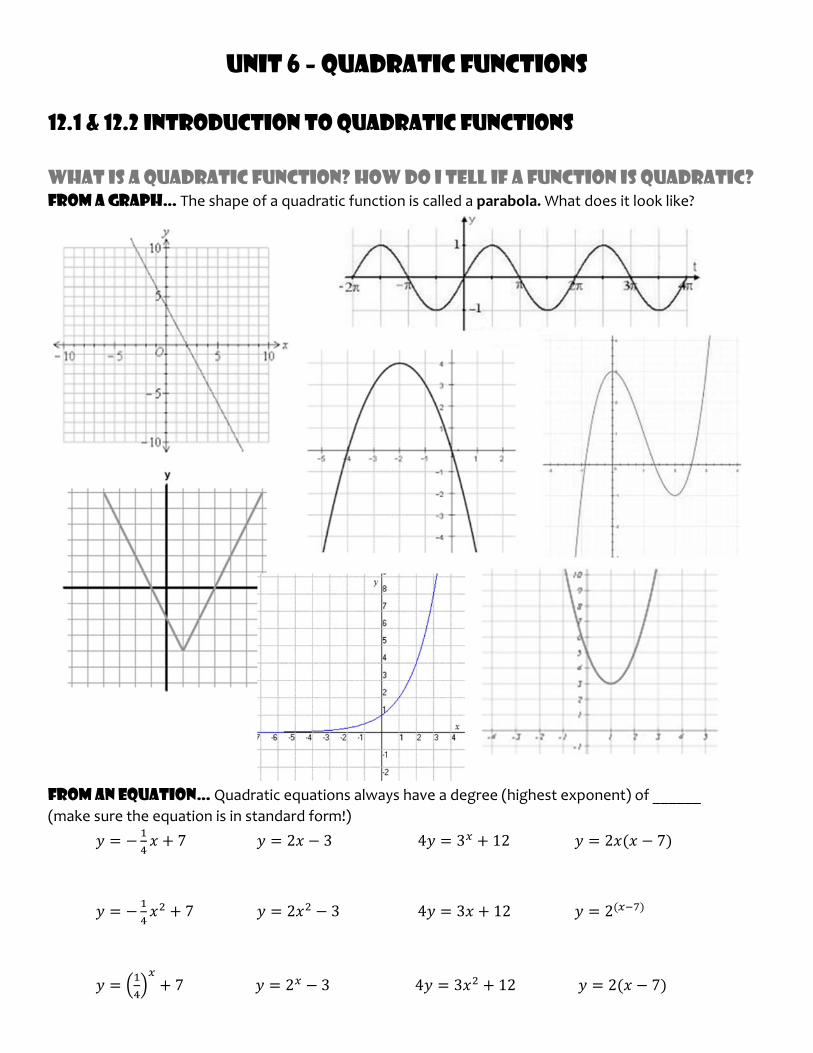
Unit 6 – Quadratic Functions
12.1 & 12.2 Introduction to Quadratic Functions
What is A Quadratic Function? How do I tell if a Function is Quadratic? From a Graph… The shape of a quadratic function is called a parabola. What does it look like?
From An Equation… Quadratic equations always have a degree (highest exponent) of ______
(make sure the equation is in standard form!)
7 2 3 4 3 12 2 7
7 2 3 4 3 12 2
7 2 3 4 3 12 2 7
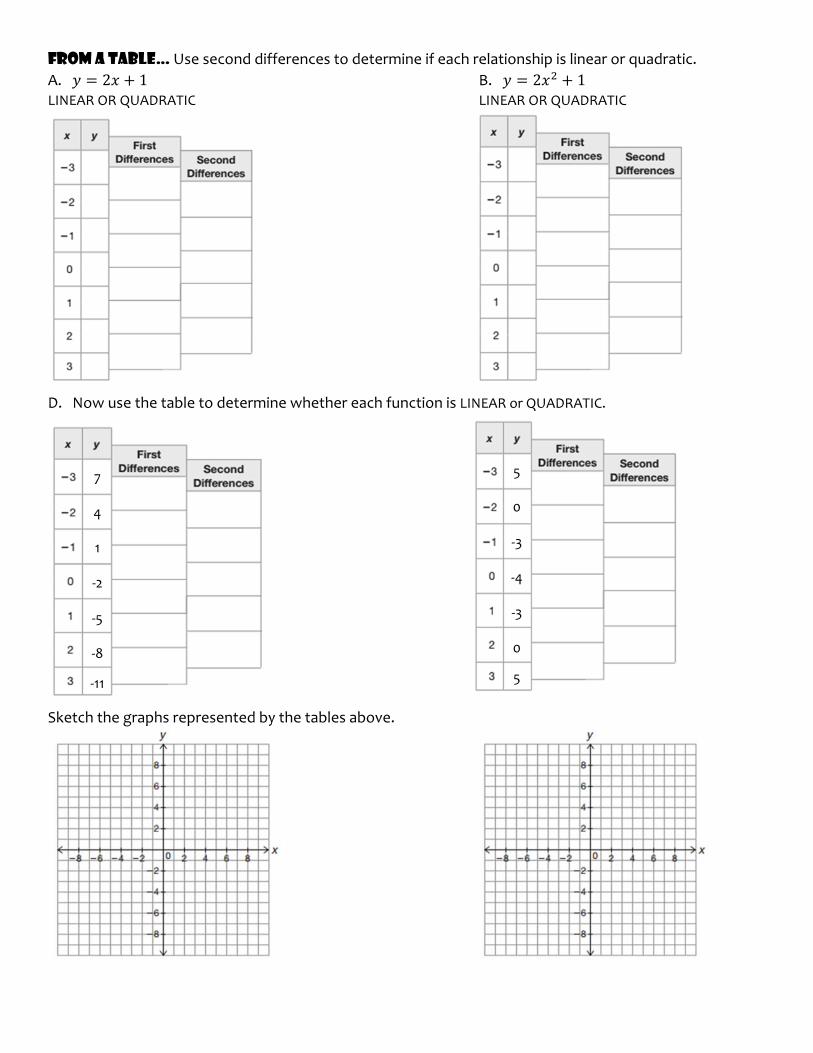
From A Table… Use second differences to determine if each relationship is linear or quadratic.
A. 2 1 B. 2 1 LINEAR OR QUADRATIC LINEAR OR QUADRATIC
D. Now use the table to determine whether each function is LINEAR or QUADRATIC.
Sketch the graphs represented by the tables above.
5
0
‐3
‐4
‐3
0
5
7
4
1
‐2
‐5
‐8
‐11
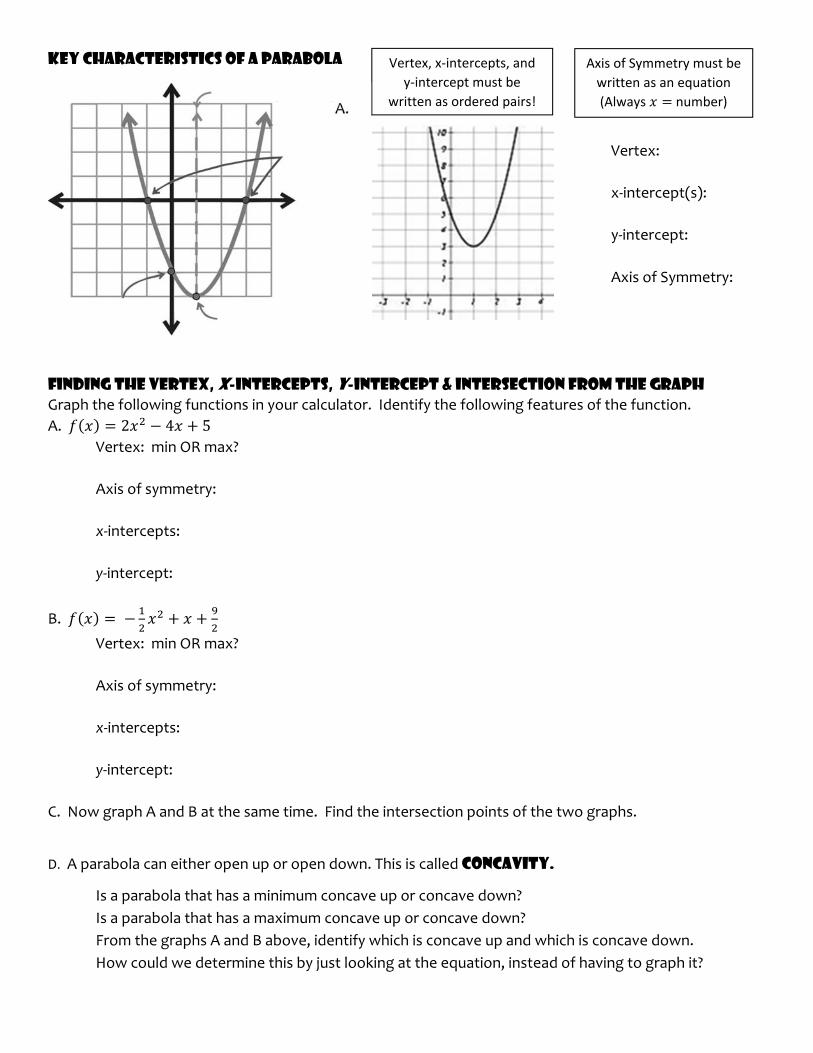
Key Characteristics of a Parabola
A.
Vertex:
x‐intercept(s):
y‐intercept:
Axis of Symmetry:
Finding the vertex, x-intercepts, y-intercept & Intersection from the Graph
Graph the following functions in your calculator. Identify the following features of the function.
A. 2 4 5 Vertex: min OR max?
Axis of symmetry:
x‐intercepts:
y‐intercept:
B.
Vertex: min OR max?
Axis of symmetry:
x‐intercepts:
y‐intercept:
C. Now graph A and B at the same time. Find the intersection points of the two graphs.
D. A parabola can either open up or open down. This is called Concavity.
Is a parabola that has a minimum concave up or concave down?
Is a parabola that has a maximum concave up or concave down?
From the graphs A and B above, identify which is concave up and which is concave down.
How could we determine this by just looking at the equation, instead of having to graph it?
Vertex, x‐intercepts, and
y‐intercept must be
written as ordered pairs!
Axis of Symmetry must be
written as an equation
(Always number)
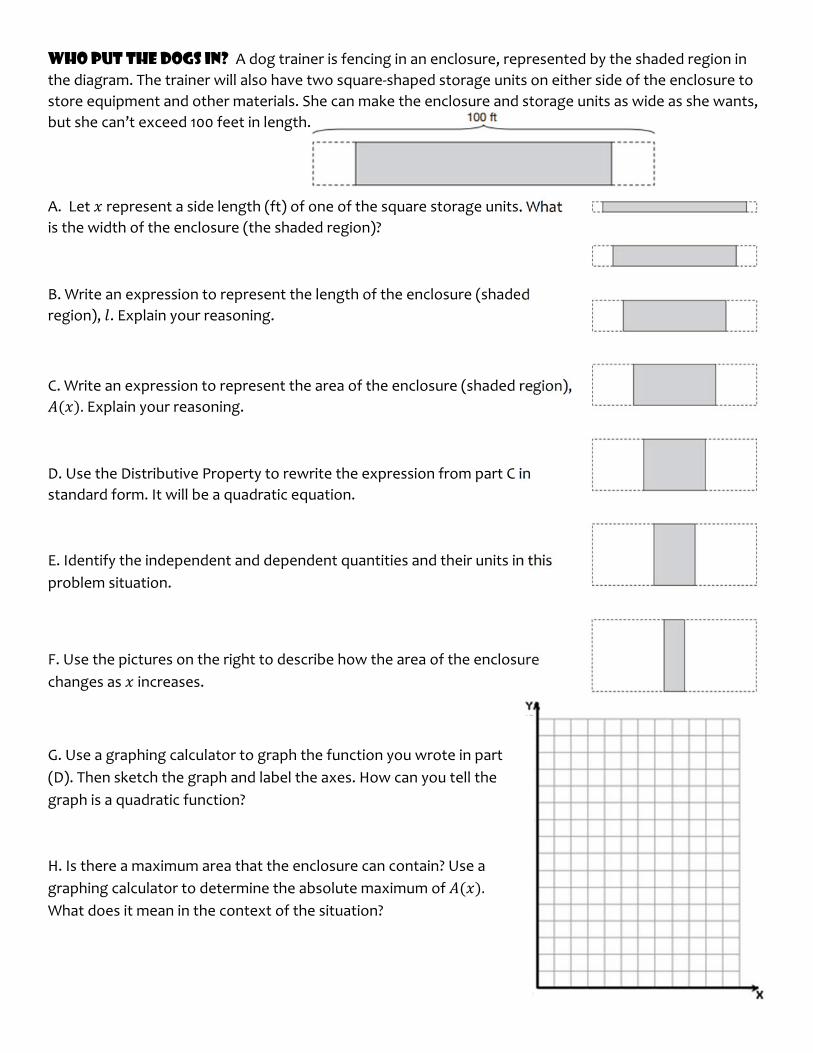
Who Put the Dogs In? A dog trainer is fencing in an enclosure, represented by the shaded region in
the diagram. The trainer will also have two square‐shaped storage units on either side of the enclosure to
store equipment and other materials. She can make the enclosure and storage units as wide as she wants,
but she can’t exceed 100 feet in length.
A. Let represent a side length (ft) of one of the square storage units. What
is the width of the enclosure (the shaded region)?
B. Write an expression to represent the length of the enclosure (shaded
region), . Explain your reasoning.
C. Write an expression to represent the area of the enclosure (shaded region),
. Explain your reasoning.
D. Use the Distributive Property to rewrite the expression from part C in
standard form. It will be a quadratic equation.
E. Identify the independent and dependent quantities and their units in this
problem situation.
F. Use the pictures on the right to describe how the area of the enclosure
changes as increases.
G. Use a graphing calculator to graph the function you wrote in part
(D). Then sketch the graph and label the axes. How can you tell the
graph is a quadratic function?
H. Is there a maximum area that the enclosure can contain? Use a
graphing calculator to determine the absolute maximum of . What does it mean in the context of the situation?
What to do with 2 dogs? Two dog owners want to build a dog run against the side of their house.
They want the run to be in the shape of a rectangle. They have 16 yards of fencing to build the dog run.
A. Draw a picture to model the situation.
B. Write an equation that describes the perimeter of the dog run.
C. Write the perimeter equation terms of w (Hint: Solve for l).
D. What is the equation you will use to find the area of the dog run?
E. Write the area equation of the dog run in terms of w.
F. Identify the independent and dependent quantities and their units in this problem situation.
G. Graph your equation from E in your calculator.
H. Window: , will represent , . Use the context to give reasonable values.
x‐min: x‐max:
y‐min: y‐max:
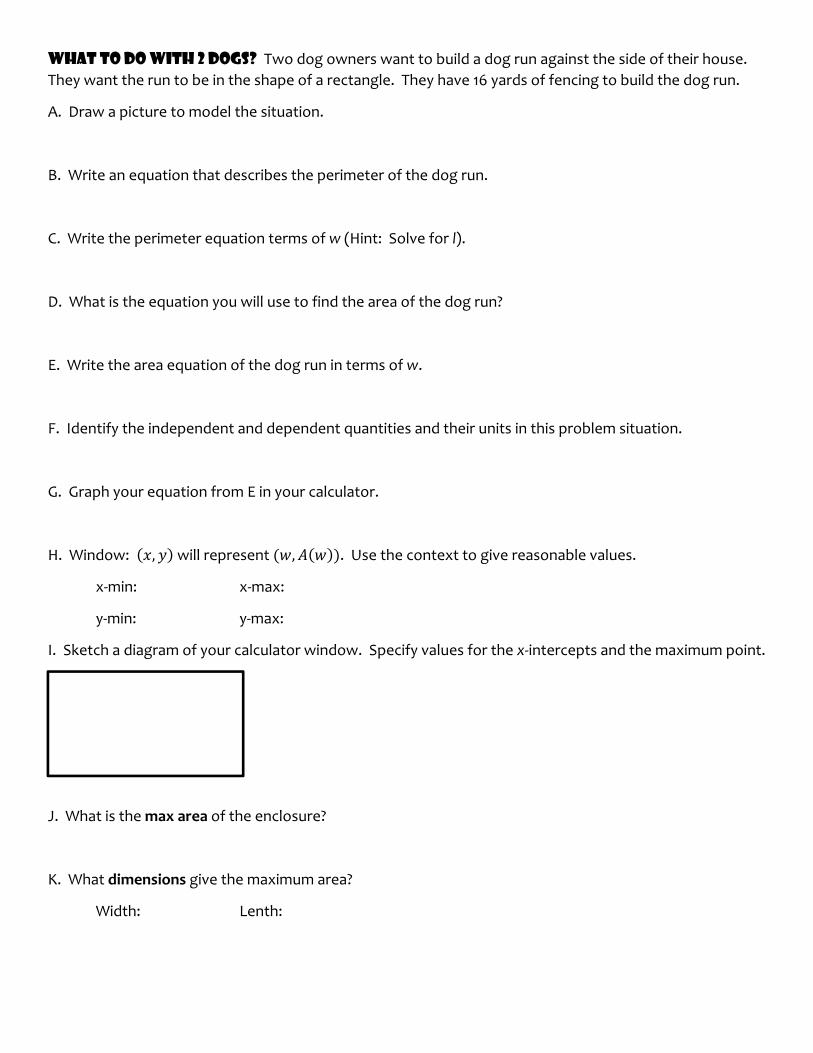
I. Sketch a diagram of your calculator window. Specify values for the x‐intercepts and the maximum point.
J.
J. What is the max area of the enclosure?
K. What dimensions give the maximum area?
Width: Lenth:
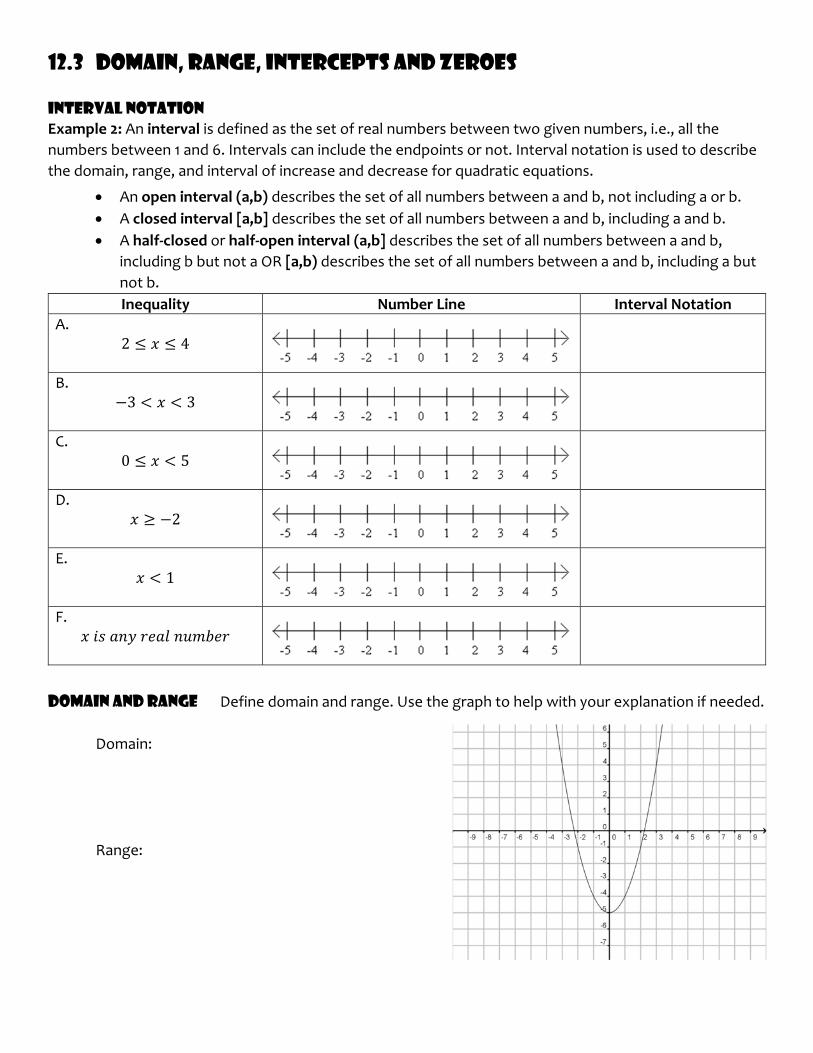
12.3 Domain, Range, Intercepts and Zeroes
Interval Notation
Example 2: An interval is defined as the set of real numbers between two given numbers, i.e., all the
numbers between 1 and 6. Intervals can include the endpoints or not. Interval notation is used to describe
the domain, range, and interval of increase and decrease for quadratic equations.
An open interval (a,b) describes the set of all numbers between a and b, not including a or b.
A closed interval [a,b] describes the set of all numbers between a and b, including a and b.
A half‐closed or half‐open interval (a,b] describes the set of all numbers between a and b,
including b but not a OR [a,b) describes the set of all numbers between a and b, including a but
not b.
Inequality Number Line Interval Notation
A. 2 4
B. 3 3
C. 0 5
D. 2
E. 1
F.
Domain and Range Define domain and range. Use the graph to help with your explanation if needed.
Domain:
Range:
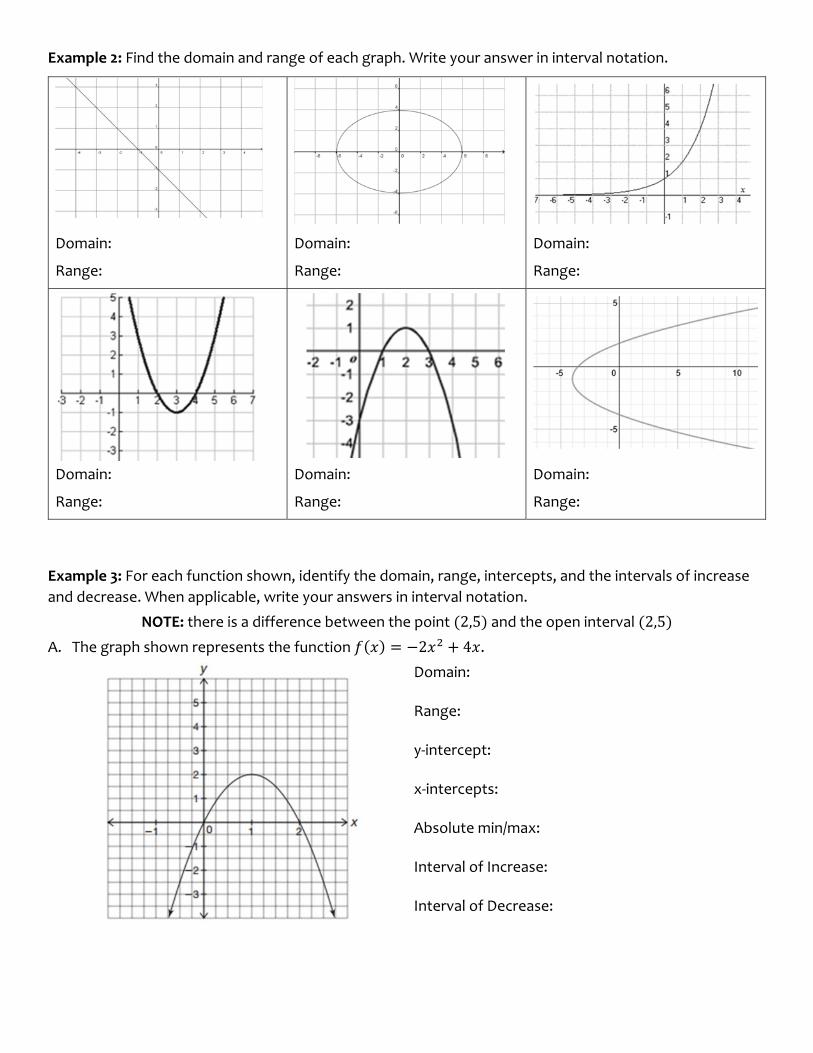
Example 2: Find the domain and range of each graph. Write your answer in interval notation.
Domain:
Range:
Domain:
Range:
Domain:
Range:
Domain:
Range:
Domain:
Range:
Domain:
Range:
Example 3: For each function shown, identify the domain, range, intercepts, and the intervals of increase
and decrease. When applicable, write your answers in interval notation.
NOTE: there is a difference between the point 2,5 and the open interval 2,5
A. The graph shown represents the function 2 4 .
Domain: Range: y‐intercept: x‐intercepts: Absolute min/max: Interval of Increase: Interval of Decrease:
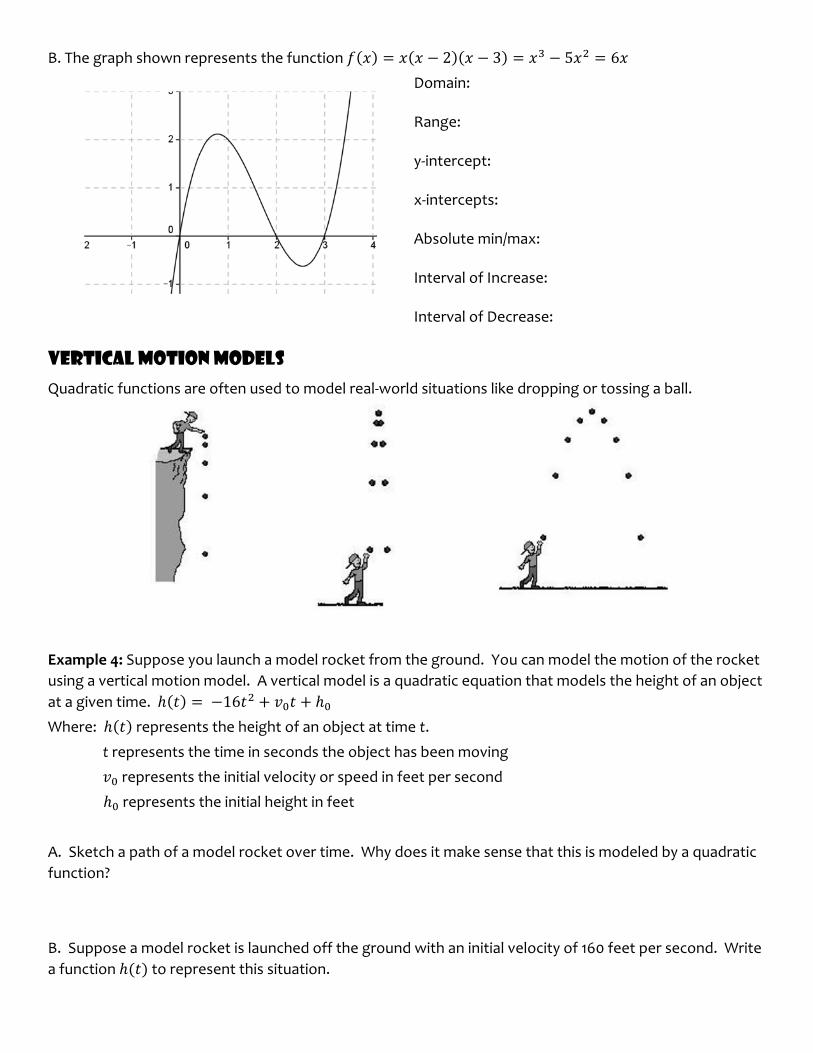
B. The graph shown represents the function 2 3 5 6
Domain: Range: y‐intercept: x‐intercepts: Absolute min/max: Interval of Increase: Interval of Decrease:
Vertical Motion Models
Quadratic functions are often used to model real‐world situations like dropping or tossing a ball.
Example 4: Suppose you launch a model rocket from the ground. You can model the motion of the rocket
using a vertical motion model. A vertical model is a quadratic equation that models the height of an object
at a given time. 16
Where: represents the height of an object at time t.
t represents the time in seconds the object has been moving
represents the initial velocity or speed in feet per second
represents the initial height in feet
A. Sketch a path of a model rocket over time. Why does it make sense that this is modeled by a quadratic
function?
B. Suppose a model rocket is launched off the ground with an initial velocity of 160 feet per second. Write
a function to represent this situation.
C. What variable is the independent variable? What variable is the dependent variable?
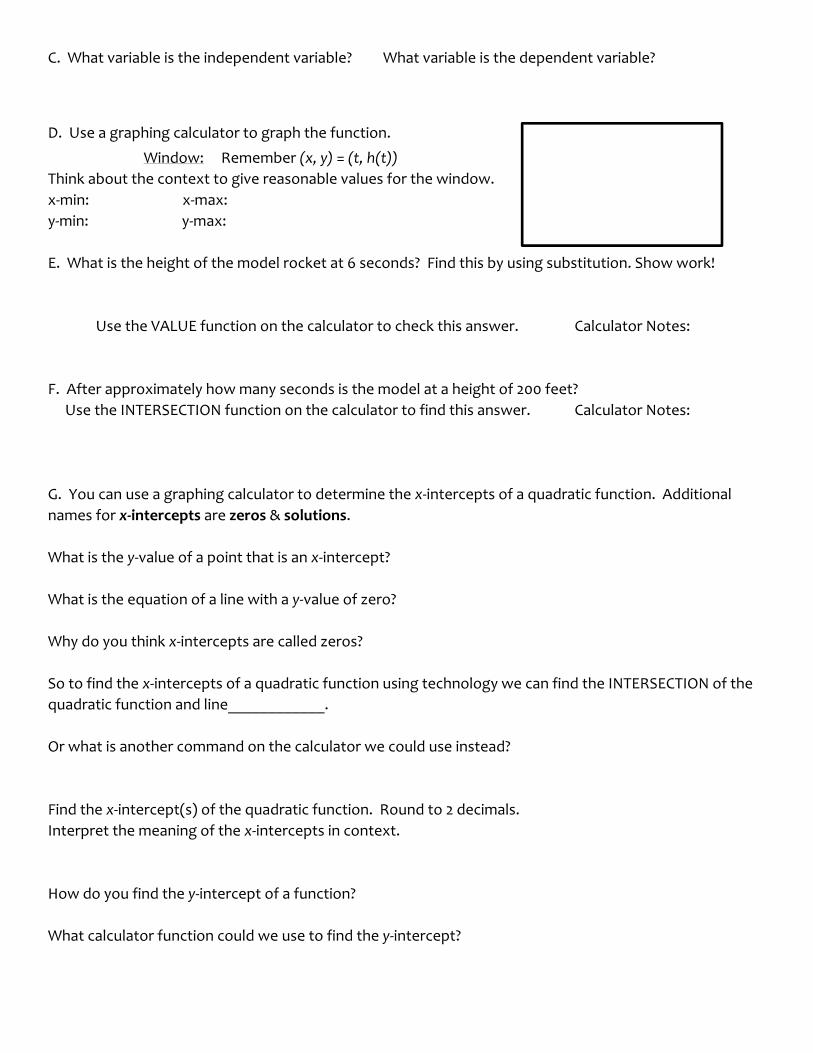
D. Use a graphing calculator to graph the function.
Window: Remember (x, y) = (t, h(t))
Think about the context to give reasonable values for the window.
x‐min: x‐max:
y‐min: y‐max:
E. What is the height of the model rocket at 6 seconds? Find this by using substitution. Show work!
Use the VALUE function on the calculator to check this answer. Calculator Notes:
F. After approximately how many seconds is the model at a height of 200 feet?
Use the INTERSECTION function on the calculator to find this answer. Calculator Notes:
G. You can use a graphing calculator to determine the x‐intercepts of a quadratic function. Additional
names for x‐intercepts are zeros & solutions.
What is the y‐value of a point that is an x‐intercept?
What is the equation of a line with a y‐value of zero?
Why do you think x‐intercepts are called zeros?
So to find the x‐intercepts of a quadratic function using technology we can find the INTERSECTION of the
quadratic function and line____________.
Or what is another command on the calculator we could use instead?
Find the x‐intercept(s) of the quadratic function. Round to 2 decimals.
Interpret the meaning of the x‐intercepts in context.
How do you find the y‐intercept of a function?
What calculator function could we use to find the y‐intercept?
Instructions to create your own vertical motion model Toss the ball underhand straight up into the air. Measure the initial height of the ball (not the height of the
person throwing the ball) Using a cell phone stopwatch, time how long it takes the ball to hit the ground.
Record the information below.
Initial Height ( : __________ Time before landing : __________
Plug this information into the vertical motion model equation below, including 0. Solve for (the initial velocity). This represents the speed of the ball when it left your
hand.
16
Write the equation of your parabola, . Leave as the only variable.
Use your equation to answer the following questions.
1. Use your graphing calculator to graph your quadratic equation. Window: [ , ] x [ , ]
2. Use your calculator to find the maximum height your ball reached. (Hint: Use MAXIMUM function on
calculator)
3. After how many seconds was the maximum reached? (What is the x‐coordinate of the vertex?)
4. Use your calculator to find the y‐intercept (remember to write it as an ordered pair). Interpret its
meaning in terms of the problem situation.
y‐intercept:
interpretation:
5. Use your calculator to find the x‐intercepts of your function (remember to write them as ordered
pairs). Explain what each one means in terms of the problem situation.
x‐intercepts:
interpretation:
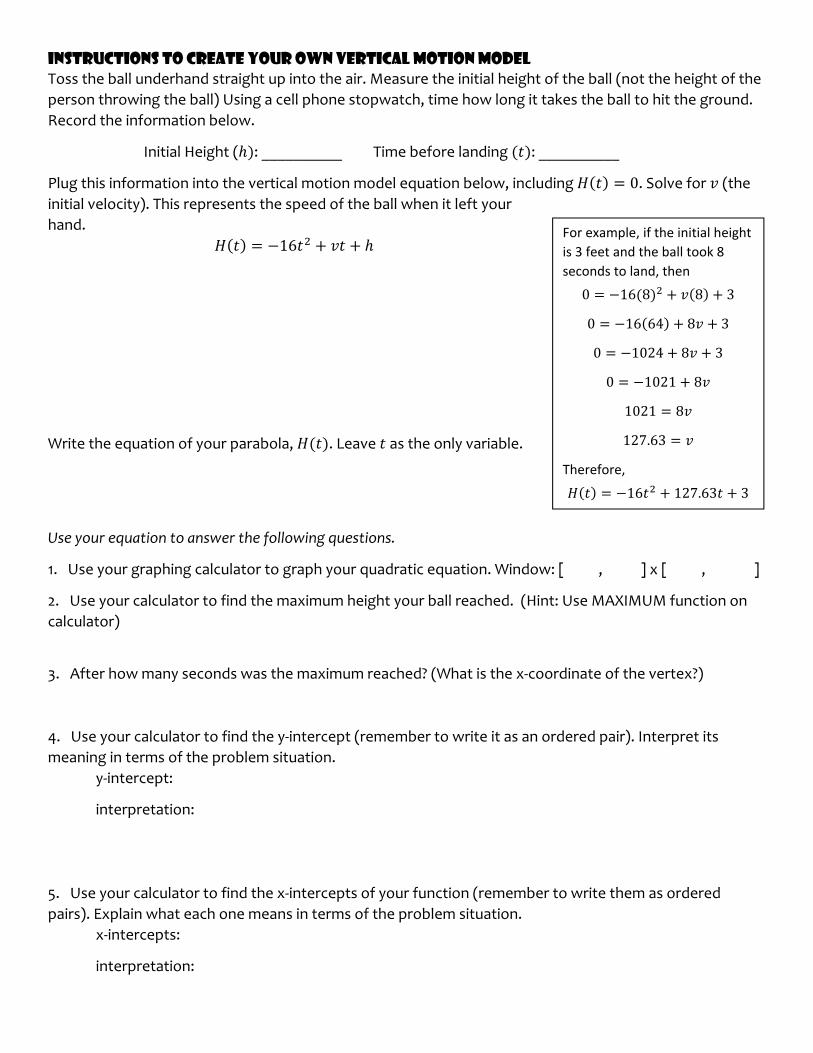
For example, if the initial height
is 3 feet and the ball took 8
seconds to land, then
0 16 8 8 3
0 16 64 8 3
0 1024 8 3
0 1021 8
1021 8
127.63
Therefore,
16 127.63 3
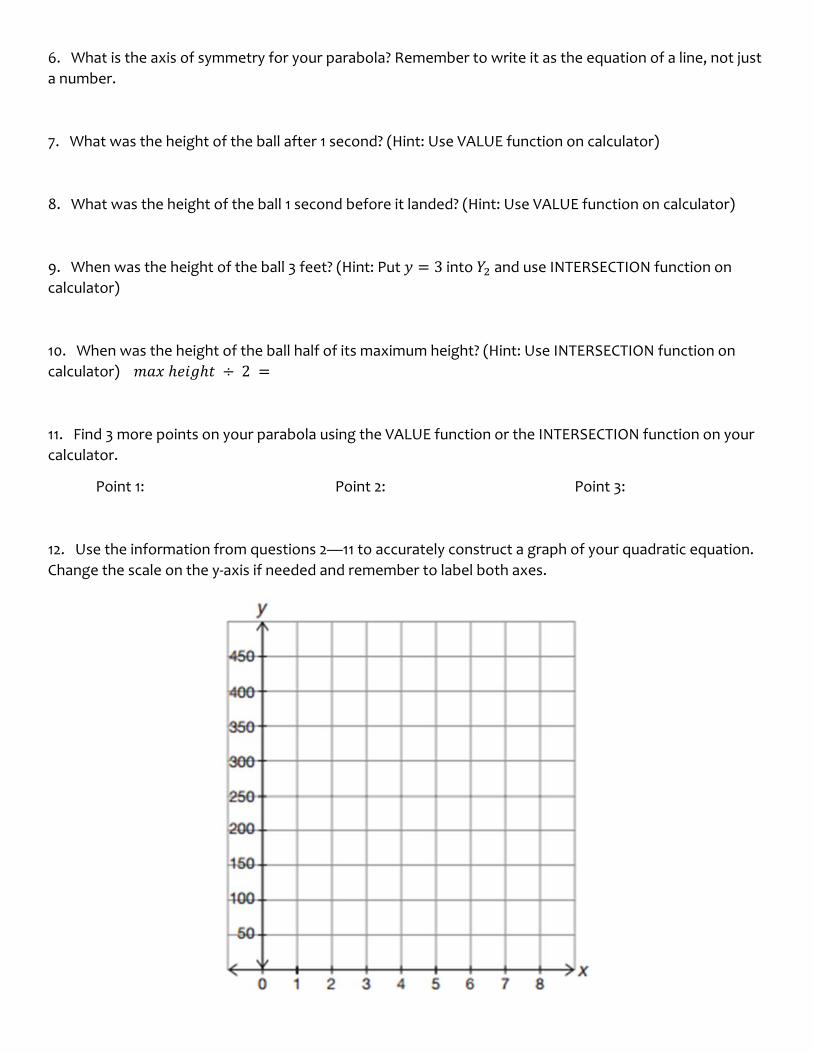
6. What is the axis of symmetry for your parabola? Remember to write it as the equation of a line, not just
a number.
7. What was the height of the ball after 1 second? (Hint: Use VALUE function on calculator)
8. What was the height of the ball 1 second before it landed? (Hint: Use VALUE function on calculator)
9. When was the height of the ball 3 feet? (Hint: Put 3 into and use INTERSECTION function on
calculator)
10. When was the height of the ball half of its maximum height? (Hint: Use INTERSECTION function on
calculator) 2
11. Find 3 more points on your parabola using the VALUE function or the INTERSECTION function on your
calculator.
Point 1: Point 2: Point 3:
12. Use the information from questions 2—11 to accurately construct a graph of your quadratic equation.
Change the scale on the y‐axis if needed and remember to label both axes.
12.4 Factored Form of Quadratic Functions
Review: If possible, simplify each expression.
A. 2 ∙ 3 B. 2 3 C. ∙ D. E. 2 3
Greatest Common Factor
Example 1: Find the greatest common factor of each set of monomials.
A. 12 and 15 B. 10 and 15 C. 14 and 70
Factoring the opposite of distributing
Example 2: Comparing distributing and factoring
A. Distribute: 2 3 8 B. Factor: 6 16
Example 3: Factor each expression
A. 14 70 B. 8 10 C. 9 15 30
Factored Form
: the gcf from standard form
, : the x‐intercepts of the graph
Example 4: Two students were asked to write a quadratic function in factored form to represent a
parabola that opens downward and has zeros at (4, 0) and (‐1, 0).
Maureen’s answer: 4 1 Michael’s answer: 4 1
Use your calculator to graph each student’s function. Which student has a correct function?
Explain why the other function is not correct.
Example 5: Use the given information to write a quadratic function in factored form.
a. The parabola opens upward and the zeros are (2, 0) and (4, 0).
b. The parabola opens downward and the zeros are (‐1/2, 0) and (5/2, 0).
Simplify the factors to integer form.
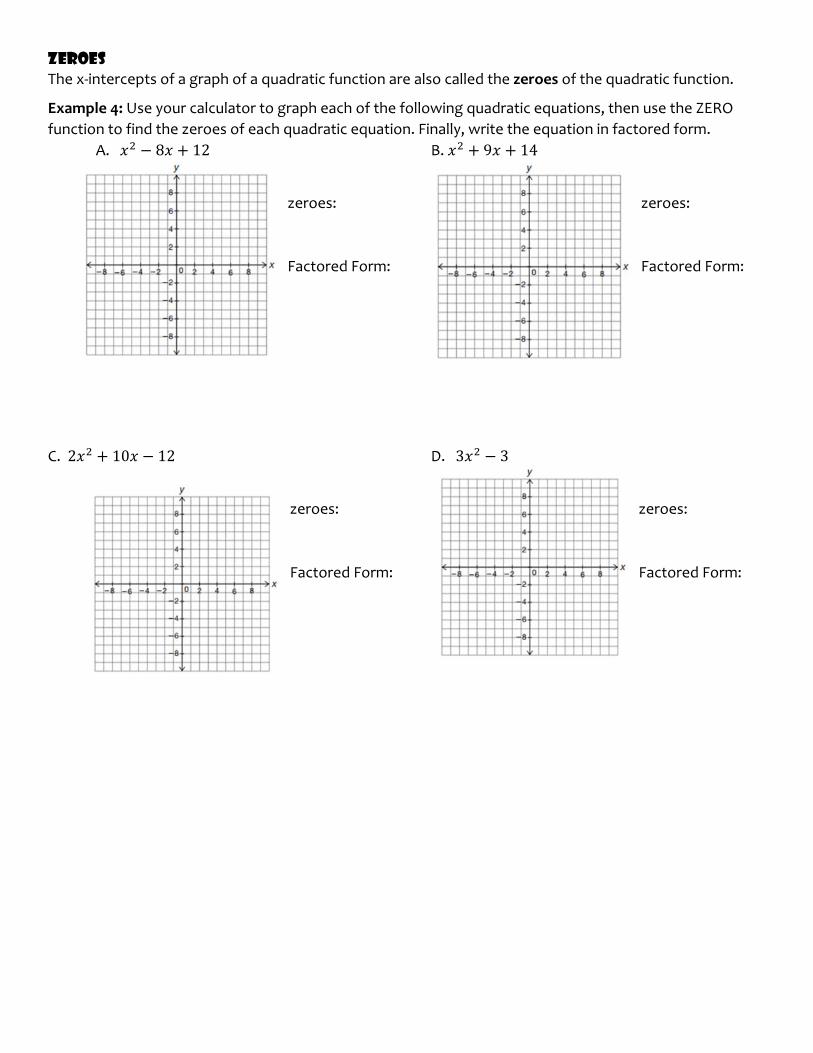
Zeroes
The x‐intercepts of a graph of a quadratic function are also called the zeroes of the quadratic function.
Example 4: Use your calculator to graph each of the following quadratic equations, then use the ZERO
function to find the zeroes of each quadratic equation. Finally, write the equation in factored form.
A. 8 12 B. 9 14
zeroes: zeroes:
Factored Form: Factored Form:
C. 2 10 12 D. 3 3
zeroes: zeroes:
Factored Form: Factored Form:
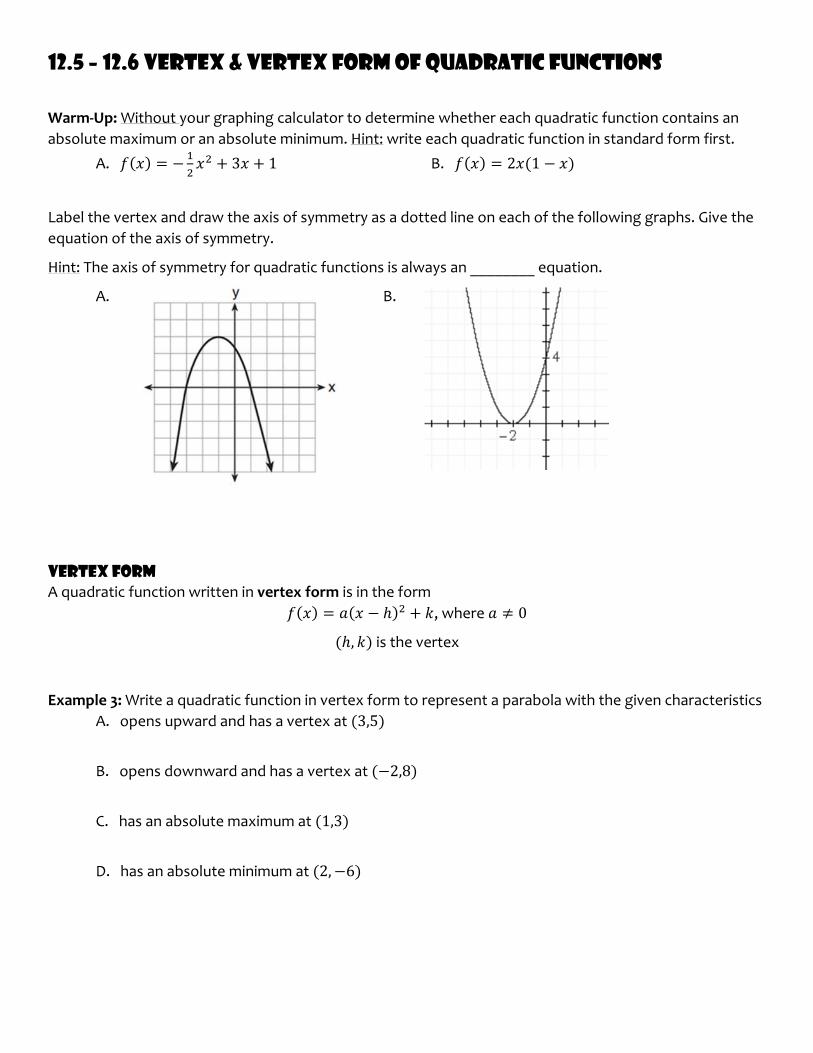
12.5 – 12.6 Vertex & Vertex Form of Quadratic Functions
Warm‐Up: Without your graphing calculator to determine whether each quadratic function contains an
absolute maximum or an absolute minimum. Hint: write each quadratic function in standard form first.
A. 3 1 B. 2 1
Label the vertex and draw the axis of symmetry as a dotted line on each of the following graphs. Give the
equation of the axis of symmetry.
Hint: The axis of symmetry for quadratic functions is always an ________ equation.
A. B.
Vertex Form
A quadratic function written in vertex form is in the form
, where 0
, is the vertex
Example 3: Write a quadratic function in vertex form to represent a parabola with the given characteristics
A. opens upward and has a vertex at 3,5
B. opens downward and has a vertex at 2,8
C. has an absolute maximum at 1,3
D. has an absolute minimum at 2, 6
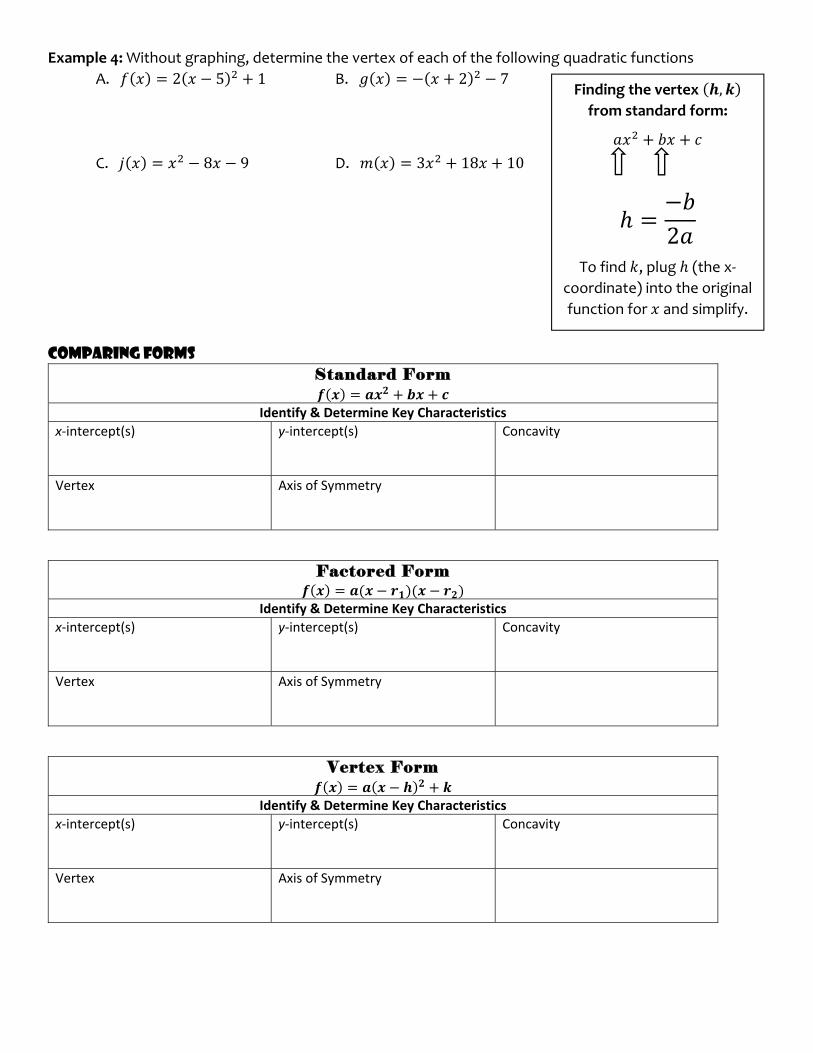
Example 4: Without graphing, determine the vertex of each of the following quadratic functions
A. 2 5 1 B. 2 7
C. 8 9 D. 3 18 10
Comparing Forms
Standard Form
Identify & Determine Key Characteristics
x‐intercept(s) y‐intercept(s) Concavity
Vertex Axis of Symmetry
Factored Form
Identify & Determine Key Characteristics
x‐intercept(s) y‐intercept(s) Concavity
Vertex Axis of Symmetry
Vertex Form
Identify & Determine Key Characteristics
x‐intercept(s) y‐intercept(s) Concavity
Vertex Axis of Symmetry
Finding the vertex ,
from standard form:
2
To find , plug (the x‐
coordinate) into the original
function for and simplify.
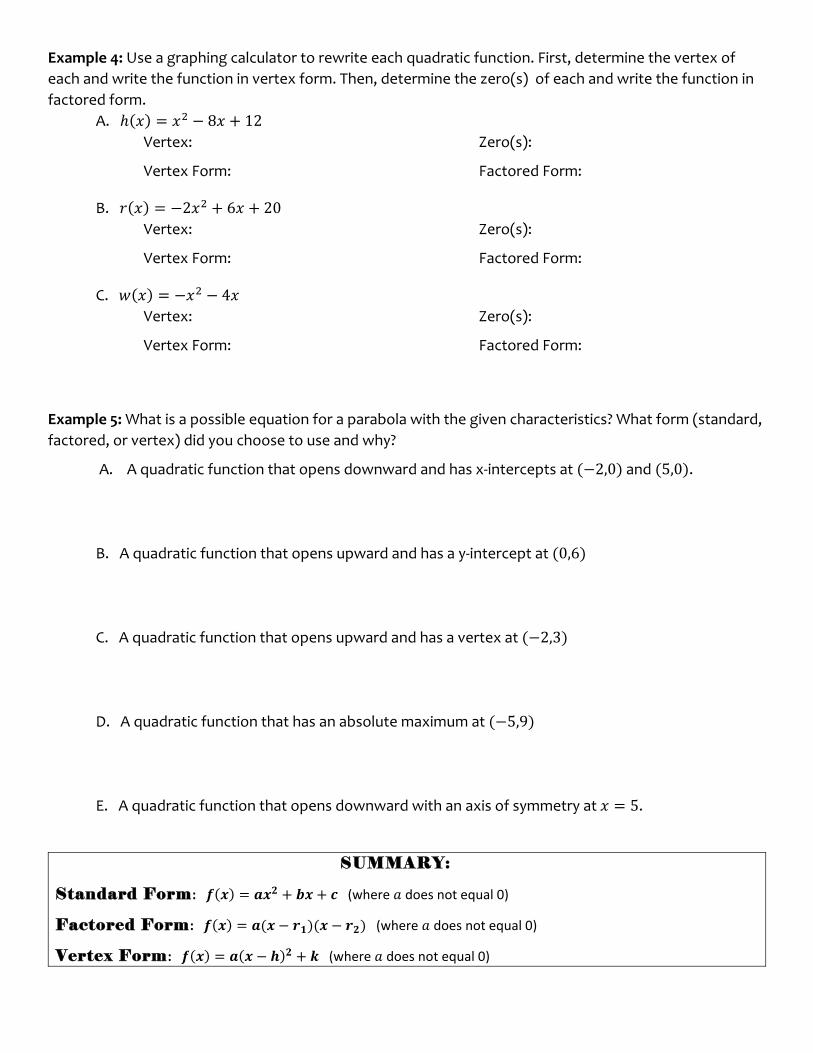
Example 4: Use a graphing calculator to rewrite each quadratic function. First, determine the vertex of
each and write the function in vertex form. Then, determine the zero(s) of each and write the function in
factored form.
A. 8 12 Vertex: Zero(s):
Vertex Form: Factored Form:
B. 2 6 20 Vertex: Zero(s):
Vertex Form: Factored Form:
C. 4
Vertex: Zero(s):
Vertex Form: Factored Form:
Example 5: What is a possible equation for a parabola with the given characteristics? What form (standard,
factored, or vertex) did you choose to use and why?
A. A quadratic function that opens downward and has x‐intercepts at 2,0 and 5,0 .
B. A quadratic function that opens upward and has a y‐intercept at 0,6
C. A quadratic function that opens upward and has a vertex at 2,3
D. A quadratic function that has an absolute maximum at 5,9
E. A quadratic function that opens downward with an axis of symmetry at 5.
SUMMARY:
Standard Form: (where does not equal 0)
Factored Form: (where does not equal 0)
Vertex Form: (where does not equal 0)
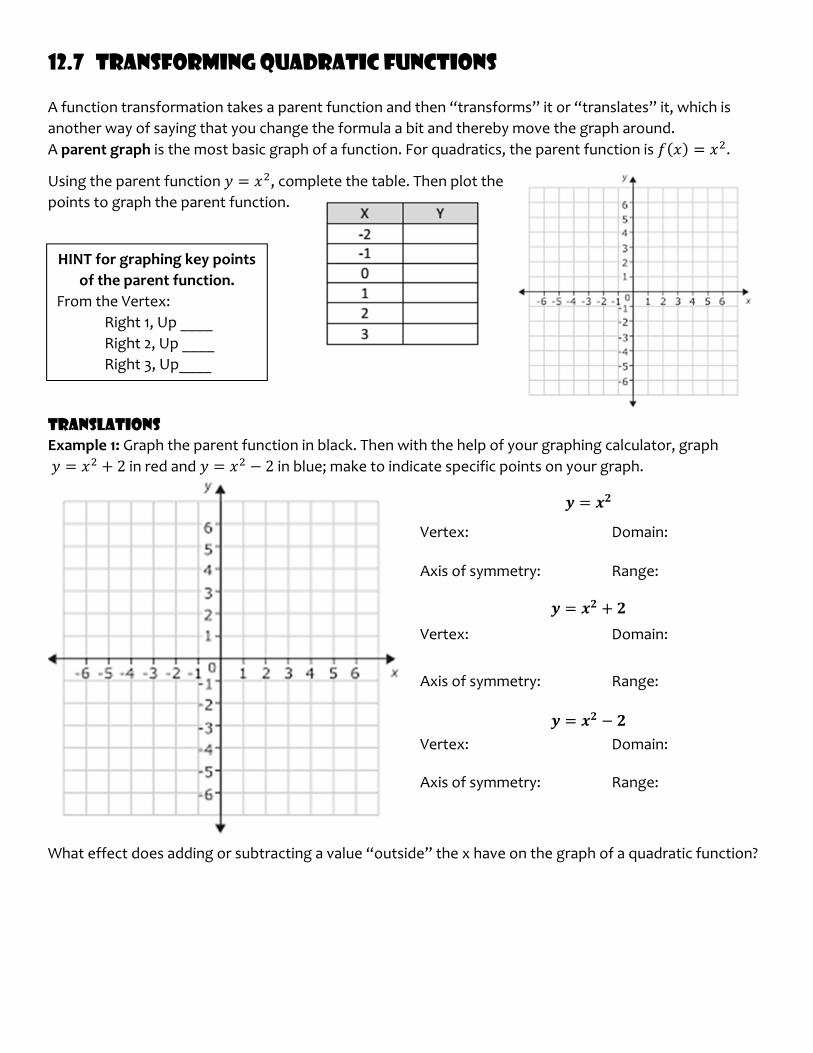
12.7 Transforming Quadratic Functions
A function transformation takes a parent function and then “transforms” it or “translates” it, which is
another way of saying that you change the formula a bit and thereby move the graph around.
A parent graph is the most basic graph of a function. For quadratics, the parent function is .
Using the parent function , complete the table. Then plot the
points to graph the parent function.
Translations
Example 1: Graph the parent function in black. Then with the help of your graphing calculator, graph
2 in red and 2 in blue; make to indicate specific points on your graph.
Vertex: Domain: Axis of symmetry: Range:
Vertex: Domain:
Axis of symmetry: Range:
Vertex: Domain:
Axis of symmetry: Range:
What effect does adding or subtracting a value “outside” the x have on the graph of a quadratic function?
HINT for graphing key points
of the parent function.
From the Vertex:
Right 1, Up ____
Right 2, Up ____
Right 3, Up____
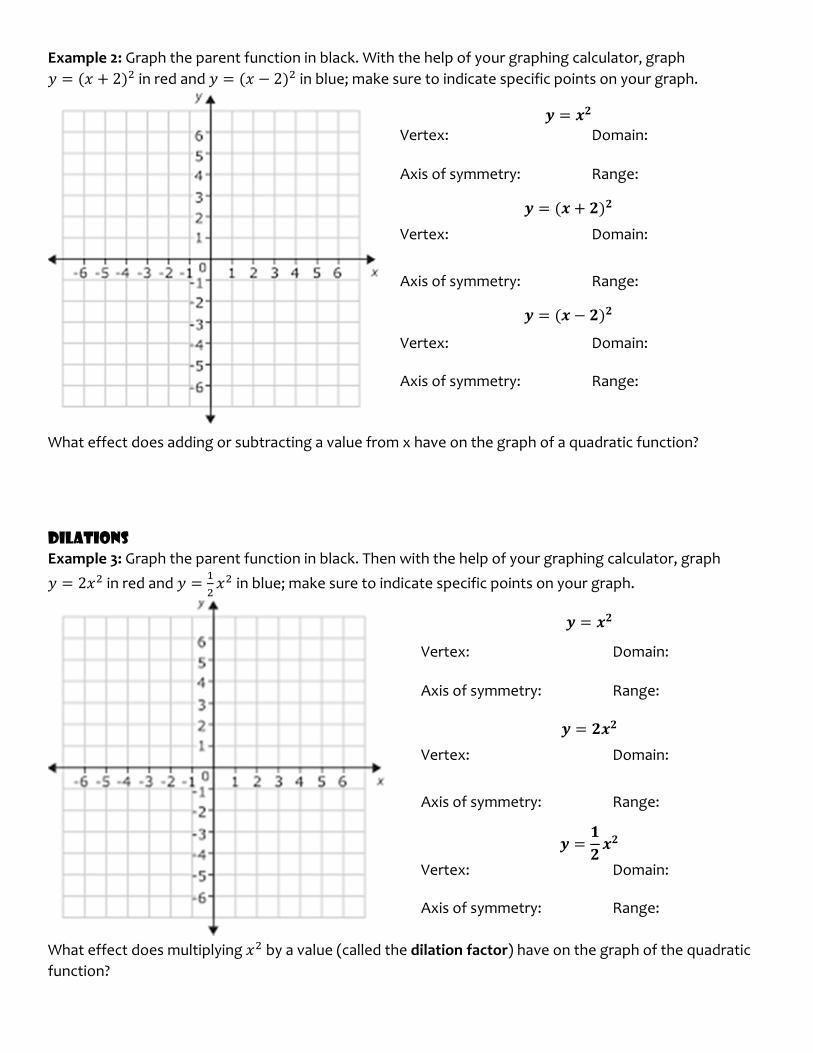
Example 2: Graph the parent function in black. With the help of your graphing calculator, graph
2 in red and 2 in blue; make sure to indicate specific points on your graph.
Vertex: Domain: Axis of symmetry: Range:
Vertex: Domain:
Axis of symmetry: Range:
Vertex: Domain:
Axis of symmetry: Range:
What effect does adding or subtracting a value from x have on the graph of a quadratic function?
Dilations
Example 3: Graph the parent function in black. Then with the help of your graphing calculator, graph
2 in red and in blue; make sure to indicate specific points on your graph.
What effect does multiplying by a value (called the dilation factor) have on the graph of the quadratic
function?
Vertex: Domain: Axis of symmetry: Range:
Vertex: Domain:
Axis of symmetry: Range:
Vertex: Domain:
Axis of symmetry: Range:
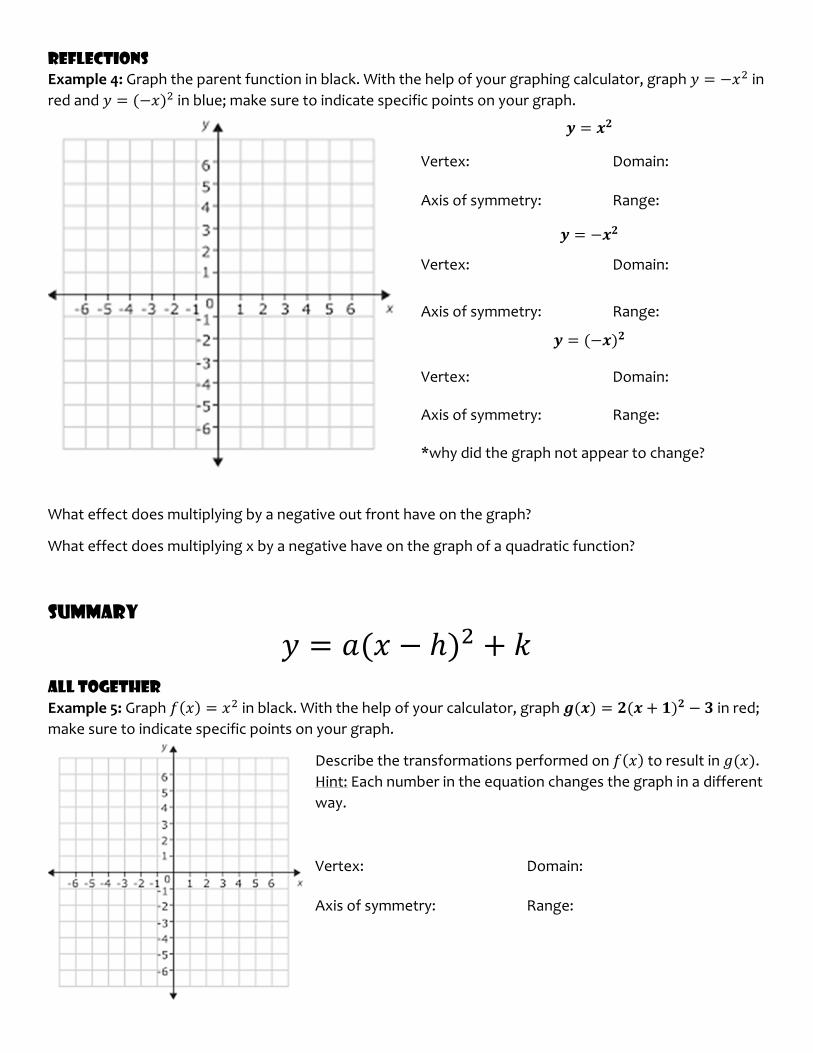
Reflections
Example 4: Graph the parent function in black. With the help of your graphing calculator, graph in
red and in blue; make sure to indicate specific points on your graph.
What effect does multiplying by a negative out front have on the graph?
What effect does multiplying x by a negative have on the graph of a quadratic function?
Summary
All Together
Example 5: Graph in black. With the help of your calculator, graph in red;
make sure to indicate specific points on your graph.
Describe the transformations performed on to result in .
Hint: Each number in the equation changes the graph in a different
way.
Vertex: Domain:
Axis of symmetry: Range:
Vertex: Domain: Axis of symmetry: Range:
Vertex: Domain:
Axis of symmetry: Range:
Vertex: Domain:
Axis of symmetry: Range:
*why did the graph not appear to change?
Example 6: Graph in black. WITHOUT the help of your graphing calculator this time, graph
4 5 in red; make sure to indicate specific points on your graph.
Describe the transformations performed on to
result in . Remember that each number in the
equation changes the graph in a different way.
Vertex: Domain:
Axis of symmetry: Range:
Example 7: Graph in black. WITHOUT the help of your graphing calculator, graph
3 2 7 in red; make sure to indicate specific points on your graph.
Describe the transformations performed on to
result in . Remember that each number in the
equation changes the graph in a different way.
Vertex: Domain:
Axis of symmetry: Range: