Embed Size (px)
Citation preview
USOO8756572B2
(12) United States Patent (10) Patent No.: US 8,756,572 B2 Halliday et al. (45) Date of Patent: Jun. 17, 2014
(54) DEBUGGER-SET IDENTIFYING 6,412, 106 B1 6/2002 Leask et al. ................... 717/124 BREAKPOINTS AFTER COROUTINE YELD 7,401.323 B2 7/2008 Stallet al. POINTS 7,836,430 B2 11/2010 Shebs
8,019,075 B2 9/2011 Mohammad et al. 8,079,019 B2 12/2011 Lindo et al.
(75) Inventors: Ian W. J. Halliday, Seattle, WA (US); 2004/01681.55 A1 8/2004 O'Farrell et al. ............. 717/129 Gregory B. Miskelly, Seattle, WA (US); 2004/0205720 A1 10, 2004 Hundt Stephen H. Toub, Seattle, WA (US); 2005.0034024 A1 2/2005 AlverSon et al. ................ T14? 38 Dmitry Lomov, Redmond, WA (US); 2008, OO52683 A1 2/2008 Bates et al. Kayle K. Hinkle, III, Redmond, WA (Continued) (US) OTHER PUBLICATIONS
(73) Assignee: Microsoft Corporation, Redmond, WA Fernadez, et al., “Dolbw-LPP: A Dynamic Software Tool for Debug (US) ging Asynchronous Distributed Algorithms on Loosely- Coupled
Parallel Processors'. Retrieved at-3 http://ieeexplore.ieee.org/ (*) Notice: Subject to any disclaimer, the term of this stampan Inn"oo-ji, pp. E. 9.
patent is extended or adjusted under 35 U.S.C. 154(b) by 150 days. (Continued)
(21) Appl. No.: 13/053,228 Primary Examiner — Don Wong Assistant Examiner — Mohammad Kabir
(22) Filed: Mar 22, 2011 (74) Attorney, Agent, or Firm — Kevin Sullivan; Kate O O Drakos; Micky Minhas (65) Prior Publication Data
US 2012/0246624 A1 Sep. 27, 2012 (57) ABSTRACT A debugger can step through target code in a computer pro
(51) Int. Cl. gram. The debugger can identify a coroutine yield point in the G06F 9/44 (2006.01) target code, and can obtain identifying information to identify
(52) U.S. Cl. continued processing of a coroutine instance triggered by the USPC ............ 717/124; 717/104; 717/128; 717/129 operator. The debugger can set a breakpoint at a location for
(58) Field of Classification Search continued stepping after the coroutine yield point. The break CPC. G06F 11/36; G06F 11/362; G06F 11/3656; point can have a condition of matching the identifying infor
GO6F11A3672 mation with runtime information. The debugger can perform USPC .................................. 717/104,124, 128, 129 the coroutine instance and resume execution of the target See application file for complete search history. code after the coroutine yield point. The debugger can also
encounter the breakpoint in the target code, and can deter (56) References Cited mine whether the condition of the breakpoint is met. If so, the
U.S. PATENT DOCUMENTS debugger can pause execution of the target code at the break point. If not, the debugger can continue execution of the target code past the breakpoint without pausing at the breakpoint. 5,748,963 A 5, 1998 Orr
5,815,653 A 9, 1998 You et al. 6,353,923 B1 3/2002 Bogle et al. 20 Claims, 4 Drawing Sheets
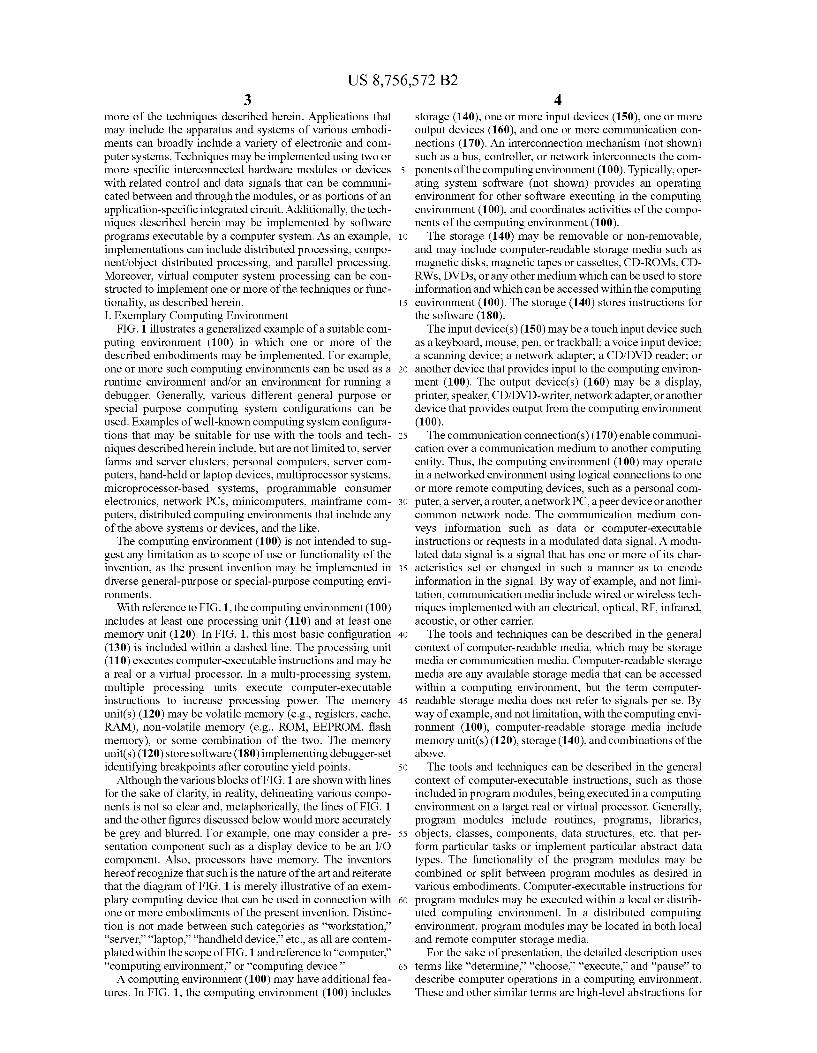
PRFORM SP ASYNCWA
THROUGH operaticN TARGE INSTANCE CODE 45 410
y
ENTIFYASYNC E. WAT opRATOR 4s
A2
s CONTINUE BTAIN BREAKON WHOUT
ENTYING ConotoNMt. O-PAUSING AT INFOROM 47 BREAKPN STATE 490 OBJECT 430
YES
y PAUSEAT
st BREAKON BRENT
440
CLEAR RAKPOINT
485
US 8,756,572 B2 Page 2
(56) References Cited
U.S. PATENT DOCUMENTS
2009/O125890 A1 2009, O133033 A1
5, 2009 Bennet et al. 5, 2009 Lindo et al.
2009/0307652 A1* 12/2009 Maybee et al. ............... T17,104 2010, 0131745 A1 5/2010 Meijer et al. 2010.0153927 A1* 6, 2010 Stall et al. ..................... 717/128 2010/0313184 A1 2011/0302454 A1 2012,0047495 A1* 2012. O151452 A1*
12/2010 Gustafsson et al. 12/2011 Prophete et al. 2/2012 Meijer et al. ... 6/2012 Zinkovsky et al.
2012/0266144 A1 10/2012 Halliday et al. 2012/0324431 A1 12/2012 Toub et al.
OTHER PUBLICATIONS
717,140 . . . . . . . . . . 717/129
Mitrovic, Vladimir, “Testing Asynchronous Code With GHUnit', Retrieved at{< http://vladimir Zardina.org/2010/11/testing-asyn chronous-code-with-ghunit/>>, Nov. 20, 2010, pp. 4. Satyam, “Ask Satyam: Writing Clean, Debuggable Code'. Retrieved at{<http://www.yuiblog.com/blog/2010/09/02/ask-satyam-writing clean-code?>>, Sep. 2, 2010, pp. 14. Baechtel, Don, “What changes in debugging Async code'. Retrieved at{<http://social.msdn.microsoft.com/Forums/en-US async? thread/ 9d6508.a5-bdOf 40df-93a3-49ddd69e5a39/>>, Nov. 2010, pp. 5. Griffiths, Ian, “C# 5 Async Exception Handling”. Retrieved at{<http://www.interact-sw.co.uk/iangblog/2010/11/01/csharp5 async-exceptions), Nov. 1, 2010, pp. 5. Halliday, “What changes in debugging Async code?” Microsoft Visual Studio Blog, Last Reply Nov. 15, 2010, 5 pages. Rossi, "ABAP Debugger'. SAP Community Network Blog, Last Edited May 28, 2010, 2 pages.
Vijaywargiya, “Writing Windows Debugger—Part 2.” The Code Project, Last Updated Dec. 26, 2010, 34 pages. Allen, “Visual Studio Debugging Tutorial.” DotNet Perls, Last Post Shown Dec. 8, 2010, 8 pages. “Visual Studio 2010: Understanding Debugging.” Programming 4Us, Oct. 13, 2010, 9 pages. Toub, "Processing Sequences of Asynchronous Operations with Tasks”, Nov. 21, 2010, 6 pages. Lippert, Eric, “Asynchronous Programming in C# 5.0 Part Two: Whence Await?'. Last Post Shown Oct. 30, 2010, 5 pages. Moise, Wesner, Smart Software, “Building Iterators. Using Asyn chronous Methods', Nov. 2, 2010, 4 pages. Sur, Abhishek, “C# 5.0 wNext-New Asynchronous Pattern'. Last Updated Nov. 20, 2010, 25 pages. Juday, Jeffrey, "Awaiting Future C# Asynchronous Features Brought to You by .NET Parallel Computing”. Dec. 7, 2010, 6 pages. Toub, “Implementing the Asynchronous Programming Model With Future <TS'. Last Post Apr. 14, 2008, 4 pages. Matveev, Vladimir, “Event-Based Async Pattern in Fi”, 2010, 3 pageS. Krohn, Maxwell, et al., “Events Can Make Sense'. Based on infor mation and belief available, at least as early as Dec. 29, 2010, 14 pageS. Office Action, U.S. Appl. No. 13/162,288, filed Jun. 16, 2011, Noti fication Date: Oct. 9, 2013, 13 Pages. Office Action, U.S. Appl. No. 13/088,003, filed Apr. 15, 2011, Noti fication Date: Jan. 6, 2014, 31 Pages. Office Action, U.S. Appl. No. 13/088,003, filed Apr. 15, 2011, Noti fication Date: Jul. 5, 2013, 20 Pages.
* cited by examiner
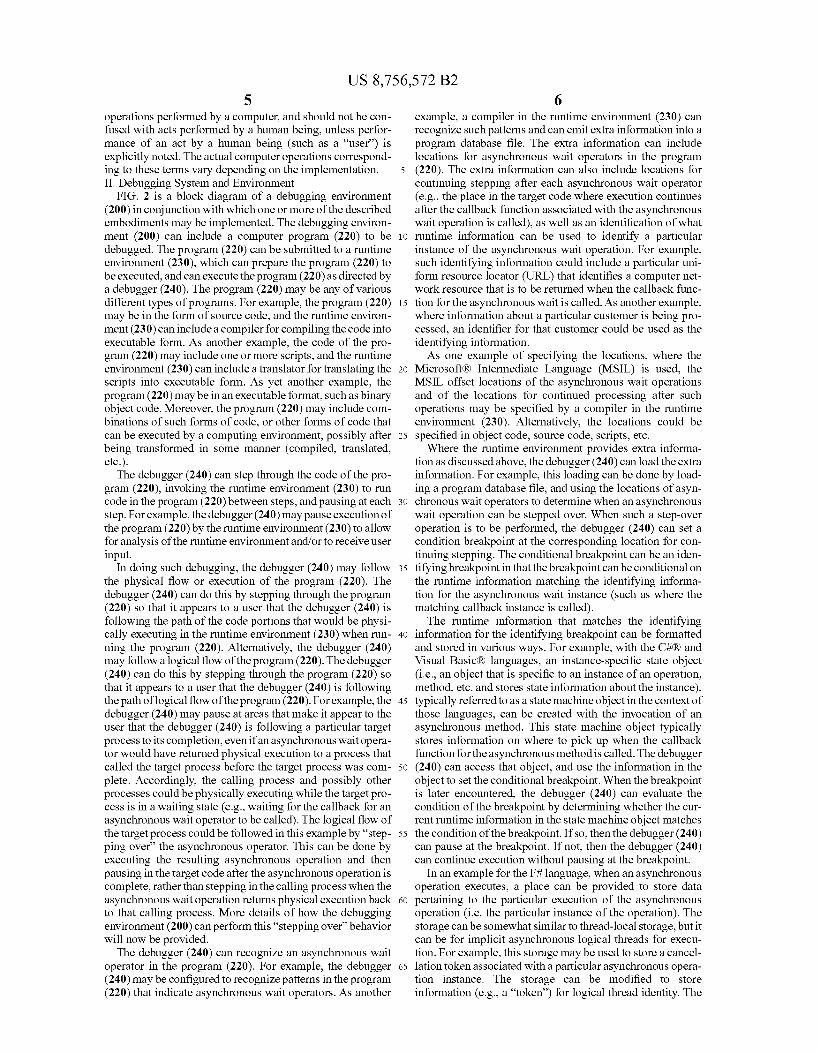
U.S. Patent Jun. 17, 2014 Sheet 1 of 4 US 8,756,572 B2
- COMMUNICATIONY
|- - - - - - - - - - - BASIC INPUT
CONFIGURATION DEVICE(S) 150 130 MEMORY
UNIT(S) OUTPUT DEVICE(S) 160 PROCESSING
UNIT(S) 110 1 STORAGE 140
COMPUTING
ENVIRONMENT 100 CONNEONS
SOFTWARE 180 IMPLEMENTING DEBUGGER-SET IDENTIFYING BREAKPOINTS AFTER COROUTINE
YELD POINTS
FIGURE 1
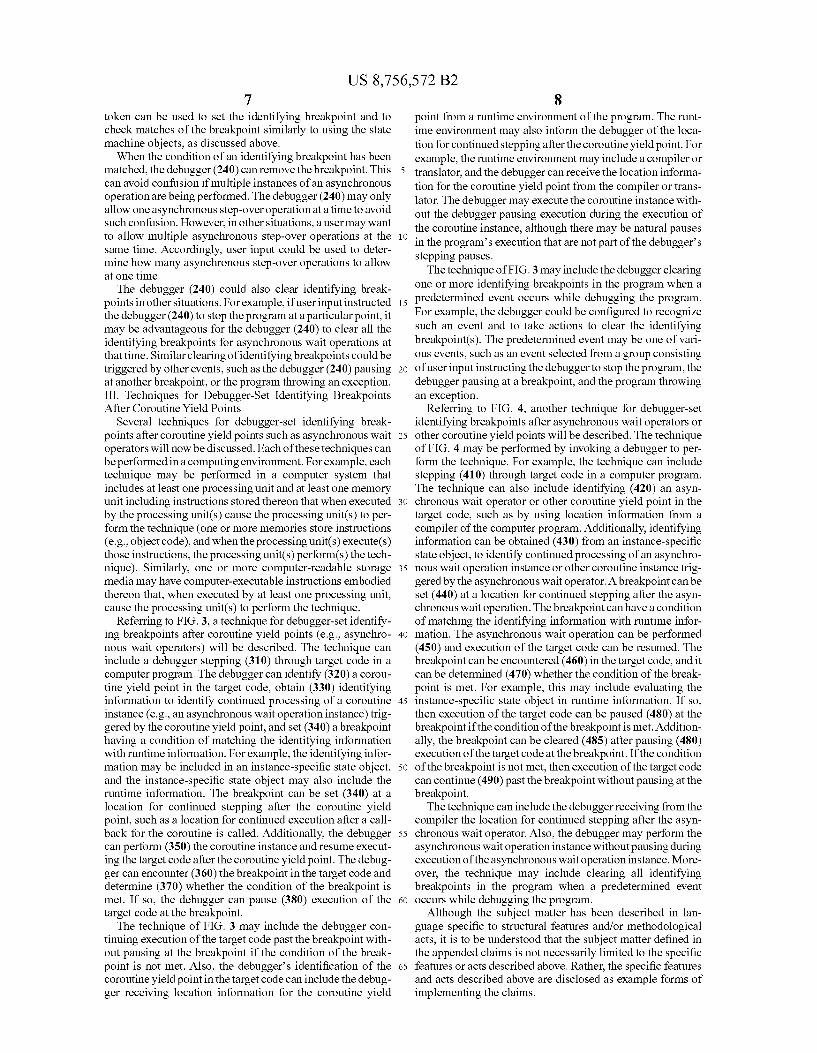
U.S. Patent Jun. 17, 2014
PROGRAM 220
Sheet 2 of 4 US 8,756,572 B2
RUNTIME ENVIRONMENT DEBUSGER
230 240
DEBUGGING ENVIRONMENT
200
FIGURE 2
U.S. Patent Jun. 17, 2014
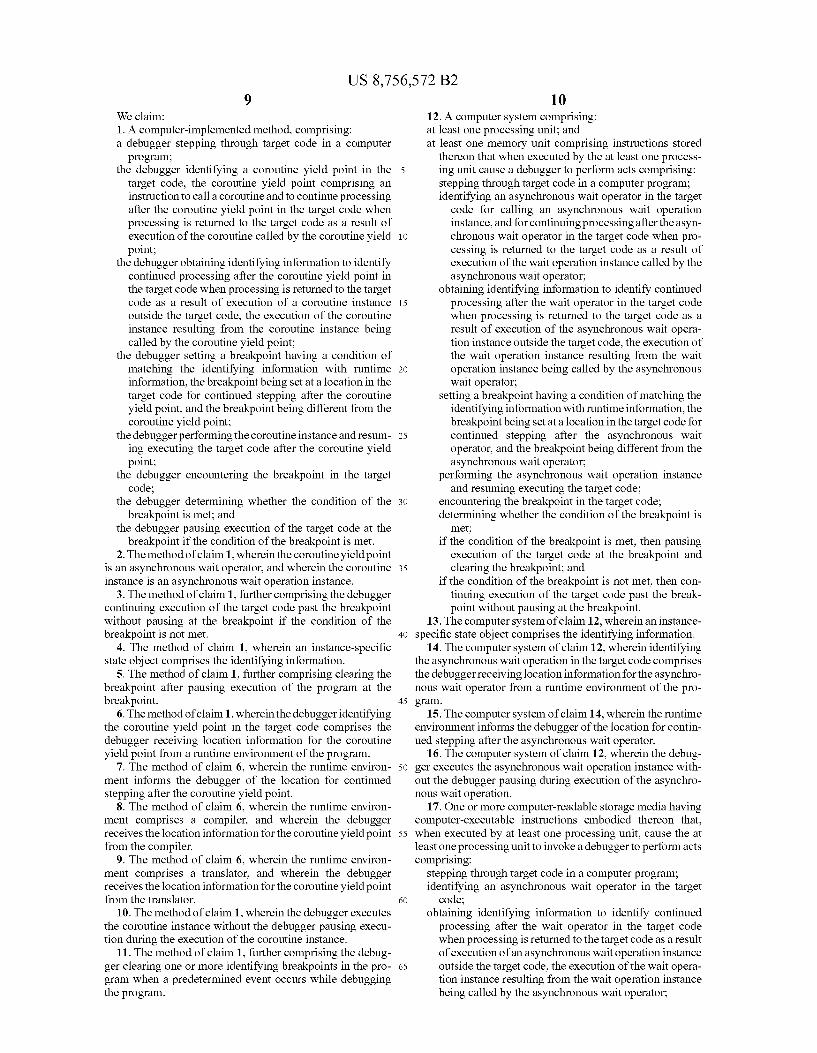
STEP THROUGH TARGET CODE 310
IDENTIFY COROUTINE YIELD POINT
320
OBTAIN IDENTIFYING INFORMATION
330
SET BREAKPOINT
340
Sheet 3 of 4
FIGURE 3
CONDITION MET2
US 8,756,572 B2
PERFORM COROUTINE INSTANCE
350
ENCOUNTER BREAKPOINT
360
BREAKPOINT
370
YES
PAUSEAT BREAKPOINT
380
U.S. Patent Jun. 17, 2014 Sheet 4 of 4 US 8,756,572 B2
PERFORM STEP ASYNC WAIT
THROUGH OPERATION TARGET INSTANCE CODE 450 410
ENCOUNTER IDENTIFY ASYNC BREAKPOINT WAIT OPERATOR 460
420
CONTINUE OBTAIN BREAKPOINT WITHOUT
IDENTIFYING CONDITION MET2 NO-> PAUSING AT INFO FROM 470 BREAKPOINT STATE 490 OBJECT
430 YES
PAUSEAT SET
BREAKPOINT BREAoNT 440
CLEAR BREAKPOINT
485
FIGURE 4
US 8,756,572 B2 1.
DEBUGGER-SET IDENTIFYING BREAKPOINTS AFTER COROUTINE YELD
POINTS
BACKGROUND
When debugging code, a debugger steps through the code to be debugged by executing (typically via a runtime envi ronment) the code and pausing the execution of the code at the end of each 'step'. This pausing can allow analysis of the runtime environment, and it can also allow other actions such as user input to provide direction via user input.
Debuggers can step through asynchronous code (e.g., asynchronous workflows in the Visual Fit language and asyn chronous methods in the Visual CHR and Visual Basic(R) languages). Such as an "asynchronous wait operator in target code, which triggers an asynchronous wait operation. An asynchronous wait operation Suspends execution of the target code (e.g., by signing up a callback to be invoked upon the completion of Some asynchronous operation) and then returns to the target code's caller. Later, (e.g., when the call back is invoked) processing of the asynchronous operation is continued in the target code. Execution of Such an asynchro nous wait operation causes a typical debugger to follow the physical execution and continue stepping in the caller.
SUMMARY
In some situations, it can be desirable to have debugger stepping behavior Such that encountering a coroutine yield point, such as an asynchronous wait operator, will cause the debugger to wait for the coroutine to complete and continue stepping in the code following the yield point. According to the tools and techniques described herein, a debugger can set an identifying breakpoint at a location for continued process ing after a coroutine yield point. The identifying breakpoint is a conditional breakpoint with a condition of matching iden tifying information for a coroutine instance such as an asyn chronous wait operation instance. The debugger can proceed with executing the coroutine instance, and can pause when the breakpoint is encountered and the condition is met.
In one embodiment, the tools and techniques can include a debugger stepping through target code in a computer pro gram. The debugger can identify a coroutine yield point in the target code, and can obtain identifying information to identify continued processing of a coroutine instance triggered by the yield point. The debugger can set a breakpoint at a location for continued stepping after the yield point. The breakpoint can have a condition of matching the identifying information with runtime information. The debugger can perform the coroutine instance and resume execution of the target code after the yield point. The debugger can also encounter the breakpoint in the target code, and can determine whether the condition of the breakpoint is met. If so, the debugger can pause execution of the target code at the breakpoint. If not, the debugger can continue execution of the target code past the breakpoint without pausing at the breakpoint.
This Summary is provided to introduce a selection of con cepts in a simplified form. The concepts are further described below in the Detailed Description. This Summary is not intended to identify key features or essential features of the claimed subject matter, nor is it intended to be used to limit the scope of the claimed subject matter. Similarly, the inven tion is not limited to implementations that address the par ticular techniques, tools, environments, disadvantages, or
10
15
25
30
35
40
45
50
55
60
65
2 advantages discussed in the Background, the Detailed Description, or the attached drawings.
BRIEF DESCRIPTION OF THE DRAWINGS
FIG. 1 is a block diagram of a suitable computing environ ment in which one or more of the described embodiments may be implemented.
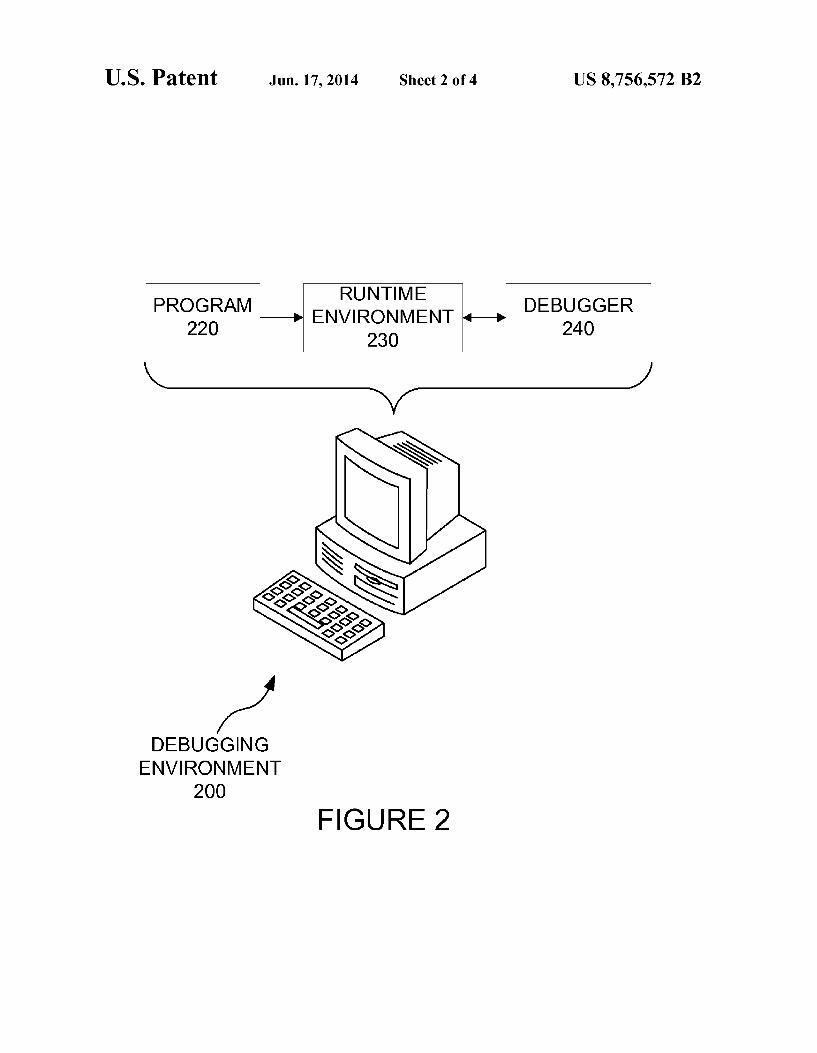
FIG. 2 is a schematic diagram of a debugging environment. FIG.3 is a flowchart of a technique for debugger-set iden
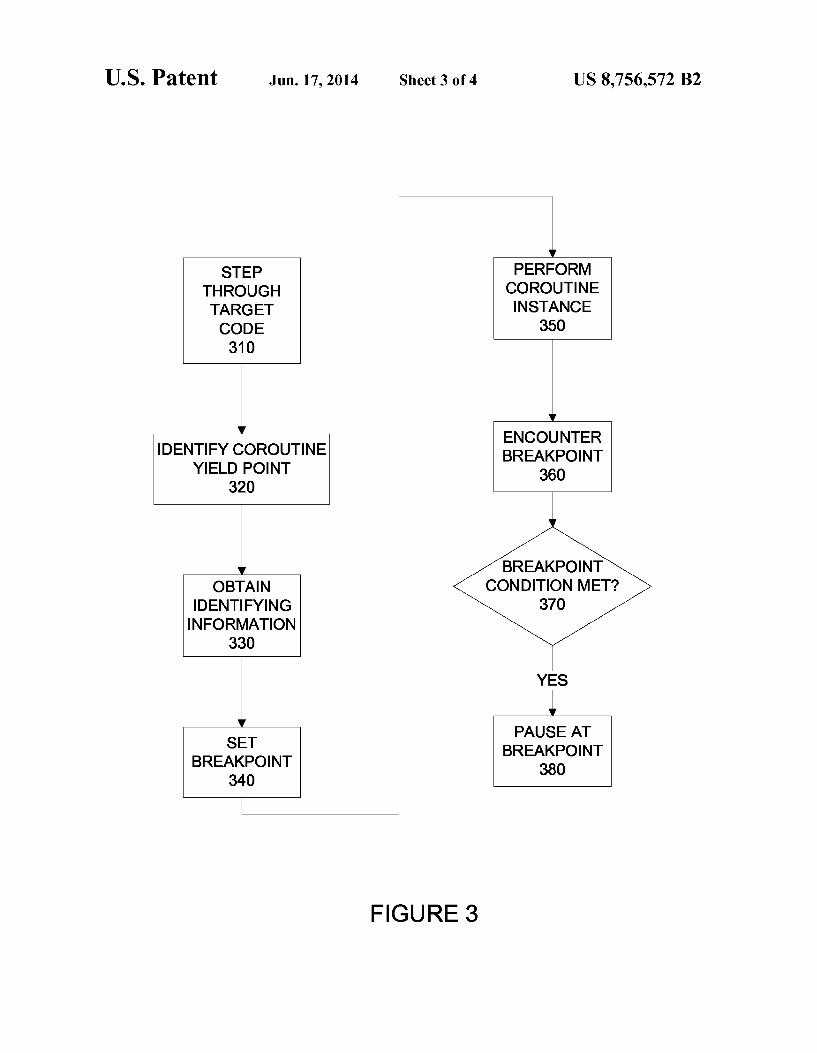
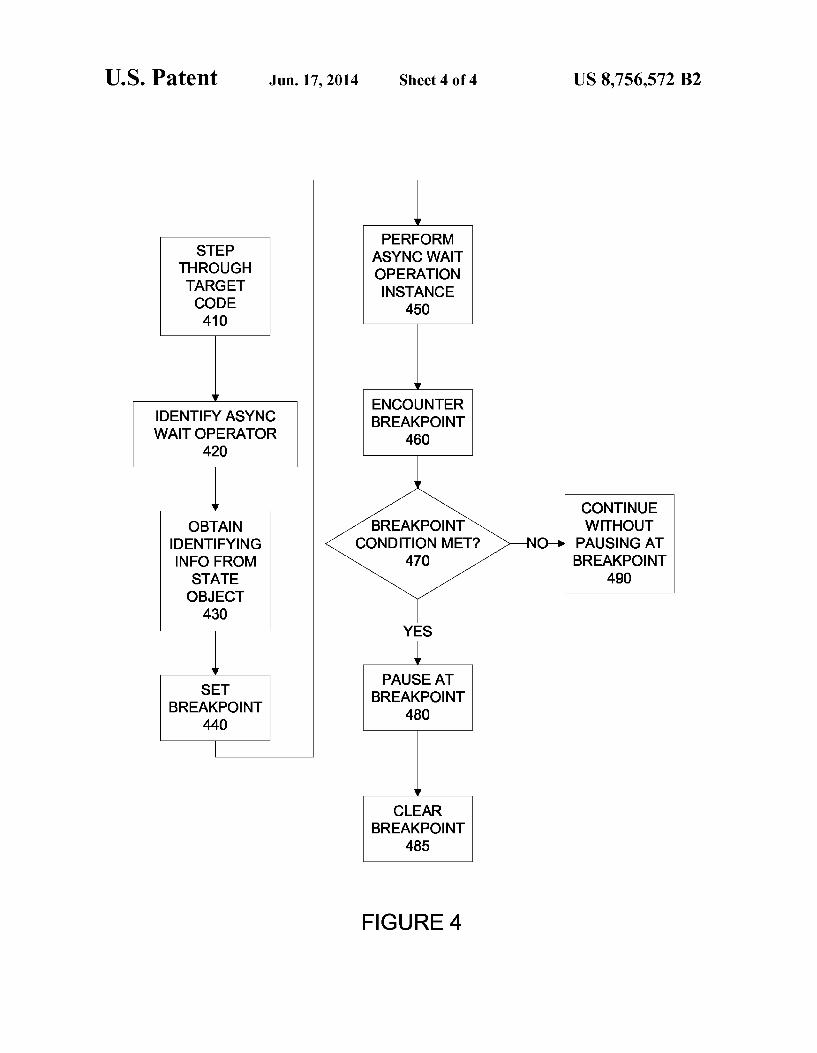
tifying breakpoints after coroutine yield points. FIG. 4 is a flowchart of another technique for debugger-set
identifying breakpoints after asynchronous wait operators.
DETAILED DESCRIPTION
Embodiments described herein are directed to techniques and tools for improved debugging behavior when stepping through target code that includes a coroutine yield point. Such improvements may result from the use of various techniques and tools separately or in combination.
Such techniques and tools may include a debugger decid ing to step over a coroutine yield point Such as an asynchro nous wait operation. For the sake of simplicity, an asynchro nous wait operator and corresponding asynchronous wait operation will be described throughout this detailed descrip tion. However, the techniques and tools described herein can apply to other types of yield points and other types of corou tines. The debugger can perform the step-over operation by setting and using an identifying conditional breakpoint. Spe cifically, the debugger can set an identifying breakpoint at a location for continued stepping after execution of the asyn chronous wait operation. Such a breakpoint can be condi tional on the runtime information matching an identity con dition for a callback instance corresponding to the asynchronous wait operation instance. When the breakpoint is encountered and the condition is met, the debugger can pause, and stepping can continue from that point.
In this way, the debugger can follow the logic of the code by stepping over an asynchronous wait operator as if it were synchronous code. This can be done without a user manually setting a breakpoint, which can be tedious and time-consum ing. Additionally, the stepping can continue in the matching callback instance because the debugger can use the identify ing information to set the condition of the identifying break point to identify that callback instance. The subject matter defined in the appended claims is not
necessarily limited to the benefits described herein. A particu lar implementation of the invention may provide all. Some, or none of the benefits described herein. Although operations for the various techniques are described herein in a particular, sequential order for the sake of presentation, it should be understood that this manner of description encompasses rear rangements in the order of operations, unless a particular ordering is required. For example, operations described sequentially may in Some cases be rearranged or performed concurrently. Moreover, for the sake of simplicity, flowcharts may not show the various ways in which particular techniques can be used in conjunction with other techniques.
Techniques described herein may be used with one or more of the systems described herein and/or with one or more other systems. For example, the various procedures described herein may be implemented with hardware or software, or a combination of both. For example, dedicated hardware implementations, such as application specific integrated cir cuits, programmable logic arrays and otherhardware devices, can be constructed to implement at least a portion of one or
US 8,756,572 B2 3
more of the techniques described herein. Applications that may include the apparatus and systems of various embodi ments can broadly include a variety of electronic and com puter systems. Techniques may be implemented using two or more specific interconnected hardware modules or devices with related control and data signals that can be communi cated between and through the modules, or as portions of an application-specific integrated circuit. Additionally, the tech niques described herein may be implemented by software programs executable by a computer system. As an example, implementations can include distributed processing, compo nent/object distributed processing, and parallel processing. Moreover, virtual computer system processing can be con structed to implement one or more of the techniques or func tionality, as described herein. I. Exemplary Computing Environment
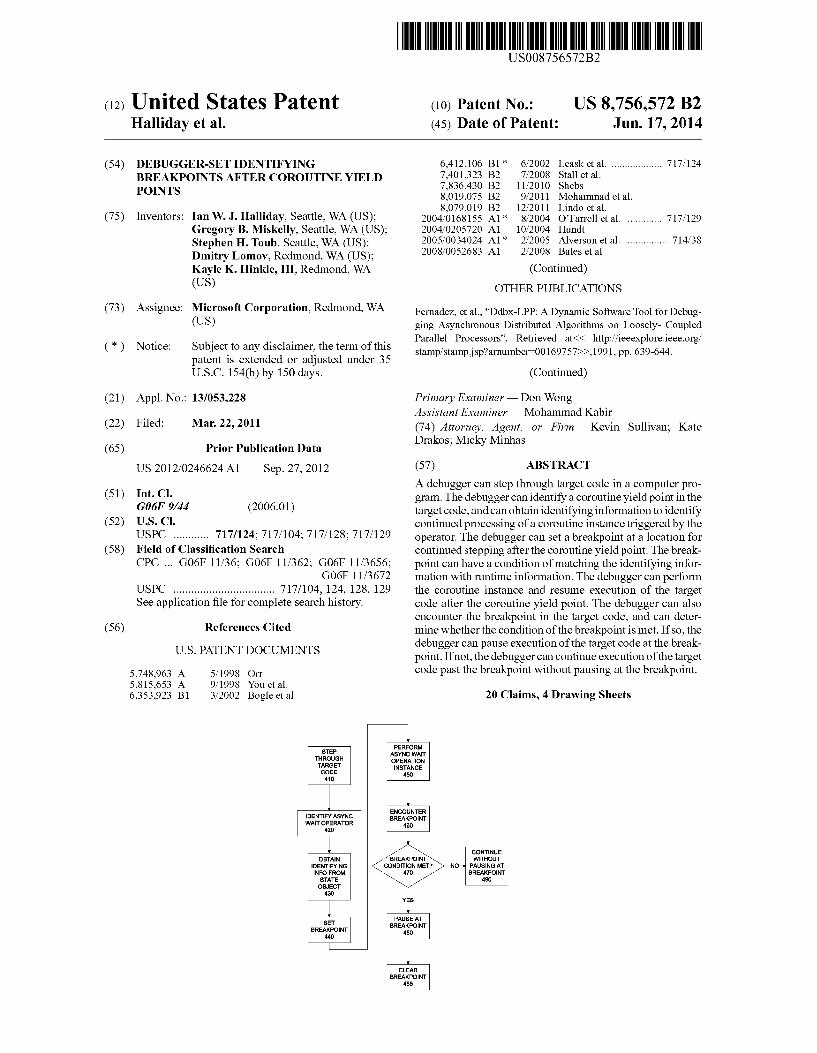
FIG. 1 illustrates a generalized example of a suitable com puting environment (100) in which one or more of the described embodiments may be implemented. For example, one or more Such computing environments can be used as a runtime environment and/or an environment for running a debugger. Generally, various different general purpose or special purpose computing system configurations can be used. Examples of well-known computing system configura tions that may be suitable for use with the tools and tech niques described herein include, but are not limited to, server farms and server clusters, personal computers, server com puters, hand-held or laptop devices, multiprocessor Systems, microprocessor-based systems, programmable consumer electronics, network PCs, minicomputers, mainframe com puters, distributed computing environments that include any of the above systems or devices, and the like. The computing environment (100) is not intended to Sug
gest any limitation as to scope of use or functionality of the invention, as the present invention may be implemented in diverse general-purpose or special-purpose computing envi rOnmentS.
With reference to FIG.1, the computing environment (100) includes at least one processing unit (110) and at least one memory unit (120). In FIG. 1, this most basic configuration (130) is included within a dashed line. The processing unit (110) executes computer-executable instructions and may be a real or a virtual processor. In a multi-processing system, multiple processing units execute computer-executable instructions to increase processing power. The memory unit(s) (120) may be volatile memory (e.g., registers, cache, RAM), non-volatile memory (e.g., ROM, EEPROM, flash memory), or some combination of the two. The memory unit(s) (120) store software (180) implementing debugger-set identifying breakpoints after coroutine yield points.
Although the various blocks of FIG. 1 are shown with lines for the sake of clarity, in reality, delineating various compo nents is not so clear and, metaphorically, the lines of FIG. 1 and the other figures discussed below would more accurately be grey and blurred. For example, one may consider a pre sentation component Such as a display device to be an I/O component. Also, processors have memory. The inventors hereof recognize that such is the nature of the art and reiterate that the diagram of FIG. 1 is merely illustrative of an exem plary computing device that can be used in connection with one or more embodiments of the present invention. Distinc tion is not made between Such categories as “workstation.” “server.” “laptop,” “handheld device.” etc., as all are contem plated within the scope of FIG. 1 and reference to “computer.” “computing environment, or “computing device.” A computing environment (100) may have additional fea
tures. In FIG. 1, the computing environment (100) includes
10
15
25
30
35
40
45
50
55
60
65
4 storage (140), one or more input devices (150), one or more output devices (160), and one or more communication con nections (170). An interconnection mechanism (not shown) Such as a bus, controller, or network interconnects the com ponents of the computing environment (100). Typically, oper ating system software (not shown) provides an operating environment for other software executing in the computing environment (100), and coordinates activities of the compo nents of the computing environment (100). The storage (140) may be removable or non-removable,
and may include computer-readable storage media Such as magnetic disks, magnetic tapes or cassettes, CD-ROMs, CD RWs, DVDs, or any other medium which can be used to store information and which can be accessed within the computing environment (100). The storage (140) stores instructions for the software (180). The input device(s) (150) may be a touch input device such
as a keyboard, mouse, pen, or trackball; a Voice input device; a scanning device; a network adapter; a CD/DVD reader; or another device that provides input to the computing environ ment (100). The output device(s) (160) may be a display, printer, speaker, CD/DVD-writer, network adapter, or another device that provides output from the computing environment (100). The communication connection(s) (170) enable communi
cation over a communication medium to another computing entity. Thus, the computing environment (100) may operate in a networked environment using logical connections to one or more remote computing devices, such as a personal com puter, a server, a router, a network PC, a peer device or another common network node. The communication medium con veys information such as data or computer-executable instructions or requests in a modulated data signal. A modu lated data signal is a signal that has one or more of its char acteristics set or changed in Such a manner as to encode information in the signal. By way of example, and not limi tation, communication media include wired or wireless tech niques implemented with an electrical, optical, RF, infrared, acoustic, or other carrier. The tools and techniques can be described in the general
context of computer-readable media, which may be storage media or communication media. Computer-readable storage media are any available storage media that can be accessed within a computing environment, but the term computer readable storage media does not refer to signals per se. By way of example, and not limitation, with the computing envi ronment (100), computer-readable storage media include memory unit(s) (120), storage (140), and combinations of the above. The tools and techniques can be described in the general
context of computer-executable instructions, such as those included in program modules, being executed in a computing environment on a target real or virtual processor. Generally, program modules include routines, programs, libraries, objects, classes, components, data structures, etc. that per form particular tasks or implement particular abstract data types. The functionality of the program modules may be combined or split between program modules as desired in various embodiments. Computer-executable instructions for program modules may be executed within a local or distrib uted computing environment. In a distributed computing environment, program modules may be located in both local and remote computer storage media.
For the sake of presentation, the detailed description uses terms like “determine.” “choose.” “execute.” and “pause to describe computer operations in a computing environment. These and other similar terms are high-level abstractions for
US 8,756,572 B2 5
operations performed by a computer, and should not be con fused with acts performed by a human being, unless perfor mance of an act by a human being (Such as a “user') is explicitly noted. The actual computer operations correspond ing to these terms vary depending on the implementation. II. Debugging System and Environment
FIG. 2 is a block diagram of a debugging environment (200) in conjunction with which one or more of the described embodiments may be implemented. The debugging environ ment (200) can include a computer program (220) to be debugged. The program (220) can be submitted to a runtime environment (230), which can prepare the program (220) to be executed, and can execute the program (220) as directed by a debugger (240). The program (220) may be any of various different types of programs. For example, the program (220) may be in the form of source code, and the runtime environ ment (230) can include a compiler for compiling the code into executable form. As another example, the code of the pro gram (220) may include one or more scripts, and the runtime environment (230) can include a translator for translating the Scripts into executable form. As yet another example, the program (220) may be in an executable format, such as binary object code. Moreover, the program (220) may include com binations of such forms of code, or other forms of code that can be executed by a computing environment, possibly after being transformed in some manner (compiled, translated, etc.). The debugger (240) can step through the code of the pro
gram (220), invoking the runtime environment (230) to run code in the program (220) between steps, and pausing at each step. For example, the debugger (240) may pause execution of the program (220) by the runtime environment (230) to allow for analysis of the runtime environment and/or to receive user input.
In doing Such debugging, the debugger (240) may follow the physical flow or execution of the program (220). The debugger (240) can do this by stepping through the program (220) so that it appears to a user that the debugger (240) is following the path of the code portions that would be physi cally executing in the runtime environment (230) when run ning the program (220). Alternatively, the debugger (240) may follow a logical flow of the program (220). The debugger (240) can do this by stepping through the program (220) so that it appears to a user that the debugger (240) is following the path of logical flow of the program (220). For example, the debugger (240) may pause at areas that make it appear to the user that the debugger (240) is following a particular target process to its completion, even if an asynchronous wait opera tor would have returned physical execution to a process that called the target process before the target process was com plete. Accordingly, the calling process and possibly other processes could be physically executing while the target pro cess is in a waiting state (e.g., waiting for the callback for an asynchronous wait operator to be called). The logical flow of the target process could be followed in this example by “step ping over the asynchronous operator. This can be done by executing the resulting asynchronous operation and then pausing in the target code after the asynchronous operation is complete, rather than stepping in the calling process when the asynchronous wait operation returns physical execution back to that calling process. More details of how the debugging environment (200) can perform this “stepping over behavior will now be provided.
The debugger (240) can recognize an asynchronous wait operator in the program (220). For example, the debugger (240) may be configured to recognize patterns in the program (220) that indicate asynchronous wait operators. As another
10
15
25
30
35
40
45
50
55
60
65
6 example, a compiler in the runtime environment (230) can recognize Such patterns and can emit extra information into a program database file. The extra information can include locations for asynchronous wait operators in the program (220). The extra information can also include locations for continuing stepping after each asynchronous wait operator (e.g., the place in the target code where execution continues after the callback function associated with the asynchronous wait operation is called), as well as an identification of what runtime information can be used to identify a particular instance of the asynchronous wait operation. For example, Such identifying information could include a particular uni form resource locator (URL) that identifies a computer net work resource that is to be returned when the callback func tion for the asynchronous wait is called. As another example, where information about a particular customer is being pro cessed, an identifier for that customer could be used as the identifying information. As one example of specifying the locations, where the
Microsoft(R) Intermediate Language (MSIL) is used, the MSIL offset locations of the asynchronous wait operations and of the locations for continued processing after Such operations may be specified by a compiler in the runtime environment (230). Alternatively, the locations could be specified in object code, Source code, Scripts, etc. Where the runtime environment provides extra informa
tion as discussed above, the debugger (240) can load the extra information. For example, this loading can be done by load ing a program database file, and using the locations of asyn chronous wait operators to determine when an asynchronous wait operation can be stepped over. When such a step-over operation is to be performed, the debugger (240) can set a condition breakpoint at the corresponding location for con tinuing stepping. The conditional breakpoint can be an iden tifying breakpoint in that the breakpoint can be conditional on the runtime information matching the identifying informa tion for the asynchronous wait instance (such as where the matching callback instance is called). The runtime information that matches the identifying
information for the identifying breakpoint can be formatted and stored in various ways. For example, with the CHR and Visual Basic R. languages, an instance-specific state object (i.e., an object that is specific to an instance of an operation, method, etc. and stores state information about the instance), typically referred to as a state machine object in the context of those languages, can be created with the invocation of an asynchronous method. This state machine object typically stores information on where to pick up when the callback function for the asynchronous method is called. The debugger (240) can access that object, and use the information in the object to set the conditional breakpoint. When the breakpoint is later encountered, the debugger (240) can evaluate the condition of the breakpoint by determining whether the cur rent runtime information in the State machine object matches the condition of the breakpoint. If so, then the debugger (240) can pause at the breakpoint. If not, then the debugger (240) can continue execution without pausing at the breakpoint.
In an example for the Fit language, when an asynchronous operation executes, a place can be provided to store data pertaining to the particular execution of the asynchronous operation (i.e., the particular instance of the operation). The storage can be somewhat similar to thread-local storage, but it can be for implicit asynchronous logical threads for execu tion. For example, this storage may be used to store a cancel lation token associated with a particular asynchronous opera tion instance. The storage can be modified to store information (e.g., a “token') for logical thread identity. The
US 8,756,572 B2 7
token can be used to set the identifying breakpoint and to check matches of the breakpoint similarly to using the state machine objects, as discussed above. When the condition of an identifying breakpoint has been
matched, the debugger (240) can remove the breakpoint. This can avoid confusion if multiple instances of an asynchronous operation are being performed. The debugger (240) may only allow one asynchronous step-over operation at a time to avoid Such confusion. However, in other situations, a user may want to allow multiple asynchronous step-over operations at the same time. Accordingly, user input could be used to deter mine how many asynchronous step-over operations to allow at one time. The debugger (240) could also clear identifying break
points in other situations. For example, if user input instructed the debugger (240) to stop the program at a particular point, it may be advantageous for the debugger (240) to clear all the identifying breakpoints for asynchronous wait operations at that time. Similar clearing of identifying breakpoints could be triggered by other events, such as the debugger (240) pausing at another breakpoint, or the program throwing an exception. III. Techniques for Debugger-Set Identifying Breakpoints After Coroutine Yield Points
Several techniques for debugger-set identifying break points after coroutine yield points such as asynchronous wait operators will now be discussed. Each of these techniques can be performed in a computing environment. For example, each technique may be performed in a computer system that includes at least one processing unit and at least one memory unit including instructions stored thereon that when executed by the processing unit(s) cause the processing unit(s) to per form the technique (one or more memories store instructions (e.g., object code), and when the processing unit(s) execute(s) those instructions, the processing unit(s) perform(s) the tech nique). Similarly, one or more computer-readable storage media may have computer-executable instructions embodied thereon that, when executed by at least one processing unit, cause the processing unit(s) to perform the technique.
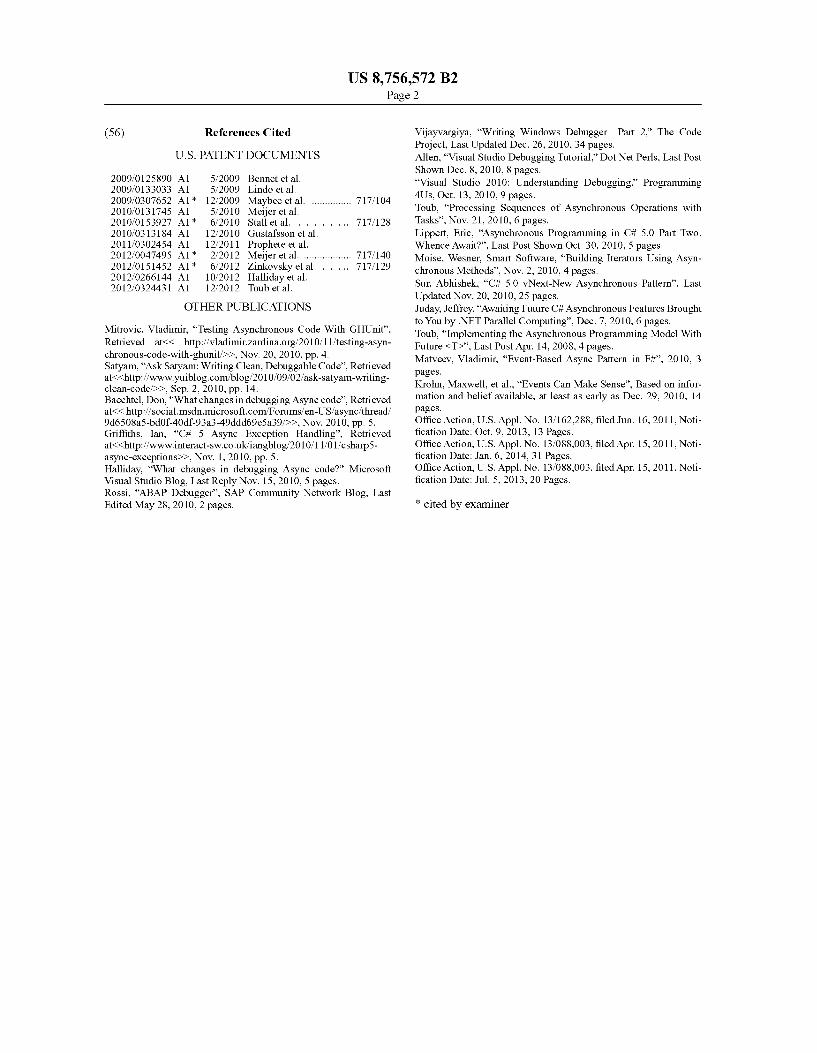
Referring to FIG. 3, a technique for debugger-set identify ing breakpoints after coroutine yield points (e.g., asynchro nous wait operators) will be described. The technique can include a debugger stepping (310) through target code in a computer program. The debugger can identify (320) a corou tine yield point in the target code, obtain (330) identifying information to identify continued processing of a coroutine instance (e.g., an asynchronous wait operation instance) trig gered by the coroutine yield point, and set (340) a breakpoint having a condition of matching the identifying information with runtime information. For example, the identifying infor mation may be included in an instance-specific state object, and the instance-specific state object may also include the runtime information. The breakpoint can be set (340) at a location for continued stepping after the coroutine yield point, such as a location for continued execution after a call back for the coroutine is called. Additionally, the debugger can perform (350) the coroutine instance and resume execut ing the target code after the coroutine yield point. The debug ger can encounter (360) the breakpoint in the target code and determine (370) whether the condition of the breakpoint is met. If so, the debugger can pause (380) execution of the target code at the breakpoint.
The technique of FIG. 3 may include the debugger con tinuing execution of the target code past the breakpoint with out pausing at the breakpoint if the condition of the break point is not met. Also, the debugger's identification of the coroutine yield point in the target code can include the debug ger receiving location information for the coroutine yield
10
15
25
30
35
40
45
50
55
60
65
8 point from a runtime environment of the program. The runt ime environment may also inform the debugger of the loca tion for continued stepping after the coroutine yield point. For example, the runtime environment may include a compiler or translator, and the debugger can receive the location informa tion for the coroutine yield point from the compiler or trans lator. The debugger may execute the coroutine instance with out the debugger pausing execution during the execution of the coroutine instance, although there may be natural pauses in the program’s execution that are not part of the debugger's stepping pauses. The technique of FIG.3 may include the debugger clearing
one or more identifying breakpoints in the program when a predetermined event occurs while debugging the program. For example, the debugger could be configured to recognize Such an event and to take actions to clear the identifying breakpoint(s). The predetermined event may be one of vari ous events, such as an event selected from a group consisting ofuser input instructing the debugger to stop the program, the debugger pausing at a breakpoint, and the program throwing an exception.
Referring to FIG. 4, another technique for debugger-set identifying breakpoints after asynchronous wait operators or other coroutine yield points will be described. The technique of FIG. 4 may be performed by invoking a debugger to per form the technique. For example, the technique can include stepping (410) through target code in a computer program. The technique can also include identifying (420) an asyn chronous wait operator or other coroutine yield point in the target code, such as by using location information from a compiler of the computer program. Additionally, identifying information can be obtained (430) from an instance-specific state object, to identify continued processing of an asynchro nous wait operation instance or other coroutine instance trig gered by the asynchronous wait operator. A breakpoint can be set (440) at a location for continued stepping after the asyn chronous wait operation. The breakpoint can have a condition of matching the identifying information with runtime infor mation. The asynchronous wait operation can be performed (450) and execution of the target code can be resumed. The breakpoint can be encountered (460) in the target code, and it can be determined (470) whether the condition of the break point is met. For example, this may include evaluating the instance-specific state object in runtime information. If so, then execution of the target code can be paused (480) at the breakpoint if the condition of the breakpoint is met. Addition ally, the breakpoint can be cleared (485) after pausing (480) execution of the target code at the breakpoint. If the condition of the breakpoint is not met, then execution of the target code can continue (490) past the breakpoint without pausing at the breakpoint. The technique can include the debugger receiving from the
compiler the location for continued stepping after the asyn chronous wait operator. Also, the debugger may perform the asynchronous wait operation instance without pausing during execution of the asynchronous wait operation instance. More over, the technique may include clearing all identifying breakpoints in the program when a predetermined event occurs while debugging the program.
Although the subject matter has been described in lan guage specific to structural features and/or methodological acts, it is to be understood that the subject matter defined in the appended claims is not necessarily limited to the specific features or acts described above. Rather, the specific features and acts described above are disclosed as example forms of implementing the claims.
US 8,756,572 B2 9
We claim: 1. A computer-implemented method, comprising: a debugger stepping through target code in a computer
program; the debugger identifying a coroutine yield point in the
target code, the coroutine yield point comprising an instruction to call a coroutine and to continue processing after the coroutine yield point in the target code when processing is returned to the target code as a result of execution of the coroutine called by the coroutine yield point;
the debugger obtaining identifying information to identify continued processing after the coroutine yield point in the target code when processing is returned to the target code as a result of execution of a coroutine instance outside the target code, the execution of the coroutine instance resulting from the coroutine instance being called by the coroutine yield point;
the debugger setting a breakpoint having a condition of matching the identifying information with runtime information, the breakpoint being set at a location in the target code for continued stepping after the coroutine yield point, and the breakpoint being different from the coroutine yield point;
the debugger performing the coroutine instance and resum ing executing the target code after the coroutine yield point;
the debugger encountering the breakpoint in the target code;
the debugger determining whether the condition of the breakpoint is met; and
the debugger pausing execution of the target code at the breakpoint if the condition of the breakpoint is met.
2. The method of claim 1, wherein the coroutine yield point is an asynchronous wait operator, and wherein the coroutine instance is an asynchronous wait operation instance.
3. The method of claim 1, further comprising the debugger continuing execution of the target code past the breakpoint without pausing at the breakpoint if the condition of the breakpoint is not met.
4. The method of claim 1, wherein an instance-specific state object comprises the identifying information.
5. The method of claim 1, further comprising clearing the breakpoint after pausing execution of the program at the breakpoint.
6. The method of claim 1, wherein the debugger identifying the coroutine yield point in the target code comprises the debugger receiving location information for the coroutine yield point from a runtime environment of the program.
7. The method of claim 6, wherein the runtime environ ment informs the debugger of the location for continued stepping after the coroutine yield point.
8. The method of claim 6, wherein the runtime environ ment comprises a compiler, and wherein the debugger receives the location information for the coroutine yield point from the compiler.
9. The method of claim 6, wherein the runtime environ ment comprises a translator, and wherein the debugger receives the location information for the coroutine yield point from the translator.
10. The method of claim 1, wherein the debugger executes the coroutine instance without the debugger pausing execu tion during the execution of the coroutine instance.
11. The method of claim 1, further comprising the debug ger clearing one or more identifying breakpoints in the pro gram when a predetermined event occurs while debugging the program.
10
15
25
30
35
40
45
50
55
60
65
10 12. A computer system comprising: at least one processing unit; and at least one memory unit comprising instructions stored
thereon that when executed by the at least one process ing unit cause a debugger to perform acts comprising: stepping through target code in a computer program; identifying an asynchronous wait operator in the target
code for calling an asynchronous wait operation instance, and for continuing processing after the asyn chronous wait operator in the target code when pro cessing is returned to the target code as a result of execution of the wait operation instance called by the asynchronous wait operator,
obtaining identifying information to identify continued processing after the wait operator in the target code when processing is returned to the target code as a result of execution of the asynchronous wait opera tion instance outside the target code, the execution of the wait operation instance resulting from the wait operation instance being called by the asynchronous wait operator,
setting a breakpoint having a condition of matching the identifying information with runtime information, the breakpoint being set at a location in the target code for continued stepping after the asynchronous wait operator, and the breakpoint being different from the asynchronous wait operator,
performing the asynchronous wait operation instance and resuming executing the target code;
encountering the breakpoint in the target code: determining whether the condition of the breakpoint is
met; if the condition of the breakpoint is met, then pausing
execution of the target code at the breakpoint and clearing the breakpoint; and
if the condition of the breakpoint is not met, then con tinuing execution of the target code past the break point without pausing at the breakpoint.
13. The computer system of claim 12, wherein an instance specific state object comprises the identifying information.
14. The computer system of claim 12, wherein identifying the asynchronous wait operation in the target code comprises the debugger receiving location information for the asynchro nous wait operator from a runtime environment of the pro gram.
15. The computer system of claim 14, wherein the runtime environment informs the debugger of the location for contin ued stepping after the asynchronous wait operator.
16. The computer system of claim 12, wherein the debug ger executes the asynchronous wait operation instance with out the debugger pausing during execution of the asynchro nous wait operation.
17. One or more computer-readable storage media having computer-executable instructions embodied thereon that, when executed by at least one processing unit, cause the at least one processing unit to invoke a debugger to perform acts comprising:
stepping through target code in a computer program; identifying an asynchronous wait operator in the target
code; obtaining identifying information to identify continued
processing after the wait operator in the target code when processing is returned to the target code as a result of execution of an asynchronous wait operation instance outside the target code, the execution of the wait opera tion instance resulting from the wait operation instance being called by the asynchronous wait operator,
US 8,756,572 B2 11
setting a breakpoint having a condition of matching the identifying information with runtime information, the breakpoint being set at a location in the target code for continued stepping after the asynchronous wait opera tion, and the breakpoint being different from the asyn- 5 chronous wait operator;
performing the asynchronous wait operation and resuming executing the target code;
encountering the breakpoint in the target code: determining whether the condition of the breakpoint is 10
met; pausing execution of the target code at the breakpoint if the
condition of the breakpoint is met; and continuing execution of the target code past the breakpoint
without pausing at the breakpoint if the condition of the 15 breakpoint is not met.
18. The one or more computer-readable storage media of claim 17, wherein, if the condition of the breakpoint is met, the acts further comprise clearing the breakpoint after paus ing execution of the target code at the breakpoint. 2O
19. The one or more computer-readable storage media of claim 17, wherein the acts comprise the debugger receiving from a compiler the location for continued stepping after the asynchronous wait operator.
20. The one or more computer-readable storage media of 25 claim 17, wherein the acts comprise the debugger performing the asynchronous wait operation instance without pausing during execution of the asynchronous wait operation instance.
30
12