Embed Size (px)
Citation preview

Microsoft Excel 14.0 Answer Report
Worksheet: [12 November.xlsx]Animal Feed Company
Report Created: 12-11-2013 19:39:29
Result: Solver found a solution. All Constraints and optimality conditions are satisfied.
Solver Engine
Solver Options
Objective Cell (Min)
Cell Name Original Value Final Value
$B$15 Minimum Cost (Rs) Total 840 840
Variable Cells
Cell Name Original Value Final Value Integer
$C$11 X1 Usage 80 80 Contin
$C$12 X2 Usage 120 120 Contin
Constraints
Cell Name Cell Value Formula Status Slack
$C$13 Total Usage 200 $C$13=$B$8 Binding 0
$C$12 X2 Usage 120 $C$12>=$B$12 Not Binding 60
$C$11 X1 Usage 80 $C$11<=$B$11 Binding 0

Experiment 1 29 July, 2013
Target (Kg) 200
Resources Limit Usage Rate Cost
X1 80 80 3 240
X2 60 120 5 600
Total 200
Minimum Cost (Rs) 840
Microsoft Excel 12.0 Answer Report
Worksheet: [Book1]Animal Feed Company
Report Created: 7/29/2013 12:11:39 PM
Objective Cell (Min)
Cell Name Original Value Final Value
$B$15 Minimum Cost (Rs) Total 840 840
Variable Cells
Cell Name Original Value Final Value Integer
$C$11 X1 Usage 80 80 Contin
$C$12 X2 Usage 120 120 Contin
Constraints
Cell Name Cell Value Formula Status Slack
$C$13 Total Usage 200 $C$13=$B$8 Binding 0
$C$12 X2 Usage 120 $C$12>=$B$12Not Binding 60
$C$11 X1 Usage 80 $C$11<=$B$11Binding 0
An animal Feed company must produce exactly 200Kg of a mixture consisting of ingridients X1 and X2. The ingridients X1 costs Rs 3/Kg and X2 costs Rs 5/Kg. Not more than 80Kg of X1 can be used and atleast 60Kg of X2 must be used. Find the minimum cost of mixture.
Nikhil Sorout: A50105410093

Experiment 1 29 July, 2013
Nikhil Sorout: A50105410093

Microsoft Excel 12.0 Answer Report
Worksheet: [Book1]Sheet1
Report Created: 7/29/2013 11:44:23 AM
Target Cell (Max)
Cell Name Original Value Final Value
$H$33 Profit 0 1360
Adjustable Cells
Cell Name Original Value Final Value
$B$28 Number of Bowls 0 24
$C$28 Number of Mugs 0 8
Constraints
Cell Name Cell Value Formula Status Slack
$G$22 Labour Usage 40 $G$22<=$F$22 Binding 0
$G$23 Clay Usage 120 $G$23<=$F$23 Binding 0

Experiment 2 29 July, 2013
Data Table
Product Bowl Mug
Profit 40 50
Resource List
Resources Bowl Mug Available Used
Labour 1 2 40 40
Clay 4 3 120 120
Number of Bowls Number of Mugs
24 8
Profit: 1360
Microsoft Excel 12.0 Answer Report
Worksheet: [Book1]Sheet1
Report Created: 7/29/2013 11:44:23 AM
Target Cell (Max)
Cell Name Original Value Final Value
$H$33 Profit 0 1360
Adjustable Cells
Cell Name Original Value Final Value
$B$28 Number of Bowls 0 24
$C$28 Number of Mugs 0 8
Constraints
Cell Name Cell Value Formula Status Slack
$G$22 Labour Usage 40 $G$22<=$F$22 Binding 0
$G$23 Clay Usage 120 $G$23<=$F$23 Binding 0
Optimized Production Plan
A company makes bowls and mugs from clay. The profit earned in making cups and bowls is Rs40 & Rs50 repectively. Making a cup requires 1 labour and 4 pounds of clay while making a mug requires 2 albours and 3 pounds of clay. 40 Labour and 120 pounds of clay are available per day. Formulate an LPP to maximize the profit.
Nikhil Sorout: A50105410093

Microsoft Excel 14.0 Answer Report
Worksheet: [12 November.xlsx]August 5 (I)
Report Created: 12-11-2013 20:22:34
Result: Solver found a solution. All Constraints and optimality conditions are satisfied.
Solver Engine
Solver Options
Objective Cell (Min)
Cell Name Original Value Final Value
$B$25 Total Cost (Rs.) Contractor 1 0 4900
Variable Cells
Cell Name Original Value Final Value Integer
$B$19:$E$22
Constraints
Cell Name Cell Value Formula Status Slack
$F$19:$F$22 = 1
$B$23:$E$23 = 1

Experiment 3 5 August, 2013
Bid Matrix
. Contractor 1 Contractor 2 Contractor 3 Contractor 4
Assembly 1 15 13 14 17
Assembly 2 11 12 15 13
Assembly 3 13 12 10 11
Assembly 4 15 17 14 16
. Contractor 1 Contractor 2 Contractor 3 Contractor 4 Row Sum
Assembly 1 0 1 0 0 1
Assembly 2 1 0 0 0 1
Assembly 3 0 0 0 1 1
Assembly 4 0 0 1 0 1
Column Sum 1 1 1 1
Total Cost (Rs.) 4900
Constraints
$B$23:$E$23 = 1
Assignment Matrix
A machine tool company decides to make 4 sub-assemblies through 4 sub-contractors. Each contractor is to receive only 1 sub-assembly. The cost of each sub-assembly is determined by the bids submitted by each contractor and is shown in the table in 100s' of Rs. Assign the assemblies to minimise the cost.
Nikhil Sorout: A50105410093

Experiment 3 5 August, 2013
Microsoft Excel 14.0 Answer Report
Worksheet: [12 November.xlsx]August 5 (I)
Report Created: 12-11-2013 20:22:34
Solver Engine
Engine: Simplex LP
Solution Time: 0.016 Seconds.
Iterations: 7 Subproblems: 0
Solver Options
Max Time 100 sec, Iterations 100, Precision 0.000001
Objective Cell (Min)
Cell Name Original ValueFinal Value
$B$25 Total Cost (Rs.) Contractor 1 0 4900
Variable Cells
Cell Name Original ValueFinal Value Integer
$B$19:$E$22
$B$19 Assembly 1 Contractor 1 0 0 Contin
$C$19 Assembly 1 Contractor 2 0 1 Contin
$D$19 Assembly 1 Contractor 3 0 0 Contin
$E$19 Assembly 1 Contractor 4 0 0 Contin
$B$20 Assembly 2 Contractor 1 0 1 Contin
$C$20 Assembly 2 Contractor 2 0 0 Contin
$D$20 Assembly 2 Contractor 3 0 0 Contin
$E$20 Assembly 2 Contractor 4 0 0 Contin
$B$21 Assembly 3 Contractor 1 0 0 Contin
$C$21 Assembly 3 Contractor 2 0 0 Contin
$D$21 Assembly 3 Contractor 3 0 0 Contin
$E$21 Assembly 3 Contractor 4 0 1 Contin
$B$22 Assembly 4 Contractor 1 0 0 Contin
$C$22 Assembly 4 Contractor 2 0 0 Contin
$D$22 Assembly 4 Contractor 3 0 1 Contin
$E$22 Assembly 4 Contractor 4 0 0 Contin
Constraints
Cell Name Cell Value Formula Status Slack
$F$19:$F$22 = 1
$F$19 Assembly 1 Row Sum 1 $F$19=1 Binding 0
$F$20 Assembly 2 Row Sum 1 $F$20=1 Binding 0
$F$21 Assembly 3 Row Sum 1 $F$21=1 Binding 0
$F$22 Assembly 4 Row Sum 1 $F$22=1 Binding 0
$B$23:$E$23 = 1
Result: Solver found a solution. All Constraints and optimality conditions are satisfied.
Max Subproblems Unlimited, Max Integer Sols Unlimited, Integer Tolerance 5%, Solve
Without Integer Constraints, Assume NonNegative
Nikhil Sorout: A50105410093

Microsoft Excel 15.0 Answer Report
Worksheet: [12 November.xlsx]Machine Assignment Problem
Report Created: 11/14/2013 5:31:02 PM
Result: Solver found a solution. All Constraints and optimality conditions are satisfied.
Solver Engine
Engine: Simplex LP
Solution Time: 0.047 Seconds.
Iterations: 17 Subproblems: 0
Solver Options
Max Time 100 sec, Iterations 100, Precision 0.000001
Max Subproblems Unlimited, Max Integer Sols Unlimited, Integer Tolerance 5%, Solve Without Integer Constraints, Assume NonNegative
Objective Cell (Max)
Cell Name Original Value Final Value
$C$27 Total Profit Job 2 50 50
Variable Cells
Cell Name Original Value Final Value Integer
$B$19 Machine 1 Job 1 0 0 Contin
$C$19 Machine 1 Job 2 0 0 Contin
$D$19 Machine 1 Job 3 1 1 Contin
$E$19 Machine 1 Job 4 0 0 Contin
$F$19 Machine 1 Job 5 0 0 Contin
$B$20 Machine 2 Job 1 0 0 Contin
$C$20 Machine 2 Job 2 0 0 Contin
$D$20 Machine 2 Job 3 0 0 Contin
$E$20 Machine 2 Job 4 0 0 Contin
$F$20 Machine 2 Job 5 1 1 Contin
$B$21 Machine 3 Job 1 0 0 Contin
$C$21 Machine 3 Job 2 0 0 Contin
$D$21 Machine 3 Job 3 0 0 Contin
$E$21 Machine 3 Job 4 1 1 Contin
$F$21 Machine 3 Job 5 0 0 Contin
$B$22 Machine 4 Job 1 0 0 Contin
$C$22 Machine 4 Job 2 1 1 Contin
$D$22 Machine 4 Job 3 0 0 Contin
$E$22 Machine 4 Job 4 0 0 Contin
$F$22 Machine 4 Job 5 0 0 Contin
$B$23 Machine 5 Job 1 1 1 Contin
$C$23 Machine 5 Job 2 0 0 Contin
$D$23 Machine 5 Job 3 0 0 Contin
$E$23 Machine 5 Job 4 0 0 Contin
$F$23 Machine 5 Job 5 0 0 Contin

Constraints
Cell Name Cell Value Formula Status Slack
$G$19 Machine 1 Row Sum 1 $G$19=1 Binding 0
$G$20 Machine 2 Row Sum 1 $G$20=1 Binding 0
$G$21 Machine 3 Row Sum 1 $G$21=1 Binding 0
$G$22 Machine 4 Row Sum 1 $G$22=1 Binding 0
$G$23 Machine 5 Row Sum 1 $G$23=1 Binding 0
$B$24 Column Sum Job 1 1 $B$24=1 Binding 0
$C$24 Column Sum Job 2 1 $C$24=1 Binding 0
$D$24 Column Sum Job 3 1 $D$24=1 Binding 0
$E$24 Column Sum Job 4 1 $E$24=1 Binding 0
$F$24 Column Sum Job 5 1 $F$24=1 Binding 0

Max Subproblems Unlimited, Max Integer Sols Unlimited, Integer Tolerance 5%, Solve Without Integer Constraints, Assume NonNegative

Experiment 4
Profit Matrix
. Job 1 Job 2 Job 3 Job 4 Job 5
Machine 1 5 11 10 12 4
Machine 2 2 4 6 3 5
Machine 3 3 12 5 14 6
Machine 4 6 14 4 11 7
Machine 5 7 9 8 12 5
. Job 1 Job 2 Job 3 Job 4 Job 5 Row Sum
Machine 1 0 0 1 0 0 1
Machine 2 0 0 0 0 1 1
Machine 3 0 0 0 1 0 1
Machine 4 0 1 0 0 0 1
Machine 5 1 0 0 0 0 1
Column Sum 1 1 1 1 1
Total Profit 50
Microsoft Excel 15.0 Answer Report
Worksheet: [12 November.xlsx]Machine Assignment Problem
Report Created: 11/14/2013 5:31:02 PM
Result: Solver found a solution. All Constraints and optimality conditions are satisfied.
Solver Engine
Engine: Simplex LP
Solution Time: 0.047 Seconds.
Iterations: 17 Subproblems: 0
Solver Options
Max Time 100 sec, Iterations 100, Precision 0.000001
Objective Cell (Max)
Cell Name Original Value Final Value
$C$27 Total Profit Job 2 50 50
Assignment Matrix
Max Subproblems Unlimited, Max Integer Sols Unlimited, Integer Tolerance 5%, Solve
Without Integer Constraints, Assume NonNegative
A company has 5 jobs to be done. The following matrix shows the return in rupees of assigning Ith machine to Jth job. Assign the 5 Jobs to 5 machines so as to maximize the total expected profit.
Nikhil Sorout: A50105410093

Experiment 4
Variable Cells
Cell Name Original Value Final Value Integer
$B$19 Machine 1 Job 1 0 0 Contin
$C$19 Machine 1 Job 2 0 0 Contin
$D$19 Machine 1 Job 3 1 1 Contin
$E$19 Machine 1 Job 4 0 0 Contin
$F$19 Machine 1 Job 5 0 0 Contin
$B$20 Machine 2 Job 1 0 0 Contin
$C$20 Machine 2 Job 2 0 0 Contin
$D$20 Machine 2 Job 3 0 0 Contin
$E$20 Machine 2 Job 4 0 0 Contin
$F$20 Machine 2 Job 5 1 1 Contin
$B$21 Machine 3 Job 1 0 0 Contin
$C$21 Machine 3 Job 2 0 0 Contin
$D$21 Machine 3 Job 3 0 0 Contin
$E$21 Machine 3 Job 4 1 1 Contin
$F$21 Machine 3 Job 5 0 0 Contin
$B$22 Machine 4 Job 1 0 0 Contin
$C$22 Machine 4 Job 2 1 1 Contin
$D$22 Machine 4 Job 3 0 0 Contin
$E$22 Machine 4 Job 4 0 0 Contin
$F$22 Machine 4 Job 5 0 0 Contin
$B$23 Machine 5 Job 1 1 1 Contin
$C$23 Machine 5 Job 2 0 0 Contin
$D$23 Machine 5 Job 3 0 0 Contin
$E$23 Machine 5 Job 4 0 0 Contin
$F$23 Machine 5 Job 5 0 0 Contin
Constraints
Cell Name Cell Value Formula Status Slack
$G$19 Machine 1 Row Sum 1 $G$19=1 Binding 0
$G$20 Machine 2 Row Sum 1 $G$20=1 Binding 0
$G$21 Machine 3 Row Sum 1 $G$21=1 Binding 0
$G$22 Machine 4 Row Sum 1 $G$22=1 Binding 0
$G$23 Machine 5 Row Sum 1 $G$23=1 Binding 0
$B$24 Column Sum Job 1 1 $B$24=1 Binding 0
$C$24 Column Sum Job 2 1 $C$24=1 Binding 0
$D$24 Column Sum Job 3 1 $D$24=1 Binding 0
$E$24 Column Sum Job 4 1 $E$24=1 Binding 0
$F$24 Column Sum Job 5 1 $F$24=1 Binding 0
Nikhil Sorout: A50105410093

Experiment 4
machine
Nikhil Sorout: A50105410093
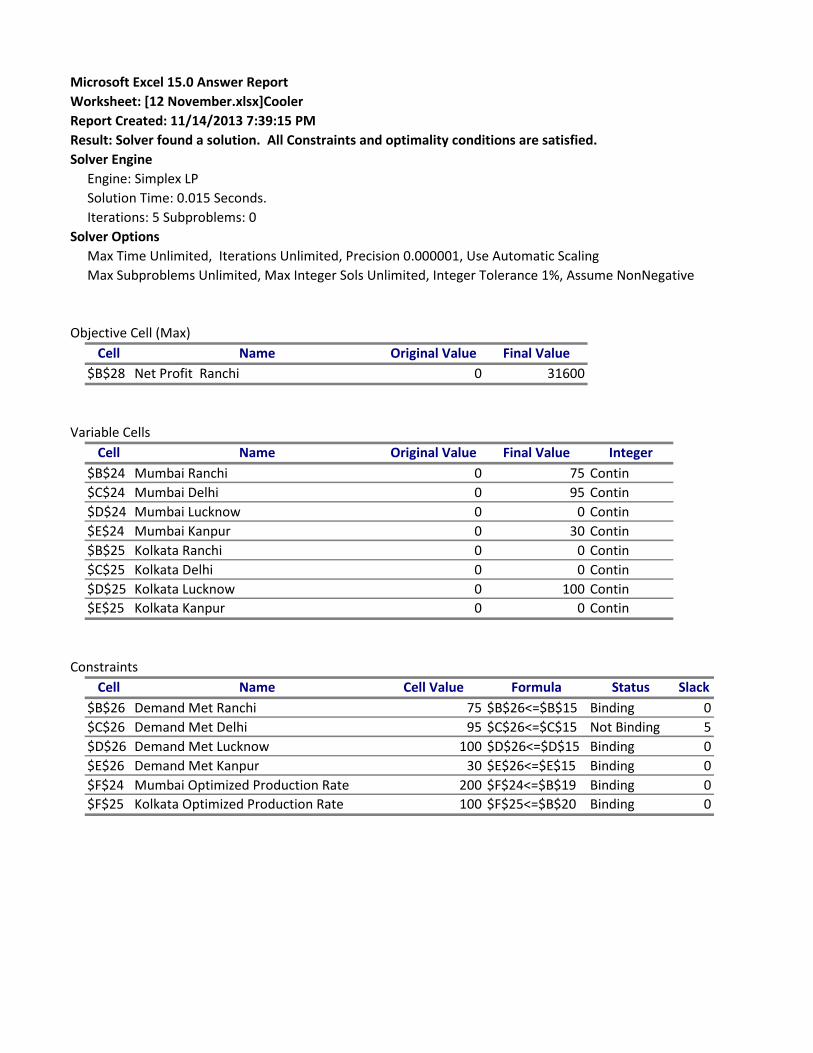
Microsoft Excel 15.0 Answer Report
Worksheet: [12 November.xlsx]Cooler
Report Created: 11/14/2013 7:39:15 PM
Result: Solver found a solution. All Constraints and optimality conditions are satisfied.
Solver Engine
Engine: Simplex LP
Solution Time: 0.015 Seconds.
Iterations: 5 Subproblems: 0
Solver Options
Max Time Unlimited, Iterations Unlimited, Precision 0.000001, Use Automatic Scaling
Max Subproblems Unlimited, Max Integer Sols Unlimited, Integer Tolerance 1%, Assume NonNegative
Objective Cell (Max)
Cell Name Original Value Final Value
$B$28 Net Profit Ranchi 0 31600
Variable Cells
Cell Name Original Value Final Value Integer
$B$24 Mumbai Ranchi 0 75 Contin
$C$24 Mumbai Delhi 0 95 Contin
$D$24 Mumbai Lucknow 0 0 Contin
$E$24 Mumbai Kanpur 0 30 Contin
$B$25 Kolkata Ranchi 0 0 Contin
$C$25 Kolkata Delhi 0 0 Contin
$D$25 Kolkata Lucknow 0 100 Contin
$E$25 Kolkata Kanpur 0 0 Contin
Constraints
Cell Name Cell Value Formula Status Slack
$B$26 Demand Met Ranchi 75 $B$26<=$B$15 Binding 0
$C$26 Demand Met Delhi 95 $C$26<=$C$15 Not Binding 5
$D$26 Demand Met Lucknow 100 $D$26<=$D$15 Binding 0
$E$26 Demand Met Kanpur 30 $E$26<=$E$15 Binding 0
$F$24 Mumbai Optimized Production Rate 200 $F$24<=$B$19 Binding 0
$F$25 Kolkata Optimized Production Rate 100 $F$25<=$B$20 Binding 0

Experiment 6
Profit Matrix
. Ranchi Delhi Lucknow Kanpur
Mumbai 90 90 100 110
Kolkata 50 70 130 85
. Ranchi Delhi Lucknow Kanpur
Demand 75 100 100 30
Plant Capacity
Mumbai 200
Kolkata 100
. Ranchi Delhi Lucknow Kanpur Optimized Production Rate
Mumbai 75 95 0 30 200
Kolkata 0 0 100 0 100
Demand Met 75 95 100 30
Net Profit 31600
$B$26
$C$26
$D$26
$E$26
$F$24
$F$25
Demand Matrix
Production Allotment
Capacity Chart
A company manufacturing air collers has 2 plants located at Mumbai and Kolkata with a capacity of 200 & 100 units per week. The company has to supply the coolers to its' 4 showrooms located at Ranchi, Delhi, Lucknow and Kanpur which have a maximum demand of 75; 100; 100 & 30 units respectively. Due to variations in material and transportation cost the profit per unit differs and is given in the table. Plan the production in order to maximize the profit. The plants can be run undercapacity.
Nikhil Sorout: A50105410093

Experiment 6
Microsoft Excel 15.0 Answer Report
Worksheet: [12 November.xlsx]Cooler
Report Created: 11/14/2013 7:39:15 PM
Result: Solver found a solution. All Constraints and optimality conditions are satisfied.
Solver Engine
Engine: Simplex LP
Solution Time: 0.015 Seconds.
Iterations: 5 Subproblems: 0
Solver Options
Max Time Unlimited, Iterations Unlimited, Precision 0.000001, Use Automatic Scaling
Objective Cell (Max)
Cell Name Original ValueFinal Value
$B$28 Net Profit Ranchi 0 31600
Variable Cells
Cell Name Original ValueFinal Value Integer
$B$24 Mumbai Ranchi 0 75 Contin
$C$24 Mumbai Delhi 0 95 Contin
$D$24 Mumbai Lucknow 0 0 Contin
$E$24 Mumbai Kanpur 0 30 Contin
$B$25 Kolkata Ranchi 0 0 Contin
$C$25 Kolkata Delhi 0 0 Contin
$D$25 Kolkata Lucknow 0 100 Contin
$E$25 Kolkata Kanpur 0 0 Contin
Constraints
Cell Name Cell Value Formula Status Slack
$B$26 Demand Met Ranchi 75 $B$26<=$B$15Binding 0
$C$26 Demand Met Delhi 95 $C$26<=$C$15Not Binding 5
$D$26 Demand Met Lucknow 100 $D$26<=$D$15Binding 0
$E$26 Demand Met Kanpur 30 $E$26<=$E$15Binding 0
$F$24 Mumbai Optimized Production Rate 200 $F$24<=$B$19Binding 0
$F$25 Kolkata Optimized Production Rate 100 $F$25<=$B$20Binding 0
Max Subproblems Unlimited, Max Integer Sols Unlimited, Integer Tolerance 1%, Assume Non-
Negative
company manufacturing air collers has 2 plants located at Mumbai and Kolkata with a capacity of 200 & 100
Nikhil Sorout: A50105410093

Microsoft Excel 12.0 Answer Report
Worksheet: [12 November.xlsx]Car Rental
Report Created: 11/13/2013 3:50:57 PM
Target Cell (Min)
Cell Name Original Value Final Value
$B$27 Total Cost 1 185 185
Adjustable Cells
Cell Name Original Value Final Value
$B$19 1 0 0
$C$19 2 0 0
$D$19 3 0 0
$E$19 4 0 0
$F$19 5 1 1
$G$19 6 0 0
$B$20 1 0 0
$C$20 2 1 1
$D$20 3 0 0
$E$20 4 0 0
$F$20 5 0 0
$G$20 6 0 0
$B$21 1 1 1
$C$21 2 0 0
$D$21 3 0 0
$E$21 4 0 0
$F$21 5 0 0
$G$21 6 0 0
$B$22 1 0 0
$C$22 2 0 0
$D$22 3 1 1
$E$22 4 0 0
$F$22 5 0 0
$G$22 6 0 0
$B$23 1 0 0
$C$23 2 0 0
$D$23 3 0 0
$E$23 4 1 1
$F$23 5 0 0
$G$23 6 0 0
$B$24 1 0 0
$C$24 2 0 0
$D$24 3 0 0
$E$24 4 0 0

$F$24 5 0 0
$G$24 6 1 1
Constraints
Cell Name Cell Value Formula Status Slack
$H$19 Row Sum 1 $H$19=1 Not Binding 0
$H$20 Row Sum 1 $H$20=1 Not Binding 0
$H$21 Row Sum 1 $H$21=1 Not Binding 0
$H$22 Row Sum 1 $H$22=1 Not Binding 0
$H$23 Row Sum 1 $H$23=1 Not Binding 0
$H$24 Row Sum 1 $H$24=1 Not Binding 0
$B$25 Column Sum 1 1 $B$25=1 Not Binding 0
$C$25 Column Sum 2 1 $C$25=1 Not Binding 0
$D$25 Column Sum 3 1 $D$25=1 Not Binding 0
$E$25 Column Sum 4 1 $E$25=1 Not Binding 0
$F$25 Column Sum 5 1 $F$25=1 Not Binding 0
$G$25 Column Sum 6 1 $G$25=1 Not Binding 0

Transportation cost chart
Cities 1 2 3 4 5 6
7 41 72 39 52 25 51
8 22 29 49 65 81 50
9 27 39 60 51 32 32
10 45 50 48 52 37 43
11 29 40 39 26 30 33
12 32 40 40 60 51 30
Cities 1 2 3 4 5 6 Row Sum
7 0 0 0 0 1 0 1
8 0 1 0 0 0 0 1
9 1 0 0 0 0 0 1
10 0 0 1 0 0 0 1
11 0 0 0 1 0 0 1
12 0 0 0 0 0 1 1
Column Sum 1 1 1 1 1 1
Total Cost 185
Microsoft Excel 12.0 Answer Report
Worksheet: [12 November.xlsx]Car Rental
Report Created: 11/13/2013 3:50:57 PM
Target Cell (Min)
Cell Name Original ValueFinal Value
$B$27 Total Cost 1 185 185
Adjustable Cells
Cell Name Original ValueFinal Value
$B$19 1 0 0
$C$19 2 0 0
$D$19 3 0 0
$E$19 4 0 0
$F$19 5 1 1
$G$19 6 0 0
$B$20 1 0 0
Assignment Matrix
A national car rental service has surplus of cars in cities (1-6) and a deficiency of 1 car in cities (7-12). The distance between the two cities is given below. Assign the travel route so as to minimize the transportation cost.
Nikhil Sorout: A50105410093

$C$20 2 1 1
$D$20 3 0 0
$E$20 4 0 0
$F$20 5 0 0
$G$20 6 0 0
$B$21 1 1 1
$C$21 2 0 0
$D$21 3 0 0
$E$21 4 0 0
$F$21 5 0 0
$G$21 6 0 0
$B$22 1 0 0
$C$22 2 0 0
$D$22 3 1 1
$E$22 4 0 0
$F$22 5 0 0
$G$22 6 0 0
$B$23 1 0 0
$C$23 2 0 0
$D$23 3 0 0
$E$23 4 1 1
$F$23 5 0 0
$G$23 6 0 0
$B$24 1 0 0
$C$24 2 0 0
$D$24 3 0 0
$E$24 4 0 0
$F$24 5 0 0
$G$24 6 1 1
Constraints
Cell Name Cell Value Formula Status Slack
$H$19 Row Sum 1 $H$19=1 Not Binding 0
$H$20 Row Sum 1 $H$20=1 Not Binding 0
$H$21 Row Sum 1 $H$21=1 Not Binding 0
$H$22 Row Sum 1 $H$22=1 Not Binding 0
$H$23 Row Sum 1 $H$23=1 Not Binding 0
$H$24 Row Sum 1 $H$24=1 Not Binding 0
$B$25 Column Sum 1 1 $B$25=1 Not Binding 0
$C$25 Column Sum 2 1 $C$25=1 Not Binding 0
$D$25 Column Sum 3 1 $D$25=1 Not Binding 0
$E$25 Column Sum 4 1 $E$25=1 Not Binding 0
$F$25 Column Sum 5 1 $F$25=1 Not Binding 0
$G$25 Column Sum 6 1 $G$25=1 Not Binding 0
Nikhil Sorout: A50105410093

Nikhil Sorout: A50105410093

Not a part of practical file
Machine Product 1 Product 2 Product 3Machine
Capacity
Total minutes
utilized
M1 2 3 2 440 440
M2 4 0 3 470 470
M3 2 5 0 430 211.1111111
Profit/Unit
(Rs)4 3 6
Product P1 P2 P3
Number 0 42.2222222 156.666667
Profit 0 126.666667 940
Total Profit 1066.66667
Time/Unit (minutes)
A firm produces 3 Products which are being processed on 3 different machines. The time required to manufacture 1 unit of each of the 3 products and the daily capacity of the 3 machines are given in the table. It is required to determine the daily no of units to be manufactured for each product. The profit per unit for products are Rs 4,3,6 respectively. It's assumed that all the amounts produced are consumed in the market. Formulate L.P.P to maximize the daily profit and solve it using in-built solver.
Nikhil Sorout: A50105410093

Not a part of practical file
Nikhil Sorout: A50105410093