Embed Size (px)
Citation preview
Mass Transfer Evolution in a Reactive Sprayduring Carbon Dioxide Capture
In view of global warming, improvement of CO2 capture efficiency in addition tocarbon valorization has become a major concern. In the last decade, post-combus-tion capture using amines evolved as one of the most mature technologies forindustrial applications. The understanding of mass transfer phenomena is still achallenge for enhancing the absorption step. The mass transfer in a spray columnduring CO2 absorption using monoethanolamine as a solvent was characterized.An innovative optical technique called global rainbow technology as a non-intru-sive approach to investigate mass transfer is used to measure the amount of CO2
absorbed in a cloud of droplets in the spray. The CO2 absorbed flux obtained fromexperiments is compared to a basic mass transfer model simulated on ComsolMultyphysics�.
Keywords: Carbon dioxide capture, Gas absorption, Global rainbow technique,Mass transfer, Monoethanolamine
Received: November 12, 2014; revised: February 02, 2015; accepted: April 20, 2015
DOI: 10.1002/ceat.201400651
1 Introduction
Fossil fuels are still the most important energy sources, andthe burning of carbon derivatives produces flue gases thatcontain carbon dioxide (CO2). CO2 is the major source ofthe greenhouse gases (GHG) believed to cause global warm-ing and represents 76.7 % of GHG [1]. Power plants usingfossil fuels produce approximately one third of global CO2
emissions. Post-combustion capture (PCC) in general andthe amine-based process in particular are the most techno-logically mature options to reduce CO2 from existing powerplants. Aqueous solutions of alkanolamines are widely usedas solvents to capture acid gases such as CO2 from flue gas[2]. Khol and Nielsen [3] provided a comprehensive sum-mary of amine-based capture.
Monoethanolamine (MEA) has a high reaction rate with acidgas and its ability to remove even traces of CO2 has made thischemical absorption one of the most promising technologies[4]. Many authors evaluated the sustainability of CO2 captureby MEA from incinerator flue gas using packed columns [5, 6].It is clear that a significant improvement in the separation stepis required, with high efficiency, compactness, and operational-ly flexible contactors. So far, little attention is given to spraycolumns for CO2 capture. The main advantages of this type of
contactors are to optimize the exchange area between the twophases and significantly reduce the pressure drop for the gas.Spray columns also offer a very basic operation and equipmentcompared to packed columns, with no limits due to flooding orexcessive foaming in the column. These contactors are widelyapplied for SO2 capture and have been studied in terms of cap-ture efficiency with various solvents such as sodium hydroxide,ammonia, and amines [7–12].
An optical and non-intrusive technique, namely, the globalrainbow technique (GRT), is applied to measure mass transferevolution along a spray column at different heights. This tech-nique is based on measuring the refractive index of the drop-lets. During CO2 capture, the concentration inside the dropletsin a spray changes, leading to a density evolution and thus, arefractive index evolution. The density of the droplets duringthe chemical absorption depends on temperature and concen-tration of absorbed CO2. Therefore, the determination of therefractive index of droplets by GRT is a measurement of theCO2 absorption extent. In addition to GRT, phase Doppler ane-mometry (PDA) is used to characterize size and velocity distri-butions in the spray.
2 Mass Transfer Theory
The reaction between CO2 and MEA (RNH2) has been de-scribed in many studies. According to Satori and Savage [13],the carbamate formation is considered to be the main reactionbetween CO2 and MEA. The reversible reaction is neglecteddue to the temperature of the measurement volume in thisstudy.
Chem. Eng. Technol. 2015, 38, No. 00, 1–12 ª 2015 WILEY-VCH Verlag GmbH & Co. KGaA, Weinheim www.cet-journal.com
Maria Ouboukhlik1,2
Gilles Godard2
Sawitree Saengkaew2
Marie-Christine Fournier-
Salaun1
Lionel Estel1
Gerard Grehan2
1Normandie Universite, LSPC-EA4704, Saint Etienne du Rouvray,France.
2Normandie Universite,CORIA-UMR 6614, SaintEtienne du Rouvray, France.
Supporting Informationavailable online
–Correspondence: Maria Ouboukhlik ([email protected]), Normandie Universite, LSPC-EA 4704, 76800 Saint Etiennedu Rouvray, France.
Research Article 1
These are not the final page numbers! ((

The reaction with a rate constant k1) can beexpressed as follows:
CO2 þ 2RNH2 fik
RNH3þ þ RNHCOO� (1)
Regarding the reaction rate dependence, thereaction kinetic is known to be first order withrespect to both reactants CO2 and MEA [14].
The reaction rate is expressed as follows:
r ¼ k ½CO2� ½MEA� (2)
To predict the mass transfer during CO2 captureby MEA droplets, mass transfer parameters arerequired. In this study, the values of rate constant kare obtained at different temperatures with the cor-relation provided by Hikita et al. [15]. The CO2 dif-fusion coefficient in aqueous MEA solution is takenfrom Versteeg and Van Swaaij [16] as a function oftemperature while the MEA diffusion coefficient isreported in [17]. Finally, CO2 solubility is expressedwith Henry’s constant as studied by Versteeg andVan Swaaij [16] and correlated with temperatureby Maceiras et al. [18].
3 Mass Transfer Prediction
In a spray column, the droplets generated by anultrasonic nozzle can be modeled as a sphericaldroplet with a diameter corresponding to the mean diameter ofthe spray. This is possible if there is no droplet coalescence ordistortion. Thus, a perfectly axisymmetric and spherical dropletis considered in this model (Fig. 1). According to Elperin andFominykh [19], a spherical shape is observed up to a Reynoldsnumber of 300, which corresponds to a water droplet of 1 mmfalling in air. Beyond this limit, the drop oscillates and loses itssphericity.
3.1 Assumptions
The droplet is supposed isothermal and all transfer parameterspresented above are taken at a constant droplet temperature.The droplet is in contact with pure CO2 atmosphere. Further-more, the droplet is assumed rigid without internal circulation;this assumption is possible for a small diameter. Indeed, Cliftet al. [20] reported that water droplets smaller than 1 mm fall-ing in air can be considered as rigid sphere. The droplet in thismodel is assumed motionless; this assumption is verified sincethe Sherwood number of the droplet is about 3.2 leading to agas film close to 30 % of the droplet diameter. MEA and CO2
are the only reactants and have a global rate order of 2. Revers-ibility of the reaction is not taken into account because thedroplet temperature does not exceed 50 �C.
The aim of this model is to obtain the flux of CO2 absorbedinto a rigid spherical droplet. Fig. 1 displays an axisymmetricdroplet in a gas phase. The droplet is initially an aqueous solu-tion of 30 wt % MEA in a pure CO2 atmosphere. For furtherdetails refer to the Supporting Information.
3.2 Equations
The mass balance on a differential element is done in sphericalcoordinates for each species on the axisymmetric droplet:
Inlet� outlet ¼ divðDspecies� species½ �Þ�������!
¼ Dspecies¶2 species½ �
¶r2 þ 2r
¶ species½ �¶r
� �(3)
The mass production source term is linked to the kinetic ofthe reaction which is negative for CO2 and MEA.
The mass balance on CO2 and MEA using Fick’s law is then:
DCO2
¶2½CO2�¶r2 þ 2
r¶½CO2�
¶r
� �¼ k CO2½ � MEA½ � þ ¶½CO2�
¶t
(4)
DMEA¶2½MEA�
¶r2 þ 2r
¶½MEA�¶r
� �¼ 2 k CO2½ � MEA½ � þ ¶½MEA�
¶t
(5)
www.cet-journal.com ª 2015 WILEY-VCH Verlag GmbH & Co. KGaA, Weinheim Chem. Eng. Technol. 2015, 38, No. 00, 1–12
Figure 1. Illustrating sketch of the modeled droplet.
–1) List of symbols at the end of the paper.
2 Research Article
’’ These are not the final page numbers!
3.3 Boundaries and InitialConditions
At gas liquid interface, there is equilib-rium between CO2 in gas and liquidphase. The droplet is in pure CO2 at-mosphere and mass transfer resistanceis neglected. The equilibrium assump-tion can be modeled by Henry’s law ac-cording to Eq. (6). On the other hand,the MEA molecules are assumed non-volatile imposing a null flow on the gasliquid interface. Thus, boundaries con-ditions can be expressed as follows:
CO2½ �r¼R ¼ HeCO2PCO2
(6)
MEA nonvolatility is expressed withthe MEA concentration gradient at theliquid gas interface:
¶½MEA�¶r
�r¼R¼ 0 (7)
At r = 0, the continuity of concentra-tion in the axisymmetric droplet is im-posed.
Initial conditions: Originally, thedroplet is only composed of MEAmolecules mixed with water. The initialMEA concentration used in the modelis the concentration of an aqueoussolution of 30 wt % MEA, about5000 mol m–3, while there is no CO2 inthe droplet at t = 0.
½MEA�0 ¼ 5000 mol m�3 (8)
½CO2�0 ¼ 0 mol m�3 (9)
3.4 Simulation Results
Eqs. (4)–(7) are solved numerically with Comsol Multiphysics�
4.2a software. The finite element method (FEM) is used to solvethe boundary value problem in 2D axisymmetric geometry.
3.4.1 Average MEA Concentration in the Droplet
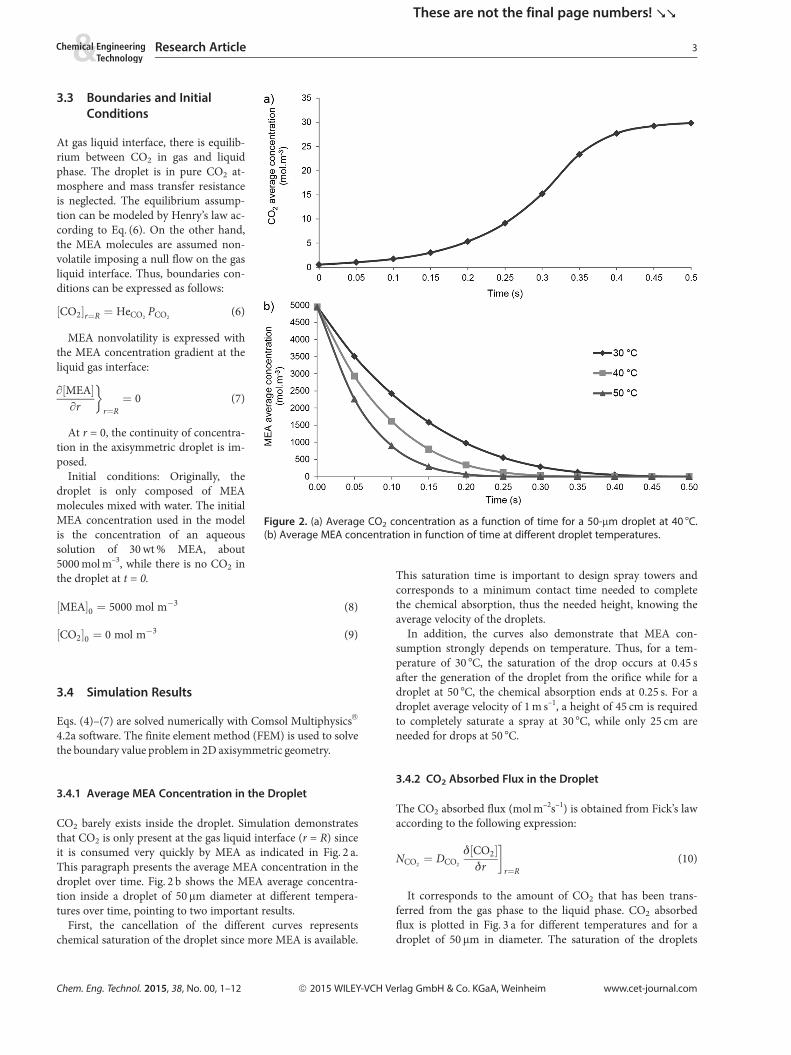
CO2 barely exists inside the droplet. Simulation demonstratesthat CO2 is only present at the gas liquid interface (r = R) sinceit is consumed very quickly by MEA as indicated in Fig. 2 a.This paragraph presents the average MEA concentration in thedroplet over time. Fig. 2 b shows the MEA average concentra-tion inside a droplet of 50 mm diameter at different tempera-tures over time, pointing to two important results.
First, the cancellation of the different curves representschemical saturation of the droplet since more MEA is available.
This saturation time is important to design spray towers andcorresponds to a minimum contact time needed to completethe chemical absorption, thus the needed height, knowing theaverage velocity of the droplets.
In addition, the curves also demonstrate that MEA con-sumption strongly depends on temperature. Thus, for a tem-perature of 30 �C, the saturation of the drop occurs at 0.45 safter the generation of the droplet from the orifice while for adroplet at 50 �C, the chemical absorption ends at 0.25 s. For adroplet average velocity of 1 m s–1, a height of 45 cm is requiredto completely saturate a spray at 30 �C, while only 25 cm areneeded for drops at 50 �C.
3.4.2 CO2 Absorbed Flux in the Droplet
The CO2 absorbed flux (mol m–2s–1) is obtained from Fick’s lawaccording to the following expression:
NCO2¼ DCO2
d½CO2�dr
�r¼R
(10)
It corresponds to the amount of CO2 that has been trans-ferred from the gas phase to the liquid phase. CO2 absorbedflux is plotted in Fig. 3 a for different temperatures and for adroplet of 50 mm in diameter. The saturation of the droplets
Chem. Eng. Technol. 2015, 38, No. 00, 1–12 ª 2015 WILEY-VCH Verlag GmbH & Co. KGaA, Weinheim www.cet-journal.com
Figure 2. (a) Average CO2 concentration as a function of time for a 50-mm droplet at 40 �C.(b) Average MEA concentration in function of time at different droplet temperatures.
Research Article 3
These are not the final page numbers! ((
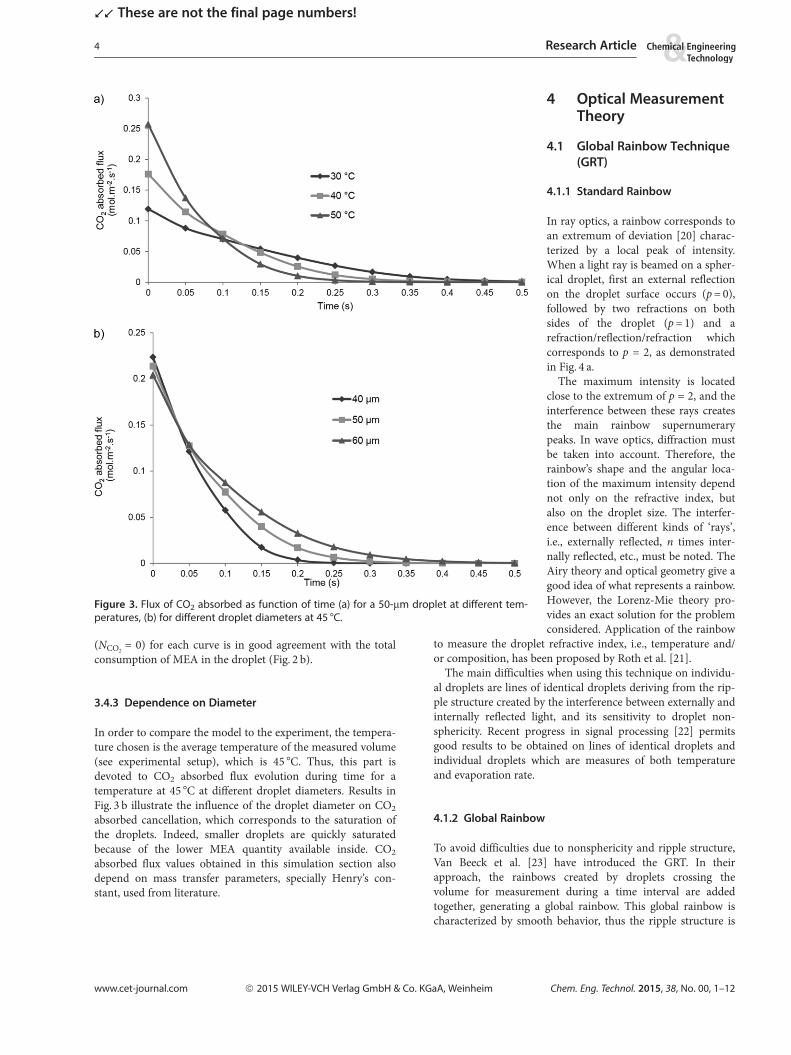
(NCO2= 0) for each curve is in good agreement with the total
consumption of MEA in the droplet (Fig. 2 b).
3.4.3 Dependence on Diameter
In order to compare the model to the experiment, the tempera-ture chosen is the average temperature of the measured volume(see experimental setup), which is 45 �C. Thus, this part isdevoted to CO2 absorbed flux evolution during time for atemperature at 45 �C at different droplet diameters. Results inFig. 3 b illustrate the influence of the droplet diameter on CO2
absorbed cancellation, which corresponds to the saturation ofthe droplets. Indeed, smaller droplets are quickly saturatedbecause of the lower MEA quantity available inside. CO2
absorbed flux values obtained in this simulation section alsodepend on mass transfer parameters, specially Henry’s con-stant, used from literature.
4 Optical MeasurementTheory
4.1 Global Rainbow Technique(GRT)
4.1.1 Standard Rainbow
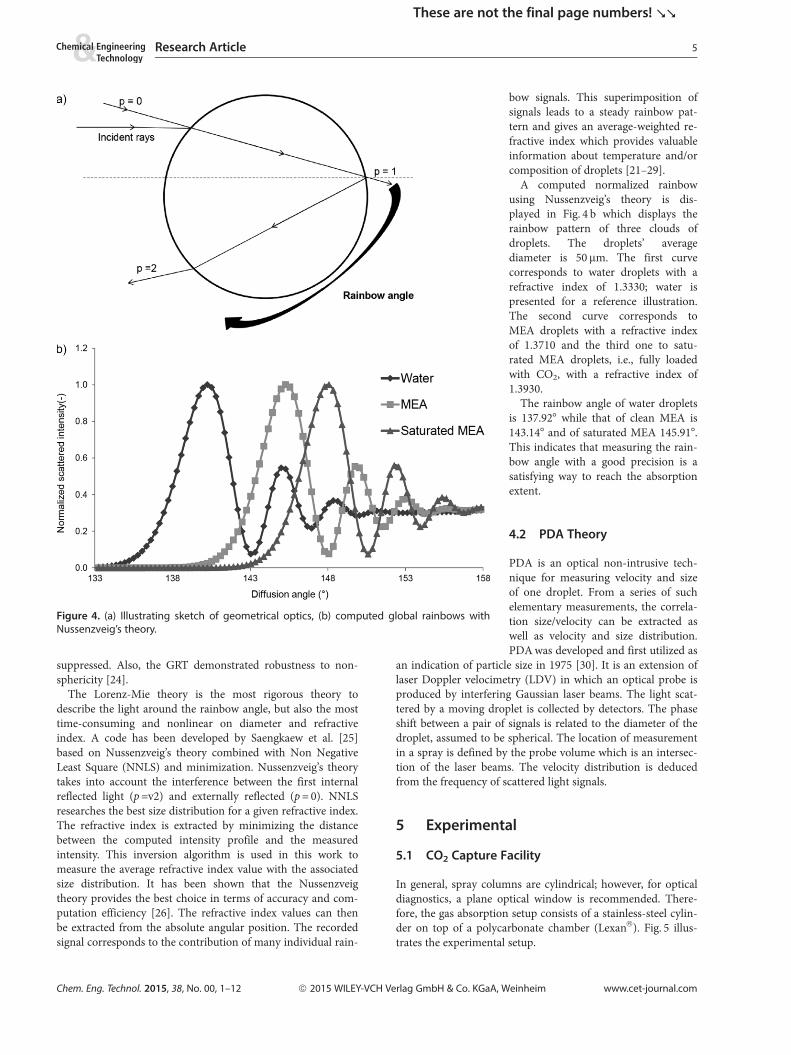
In ray optics, a rainbow corresponds toan extremum of deviation [20] charac-terized by a local peak of intensity.When a light ray is beamed on a spher-ical droplet, first an external reflectionon the droplet surface occurs (p = 0),followed by two refractions on bothsides of the droplet (p = 1) and arefraction/reflection/refraction whichcorresponds to p = 2, as demonstratedin Fig. 4 a.
The maximum intensity is locatedclose to the extremum of p = 2, and theinterference between these rays createsthe main rainbow supernumerarypeaks. In wave optics, diffraction mustbe taken into account. Therefore, therainbow’s shape and the angular loca-tion of the maximum intensity dependnot only on the refractive index, butalso on the droplet size. The interfer-ence between different kinds of ‘rays’,i.e., externally reflected, n times inter-nally reflected, etc., must be noted. TheAiry theory and optical geometry give agood idea of what represents a rainbow.However, the Lorenz-Mie theory pro-vides an exact solution for the problemconsidered. Application of the rainbow
to measure the droplet refractive index, i.e., temperature and/or composition, has been proposed by Roth et al. [21].
The main difficulties when using this technique on individu-al droplets are lines of identical droplets deriving from the rip-ple structure created by the interference between externally andinternally reflected light, and its sensitivity to droplet non-sphericity. Recent progress in signal processing [22] permitsgood results to be obtained on lines of identical droplets andindividual droplets which are measures of both temperatureand evaporation rate.
4.1.2 Global Rainbow
To avoid difficulties due to nonsphericity and ripple structure,Van Beeck et al. [23] have introduced the GRT. In theirapproach, the rainbows created by droplets crossing thevolume for measurement during a time interval are addedtogether, generating a global rainbow. This global rainbow ischaracterized by smooth behavior, thus the ripple structure is
www.cet-journal.com ª 2015 WILEY-VCH Verlag GmbH & Co. KGaA, Weinheim Chem. Eng. Technol. 2015, 38, No. 00, 1–12
Figure 3. Flux of CO2 absorbed as function of time (a) for a 50-mm droplet at different tem-peratures, (b) for different droplet diameters at 45 �C.
4 Research Article
’’ These are not the final page numbers!
suppressed. Also, the GRT demonstrated robustness to non-sphericity [24].
The Lorenz-Mie theory is the most rigorous theory todescribe the light around the rainbow angle, but also the mosttime-consuming and nonlinear on diameter and refractiveindex. A code has been developed by Saengkaew et al. [25]based on Nussenzveig’s theory combined with Non NegativeLeast Square (NNLS) and minimization. Nussenzveig’s theorytakes into account the interference between the first internalreflected light (p =v2) and externally reflected (p = 0). NNLSresearches the best size distribution for a given refractive index.The refractive index is extracted by minimizing the distancebetween the computed intensity profile and the measuredintensity. This inversion algorithm is used in this work tomeasure the average refractive index value with the associatedsize distribution. It has been shown that the Nussenzveigtheory provides the best choice in terms of accuracy and com-putation efficiency [26]. The refractive index values can thenbe extracted from the absolute angular position. The recordedsignal corresponds to the contribution of many individual rain-
bow signals. This superimposition ofsignals leads to a steady rainbow pat-tern and gives an average-weighted re-fractive index which provides valuableinformation about temperature and/orcomposition of droplets [21–29].
A computed normalized rainbowusing Nussenzveig’s theory is dis-played in Fig. 4 b which displays therainbow pattern of three clouds ofdroplets. The droplets’ averagediameter is 50 mm. The first curvecorresponds to water droplets with arefractive index of 1.3330; water ispresented for a reference illustration.The second curve corresponds toMEA droplets with a refractive indexof 1.3710 and the third one to satu-rated MEA droplets, i.e., fully loadedwith CO2, with a refractive index of1.3930.
The rainbow angle of water dropletsis 137.92� while that of clean MEA is143.14� and of saturated MEA 145.91�.This indicates that measuring the rain-bow angle with a good precision is asatisfying way to reach the absorptionextent.
4.2 PDA Theory
PDA is an optical non-intrusive tech-nique for measuring velocity and sizeof one droplet. From a series of suchelementary measurements, the correla-tion size/velocity can be extracted aswell as velocity and size distribution.PDA was developed and first utilized as
an indication of particle size in 1975 [30]. It is an extension oflaser Doppler velocimetry (LDV) in which an optical probe isproduced by interfering Gaussian laser beams. The light scat-tered by a moving droplet is collected by detectors. The phaseshift between a pair of signals is related to the diameter of thedroplet, assumed to be spherical. The location of measurementin a spray is defined by the probe volume which is an intersec-tion of the laser beams. The velocity distribution is deducedfrom the frequency of scattered light signals.
5 Experimental
5.1 CO2 Capture Facility
In general, spray columns are cylindrical; however, for opticaldiagnostics, a plane optical window is recommended. There-fore, the gas absorption setup consists of a stainless-steel cylin-der on top of a polycarbonate chamber (Lexan�). Fig. 5 illus-trates the experimental setup.
Chem. Eng. Technol. 2015, 38, No. 00, 1–12 ª 2015 WILEY-VCH Verlag GmbH & Co. KGaA, Weinheim www.cet-journal.com
Figure 4. (a) Illustrating sketch of geometrical optics, (b) computed global rainbows withNussenzveig’s theory.
Research Article 5
These are not the final page numbers! ((

The chamber is fitted with an optical window made ofglass on the front. The height of the cylinder is 30 cm andthe diameter is 18 cm. This choice of column diameter ismade to prevent wall liquid dripping. The polycarbonatechamber, made of Lexan�, is 30 cm high, 20 cm deep, and30 cm large. An ultrasonic nozzle is placed on the top of thecolumn and creates a cloud of droplets with a frequency of40 kHz. The diameter and the velocity of the droplets dependon the liquid flow rate. The ultrasonic nozzle is provided byACIL (model US630-0499G).
The ultrasonic spray nozzle is connected to a feed tankloaded with 30 wt % aqueous MEA. The feed tank is made ofstainless steel and is connected with a nitrogen bottle in orderto create a liquid flow. The pressure in-side the tank is about 2 bar for a vol-ume of 5 L. The liquid flow is con-trolled with a flow meter provided byBrooks (model 2-65B). In order to per-form measurements along the spray atdifferent heights, the top of the columnis designed to be removable, so theheight of the column can be varied.
The gas inlet is located at the bottomof both sides of the chamber. Thisbrings the gas and liquid into counter-current exchange. The gas, after CO2
absorption, is carried out through thetop of the column to an event while the
rich solution is sent to the liquid receiverlocated at the bottom of the column. Thelaser for GRT measurements is beamedthrough the optical glass window located inthe spray column and encounters the sprayperpendicularly.
5.2 Optical Setup for GRT
The optical setup is displayed in Fig. 6 andconsists of:– a continuous laser source with a wave-
length of 589 nm and power of 50 mW,provided by Shanghai Dream LasersTechnology Co. Ltd (model SDL-589-050T)
– a first collecting lens with 80 mm dia-meter and 150 mm focal length
– a second lens with 80 mm diameter and200 mm focal length
– a spatial filter with 1 mm diameter– a CCD camera from Kappa (model DX 2
HC-FW).The first collecting lens creates an image
of the control volume on a spatial filter.The spatial filter (or pinhole) is thenlocated on the image plane of the first lens.The second collecting lens generates animage of the first lens focal plane on thedetector. This optical setup with a spatial
filter allows only the light scattered by the particles located inthe control volume in the spray (1 mm3) and organized by thescattering angle to be collected.
5.3 PDA Setup
The PDA setup is provided by Dantec Dynamics� and consistsof an emitting part, a receiving part, and a signal processor.The emitting part includes a system of two 1-W diode lasers,model Genesis MX 488-1000 SLM and Genesis MX 532-1000SLM. The laser wavelengths are 488 and 532 nm. The beamcombination system is manufactured by Dantec Dynamics�. A
www.cet-journal.com ª 2015 WILEY-VCH Verlag GmbH & Co. KGaA, Weinheim Chem. Eng. Technol. 2015, 38, No. 00, 1–12
Figure 5. Process diagram of a CO2 capture facility.
Figure 6. Photo of the GRT optical bench.
6 Research Article
’’ These are not the final page numbers!

2D 85-mm fiber optic transducer (Dantec Dynamics� 60X 83)is used to create the measurement volume. The laser couplingis realized by Dantec FiberFlow optical system. The emittingfocal length is 350 mm; the beam diameter is 2.2 mm while thebeam spacing is 40 mm.
The receiving part involves a signal collecting unit located inthe forward direction at 30�. This angle has been chosen to bein the scattering mode dominated by first-order refraction. Thereceiving part consists of a 112-mm diameter Dual PDA probe.The focal length of the receiver is 310 mm. The range of meas-urable diameters for this configuration runs from about 5 to225 mm. The collected signal is transmitted by optical fibers tothe detector unit and is processed by a BSA P80 processor. Themeasurement accuracy of the velocity is about 5 % and of thesize about 10 % of the measured value.
5.4 Experimental Procedure for Mass TransferMeasurement by GRT
The experiment starts by introducing the gas phase which ispure CO2 at the desired flow rate. To make sure that the gasconcentration is uniform inside the col-umn, the solvent is sprayed after fourtimes the time needed to fill up the col-umn. Once the system reaches steadystate after injecting the spray, the laseris beamed on the volume to be mea-sured by GRT. The top of the column isadjusted for each experiment to reachthe desired height. When finishing theGRT experiment, a temperature mea-surement is made at the same volumebeamed by the laser by using a thermo-couple. This allows a correspondingtemperature with each GRT measure-ment. Tab. 1 summarizes the operatingconditions.
6 Results
6.1 Preliminary Results: Sizeand Velocity Distributionin the Spray
There are different types of nozzlesthat can generate a spray such asplain orifice nozzles, air-blast nozzles,effervescent nozzles, hydraulic nozzlesetc. A spray generated with an ultra-sonic nozzle is the most suitable formass transfer experiments because ofits low droplet density and signifi-cantly low average diameter and aver-age velocity. The low density allowsall the droplets in the spray to be incontact with the same CO2 concentra-tion. The low size and velocity distri-
bution leads to a low Reynolds number and thus an absence ofdroplet oscillation, distortion, strong internal circulation etc.
In order to compare the GRT measurement to the modelresults presented above, velocity and size distribution of thespray must be known. Therefore, PDA is used to measurethe arithmetic mean diameter and the mean velocity at dif-ferent positions of the spray. Fig. 7 demonstrates the evolu-tion of the average diameter and the average velocity alongthe spray. Results shows that the arithmetic average diameterand velocity oscillate within the PDA measurement accuracy.
Chem. Eng. Technol. 2015, 38, No. 00, 1–12 ª 2015 WILEY-VCH Verlag GmbH & Co. KGaA, Weinheim www.cet-journal.com
Table 1. Operating conditions during experiments in the col-umn.
Solvent composition [wt % MEA] 30
Gas phase Pure CO2
Pressure inside the column [kPa] 1013
Average temperature of measurement volume [�C] 45
Column height [cm] 5–25
Figure 7. Evolution of (a) arithmetic mean diameter with column height, (b) mean velocityof a droplet with column height.
Research Article 7
These are not the final page numbers! ((
6.2 Mass Transfer Measurement
In order to measure the CO2 absorbed concentration along thecolumn, four steps are required. The first step is to take rain-bow pictures at the desired height when absorption reachessteady state. The second step is devoted to optical calibration inorder to obtain from the rainbow pictures the scattered inten-sity at each diffusion angle. The third step uses an inversioncode to extract refractive index values from the scattered inten-sity/diffusion angle. Finally, the last step is to acquire from theaverage refractive index the corresponding concentration ofCO2 absorbed at a known temperature; therefore, a correlationof refractive index with temperature and CO2 absorbed con-centration is needed.
6.2.1 Rainbow Pictures
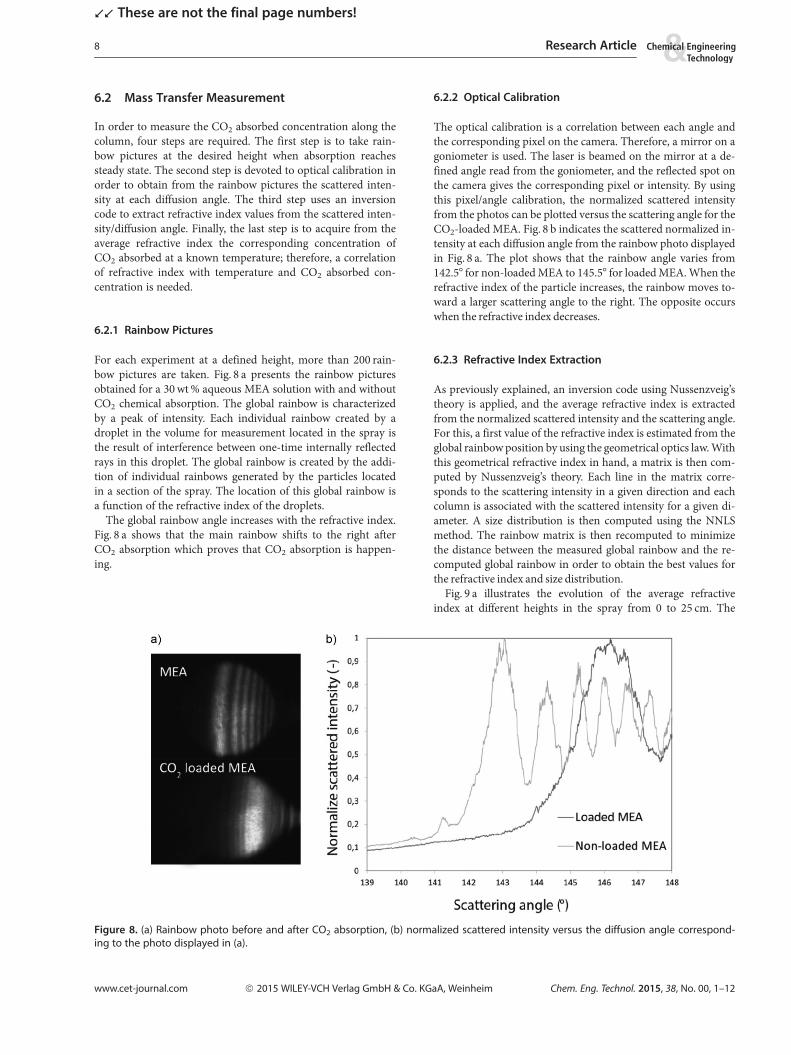
For each experiment at a defined height, more than 200 rain-bow pictures are taken. Fig. 8 a presents the rainbow picturesobtained for a 30 wt % aqueous MEA solution with and withoutCO2 chemical absorption. The global rainbow is characterizedby a peak of intensity. Each individual rainbow created by adroplet in the volume for measurement located in the spray isthe result of interference between one-time internally reflectedrays in this droplet. The global rainbow is created by the addi-tion of individual rainbows generated by the particles locatedin a section of the spray. The location of this global rainbow isa function of the refractive index of the droplets.
The global rainbow angle increases with the refractive index.Fig. 8 a shows that the main rainbow shifts to the right afterCO2 absorption which proves that CO2 absorption is happen-ing.
6.2.2 Optical Calibration
The optical calibration is a correlation between each angle andthe corresponding pixel on the camera. Therefore, a mirror on agoniometer is used. The laser is beamed on the mirror at a de-fined angle read from the goniometer, and the reflected spot onthe camera gives the corresponding pixel or intensity. By usingthis pixel/angle calibration, the normalized scattered intensityfrom the photos can be plotted versus the scattering angle for theCO2-loaded MEA. Fig. 8 b indicates the scattered normalized in-tensity at each diffusion angle from the rainbow photo displayedin Fig. 8 a. The plot shows that the rainbow angle varies from142.5� for non-loaded MEA to 145.5� for loaded MEA. When therefractive index of the particle increases, the rainbow moves to-ward a larger scattering angle to the right. The opposite occurswhen the refractive index decreases.
6.2.3 Refractive Index Extraction
As previously explained, an inversion code using Nussenzveig’stheory is applied, and the average refractive index is extractedfrom the normalized scattered intensity and the scattering angle.For this, a first value of the refractive index is estimated from theglobal rainbow position by using the geometrical optics law. Withthis geometrical refractive index in hand, a matrix is then com-puted by Nussenzveig’s theory. Each line in the matrix corre-sponds to the scattering intensity in a given direction and eachcolumn is associated with the scattered intensity for a given di-ameter. A size distribution is then computed using the NNLSmethod. The rainbow matrix is then recomputed to minimizethe distance between the measured global rainbow and the re-computed global rainbow in order to obtain the best values forthe refractive index and size distribution.
Fig. 9 a illustrates the evolution of the average refractiveindex at different heights in the spray from 0 to 25 cm. The
www.cet-journal.com ª 2015 WILEY-VCH Verlag GmbH & Co. KGaA, Weinheim Chem. Eng. Technol. 2015, 38, No. 00, 1–12
Figure 8. (a) Rainbow photo before and after CO2 absorption, (b) normalized scattered intensity versus the diffusion angle correspond-ing to the photo displayed in (a).
8 Research Article
’’ These are not the final page numbers!
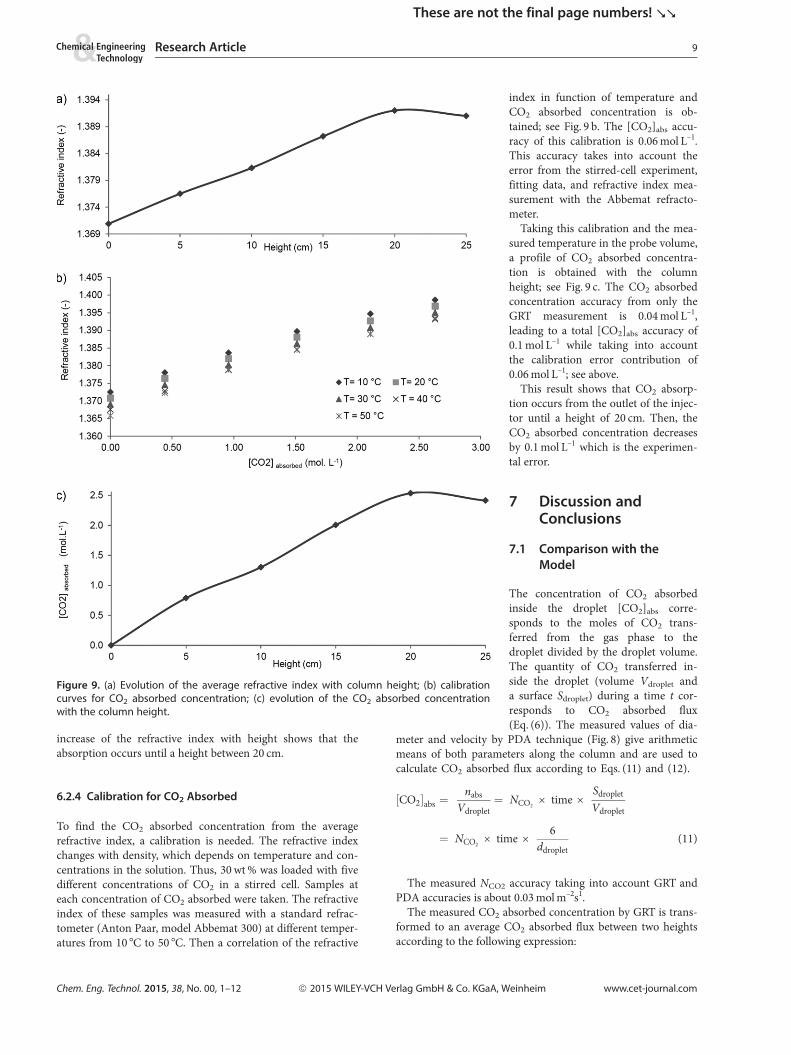
increase of the refractive index with height shows that theabsorption occurs until a height between 20 cm.
6.2.4 Calibration for CO2 Absorbed
To find the CO2 absorbed concentration from the averagerefractive index, a calibration is needed. The refractive indexchanges with density, which depends on temperature and con-centrations in the solution. Thus, 30 wt % was loaded with fivedifferent concentrations of CO2 in a stirred cell. Samples ateach concentration of CO2 absorbed were taken. The refractiveindex of these samples was measured with a standard refrac-tometer (Anton Paar, model Abbemat 300) at different temper-atures from 10 �C to 50 �C. Then a correlation of the refractive
index in function of temperature andCO2 absorbed concentration is ob-tained; see Fig. 9 b. The [CO2]abs accu-racy of this calibration is 0.06 mol L–1.This accuracy takes into account theerror from the stirred-cell experiment,fitting data, and refractive index mea-surement with the Abbemat refracto-meter.
Taking this calibration and the mea-sured temperature in the probe volume,a profile of CO2 absorbed concentra-tion is obtained with the columnheight; see Fig. 9 c. The CO2 absorbedconcentration accuracy from only theGRT measurement is 0.04 mol L–1,leading to a total [CO2]abs accuracy of0.1 mol L–1 while taking into accountthe calibration error contribution of0.06 mol L–1; see above.
This result shows that CO2 absorp-tion occurs from the outlet of the injec-tor until a height of 20 cm. Then, theCO2 absorbed concentration decreasesby 0.1 mol L–1 which is the experimen-tal error.
7 Discussion andConclusions
7.1 Comparison with theModel
The concentration of CO2 absorbedinside the droplet [CO2]abs corre-sponds to the moles of CO2 trans-ferred from the gas phase to thedroplet divided by the droplet volume.The quantity of CO2 transferred in-side the droplet (volume Vdroplet anda surface Sdroplet) during a time t cor-responds to CO2 absorbed flux(Eq. (6)). The measured values of dia-
meter and velocity by PDA technique (Fig. 8) give arithmeticmeans of both parameters along the column and are used tocalculate CO2 absorbed flux according to Eqs. (11) and (12).
CO2½ �abs ¼nabs
Vdroplet¼ NCO2
· time ·Sdroplet
Vdroplet
¼ NCO2· time ·
6ddroplet
(11)
The measured NCO2 accuracy taking into account GRT andPDA accuracies is about 0.03 mol m–2s1.
The measured CO2 absorbed concentration by GRT is trans-formed to an average CO2 absorbed flux between two heightsaccording to the following expression:
Chem. Eng. Technol. 2015, 38, No. 00, 1–12 ª 2015 WILEY-VCH Verlag GmbH & Co. KGaA, Weinheim www.cet-journal.com
Figure 9. (a) Evolution of the average refractive index with column height; (b) calibrationcurves for CO2 absorbed concentration; (c) evolution of the CO2 absorbed concentrationwith the column height.
Research Article 9
These are not the final page numbers! ((

NCO2¼ D½CO2�asborbed
Dt
Vdroplet
Sdroplet
¼ D½CO2�asborbed
DH
vdroplet Vdroplet
Sdroplet(12)
The CO2 absorbed flux is compared to the flux simulated onComsol Multiphysics� for three equivalent droplet diametersof 40, 50, and 60 mm (Fig. 10). This range of diameter corre-sponds to 50 mm ± 20 % which is larger than 10 % precision ondiameter announced by PDA measurement.
In Fig. 10, three zones can be highlighted. In the first rangeuntil 0.1 s, i.e., about 10 cm, the experimental flux is in a goodagreement with the simulated ones. Indeed, the flux at thebeginning of the experiment is higher. This is explained by theMEA diffusion which brings available MEA at the interface inorder to react with CO2.
In the second range from 0.1 to about 0.19 s, i.e., from 10 to20 cm, the experimental flux decreases as predicted by the sim-ulation. However, the experimental flux remains higher thanthe simulated one. An increase of the experimental mass fluxcan be explained by a raise of temperature inside the droplets,leading to an acceleration of mass transfer. However, this devia-tion falls within the precision of mass transfer measurement byGRT being about 0.03 mol m–2s–1 for the closest simulatedcurve at 60 mm diameter.
In the last range from 20 to about 25 cm, the cancellation ofthe experimental curve and the simulated one are in goodagreement, at about 0.2 s. This means that the absorption is fin-ished at 20 cm and saturation does not depend on the dropletdiameter. However, the experimental flux becomes negative at0.21 s. A negative mass transfer could be due to CO2 desorption
while this phenomenon is not taken into account in the model,but the deviation also falls within the precision of mass transfermeasurement by GRT.
8 Conclusions
CO2 absorbed flux during CO2 capture was successfully mea-sured by the global rainbow technique which is its first applica-tion for transient mass transfer evolution in a chemical absorp-tion. This measured flux was compared to a basic mass transfermodel for three equivalent droplet diameters, namely, 40, 50,and 60mm. GRT mass transfer measurement indicated that theCO2 absorbed flux is higher at the beginning of the absorptionaccording to the simulation. In the middle of the absorption,the experimental flux is higher than the computed one, but thedeviation mostly falls within with the GRT measurement accu-racy of about 30 % for the 60-mm droplet diameter flux. At theend of the absorption experiment, the droplets’ saturation timeor height agreed well with the simulation.
Acknowledgment
The authors gratefully acknowledge the financial support pro-vided by ‘‘La Region Haute Normandie’’ and the E3C3 project(No. 4274), which was selected by the European INTERREGIV France (Channel) – England Cross-border CooperationProgram and co-financed by ERDF. Authors also thank CaroleGobin for her contribution during PDA experiments.
The authors have declared no conflict of interest.
www.cet-journal.com ª 2015 WILEY-VCH Verlag GmbH & Co. KGaA, Weinheim Chem. Eng. Technol. 2015, 38, No. 00, 1–12
Figure 10. Experimental CO2 absorbed flux in comparison to the simulated flux for three equivalent droplet diameters of 40, 50, and60mm.
10 Research Article
’’ These are not the final page numbers!
Symbols
[CO2] [mol m–3] CO2 concentration inside thedroplet
[CO2]0 [mol m–3] CO2 initial concentration insidethe droplet
[CO2]abs [mol m–3] quantity of CO2 absorbed (mole)from the gas phase to the dropletdivided by the droplet volume (orCO2 absorbed concentration)
Di [m2s–1] diffusion coefficient of the species iddroplet [m] droplets arithmetic mean
diameterHeCO2 [mol m–3MPa–1] CO2 Henry constant in 30 %
aqueous MEAk [m3mol–1s–1] reaction rate constant[MEA] [mol m–3] MEA concentration inside the
droplet[MEA]0 [mol m–3] MEA initial concentration inside
the dropletNCO2 [mol m–2s–1] CO2 absorbed fluxPCO2 [Pa] CO2 partial pressureR [m] droplet radiusSdroplet [m2] droplet areaT [K] temperaturet [s] timevdroplet [m s–1] droplets arithmetic mean velocityVdroplet [m3] droplet volume
Greek letter
mi [Pa s] dynamic viscosity of the species i
Abbreviations
FEM finite element methodGHG greenhouse gasesGRT global rainbow techniqueMEA monoethanolamineNNLS non-negative least squarePCC post-combustion capturePDA phase Doppler anemometryRNH2 monoethanolamineRNH3
+ protonated MEARNHCCO– carbamate
References
[1] Intergovernmental Panel on Climate Change, 4th AssessmentReport, Switzerland 2007.
[2] F. Lecomte, P. Broutin, E. Lebas, Le Captage de CO2, Technip,Paris 2010.
[3] A. Kohl, R. Nielsen, Gas Purification, 5th ed., Gulf Publish-ing Company, Houston, TX 1997.
[4] A. Aboudheir, P. Tontiwachwuthikul, A. Chakma, R. Idem,Can. J. Chem. Eng. 2003, 81 (3–4), 604–612. DOI: 10.1002/cjce.5450810336
[5] D. DeMontigny, P. Tontiwachwuthikul, A. Chakma, Ind.Eng. Chem. Res. 2005, 44 (15), 5726–5732. DOI: 10.1021/ie040264k
[6] I. Aouini, A. Ledoux, L. Estel, S. Mary, Oil Gas Sci. Technol.2014, 69 (6), 1091–1104. DOI: 10.2516/ogst/2013205
[7] I. Taniguchi, H. Yokoyama, K. Asano, J. Chem. Eng. Jpn.1999, 32 (1), 145–150. DOI: 10.1252/jcej.32.145
[8] I. Taniguchi, Y. Takamura, K. Asano, J. Chem. Eng. Jpn.1997, 30 (3), 427–433. DOI: 10.1252/jcej.30.427
[9] K. C. Mehta, M. M. Sharma, Br. Chem. Eng. 1970, 15 (11),1440–1558.
[10] E. A. Pinilla, J. M. Diaz, J. Coca, Can. J. Chem. Eng. 1984, 62(5), 617–622. DOI: 10.1002/cjce.5450620507
[11] A. Chakma, E. Chornet, R. P. Overend, W. H. Dawson, Can.J. Chem. Eng. 1990, 68 (4), 592–598. DOI: 10.1002/cjce.5450680409
[12] J. Kuntz, A. Aroonwilas, Energy Procedia 2009, 1 (1),205–209. DOI: 10.1016/j.egypro.2009.01.029
[13] J. G. Sartori, D. W. Savage, Ind. Eng. Chem. Fundam. 1983,22 (2), 239–249. DOI: 10.1021/i100010a016
[14] P. V. Danckwerts, Gas Liquid Reactions, 1st ed., McGraw-Hill Book Company, New York 1970.
[15] H. Hikita, H. Asai, H. Ishikawa, M. Honda, Chem. Eng. J.1977, 13 (1), 7–12. DOI: 10.1016/0300-9467(77)80002-6
[16] G. F. Versteeg, W. P. M. Van Swaaij, J. Chem. Eng. Data1988, 33 (1), 29–34. DOI: 10.1021/je00051a011
[17] E. D. Snijder, M. J. M. te Riele, G. F. Vertseeg, W. P. M. VanSwaaij, J. Chem. Eng. Data 1993, 38 (3), 475–480. DOI:10.1021/je00011a037
[18] R. Maceira, E. Alvarez, M. Angeles Cancela, Chem. Eng. J.2008, 138 (1–3), 295–300. DOI: 10.1016/j.cej.2007.05.049
[19] T. Elperin, A. Fominykh, Atmos. Environ. 2005, 39 (25),4575–4582. DOI: 10.1016/j.atmosenv.2005.04.005
[20] J. Adam, Phys. Rep. 2002, 356, 229–365.[21] N. Roth, K. Anders, A. Frohn, J. Laser Appl. 1990, 2 (1), 37.
DOI: 10.2351/1.4745251[22] S. Saengkaew, T. Charinpanikul, C. Laurent, Y. Biscos,
G. Lavergne, G. Gouesbet, G. Grehan, Exp. Fluids 2010,48 (1), 111–119. DOI: 10.1007/s00348-009-0717-3
[23] J. Van Beeck, D. Giannoulis, L. Zimmer, M. Riethmuller,Opt. Lett. 1999, 24 (23), 1696–1698. DOI: 10.1364/OL.24.001696
[24] S. Saengkaew, G. Godard, J. B. Blaisot, G. Grehan, Exp. Fluids2009, 47 (4–5), 839–848. DOI: 10.1007/s00348-009-0680-z
[25] S. Saengkaew, Ph. D. Thesis, Universite de Rouen, France2006.
[26] S. Saengkaew, T. Charinpanitkul, H. Vanisri, W. Tanthapani-chakoon, L. Mees, G. Gouesbet, G. Grehan, Opt. Commun.2006, 259 (1), 7–13. DOI: 10.1016/j.optcom.2005.08.031
[27] M. R. Vetrano, S. Gauthier, J. van Beeck, P. Boulet, J.-M.Buchlin, Exp. Fluids 2006, 40, 15–22. DOI: 10.1007/s00348-005-0042-4
[28] X. Wu, Y. Wu, S. Saengkaew, S. Meunier-Guttin-Cluzel,G. Grehan, L. Chen, K. Cen, Meas. Sci. Technol. 2012,23 (12). DOI: 10.1088/0957-0233/23/12/125302
[29] M. Ouboukhlik, S. Saengkaew, M.-C. Fournier-Salaun,L. Estel, G. Grehan, Can. J. Chem. Eng. 2015, 93 (2),419–426. DOI: 10.1002/cjce.22123
[30] F. Durst, G. Brenn, T. H. Xu, Meas. Sci. Technol. 1997, 8 (11),1203. DOI: 10.1088/0957-0233/8/11/002
Chem. Eng. Technol. 2015, 38, No. 00, 1–12 ª 2015 WILEY-VCH Verlag GmbH & Co. KGaA, Weinheim www.cet-journal.com
Research Article 11
These are not the final page numbers! ((
www.cet-journal.com ª 2015 WILEY-VCH Verlag GmbH & Co. KGaA, Weinheim Chem. Eng. Technol. 2015, 38, No. 00, 1–12
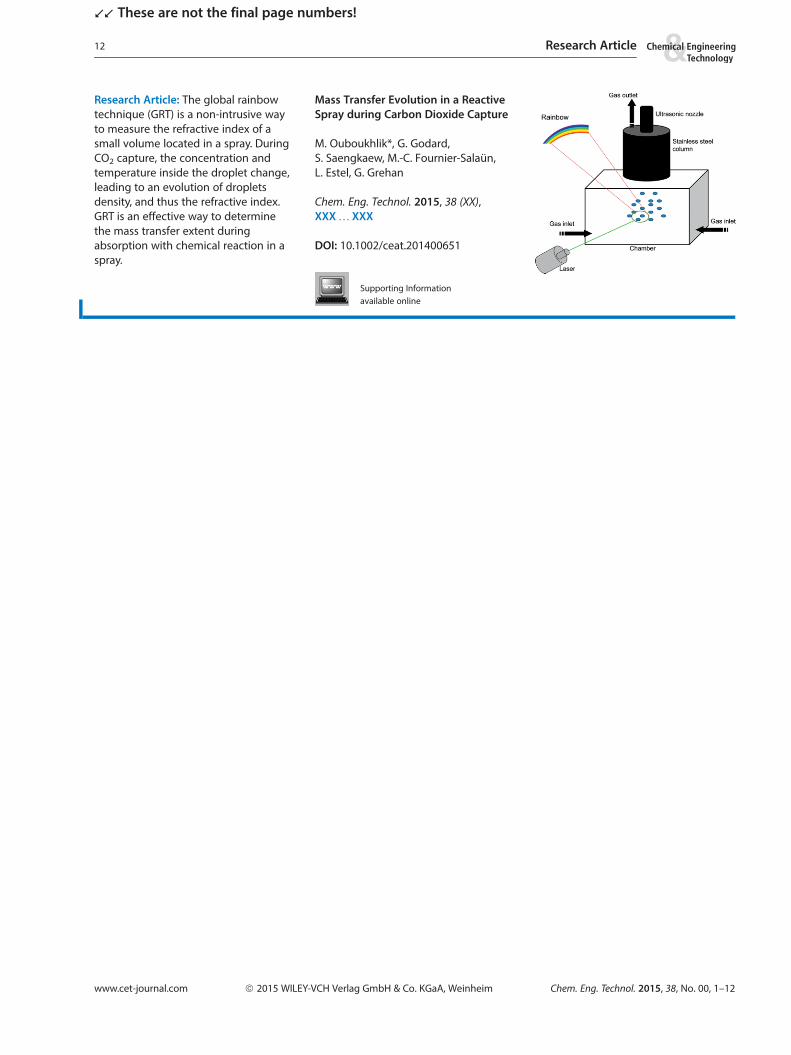
Research Article: The global rainbowtechnique (GRT) is a non-intrusive wayto measure the refractive index of asmall volume located in a spray. DuringCO2 capture, the concentration andtemperature inside the droplet change,leading to an evolution of dropletsdensity, and thus the refractive index.GRT is an effective way to determinethe mass transfer extent duringabsorption with chemical reaction in aspray.
Mass Transfer Evolution in a ReactiveSpray during Carbon Dioxide Capture
M. Ouboukhlik*, G. Godard,S. Saengkaew, M.-C. Fournier-Salaun,L. Estel, G. Grehan
Chem. Eng. Technol. 2015, 38 (XX),XXX K XXX
DOI: 10.1002/ceat.201400651
Supporting Informationavailable online
12 Research Article
’’ These are not the final page numbers!


![Scavengers of reactive γ‐ ketoaldehydes extend ......susceptibility to free radical attack [1,2]. Accumulation of lipid peroxidation products has been implicated in the pathogenesis](https://img.pdfslide.us/doc/110x75/60c6eba0849c845d6054f57f/scavengers-of-reactive-a-ketoaldehydes-extend-susceptibility-to-free.jpg)