Embed Size (px)
Citation preview
Clean Energy & Energy Smart Technologies.
12 January 2017
2016 League Tables.
1
CLEAN ENERGY & EST LEAGUE TABLES
CONTENTS
1. Introduction
2. League table role coverage
3. Overview
4. Asset finance
Lead arrangers
Syndicated lenders
Sponsors
Legal advisers
Financial advisers
Tax equity
13. M&A
Acquirers
16. Venture capital & private equity
Investors
Investors (by count)
19. Acquisition advisers
M&A and VC/PE financial advisers
M&A and VC/PE legal advisers
23. Public markets
Lead managers
Co-lead managers
Legal advisers
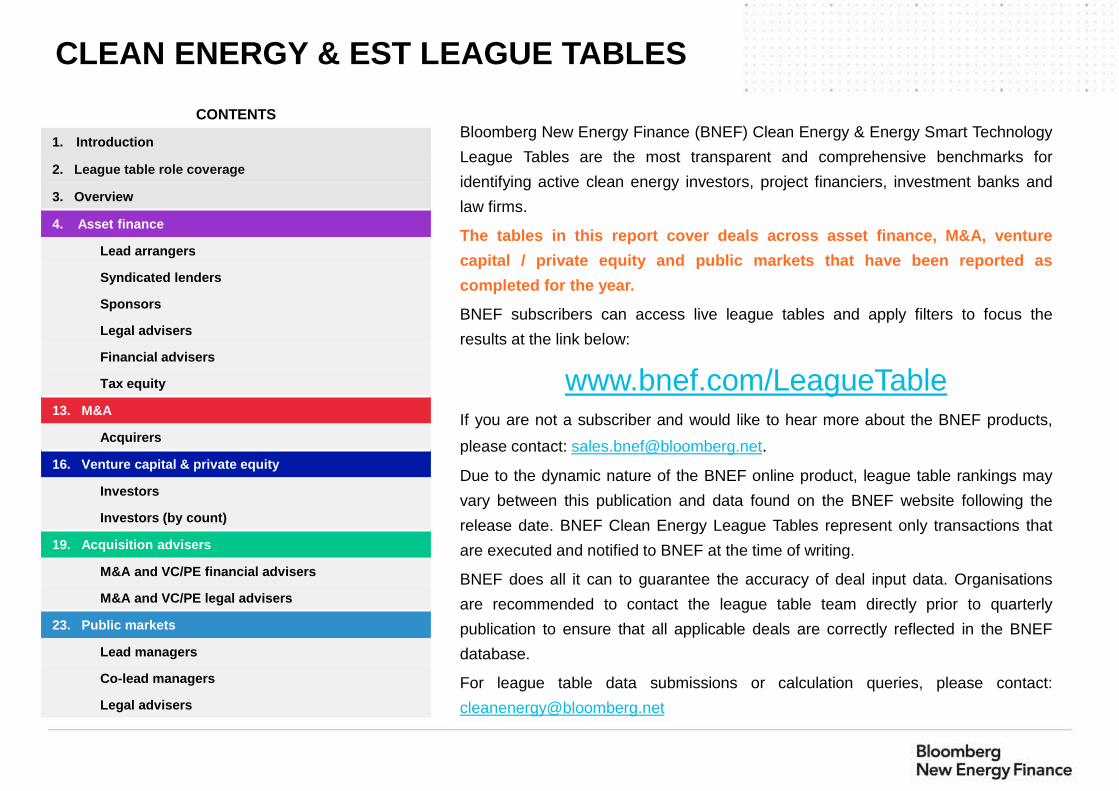
Bloomberg New Energy Finance (BNEF) Clean Energy & Energy Smart Technology
League Tables are the most transparent and comprehensive benchmarks for
identifying active clean energy investors, project financiers, investment banks and
law firms.
The tables in this report cover deals across asset finance, M&A, venture
capital / private equity and public markets that have been reported as
completed for the year.
BNEF subscribers can access live league tables and apply filters to focus the
results at the link below:
www.bnef.com/LeagueTableIf you are not a subscriber and would like to hear more about the BNEF products,
please contact: [email protected].
Due to the dynamic nature of the BNEF online product, league table rankings may
vary between this publication and data found on the BNEF website following the
release date. BNEF Clean Energy League Tables represent only transactions that
are executed and notified to BNEF at the time of writing.
BNEF does all it can to guarantee the accuracy of deal input data. Organisations
are recommended to contact the league table team directly prior to quarterly
publication to ensure that all applicable deals are correctly reflected in the BNEF
database.
For league table data submissions or calculation queries, please contact:
2
LEAGUE TABLE ROLE COVERAGE
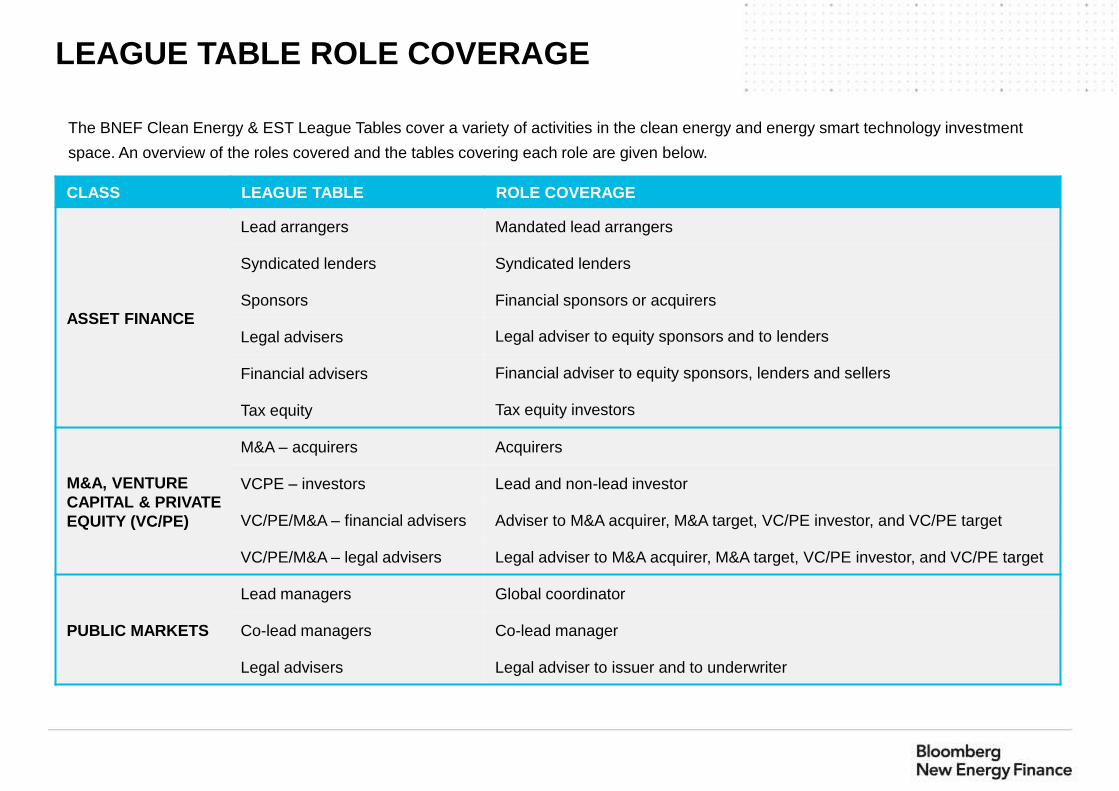
CLASS LEAGUE TABLE ROLE COVERAGE
ASSET FINANCE
Lead arrangers Mandated lead arrangers
Syndicated lenders Syndicated lenders
Sponsors Financial sponsors or acquirers
Legal advisers Legal adviser to equity sponsors and to lenders
Financial advisers Financial adviser to equity sponsors, lenders and sellers
Tax equity Tax equity investors
M&A, VENTURE
CAPITAL & PRIVATE
EQUITY (VC/PE)
M&A – acquirers Acquirers
VCPE – investors Lead and non-lead investor
VC/PE/M&A – financial advisers Adviser to M&A acquirer, M&A target, VC/PE investor, and VC/PE target
VC/PE/M&A – legal advisers Legal adviser to M&A acquirer, M&A target, VC/PE investor, and VC/PE target
PUBLIC MARKETS
Lead managers Global coordinator
Co-lead managers Co-lead manager
Legal advisers Legal adviser to issuer and to underwriter
The BNEF Clean Energy & EST League Tables cover a variety of activities in the clean energy and energy smart technology investment
space. An overview of the roles covered and the tables covering each role are given below.
3
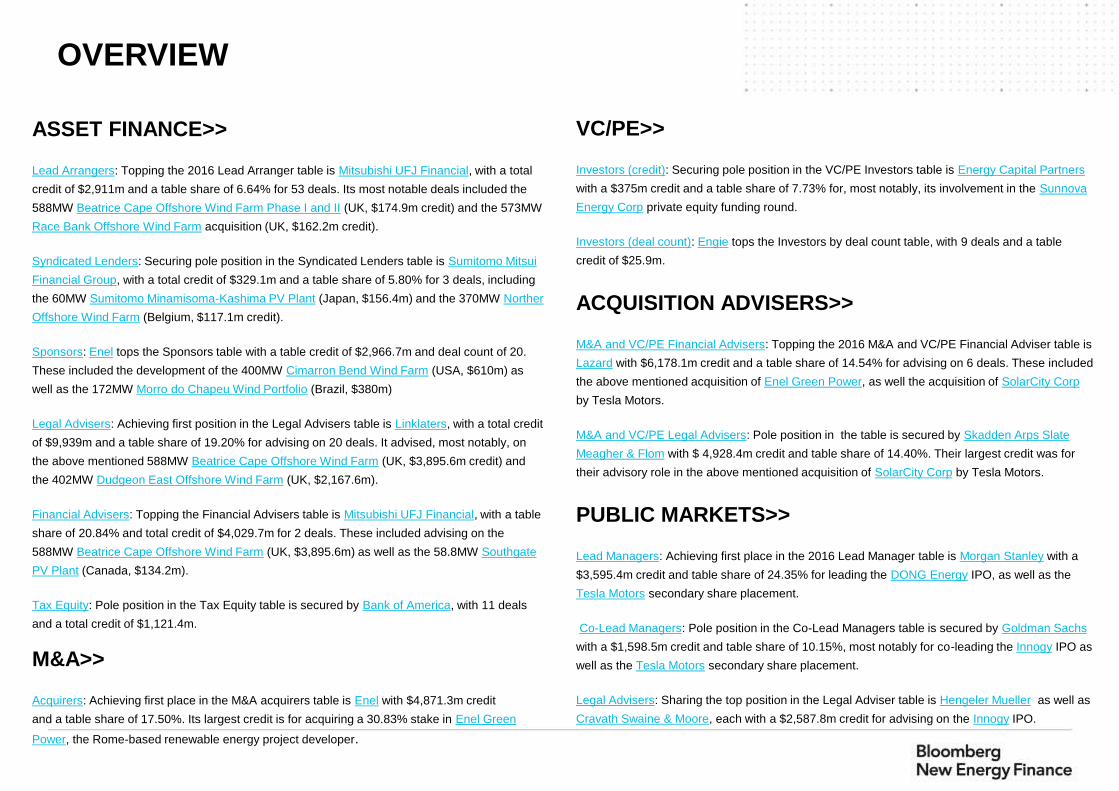
OVERVIEW
ASSET FINANCE>>
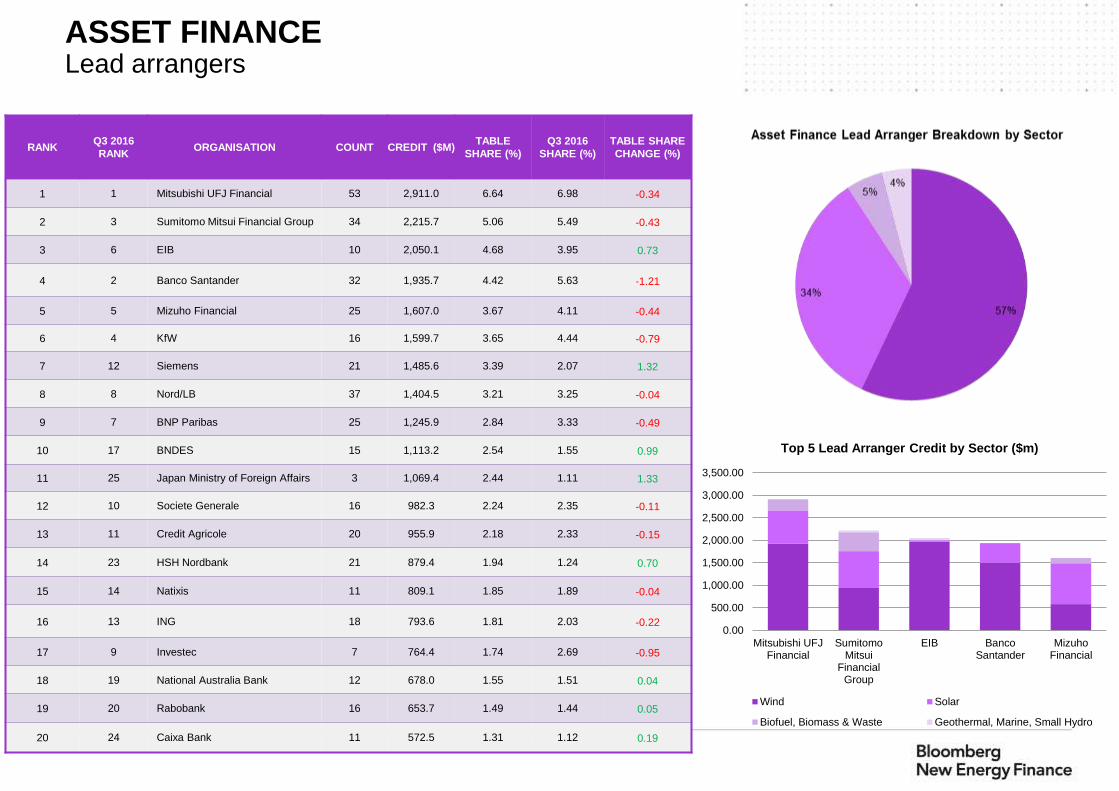
Lead Arrangers: Topping the 2016 Lead Arranger table is Mitsubishi UFJ Financial, with a total
credit of $2,911m and a table share of 6.64% for 53 deals. Its most notable deals included the
588MW Beatrice Cape Offshore Wind Farm Phase I and II (UK, $174.9m credit) and the 573MW
Race Bank Offshore Wind Farm acquisition (UK, $162.2m credit).
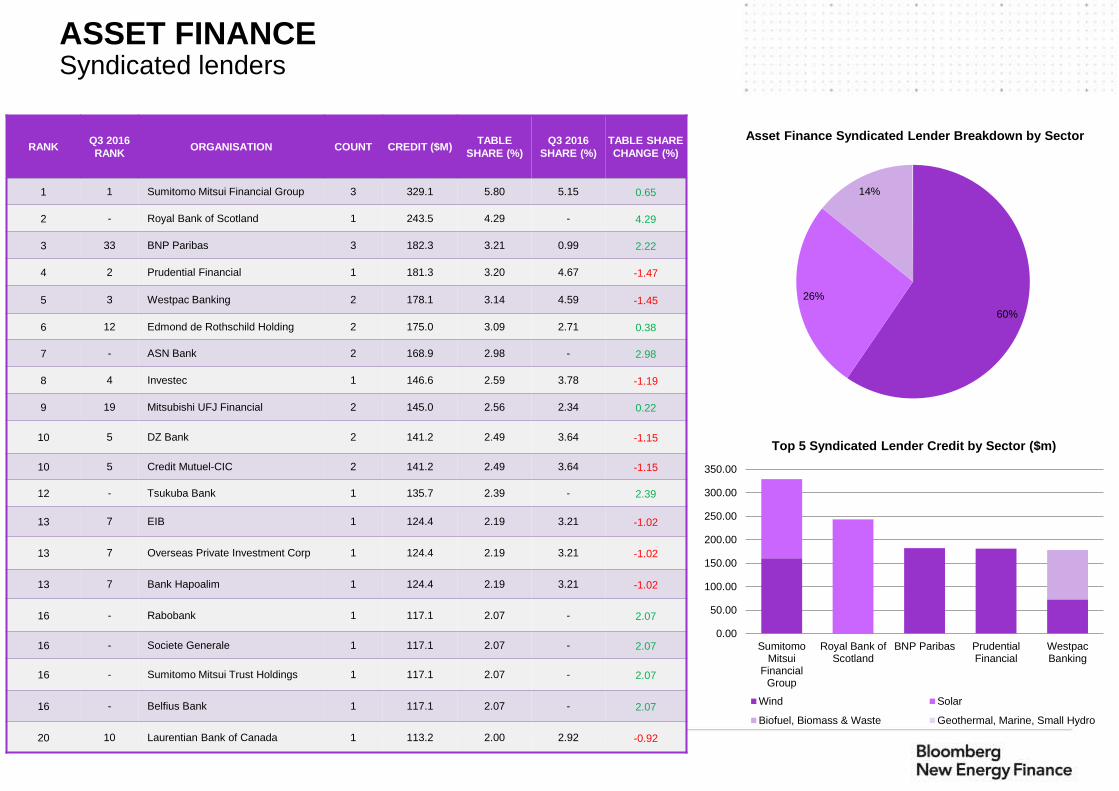
Syndicated Lenders: Securing pole position in the Syndicated Lenders table is Sumitomo Mitsui
Financial Group, with a total credit of $329.1m and a table share of 5.80% for 3 deals, including
the 60MW Sumitomo Minamisoma-Kashima PV Plant (Japan, $156.4m) and the 370MW Norther
Offshore Wind Farm (Belgium, $117.1m credit).
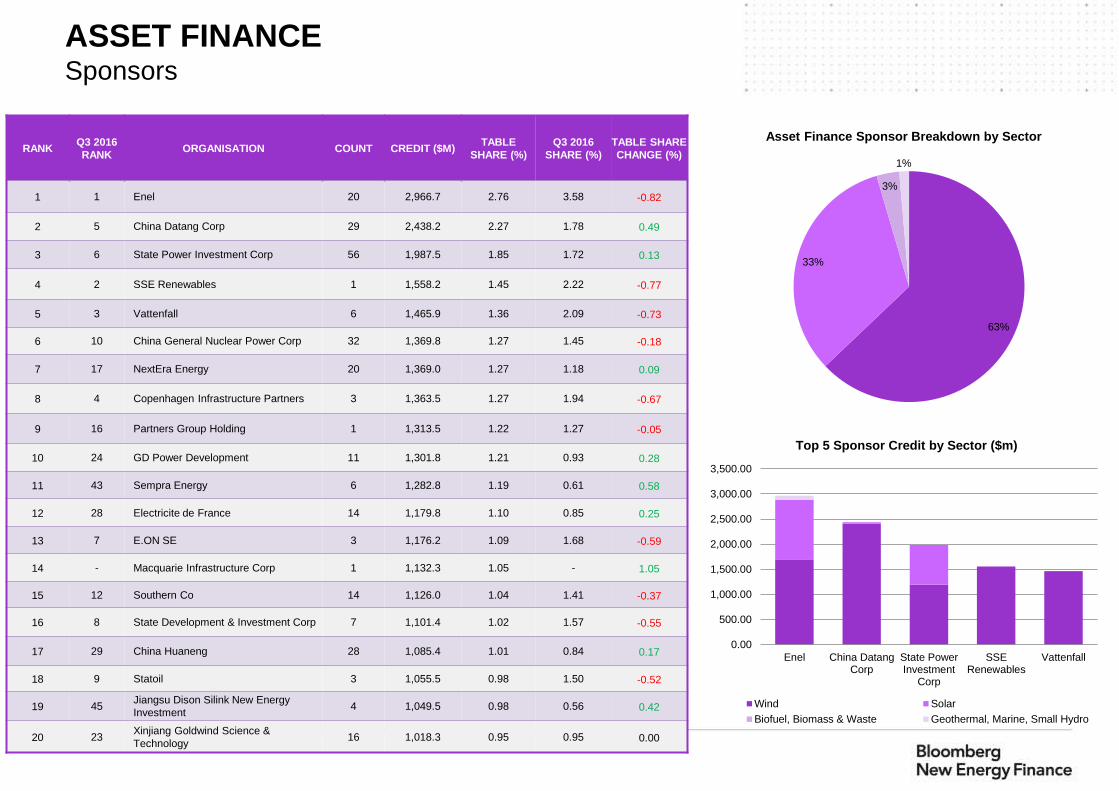
Sponsors: Enel tops the Sponsors table with a table credit of $2,966.7m and deal count of 20.
These included the development of the 400MW Cimarron Bend Wind Farm (USA, $610m) as
well as the 172MW Morro do Chapeu Wind Portfolio (Brazil, $380m)
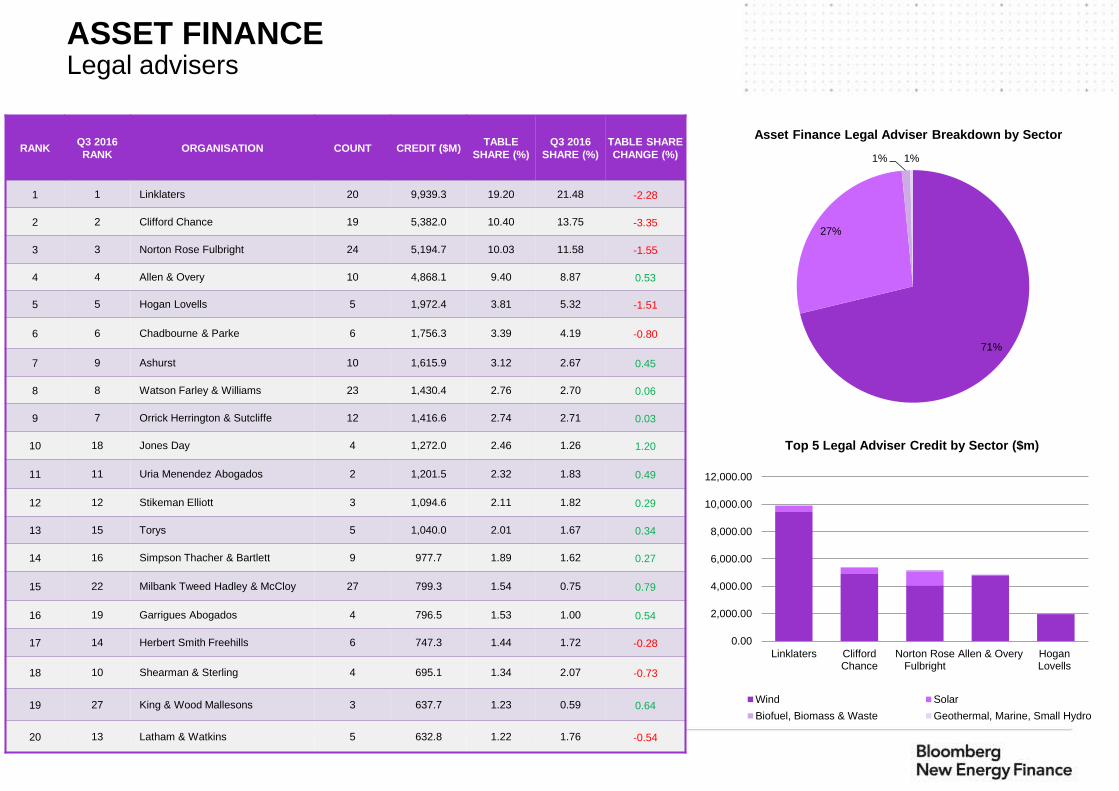
Legal Advisers: Achieving first position in the Legal Advisers table is Linklaters, with a total credit
of $9,939m and a table share of 19.20% for advising on 20 deals. It advised, most notably, on
the above mentioned 588MW Beatrice Cape Offshore Wind Farm (UK, $3,895.6m credit) and
the 402MW Dudgeon East Offshore Wind Farm (UK, $2,167.6m).
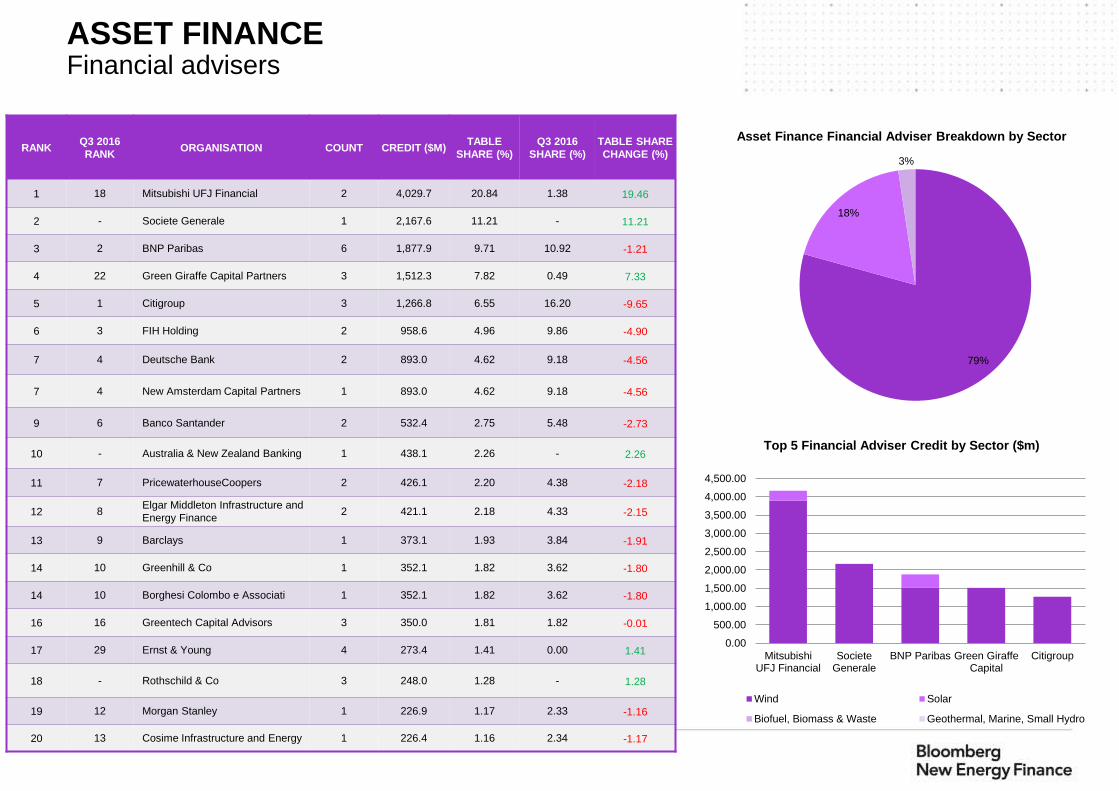
Financial Advisers: Topping the Financial Advisers table is Mitsubishi UFJ Financial, with a table
share of 20.84% and total credit of $4,029.7m for 2 deals. These included advising on the
588MW Beatrice Cape Offshore Wind Farm (UK, $3,895.6m) as well as the 58.8MW Southgate
PV Plant (Canada, $134.2m).
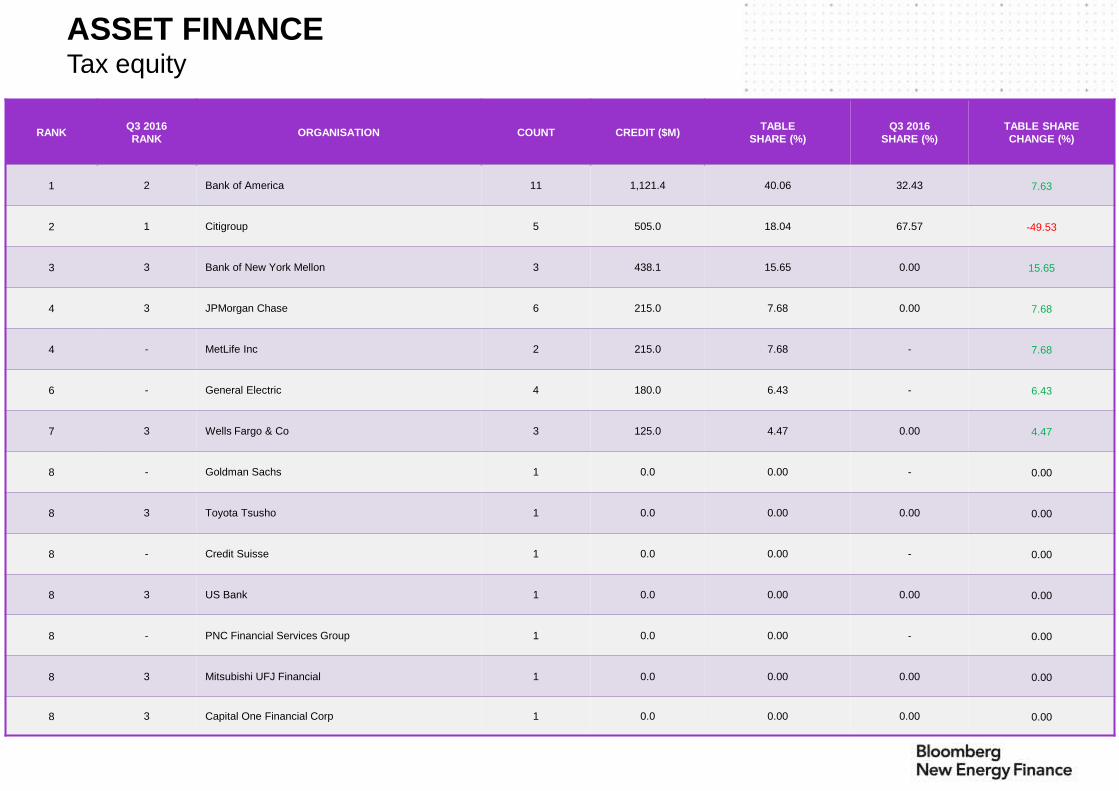
Tax Equity: Pole position in the Tax Equity table is secured by Bank of America, with 11 deals
and a total credit of $1,121.4m.
M&A>>
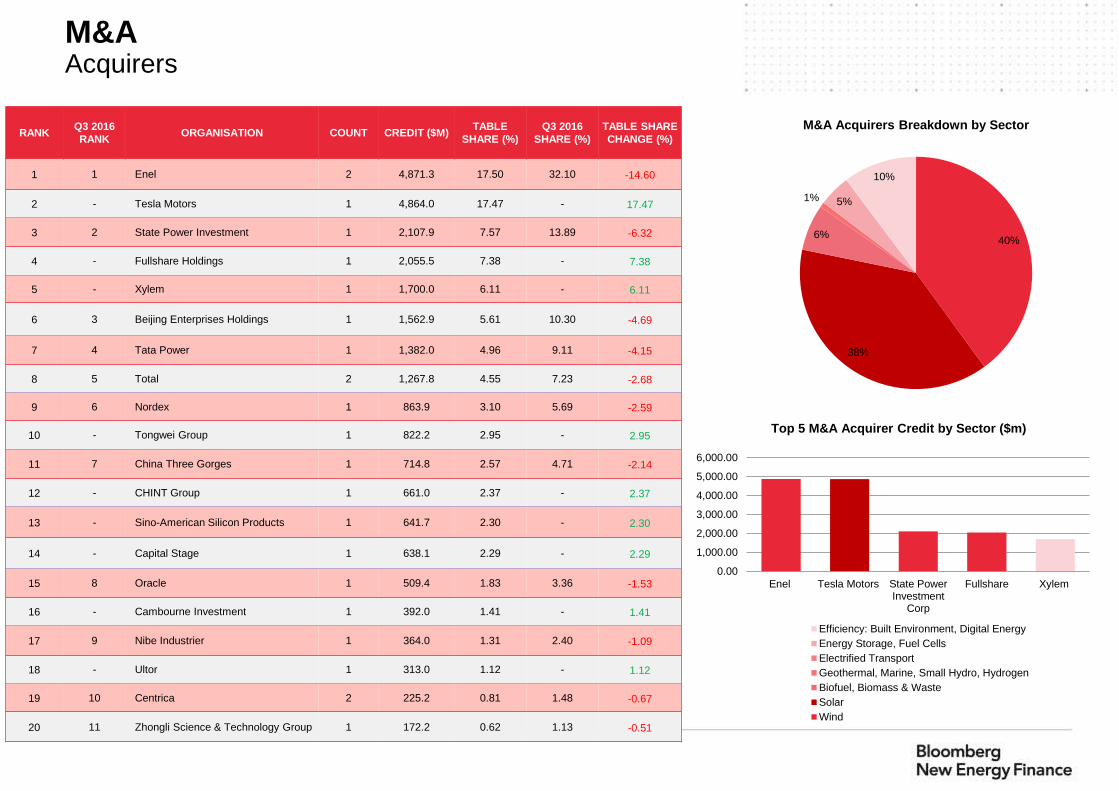
Acquirers: Achieving first place in the M&A acquirers table is Enel with $4,871.3m credit
and a table share of 17.50%. Its largest credit is for acquiring a 30.83% stake in Enel Green
Power, the Rome-based renewable energy project developer.
VC/PE>>
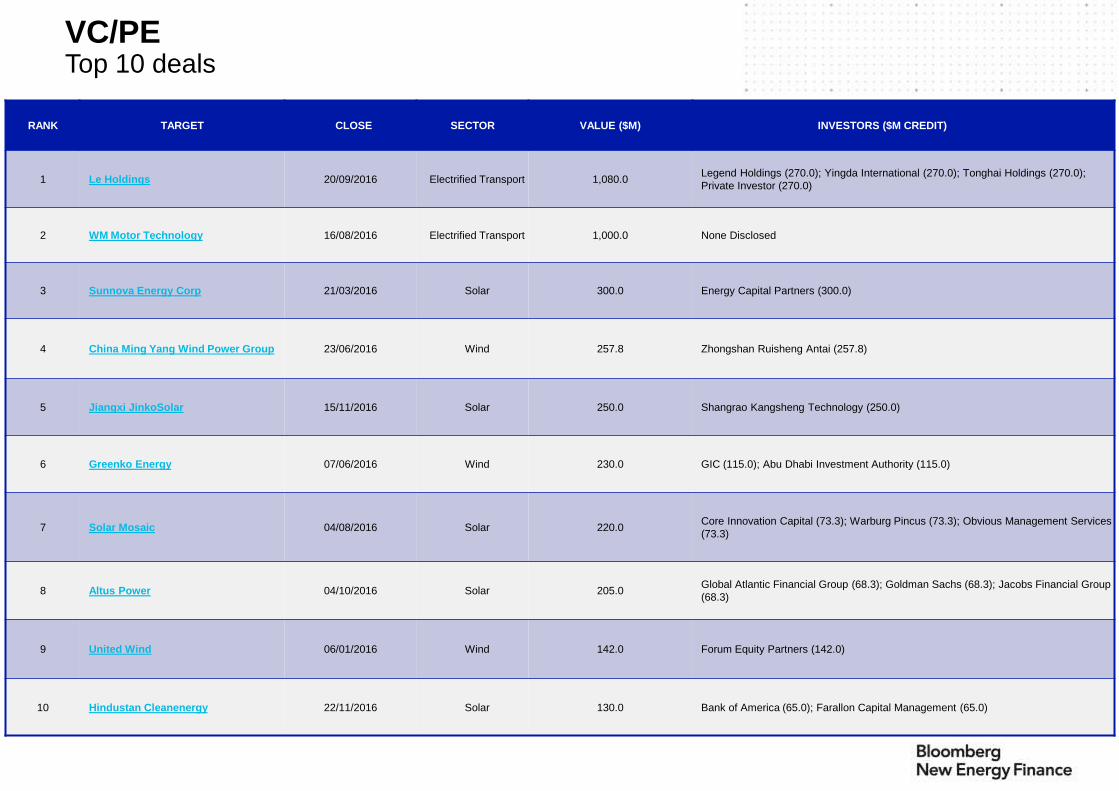
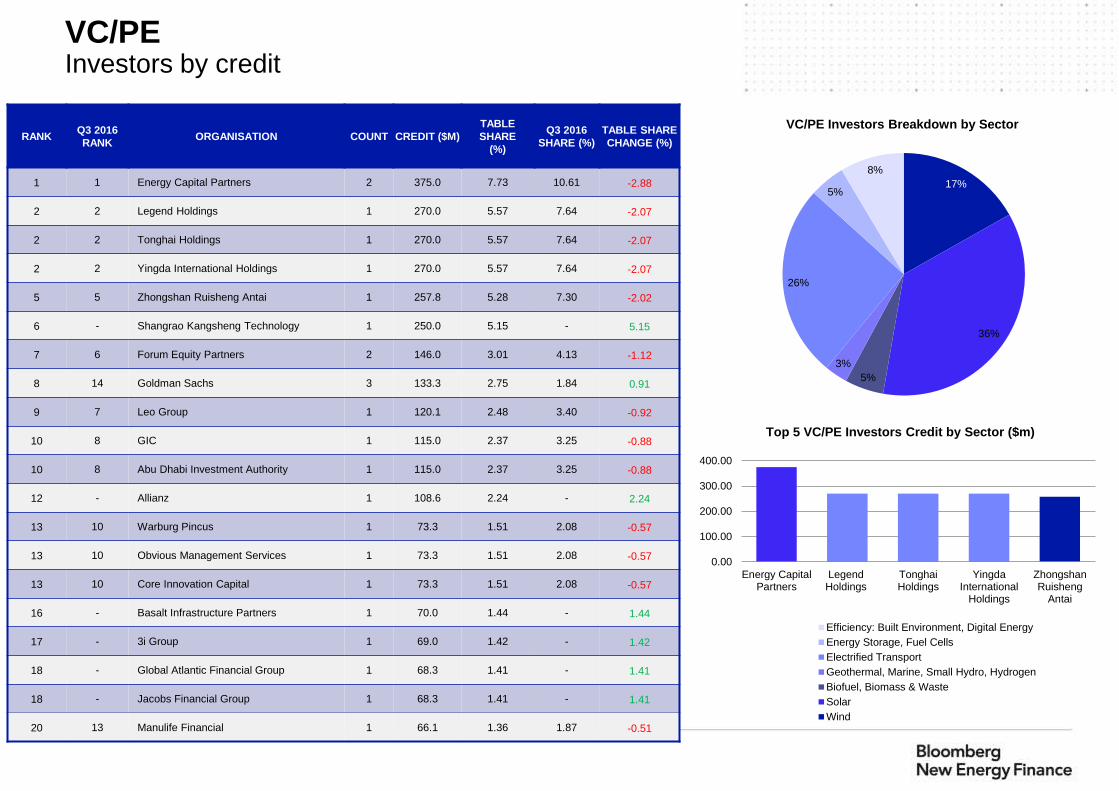
Investors (credit): Securing pole position in the VC/PE Investors table is Energy Capital Partners
with a $375m credit and a table share of 7.73% for, most notably, its involvement in the Sunnova
Energy Corp private equity funding round.
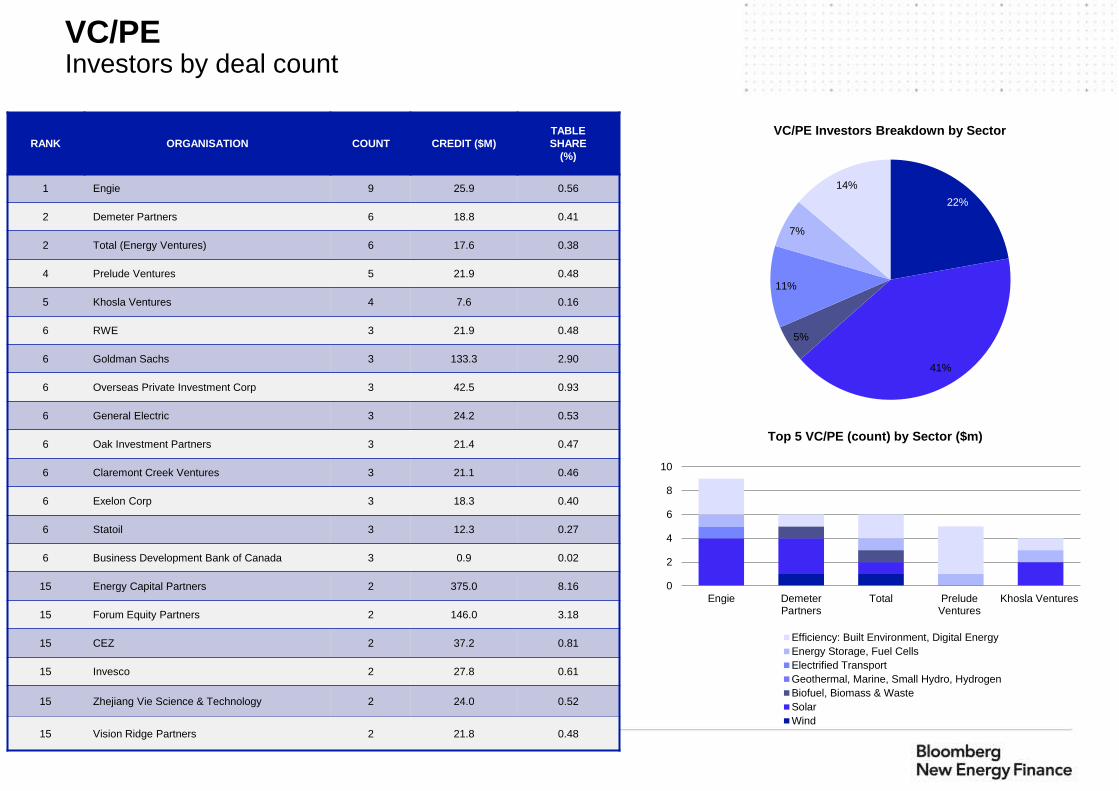
Investors (deal count): Engie tops the Investors by deal count table, with 9 deals and a table
credit of $25.9m.
ACQUISITION ADVISERS>>
M&A and VC/PE Financial Advisers: Topping the 2016 M&A and VC/PE Financial Adviser table is
Lazard with $6,178.1m credit and a table share of 14.54% for advising on 6 deals. These included
the above mentioned acquisition of Enel Green Power, as well the acquisition of SolarCity Corp
by Tesla Motors.
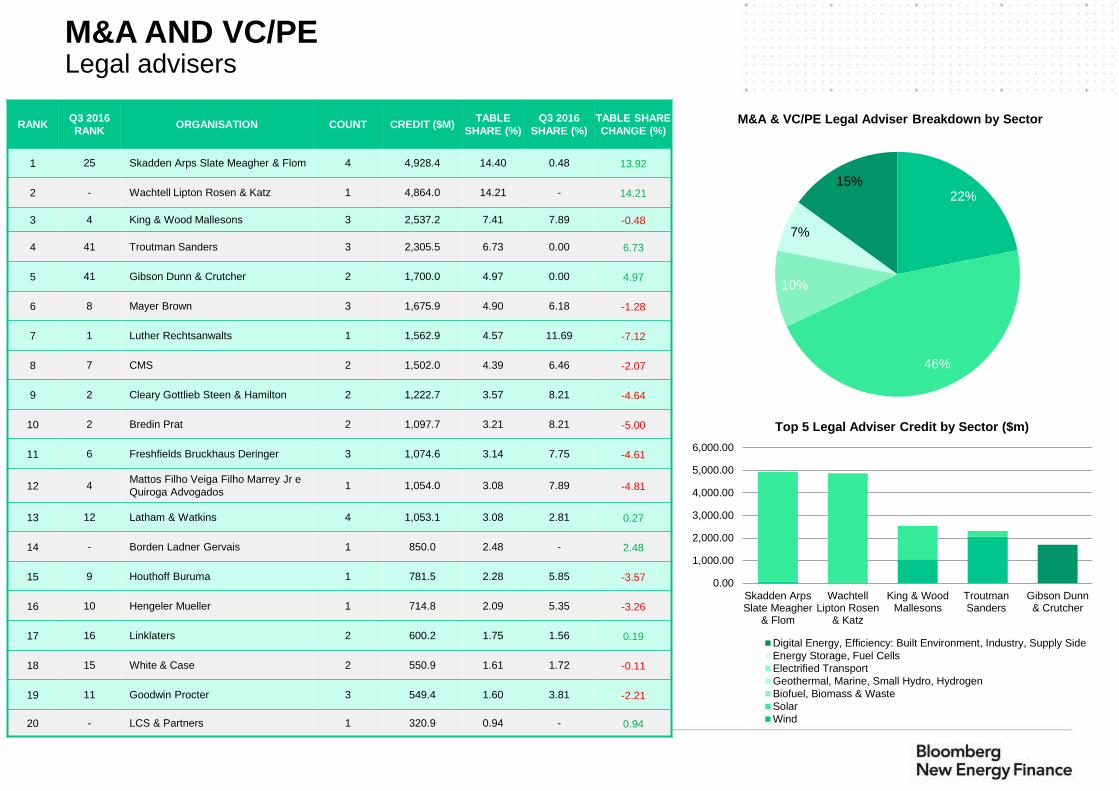
M&A and VC/PE Legal Advisers: Pole position in the table is secured by Skadden Arps Slate
Meagher & Flom with $ 4,928.4m credit and table share of 14.40%. Their largest credit was for
their advisory role in the above mentioned acquisition of SolarCity Corp by Tesla Motors.
PUBLIC MARKETS>>
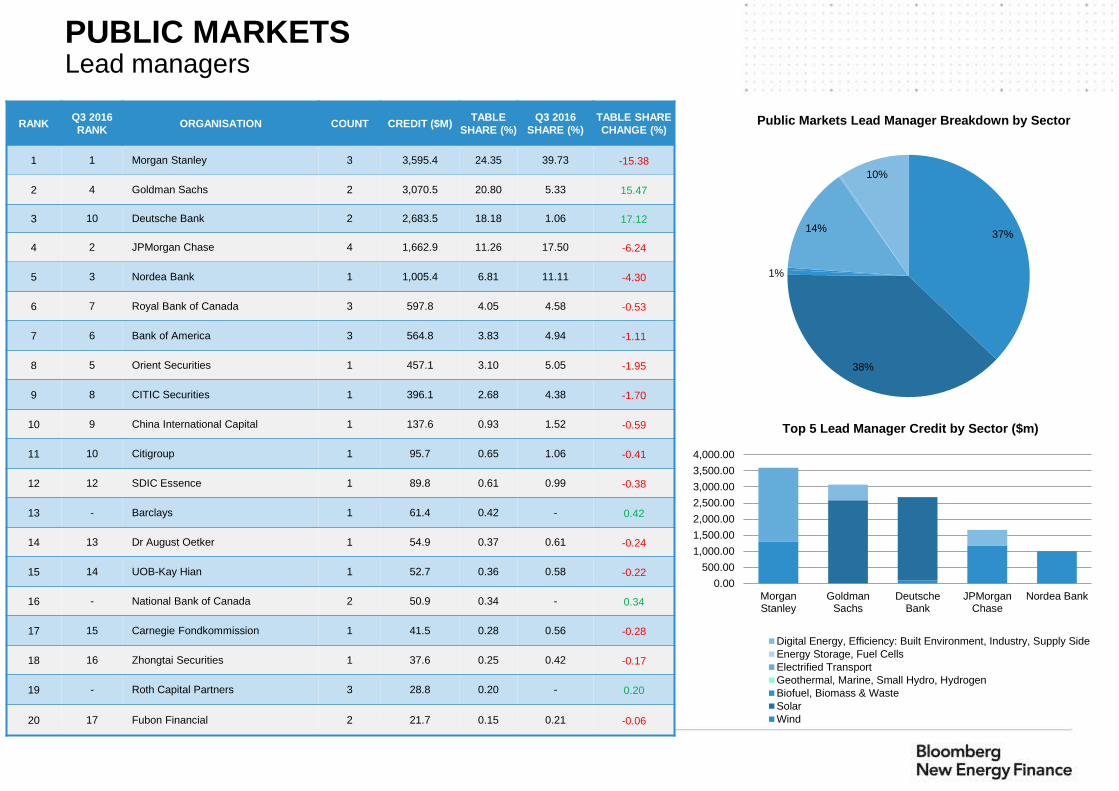
Lead Managers: Achieving first place in the 2016 Lead Manager table is Morgan Stanley with a
$3,595.4m credit and table share of 24.35% for leading the DONG Energy IPO, as well as the
Tesla Motors secondary share placement.
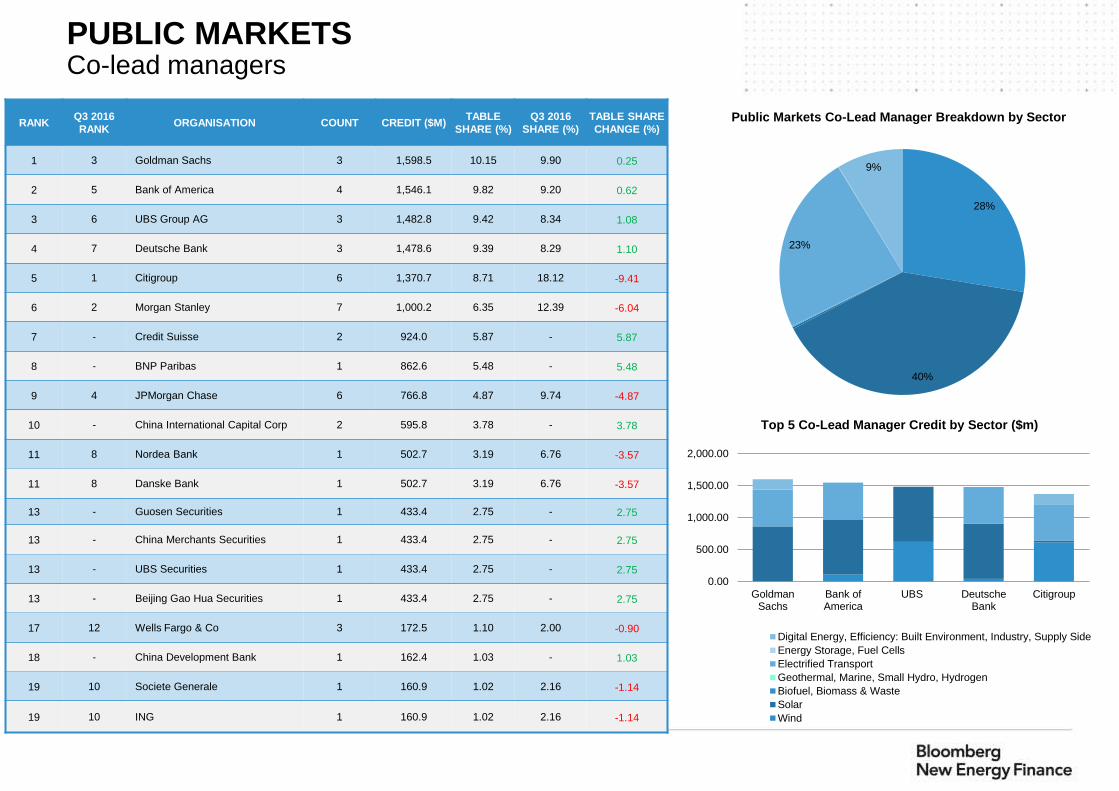
Co-Lead Managers: Pole position in the Co-Lead Managers table is secured by Goldman Sachs
with a $1,598.5m credit and table share of 10.15%, most notably for co-leading the Innogy IPO as
well as the Tesla Motors secondary share placement.
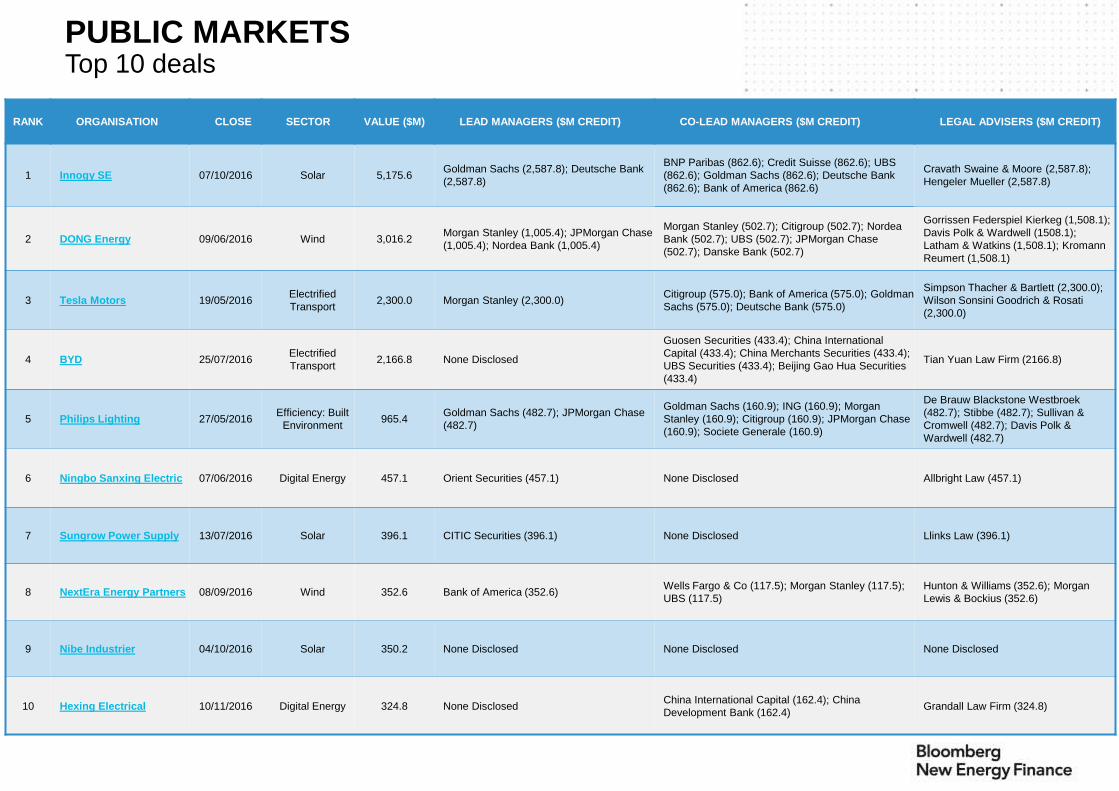
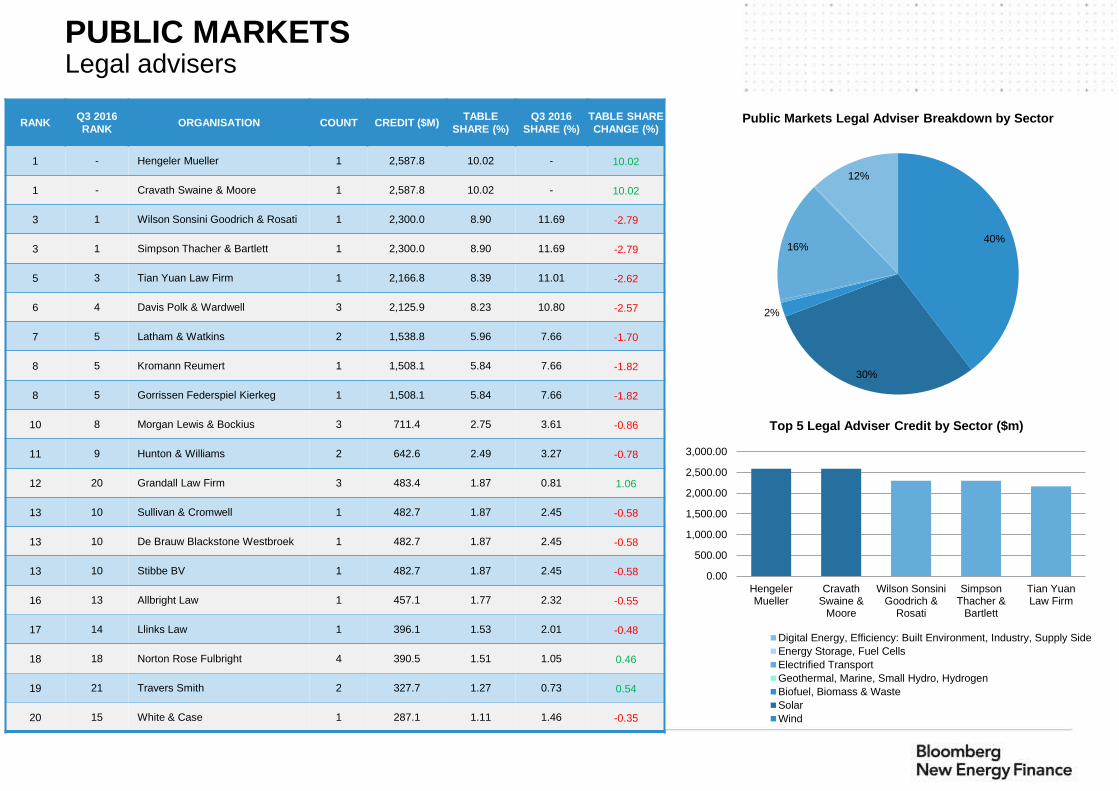
Legal Advisers: Sharing the top position in the Legal Adviser table is Hengeler Mueller as well as
Cravath Swaine & Moore, each with a $2,587.8m credit for advising on the Innogy IPO.
4
Asset finance.
5
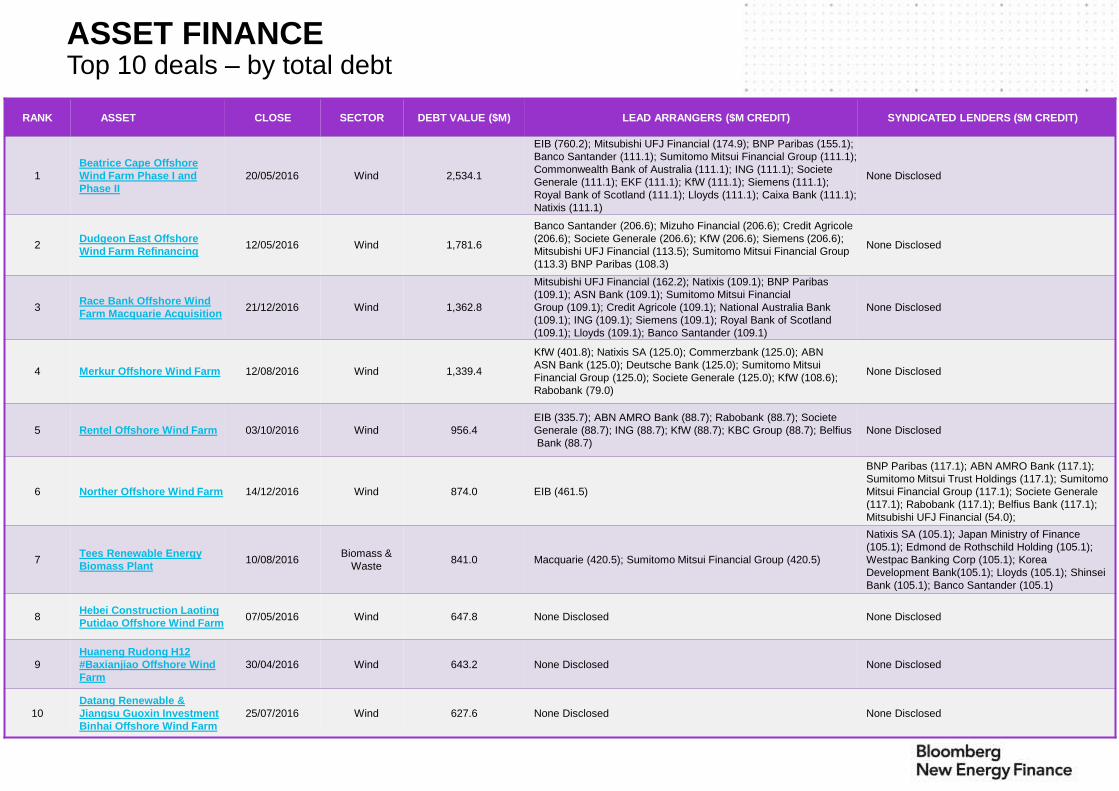
ASSET FINANCETop 10 deals – by total debt
RANK ASSET CLOSE SECTOR DEBT VALUE ($M) LEAD ARRANGERS ($M CREDIT) SYNDICATED LENDERS ($M CREDIT)
1
Beatrice Cape Offshore
Wind Farm Phase I and
Phase II
20/05/2016 Wind 2,534.1
EIB (760.2); Mitsubishi UFJ Financial (174.9); BNP Paribas (155.1);
Banco Santander (111.1); Sumitomo Mitsui Financial Group (111.1);
Commonwealth Bank of Australia (111.1); ING (111.1); Societe
Generale (111.1); EKF (111.1); KfW (111.1); Siemens (111.1);
Royal Bank of Scotland (111.1); Lloyds (111.1); Caixa Bank (111.1);
Natixis (111.1)
None Disclosed
2Dudgeon East Offshore
Wind Farm Refinancing12/05/2016 Wind 1,781.6
Banco Santander (206.6); Mizuho Financial (206.6); Credit Agricole
(206.6); Societe Generale (206.6); KfW (206.6); Siemens (206.6);
Mitsubishi UFJ Financial (113.5); Sumitomo Mitsui Financial Group
(113.3) BNP Paribas (108.3)
None Disclosed
3Race Bank Offshore Wind
Farm Macquarie Acquisition21/12/2016 Wind 1,362.8
Mitsubishi UFJ Financial (162.2); Natixis (109.1); BNP Paribas
(109.1); ASN Bank (109.1); Sumitomo Mitsui Financial
Group (109.1); Credit Agricole (109.1); National Australia Bank
(109.1); ING (109.1); Siemens (109.1); Royal Bank of Scotland
(109.1); Lloyds (109.1); Banco Santander (109.1)
None Disclosed
4 Merkur Offshore Wind Farm 12/08/2016 Wind 1,339.4
KfW (401.8); Natixis SA (125.0); Commerzbank (125.0); ABN
ASN Bank (125.0); Deutsche Bank (125.0); Sumitomo Mitsui
Financial Group (125.0); Societe Generale (125.0); KfW (108.6);
Rabobank (79.0)
None Disclosed
5 Rentel Offshore Wind Farm 03/10/2016 Wind 956.4
EIB (335.7); ABN AMRO Bank (88.7); Rabobank (88.7); Societe
Generale (88.7); ING (88.7); KfW (88.7); KBC Group (88.7); Belfius
Bank (88.7)
None Disclosed
6 Norther Offshore Wind Farm 14/12/2016 Wind 874.0 EIB (461.5)
BNP Paribas (117.1); ABN AMRO Bank (117.1);
Sumitomo Mitsui Trust Holdings (117.1); Sumitomo
Mitsui Financial Group (117.1); Societe Generale
(117.1); Rabobank (117.1); Belfius Bank (117.1);
Mitsubishi UFJ Financial (54.0);
7Tees Renewable Energy
Biomass Plant10/08/2016
Biomass &
Waste841.0 Macquarie (420.5); Sumitomo Mitsui Financial Group (420.5)
Natixis SA (105.1); Japan Ministry of Finance
(105.1); Edmond de Rothschild Holding (105.1);
Westpac Banking Corp (105.1); Korea
Development Bank(105.1); Lloyds (105.1); Shinsei
Bank (105.1); Banco Santander (105.1)
8Hebei Construction Laoting
Putidao Offshore Wind Farm07/05/2016 Wind 647.8 None Disclosed None Disclosed
9
Huaneng Rudong H12
#Baxianjiao Offshore Wind
Farm
30/04/2016 Wind 643.2 None Disclosed None Disclosed
10
Datang Renewable &
Jiangsu Guoxin Investment
Binhai Offshore Wind Farm
25/07/2016 Wind 627.6 None Disclosed None Disclosed
6
ASSET FINANCE Lead arrangers
RANKQ3 2016
RANKORGANISATION COUNT CREDIT ($M)
TABLE
SHARE (%)
Q3 2016
SHARE (%)
TABLE SHARE
CHANGE (%)
1 1 Mitsubishi UFJ Financial 53 2,911.0 6.64 6.98 -0.34
2 3 Sumitomo Mitsui Financial Group 34 2,215.7 5.06 5.49 -0.43
3 6 EIB 10 2,050.1 4.68 3.95 0.73
4 2 Banco Santander 32 1,935.7 4.42 5.63 -1.21
5 5 Mizuho Financial 25 1,607.0 3.67 4.11 -0.44
6 4 KfW 16 1,599.7 3.65 4.44 -0.79
7 12 Siemens 21 1,485.6 3.39 2.07 1.32
8 8 Nord/LB 37 1,404.5 3.21 3.25 -0.04
9 7 BNP Paribas 25 1,245.9 2.84 3.33 -0.49
10 17 BNDES 15 1,113.2 2.54 1.55 0.99
11 25 Japan Ministry of Foreign Affairs 3 1,069.4 2.44 1.11 1.33
12 10 Societe Generale 16 982.3 2.24 2.35 -0.11
13 11 Credit Agricole 20 955.9 2.18 2.33 -0.15
14 23 HSH Nordbank 21 879.4 1.94 1.24 0.70
15 14 Natixis 11 809.1 1.85 1.89 -0.04
16 13 ING 18 793.6 1.81 2.03 -0.22
17 9 Investec 7 764.4 1.74 2.69 -0.95
18 19 National Australia Bank 12 678.0 1.55 1.51 0.04
19 20 Rabobank 16 653.7 1.49 1.44 0.05
20 24 Caixa Bank 11 572.5 1.31 1.12 0.19
0.00
500.00
1,000.00
1,500.00
2,000.00
2,500.00
3,000.00
3,500.00
Mitsubishi UFJFinancial
SumitomoMitsui
FinancialGroup
EIB BancoSantander
MizuhoFinancial
Top 5 Lead Arranger Credit by Sector ($m)
Wind Solar
Biofuel, Biomass & Waste Geothermal, Marine, Small Hydro
7
ASSET FINANCESyndicated lenders
RANKQ3 2016
RANKORGANISATION COUNT CREDIT ($M)
TABLE
SHARE (%)
Q3 2016
SHARE (%)
TABLE SHARE
CHANGE (%)
1 1 Sumitomo Mitsui Financial Group 3 329.1 5.80 5.15 0.65
2 - Royal Bank of Scotland 1 243.5 4.29 - 4.29
3 33 BNP Paribas 3 182.3 3.21 0.99 2.22
4 2 Prudential Financial 1 181.3 3.20 4.67 -1.47
5 3 Westpac Banking 2 178.1 3.14 4.59 -1.45
6 12 Edmond de Rothschild Holding 2 175.0 3.09 2.71 0.38
7 - ASN Bank 2 168.9 2.98 - 2.98
8 4 Investec 1 146.6 2.59 3.78 -1.19
9 19 Mitsubishi UFJ Financial 2 145.0 2.56 2.34 0.22
10 5 DZ Bank 2 141.2 2.49 3.64 -1.15
10 5 Credit Mutuel-CIC 2 141.2 2.49 3.64 -1.15
12 - Tsukuba Bank 1 135.7 2.39 - 2.39
13 7 EIB 1 124.4 2.19 3.21 -1.02
13 7 Overseas Private Investment Corp 1 124.4 2.19 3.21 -1.02
13 7 Bank Hapoalim 1 124.4 2.19 3.21 -1.02
16 - Rabobank 1 117.1 2.07 - 2.07
16 - Societe Generale 1 117.1 2.07 - 2.07
16 - Sumitomo Mitsui Trust Holdings 1 117.1 2.07 - 2.07
16 - Belfius Bank 1 117.1 2.07 - 2.07
20 10 Laurentian Bank of Canada 1 113.2 2.00 2.92 -0.92
60%
26%
14%
Asset Finance Syndicated Lender Breakdown by Sector
0.00
50.00
100.00
150.00
200.00
250.00
300.00
350.00
SumitomoMitsui
FinancialGroup
Royal Bank ofScotland
BNP Paribas PrudentialFinancial
WestpacBanking
Top 5 Syndicated Lender Credit by Sector ($m)
Wind Solar
Biofuel, Biomass & Waste Geothermal, Marine, Small Hydro
8
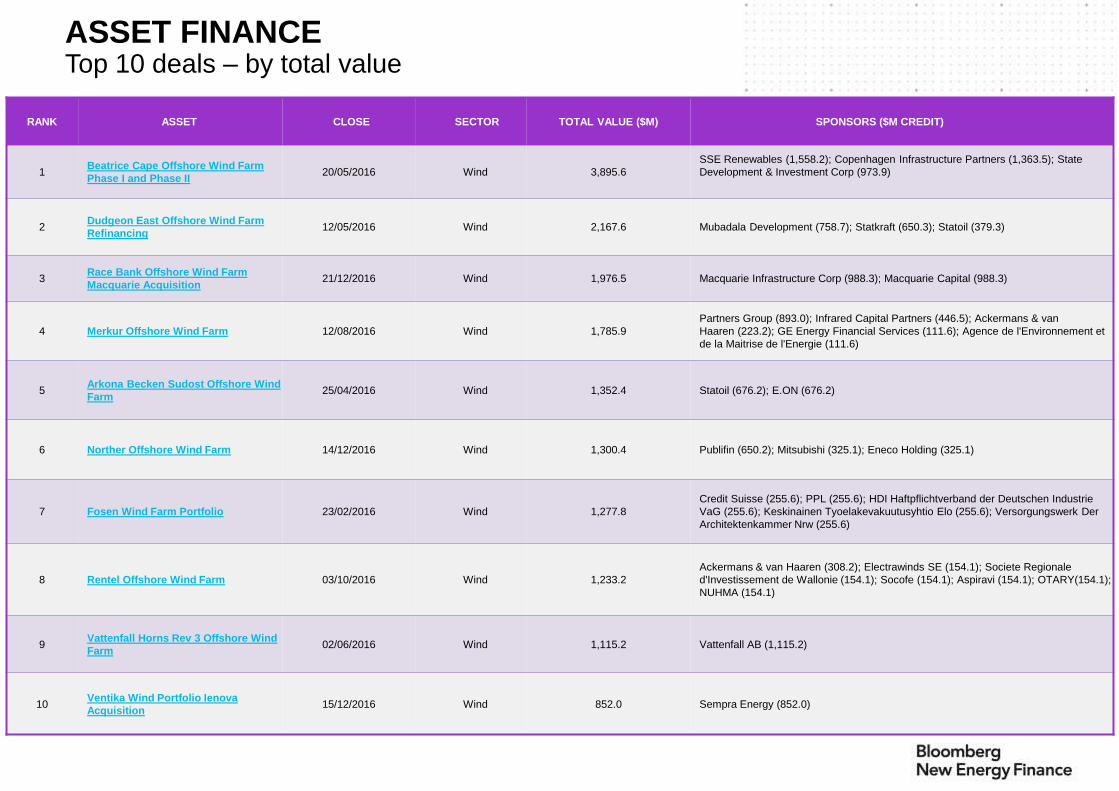
ASSET FINANCETop 10 deals – by total value
RANK ASSET CLOSE SECTOR TOTAL VALUE ($M) SPONSORS ($M CREDIT)
1Beatrice Cape Offshore Wind Farm
Phase I and Phase II20/05/2016 Wind 3,895.6
SSE Renewables (1,558.2); Copenhagen Infrastructure Partners (1,363.5); State
Development & Investment Corp (973.9)
2Dudgeon East Offshore Wind Farm
Refinancing12/05/2016 Wind 2,167.6 Mubadala Development (758.7); Statkraft (650.3); Statoil (379.3)
3Race Bank Offshore Wind Farm
Macquarie Acquisition21/12/2016 Wind 1,976.5 Macquarie Infrastructure Corp (988.3); Macquarie Capital (988.3)
4 Merkur Offshore Wind Farm 12/08/2016 Wind 1,785.9
Partners Group (893.0); Infrared Capital Partners (446.5); Ackermans & van
Haaren (223.2); GE Energy Financial Services (111.6); Agence de l'Environnement et
de la Maitrise de l'Energie (111.6)
5Arkona Becken Sudost Offshore Wind
Farm25/04/2016 Wind 1,352.4 Statoil (676.2); E.ON (676.2)
6 Norther Offshore Wind Farm 14/12/2016 Wind 1,300.4 Publifin (650.2); Mitsubishi (325.1); Eneco Holding (325.1)
7 Fosen Wind Farm Portfolio 23/02/2016 Wind 1,277.8
Credit Suisse (255.6); PPL (255.6); HDI Haftpflichtverband der Deutschen Industrie
VaG (255.6); Keskinainen Tyoelakevakuutusyhtio Elo (255.6); Versorgungswerk Der
Architektenkammer Nrw (255.6)
8 Rentel Offshore Wind Farm 03/10/2016 Wind 1,233.2
Ackermans & van Haaren (308.2); Electrawinds SE (154.1); Societe Regionale
d'Investissement de Wallonie (154.1); Socofe (154.1); Aspiravi (154.1); OTARY(154.1);
NUHMA (154.1)
9Vattenfall Horns Rev 3 Offshore Wind
Farm02/06/2016 Wind 1,115.2 Vattenfall AB (1,115.2)
10Ventika Wind Portfolio Ienova
Acquisition15/12/2016 Wind 852.0 Sempra Energy (852.0)
9
ASSET FINANCESponsors
RANKQ3 2016
RANKORGANISATION COUNT CREDIT ($M)
TABLE
SHARE (%)
Q3 2016
SHARE (%)
TABLE SHARE
CHANGE (%)
1 1 Enel 20 2,966.7 2.76 3.58 -0.82
2 5 China Datang Corp 29 2,438.2 2.27 1.78 0.49
3 6 State Power Investment Corp 56 1,987.5 1.85 1.72 0.13
4 2 SSE Renewables 1 1,558.2 1.45 2.22 -0.77
5 3 Vattenfall 6 1,465.9 1.36 2.09 -0.73
6 10 China General Nuclear Power Corp 32 1,369.8 1.27 1.45 -0.18
7 17 NextEra Energy 20 1,369.0 1.27 1.18 0.09
8 4 Copenhagen Infrastructure Partners 3 1,363.5 1.27 1.94 -0.67
9 16 Partners Group Holding 1 1,313.5 1.22 1.27 -0.05
10 24 GD Power Development 11 1,301.8 1.21 0.93 0.28
11 43 Sempra Energy 6 1,282.8 1.19 0.61 0.58
12 28 Electricite de France 14 1,179.8 1.10 0.85 0.25
13 7 E.ON SE 3 1,176.2 1.09 1.68 -0.59
14 - Macquarie Infrastructure Corp 1 1,132.3 1.05 - 1.05
15 12 Southern Co 14 1,126.0 1.04 1.41 -0.37
16 8 State Development & Investment Corp 7 1,101.4 1.02 1.57 -0.55
17 29 China Huaneng 28 1,085.4 1.01 0.84 0.17
18 9 Statoil 3 1,055.5 0.98 1.50 -0.52
19 45Jiangsu Dison Silink New Energy
Investment 4 1,049.5 0.98 0.56 0.42
20 23Xinjiang Goldwind Science &
Technology16 1,018.3 0.95 0.95 0.00
63%
33%
3%
1%
Asset Finance Sponsor Breakdown by Sector
0.00
500.00
1,000.00
1,500.00
2,000.00
2,500.00
3,000.00
3,500.00
Enel China DatangCorp
State PowerInvestment
Corp
SSERenewables
Vattenfall
Top 5 Sponsor Credit by Sector ($m)
Wind Solar
Biofuel, Biomass & Waste Geothermal, Marine, Small Hydro
10
ASSET FINANCELegal advisers
RANKQ3 2016
RANKORGANISATION COUNT CREDIT ($M)
TABLE
SHARE (%)
Q3 2016
SHARE (%)
TABLE SHARE
CHANGE (%)
1 1 Linklaters 20 9,939.3 19.20 21.48 -2.28
2 2 Clifford Chance 19 5,382.0 10.40 13.75 -3.35
3 3 Norton Rose Fulbright 24 5,194.7 10.03 11.58 -1.55
4 4 Allen & Overy 10 4,868.1 9.40 8.87 0.53
5 5 Hogan Lovells 5 1,972.4 3.81 5.32 -1.51
6 6 Chadbourne & Parke 6 1,756.3 3.39 4.19 -0.80
7 9 Ashurst 10 1,615.9 3.12 2.67 0.45
8 8 Watson Farley & Williams 23 1,430.4 2.76 2.70 0.06
9 7 Orrick Herrington & Sutcliffe 12 1,416.6 2.74 2.71 0.03
10 18 Jones Day 4 1,272.0 2.46 1.26 1.20
11 11 Uria Menendez Abogados 2 1,201.5 2.32 1.83 0.49
12 12 Stikeman Elliott 3 1,094.6 2.11 1.82 0.29
13 15 Torys 5 1,040.0 2.01 1.67 0.34
14 16 Simpson Thacher & Bartlett 9 977.7 1.89 1.62 0.27
15 22 Milbank Tweed Hadley & McCloy 27 799.3 1.54 0.75 0.79
16 19 Garrigues Abogados 4 796.5 1.53 1.00 0.54
17 14 Herbert Smith Freehills 6 747.3 1.44 1.72 -0.28
18 10 Shearman & Sterling 4 695.1 1.34 2.07 -0.73
19 27 King & Wood Mallesons 3 637.7 1.23 0.59 0.64
20 13 Latham & Watkins 5 632.8 1.22 1.76 -0.54
71%
27%
1% 1%
Asset Finance Legal Adviser Breakdown by Sector
0.00
2,000.00
4,000.00
6,000.00
8,000.00
10,000.00
12,000.00
Linklaters CliffordChance
Norton RoseFulbright
Allen & Overy HoganLovells
Top 5 Legal Adviser Credit by Sector ($m)
Wind Solar
Biofuel, Biomass & Waste Geothermal, Marine, Small Hydro
11
ASSET FINANCEFinancial advisers
RANKQ3 2016
RANKORGANISATION COUNT CREDIT ($M)
TABLE
SHARE (%)
Q3 2016
SHARE (%)
TABLE SHARE
CHANGE (%)
1 18 Mitsubishi UFJ Financial 2 4,029.7 20.84 1.38 19.46
2 - Societe Generale 1 2,167.6 11.21 - 11.21
3 2 BNP Paribas 6 1,877.9 9.71 10.92 -1.21
4 22 Green Giraffe Capital Partners 3 1,512.3 7.82 0.49 7.33
5 1 Citigroup 3 1,266.8 6.55 16.20 -9.65
6 3 FIH Holding 2 958.6 4.96 9.86 -4.90
7 4 Deutsche Bank 2 893.0 4.62 9.18 -4.56
7 4 New Amsterdam Capital Partners 1 893.0 4.62 9.18 -4.56
9 6 Banco Santander 2 532.4 2.75 5.48 -2.73
10 - Australia & New Zealand Banking 1 438.1 2.26 - 2.26
11 7 PricewaterhouseCoopers 2 426.1 2.20 4.38 -2.18
12 8Elgar Middleton Infrastructure and
Energy Finance 2 421.1 2.18 4.33 -2.15
13 9 Barclays 1 373.1 1.93 3.84 -1.91
14 10 Greenhill & Co 1 352.1 1.82 3.62 -1.80
14 10 Borghesi Colombo e Associati 1 352.1 1.82 3.62 -1.80
16 16 Greentech Capital Advisors 3 350.0 1.81 1.82 -0.01
17 29 Ernst & Young 4 273.4 1.41 0.00 1.41
18 - Rothschild & Co 3 248.0 1.28 - 1.28
19 12 Morgan Stanley 1 226.9 1.17 2.33 -1.16
20 13 Cosime Infrastructure and Energy 1 226.4 1.16 2.34 -1.17
79%
18%
3%
Asset Finance Financial Adviser Breakdown by Sector
0.00
500.00
1,000.00
1,500.00
2,000.00
2,500.00
3,000.00
3,500.00
4,000.00
4,500.00
MitsubishiUFJ Financial
SocieteGenerale
BNP Paribas Green GiraffeCapital
Citigroup
Top 5 Financial Adviser Credit by Sector ($m)
Wind Solar
Biofuel, Biomass & Waste Geothermal, Marine, Small Hydro
12
ASSET FINANCETax equity
RANKQ3 2016
RANKORGANISATION COUNT CREDIT ($M)
TABLE
SHARE (%)
Q3 2016
SHARE (%)
TABLE SHARE
CHANGE (%)
1 2 Bank of America 11 1,121.4 40.06 32.43 7.63
2 1 Citigroup 5 505.0 18.04 67.57 -49.53
3 3 Bank of New York Mellon 3 438.1 15.65 0.00 15.65
4 3 JPMorgan Chase 6 215.0 7.68 0.00 7.68
4 - MetLife Inc 2 215.0 7.68 - 7.68
6 - General Electric 4 180.0 6.43 - 6.43
7 3 Wells Fargo & Co 3 125.0 4.47 0.00 4.47
8 - Goldman Sachs 1 0.0 0.00 - 0.00
8 3 Toyota Tsusho 1 0.0 0.00 0.00 0.00
8 - Credit Suisse 1 0.0 0.00 - 0.00
8 3 US Bank 1 0.0 0.00 0.00 0.00
8 - PNC Financial Services Group 1 0.0 0.00 - 0.00
8 3 Mitsubishi UFJ Financial 1 0.0 0.00 0.00 0.00
8 3 Capital One Financial Corp 1 0.0 0.00 0.00 0.00
14
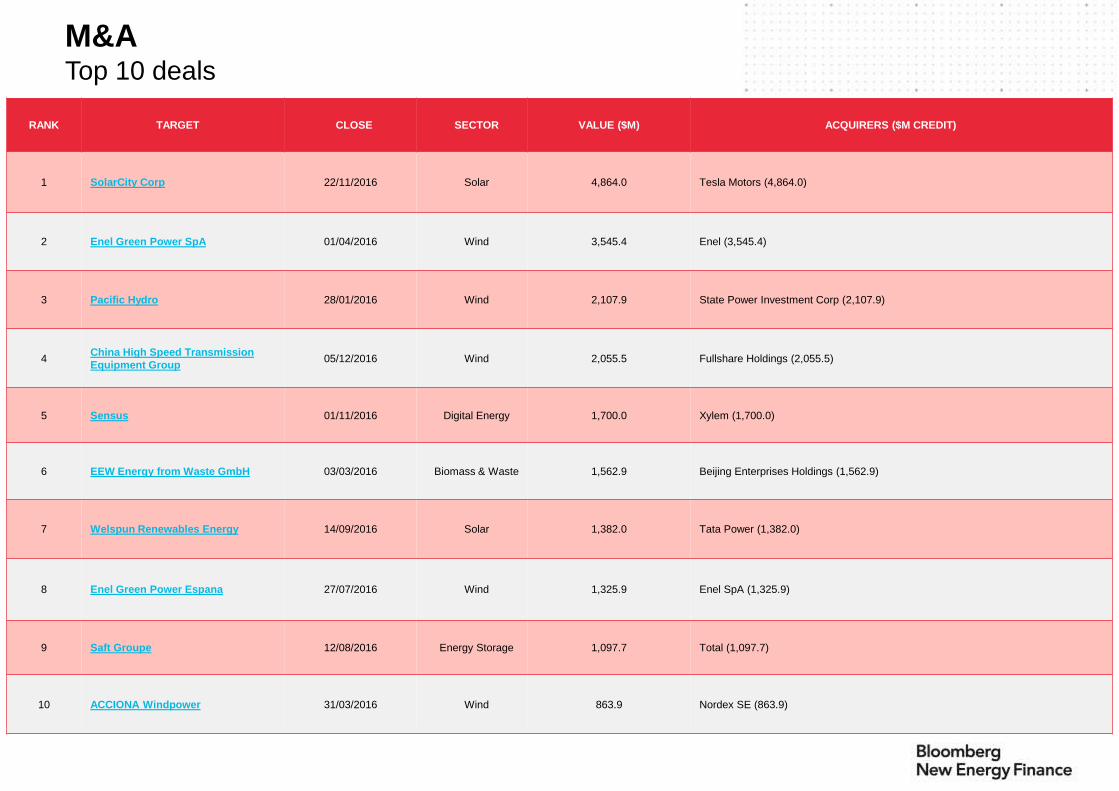
M&ATop 10 deals
RANK TARGET CLOSE SECTOR VALUE ($M) ACQUIRERS ($M CREDIT)
1 SolarCity Corp 22/11/2016 Solar 4,864.0 Tesla Motors (4,864.0)
2 Enel Green Power SpA 01/04/2016 Wind 3,545.4 Enel (3,545.4)
3 Pacific Hydro 28/01/2016 Wind 2,107.9 State Power Investment Corp (2,107.9)
4China High Speed Transmission
Equipment Group 05/12/2016 Wind 2,055.5 Fullshare Holdings (2,055.5)
5 Sensus 01/11/2016 Digital Energy 1,700.0 Xylem (1,700.0)
6 EEW Energy from Waste GmbH 03/03/2016 Biomass & Waste 1,562.9 Beijing Enterprises Holdings (1,562.9)
7 Welspun Renewables Energy 14/09/2016 Solar 1,382.0 Tata Power (1,382.0)
8 Enel Green Power Espana 27/07/2016 Wind 1,325.9 Enel SpA (1,325.9)
9 Saft Groupe 12/08/2016 Energy Storage 1,097.7 Total (1,097.7)
10 ACCIONA Windpower 31/03/2016 Wind 863.9 Nordex SE (863.9)
15
M&AAcquirers
RANKQ3 2016
RANKORGANISATION COUNT CREDIT ($M)
TABLE
SHARE (%)
Q3 2016
SHARE (%)
TABLE SHARE
CHANGE (%)
1 1 Enel 2 4,871.3 17.50 32.10 -14.60
2 - Tesla Motors 1 4,864.0 17.47 - 17.47
3 2 State Power Investment 1 2,107.9 7.57 13.89 -6.32
4 - Fullshare Holdings 1 2,055.5 7.38 - 7.38
5 - Xylem 1 1,700.0 6.11 - 6.11
6 3 Beijing Enterprises Holdings 1 1,562.9 5.61 10.30 -4.69
7 4 Tata Power 1 1,382.0 4.96 9.11 -4.15
8 5 Total 2 1,267.8 4.55 7.23 -2.68
9 6 Nordex 1 863.9 3.10 5.69 -2.59
10 - Tongwei Group 1 822.2 2.95 - 2.95
11 7 China Three Gorges 1 714.8 2.57 4.71 -2.14
12 - CHINT Group 1 661.0 2.37 - 2.37
13 - Sino-American Silicon Products 1 641.7 2.30 - 2.30
14 - Capital Stage 1 638.1 2.29 - 2.29
15 8 Oracle 1 509.4 1.83 3.36 -1.53
16 - Cambourne Investment 1 392.0 1.41 - 1.41
17 9 Nibe Industrier 1 364.0 1.31 2.40 -1.09
18 - Ultor 1 313.0 1.12 - 1.12
19 10 Centrica 2 225.2 0.81 1.48 -0.67
20 11 Zhongli Science & Technology Group 1 172.2 0.62 1.13 -0.51
40%
38%
6%
1% 5%
10%
M&A Acquirers Breakdown by Sector
0.00
1,000.00
2,000.00
3,000.00
4,000.00
5,000.00
6,000.00
Enel Tesla Motors State PowerInvestment
Corp
Fullshare Xylem
Top 5 M&A Acquirer Credit by Sector ($m)
Efficiency: Built Environment, Digital Energy
Energy Storage, Fuel Cells
Electrified Transport
Geothermal, Marine, Small Hydro, Hydrogen
Biofuel, Biomass & Waste
Solar
Wind
16
Venture Capital
/ Private Equity.
17
VC/PETop 10 deals
RANK TARGET CLOSE SECTOR VALUE ($M) INVESTORS ($M CREDIT)
1 Le Holdings 20/09/2016 Electrified Transport 1,080.0Legend Holdings (270.0); Yingda International (270.0); Tonghai Holdings (270.0);
Private Investor (270.0)
2 WM Motor Technology 16/08/2016 Electrified Transport 1,000.0 None Disclosed
3 Sunnova Energy Corp 21/03/2016 Solar 300.0 Energy Capital Partners (300.0)
4 China Ming Yang Wind Power Group 23/06/2016 Wind 257.8 Zhongshan Ruisheng Antai (257.8)
5 Jiangxi JinkoSolar 15/11/2016 Solar 250.0 Shangrao Kangsheng Technology (250.0)
6 Greenko Energy 07/06/2016 Wind 230.0 GIC (115.0); Abu Dhabi Investment Authority (115.0)
7 Solar Mosaic 04/08/2016 Solar 220.0Core Innovation Capital (73.3); Warburg Pincus (73.3); Obvious Management Services
(73.3)
8 Altus Power 04/10/2016 Solar 205.0Global Atlantic Financial Group (68.3); Goldman Sachs (68.3); Jacobs Financial Group
(68.3)
9 United Wind 06/01/2016 Wind 142.0 Forum Equity Partners (142.0)
10 Hindustan Cleanenergy 22/11/2016 Solar 130.0 Bank of America (65.0); Farallon Capital Management (65.0)
18
VC/PEInvestors by credit
RANKQ3 2016
RANKORGANISATION COUNT CREDIT ($M)
TABLE
SHARE
(%)
Q3 2016
SHARE (%)
TABLE SHARE
CHANGE (%)
1 1 Energy Capital Partners 2 375.0 7.73 10.61 -2.88
2 2 Legend Holdings 1 270.0 5.57 7.64 -2.07
2 2 Tonghai Holdings 1 270.0 5.57 7.64 -2.07
2 2 Yingda International Holdings 1 270.0 5.57 7.64 -2.07
5 5 Zhongshan Ruisheng Antai 1 257.8 5.28 7.30 -2.02
6 - Shangrao Kangsheng Technology 1 250.0 5.15 - 5.15
7 6 Forum Equity Partners 2 146.0 3.01 4.13 -1.12
8 14 Goldman Sachs 3 133.3 2.75 1.84 0.91
9 7 Leo Group 1 120.1 2.48 3.40 -0.92
10 8 GIC 1 115.0 2.37 3.25 -0.88
10 8 Abu Dhabi Investment Authority 1 115.0 2.37 3.25 -0.88
12 - Allianz 1 108.6 2.24 - 2.24
13 10 Warburg Pincus 1 73.3 1.51 2.08 -0.57
13 10 Obvious Management Services 1 73.3 1.51 2.08 -0.57
13 10 Core Innovation Capital 1 73.3 1.51 2.08 -0.57
16 - Basalt Infrastructure Partners 1 70.0 1.44 - 1.44
17 - 3i Group 1 69.0 1.42 - 1.42
18 - Global Atlantic Financial Group 1 68.3 1.41 - 1.41
18 - Jacobs Financial Group 1 68.3 1.41 - 1.41
20 13 Manulife Financial 1 66.1 1.36 1.87 -0.51
17%
36%
5%
3%
26%
5%
8%
VC/PE Investors Breakdown by Sector
0.00
100.00
200.00
300.00
400.00
Energy CapitalPartners
LegendHoldings
TonghaiHoldings
YingdaInternational
Holdings
ZhongshanRuisheng
Antai
Top 5 VC/PE Investors Credit by Sector ($m)
Efficiency: Built Environment, Digital Energy
Energy Storage, Fuel Cells
Electrified Transport
Geothermal, Marine, Small Hydro, Hydrogen
Biofuel, Biomass & Waste
Solar
Wind
19
VC/PEInvestors by deal count
RANK ORGANISATION COUNT CREDIT ($M)
TABLE
SHARE
(%)
1 Engie 9 25.9 0.56
2 Demeter Partners 6 18.8 0.41
2 Total (Energy Ventures) 6 17.6 0.38
4 Prelude Ventures 5 21.9 0.48
5 Khosla Ventures 4 7.6 0.16
6 RWE 3 21.9 0.48
6 Goldman Sachs 3 133.3 2.90
6 Overseas Private Investment Corp 3 42.5 0.93
6 General Electric 3 24.2 0.53
6 Oak Investment Partners 3 21.4 0.47
6 Claremont Creek Ventures 3 21.1 0.46
6 Exelon Corp 3 18.3 0.40
6 Statoil 3 12.3 0.27
6 Business Development Bank of Canada 3 0.9 0.02
15 Energy Capital Partners 2 375.0 8.16
15 Forum Equity Partners 2 146.0 3.18
15 CEZ 2 37.2 0.81
15 Invesco 2 27.8 0.61
15 Zhejiang Vie Science & Technology 2 24.0 0.52
15 Vision Ridge Partners 2 21.8 0.48
22%
41%
5%
11%
7%
14%
VC/PE Investors Breakdown by Sector
0
2
4
6
8
10
Engie DemeterPartners
Total PreludeVentures
Khosla Ventures
Top 5 VC/PE (count) by Sector ($m)
Efficiency: Built Environment, Digital Energy
Energy Storage, Fuel Cells
Electrified Transport
Geothermal, Marine, Small Hydro, Hydrogen
Biofuel, Biomass & Waste
Solar
Wind

20
Advisers.
21
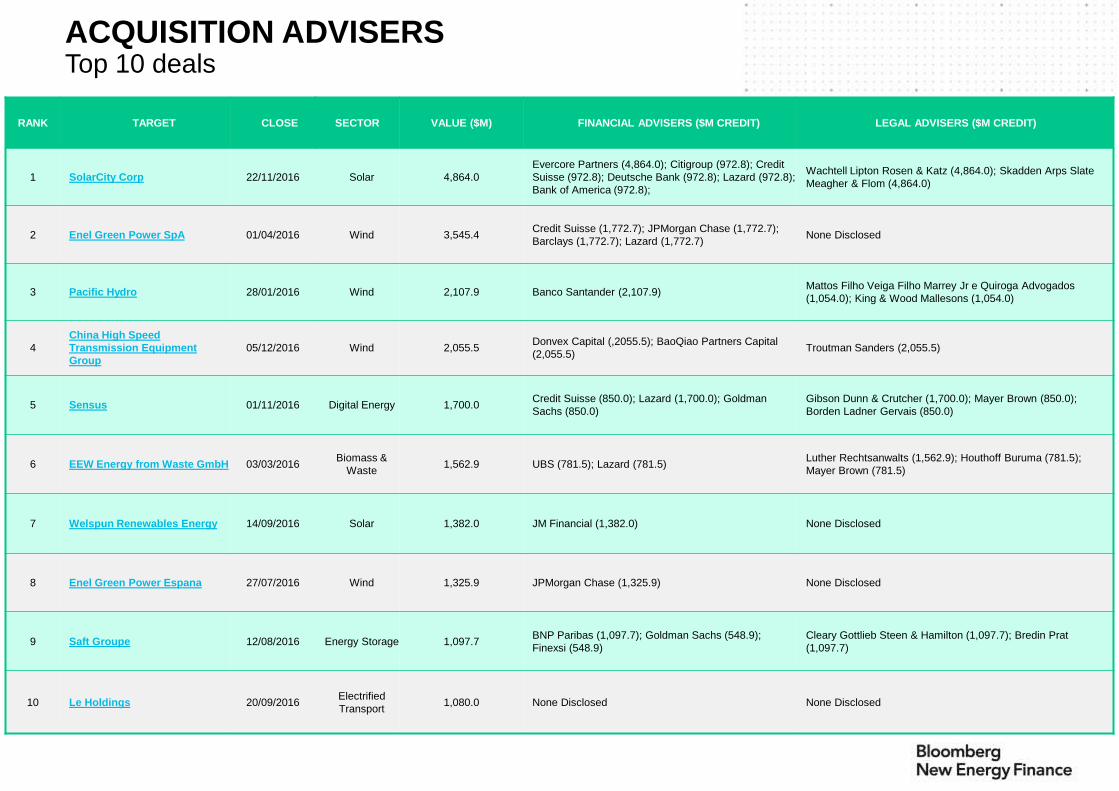
ACQUISITION ADVISERS Top 10 deals
RANK TARGET CLOSE SECTOR VALUE ($M) FINANCIAL ADVISERS ($M CREDIT) LEGAL ADVISERS ($M CREDIT)
1 SolarCity Corp 22/11/2016 Solar 4,864.0
Evercore Partners (4,864.0); Citigroup (972.8); Credit
Suisse (972.8); Deutsche Bank (972.8); Lazard (972.8);
Bank of America (972.8);
Wachtell Lipton Rosen & Katz (4,864.0); Skadden Arps Slate
Meagher & Flom (4,864.0)
2 Enel Green Power SpA 01/04/2016 Wind 3,545.4Credit Suisse (1,772.7); JPMorgan Chase (1,772.7);
Barclays (1,772.7); Lazard (1,772.7)None Disclosed
3 Pacific Hydro 28/01/2016 Wind 2,107.9 Banco Santander (2,107.9)Mattos Filho Veiga Filho Marrey Jr e Quiroga Advogados
(1,054.0); King & Wood Mallesons (1,054.0)
4
China High Speed
Transmission Equipment
Group
05/12/2016 Wind 2,055.5Donvex Capital (,2055.5); BaoQiao Partners Capital
(2,055.5)Troutman Sanders (2,055.5)
5 Sensus 01/11/2016 Digital Energy 1,700.0Credit Suisse (850.0); Lazard (1,700.0); Goldman
Sachs (850.0)
Gibson Dunn & Crutcher (1,700.0); Mayer Brown (850.0);
Borden Ladner Gervais (850.0)
6 EEW Energy from Waste GmbH 03/03/2016Biomass &
Waste1,562.9 UBS (781.5); Lazard (781.5)
Luther Rechtsanwalts (1,562.9); Houthoff Buruma (781.5);
Mayer Brown (781.5)
7 Welspun Renewables Energy 14/09/2016 Solar 1,382.0 JM Financial (1,382.0) None Disclosed
8 Enel Green Power Espana 27/07/2016 Wind 1,325.9 JPMorgan Chase (1,325.9) None Disclosed
9 Saft Groupe 12/08/2016 Energy Storage 1,097.7BNP Paribas (1,097.7); Goldman Sachs (548.9);
Finexsi (548.9)
Cleary Gottlieb Steen & Hamilton (1,097.7); Bredin Prat
(1,097.7)
10 Le Holdings 20/09/2016Electrified
Transport1,080.0 None Disclosed None Disclosed

22
M&A AND VC/PEFinancial advisers
RANKQ3 2016
RANKORGANISATION COUNT CREDIT ($M)
TABLE
SHARE (%)
Q3 2016
SHARE (%)
TABLE SHARE
CHANGE (%)
1 2 Lazard 6 6,178.1 14.54 13.10 1.44
2 - Evercore Partners 1 4,864.0 11.45 - 11.45
3 3 Credit Suisse 5 4,560.3 10.73 12.76 -2.03
4 1 JPMorgan Chase 3 3,142.2 7.40 16.12 -8.72
5 5 Barclays 3 2,243.6 5.28 9.86 -4.58
6 4 Banco Santander 1 2,107.9 4.96 10.81 -5.85
7 - Donvex Capital 1 2,055.5 4.84 - 4.84
7 - BaoQiao Partners Capital 1 2,055.5 4.84 - 4.84
9 9 Goldman Sachs 2 1,398.9 3.29 2.89 0.40
10 6 JM Financial 1 1,382.0 3.25 7.09 -3.84
11 7 BNP Paribas 2 1,097.7 2.58 5.63 -3.05
12 29 Citigroup 2 972.8 2.29 0.00 2.29
12 - Bank of America 1 972.8 2.29 - 2.29
12 - Deutsche Bank 1 972.8 2.29 - 2.29
15 8 UBS 3 844.5 1.99 4.01 -2.02
16 - China Securities 1 822.2 1.94 - 1.94
17 14 Rothschild & Co 3 686.0 1.61 1.51 0.10
18 - Guotai Junan Securities 1 661.0 1.56 - 1.56
19 - Macquarie 1 638.1 1.50 - 1.50
20 9 Finexsi 1 548.9 1.29 2.82 -1.53
39%
42%
4%
5%
10%
M&A & VC/PE Financial Adviser Breakdown by Sector
0.00
1,000.00
2,000.00
3,000.00
4,000.00
5,000.00
6,000.00
7,000.00
Lazard EvercorePartners Inc
Credit Suisse JPMorganChase
Barclays
Top 5 Financial Adviser Credit by Sector ($m)
Digital Energy, Efficiency: Built Environment, Industry, Supply Side
Energy Storage, Fuel Cells
Electrified Transport
Geothermal, Marine, Small Hydro, Hydrogen
Biofuel, Biomass & Waste
Solar
Wind
23
M&A AND VC/PELegal advisers
RANKQ3 2016
RANKORGANISATION COUNT CREDIT ($M)
TABLE
SHARE (%)
Q3 2016
SHARE (%)
TABLE SHARE
CHANGE (%)
1 25 Skadden Arps Slate Meagher & Flom 4 4,928.4 14.40 0.48 13.92
2 - Wachtell Lipton Rosen & Katz 1 4,864.0 14.21 - 14.21
3 4 King & Wood Mallesons 3 2,537.2 7.41 7.89 -0.48
4 41 Troutman Sanders 3 2,305.5 6.73 0.00 6.73
5 41 Gibson Dunn & Crutcher 2 1,700.0 4.97 0.00 4.97
6 8 Mayer Brown 3 1,675.9 4.90 6.18 -1.28
7 1 Luther Rechtsanwalts 1 1,562.9 4.57 11.69 -7.12
8 7 CMS 2 1,502.0 4.39 6.46 -2.07
9 2 Cleary Gottlieb Steen & Hamilton 2 1,222.7 3.57 8.21 -4.64
10 2 Bredin Prat 2 1,097.7 3.21 8.21 -5.00
11 6 Freshfields Bruckhaus Deringer 3 1,074.6 3.14 7.75 -4.61
12 4Mattos Filho Veiga Filho Marrey Jr e
Quiroga Advogados1 1,054.0 3.08 7.89 -4.81
13 12 Latham & Watkins 4 1,053.1 3.08 2.81 0.27
14 - Borden Ladner Gervais 1 850.0 2.48 - 2.48
15 9 Houthoff Buruma 1 781.5 2.28 5.85 -3.57
16 10 Hengeler Mueller 1 714.8 2.09 5.35 -3.26
17 16 Linklaters 2 600.2 1.75 1.56 0.19
18 15 White & Case 2 550.9 1.61 1.72 -0.11
19 11 Goodwin Procter 3 549.4 1.60 3.81 -2.21
20 - LCS & Partners 1 320.9 0.94 - 0.94
22%
46%
10%
7%
15%
M&A & VC/PE Legal Adviser Breakdown by Sector
0.00
1,000.00
2,000.00
3,000.00
4,000.00
5,000.00
6,000.00
Skadden ArpsSlate Meagher
& Flom
WachtellLipton Rosen
& Katz
King & WoodMallesons
TroutmanSanders
Gibson Dunn& Crutcher
Top 5 Legal Adviser Credit by Sector ($m)
Digital Energy, Efficiency: Built Environment, Industry, Supply Side
Energy Storage, Fuel Cells
Electrified Transport
Geothermal, Marine, Small Hydro, Hydrogen
Biofuel, Biomass & Waste
Solar
Wind

24
Public Markets.
25
PUBLIC MARKETSTop 10 deals
RANK ORGANISATION CLOSE SECTOR VALUE ($M) LEAD MANAGERS ($M CREDIT) CO-LEAD MANAGERS ($M CREDIT) LEGAL ADVISERS ($M CREDIT)
1 Innogy SE 07/10/2016 Solar 5,175.6Goldman Sachs (2,587.8); Deutsche Bank
(2,587.8)
BNP Paribas (862.6); Credit Suisse (862.6); UBS
(862.6); Goldman Sachs (862.6); Deutsche Bank
(862.6); Bank of America (862.6)
Cravath Swaine & Moore (2,587.8);
Hengeler Mueller (2,587.8)
2 DONG Energy 09/06/2016 Wind 3,016.2Morgan Stanley (1,005.4); JPMorgan Chase
(1,005.4); Nordea Bank (1,005.4)
Morgan Stanley (502.7); Citigroup (502.7); Nordea
Bank (502.7); UBS (502.7); JPMorgan Chase
(502.7); Danske Bank (502.7)
Gorrissen Federspiel Kierkeg (1,508.1);
Davis Polk & Wardwell (1508.1);
Latham & Watkins (1,508.1); Kromann
Reumert (1,508.1)
3 Tesla Motors 19/05/2016Electrified
Transport2,300.0 Morgan Stanley (2,300.0)
Citigroup (575.0); Bank of America (575.0); Goldman
Sachs (575.0); Deutsche Bank (575.0)
Simpson Thacher & Bartlett (2,300.0);
Wilson Sonsini Goodrich & Rosati
(2,300.0)
4 BYD 25/07/2016Electrified
Transport2,166.8 None Disclosed
Guosen Securities (433.4); China International
Capital (433.4); China Merchants Securities (433.4);
UBS Securities (433.4); Beijing Gao Hua Securities
(433.4)
Tian Yuan Law Firm (2166.8)
5 Philips Lighting 27/05/2016Efficiency: Built
Environment965.4
Goldman Sachs (482.7); JPMorgan Chase
(482.7)
Goldman Sachs (160.9); ING (160.9); Morgan
Stanley (160.9); Citigroup (160.9); JPMorgan Chase
(160.9); Societe Generale (160.9)
De Brauw Blackstone Westbroek
(482.7); Stibbe (482.7); Sullivan &
Cromwell (482.7); Davis Polk &
Wardwell (482.7)
6 Ningbo Sanxing Electric 07/06/2016 Digital Energy 457.1 Orient Securities (457.1) None Disclosed Allbright Law (457.1)
7 Sungrow Power Supply 13/07/2016 Solar 396.1 CITIC Securities (396.1) None Disclosed Llinks Law (396.1)
8 NextEra Energy Partners 08/09/2016 Wind 352.6 Bank of America (352.6)Wells Fargo & Co (117.5); Morgan Stanley (117.5);
UBS (117.5)
Hunton & Williams (352.6); Morgan
Lewis & Bockius (352.6)
9 Nibe Industrier 04/10/2016 Solar 350.2 None Disclosed None Disclosed None Disclosed
10 Hexing Electrical 10/11/2016 Digital Energy 324.8 None DisclosedChina International Capital (162.4); China
Development Bank (162.4)Grandall Law Firm (324.8)
26
PUBLIC MARKETSLead managers
RANKQ3 2016
RANKORGANISATION COUNT CREDIT ($M)
TABLE
SHARE (%)
Q3 2016
SHARE (%)
TABLE SHARE
CHANGE (%)
1 1 Morgan Stanley 3 3,595.4 24.35 39.73 -15.38
2 4 Goldman Sachs 2 3,070.5 20.80 5.33 15.47
3 10 Deutsche Bank 2 2,683.5 18.18 1.06 17.12
4 2 JPMorgan Chase 4 1,662.9 11.26 17.50 -6.24
5 3 Nordea Bank 1 1,005.4 6.81 11.11 -4.30
6 7 Royal Bank of Canada 3 597.8 4.05 4.58 -0.53
7 6 Bank of America 3 564.8 3.83 4.94 -1.11
8 5 Orient Securities 1 457.1 3.10 5.05 -1.95
9 8 CITIC Securities 1 396.1 2.68 4.38 -1.70
10 9 China International Capital 1 137.6 0.93 1.52 -0.59
11 10 Citigroup 1 95.7 0.65 1.06 -0.41
12 12 SDIC Essence 1 89.8 0.61 0.99 -0.38
13 - Barclays 1 61.4 0.42 - 0.42
14 13 Dr August Oetker 1 54.9 0.37 0.61 -0.24
15 14 UOB-Kay Hian 1 52.7 0.36 0.58 -0.22
16 - National Bank of Canada 2 50.9 0.34 - 0.34
17 15 Carnegie Fondkommission 1 41.5 0.28 0.56 -0.28
18 16 Zhongtai Securities 1 37.6 0.25 0.42 -0.17
19 - Roth Capital Partners 3 28.8 0.20 - 0.20
20 17 Fubon Financial 2 21.7 0.15 0.21 -0.06
37%
38%
1%
14%
10%
Public Markets Lead Manager Breakdown by Sector
0.00
500.00
1,000.00
1,500.00
2,000.00
2,500.00
3,000.00
3,500.00
4,000.00
MorganStanley
GoldmanSachs
DeutscheBank
JPMorganChase
Nordea Bank
Top 5 Lead Manager Credit by Sector ($m)
Digital Energy, Efficiency: Built Environment, Industry, Supply Side
Energy Storage, Fuel Cells
Electrified Transport
Geothermal, Marine, Small Hydro, Hydrogen
Biofuel, Biomass & Waste
Solar
Wind
27
PUBLIC MARKETSCo-lead managers
RANKQ3 2016
RANKORGANISATION COUNT CREDIT ($M)
TABLE
SHARE (%)
Q3 2016
SHARE (%)
TABLE SHARE
CHANGE (%)
1 3 Goldman Sachs 3 1,598.5 10.15 9.90 0.25
2 5 Bank of America 4 1,546.1 9.82 9.20 0.62
3 6 UBS Group AG 3 1,482.8 9.42 8.34 1.08
4 7 Deutsche Bank 3 1,478.6 9.39 8.29 1.10
5 1 Citigroup 6 1,370.7 8.71 18.12 -9.41
6 2 Morgan Stanley 7 1,000.2 6.35 12.39 -6.04
7 - Credit Suisse 2 924.0 5.87 - 5.87
8 - BNP Paribas 1 862.6 5.48 - 5.48
9 4 JPMorgan Chase 6 766.8 4.87 9.74 -4.87
10 - China International Capital Corp 2 595.8 3.78 - 3.78
11 8 Nordea Bank 1 502.7 3.19 6.76 -3.57
11 8 Danske Bank 1 502.7 3.19 6.76 -3.57
13 - Guosen Securities 1 433.4 2.75 - 2.75
13 - China Merchants Securities 1 433.4 2.75 - 2.75
13 - UBS Securities 1 433.4 2.75 - 2.75
13 - Beijing Gao Hua Securities 1 433.4 2.75 - 2.75
17 12 Wells Fargo & Co 3 172.5 1.10 2.00 -0.90
18 - China Development Bank 1 162.4 1.03 - 1.03
19 10 Societe Generale 1 160.9 1.02 2.16 -1.14
19 10 ING 1 160.9 1.02 2.16 -1.14
28%
40%
23%
9%
Public Markets Co-Lead Manager Breakdown by Sector
0.00
500.00
1,000.00
1,500.00
2,000.00
GoldmanSachs
Bank ofAmerica
UBS DeutscheBank
Citigroup
Top 5 Co-Lead Manager Credit by Sector ($m)
Digital Energy, Efficiency: Built Environment, Industry, Supply Side
Energy Storage, Fuel Cells
Electrified Transport
Geothermal, Marine, Small Hydro, Hydrogen
Biofuel, Biomass & Waste
Solar
Wind
28
PUBLIC MARKETSLegal advisers
RANKQ3 2016
RANKORGANISATION COUNT CREDIT ($M)
TABLE
SHARE (%)
Q3 2016
SHARE (%)
TABLE SHARE
CHANGE (%)
1 - Hengeler Mueller 1 2,587.8 10.02 - 10.02
1 - Cravath Swaine & Moore 1 2,587.8 10.02 - 10.02
3 1 Wilson Sonsini Goodrich & Rosati 1 2,300.0 8.90 11.69 -2.79
3 1 Simpson Thacher & Bartlett 1 2,300.0 8.90 11.69 -2.79
5 3 Tian Yuan Law Firm 1 2,166.8 8.39 11.01 -2.62
6 4 Davis Polk & Wardwell 3 2,125.9 8.23 10.80 -2.57
7 5 Latham & Watkins 2 1,538.8 5.96 7.66 -1.70
8 5 Kromann Reumert 1 1,508.1 5.84 7.66 -1.82
8 5 Gorrissen Federspiel Kierkeg 1 1,508.1 5.84 7.66 -1.82
10 8 Morgan Lewis & Bockius 3 711.4 2.75 3.61 -0.86
11 9 Hunton & Williams 2 642.6 2.49 3.27 -0.78
12 20 Grandall Law Firm 3 483.4 1.87 0.81 1.06
13 10 Sullivan & Cromwell 1 482.7 1.87 2.45 -0.58
13 10 De Brauw Blackstone Westbroek 1 482.7 1.87 2.45 -0.58
13 10 Stibbe BV 1 482.7 1.87 2.45 -0.58
16 13 Allbright Law 1 457.1 1.77 2.32 -0.55
17 14 Llinks Law 1 396.1 1.53 2.01 -0.48
18 18 Norton Rose Fulbright 4 390.5 1.51 1.05 0.46
19 21 Travers Smith 2 327.7 1.27 0.73 0.54
20 15 White & Case 1 287.1 1.11 1.46 -0.35
40%
30%
2%
16%
12%
Public Markets Legal Adviser Breakdown by Sector
0.00
500.00
1,000.00
1,500.00
2,000.00
2,500.00
3,000.00
HengelerMueller
CravathSwaine &
Moore
Wilson SonsiniGoodrich &
Rosati
SimpsonThacher &
Bartlett
Tian YuanLaw Firm
Top 5 Legal Adviser Credit by Sector ($m)
Digital Energy, Efficiency: Built Environment, Industry, Supply Side
Energy Storage, Fuel Cells
Electrified Transport
Geothermal, Marine, Small Hydro, Hydrogen
Biofuel, Biomass & Waste
Solar
Wind
29
GUIDELINES
Accuracy.
Due to the dynamic nature of the BNEF online product, league table rankings may vary between this release and data found on the BNEF website
following the release date. BNEF Clean Energy League Tables represent only transactions that are executed and about which BNEF has been notified.
BNEF does all it can to guarantee the accuracy of deal input data. Organisations are recommended to contact the league table team directly prior to
quarterly publication to ensure that all applicable deals are correctly reflected in the BNEF database.
Submissions.
Three weeks prior to the quarter/year end, all missing submissions for the quarter/year end must be submitted. Participants should also notify BNEF of
all deals expected to close within the final two weeks of the quarter/year end, and must provide subsequent confirmation of the closing date, prior to the
BNEF League Tables being locked.
Preliminary tables are provided two weeks prior to quarter end for all participants. Any data feedback received following publication of the Q1 to Q4
league tables will be rectified in the following quarter’s publication only.
Any time prior to the final submission deadline, at the participant’s request, a full inventory of only that participant’s submissions can be sent out for
review. Submissions will be accepted if received prior to the final week of the quarter. Any information received after this time may not be included in the
final league table publication but will be updated on the BNEF database.
BNEF reserves the right of final decision concerning league table eligibility and requires adequate documentation for the same. Bloomberg LP and its
suppliers believe the information herein was obtained from reliable sources, but do not guarantee its accuracy. Neither the information nor the opinion
expressed constitutes a solicitation of the purchase or sale of securities or commodities.
Accuracy claims & enquiries.
All league table participants have the right to examine the accuracy of league table data as published on the BNEF website. All accuracy claims and
inquiries must be submitted in writing and with adequate explanation and documentation. BNEF will investigate all accuracy claims and inquiries in a
timely manner, but cannot assure completion of its investigation by the respective league table deadlines.
30
This publication is the copyright of Bloomberg New Energy Finance. No portion of this document may be photocopied,
reproduced, scanned into an electronic system or transmitted, forwarded or distributed in any way without prior consent of
Bloomberg New Energy Finance.
The information contained in this publication is derived from carefully selected sources we believe are reasonable. We do
not guarantee its accuracy or completeness and nothing in this document shall be construed to be a representation of such
a guarantee. Any opinions expressed reflect the current judgment of the author of the relevant article or features, and does
not necessarily reflect the opinion of Bloomberg New Energy Finance, Bloomberg Finance L.P., Bloomberg L.P. or any of
their affiliates ("Bloomberg"). The opinions presented are subject to change without notice. Bloomberg accepts no
responsibility for any liability arising from use of this document or its contents. Nothing herein shall constitute or be
construed as an offering of financial instruments, or as investment advice or recommendations by Bloomberg of an
investment strategy or whether or not to "buy," "sell" or "hold" an investment.
8 April 2015
COPYRIGHT AND DISCLAIMER
Bloomberg New Energy Finance (BNEF) is a research firm that helps energy
professionals generate opportunities. With a team of experts spread across six
continents, BNEF provides independent analysis and insight, enabling decision-
makers to navigate change in an evolving energy economy.
Leveraging the most sophisticated new energy data sets in the world, BNEF
synthesizes proprietary data into astute narratives that frame the financial,
economic and policy implications of emerging energy technologies.
Bloomberg New Energy Finance is powered by Bloomberg’s global network of
19,000 employees in 192 locations, reporting 5,000 news stories a day.
Visit about.bnef.com.
COVERAGE
Renewable Energy
Power & Utilities
Energy Smart Technologies
Transport
Gas
Carbon Markets & Climate Negotiations