Embed Size (px)
Citation preview

Section 1.2 Functions and Graphs 13
1.2 Functions and Graphs
You will be able to use the lan-
guage, notation, and graphical
representation of functions to
express relationships between
variable quantities.
• Function, domain, and range
• Interval notation
Graphs in the coordinate plane
• Odd and even symmetry
• Piecewise-defined functions,
including absolute value
• Composite functions
x
Input
(Domain)
f(x)
Output(Range)
Figure 1.6 A "machine" diagram for a
function.
Leonhard Euler (1707—1783)
Leonhard Euler, thedominant mathemati-
cal figure of his cen-tury and the mostprolific mathematicianever, was also anastronomer, physicist,
botanist, and chemist,
and an expert in ori-ental languages. His work was the first togive the function concept the prominencethat it has in mathematics today. Euler'scollected books and papers fill 72 volumes.This does not count his enormous corre-spondence to approximately 300 address-es. His introductory algebra text, writtenoriginally in German (Euler was Swiss), isstill available in English translation.
Functions
We assumed some familiarity with the language of functions and graphs in Section 1.1,
where we connected lines in the coordinate plane with their algebraic representations,
called linear functions. In this section we will review some of the other terminology asso-
ciated with functions and graphs so that you will be comfortable with them in the chapters
to come.
DEFINITION Function (and Related Terms)
A function from a set D to a set R is a rule that assigns to every element in D a
unique element in R. The set of all input values in D is the domain of the function,
and the set of all output values in R is the range of the function. In function notation,
we use f(x) to denote the range value that f assigns to the domain value x. The set
of all points (x, y) in the coordinate plane determined by the rule y = f(x) is the
graph of the function f. The variable x is the independent variable and the vari-
able y is the dependent variable.
Most of the functions in this course will be from the real numbers to the real numbers.
Indeed, this course might be more fully described as "the calculus of real functions of a
real variable." In this context, the domain is a subset (not always the whole set) of the real
numbers, as is the range.
The uniqueness in the definition of f(x) is essential. It might be helpful to think off as a machine that assigns a unique range value to every domain value (Figure 1.6). If
the same x were put into the same machine, the same f(x) would result. On the otherhand, two (or more) different domain values could be assigned the same range value(Figure 1.7).
D = domain set DR = range set
(a) (b)
Figure 1.7 (a) A function from a set D to a set R. (b) Not a function. The assignment isnot unique.
Euler invented a symbolic way to say "y is a function of x":
Y f(x),
which we read as "y equals f of x." This notation enables us to give different functionsdifferent names by changing the letters we use. To say that the boiling point of water is afunction of elevation, we can write b = f(e). To say that the area of a circle is a functionof the circle's radius, we can write A = A(r), giving the function the same name as thedependent variable.
14 Chapter Prerequisites for Calculus
0
Name: The set of all real numbers
Notation: —00 < x < oc or (—00, 00)
a
Name: The set of numbers greater than a
Notation: a < x or (a, cc)
a
Name: The set of numbers greater than
or equal to a
Notation: a s x or [a, cc)
b
Name: The set of numbers less than b
Notation: x < b or (—00, b)
b
Name: The set of numbers less than
or equal to b
Notation: x b or (—00, b]
Figure 1.10 Infinite intervals—rays on the
number line and the number line itself.
The symbol 00 (infinity) is used merely
for convenience; it does not mean there is
a number 00.
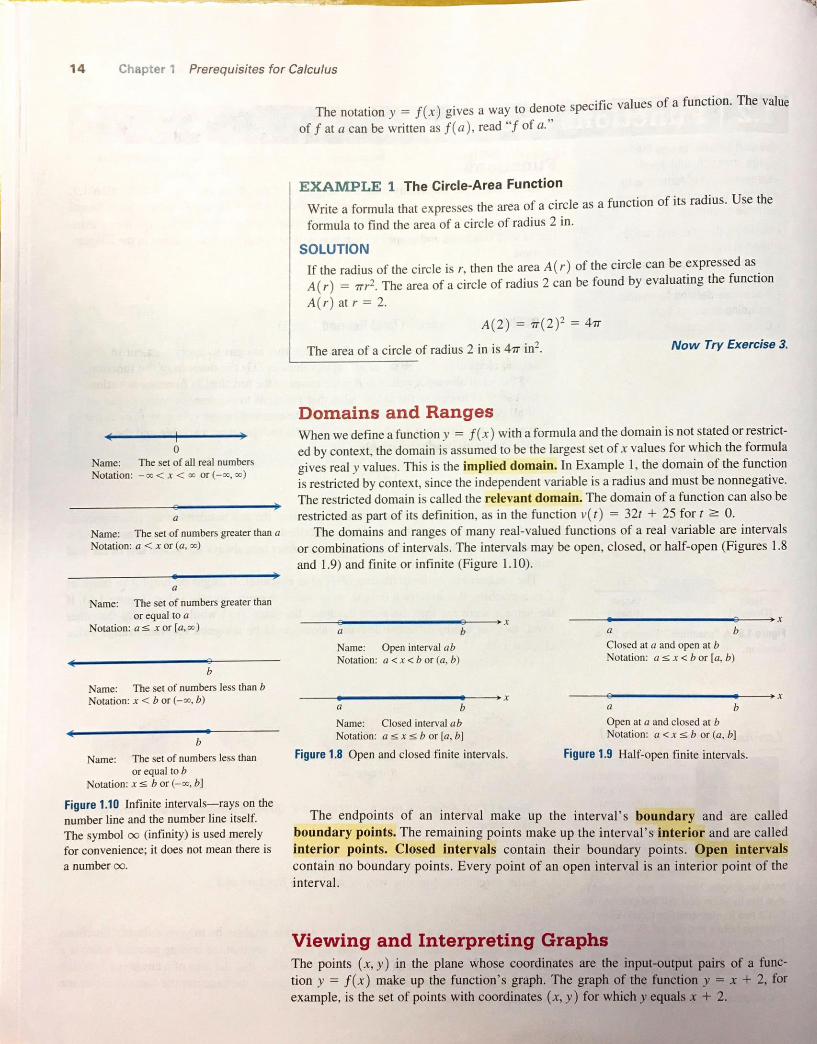
The notation y = f(x) gives a way to denote specific values of a function. The value
of f at a can be written as f(a), read "f of a."
EXAMPLE 1 The Circle-Area Function
Write a formula that expresses the area of a circle as a function of its radius. Use the
formula to find the area of a circle of radius 2 in.
SOLUTION
If the radius of the circle is r, then the area A(r) of the circle can be expressed as
A(r) = Trr2 . The area of a circle of radius 2 can be found by evaluating the function
A(r) at r = 2.
A(2) =
The area of a circle of radius 2 in is 47 in 2.
Domains and Ranges
= 47
Now Try Exercise 3.
When we define a function y = f(x) with a formula and the domain is not stated or restrict-
ed by context, the domain is assumed to be the largest set of x values for which the formula
gives real y values. This is the implied domain. In Example 1, the domain of the function
is restricted by context, since the independent variable is a radius and must be nonnegative.
The restricted domain is called the relevant domain. The domain of a function can also be
restricted as part of its definition, as in the function v(t) 32t + 25 fort 0.
The domains and ranges of many real-valued functions of a real variable are intervals
or combinations of intervals. The intervals may be open, closed, or half-open (Figures 1.8
and 1.9) and finite or infinite (Figure 1.10).
x xa a b
Name: Open interval ab Closed at a and open at b
Notation: a < x < b or (a, b) Notation: a s x < b or [a, b)
x xa b a b
Name: Closed interval ab Open at a and closed at b
Notation: a b or [a, b] Notation: a < x b or (a, b]
Figure 1.8 Open and closed finite intervals. Figure 1.9 Half-open finite intervals.
The endpoints of an interval make up the interval's boundary and are calledboundary points. The remaining points make up the interval's interior and are calledinterior points. Closed intervals contain their boundary points. Open intervalscontain no boundary points. Every point of an open interval is an interior point of the
interval.
Viewing and Interpreting Graphs
The points (x, y) in the plane whose coordinates are the input-output pairs of a func-
tion y = f(x) make up the function's graph. The graph of the function y = x + 2, for
example, is the set of points with coordinates (x, y) for which y equals x + 2.

Power Function
Any function that can be written in the
form f(x) = kxa, where k and a are
nonzero constants, is a power function.
Section 1.2 Functions and Graphs 15
EXAMPLE 2 Identifying Domain and Range of a Function
Identify the domain and range, and then sketch a graph of the function.
1
x
SOLUTION(a) The formula gives a real y value for every real x value except x = 0. (We cannot divide
any number by 0.) The domain is (—00, 0) U (0, 00). The value y takes on every real
number except y = 0. (y = c # 0 if x = l/c). The range is also (—00, 0) CJ (0, 00).
A sketch is shown in Figure 1.1 la.
4 4
3 3
2 2
1 1
x x-1 1 2 3 4
-2 -1 1 2 5 6
-1 -1
2 -2
(a) (b)
Figure 1.11 A sketch of the graph of (a) y = l/x and (b) y = Vx. (Example 2)
(b) The formula gives a real number only when x is positive or zero. The domain is
[ 0, 00). Because AvFx denotes the principal square root of x, y is greater than or equal
to zero. The range is also [0, 00). A sketch is shown in Figure 1.11b.
Now Try Exercise 9.
Graphing with pencil and paper requires that you develop graph drawing skills.
Graphing with a grapher (graphing calculator) requires that you develop graph viewing
skills.
Graph Viewing Skills
1. Recognize that the graph is reasonable.
2. See all the important characteristics of the graph.
3. Interpret those characteristics.
4. Recognize grapher failure.
Being able to recognize that a graph is reasonable comes with experience. You need
to know the basic functions, their graphs, and how changes in their equations affect the
graphs.
Grapherfailure occurs when the graph produced by a grapher is less than precise—or
even incorrect—usually due to the limitations of the screen resolution of the grapher.

16 Chapter Prerequisites for Calculus
Graphing y = x2F—PossibleGrapher Failure
On some graphing calculators you needto enter this function as y = (x2 ) 1 /3 ory = (x l /3 )2 to obtain a correct graph.
Try graphing this function on your grapher.
2x
x
(a)
3
x
(b)
Figure 1.13 (a) The graph of y = x2
(an even function) is symmetric about the
y-axis. (b) The graph of y x 3 (an odd
function) is symmetric about the origin.
EXAMPLE 3 Identifying Domain and Range of a Function
Use a grapher to identify the domain and range, and then draw a graph of the function.
2 (b) Y = x2/3
SOLUTION
(a) Figure 1.12a shows a graph of the function for —4.7 x 4.7 and
—3.1 s y 3.1, that is, the viewing window [—4.7, 4.7] by [—3.1, 3.1 ] , with
x-scale y-scale l. The graph appears to be the upper half of a circle. The
domain appears to be [—2, 2]. This observation is correct because we must have
4 — x 2 2 0, or equivalently, —2 x 2. The range appears to be [0, 2], which
can also be verified algebraically.
[-4.7, 4.7] by [-3.1, 3.1]
(a)
2/3
[-4.7, 4.71 by [-2.1, 4.1]
(b)
Figure 1.12 The graph of (a) y — 4 — x 2 and (b) y = x 2/3. (Example 3)
(b) Figure 1.12b shows a graph of the function in the viewing window [—4.7, 4.7] by
[—2.1, 4.1 ] , with x-scale = y-scale = l. The domain appears to be (—00, 00), which
we can verify by observing that x2/3 = ( Also the range is [0, 00) by the same
observation. Now Try Exercise 15.
Even Functions and Odd Functions—Symmetry
The graphs of even and odd functions have important symmetry properties.
DEFINITIONS Even Function, Odd Function
A function y = f(x) is an
even function of x If f( x)
odd function of x If f( x)
for every x in the function's domain.
2The names even and odd come from powers of x. If y is an even power of x, as in y = x
or y = x4, it is an even function of x(because (—x) 2 x2 and (—x)4 = x4 ). If y is an
odd power of x, as in y = x or y = x3, it is an odd function of x (because (—x)and ( —x
The graph of an even function is symmetric about the y-axis. Since f(—x) = f(x), a
point (x, y) lies on the graph if and only if the point ( —x, y) lies on the graph (Figure 1.13a)•
The graph of an odd function is symmetric about the origin. Since f(—x)
point (x, y) lies on the graph if and only if the point ( —x, —y) lies on the graph (Figure 1.13b),

Section 1.2 Functions and Graphs 17
Equivalently, a graph is symmetric about the origin if a rotation of 1800 about the origin leaves
2y = x
xo
(a)
x
x1
(b)
Figure 1.14 (a) When we add the constant
term 1 to the function y = x 2, the result-
ing function y = x 2 + 1 is still even
and its graph is still symmetric about the
y-axis. (b) When we add the constant
term 1 to the function y = x, the result-
ing function y = x + 1 is no longer odd.
The symmetry about the origin is lost.
(Example 4)
x2, 0 1
[-3, 3] by 3]
Figure 1.15 The graph of a piecewise-defined function. (Example 5)
the graph unchanged.
EXAMPLE 4 Recognizing Even and Odd Functions
f(x) = x2
f(x)
x
f(x) =
Even function: ( —x) — x 2 for all x; symmetry about y-axis.
Even function•. (—x) 2 + 1 = x 2 + 1 for all x; symmetry about
y-axis (Figure l. 14a).
Odd function: ( —x) = —x for all x; symmetry about the origin.
Not odd: f(—x) = —x + 1, but —f(x) = —x — 1. The two are
not equal.
Not even: ( —x) + 1 # x + 1 for all x # 0 (Figure 1.14b).
Now Try Exercises 21 and 23.
It is useful in graphing to recognize even and odd functions. Once we know the graph
of either type of function on one side of the y-axis, we know its graph on both sides.
Piecewise-Defined Functions
While some functions are defined by single formulas, others are defined by applying dif-
ferent formulas to different parts of their domains.
EXAMPLE 5 Graphing Piecewise-Defined Functions
—x,
Graph y f(x) — x2
1,
SOLUTIONThe values of f are given by three separate formulas: y = —x when x < 0, y = x2
when 0 x 1, and y = 1 when x > 1. However, the function is just one function,whose domain is the entire set of real numbers (Figure 1.15).
Now Try Exercise 33.
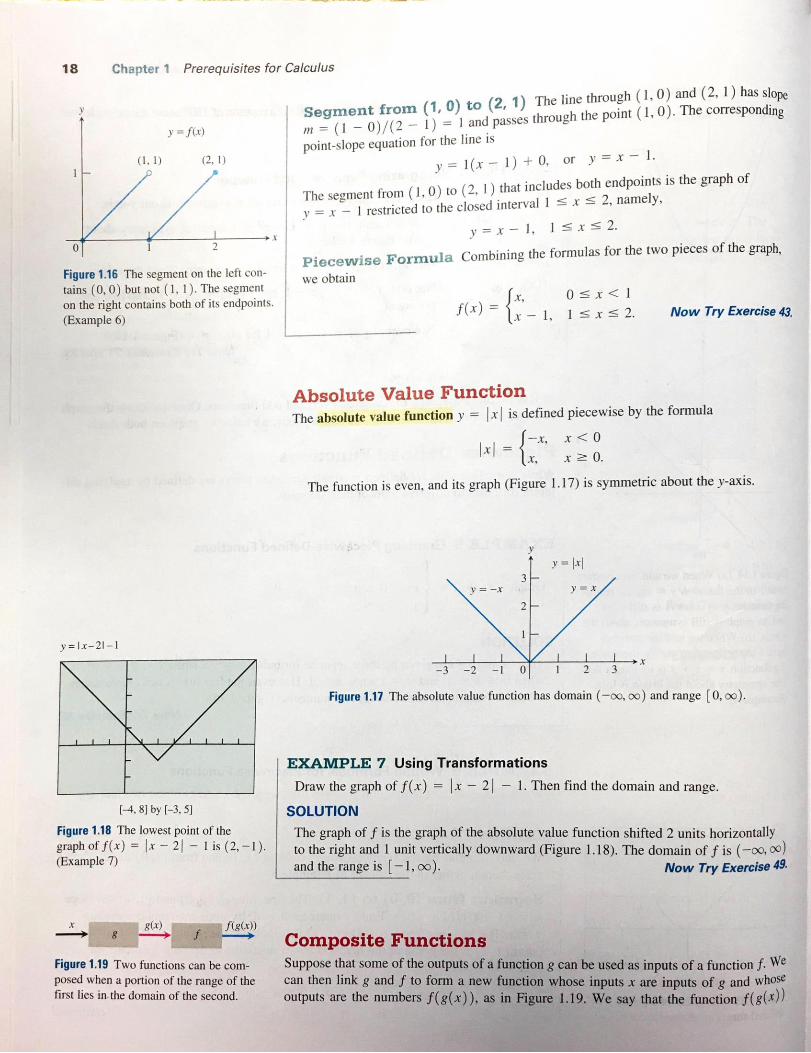
EXAMPLE 6 Writing Formulas for Piecewise Functions
Write a formula for the function y = f(x) whose graph consists of the two line seg-ments in Figure 1.16.
SOLUTIONWe find formulas for the segments from (0, 0) to (1, 1) and from (1, 0) to (2, 1) andpiece them together in the manner of Example 5.
Segment from (O, O) to (1, 1) The line through (0, 0) and (1, 1) has slope— 1 and y-intercept b = 0. Its slope-intercept equation is
y = x. The segment from (0, 0) to (l, l) that includes the point (0, 0) but not thepoint ( 1, 1) is the graph of the function y = x restricted to the half-open interval
0 x < 1, namely,
continued
18 Chapter 1 Prerequisites for Calculus
1
x0 1 2
Figure 1.16 The segment on the left con-
tains (0, 0) but not (1, 1). The segment
on the right contains both of its endpoints.
(Example 6)
y=lx-21-1
8] by [—3, 5]
Figure 1.18 The lowest point of the
graph of f(x) = x —21(Example 7)
x g(x)
Figure 1.19 Two functions can be com-posed when a portion of the range of thefirst lies in the domain of the second.
Segment from (1, O) to (2, 1) The line through (1, O) and (2, 1) has slope
= 1 and passes through the point ( 1, 0). The corresponding
point-slope equation for the line is
y = I (x— l) +0, or y = x— 1.
The segment from ( l, 0) to (2, l) that includes both endpoints is the graph of
— I restricted to the closed interval 1 x 2, namely,
Piecewise Formula Combining the formulas for the two pieces of the graph,
we obtain
x,f( x ) = Now Try Exercise 43.
Absolute Value Function
The absolute value function y = IXI is defined piecewise by the formula
xx,
The function is even, and its graph (Figure 1.17) is symmetric about the y-axis.
3
2
1
x-3 -2 1 2 3
Figure 1.17 The absolute value function has domain (—00, 00) and range [0, 00).
EXAMPLE 7 Using TransformationsDraw the graph of f(x) x -21 — l. Then find the domain and range.
SOLUTIONThe graph of f is the graph of the absolute value function shifted 2 units horizontally
to the right and 1 unit vertically downward (Figure 1.18). The domain of f is (—00, 00 )and the range IS [—l, 00). Now Try Exercise 49.
Composite Functions
Suppose that some of the outputs of a function g can be used as inputs of a function f. We
can then link g and f to form a new function whose inputs x are inputs of g and whoseoutputs are the numbers f(g(x)), as in Figure 1.19. We say that the function

Section 1.2 Functions and Graphs 19
Composition Is Not Commutative
Function composition is not a commuta-
tive operation. In Example 8, (fo g)(x)— 7, but (g o f)(x) = (x - 7) 2 . For
most functions, fog go f.
(read "f of g of x") is the composite of g and f. It is made by composing g and f in the
order of first g, then f. The usual "stand-alone" notation for this composite is f o g, which
is read as "f of g." Thus, the value of fog at x is (fo g)(x) = f(g(x)).
EXAMPLE 8 Composing Functions
Find a formula for f(g(x)) if g(x) = x2 and f(x)
SOLUTIONTo find f(g(x) ), we replace x in the formula f(x)
for g(x).
f(x) =
g(x)
- x - 7. Then find
— x — 7 by the expression given
2
We then find the value of ) by substituting 2 for x.
= (2) 2 -7Now Try Exercise 51.
EXPLORATION 1 Composing Functions
Some graphers allow a function such as to be used as the independent variable of
another function. With such a grapher, we can compose functions.
1. Enter the functions = f(x) 4 — x2,Y2 = g(x) = =
and = Which of Y'3 and Y'4 corresponds to f o g? to g o f?
2. Graph h, h, and Y'3 and make conjectures about the domain and range of )'3.
3. Graph Y'l, h, and Y'4 and make conjectures about the domain and range of )'4.
4. Confirm your conjectures algebraically by finding formulas for and )'4.
Exercise numbers with a gray background indicate problems that the In Exercises 9—12, find all real solutions to the equations.
authors have designed to be solved without a calculator.
In Exercises 1—6, solve for x.
1.3x-1 5x +3
5. x2 < 16 6.9 - x2 2 0
9. f(x) = x2
(a) f(x) = 4
(10. f(x) = l/x
(a) f(x)
In Exercises 7 and 8, describe how the graph of f can be transformed to (a) f(x) = 4
the graph of g. 3(-12. f(x) =
x 2, g(x)(a) f(x)
(b) f(x) =
(b) f(x) —-1
8. f(x) = xl, g(x) =

20 Chapter Prerequisites for Calculus
Exerfises
Exercise numbers with a gray background indicate problems that theauthors have designed to be solved without a calculator.In Exercises 1—4, (a) write a formula for the function and (b) use theformula to find the indicated value of the function.
1. the area A of a circle as a function of its diameter d; the area of acircle of diameter 4 in.
2. the height h of an equilateral triangle as a function of its sidelength s; the height of an equilateral triangle of side length 3 m
3. the surface area S of a cube as a function of the length of thecube's edge e; the surface area of a cube of edge length 5 ft
4. the volume V of a sphere as a function of the sphere's radius r;the volume of a sphere of radius 3 cm
In Exercises 5—12, (a) identify the domain and range and (b) sketchthe graph of the function.
5. y = 4 — x2
CIO,
11. (12
In Exercises 13—20, use a grapher to (a) identify the domain andrange and (b) draw the graph of the function.
17. 2/5
19.
14.y=2 3 -x
16.
18. y = x3/2
20.
In Exercises 21—30, determine whether the function is even, odd, or
neither.
23.
25.
27.
29.
22. y = x + x2
24.
26.
28.
30.
In Exercises 31—34, graph the piecewise-defined functions.
31. f(x) = 32. f(x) =VEX,
35. Writing to Learn The vertical line test to determine whether
a curve is the graph of a function states: If every vertical line in
the xy-plane intersects a given curve in at most one point, then
the curve is the graph of a function. Explain why this is true.
36. Writing to Learn For a curve to be symmetric about the
x-axis, the point (x, y) must lie on the curve if and only if the
point (x, —y) lies on the curve. Explain why a curve that is sym-
metric about the x-axis is not the graph of a function, unless the
function is y = 0.
In Exercises 37—40, use the vertical line test (see Exercise 35) to
determine whether the curve is the graph of a function.
37. 38.
39.
In Exercises 41—48, write a piecewise formula for the function.
42.
1 2 3 4
33. f(x) = (3/2)x + 3/2,
34. f(x) =
46.45.
1 2
x3
x
47. 48.
1
x0
x0
In Exercises 49 and 50, (a) draw the graph of the function. Then find
its (b) domain and (c) range.
49. f(x) 50. f(x) = 21 x +41
In Exercises 51 and 52, find
(a) f(g(x))
51. f( x ) = x + 5,
52. f(x) = x + 1,
(b) g(f(x))
g(x)
g(x)
53. Copy and complete the following table.
f(x)
(a)
x
l/x x
(d) I X l, x 20
54. The Cylindrical Can Problem A cylindrical can is to be
constructed so that its height h is equal to its diameter.
(a) Write the volume of the cylinder as a function of its height h.
(b) Write the total surface area of the cylindrical can (including
the top and bottom) as a function of its height h.
(c) Find the volume of the can if its total surface area is 547
square inches.
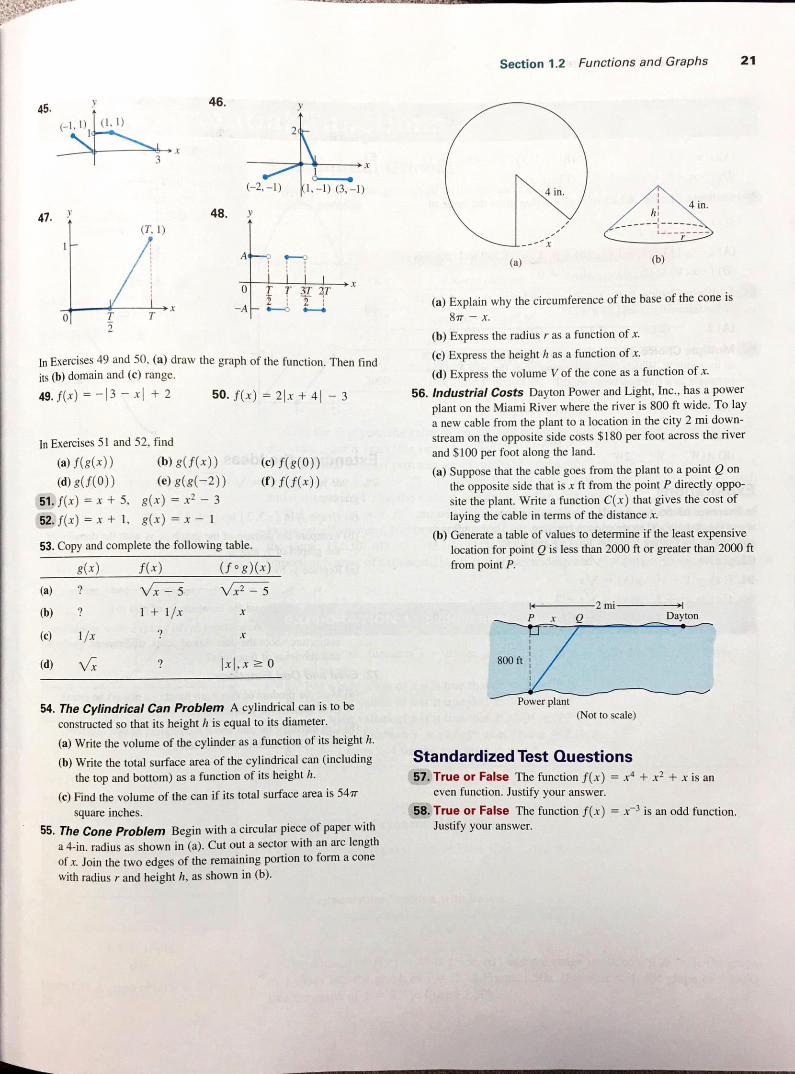
55. The Cone Problem Begin with a circular piece of paper with
a 4-in. radius as shown in (a). Cut out a sector with an arc length
of x. Join the two edges of the remaining portion to form a cone
with radius r and height h, as shown in (b).
Section 1.2 Functions and Graphs 21
4 in.4 in.
x
(a) (b)
(a) Explain why the circumference of the base of the cone is
87 — x.
(b) Express the radius r as a function of x.
(c) Express the height h as a function of x.
(d) Express the volume V of the cone as a function of x.
56. Industrial Costs Dayton Power and Light, Inc., has a power
plant on the Miami River where the river is 800 ft wide. To lay
a new cable from the plant to a location in the city 2 mi down-
stream on the opposite side costs $180 per foot across the river
and $100 per foot along the land.
(a) Suppose that the cable goes from the plant to a point Q on
the opposite side that is x ft from the point P directly oppo-
site the plant. Write a function C(x) that gives the cost of
laying the cable in terms of the distance x.
(b) Generate a table of values to determine if the least expensive
location for point Q is less than 2000 ft or greater than 2000 ft
from point P.
Dayton
800ft
Power plant
(Not to scale)
Standardized Test Questions57. True or False The function f(x) = x4 + x2 + x is an
even function. Justify your answer.
58. True or False The function f(x) = is an odd function.Justify your answer.
22 Chapter 1 Prerequisites for Calculus
59. Multiple Choice Which of the following gives the domain ofx
9 — x2
(D) (-00, -3) U (3, 00 (E) (3, 00
60. Multiple Choice Which of the following gives the range of
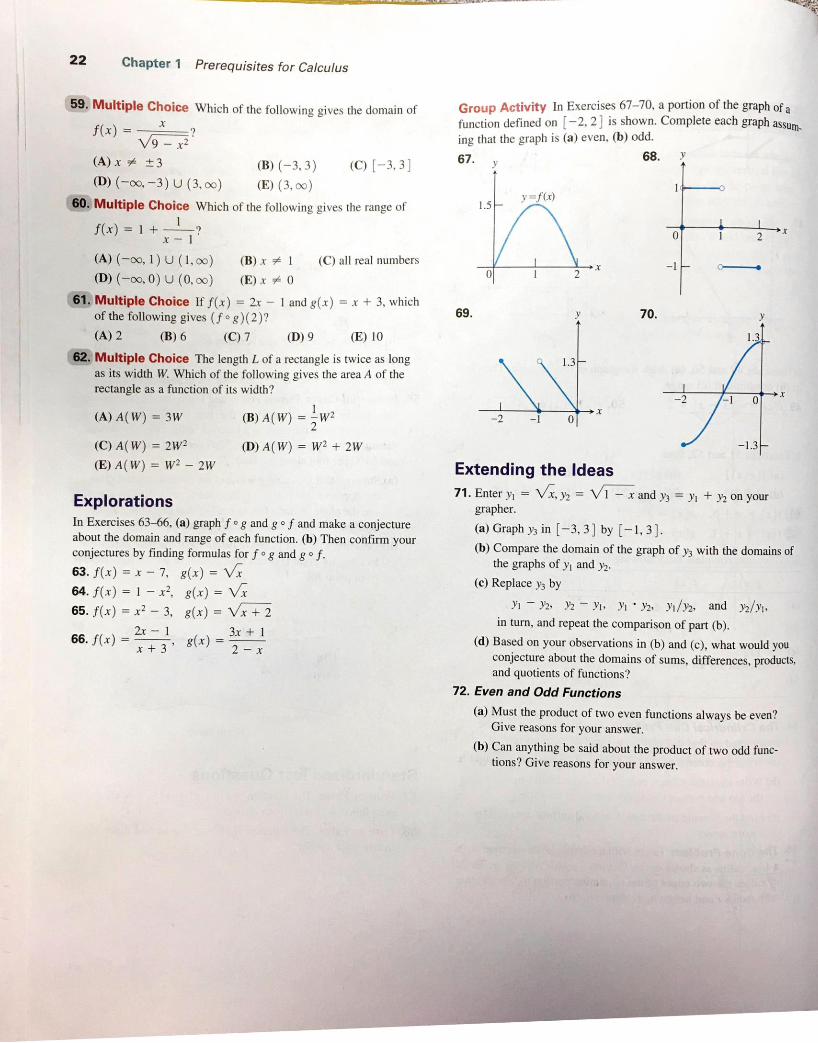
Group Activity In Exercises 67—70, a portion of the graph of a
function defined on [—2, 2] is shown. Complete each graph assum_
ing that the graph is (a) even, (b) odd.
1
(A) (—00, I) CJ (l, 00)
(D) (—00, 0) U (0, 00)
(B) x I
(E) x # 0
(C) all real numbers
(61. Multiple Choice Iff(x) = — I and g(x) = x + 3, whichof the following gives (f o g)(2)?
(E) 10
62. Multiple Choice The length L of a rectangle is twice as longas its width W. Which of the following gives the area A of therectangle as a function of its width?
(A) A(w) = 3W (B) A(w) =-
(C) A(W) = 2W2
(E) A(w) = W2 - 2W
ExplorationsIn Exercises 63—66, (a) graph f o g and g o f and make a conjectureabout the domain and range of each function. (b) Then confirm yourconjectures by finding formulas for f o g and g o f.
63. f(x) = x — 7, g(x) = N'Fx
64. f(x) = I — x2, g(x) =
65. f(x) =
2x-166. f(x) = g(x) =
67. Y
1.5
0
69.
-2
68. Y'
1
o
x -11 2
70.
1.3
-2x
-1
Extending the Ideas
xI 2
1.3
x-1
-1.3
71. Enter = NEX, Y2 = 1 — x and = Yl + Y2 on yourgrapher.
(a) Graph in [—3, 3] by [—1, 3]
(b) Compare the domain of the graph of with the domains ofthe graphs of and h.
(c) Replace by
Yl -h, h - Yl • h, Yi/Y2, and Y2/Yl,in turn, and repeat the comparison of part (b).
(d) Based on your observations in (b) and (c), what would youconjecture about the domains of sums, differences, products,and quotients of functions?
72. Even and Odd Functions
(a) Must the product of two even functions always be even?Give reasons for your answer.
(b) Can anything be said about the product of two odd func-tions? Give reasons for your answer.