Embed Size (px)
Citation preview

59
source: STATISTICS AUSTRIA
region
12.0 Austria´s foreign trade 2017 by world region
million EURexports of goods 2017 1
2 provisional data
1 since 1995 inner-community trade has to be recorded by direct survey (INTRASTAT), so that there is no direct comparability of results before/after 1995
imports of goods 2017 1
12. FOREIGN TRADE & BALANCE OF PAYMENTS
million EURshare (%) share (%)
1 provisional data source: STATISTICS AUSTRIA
Europe 119,180 80.7 112,559 79.3 EU 104,604 70.9 99,038 69.8 EFTA 8,394 5.7 8,021 5.7 Rest of Europe 6,183 4.2 5,500 3.9Overseas 28,435 19.3 29,323 20.7 Asia 18,997 12.9 12,845 9.1 America 7,674 5.2 13,533 9.5 Africa 1,555 1.1 1,651 1.2TOTAL 147,615 100.0 141,918 100.0
1980 22.95 + 17.0 16.44 + 9.7 - 6.52
1990 40.42 + 8.1 33.87 + 8.6 - 6.55
1995 1 48.55 . 42.15 . - 6.402000 74.94 +14.7 69.69 +15.6 - 5.242001 78.69 + 5.0 74.25 + 6.5 - 4.442002 77.10 - 2.0 77.40 + 4.2 + 0.302003 80.99 + 5.0 78.90 + 1.9 - 2.092004 91.09 +12.5 89.85 +13.9 - 1.252005 96.50 + 5.9 94.71 + 5.4 - 1.792006 104.20 + 8.0 103.74 + 9.5 - 0.462007 114.25 + 9.6 114.68 +10.5 + 0.432008 119.57 + 4.7 117.53 + 2.5 - 2.042009 97.57 -18.4 93.74 -20.2 - 3.832010 113.65 +16.5 109.37 +16.7 - 4.282011 131.01 +15.3 121.77 +11.3 - 9.232012 131.98 + 0.7 123.54 + 1.5 - 8.442013 130.71 - 1.0 125.81 + 1.8 - 4.902014 129.85 - 0.7 128.11 + 1.8 - 1.742015 133.53 + 2.8 131.54 + 2.7 - 1.992016 135.67 + 1.6 131.13 - 0.3 - 4.54
2017 ² 147.62 + 8.8 141.92 + 8.2 - 5.70
year
12.1 Foreign trade and trade balance
billion EUR
exports of goodsimports of goods
billion EURannualchange (%)
annualchange (%)
trade balance
billion EUR
60
commodity group (SITC)
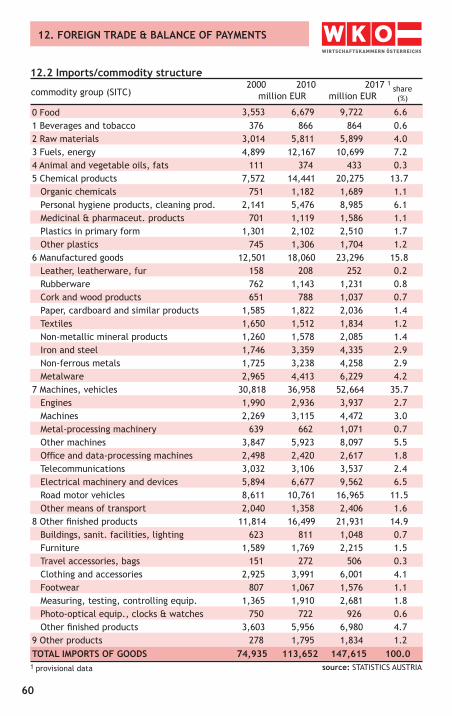
12.2 Imports/commodity structure
million EUR2017 12010
million EURshare(%)
1 provisional data source: STATISTICS AUSTRIA
0 Food 3,553 6,679 9,722 6.61 Beverages and tobacco 376 866 864 0.62 Raw materials 3,014 5,811 5,899 4.03 Fuels, energy 4,899 12,167 10,699 7.24 Animal and vegetable oils, fats 111 374 433 0.35 Chemical products 7,572 14,441 20,275 13.7 Organic chemicals 751 1,182 1,689 1.1 Personal hygiene products, cleaning prod. 2,141 5,476 8,985 6.1 Medicinal & pharmaceut. products 701 1,119 1,586 1.1 Plastics in primary form 1,301 2,102 2,510 1.7 Other plastics 745 1,306 1,704 1.26 Manufactured goods 12,501 18,060 23,296 15.8 Leather, leatherware, fur 158 208 252 0.2 Rubberware 762 1,143 1,231 0.8 Cork and wood products 651 788 1,037 0.7 Paper, cardboard and similar products 1,585 1,822 2,036 1.4 Textiles 1,650 1,512 1,834 1.2 Non-metallic mineral products 1,260 1,578 2,085 1.4 Iron and steel 1,746 3,359 4,335 2.9 Non-ferrous metals 1,725 3,238 4,258 2.9 Metalware 2,965 4,413 6,229 4.27 Machines, vehicles 30,818 36,958 52,664 35.7 Engines 1,990 2,936 3,937 2.7 Machines 2,269 3,115 4,472 3.0 Metal-processing machinery 639 662 1,071 0.7 Other machines 3,847 5,923 8,097 5.5 Office and data-processing machines 2,498 2,420 2,617 1.8 Telecommunications 3,032 3,106 3,537 2.4 Electrical machinery and devices 5,894 6,677 9,562 6.5 Road motor vehicles 8,611 10,761 16,965 11.5 Other means of transport 2,040 1,358 2,406 1.68 Other finished products 11,814 16,499 21,931 14.9 Buildings, sanit. facilities, lighting 623 811 1,048 0.7 Furniture 1,589 1,769 2,215 1.5 Travel accessories, bags 151 272 506 0.3 Clothing and accessories 2,925 3,991 6,001 4.1 Footwear 807 1,067 1,576 1.1 Measuring, testing, controlling equip. 1,365 1,910 2,681 1.8 Photo-optical equip., clocks & watches 750 722 926 0.6 Other finished products 3,603 5,956 6,980 4.79 Other products 278 1,795 1,834 1.2TOTAL IMPORTS OF GOODS 74,935 113,652 147,615 100.0
12. FOREIGN TRADE & BALANCE OF PAYMENTS
2000

61
12. FOREIGN TRADE & BALANCE OF PAYMENTS
commodity group (SITC)
12.3 Exports/commodity structure
million EUR2017 12010
million EURshare(%)
1 provisional data source: STATISTICS AUSTRIA
0 Food 2,478 5,671 7,986 5.61 Beverages and tobacco 780 1,614 2,332 1.62 Raw materials 2,396 3,692 4,481 3.23 Fuels, energy 911 3,511 2,785 2.04 Animal and vegetable oils, fats 54 169 231 0.25 Chemical products 6,427 14,167 19,837 14.0 Organic chemicals 876 1,000 1,233 0.9 Personal hygiene & cleaning products 1,982 6,207 9,934 7.0 Medicinal & pharmaceut. products 276 658 785 0.6 Plastics in primary form 926 1,810 2,171 1.5 Other plastics 1,005 1,748 2,073 1.56 Manufactured goods 16,363 25,162 30,905 21.8 Leather, leatherware, fur 382 407 574 0.4 Rubberware 509 595 554 0.4 Cork and wood products 1,202 2,134 2,579 1.8 Paper, cardboard and similar products 3,240 3,747 4,066 2.9 Textiles 1,872 1,476 1,717 1.2 Non-metallic mineral products 1,489 1,949 2,265 1.6 Iron and steel 2,959 6,083 7,720 5.4 Non-ferrous metals 1,612 3,329 3,804 2.7 Metalware 3,099 5,443 7,626 5.47 Machines, vehicles 30,612 41,365 56,632 39.9 Engines 3,642 6,016 7,057 5.0 Machines 3,789 5,651 8,152 5.7 Metal-processing machinery 660 1,253 1,504 1.1 Other machines 3,937 6,648 9,021 6.4 Office and data-processing machines 1,220 1,023 1,088 0.8 Telecommunications 2,482 1,778 2,548 1.8 Electrical machinery and devices 6,102 7,967 10,630 7.5 Road motor vehicles 6,869 8,711 13,829 9.7 Other means of transport 1,910 2,317 2,803 2.08 Other finished products 9,089 12,924 15,843 11.2 Buildings, sanit. facilities, lighting 591 1,002 1,303 0.9 Furniture 1,200 1,341 1,262 0.9 Travel accessories, bags 22 59 117 0.1 Clothing and accessories 1,260 1,608 2,562 1.8 Footwear 573 572 771 0.5 Measuring, testing, controlling equip. 1,040 1,859 2,630 1.9 Photo-optical equip., clocks & watches 395 585 640 0.5 Other finished products 4,009 5,896 6,559 4.69 Other products 581 1,099 887 0.6TOTAL EXPORTS OF GOODS 69,692 109,373 141,918 100.0
2000
62
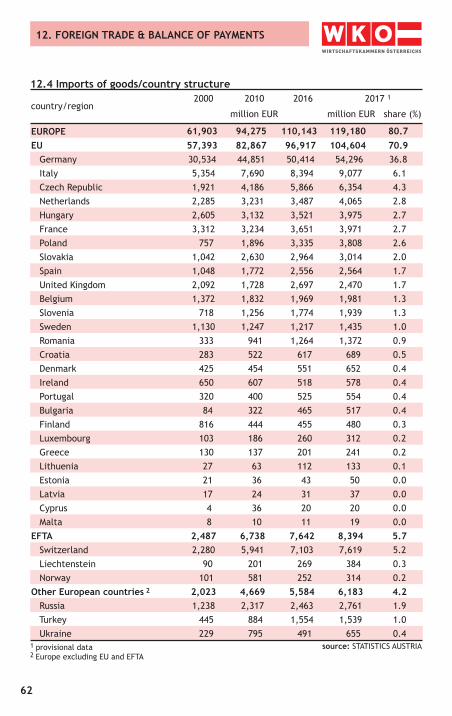
12.4 Imports of goods/country structure
2 Europe excluding EU and EFTA
12. FOREIGN TRADE & BALANCE OF PAYMENTS
country/regionmillion EUR
2017 12016
million EUR share (%)
1 provisional data source: STATISTICS AUSTRIA
EUROPE 61,903 94,275 110,143 119,180 80.7EU 57,393 82,867 96,917 104,604 70.9 Germany 30,534 44,851 50,414 54,296 36.8 Italy 5,354 7,690 8,394 9,077 6.1 Czech Republic 1,921 4,186 5,866 6,354 4.3 Netherlands 2,285 3,231 3,487 4,065 2.8 Hungary 2,605 3,132 3,521 3,975 2.7 France 3,312 3,234 3,651 3,971 2.7 Poland 757 1,896 3,335 3,808 2.6 Slovakia 1,042 2,630 2,964 3,014 2.0 Spain 1,048 1,772 2,556 2,564 1.7 United Kingdom 2,092 1,728 2,697 2,470 1.7 Belgium 1,372 1,832 1,969 1,981 1.3 Slovenia 718 1,256 1,774 1,939 1.3 Sweden 1,130 1,247 1,217 1,435 1.0 Romania 333 941 1,264 1,372 0.9 Croatia 283 522 617 689 0.5 Denmark 425 454 551 652 0.4 Ireland 650 607 518 578 0.4 Portugal 320 400 525 554 0.4 Bulgaria 84 322 465 517 0.4 Finland 816 444 455 480 0.3 Luxembourg 103 186 260 312 0.2 Greece 130 137 201 241 0.2 Lithuenia 27 63 112 133 0.1 Estonia 21 36 43 50 0.0 Latvia 17 24 31 37 0.0 Cyprus 4 36 20 20 0.0 Malta 8 10 11 19 0.0EFTA 2,487 6,738 7,642 8,394 5.7 Switzerland 2,280 5,941 7,103 7,619 5.2 Liechtenstein 90 201 269 384 0.3 Norway 101 581 252 314 0.2Other European countries 2 2,023 4,669 5,584 6,183 4.2 Russia 1,238 2,317 2,463 2,761 1.9 Turkey 445 884 1,554 1,539 1.0 Ukraine 229 795 491 655 0.4
20102000

63
12.4 Imports of goods/country structure
country/regionmillion EUR
2017 12016
million EUR share (%)
1 provisional data source: STATISTICS AUSTRIA
OVERSEAS 13,033 19,377 25,524 28,435 19.3Asia 6,751 12,402 17,330 18,997 12.9 China 1,243 5,428 7,972 8,498 5.8 Japan 2,015 1,777 1,973 2,144 1.5 Kasachstan 384 873 664 945 0.6 South Korea 363 479 755 858 0.6 Vietnam 79 255 764 855 0.6Africa 1,078 1,997 1,365 1,555 1.1North America 4,616 3,624 5,326 6,243 4.2 United States 4,108 3,261 5,002 5,811 3.9 Canada 508 362 324 432 0.3Middle and South America 525 1,252 1,313 1,431 1.0Australia, Oceania 62 103 190 209 0.1
TOTAL IMPORTS OF GOODS 74,935 113,652 135,667 147,615 100.0
20102000
12. FOREIGN TRADE & BALANCE OF PAYMENTS
Austria's imports of goods 2017 by world regions, %-share
EFTA: 5.7 %
EU: 70.9 %
Asia: 12.9 %
others*: 5.4 %
America: 5.2 %
* Rest of Europe: 4.2 %, Africa: 1.1 %, Australia/Oceania: 0.1 %
64
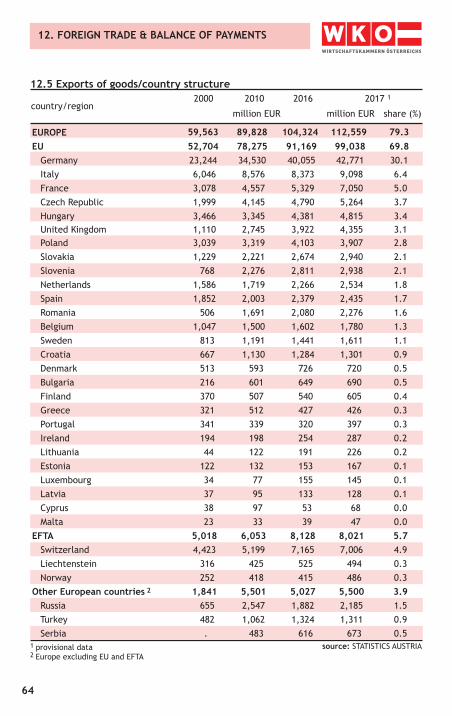
12.5 Exports of goods/country structure
2 Europe excluding EU and EFTA
12. FOREIGN TRADE & BALANCE OF PAYMENTS
country/regionmillion EUR
2017 12016
million EUR share (%)
1 provisional data source: STATISTICS AUSTRIA
EUROPE 59,563 89,828 104,324 112,559 79.3EU 52,704 78,275 91,169 99,038 69.8 Germany 23,244 34,530 40,055 42,771 30.1 Italy 6,046 8,576 8,373 9,098 6.4 France 3,078 4,557 5,329 7,050 5.0 Czech Republic 1,999 4,145 4,790 5,264 3.7 Hungary 3,466 3,345 4,381 4,815 3.4 United Kingdom 1,110 2,745 3,922 4,355 3.1 Poland 3,039 3,319 4,103 3,907 2.8 Slovakia 1,229 2,221 2,674 2,940 2.1 Slovenia 768 2,276 2,811 2,938 2.1 Netherlands 1,586 1,719 2,266 2,534 1.8 Spain 1,852 2,003 2,379 2,435 1.7 Romania 506 1,691 2,080 2,276 1.6 Belgium 1,047 1,500 1,602 1,780 1.3 Sweden 813 1,191 1,441 1,611 1.1 Croatia 667 1,130 1,284 1,301 0.9 Denmark 513 593 726 720 0.5 Bulgaria 216 601 649 690 0.5 Finland 370 507 540 605 0.4 Greece 321 512 427 426 0.3 Portugal 341 339 320 397 0.3 Ireland 194 198 254 287 0.2 Lithuania 44 122 191 226 0.2 Estonia 122 132 153 167 0.1 Luxembourg 34 77 155 145 0.1 Latvia 37 95 133 128 0.1 Cyprus 38 97 53 68 0.0 Malta 23 33 39 47 0.0EFTA 5,018 6,053 8,128 8,021 5.7 Switzerland 4,423 5,199 7,165 7,006 4.9 Liechtenstein 316 425 525 494 0.3 Norway 252 418 415 486 0.3Other European countries 2 1,841 5,501 5,027 5,500 3.9 Russia 655 2,547 1,882 2,185 1.5 Turkey 482 1,062 1,324 1,311 0.9 Serbia . 483 616 673 0.5
20102000

65
12.5 Exports of goods/country structure
country/regionmillion EUR
2017 12016
million EUR
1 provisional data source: STATISTICS AUSTRIA
OVERSEAS 10,129 19,492 26,774 29,323 20.7Asia 4,195 9,660 11,946 12,845 9.1 China 490 2,807 3,313 3,699 2.6 Japan 914 1,023 1,332 1,385 1.0 South Korea 269 712 851 1,290 0.9 India 116 655 779 755 0.5 United Arab Emirates 121 490 640 610 0.4Africa 811 1,425 1,606 1,651 1.2North America 4,007 5,704 9,705 10,802 7.6 United States 3,498 4,958 8,727 9,661 6.8 Canada 509 746 977 1,141 0.8Middle and South America 756 1,979 2,353 2,731 1.9Australia, Oceania 361 723 1,164 1,294 0.9
TOTAL EXPORTS OF GOODS 69,692 109,373 131,125 141,918 100.0
20102000
12. FOREIGN TRADE & BALANCE OF PAYMENTS
share (%)
Austria's exports of goods 2017 by world regions, %-share
EFTA: 5.7%
EU: 69.8 %
Asia: 9.1 %
others*: 6.0 %
America: 9.5 %
* Rest of Europe: 3.9 %, Africa: 1.2 %, Australia/Oceania: 0.9 %
66
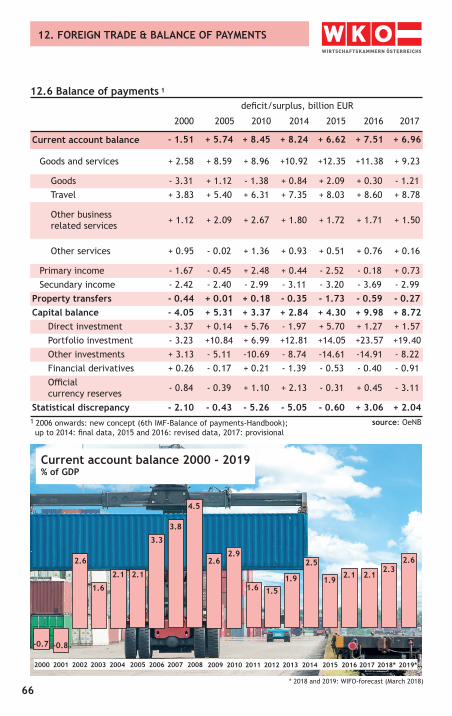
12.6 Balance of payments 1
deficit/surplus, billion EUR
12. FOREIGN TRADE & BALANCE OF PAYMENTS
1 2006 onwards: new concept (6th IMF-Balance of payments-Handbook); up to 2014: final data, 2015 and 2016: revised data, 2017: provisional
source: OeNB
Current account balance - 1.51 + 5.74 + 8.45 + 8.24 + 6.62 + 7.51 + 6.96
Goods and services + 2.58 + 8.59 + 8.96 +10.92 +12.35 +11.38 + 9.23
Goods - 3.31 + 1.12 - 1.38 + 0.84 + 2.09 + 0.30 - 1.21 Travel + 3.83 + 5.40 + 6.31 + 7.35 + 8.03 + 8.60 + 8.78
Other business related services + 1.12 + 2.09 + 2.67 + 1.80 + 1.72 + 1.71 + 1.50
Other services + 0.95 - 0.02 + 1.36 + 0.93 + 0.51 + 0.76 + 0.16
Primary income - 1.67 - 0.45 + 2.48 + 0.44 - 2.52 - 0.18 + 0.73Secundary income - 2.42 - 2.40 - 2.99 - 3.11 - 3.20 - 3.69 - 2.99
Property transfers - 0.44 + 0.01 + 0.18 - 0.35 - 1.73 - 0.59 - 0.27Capital balance - 4.05 + 5.31 + 3.37 + 2.84 + 4.30 + 9.98 + 8.72
Direct investment - 3.37 + 0.14 + 5.76 - 1.97 + 5.70 + 1.27 + 1.57 Portfolio investment - 3.23 +10.84 + 6.99 +12.81 +14.05 +23.57 +19.40 Other investments + 3.13 - 5.11 -10.69 - 8.74 -14.61 -14.91 - 8.22 Financial derivatives + 0.26 - 0.17 + 0.21 - 1.39 - 0.53 - 0.40 - 0.91 Official currency reserves - 0.84 - 0.39 + 1.10 + 2.13 - 0.31 + 0.45 - 3.11
Statistical discrepancy - 2.10 - 0.43 - 5.26 - 5.05 - 0.60 + 3.06 + 2.04
2005 2000 2010 2016 2017 2014 2015
Current account balance 2000 - 2019 % of GDP
* 2018 and 2019: WIFO-forecast (March 2018)
3.3
2.12.1
1.6
2.6
-0.8-0.7
3.8
4.5
1.9
2001 2002 2003 2004 2005 2006 2007 2008 2010 2011 2012 2013 2014 2000 2015 2016 2017 2009
1.51.6
2.92.6
2.1 2.11.9
2.32.5
2018*
2.6
2019*

67
12.7 Austrian direct investment abroadAustrian investment abroad 1, million EUR
(active direct investment)
12. FOREIGN TRADE & BALANCE OF PAYMENTS
source: OeNB
Belgium - 2 120 -437 227 351 -264 Denmark 36 -855 -27 39 - 3 -73 Germany 1,976 673 -805 532 978 209 Finland 15 -139 -101 40 54 54 France -43 -242 2,002 -53 21 316 United Kingdom 136 -45 -806 7 1,018 -566 Irland -39 12 - 7 28 55 3 Italy 81 131 -339 513 724 -62 Croatia 140 161 -436 -191 -1,540 230 Luxembourg 1 115 -306 -183 389 337 Netherlands 669 856 5,183 -954 5,161 4,545 Poland 324 -755 -39 78 621 929 Romania 183 461 -1,056 1,199 -1,067 357 Sweden 79 -237 53 188 -99 197 Slovakia 194 288 -385 257 -155 -457 Slovenia 111 116 -49 164 -190 180 Spain 7 169 51 85 - 4 135 Czech Republic 1,014 692 356 610 -669 746 Hungary 386 136 -214 661 -754 -138Euro area (19) 3,025 1,463 3,808 753 7,329 4,879EU (28) 5,336 1,137 1,502 3,656 3,128 6,413 Russia 73 1,235 247 395 -936 1,733 Switzerland -182 651 362 589 488 297 Turkey 2 1,251 428 191 -2,731 -1,277America 484 799 -2,761 319 -5,423 525 United States 377 165 1,115 579 -655 205 Canada - 7 -249 -448 -106 -328 -161Asia 90 1,350 437 1,003 2,182 2,627Africa - 7 66 74 -98 37 -70
TOTAL NET INVESTMENT 5,980 7,237 -547 6,294 -3,182 9,666
STOCK OF DIRECT INVESTMENT 26,630 135,936 179,654 188,522 190,036 201,083
2000 2010 2016 2017 2014 2015country of destination
1 2006 onwards: new concept (6th IMF-Balance of payments-Handbook); up to 2014: final data, 2015 and 2016: revised data, 2017: provisional
68
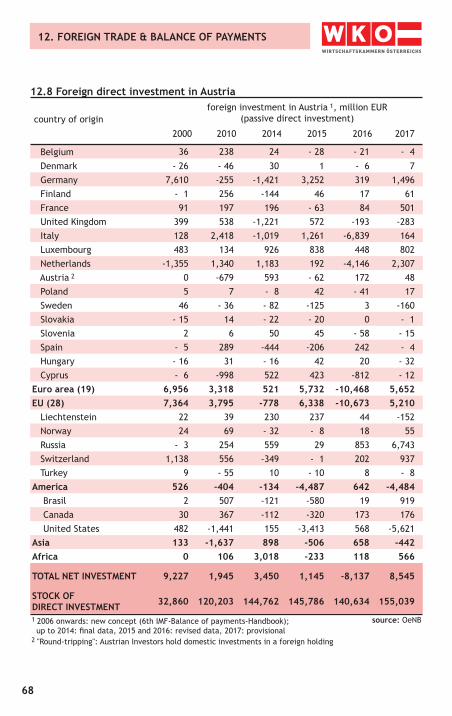
12.8 Foreign direct investment in Austriaforeign investment in Austria 1, million EUR
(passive direct investment)
12. FOREIGN TRADE & BALANCE OF PAYMENTS
source: OeNB
Belgium 36 238 24 - 28 - 21 - 4 Denmark - 26 - 46 30 1 - 6 7 Germany 7,610 -255 -1,421 3,252 319 1,496 Finland - 1 256 -144 46 17 61 France 91 197 196 - 63 84 501 United Kingdom 399 538 -1,221 572 -193 -283 Italy 128 2,418 -1,019 1,261 -6,839 164 Luxembourg 483 134 926 838 448 802 Netherlands -1,355 1,340 1,183 192 -4,146 2,307 Austria 2 0 -679 593 - 62 172 48 Poland 5 7 - 8 42 - 41 17 Sweden 46 - 36 - 82 -125 3 -160 Slovakia - 15 14 - 22 - 20 0 - 1 Slovenia 2 6 50 45 - 58 - 15 Spain - 5 289 -444 -206 242 - 4 Hungary - 16 31 - 16 42 20 - 32 Cyprus - 6 -998 522 423 -812 - 12Euro area (19) 6,956 3,318 521 5,732 -10,468 5,652EU (28) 7,364 3,795 -778 6,338 -10,673 5,210 Liechtenstein 22 39 230 237 44 -152 Norway 24 69 - 32 - 8 18 55 Russia - 3 254 559 29 853 6,743 Switzerland 1,138 556 -349 - 1 202 937 Turkey 9 - 55 10 - 10 8 - 8America 526 -404 -134 -4,487 642 -4,484 Brasil 2 507 -121 -580 19 919 Canada 30 367 -112 -320 173 176 United States 482 -1,441 155 -3,413 568 -5,621Asia 133 -1,637 898 -506 658 -442Africa 0 106 3,018 -233 118 566
TOTAL NET INVESTMENT 9,227 1,945 3,450 1,145 -8,137 8,545
STOCK OF DIRECT INVESTMENT 32,860 120,203 144,762 145,786 140,634 155,039
2000 2010 2014 2015country of origin
2016 2017
1 2006 onwards: new concept (6th IMF-Balance of payments-Handbook); up to 2014: final data, 2015 and 2016: revised data, 2017: provisional2 "Round-tripping": Austrian Investors hold domestic investments in a foreign holding