Embed Size (px)
Citation preview
A R T I C L E S
Management Practices Across Firms and Countriesby Nicholas Bloom, Christos Genakos, Raffaella Sadun, and John Van Reenen
Executive OverviewFor the past decade we have been using double-blind survey techniques and randomized sampling to constructmanagement data on more than 10,000 organizations across 20 countries. On average, we find that inmanufacturing American, Japanese, and German firms are the best managed. Firms in developing countries, suchas Brazil, China, and India, tend to be poorly managed. American retail firms and hospitals are also well managedby international standards, although American schools are worse managed than those in several other developedcountries. We also find substantial variation in management practices across organizations in every country andevery sector, mirroring the wide spread of productivity and profitability within industries. One factor linked tothis variation is ownership. Government and founder-owned firms are usually poorly managed, while multina-tional, dispersed shareholder, and private-equity-owned firms are typically well managed. Family-owned firms arebadly managed if run by family members compared with similar family-owned firms run by external CEOs.Stronger product market competition and higher worker skills are associated with better management practices.Less regulated labor markets are associated with improvements in incentive management practices such asperformance-based promotion.
As four Europeans, we are used to hearing thatAmerican firms are the world’s best managed.American companies such as GE, Apple,
IBM, McDonald’s, and Walmart are icons of busi-
ness. And U.S. business schools, which train top-level managers of these firms, dominate globalrankings. This was not always the case, however.In the 1980s, for example, Japanese firms wereregarded by many as the best managed in theworld, powered by Toyota-inspired lean manufac-turing principles.1
The chief purpose of our ongoing research pro-gram is to understand how and why management
Financial support was provided by the Alfred P. Sloan Foundation, theAnglo-German Foundation, the Economic and Social Research Council,and the National Science Foundation. We want to thank Don Siegel andan anonymous reviewer for extremely helpful comments. We are indebtedto Rebecca Homkes, Renata Lemos, Mimi Qi, and Daniela Scur for theirhelp in this research project. Our partnership with McKinsey & Company(from which we received no funding) has been essential for the develop-ment of the project, in particular Pedro Castro, Stephen Dorgan, JohnDowdy, and Dennis Layton. We have also recently benefited tremendouslyfrom working closely with Accenture (from which we also received nofunding), in particular Ashutosh Tyagi and Shaleen Chavda. We thankJames Milway at the IPC for the retail data, Renu Agarwal and Roy Greenat UTS for collecting the Australian and New Zealand data, and AndreaTokman at the IPP for the Chilean data.
1 See, for example, Appelbaum and Batt (1994) for a historical reviewof the cross-country evolution of some of the managerial concepts that areincluded in our survey. And note that while United States manufacturingfirms are struggling domestically due to high employment costs, UnitedStates multinationals have been very successful abroad over the past coupleof decades (see Bloom, Sadun, & Van Reenen, 2012).
* Nicholas Bloom ([email protected]) is Associate Professor of Economics at Stanford University and Co-Director of the ProductivityProgram at the National Bureau of Economic Research.Christos Genakos ([email protected]) is Assistant Professor of Economics at Athens University of Economics and Business and SeniorResearch Officer in the Centre for Economic Performance at the London School of Economics.Raffaella Sadun ([email protected]) is Assistant Professor of Business Administration at Harvard Business School, a Faculty Research Fellowat the National Bureau of Economic Research, and Faculty Associate at the Centre for Economic Performance at the London School ofEconomics.John Van Reenen ([email protected]) is Professor of Economics and Director of the Centre for Economic Performance, both at theLondon School of Economics.
12 FebruaryAcademy of Management Perspectives
Copyright of the Academy of Management, all rights reserved. Contents may not be copied, emailed, posted to a listserv, or otherwise transmitted without the copyright holder’s express written permission.Users may print, download, or email articles for individual use only. http://dx.doi.org/10.5465/amp.2011.0077
practices vary across countries as well as across firmsand industries. To address this we must first tackle aserious challenge: how to measure and define man-agement practices? We believe that managementpractices can be systematically measured, whichthen allows us to investigate their role in explainingthe astounding differences in performance acrossfirms and countries.
To measure management practices, we use anew double-blind survey tool. This survey is runon randomly drawn samples of organizationsacross a range of different industries and countriesand uses open questions to obtain accurate re-sponses regarding the quality of managerial prac-tices inside each firm. By systematically executingthis approach on more than 10,000 organizationsover the past decade, we have assembled one ofthe first large internationally comparable manage-ment datasets.2 In this paper we will both describethis dataset and present some preliminary results.3
We begin by describing this new survey ap-proach, which focuses on measuring managementpractices along three operations-focused dimen-sions: (1) performance monitoring, (2) target set-ting, and (3) incentives/people management.Within these three areas of management we de-fine “best” management practices as those thatcontinuously collect and analyze performance in-formation, that set challenging and interlinkedshort- and long-run targets, and that reward highperformers and retrain/fire low performers.
There is a vast literature on the theory andmeasurement of management practices4 that offers
a wide spread of opinions on the definition, scope,and impact of different practices, and even a de-bate whether “best practices” exist or whetherevery management practice is contingent. Ourmanagement scoring grid has a very practical or-igin: It was developed by McKinsey as a first-contact guide to firms’ management quality. Assuch it targets a set of core operational manage-ment practices that have a direct impact on firmperformance based on the consultants’ experience,and that can be easily measured in an initialappraisal. As we discuss below, we also test (andconfirm) that these practices are indeed stronglylinked to higher productivity, profitability, andgrowth.
Our main findings on management practicescan be summarized in ten points (with the corre-sponding figures in the main text referenced):
1. U.S. manufacturing firms score higher thanany other country. Companies based in Canada,Germany, Japan, and Sweden are also well man-aged. Firms in developing countries, such as Brazil,China, and India, are typically less well managed(Figure 1).2. In manufacturing, there is a wide spread ofmanagement practices within every country. Thisspread is particularly notable in developing coun-tries, such as Brazil and India, which have a largetail of very badly managed firms (Figure 2).3. Looking at other sectors, U.S. firms in retailand hospitals also appear to be the best managedinternationally, but U.S. (high) schools scorepoorly (Figure 3).4. There is a wide spread of management prac-tices in nonmanufacturing sectors (Figure 4).5. Publicly (i.e., government) owned organiza-tions have worse management practices across all
2 Other international management datasets include the Global Man-ufacturing Research Group (GLOBE) survey (House et al., 2004; Javidan,Dorfman, Sully de Luque, & House, 2006) and the World Bank/EBRDestablishment surveys.
3 An anonymized version of the full data is available online at www.worldmanagementsurvey.org. We can provide only anonymized data be-cause we committed to confidentiality during the interviews. Anyone withaccess to a U.S. Census Research Data Center can apply to us to gain accessto the full dataset, since data within the RDCs is protected by United Statesfederal law.
4 Details of the survey can be found in Table 1 and online at www.worldmanagementsurvey.com. This survey was originally developed byMcKinsey, but most of the concepts in the questionnaire overlap with theexisting management literature. For example, the emphasis on repeated andpersistent organizational processes is similar to the literature on static anddynamic routines (Eisenhardt & Martin, 2000; Nelson & Winter, 1982;Winter, 2003; see Becker, 2004, for a review). Conceptually, the survey isalso related to the idea that intangible firm-specific assets and organiza-
tional processes are crucial in determining firm performance, a key elementof the resource-based view of the firm (Barney & Arikan, 2001; see Barney& Griffin, 1992, for a review). Finally, the section of the survey dedicatedto HR practices—and in particular the attention to the selection, rewards,and training given to employees—is consistent with the literature dedi-cated to high-performance work systems (e.g., Lengnick-Hall, Lengnick-Hall, Andrade, & Drake, 2009; Lepak, Liao, Chung, & Harden, 2006;Pfeffer, 1999a, 1999b; Pfeffer & Veiga, 1999). Bloom and colleagues (2010)discussed the links between their work and the more general HR manage-ment literature. In terms of methodology, our work shares the same em-phasis on data and econometric identification issues discussed in Beckerand Huselid (1998) and Huselid and Becker (1996).
2012 13Bloom, Genakos, Sadun, and Van Reenen
sectors we studied. They are particularly weak atincentives; promotion is more likely to be basedon tenure (rather than performance), and persis-tent low performers are much less likely to beretrained or moved (Figures 5 and 6).6. Among private-sector firms, those owned andrun by the founders or their descendants, espe-cially firstborn sons, tend to be badly managed.Firms with professional (external, nonfamily)CEOs tend to be well managed (Figure 7).7. Multinationals appear able to adopt good man-agement practices in almost every country inwhich they operate (Figure 8).8. There is strong evidence that tough productmarket competition is associated with better man-agement practices, within both the private andpublic sectors (Figure 9).9. Light labor market regulation is correlated withthe systematic use of monetary and nonmonetaryincentives (related to hiring, firing, pay, and pro-motions), but not monitoring or target manage-ment (Figure 10).10. The level of education of both managers andnonmanagers is strongly linked to better manage-ment practices (Figure 11).
As mentioned above, one immediate concernwith our work is that measuring management isimpossible because it is unclear which manage-ment practices are “good” or “bad.” Maybe allmanagement practices are contingent on the busi-ness situation. For example, firms in India may notadopt performance measurement because wagesare so low that measuring workers’ output is un-necessary. We find that for at least our core set ofmanagement practices around monitoring, targets,and incentives, there does appear to be a conceptof “best” practices. Firms adopting these practicesare more profitable and more productive, growfaster, and survive longer, not just in the Anglo-Saxon nations but in every region we looked at.Moreover, in recent experimental studies ran-domly chosen treatment firms that were helped toadopt these practices demonstrated large causalimprovements in profitability compared to thecontrol firms.5
There are several caveats to this. First, there aremany management practices that are contingenton the firms’ business environment and product,such as strategy, finance, M&A, and marketing.We deliberately focus on a narrow subset of basicmanagement practices for which best practicesmost likely exist: those practices that seem likelyto raise the efficiency of firms’ production of goodsand services.6 Second, there are other types ofmanagement, such as leadership, that are un-doubtedly important to business success but aremuch harder to quantify (House, Hanges, Javidan,Dorfman, & Gupta, 2004, is the most ambitiousattempt). Finally, even this core set of best prac-tices almost surely changes over time. For exam-ple, the advent of cheap computers now makes itrelatively more attractive to undertake continuousperformance measurement and related analysis.
HowCanManagementPracticesBeMeasured?
To measure management practices, we devel-oped a new survey methodology described indetail in Bloom and Van Reenen (2007). In
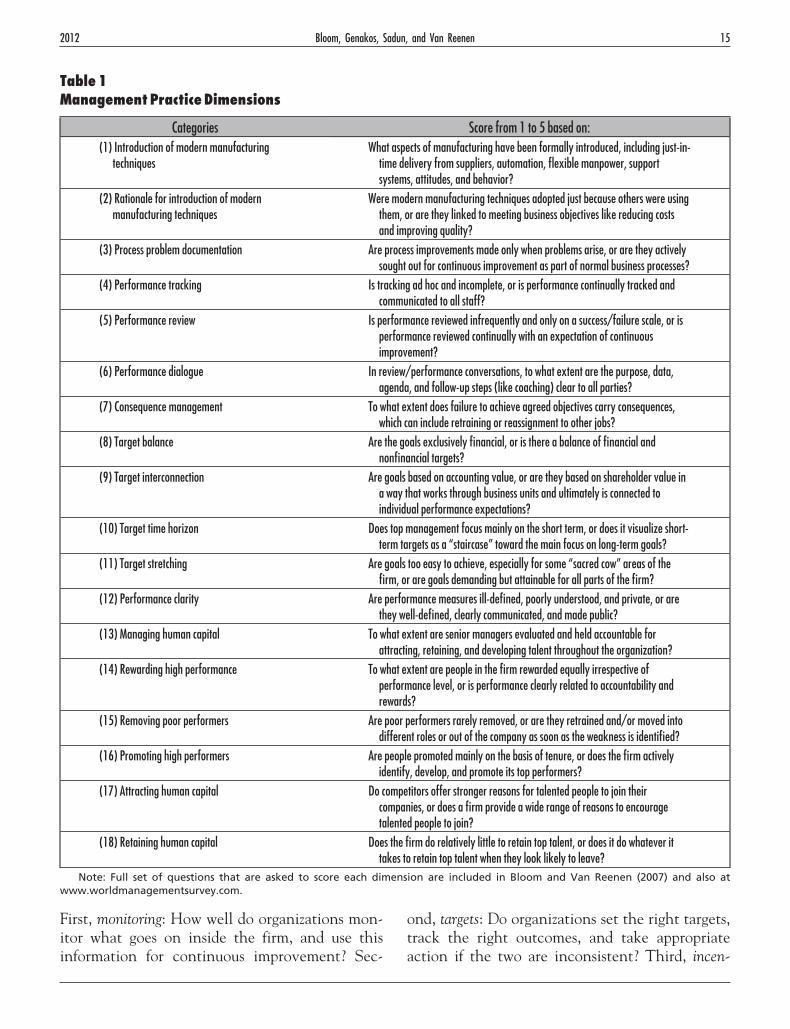
summary, we use an interview-based evaluationtool that defines and scores from 1 (“worst prac-tice”) to 5 (“best practice”) 18 key managementpractices. Table 1 lists the management questionsfor manufacturing, and it also gives some sense ofhow each is mapped onto the scoring grid. Wethen average the individual question scores foreach firm into a single indicator that is meant toreflect “good management,” as commonly under-stood. For retail, schools, and hospitals we use avery similar methodology.7
As mentioned, this evaluation tool attempts tomeasure management practices in three key areas.
5 See, for example, Bloom and colleagues (2011).
6 In our view it is an open question whether high scores on ourmanagement practices grid are beneficial, neutral, or detrimental to inno-vation (the generation of new goods and services). On one hand, ourmanagement practices may be complements to innovation, as efficientlyorganizing a research team is likely to get more “bang” for every R&D“buck” spent. By contrast, the kind of careful monitoring and managerialoversight we emphasize could potentially frustrate a more freewheelinginnovative culture. Ultimately, this is an empirical issue.
7 For the full survey grids for each industry see www.worldmanagementsurvey.org. The differences across industries primarilyreflect different organizational structures—for example, using the words“nurse manager” and “unit” in hospitals as compared to “plant manager”and “factory” in manufacturing firms.
14 FebruaryAcademy of Management Perspectives
First, monitoring: How well do organizations mon-itor what goes on inside the firm, and use thisinformation for continuous improvement? Sec-
ond, targets: Do organizations set the right targets,track the right outcomes, and take appropriateaction if the two are inconsistent? Third, incen-
Table1ManagementPracticeDimensions
Categories Score from 1 to 5 based on:(1) Introduction of modern manufacturing
techniquesWhat aspects of manufacturing have been formally introduced, including just-in-
time delivery from suppliers, automation, flexible manpower, supportsystems, attitudes, and behavior?
(2) Rationale for introduction of modernmanufacturing techniques
Were modern manufacturing techniques adopted just because others were usingthem, or are they linked to meeting business objectives like reducing costsand improving quality?
(3) Process problem documentation Are process improvements made only when problems arise, or are they activelysought out for continuous improvement as part of normal business processes?
(4) Performance tracking Is tracking ad hoc and incomplete, or is performance continually tracked andcommunicated to all staff?
(5) Performance review Is performance reviewed infrequently and only on a success/failure scale, or isperformance reviewed continually with an expectation of continuousimprovement?
(6) Performance dialogue In review/performance conversations, to what extent are the purpose, data,agenda, and follow-up steps (like coaching) clear to all parties?
(7) Consequence management To what extent does failure to achieve agreed objectives carry consequences,which can include retraining or reassignment to other jobs?
(8) Target balance Are the goals exclusively financial, or is there a balance of financial andnonfinancial targets?
(9) Target interconnection Are goals based on accounting value, or are they based on shareholder value ina way that works through business units and ultimately is connected toindividual performance expectations?
(10) Target time horizon Does top management focus mainly on the short term, or does it visualize short-term targets as a “staircase” toward the main focus on long-term goals?
(11) Target stretching Are goals too easy to achieve, especially for some “sacred cow” areas of thefirm, or are goals demanding but attainable for all parts of the firm?
(12) Performance clarity Are performance measures ill-defined, poorly understood, and private, or arethey well-defined, clearly communicated, and made public?
(13) Managing human capital To what extent are senior managers evaluated and held accountable forattracting, retaining, and developing talent throughout the organization?
(14) Rewarding high performance To what extent are people in the firm rewarded equally irrespective ofperformance level, or is performance clearly related to accountability andrewards?
(15) Removing poor performers Are poor performers rarely removed, or are they retrained and/or moved intodifferent roles or out of the company as soon as the weakness is identified?
(16) Promoting high performers Are people promoted mainly on the basis of tenure, or does the firm activelyidentify, develop, and promote its top performers?
(17) Attracting human capital Do competitors offer stronger reasons for talented people to join theircompanies, or does a firm provide a wide range of reasons to encouragetalented people to join?
(18) Retaining human capital Does the firm do relatively little to retain top talent, or does it do whatever ittakes to retain top talent when they look likely to leave?
Note: Full set of questions that are asked to score each dimension are included in Bloom and Van Reenen (2007) and also atwww.worldmanagementsurvey.com.
2012 15Bloom, Genakos, Sadun, and Van Reenen
tives: Are organizations promoting and rewardingemployees based on performance, prioritizing hir-ing, and trying to keep their best employees?8
Our methodology defines a badly managed or-ganization as one that fails to track performance,has no effective targets, and bases promotions ontenure with no system to address persistent em-ployee underperformance. In contrast, a well-managed organization is defined as one that con-tinuously monitors and tries to improve itsprocesses, sets comprehensive and stretching tar-gets, and promotes high-performing employeesand fixes (by training or exit) underperformingemployees.
To collect the data, we hired teams of MBA-type students to conduct the telephone inter-views, as they had some business experience andtraining. These students were all from the coun-tries we surveyed (and so could interview manag-ers in their native languages) but were studying attop U.S. or European universities. The survey wascompleted by plant managers in manufacturing,retail store managers, clinical service leads in hos-pitals, and school principals or headmasters. Thislevel of middle managers was purposely selected,as they were senior enough to have an overview ofmanagement practices but not so senior as to bedetached from day-to-day operations.
We interviewed these managers using a double-blind survey technique. The first part of this dou-ble-blind technique was that managers were nottold they were being scored or shown the scoringgrid. They were told only that they were being“interviewed about management practices.” To dothis, we asked “open” questions in the survey. Forexample, on the first monitoring dimension inmanufacturing, we started by making the openstatement “Tell me how you monitor your produc-tion process” rather than closed questions such as“Do you monitor your production daily [yes/no]?”
We continued with open questions focusing onactual practices and examples until the inter-viewer could make an accurate assessment of thefirm’s practices. For example, the second question
on that performance tracking dimension was“What kinds of measures would you use to trackperformance?” and the third was “If I walkedaround your factory what could I tell about howeach person was performing?” The combined re-sponses to this dimension are scored against a gridthat goes from 1, which is defined as “Measurestracked do not indicate directly if overall businessobjectives are being met. Tracking is an ad hocprocess (certain processes aren’t tracked at all),”to 5, which is defined as “Performance is contin-uously tracked and communicated, both formallyand informally, to all staff using a range of visualmanagement tools.”
The other side of our double-blind approachwas that our interviewers were not told in advanceanything about the organization’s performance;they were provided only with the organization’sname, telephone number, and industry. We ran-domly sampled medium-sized firms (employingbetween 100 and 5,000 workers) in manufacturingand retail, acute care hospitals, and schools thatoffered general education to 15-year-olds (whichcorresponds to high schools in most of the coun-tries we surveyed). These organizations are largeenough that the type of systematic managementpractices chosen is likely to matter, but smallenough that they are not usually covered in thebusiness press. Thus, the interviewers generallyhad not heard of them before, so they should havehad no preconceptions.
We used a variety of procedures to obtain ahigh success rate and to remove potential sourcesof bias from our estimates. First, we obtained gov-ernment endorsements for the surveys in mostcountries and industries. Second, we positionedthe surveys as “an interview on management,”never using the word “survey” or “research,” astelephone operators usually block surveys andmarket research. Third, we never asked interview-ees for performance or financial data; instead, weobtained such data from independent sources suchas company accounts or hospital and school leaguetables. Fourth, the interviewers were encouragedto be persistent; they ran about two interviews,lasting 45 minutes each on average, per day, withthe rest of the time spent contacting managers to
8 These practices are similar to those emphasized in earlier work onmanagement practices, by, for example, Osterman (1994), Macduffie(1995), Delery and Doty (1996), and Ichniowski, Shaw, and Prennushi(1997).
16 FebruaryAcademy of Management Perspectives
schedule interviews.9 We also ran interviews inthe managers’ native languages to make the pro-cess as comfortable as possible. These steps helpedyield a response rate of about 50% across indus-tries, which was uncorrelated with the (indepen-dently collected) performance measures for thefirm—thus, we were not disproportionately inter-viewing successful or failing organizations.
We also collected a series of “noise controls” onthe interview process itself (such as the time ofday and the day of the week), characteristics ofthe interviewee (such as tenure in firm), and theidentity of the interviewer (so we could include afull set of dummy variables for the interviewer todeal with interviewer bias). Including these in ourregression analysis typically helps to improve theprecision of our estimates by stripping out some ofthe measurement error.
Validating theManagementData
Before showing the management data, it is im-portant to ask whether our survey procedureappears to be measuring consistent differences
in management across firms. To do this we carriedout two survey exercises to assess to what extentour management data appears internally consis-tent across questions and interviews.
First, for almost three quarters of all interviewswe had a second person listening in on a phoneextension as a “silent monitor” to independentlyscore the interview. For these double-scored inter-views we found the correlation across scores was0.887, which shows that two interviewers typi-cally gave the same score to the same interview.
Second, we also ran repeat interviews on 222firms from our manufacturing sample, using a sec-ond MBA student to interview a second plantmanager in the same firm. This helped to evaluatehow consistently we were measuring managementpractices within firms by interviewing one man-ager. We found that the correlation between ourindependently run first and second interview
scores was 0.51. Part of this difference acrossplants within the same firms is likely to be realinternal variations in management practices; notwo plants within the same firm will have identi-cal management practices. The rest of this differ-ence across plants within firms reflects measure-ment error in the survey process. Nevertheless,this 0.51 correlation across different plants withinthe same firm, which is highly significant (p-value� 0.001), suggests that while our managementscore is clearly noisy, it picks up significant man-agement differences across firms. Similar high cor-relations are found in the hospital surveys (seeBloom, Propper, Seiler, & Van Reenen, 2010).10
InternationalPatternsofManagement
Below we summarize some of the main findingsfrom the management data.11
Manufacturing
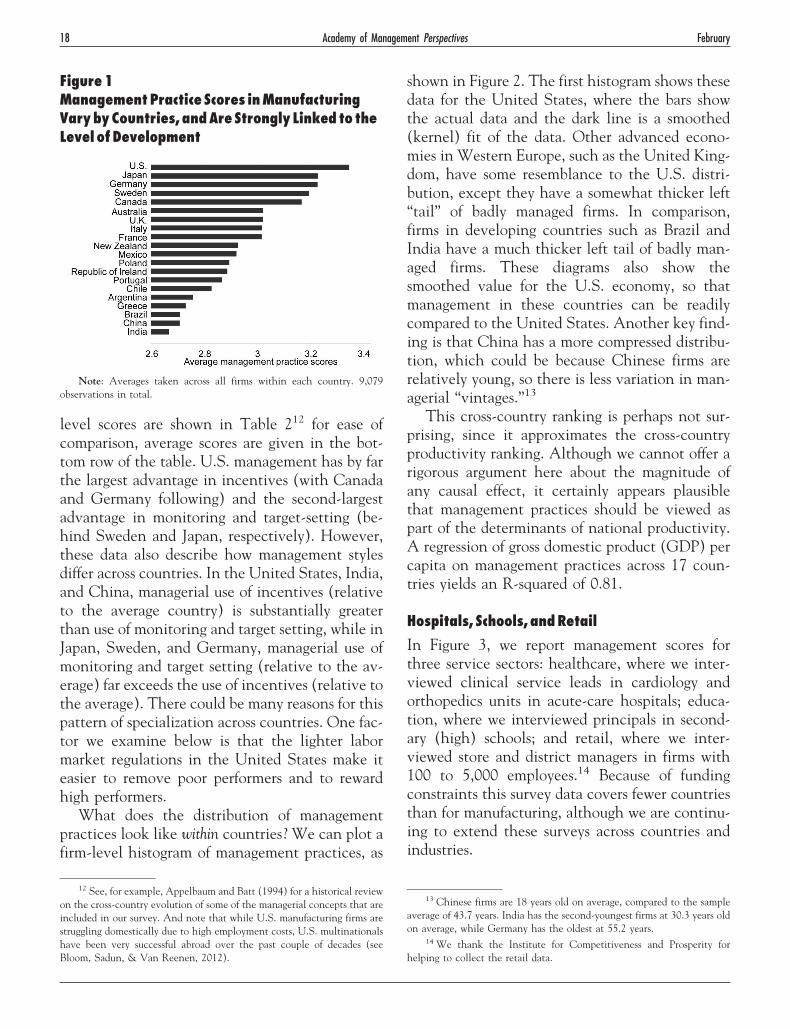
Figure 1 presents the average management prac-tice score across countries (details in AppendixA). These firms were randomly sampled from thepopulation of all manufacturing firms with 100 to5,000 employees. The median firm is privatelyowned, employs around 350 workers, and operatestwo production plants.
The United States has the highest manage-ment practice scores, on average, followed by Ger-many and Japan. At the bottom of the rankingsare countries in Southern Europe (Greece andPortugal) and developing countries, such as Brazil,China, and India.
As discussed above, we can separate these over-all management scores into three broad categories:monitoring, targets, and incentives; the country-
9 As a result, these management surveys were expensive to run. Ourinterviews cost about $150 each (including all overheads) across all thesurvey waves. To help defray costs we actively collaborated with severaldifferent research teams and governments, and welcome any interest infuture collaboration.
10 Further evidence of the consistency of the management scores is inGrous (2011). He conducted extensive factory visits of 23 British aerospacefirms, administering both the Bloom and Van Reenen (2007) telephonesurvey on the plant manager and face-to-face interviews with up to threeother employees (the CEO/managing director, a manager, and a shop floorworker). The management scores from his site visits were highly associatedwith the scores from the telephone interviews (the correlation coefficientwas 0.89 and was significant at the 1% level).
11 The anonymized data and Stata files to replicate the results areavailable at www.worldmanagementsurvey.org.
2012 17Bloom, Genakos, Sadun, and Van Reenen
level scores are shown in Table 212 for ease ofcomparison, average scores are given in the bot-tom row of the table. U.S. management has by farthe largest advantage in incentives (with Canadaand Germany following) and the second-largestadvantage in monitoring and target-setting (be-hind Sweden and Japan, respectively). However,these data also describe how management stylesdiffer across countries. In the United States, India,and China, managerial use of incentives (relativeto the average country) is substantially greaterthan use of monitoring and target setting, while inJapan, Sweden, and Germany, managerial use ofmonitoring and target setting (relative to the av-erage) far exceeds the use of incentives (relative tothe average). There could be many reasons for thispattern of specialization across countries. One fac-tor we examine below is that the lighter labormarket regulations in the United States make iteasier to remove poor performers and to rewardhigh performers.
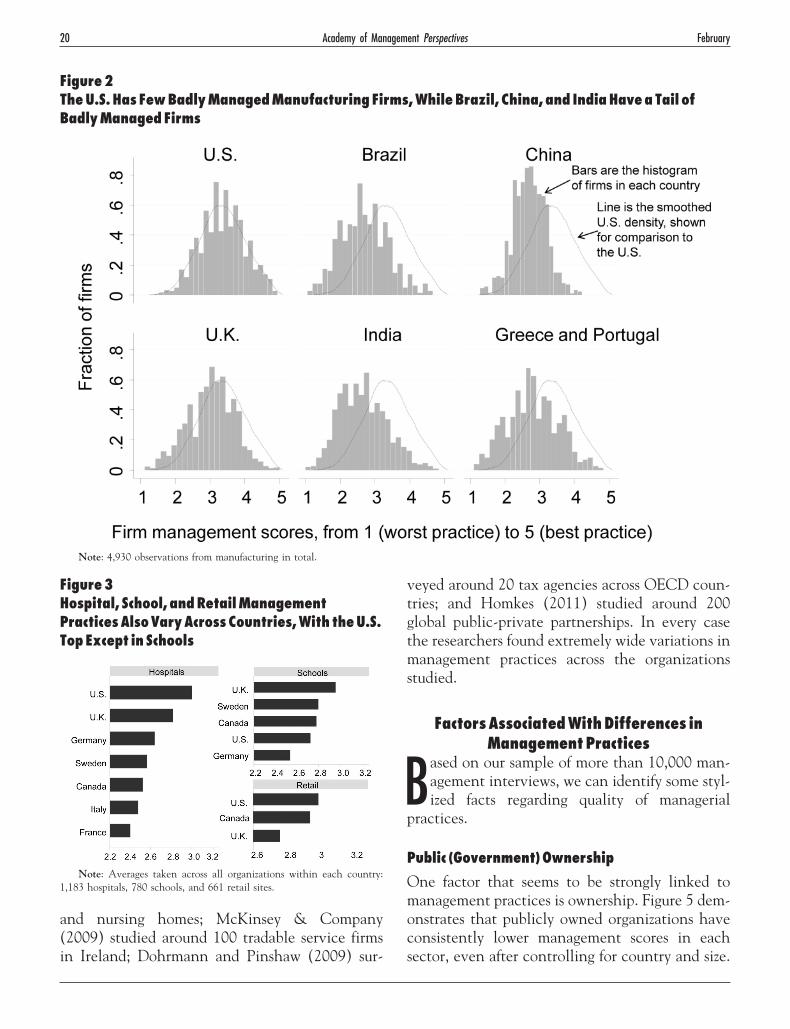
What does the distribution of managementpractices look like within countries? We can plot afirm-level histogram of management practices, as
shown in Figure 2. The first histogram shows thesedata for the United States, where the bars showthe actual data and the dark line is a smoothed(kernel) fit of the data. Other advanced econo-mies in Western Europe, such as the United King-dom, have some resemblance to the U.S. distri-bution, except they have a somewhat thicker left“tail” of badly managed firms. In comparison,firms in developing countries such as Brazil andIndia have a much thicker left tail of badly man-aged firms. These diagrams also show thesmoothed value for the U.S. economy, so thatmanagement in these countries can be readilycompared to the United States. Another key find-ing is that China has a more compressed distribu-tion, which could be because Chinese firms arerelatively young, so there is less variation in man-agerial “vintages.”13
This cross-country ranking is perhaps not sur-prising, since it approximates the cross-countryproductivity ranking. Although we cannot offer arigorous argument here about the magnitude ofany causal effect, it certainly appears plausiblethat management practices should be viewed aspart of the determinants of national productivity.A regression of gross domestic product (GDP) percapita on management practices across 17 coun-tries yields an R-squared of 0.81.
Hospitals, Schools, andRetail
In Figure 3, we report management scores forthree service sectors: healthcare, where we inter-viewed clinical service leads in cardiology andorthopedics units in acute-care hospitals; educa-tion, where we interviewed principals in second-ary (high) schools; and retail, where we inter-viewed store and district managers in firms with100 to 5,000 employees.14 Because of fundingconstraints this survey data covers fewer countriesthan for manufacturing, although we are continu-ing to extend these surveys across countries andindustries.
12 See, for example, Appelbaum and Batt (1994) for a historical reviewon the cross-country evolution of some of the managerial concepts that areincluded in our survey. And note that while U.S. manufacturing firms arestruggling domestically due to high employment costs, U.S. multinationalshave been very successful abroad over the past couple of decades (seeBloom, Sadun, & Van Reenen, 2012).
13 Chinese firms are 18 years old on average, compared to the sampleaverage of 43.7 years. India has the second-youngest firms at 30.3 years oldon average, while Germany has the oldest at 55.2 years.
14 We thank the Institute for Competitiveness and Prosperity forhelping to collect the retail data.
Figure1ManagementPractice Scores inManufacturingVarybyCountries, andAre Strongly Linked to theLevel ofDevelopment
Note: Averages taken across all firms within each country. 9,079observations in total.
18 FebruaryAcademy of Management Perspectives
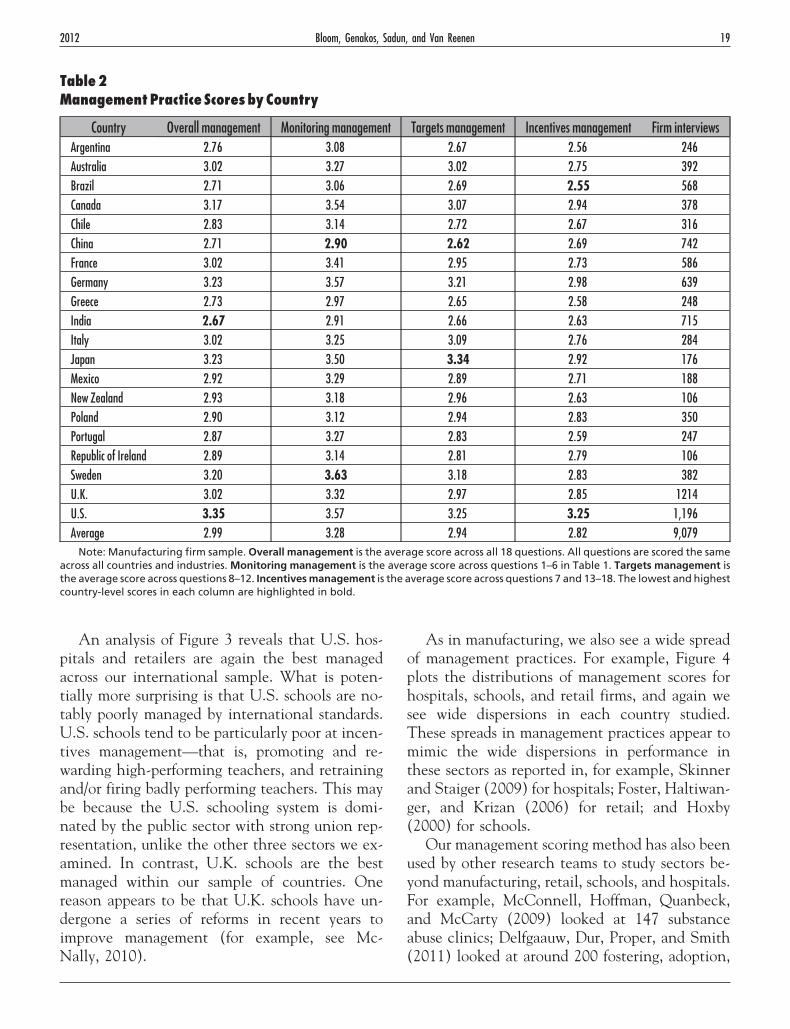
An analysis of Figure 3 reveals that U.S. hos-pitals and retailers are again the best managedacross our international sample. What is poten-tially more surprising is that U.S. schools are no-tably poorly managed by international standards.U.S. schools tend to be particularly poor at incen-tives management—that is, promoting and re-warding high-performing teachers, and retrainingand/or firing badly performing teachers. This maybe because the U.S. schooling system is domi-nated by the public sector with strong union rep-resentation, unlike the other three sectors we ex-amined. In contrast, U.K. schools are the bestmanaged within our sample of countries. Onereason appears to be that U.K. schools have un-dergone a series of reforms in recent years toimprove management (for example, see Mc-Nally, 2010).
As in manufacturing, we also see a wide spreadof management practices. For example, Figure 4plots the distributions of management scores forhospitals, schools, and retail firms, and again wesee wide dispersions in each country studied.These spreads in management practices appear tomimic the wide dispersions in performance inthese sectors as reported in, for example, Skinnerand Staiger (2009) for hospitals; Foster, Haltiwan-ger, and Krizan (2006) for retail; and Hoxby(2000) for schools.
Our management scoring method has also beenused by other research teams to study sectors be-yond manufacturing, retail, schools, and hospitals.For example, McConnell, Hoffman, Quanbeck,and McCarty (2009) looked at 147 substanceabuse clinics; Delfgaauw, Dur, Proper, and Smith(2011) looked at around 200 fostering, adoption,
Table2ManagementPractice ScoresbyCountry
Country Overall management Monitoring management Targets management Incentives management Firm interviewsArgentina 2.76 3.08 2.67 2.56 246Australia 3.02 3.27 3.02 2.75 392Brazil 2.71 3.06 2.69 2.55 568Canada 3.17 3.54 3.07 2.94 378Chile 2.83 3.14 2.72 2.67 316China 2.71 2.90 2.62 2.69 742France 3.02 3.41 2.95 2.73 586Germany 3.23 3.57 3.21 2.98 639Greece 2.73 2.97 2.65 2.58 248India 2.67 2.91 2.66 2.63 715Italy 3.02 3.25 3.09 2.76 284Japan 3.23 3.50 3.34 2.92 176Mexico 2.92 3.29 2.89 2.71 188New Zealand 2.93 3.18 2.96 2.63 106Poland 2.90 3.12 2.94 2.83 350Portugal 2.87 3.27 2.83 2.59 247Republic of Ireland 2.89 3.14 2.81 2.79 106Sweden 3.20 3.63 3.18 2.83 382U.K. 3.02 3.32 2.97 2.85 1214U.S. 3.35 3.57 3.25 3.25 1,196Average 2.99 3.28 2.94 2.82 9,079
Note: Manufacturing firm sample. Overall management is the average score across all 18 questions. All questions are scored the sameacross all countries and industries. Monitoring management is the average score across questions 1–6 in Table 1. Targets management isthe average score across questions 8–12. Incentives management is the average score across questions 7 and 13–18. The lowest and highestcountry-level scores in each column are highlighted in bold.
2012 19Bloom, Genakos, Sadun, and Van Reenen
and nursing homes; McKinsey & Company(2009) studied around 100 tradable service firmsin Ireland; Dohrmann and Pinshaw (2009) sur-
veyed around 20 tax agencies across OECD coun-tries; and Homkes (2011) studied around 200global public-private partnerships. In every casethe researchers found extremely wide variations inmanagement practices across the organizationsstudied.
FactorsAssociatedWithDifferences inManagementPractices
Based on our sample of more than 10,000 man-agement interviews, we can identify some styl-ized facts regarding quality of managerial
practices.
Public (Government)Ownership
One factor that seems to be strongly linked tomanagement practices is ownership. Figure 5 dem-onstrates that publicly owned organizations haveconsistently lower management scores in eachsector, even after controlling for country and size.
Figure2TheU.S.Has FewBadlyManagedManufacturing Firms,WhileBrazil, China, and IndiaHaveaTail ofBadlyManagedFirms
Note: 4,930 observations from manufacturing in total.
Figure3Hospital, School, andRetailManagementPracticesAlsoVaryAcross Countries,With theU.S.TopExcept in Schools
Note: Averages taken across all organizations within each country:1,183 hospitals, 780 schools, and 661 retail sites.
20 FebruaryAcademy of Management Perspectives
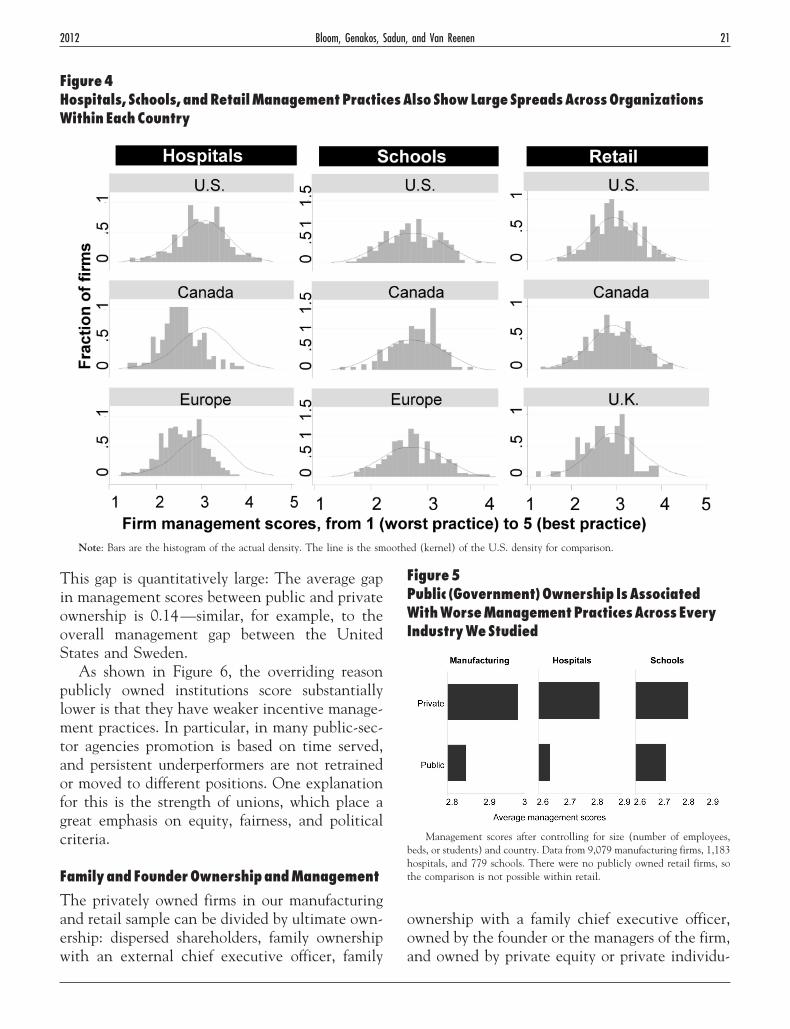
This gap is quantitatively large: The average gapin management scores between public and privateownership is 0.14—similar, for example, to theoverall management gap between the UnitedStates and Sweden.
As shown in Figure 6, the overriding reasonpublicly owned institutions score substantiallylower is that they have weaker incentive manage-ment practices. In particular, in many public-sec-tor agencies promotion is based on time served,and persistent underperformers are not retrainedor moved to different positions. One explanationfor this is the strength of unions, which place agreat emphasis on equity, fairness, and politicalcriteria.
FamilyandFounderOwnershipandManagement
The privately owned firms in our manufacturingand retail sample can be divided by ultimate own-ership: dispersed shareholders, family ownershipwith an external chief executive officer, family
ownership with a family chief executive officer,owned by the founder or the managers of the firm,and owned by private equity or private individu-
Figure4Hospitals, Schools, andRetailManagementPracticesAlso ShowLargeSpreadsAcrossOrganizationsWithin EachCountry
Note: Bars are the histogram of the actual density. The line is the smoothed (kernel) of the U.S. density for comparison.
Figure5Public (Government)Ownership IsAssociatedWithWorseManagementPracticesAcross EveryIndustryWeStudied
Management scores after controlling for size (number of employees,beds, or students) and country. Data from 9,079 manufacturing firms, 1,183hospitals, and 779 schools. There were no publicly owned retail firms, sothe comparison is not possible within retail.
2012 21Bloom, Genakos, Sadun, and Van Reenen
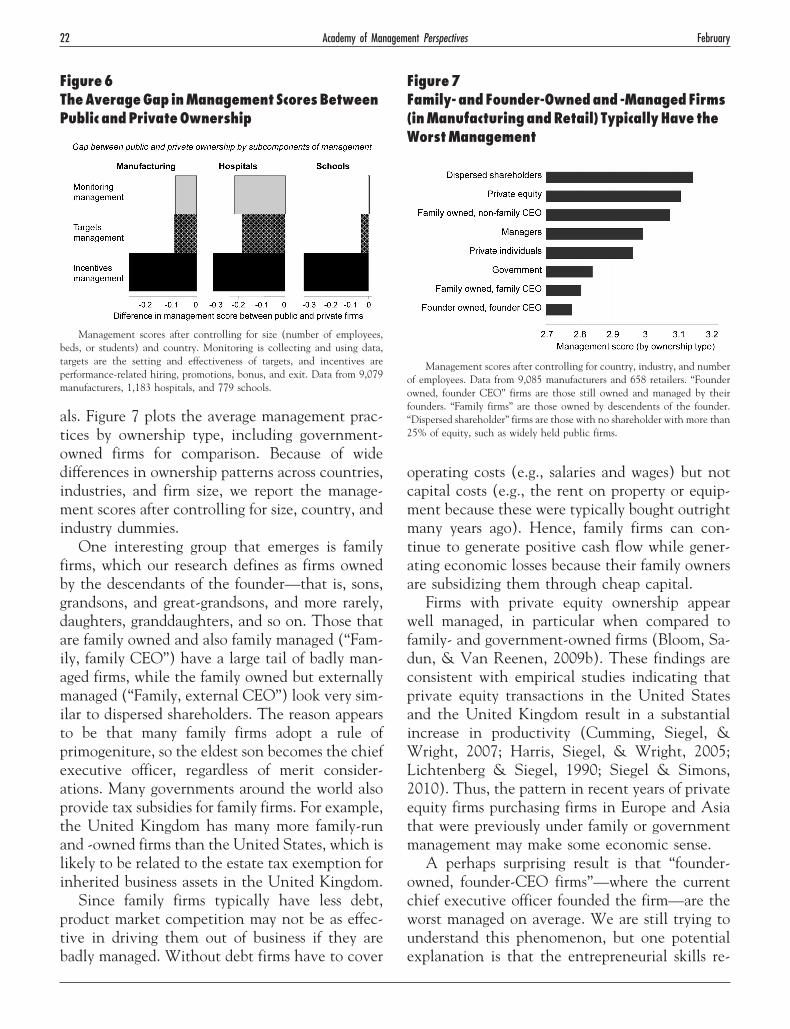
als. Figure 7 plots the average management prac-tices by ownership type, including government-owned firms for comparison. Because of widedifferences in ownership patterns across countries,industries, and firm size, we report the manage-ment scores after controlling for size, country, andindustry dummies.
One interesting group that emerges is familyfirms, which our research defines as firms ownedby the descendants of the founder—that is, sons,grandsons, and great-grandsons, and more rarely,daughters, granddaughters, and so on. Those thatare family owned and also family managed (“Fam-ily, family CEO”) have a large tail of badly man-aged firms, while the family owned but externallymanaged (“Family, external CEO”) look very sim-ilar to dispersed shareholders. The reason appearsto be that many family firms adopt a rule ofprimogeniture, so the eldest son becomes the chiefexecutive officer, regardless of merit consider-ations. Many governments around the world alsoprovide tax subsidies for family firms. For example,the United Kingdom has many more family-runand -owned firms than the United States, which islikely to be related to the estate tax exemption forinherited business assets in the United Kingdom.
Since family firms typically have less debt,product market competition may not be as effec-tive in driving them out of business if they arebadly managed. Without debt firms have to cover
operating costs (e.g., salaries and wages) but notcapital costs (e.g., the rent on property or equip-ment because these were typically bought outrightmany years ago). Hence, family firms can con-tinue to generate positive cash flow while gener-ating economic losses because their family ownersare subsidizing them through cheap capital.
Firms with private equity ownership appearwell managed, in particular when compared tofamily- and government-owned firms (Bloom, Sa-dun, & Van Reenen, 2009b). These findings areconsistent with empirical studies indicating thatprivate equity transactions in the United Statesand the United Kingdom result in a substantialincrease in productivity (Cumming, Siegel, &Wright, 2007; Harris, Siegel, & Wright, 2005;Lichtenberg & Siegel, 1990; Siegel & Simons,2010). Thus, the pattern in recent years of privateequity firms purchasing firms in Europe and Asiathat were previously under family or governmentmanagement may make some economic sense.
A perhaps surprising result is that “founder-owned, founder-CEO firms”—where the currentchief executive officer founded the firm—are theworst managed on average. We are still trying tounderstand this phenomenon, but one potentialexplanation is that the entrepreneurial skills re-
Figure6TheAverageGap inManagement ScoresBetweenPublic andPrivateOwnership
Management scores after controlling for size (number of employees,beds, or students) and country. Monitoring is collecting and using data,targets are the setting and effectiveness of targets, and incentives areperformance-related hiring, promotions, bonus, and exit. Data from 9,079manufacturers, 1,183 hospitals, and 779 schools.
Figure7Family- andFounder-Ownedand -ManagedFirms(inManufacturingandRetail) TypicallyHave theWorstManagement
Management scores after controlling for country, industry, and numberof employees. Data from 9,085 manufacturers and 658 retailers. “Founderowned, founder CEO” firms are those still owned and managed by theirfounders. “Family firms” are those owned by descendents of the founder.“Dispersed shareholder” firms are those with no shareholder with more than25% of equity, such as widely held public firms.
22 FebruaryAcademy of Management Perspectives
quired of a start-up (e.g., creativity and risk tak-ing) are not the same skills required when a firmgrows large enough to enter our sample (at least100 employees). A mature firm needs to movebeyond informal rules, and these may be imple-mented more effectively by a professional manager(see, for example, Boeker & Karichalil, 2002; Da-vila, Foster, & Jia, 2010; and Washburn, Wald-man, & Sully de Luque, 2009).
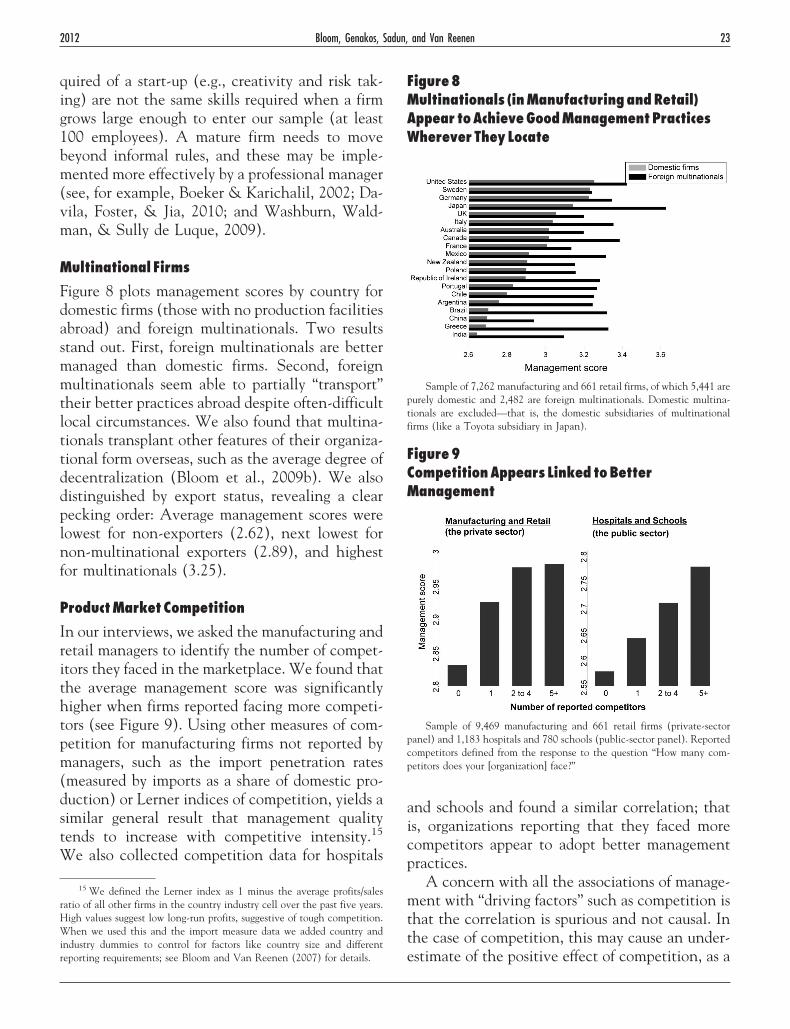
Multinational Firms
Figure 8 plots management scores by country fordomestic firms (those with no production facilitiesabroad) and foreign multinationals. Two resultsstand out. First, foreign multinationals are bettermanaged than domestic firms. Second, foreignmultinationals seem able to partially “transport”their better practices abroad despite often-difficultlocal circumstances. We also found that multina-tionals transplant other features of their organiza-tional form overseas, such as the average degree ofdecentralization (Bloom et al., 2009b). We alsodistinguished by export status, revealing a clearpecking order: Average management scores werelowest for non-exporters (2.62), next lowest fornon-multinational exporters (2.89), and highestfor multinationals (3.25).
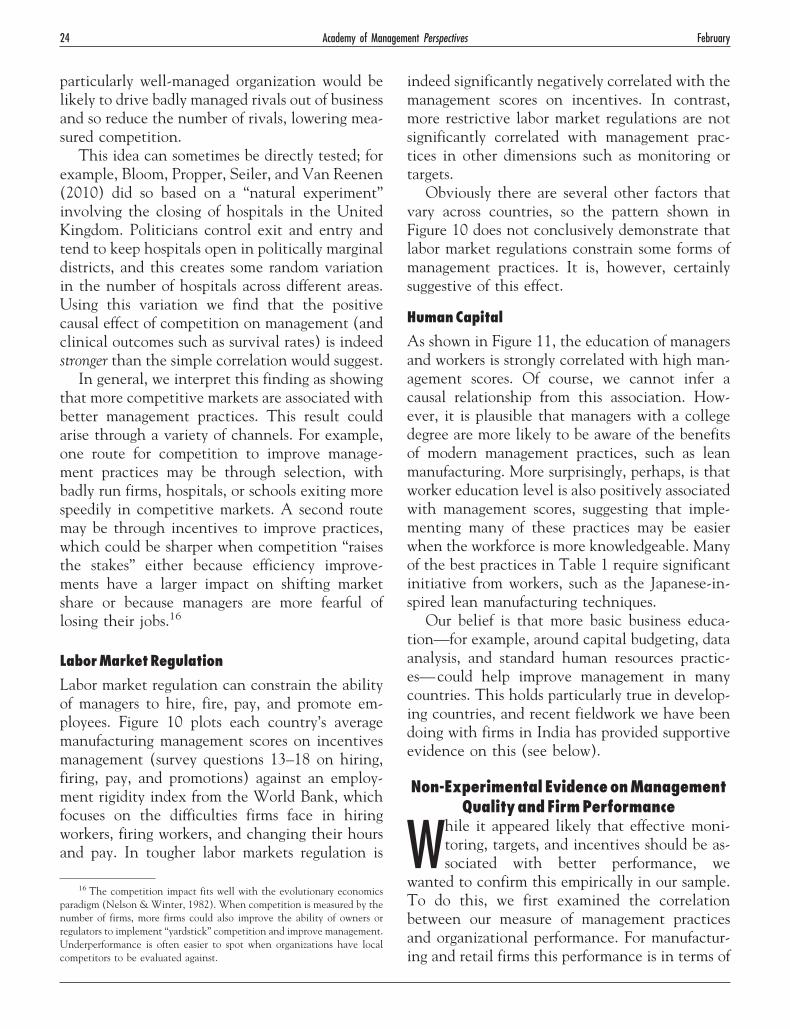
ProductMarket Competition
In our interviews, we asked the manufacturing andretail managers to identify the number of compet-itors they faced in the marketplace. We found thatthe average management score was significantlyhigher when firms reported facing more competi-tors (see Figure 9). Using other measures of com-petition for manufacturing firms not reported bymanagers, such as the import penetration rates(measured by imports as a share of domestic pro-duction) or Lerner indices of competition, yields asimilar general result that management qualitytends to increase with competitive intensity.15
We also collected competition data for hospitals
and schools and found a similar correlation; thatis, organizations reporting that they faced morecompetitors appear to adopt better managementpractices.
A concern with all the associations of manage-ment with “driving factors” such as competition isthat the correlation is spurious and not causal. Inthe case of competition, this may cause an under-estimate of the positive effect of competition, as a
15 We defined the Lerner index as 1 minus the average profits/salesratio of all other firms in the country industry cell over the past five years.High values suggest low long-run profits, suggestive of tough competition.When we used this and the import measure data we added country andindustry dummies to control for factors like country size and differentreporting requirements; see Bloom and Van Reenen (2007) for details.
Figure8Multinationals (inManufacturingandRetail)Appear toAchieveGoodManagementPracticesWherever They Locate
Sample of 7,262 manufacturing and 661 retail firms, of which 5,441 arepurely domestic and 2,482 are foreign multinationals. Domestic multina-tionals are excluded—that is, the domestic subsidiaries of multinationalfirms (like a Toyota subsidiary in Japan).
Figure9CompetitionAppears Linked toBetterManagement
Sample of 9,469 manufacturing and 661 retail firms (private-sectorpanel) and 1,183 hospitals and 780 schools (public-sector panel). Reportedcompetitors defined from the response to the question “How many com-petitors does your [organization] face?”
2012 23Bloom, Genakos, Sadun, and Van Reenen
particularly well-managed organization would belikely to drive badly managed rivals out of businessand so reduce the number of rivals, lowering mea-sured competition.
This idea can sometimes be directly tested; forexample, Bloom, Propper, Seiler, and Van Reenen(2010) did so based on a “natural experiment”involving the closing of hospitals in the UnitedKingdom. Politicians control exit and entry andtend to keep hospitals open in politically marginaldistricts, and this creates some random variationin the number of hospitals across different areas.Using this variation we find that the positivecausal effect of competition on management (andclinical outcomes such as survival rates) is indeedstronger than the simple correlation would suggest.
In general, we interpret this finding as showingthat more competitive markets are associated withbetter management practices. This result couldarise through a variety of channels. For example,one route for competition to improve manage-ment practices may be through selection, withbadly run firms, hospitals, or schools exiting morespeedily in competitive markets. A second routemay be through incentives to improve practices,which could be sharper when competition “raisesthe stakes” either because efficiency improve-ments have a larger impact on shifting marketshare or because managers are more fearful oflosing their jobs.16
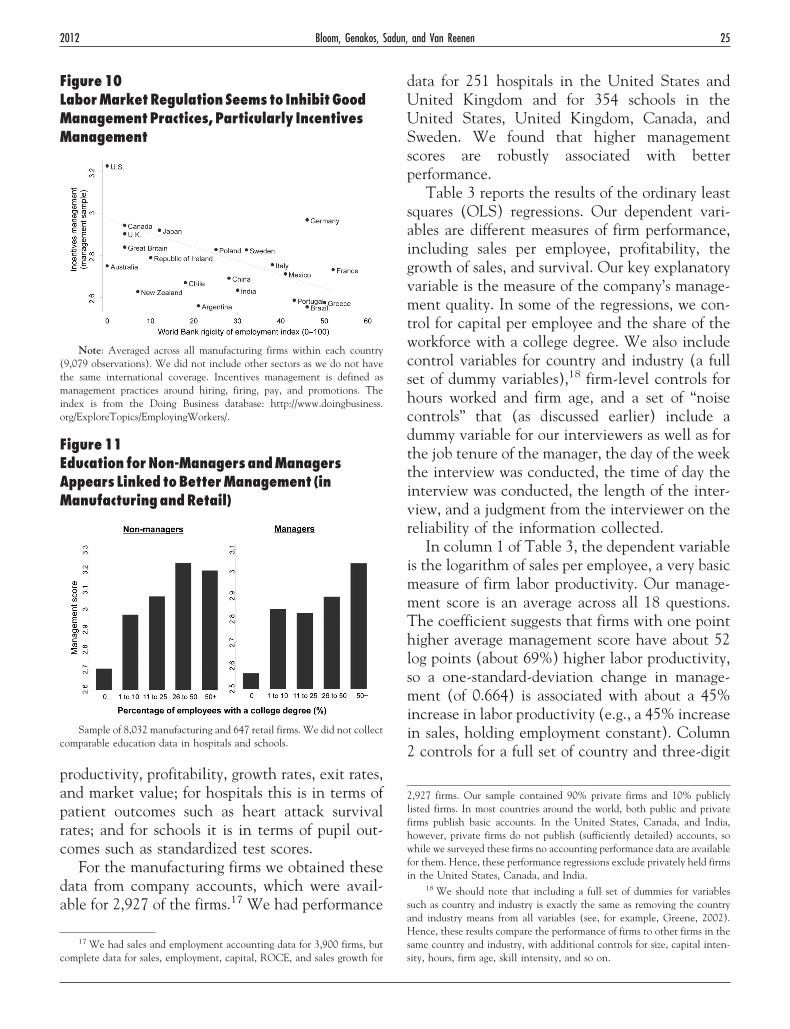
LaborMarketRegulation
Labor market regulation can constrain the abilityof managers to hire, fire, pay, and promote em-ployees. Figure 10 plots each country’s averagemanufacturing management scores on incentivesmanagement (survey questions 13–18 on hiring,firing, pay, and promotions) against an employ-ment rigidity index from the World Bank, whichfocuses on the difficulties firms face in hiringworkers, firing workers, and changing their hoursand pay. In tougher labor markets regulation is
indeed significantly negatively correlated with themanagement scores on incentives. In contrast,more restrictive labor market regulations are notsignificantly correlated with management prac-tices in other dimensions such as monitoring ortargets.
Obviously there are several other factors thatvary across countries, so the pattern shown inFigure 10 does not conclusively demonstrate thatlabor market regulations constrain some forms ofmanagement practices. It is, however, certainlysuggestive of this effect.
HumanCapital
As shown in Figure 11, the education of managersand workers is strongly correlated with high man-agement scores. Of course, we cannot infer acausal relationship from this association. How-ever, it is plausible that managers with a collegedegree are more likely to be aware of the benefitsof modern management practices, such as leanmanufacturing. More surprisingly, perhaps, is thatworker education level is also positively associatedwith management scores, suggesting that imple-menting many of these practices may be easierwhen the workforce is more knowledgeable. Manyof the best practices in Table 1 require significantinitiative from workers, such as the Japanese-in-spired lean manufacturing techniques.
Our belief is that more basic business educa-tion—for example, around capital budgeting, dataanalysis, and standard human resources practic-es—could help improve management in manycountries. This holds particularly true in develop-ing countries, and recent fieldwork we have beendoing with firms in India has provided supportiveevidence on this (see below).
Non-Experimental EvidenceonManagementQualityandFirmPerformance
While it appeared likely that effective moni-toring, targets, and incentives should be as-sociated with better performance, we
wanted to confirm this empirically in our sample.To do this, we first examined the correlationbetween our measure of management practicesand organizational performance. For manufactur-ing and retail firms this performance is in terms of
16 The competition impact fits well with the evolutionary economicsparadigm (Nelson & Winter, 1982). When competition is measured by thenumber of firms, more firms could also improve the ability of owners orregulators to implement “yardstick” competition and improve management.Underperformance is often easier to spot when organizations have localcompetitors to be evaluated against.
24 FebruaryAcademy of Management Perspectives
productivity, profitability, growth rates, exit rates,and market value; for hospitals this is in terms ofpatient outcomes such as heart attack survivalrates; and for schools it is in terms of pupil out-comes such as standardized test scores.
For the manufacturing firms we obtained thesedata from company accounts, which were avail-able for 2,927 of the firms.17 We had performance
data for 251 hospitals in the United States andUnited Kingdom and for 354 schools in theUnited States, United Kingdom, Canada, andSweden. We found that higher managementscores are robustly associated with betterperformance.
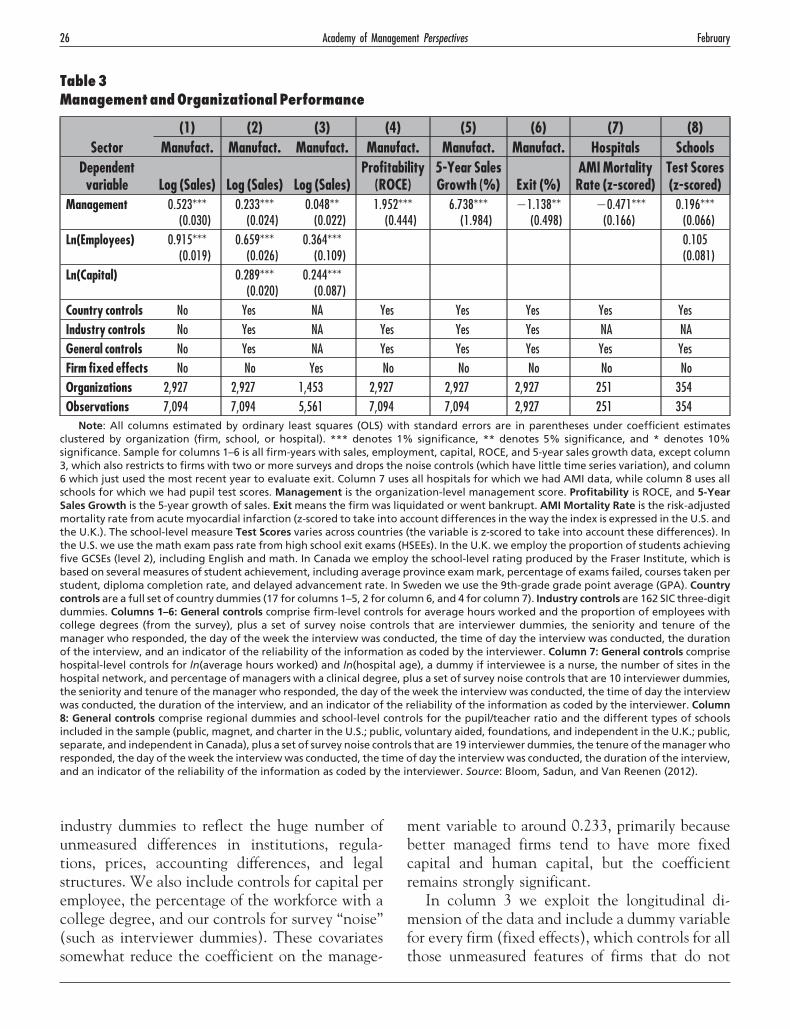
Table 3 reports the results of the ordinary leastsquares (OLS) regressions. Our dependent vari-ables are different measures of firm performance,including sales per employee, profitability, thegrowth of sales, and survival. Our key explanatoryvariable is the measure of the company’s manage-ment quality. In some of the regressions, we con-trol for capital per employee and the share of theworkforce with a college degree. We also includecontrol variables for country and industry (a fullset of dummy variables),18 firm-level controls forhours worked and firm age, and a set of “noisecontrols” that (as discussed earlier) include adummy variable for our interviewers as well as forthe job tenure of the manager, the day of the weekthe interview was conducted, the time of day theinterview was conducted, the length of the inter-view, and a judgment from the interviewer on thereliability of the information collected.
In column 1 of Table 3, the dependent variableis the logarithm of sales per employee, a very basicmeasure of firm labor productivity. Our manage-ment score is an average across all 18 questions.The coefficient suggests that firms with one pointhigher average management score have about 52log points (about 69%) higher labor productivity,so a one-standard-deviation change in manage-ment (of 0.664) is associated with about a 45%increase in labor productivity (e.g., a 45% increasein sales, holding employment constant). Column2 controls for a full set of country and three-digit
17 We had sales and employment accounting data for 3,900 firms, butcomplete data for sales, employment, capital, ROCE, and sales growth for
2,927 firms. Our sample contained 90% private firms and 10% publiclylisted firms. In most countries around the world, both public and privatefirms publish basic accounts. In the United States, Canada, and India,however, private firms do not publish (sufficiently detailed) accounts, sowhile we surveyed these firms no accounting performance data are availablefor them. Hence, these performance regressions exclude privately held firmsin the United States, Canada, and India.
18 We should note that including a full set of dummies for variablessuch as country and industry is exactly the same as removing the countryand industry means from all variables (see, for example, Greene, 2002).Hence, these results compare the performance of firms to other firms in thesame country and industry, with additional controls for size, capital inten-sity, hours, firm age, skill intensity, and so on.
Figure10LaborMarketRegulation Seems to InhibitGoodManagementPractices, Particularly IncentivesManagement
Note: Averaged across all manufacturing firms within each country(9,079 observations). We did not include other sectors as we do not havethe same international coverage. Incentives management is defined asmanagement practices around hiring, firing, pay, and promotions. Theindex is from the Doing Business database: http://www.doingbusiness.org/ExploreTopics/EmployingWorkers/.
Figure11Education forNon-ManagersandManagersAppears Linked toBetterManagement (inManufacturingandRetail)
Sample of 8,032 manufacturing and 647 retail firms. We did not collectcomparable education data in hospitals and schools.
2012 25Bloom, Genakos, Sadun, and Van Reenen
industry dummies to reflect the huge number ofunmeasured differences in institutions, regula-tions, prices, accounting differences, and legalstructures. We also include controls for capital peremployee, the percentage of the workforce with acollege degree, and our controls for survey “noise”(such as interviewer dummies). These covariatessomewhat reduce the coefficient on the manage-
ment variable to around 0.233, primarily becausebetter managed firms tend to have more fixedcapital and human capital, but the coefficientremains strongly significant.
In column 3 we exploit the longitudinal di-mension of the data and include a dummy variablefor every firm (fixed effects), which controls for allthose unmeasured features of firms that do not
Table3ManagementandOrganizationalPerformance
Sector(1) (2) (3) (4) (5) (6) (7) (8)
Manufact. Manufact. Manufact. Manufact. Manufact. Manufact. Hospitals SchoolsDependentvariable Log (Sales) Log (Sales) Log (Sales)
Profitability(ROCE)
5-Year SalesGrowth (%) Exit (%)
AMI MortalityRate (z-scored)
Test Scores(z-scored)
Management 0.523***(0.030)
0.233***(0.024)
0.048**(0.022)
1.952***(0.444)
6.738***(1.984)
�1.138**(0.498)
�0.471***(0.166)
0.196***(0.066)
Ln(Employees) 0.915***(0.019)
0.659***(0.026)
0.364***(0.109)
0.105(0.081)
Ln(Capital) 0.289***(0.020)
0.244***(0.087)
Country controls No Yes NA Yes Yes Yes Yes YesIndustry controls No Yes NA Yes Yes Yes NA NAGeneral controls No Yes NA Yes Yes Yes Yes YesFirm fixed effects No No Yes No No No No NoOrganizations 2,927 2,927 1,453 2,927 2,927 2,927 251 354Observations 7,094 7,094 5,561 7,094 7,094 2,927 251 354
Note: All columns estimated by ordinary least squares (OLS) with standard errors are in parentheses under coefficient estimatesclustered by organization (firm, school, or hospital). *** denotes 1% significance, ** denotes 5% significance, and * denotes 10%significance. Sample for columns 1–6 is all firm-years with sales, employment, capital, ROCE, and 5-year sales growth data, except column3, which also restricts to firms with two or more surveys and drops the noise controls (which have little time series variation), and column6 which just used the most recent year to evaluate exit. Column 7 uses all hospitals for which we had AMI data, while column 8 uses allschools for which we had pupil test scores. Management is the organization-level management score. Profitability is ROCE, and 5-YearSales Growth is the 5-year growth of sales. Exit means the firm was liquidated or went bankrupt. AMI Mortality Rate is the risk-adjustedmortality rate from acute myocardial infarction (z-scored to take into account differences in the way the index is expressed in the U.S. andthe U.K.). The school-level measure Test Scores varies across countries (the variable is z-scored to take into account these differences). Inthe U.S. we use the math exam pass rate from high school exit exams (HSEEs). In the U.K. we employ the proportion of students achievingfive GCSEs (level 2), including English and math. In Canada we employ the school-level rating produced by the Fraser Institute, which isbased on several measures of student achievement, including average province exam mark, percentage of exams failed, courses taken perstudent, diploma completion rate, and delayed advancement rate. In Sweden we use the 9th-grade grade point average (GPA). Countrycontrols are a full set of country dummies (17 for columns 1–5, 2 for column 6, and 4 for column 7). Industry controls are 162 SIC three-digitdummies. Columns 1–6: General controls comprise firm-level controls for average hours worked and the proportion of employees withcollege degrees (from the survey), plus a set of survey noise controls that are interviewer dummies, the seniority and tenure of themanager who responded, the day of the week the interview was conducted, the time of day the interview was conducted, the durationof the interview, and an indicator of the reliability of the information as coded by the interviewer. Column 7: General controls comprisehospital-level controls for ln(average hours worked) and ln(hospital age), a dummy if interviewee is a nurse, the number of sites in thehospital network, and percentage of managers with a clinical degree, plus a set of survey noise controls that are 10 interviewer dummies,the seniority and tenure of the manager who responded, the day of the week the interview was conducted, the time of day the interviewwas conducted, the duration of the interview, and an indicator of the reliability of the information as coded by the interviewer. Column8: General controls comprise regional dummies and school-level controls for the pupil/teacher ratio and the different types of schoolsincluded in the sample (public, magnet, and charter in the U.S.; public, voluntary aided, foundations, and independent in the U.K.; public,separate, and independent in Canada), plus a set of survey noise controls that are 19 interviewer dummies, the tenure of the manager whoresponded, the day of the week the interview was conducted, the time of day the interview was conducted, the duration of the interview,and an indicator of the reliability of the information as coded by the interviewer. Source: Bloom, Sadun, and Van Reenen (2012).
26 FebruaryAcademy of Management Perspectives
change much over time (such as technology andculture). Thus, we are comparing firm-levelchanges in productivity with the firm’s changes inmanagement practices. In this demanding specifi-cation the coefficient on management drops to0.047 but remains statistically significant.19 Thesecorrelations are not simply driven by the Anglo-Saxon countries, as one might suspect if the mea-sures were culturally biased. The relationship be-tween productivity and management is strongacross all regions in the data. The significance isalso robust to different ways of combining the 18management practices—for example, using theprincipal factor of the questions instead of theaverage in column 1 of Table 3 yields a pointestimate (standard error) of 0.374 (0.019).
In column 4 of Table 3 we report profitability,as measured by return on capital employed (de-fined as profits over equity plus debt capital) andfind that this is about two percentage pointshigher for every one-point increase in the man-agement score. In column 5 we use the five-yearsales growth rate as the outcome. Here, a unitimprovement in the management practice score isassociated with 6.7% higher annual sales growth.In column 6 we examine exit, defined as bank-ruptcy or liquidation by the last year of our ac-counts data (typically 2010). We find that a one-point increase in management practices isassociated with a 1.1% reduction in exit, a sub-stantial difference given that the average exit ratewas 2.4% for this sample.
Another key measure of performance is firmsize. Better managed firms should be larger, andthis is partly because the market will allocate thesefirms a greater share of sales and also becauselarger firms have the resources and incentives toemploy better management (e.g., if there are fixedcosts of the types of management practices weconsider). When we plotted average managementscore against the number of employees in a firm
(as a measure of firm size) we found that firms with100 to 200 employees had average managementscores of about 2.7. The management score thenrose steadily with firm size, so that firms with2,000 to 5,000 employees—the largest firms in oursample—had average management scores ofabout 3.2.
The association of management with firm per-formance is also clear in other sectors outsidemanufacturing. In Bloom, Propper, Seiler, andVan Reenen (2010) we interviewed 161 managersand physicians in the orthopedic and cardiologydepartments of 100 U.K. hospitals. We found thatmanagement scores were significantly associatedwith better performance as indicated by improvedsurvival rates from emergency heart attack admis-sions and other kinds of general surgery as well asshorter waiting lists. In column 7 of Table 3, weshow the association between management and30-day risk-adjusted mortality rates from patientsadmitted to the hospital with acute myocardialinfarction (AMI)20 across U.K. and U.S. hospi-tals. The estimates show that a one-point increasein management is associated with a decrease of0.471 points of a standard deviation in the risk-adjusted mortality rate. For schools, column 8reports the association between management andmeasures of pupils’ achievement.21 A one-pointincrease in management is associated with an in-crease of 0.196 of a standard deviation in testscores.
ManagementClusters
A large recent literature has focused on the po-tential complementarity between different types
19 Note that the drop in the magnitude of the coefficient is due entirelyto the introduction of firm-level fixed effects. This means the parametersare estimated solely from short-run changes in management practices,which are almost certainly measured with more noise than cross-sectionaldifferences. For example, if we repeat the specification of column 2 on thesubsample of 1,349 firms with multiple management observations, thecoefficient on the management score is 0.210 (standard error 0.029).
20 This is recognized to be a good outcome measure of acute carequality for several reasons. First, patients are usually taken to the nearesthospital after an acute heart attack. Second, survival is accurately mea-sured, as are risk adjustments. Third, providing care for this illness requiresthe mobilization of a variety of processes and services, so the AMI survivalrate is a good proxy for quality of care (Skinner & Staiger, 2009).
21 Due to data availability, the school-level measure of students’achievement varies across countries (the variable is z-scored to take intoaccount these differences). In the United States we use the math exam passrate from HSEEs. In the U.K. we employ the proportion of studentsachieving five GCSEs (level 2) including English and math. In Canada weemploy the school-level rating produced by the Fraser Institute, which isbased on several measures of student achievement, including average prov-ince exam mark, percentage of exams failed, courses taken per student,diploma completion rate, and delayed advancement rate. In Sweden we usethe GPA in the 9th grade.
2012 27Bloom, Genakos, Sadun, and Van Reenen
of management practices. For example, the re-turns on having strong targets are likely to behigher if an organization can also monitor perfor-mance. To investigate this we run a principalcomponent factor analysis on our 18 managementquestions. We find that the primary factor ex-plains 44% of the variation across firms and loadspositively on all practices. This presumably re-flects that some common factor—such as having agood CEO or operating in a competitive productmarket—improves all types of management prac-tices within a firm. The second factor explainsonly another 7% of the data, but does load posi-tively on monitoring and targets and negativelyon incentives. This suggests that some firms spe-cialize more in the monitoring (often those fromGermany, Sweden, and Japan) and other firmsspecialize more in incentives (often those fromAnglo-Saxon countries). Hence, we find someevidence for a moderate clustering of managementpractices, although most of the variation seemscommon to all practices within a firm.
PotentialDownsidesofManagementImprovements forWorkersand theEnvironment
Many commentators might agree that the man-agement practices we identify are beneficial forproductivity but would remain concerned thatsuch practices may have serious downsides inother dimensions. In particular, could improvingthese management practices have a negative effecton workers’ life balance and/or degrade theenvironment?
In the first major survey wave in 2004, we alsocollected information on aspects of work-life bal-ance such as child-care facilities, job flexibility,and self-assessed employee satisfaction. We foundthat well-managed firms actually tended to havebetter facilities and policies for workers alongthese dimensions (Bloom, Kretschmer, & VanReenen, 2011).
In terms of environmental impact, we foundthat energy-efficiency is strongly associated withbetter firm-level management. This is likely to bebecause good management practices (such as leanmanufacturing) tend to economize on energy use(Bloom, Genakos, Martin, & Sadun, 2010).
Experimental EvidenceonManagementQualityandFirmPerformance
The results shown in Table 3 reveal only condi-tional correlations between management andperformance. Unfortunately, it is very hard to
distinguish cause and effect from these resultsalone. For example, it could be that better man-agement practices improve firm performance, ormaybe when firms are performing well they tendto modernize their management practices, ormaybe something else (such as hiring educatedmanagers) drives both better performance and im-proved management. This inability to distinguishcause from effect in management performanceanalysis is obviously an issue with our survey ev-idence, but also more generally with the entiresurvey and case study literature. Without evidenceon causality, it is extremely hard to make strongstatements about the relationship between man-agement practices and firm performance. As aresult many researchers remain skeptical about theimportance of management practices for explain-ing variations in firm performance.22
One way to investigate the causal impact ofvarious management practices is to run a random-ized management field experiment. The idea issimilar to the way scientists evaluate drugs—pro-viding drugs to a randomly selected treatmentgroup and comparing their outcome to the ex-cluded control group.
One such experiment was recently conductedon 28 large Indian textile factories by a StanfordUniversity–World Bank research team. They pro-vided free management consulting to a set ofrandomly selected treatment plants to help themadopt modern management practices and com-pared their performance to another randomly cho-sen set of control plants (see Bloom, Eifert, Ma-hajan, McKenzie, & Roberts, 2011).23 The Indian
22 See, for example, the discussion in Stigler (1976) and Syverson(2011). The argument against the importance of management is that profitmaximization will lead firms to reduce costs. As a result, any residualvariations in management practices will reflect firms’ optimal responses todiffering market conditions. Hence, different management practices are not“good” or “bad,” but the optimal response to different market circum-stances. This view also underlies the contingency theory of Woodward(1958).
23 Although drug trials are double blind (neither the administeringdoctor nor the patient knows who is treatment and who is control), due to
28 FebruaryAcademy of Management Perspectives
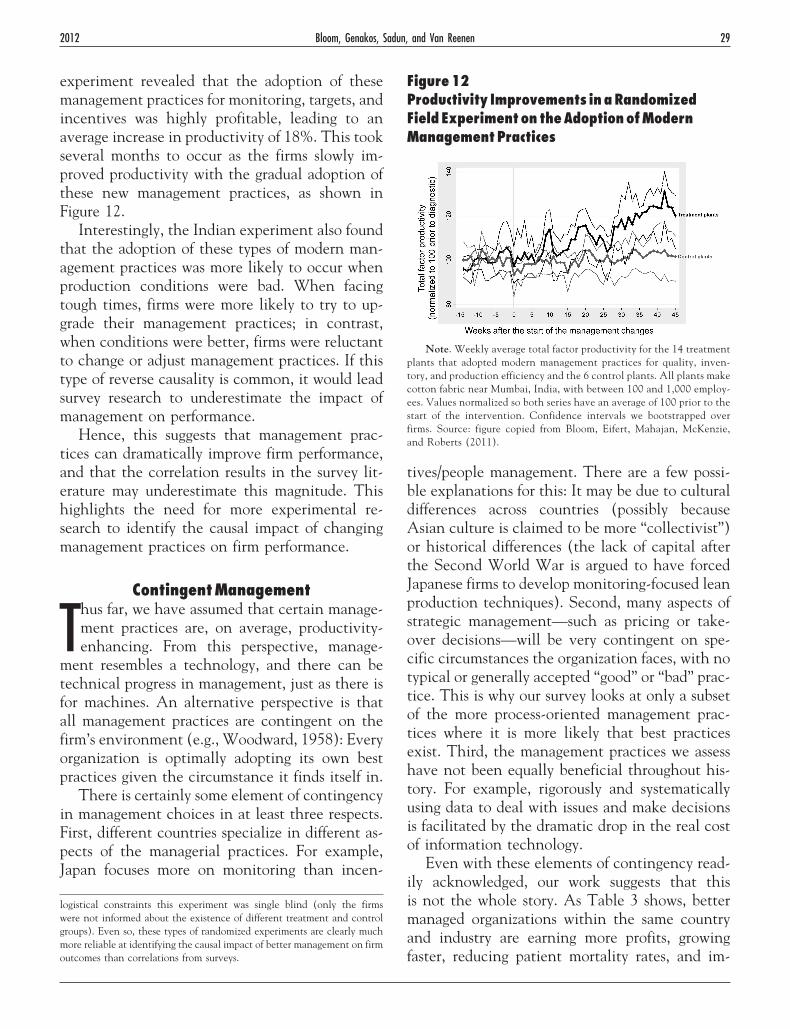
experiment revealed that the adoption of thesemanagement practices for monitoring, targets, andincentives was highly profitable, leading to anaverage increase in productivity of 18%. This tookseveral months to occur as the firms slowly im-proved productivity with the gradual adoption ofthese new management practices, as shown inFigure 12.
Interestingly, the Indian experiment also foundthat the adoption of these types of modern man-agement practices was more likely to occur whenproduction conditions were bad. When facingtough times, firms were more likely to try to up-grade their management practices; in contrast,when conditions were better, firms were reluctantto change or adjust management practices. If thistype of reverse causality is common, it would leadsurvey research to underestimate the impact ofmanagement on performance.
Hence, this suggests that management prac-tices can dramatically improve firm performance,and that the correlation results in the survey lit-erature may underestimate this magnitude. Thishighlights the need for more experimental re-search to identify the causal impact of changingmanagement practices on firm performance.
ContingentManagement
Thus far, we have assumed that certain manage-ment practices are, on average, productivity-enhancing. From this perspective, manage-
ment resembles a technology, and there can betechnical progress in management, just as there isfor machines. An alternative perspective is thatall management practices are contingent on thefirm’s environment (e.g., Woodward, 1958): Everyorganization is optimally adopting its own bestpractices given the circumstance it finds itself in.
There is certainly some element of contingencyin management choices in at least three respects.First, different countries specialize in different as-pects of the managerial practices. For example,Japan focuses more on monitoring than incen-
tives/people management. There are a few possi-ble explanations for this: It may be due to culturaldifferences across countries (possibly becauseAsian culture is claimed to be more “collectivist”)or historical differences (the lack of capital afterthe Second World War is argued to have forcedJapanese firms to develop monitoring-focused leanproduction techniques). Second, many aspects ofstrategic management—such as pricing or take-over decisions—will be very contingent on spe-cific circumstances the organization faces, with notypical or generally accepted “good” or “bad” prac-tice. This is why our survey looks at only a subsetof the more process-oriented management prac-tices where it is more likely that best practicesexist. Third, the management practices we assesshave not been equally beneficial throughout his-tory. For example, rigorously and systematicallyusing data to deal with issues and make decisionsis facilitated by the dramatic drop in the real costof information technology.
Even with these elements of contingency read-ily acknowledged, our work suggests that thisis not the whole story. As Table 3 shows, bettermanaged organizations within the same countryand industry are earning more profits, growingfaster, reducing patient mortality rates, and im-
logistical constraints this experiment was single blind (only the firmswere not informed about the existence of different treatment and controlgroups). Even so, these types of randomized experiments are clearly muchmore reliable at identifying the causal impact of better management on firmoutcomes than correlations from surveys.
Figure12Productivity Improvements inaRandomizedField Experimenton theAdoptionofModernManagementPractices
Note. Weekly average total factor productivity for the 14 treatmentplants that adopted modern management practices for quality, inven-tory, and production efficiency and the 6 control plants. All plants makecotton fabric near Mumbai, India, with between 100 and 1,000 employ-ees. Values normalized so both series have an average of 100 prior to thestart of the intervention. Confidence intervals we bootstrapped overfirms. Source: figure copied from Bloom, Eifert, Mahajan, McKenzie,and Roberts (2011).
2012 29Bloom, Genakos, Sadun, and Van Reenen
proving student test scores, among other perfor-mance measures. This is hard to square with theidea that all the differences in management practicesreflect optimal responses to different circumstances.
It thus seems much more likely that manyaspects of management style are not contingent.For example, basing promotion on nepotism orkeeping workers at the same job without any re-gard to their performance is unlikely to be pro-ductivity-enhancing in any economy. Moreover,in every country in our survey, multinationals dobring a stronger management approach, eventhough the multinationals need to work with mostof the same constraints that domestic firms face.
FutureResearch
Empirical research on the international aspectsof management practices is somewhat embry-onic; there are several fruitful areas for addi-
tional research. One such area is the use of fieldexperiments. It would be helpful to see more man-agement experiments in firms, hospitals, andschools to clearly identify the causal impacts ofbetter management practices. Another area is lon-ger run management panel data, which will helpto identify the dynamics of managerial change andmake stronger statements about cause and effect.This latter approach is part of our ongoing re-search, as we have already sampled a set of 2,094firms in three periods (2004, 2006, and 2009) andare hoping to run another large survey wave soonto continue to build the panel dimension of thedata. This will help us match the data moreclosely to various theories of why we observe suchvast heterogeneity of management practices.
A third methodological area to explore iswhether we can simplify our methods of quantify-ing management into a set of “closed questions”on a paper survey. Working with the EuropeanBank of Reconstruction and Development, wepiloted this on a sample of firms in formerly Com-munist countries, finding results on performance,ownership, skills, and competition consistent withthose discussed above (see Bloom, Schweiger, &Van Reenen, 2011). We are now working withthe U.S. Census Bureau to develop this approachfurther into large-scale publicly accessible man-agement datasets. A management survey on about
48,000 plants was carried out in the spring of 2011and will be accessible to researchers by 2012 viathe Census Research Data Centers. We hope thiswill be the first of several survey waves, buildinglarge-scale publicly accessible management paneldatasets.
Fourth, this research has focused mainly onoperational practices such as improved monitor-ing, tougher targets, and stronger incentives; ageneral consensus that these can be beneficial forperformance seems to be forming. We would liketo widen our focus to a broader range of practic-es—for example, human resource practices overflexi-time, flexi-place, and job sharing. There isvery little consensus about the costs and benefitsof these human resource practices, with firms andresearchers taking a wide range of positions (e.g.,Bloom, Kretschmer, & Van Reenen, 2011), soexperimental evidence on their impact would beparticularly helpful, something we are now work-ing on (see Bloom, Liang, Roberts, & Ying, 2012).More generally, we hope our work encouragesother researchers to rigorously quantify furtheraspects of management practices.
Finally, we are experimenting with ways tobring our research into the classroom as a possiblecomplement to case studies. As a first step in thisdirection, we have conducted in-depth interviewswith multiple managerial figures (from CEOs tonurse managers) within a small sample of U.S. andEuropean hospitals for which a case study existed.We are now using this type of material in special-ized MBA and management courses at Harvardand Stanford Business Schools and LSE, and wehope to continue to develop the use of quantita-tive data on management as a support tool for theclass teaching.
Conclusions
Studying the causes and implications of varia-tion in productivity across firms has become animportant theme in social science. While sev-
eral fields have been studying management formany decades, economists have traditionally ig-nored management as a driving factor explainingdifferences in productivity. We believe the disci-pline would benefit from more interaction withthe management field. We have started to bridge
30 FebruaryAcademy of Management Perspectives
this gap by developing a simple methodology toquantify some basic aspects of management prac-tices across sectors and countries, and using ex-periments to identify causal impact.
The patterns we find in our large samples ofmanagement data lead us to believe that an im-portant explanation for these large differences inproductivity among firms and countries are varia-tions in management practices. This is hard, butnot impossible, to measure, and we hope themethodology we have developed will be refinedand used by other researchers to help draw theinternational map of management in finer detailin additional countries, industries, and practices.To facilitate this, our methodology and the datawe collected and used in this paper are also freelyavailable on www.worldmanagementsurvey.org.
From a policy perspective, several factors seemimportant in influencing management quality.Product market competition has a critical influ-ence in increasing aggregate management qualityby thinning the ranks of the badly managed andincentivizing the survivors to improve (e.g.,Bloom, Draca, & Van Reenen, 2011). Indeed,much of the cross-country variation in manage-ment appears to be due to the presence or absenceof this tail of bad performers. One reason forhigher average management scores in the UnitedStates is that better managed firms appear to berewarded more quickly with greater market shareand the worse managed forced to rapidly shrinkand exit. This appears to have led American firmsto rapidly copy management best practices fromaround the world, with most large U.S. manufac-turing firms now routinely adopting Japanese-orig-inated lean manufacturing.
We have also uncovered many other policy-relevant effects. For example, taxes and other dis-tortive policies that favor family-run firms appearto hinder better management, while general edu-cation and multinational presence seem valuablein improving management practices.
The patterns described here support many newtheories developed to explain productivity disper-sion but also pose many puzzles. So the empiricaland theoretical foundations of management eco-nomics should continue to be a fertile and excit-ing area for future research.
ReferencesAppelbaum, E., & Batt, R. L. (1994). The new American
workplace: Transforming work systems in the United States.Ithaca, NY: ILR Press.
Barney, J. B., & Arikan, A. M. (2001). The resource-basedview origins and implications. In M. A. Hitt, R. E.Freeman, & J. S. Harrison (Eds.), The Blackwell handbookof strategic management (chapter 5). Oxford, UK, andMalden, MA: Blackwell.
Barney, J. B., & Griffin, R. W. (1992). The management oforganizations: Strategy, structure, behavior. Boston:Houghton Mifflin.
Becker, B. E., & Huselid, M. A. (1998). High performancework systems and firm performance: A synthesis of re-search and managerial implications. Research in Personneland Human Resources Journal, 16(1), 53–101.
Becker, M. C. (2004). Organizational routines: A review ofthe literature. Industrial and Corporate Change, 13(4),643–678.
Bloom, N., Draca, M., & Van Reenen, J. (2011). Tradeinduced technical change? In The impact of Chinese im-ports on innovation, IT and productivity (Discussion PaperNo. 1000). London: Centre for Economic Performance.
Bloom, N., Eifert, B., Mahajan, A., McKenzie, D., & Rob-erts, J. (2011). Does management matter? In Evidencefrom India (Working Paper Series No. 16658). Cam-bridge, MA: National Bureau of Economic Research.Available from http://www.nber.org/papers/w16658.pdf
Bloom, N., Genakos, C., Martin, R., & Sadun, R. (2010).Modern management: Good for the environment or justhot air? Economic Journal, 120(544), 551–572.
Bloom, N., Kretschmer, T., & Van Reenen, J. (2011).Are family-friendly workplace practices a valuablefirm resource? Strategic Management Journal, 32(4),343–367.
Bloom, N., Liang, J., Roberts, J., & Ying, Z. (2012). Doesworking from home work? In Evidence from a corporateexperiment (Stanford Mimeo). Palo Alto, CA: StanfordUniversity. Available from http://www.stanford.edu/~nbloom/WFH.pdf
Bloom, N., Propper, C., Seiler, S., & Van Reenen, J. (2010).The impact of competition on management quality: Evidencefrom public hospitals (Working Paper Series No. 16032).Cambridge, MA: National Bureau of Economic Re-search.
Bloom, N., Sadun, R., & Van Reenen, J. (2009a). Theorganization of firms across countries (Working Paper Se-ries No. 15129). Cambridge, MA: National Bureau ofEconomic Research. Available from http://www.nber.org/papers/w15129.pdf
Bloom, N., Sadun, R., & Van Reenen, J. (2009b). Doprivate equity-owned firms have better managementpractices? In A. Gurung & J. Lerner (Eds.), The globaleconomic impact of private equity report 2009 (pp. 1–23).Geneva, Switzerland: World Economic Forum. Avail-able from http://www.weforum.org/pdf/cgi/pe/Full_Report2.pdf
Bloom, N., Sadun, R., & Van Reenen, J. (2012). Manage-ment as a technology (LSE Mimeo). London: LondonSchool of Economics.
2012 31Bloom, Genakos, Sadun, and Van Reenen
Bloom, N., Sadun, R., & Van Reenen, J. (in press). Amer-icans do I.T. better: US multinationals and the produc-tivity miracle. American Economic Review.
Bloom, N., Schweiger, H., & Van Reenen, J. (2011). The landthat lean manufacturing forgot? Management practices in tran-sition countries (Working Paper Series No. 17231). Cam-bridge, MA: National Bureau of Economic Research.
Bloom, N., & Van Reenen, J. (2007). Measuring and ex-plaining management practices across firms and coun-tries. Quarterly Journal of Economics, 122(4), 1351–1408.
Bloom, N., & Van Reenen, J. (2011). Human resourcemanagement and productivity. In O. Ashenfelter & D.Card (Eds.), Handbook of labor economics (vol. 4B, pp.1697–1769). Amsterdam: Elsevier.
Boeker, W., & Karichalil, R. (2002). Entrepreneurialtransitions: Factors influencing founder departure. Acad-emy of Management Journal, 45(4), 818–826.
Cumming, D., Siegel, D. S., & Wright, M. (2007). Privateequity, leveraged buyouts and governance. Journal ofCorporate Finance, 13(4), 439–460.
Davila, A., Foster, G., & Jia, N. (2010). Building sustainablehigh-growth startup companies: Management systems as anaccelerator. California Management Review, 52(3), 79–105.
Delery, J. E., & Doty, D. H. (1996). Modes of theorizing instrategic human resource management: Tests of univer-salistic, contingency, and configurational performancepredictions. Academy of Management Journal, 39(4),802–835.
Delfgaauw, J., Dur, R., Proper, C., & Smith, S. (2011).Management practices: Are not for profits different? (Work-ing Paper 11/263). Bristol, UK: Center for Market andPublic Organisation.
Dohrmann, T., & Pinshaw, G. (2009). The road to improvedcompliance: A McKinsey benchmarking study of tax admin-istrations 2008–2009. New York: McKinsey & Company.
Eisenhardt, K. M., & Martin, J. A. (2000). Dynamiccapabilities: What are they? Strategic Management Jour-nal, 21(10/11), 1105–1121.
Foster, L., Haltiwanger, J., & Krizan, C. J. (2006). Marketselection, reallocation, and restructuring in the U.S.retail trade sector in the 1990s. Review of Economics andStatistics, 88(4), 748–758.
Foster, L., Haltiwanger, J., & Syverson, C. (2008). Reallo-cation, firm turnover, and efficiency: Selection on pro-ductivity or profitability? American Economic Review,98(1), 394–425.
Greene, W. (2002). Econometric analysis (5th ed.). UpperSaddle River, NJ: Prentice Hall.
Grous, A. (2011). Management practices in the UK aerospacesector (LSE Mimeo). London: London School of Eco-nomics.
Harris, R., Siegel, D. S., & Wright, M. (2005). Assessing theimpact of management buyouts on economic efficiency:Plant-level evidence from the United Kingdom. Reviewof Economics and Statistics, 87(1), 148–153.
Homkes, R. (2011). The missing management link: Why man-agement matters in global public-private partnerships (LSEMimeo). London: London School of Economics.
House, R. J., Hanges, P. M., Javidan, M., Dorfman, P., &Gupta, V. (2004). Culture, leadership, and organizations:
The GLOBE study of 62 societies. Thousand Oaks, CA:Sage Publications.
Hoxby, C. M. (2000). Does competition among publicschools benefit students and taxpayers? American Eco-nomic Review, 90(5), 1209–1238.
Huselid, M. A., & Becker, B. E. (1996). Methodologicalissues in cross-sectional and panel estimates of the hu-man resource-firm performance. Industrial Relations,35(3), 400–422.
Ichniowski, C., Shaw, K., & Prennushi, G. (1997). Theeffects of human resource management practices onproductivity: A study of steel finishing lines. AmericanEconomic Review, 87(3), 291–313.
Javidan, M., Dorfman, P., Sully de Luque, M., & House, R. J.(2006). In the eye of the beholder: Cross-cultural lessonsin leadership from Project GLOBE. Academy of Manage-ment Perspectives, 20(3), 67–91.
Lengnick-Hall, M. L., Lengnick-Hall, C. A., Andrade, L. S.,& Drake, B. (2009). Strategic human resourcemanagement: The evolution of the field. Human Re-source Management Review, 19(2), 64–85.
Lepak, D. P., Liao, H., Chung, Y., & Harden, E. (2006). Aconceptual review of human resource management sys-tems in strategic human resource management research.In J. Martocchio (Ed.), Research in personnel and humanresource management (pp. 217–271). Stamford, CT: JAIPress.
Lichtenberg, F. R., & Siegel, D. (1990). The effects ofleveraged buyouts on productivity and related aspects offirm behavior. Journal of Financial Economics, 27(1),165–194.
Macduffie, J. P. (1995). Human resource bundles and man-ufacturing performance: Organizational logic and flexi-ble production systems in the world auto industry. Indus-trial and Labor Relations Review, 48(2), 197–221.
McConnell, J., Hoffman, K., Quanbeck, A., & McCarty, D.(2009). Management practices in substance abuse treat-ment programs. Journal of Substance Abuse, 37(1), 79–89.
McKinsey & Company. (2009). Management matters in North-ern Ireland and the Republic of Ireland. Available at http://www.delni.gov.uk/management_matters_in_ireland.pdf
McNally, S. (2010). Evaluating education policies: The evi-dence from economic research (Paper No. CEPEA008).London: Centre for Economic Performance. Available athttp://cep.lse.ac.uk/pubs/download/ea008.pdf
Nelson, R. R., & Winter, S. G. (1982). An evolutionarytheory of economic change. Cambridge, MA: BelknapBooks of Harvard University Press.
Osterman, P. (1994). How common is workplace transfor-mation and who adopts it? Industrial and Labor RelationsReview, 47(2), 173–188.
Pfeffer, J. (1999a). Seven practices of successful organiza-tions. Health Forum Journal, 42(1), 24–27.
Pfeffer, J. (1999b). Seven practices of successful organiza-tions, Part 2: Invest in training, reduce status differences,don’t keep secrets. Health Forum Journal, 42(2), 55.
Pfeffer, J., & Veiga, J. F. (1999). Putting people first fororganizational success. Academy of Management Execu-tive, 13(2), 37–48.
32 FebruaryAcademy of Management Perspectives
Siegel, D. S., & Simons, K. (2010). Assessing the effects ofmergers and acquisitions on firm performance, plantproductivity, and workers: New evidence from matchedemployer-employee data. Strategic Management Journal,31, 903–916.
Skinner, J., & Staiger, D. (2009). Technology diffusion andproductivity growth in health care (Working Paper SeriesNo. 14865). Cambridge, MA: National Bureau of Eco-nomic Research.
Syverson, C. (2011). What determines productivity? Journalof Economic Literature, 49(2), 326–365.
Washburn, N., Waldman, D., & Sully de Luque, M. (2009).Agents behaving like stewards: Executive discretion andthe display of steward behaviors. Paper presented at the69th Annual Meeting of the Academy of Management,Chicago, IL.
Winter, S. G. (2003). Understanding dynamic capabilities.Strategic Management Journal, 24(10), 991–995.
Woodward, J. (1958). Management and technology. London:H. M. Stationery Office.
AppendixAExtensive details of the survey procedure are contained inBloom and Van Reenen (2007), which we summarize andupdate below.
Sample Population. The manufacturing management survey wastargeted at the population of firms with 100 to 5,000 em-ployees across 20 countries. These firms were drawn fromnational firm databases and company registries—for exam-ple, Companies House in the United Kingdom, Dun andBradstreet in the United States, and the Registrar of Com-panies in India. From comparisons with national censusdatabases, these firm populations appear to provide goodcoverage (50% or more) in every country we analyze.
Survey Organization. We ran management surveys primarilyfrom the London School of Economics during the summer,because we could obtain space for the survey team (class-rooms are empty in the summer) and hire high-qualitysurvey team members (MBA and Ph.D. students duringtheir summer break). London is an excellent survey locationbecause it lies midway between the United States and Asiantime zones and is in the European time zone, and it is easyto hire interviewers with a range of language skills.
We organized the survey team into groups, with fourinterviewers in each group overseen by a group manager.The interviewers were paid by interview completed; thegroup manager silently listened in to each interview toensure interview quality. The group managers were peoplewe could trust, such as ourselves or Ph.D. students. Aftersome initial experimentation we found this combination ofpiece-rate pay for the interviewers with extensive monitor-ing to be particularly effective in both generating a largenumber of interviews and ensuring high interview quality
(since the group managers would provide feedback aftereach interview).
Cross-Country Management Calibration. We operated the survey teamfrom one location to harmonize cross-country data comparison.In particular, all team members had the same initial training,they all sat in one large survey room, and they all attendedweekly survey calibration meetings at which we would collec-tively discuss one interview and compare scores.
Interviewers were also all required to run 10 interviewseach in at least two different countries. This typically in-volved running 10 or more interviews in each of the UnitedKingdom and United States (since all interviewers spokeEnglish) plus at least one other country (for example, Francefor the French-speaking interviewers). As a result, our me-dian interviewer ran interviews on managers in three differ-ent countries. Hence, when we report low managementscores in Indian firms this is based on the survey evidencefrom interviewers who were regularly using the same grid tointerview managers in India, the United Kingdom, and theUnited States, so are well positioned to make an accurateinternational assessment.
Finally, 25.4% of our sample are affiliates of foreignmultinationals—for example, a Japanese-owned firm oper-ating in France. These firms were always interviewed in thenative language (French in this example), but we can alsocompare their management practices to those of their parentcountry (Japan in this example). Interestingly, we foundthat multinational subsidiaries tend to adopt about 50% oftheir practices from their country of location and about 50%from their country of origin. This suggests that our meth-odology is able to pick up cross-country differences in man-agement practices despite the language of the interview, thelocation of the firm, and the nationality of our interviewer.In our example, despite having a French MBA studentinterviewing a French manager (in French) at a firm locatedin France, we would still find on average a significantnumber of Japanese management practices being adopted inthis firm when it is owned by a Japanese parent company.
Variation of Management Practices by Country, Industry, and Firm. Overallwe find that in our manufacturing sample around 11.1% ofour management practices can be explained by country oflocation and about 11.9% by industry of operation (using254 SIC, 1987 three-digit industry codes). Hence, most ofthe variation in management practices cannot be explainedby either country or industry. In part this presumably reflectsthe presence of substantial measurement error in our man-agement scores. But in part it probably reflects the largevariation in management practices in firms operating in thesame country and industry, consistent with the incrediblywide dispersion of productivity of firms in these country-industry cells, reported by Foster, Haltiwanger, and Syverson(2008) and others.
2012 33Bloom, Genakos, Sadun, and Van Reenen