Embed Size (px)
Citation preview
12-14 July 2005 – 1st NWS Svr Wx Warning Technology User Meeting Greg Stumpf – CIMMS/MDL
The New NSSL - MDL Partnership: The New NSSL - MDL Partnership:
CIMMS / University of Oklahoma
NWS Meteorological Development Laboratory Decision Assistance Branch
Location: National Severe Storms Laboratory, Norman, OK
CIMMS / University of Oklahoma
NWS Meteorological Development Laboratory Decision Assistance Branch
Location: National Severe Storms Laboratory, Norman, OK
Gregory J. StumpfGregory J. Stumpf
New Multiple- Radar/Sensor Application R&D for Warning Decision Making
New Multiple- Radar/Sensor Application R&D for Warning Decision Making
12-14 July 2005 – 1st NWS Svr Wx Warning Technology User Meeting Greg Stumpf – CIMMS/MDL
NSSL’s Vision in 2003 for NWS Warning Improvement
NSSL’s Vision in 2003 for NWS Warning Improvement
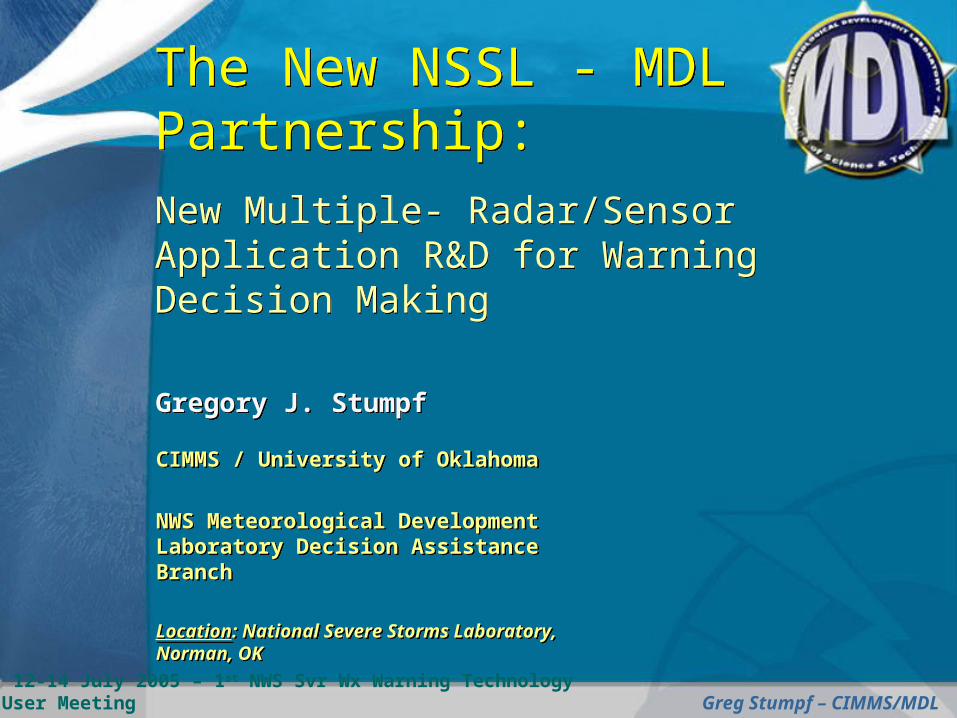
Support NWS Science and Technology Infusion PlanNSSL pitching idea to NWS to make WDSSII a Multi-Sensor Products Generator for AWIPS (to supplement ORPG)
ORPG only produces single-radar products
Warning test beds (at least one per region) using WDSSII to feed products to AWIPSIntroduce 4D radar analysis concepts as an AWIPS “pop-up” option
NWS Warning Decision Making “team” interaction; trainingMotivate WDM team to aid with the design phase of new warning applications and display conceptsInclude WDSSII into WDTB Advanced Warning Operations Course as a high-resolution 4D radar base-data analysis tool
12-14 July 2005 – 1st NWS Svr Wx Warning Technology User Meeting Greg Stumpf – CIMMS/MDL
The First StepThe First Step
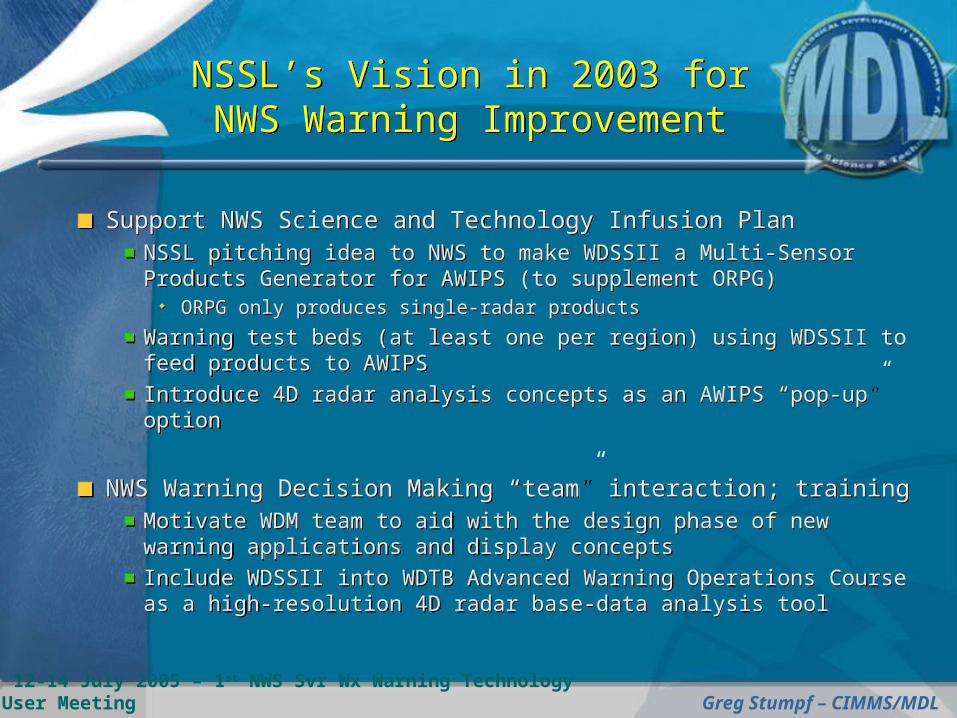
My NSSL position was moved into the NWS Meteorological Development Laboratory Decision Assistance Branch
My new boss: Dr. Stephan Smith
My location remained at NSSL in Norman
Act as a liaison between severe weather research and application development at NSSL and NWS warning operations program
Develop AWIPS testbed for new remote-sensing technologies and new multiple-sensor warning applications
12-14 July 2005 – 1st NWS Svr Wx Warning Technology User Meeting Greg Stumpf – CIMMS/MDL
NSSL’s MissionNSSL’s Mission
To enhance NOAA’s capabilities to provide accurate and timely forecasts and warnings of hazardous weather events. NSSL accomplishes this mission, in partnership with the National Weather Service (NWS), through
a balanced program of research to advance the understanding of weather processes
research to improve forecasting and warning techniques
development of operational applications
and transfer of understanding, techniques, and applications to the NWS.
NSSL is the sole NOAA agency responsible for the R&D of new applications and technology to improve NWS severe weather warning decision making.
12-14 July 2005 – 1st NWS Svr Wx Warning Technology User Meeting Greg Stumpf – CIMMS/MDL
Needs AssessmentNeeds Assessment
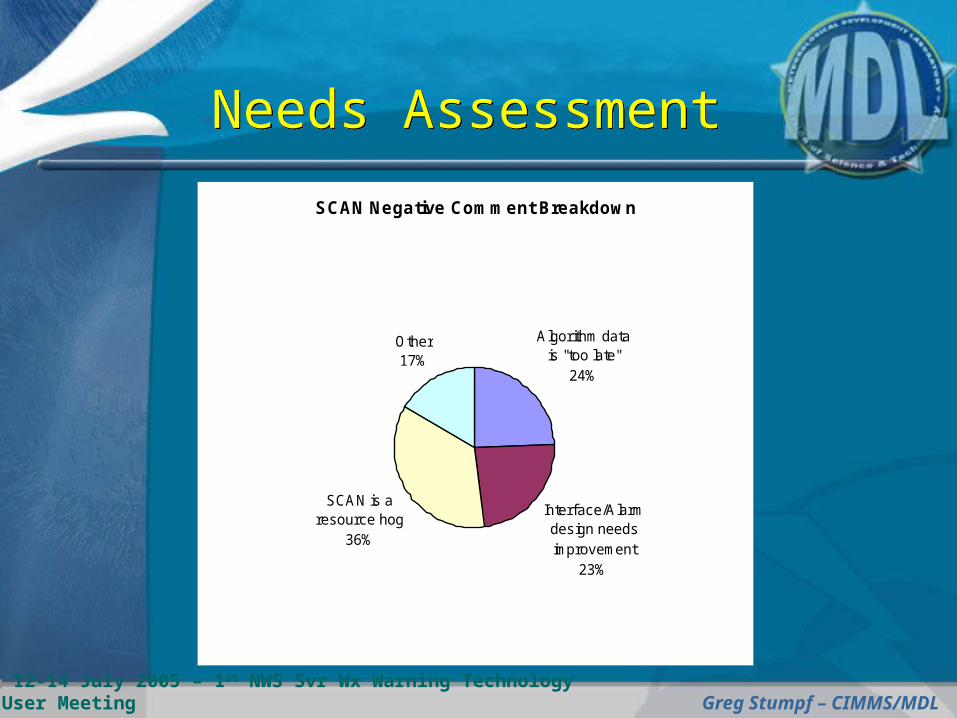
SCAN Negative Comment Breakdown
Algorithm data is "too late"
24%
Interface/Alarm design needs improvement
23%
SCAN is a resource hog
36%
Other17%
12-14 July 2005 – 1st NWS Svr Wx Warning Technology User Meeting Greg Stumpf – CIMMS/MDL
Needs AssessmentNeeds Assessment
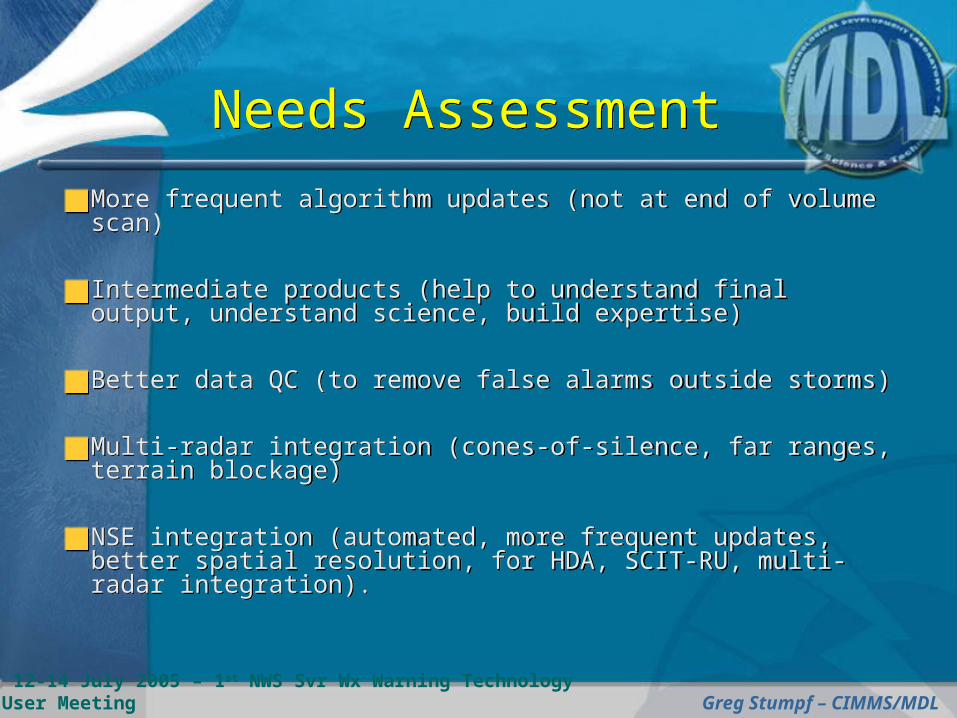
More frequent algorithm updates (not at end of volume scan)
Intermediate products (help to understand final output, understand science, build expertise)
Better data QC (to remove false alarms outside storms)
Multi-radar integration (cones-of-silence, far ranges, terrain blockage)
NSE integration (automated, more frequent updates, better spatial resolution, for HDA, SCIT-RU, multi-radar integration).
12-14 July 2005 – 1st NWS Svr Wx Warning Technology User Meeting Greg Stumpf – CIMMS/MDL
The NWS Severe Weather Warning Challenge
The NWS Severe Weather Warning Challenge
How do operational warning forecasters distinguish between severe and non-severe, and tornadic and non-tornadic thunderstorms with the information they have?
How do operational warning forecasters distinguish between severe and non-severe, and tornadic and non-tornadic thunderstorms with the information they have?
12-14 July 2005 – 1st NWS Svr Wx Warning Technology User Meeting Greg Stumpf – CIMMS/MDL
The NWS Severe Weather Warning Challenge
The NWS Severe Weather Warning Challenge
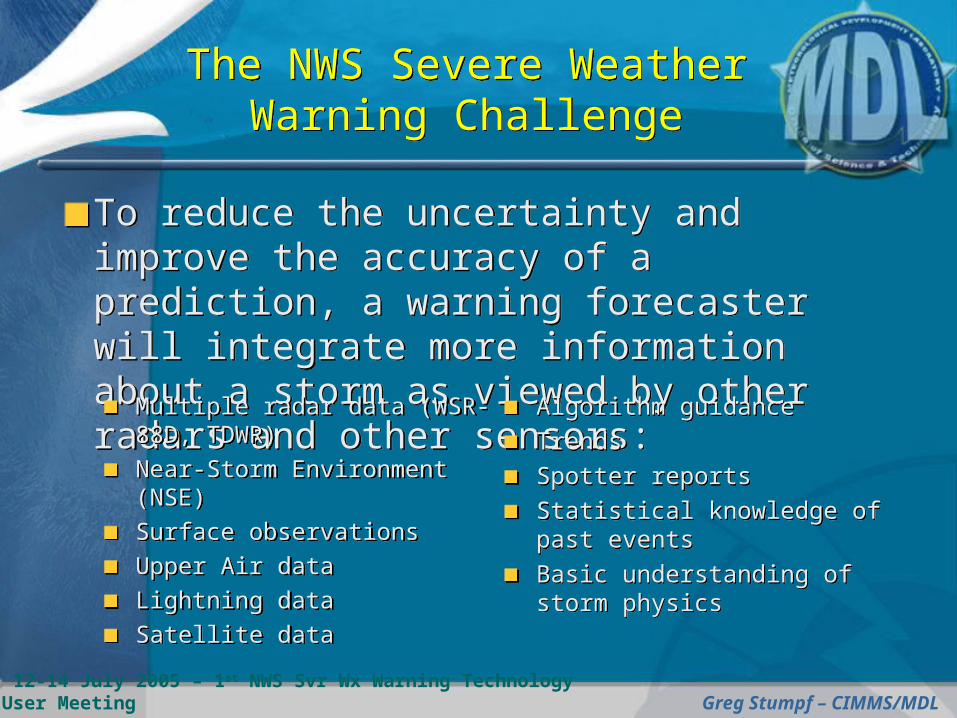
To reduce the uncertainty and improve the accuracy of a prediction, a warning forecaster will integrate more information about a storm as viewed by other radars and other sensors:
To reduce the uncertainty and improve the accuracy of a prediction, a warning forecaster will integrate more information about a storm as viewed by other radars and other sensors:Multiple radar data (WSR-
88D, TDWR)Near-Storm Environment (NSE)Surface observationsUpper Air dataLightning dataSatellite data
Multiple radar data (WSR-88D, TDWR)Near-Storm Environment (NSE)Surface observationsUpper Air dataLightning dataSatellite data
Algorithm guidanceTrendsSpotter reportsStatistical knowledge of past eventsBasic understanding of storm physics
Algorithm guidanceTrendsSpotter reportsStatistical knowledge of past eventsBasic understanding of storm physics
12-14 July 2005 – 1st NWS Svr Wx Warning Technology User Meeting Greg Stumpf – CIMMS/MDL
Severe Weather Warning Decision Making Applications
Severe Weather Warning Decision Making Applications
It makes sense that the NWS severe weather detection, diagnosis, and prediction tools also integrate multiple-sensor information!
“Multiple-sensor” integration is not a new concept
However, the MS concept has yet to be fully realized within NWS warning applications (still mostly single-radar based)
It makes sense that the NWS severe weather detection, diagnosis, and prediction tools also integrate multiple-sensor information!
“Multiple-sensor” integration is not a new concept
However, the MS concept has yet to be fully realized within NWS warning applications (still mostly single-radar based)
12-14 July 2005 – 1st NWS Svr Wx Warning Technology User Meeting Greg Stumpf – CIMMS/MDL
New Severe Weather Algorithm Requirements
New Severe Weather Algorithm Requirements
Objectives for new warning application development:
Integrate multiple-radar and multiple-sensor information No longer single-radar specific Must input highest resolution data in native format More accuracy in detection and diagnosis (oversampling -
more “eyes” looking at storms).
Must have rapid-update capability Uses virtual volume scan concept Better lead time (no more waiting until end of volume
scan for guidance).
Must be scientifically sound
12-14 July 2005 – 1st NWS Svr Wx Warning Technology User Meeting Greg Stumpf – CIMMS/MDL
ORPG Algorithms: SCIT, HDA, TDA, MDA, etc.
Signature detection based on single-radar data.
Disadvantages of single-radar algorithms:Products generated at end of volume scanOnly 5-6 minute updates – storm evolution is fastPoor sampling within cone-of-silence and at far rangesProducts all keyed to individual radar volume scan and radar domain (azimuth/range/elevation)No automated tuning for different near-storm environments
Legacy WSR-88D Severe Weather Applications
Legacy WSR-88D Severe Weather Applications
12-14 July 2005 – 1st NWS Svr Wx Warning Technology User Meeting Greg Stumpf – CIMMS/MDL
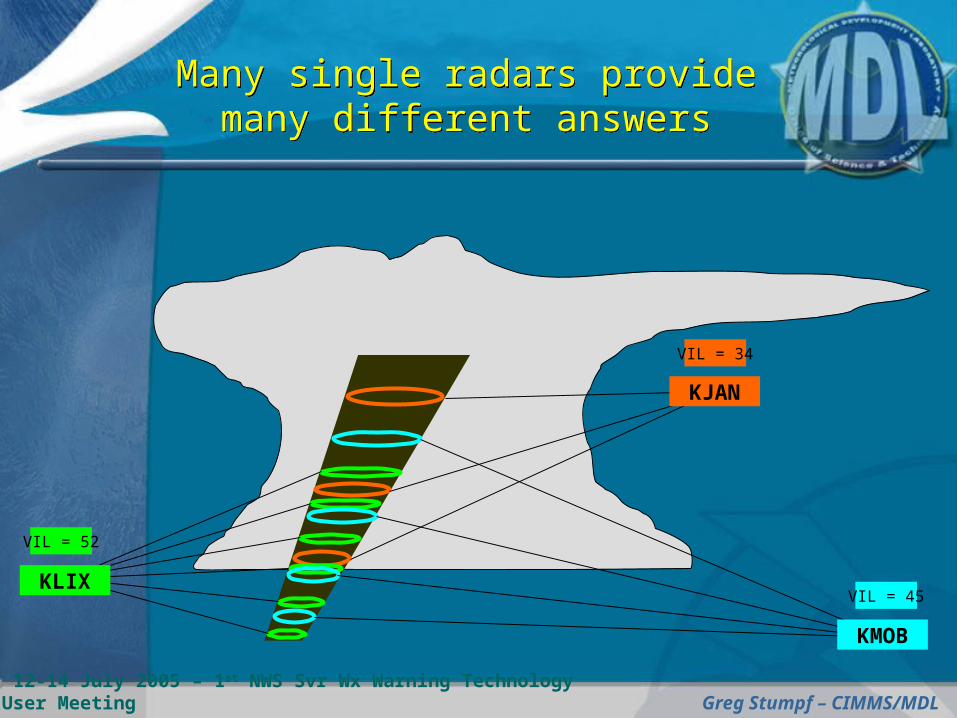
Many single radars provide many different answers
Many single radars provide many different answers
KJAN
VIL = 34
KLIX
VIL = 52
KMOB
VIL = 45
12-14 July 2005 – 1st NWS Svr Wx Warning Technology User Meeting Greg Stumpf – CIMMS/MDL
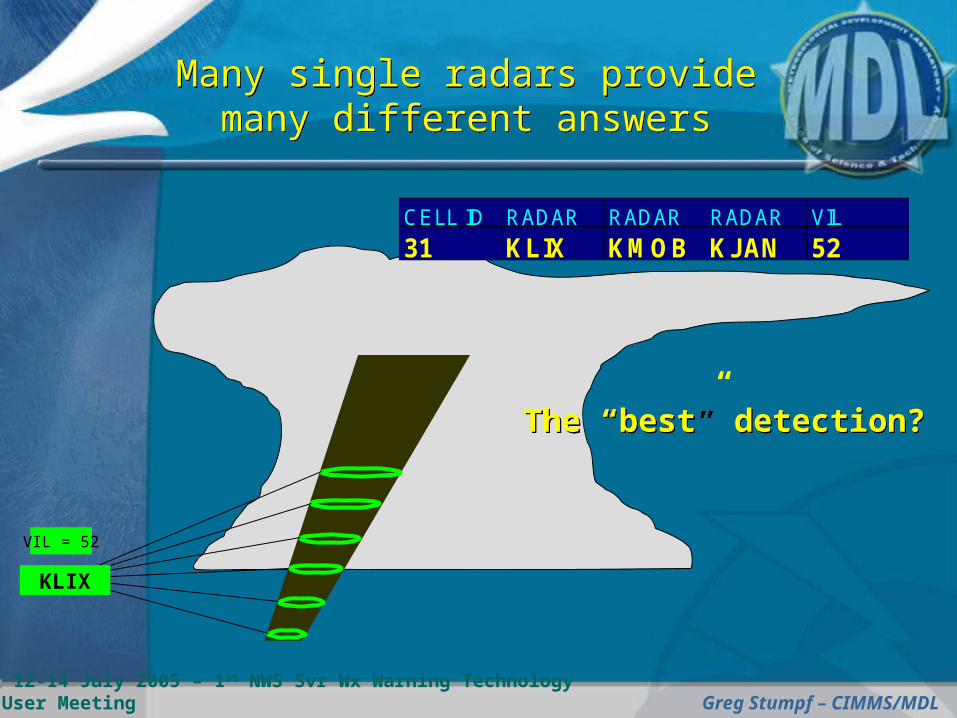
KLIX
VIL = 52
CELL ID RADAR RADAR RADAR VIL
31 KLIX KMOB KJAN 52
The “best” detection?The “best” detection?
Many single radars provide many different answers
Many single radars provide many different answers
12-14 July 2005 – 1st NWS Svr Wx Warning Technology User Meeting Greg Stumpf – CIMMS/MDL
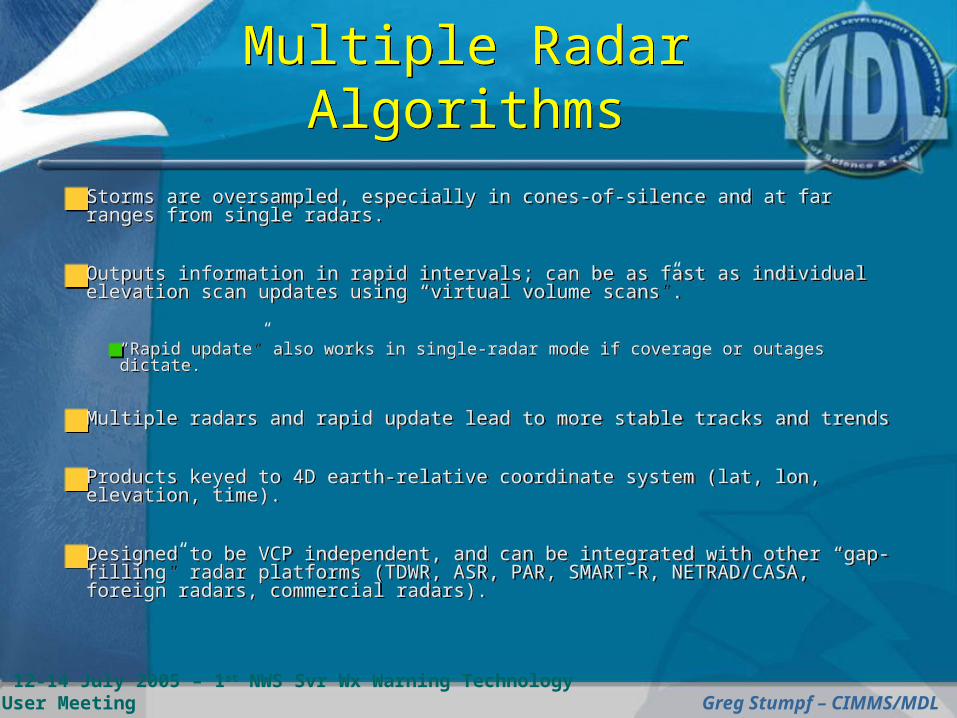
Multiple Radar Algorithms
Multiple Radar Algorithms
Storms are oversampled, especially in cones-of-silence and at far ranges from single radars.
Outputs information in rapid intervals; can be as fast as individual elevation scan updates using “virtual volume scans”.
“Rapid update” also works in single-radar mode if coverage or outages dictate.
Multiple radars and rapid update lead to more stable tracks and trends
Products keyed to 4D earth-relative coordinate system (lat, lon, elevation, time).
Designed to be VCP independent, and can be integrated with other “gap-filling” radar platforms (TDWR, ASR, PAR, SMART-R, NETRAD/CASA, foreign radars, commercial radars).
12-14 July 2005 – 1st NWS Svr Wx Warning Technology User Meeting Greg Stumpf – CIMMS/MDL
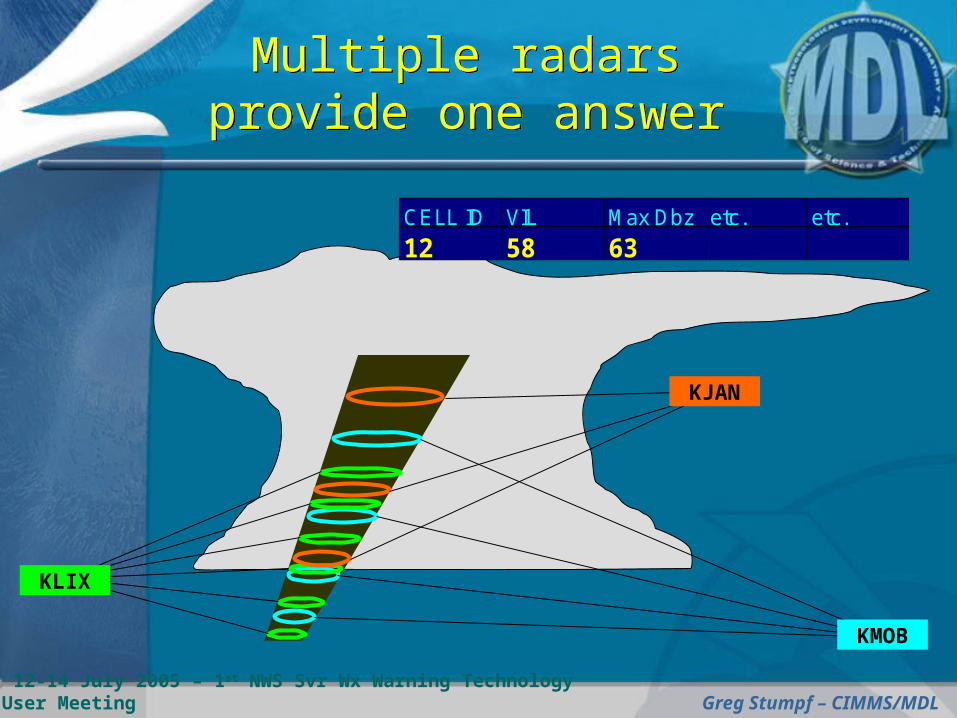
Multiple radars provide one answer
Multiple radars provide one answer
KMOB
KLIX
KJAN
CELL ID VIL Max Dbz etc. etc.
12 58 63
12-14 July 2005 – 1st NWS Svr Wx Warning Technology User Meeting Greg Stumpf – CIMMS/MDL
3D Multiple-radar grid applications
3D Multiple-radar grid applications
Mosaic multiple radar data to create a 3D Cartesian lat/lon/ht grid.Uses time-weighting and power-density (distance) weighting schemes.Intelligently handles terrain blockage, interpolation in sparse grid cellsCan advect older data when running a motion estimator.
Run algorithms on continuously-updating 3D grids (“virtual volumes”) – the data are nearly LIVE:
3D reflectivity field for MaxRef, VIL, echo top, LRM, LRA, hail, Cell ID3D velocity derivative fields for vortex (rotation) and wind shift (convergence) detection.
Easy to integrate other sensor information (NSE, satellite, lightning, etc.) on similar grids.
e.g., Thermodynamic info for hail diagnosis.
12-14 July 2005 – 1st NWS Svr Wx Warning Technology User Meeting Greg Stumpf – CIMMS/MDL
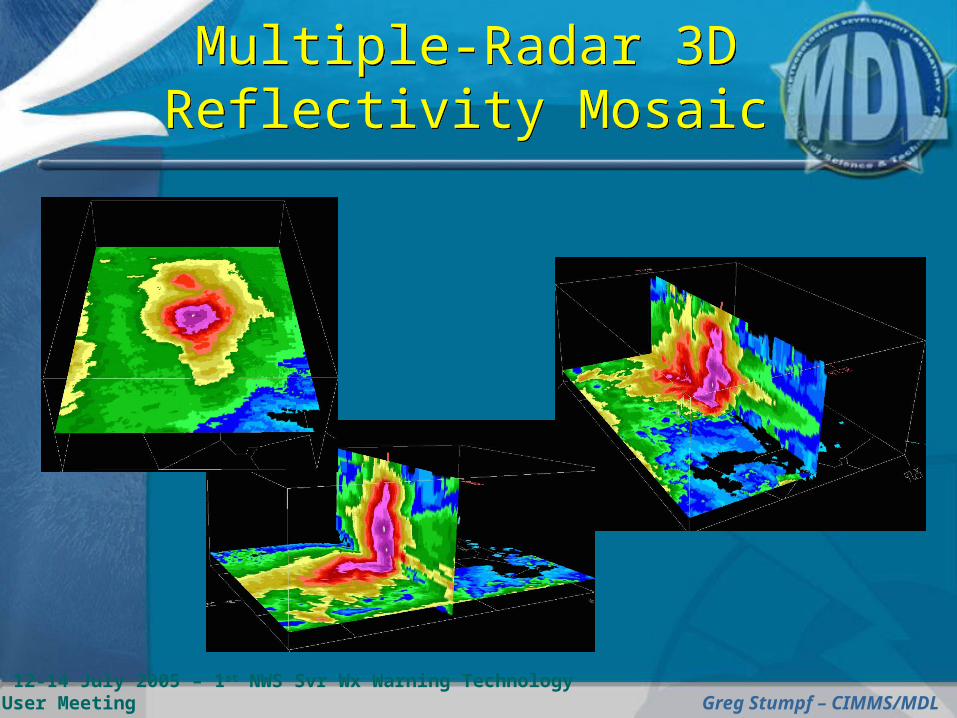
Multiple-Radar 3D Reflectivity MosaicMultiple-Radar 3D Reflectivity Mosaic
12-14 July 2005 – 1st NWS Svr Wx Warning Technology User Meeting Greg Stumpf – CIMMS/MDL
Multiple-Radar 3D Merging
Multiple-Radar 3D Merging
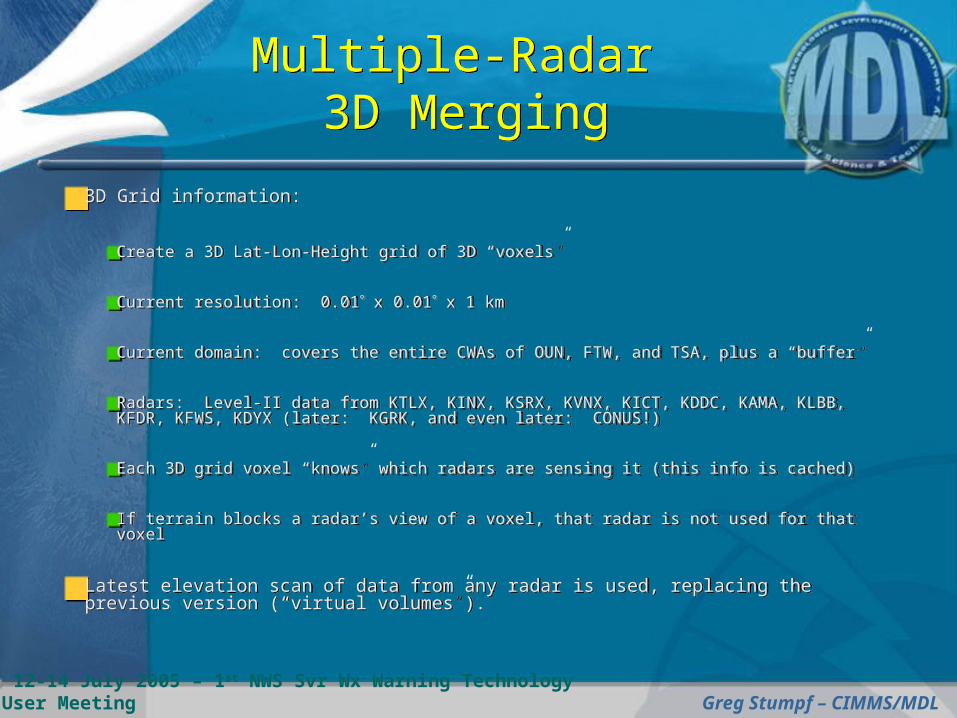
3D Grid information:
Create a 3D Lat-Lon-Height grid of 3D “voxels”
Current resolution: 0.01 x 0.01 x 1 km
Current domain: covers the entire CWAs of OUN, FTW, and TSA, plus a “buffer”
Radars: Level-II data from KTLX, KINX, KSRX, KVNX, KICT, KDDC, KAMA, KLBB, KFDR, KFWS, KDYX (later: KGRK, and even later: CONUS!)
Each 3D grid voxel “knows” which radars are sensing it (this info is cached)
If terrain blocks a radar’s view of a voxel, that radar is not used for that voxel
Latest elevation scan of data from any radar is used, replacing the previous version (“virtual volumes”).
12-14 July 2005 – 1st NWS Svr Wx Warning Technology User Meeting Greg Stumpf – CIMMS/MDL
Multiple-Radar 3D Merging
Multiple-Radar 3D Merging
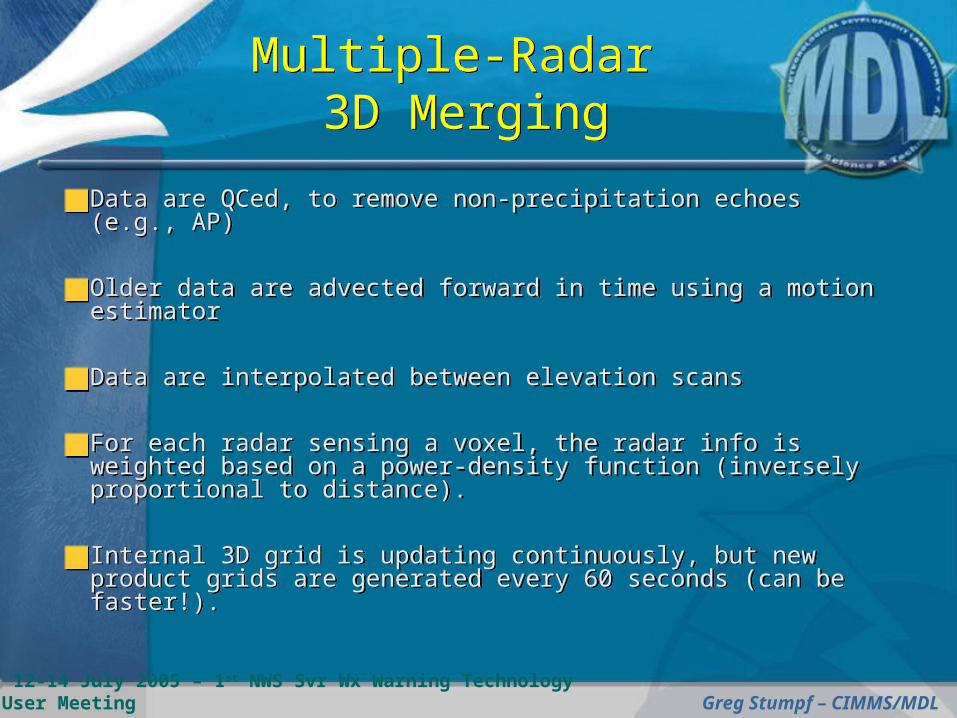
Data are QCed, to remove non-precipitation echoes (e.g., AP)
Older data are advected forward in time using a motion estimator
Data are interpolated between elevation scans
For each radar sensing a voxel, the radar info is weighted based on a power-density function (inversely proportional to distance).
Internal 3D grid is updating continuously, but new product grids are generated every 60 seconds (can be faster!).
12-14 July 2005 – 1st NWS Svr Wx Warning Technology User Meeting Greg Stumpf – CIMMS/MDL
Quality Control Neural Network (QCNN)
Quality Control Neural Network (QCNN)
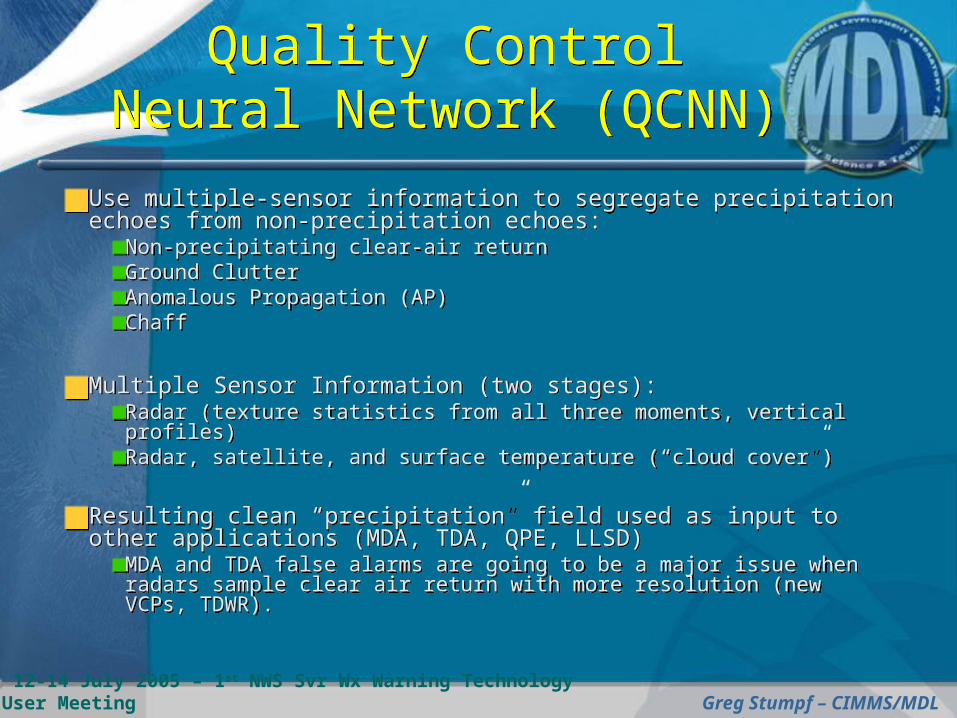
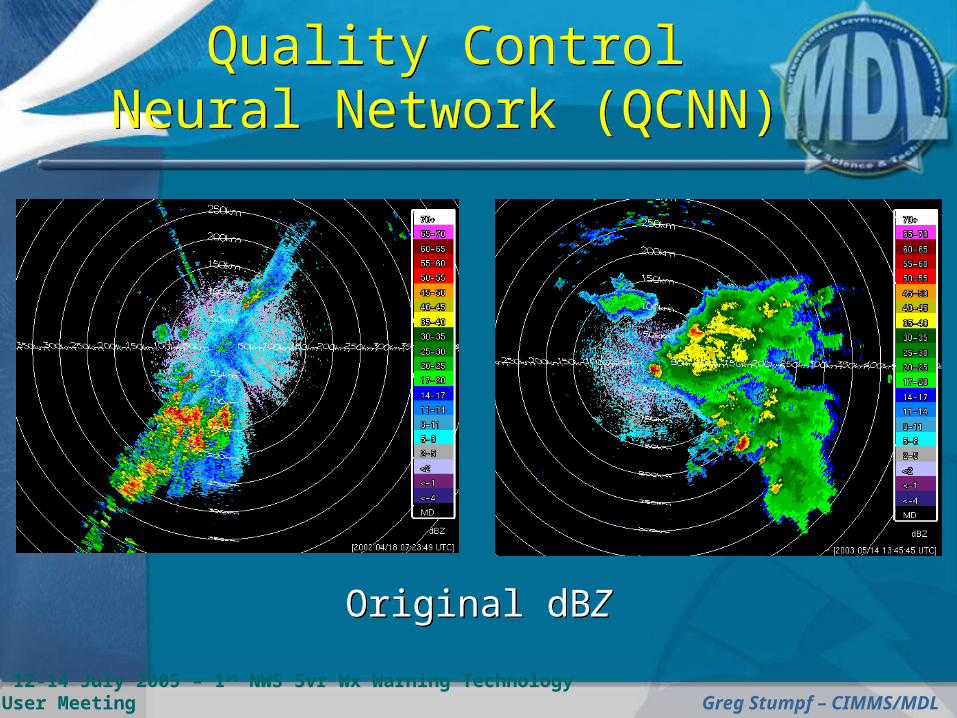
Use multiple-sensor information to segregate precipitation echoes from non-precipitation echoes:
Non-precipitating clear-air returnGround ClutterAnomalous Propagation (AP)Chaff
Multiple Sensor Information (two stages):Radar (texture statistics from all three moments, vertical profiles)Radar, satellite, and surface temperature (“cloud cover”)
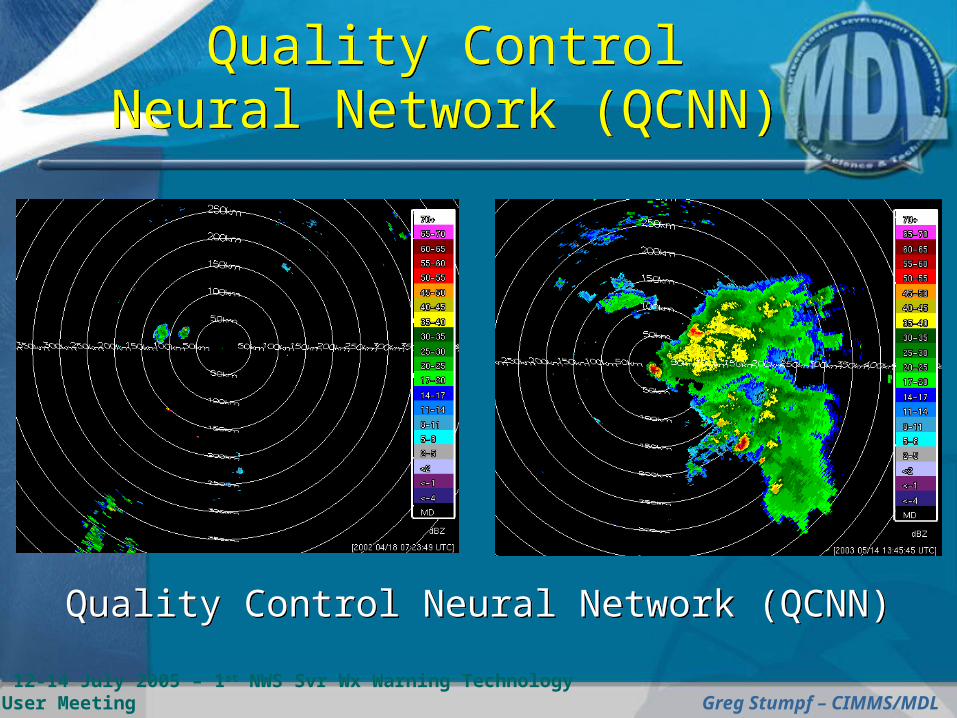
Resulting clean “precipitation” field used as input to other applications (MDA, TDA, QPE, LLSD)
MDA and TDA false alarms are going to be a major issue when radars sample clear air return with more resolution (new VCPs, TDWR).
Use multiple-sensor information to segregate precipitation echoes from non-precipitation echoes:
Non-precipitating clear-air returnGround ClutterAnomalous Propagation (AP)Chaff
Multiple Sensor Information (two stages):Radar (texture statistics from all three moments, vertical profiles)Radar, satellite, and surface temperature (“cloud cover”)
Resulting clean “precipitation” field used as input to other applications (MDA, TDA, QPE, LLSD)
MDA and TDA false alarms are going to be a major issue when radars sample clear air return with more resolution (new VCPs, TDWR).
12-14 July 2005 – 1st NWS Svr Wx Warning Technology User Meeting Greg Stumpf – CIMMS/MDL
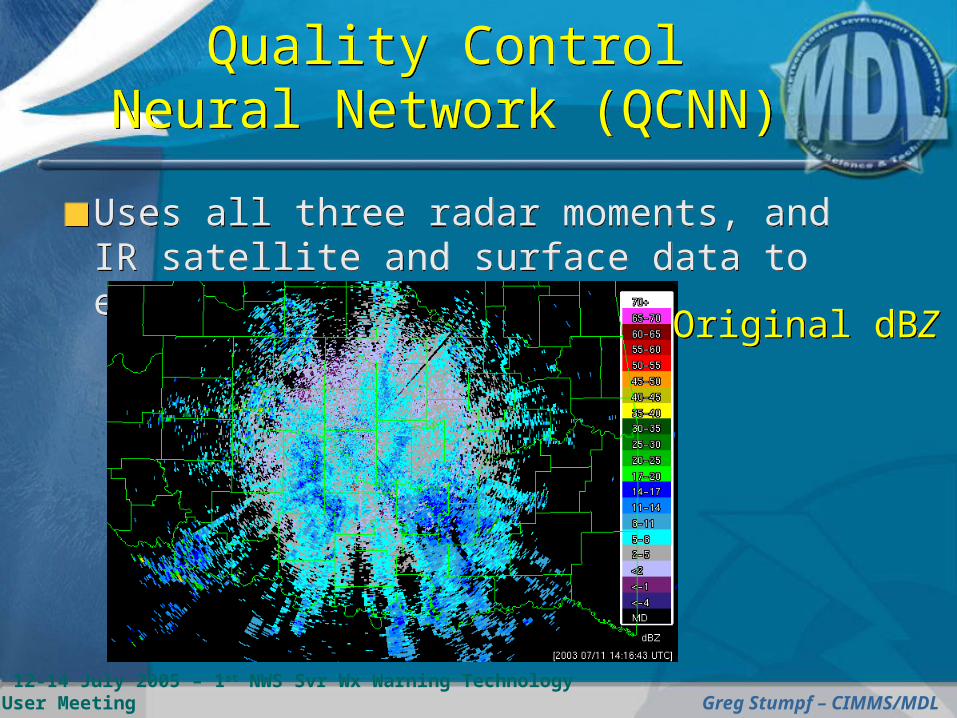
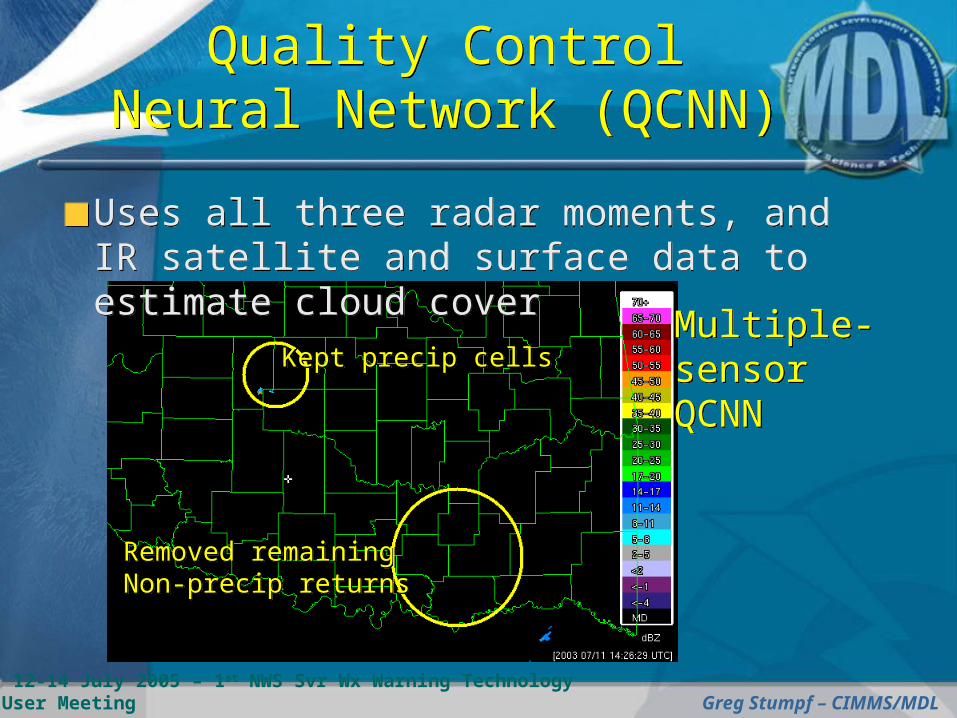
Uses all three radar moments, and IR satellite and surface data to estimate cloud cover
Uses all three radar moments, and IR satellite and surface data to estimate cloud cover
Original dBZ Original dBZ
Quality Control Neural Network (QCNN)
Quality Control Neural Network (QCNN)
12-14 July 2005 – 1st NWS Svr Wx Warning Technology User Meeting Greg Stumpf – CIMMS/MDL
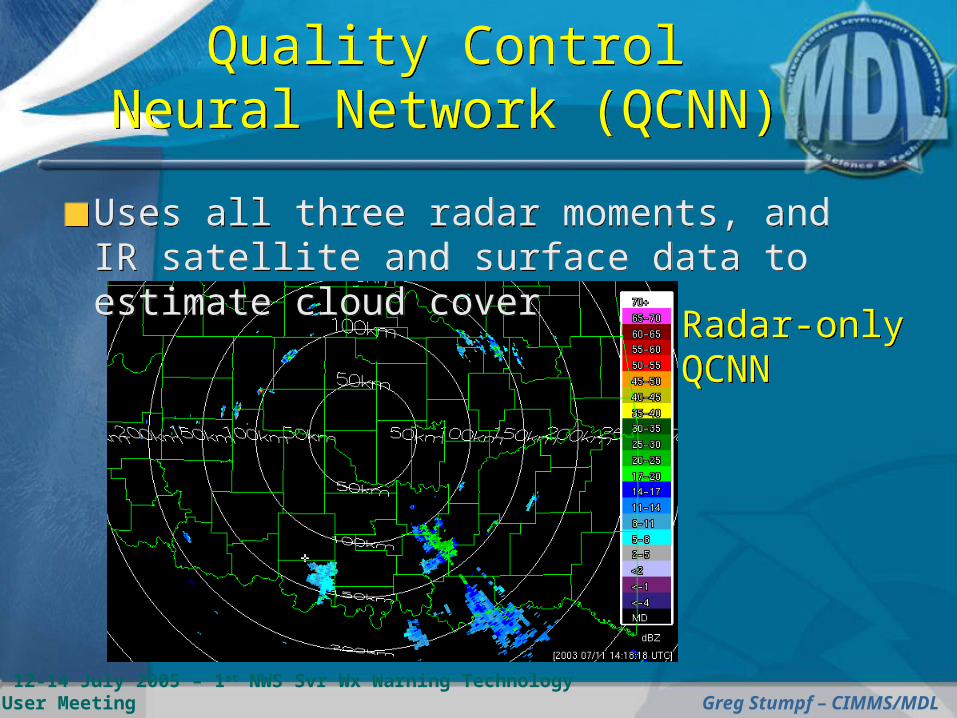
Uses all three radar moments, and IR satellite and surface data to estimate cloud cover
Uses all three radar moments, and IR satellite and surface data to estimate cloud cover
Radar-onlyQCNN Radar-onlyQCNN
Quality Control Neural Network (QCNN)
Quality Control Neural Network (QCNN)
12-14 July 2005 – 1st NWS Svr Wx Warning Technology User Meeting Greg Stumpf – CIMMS/MDL
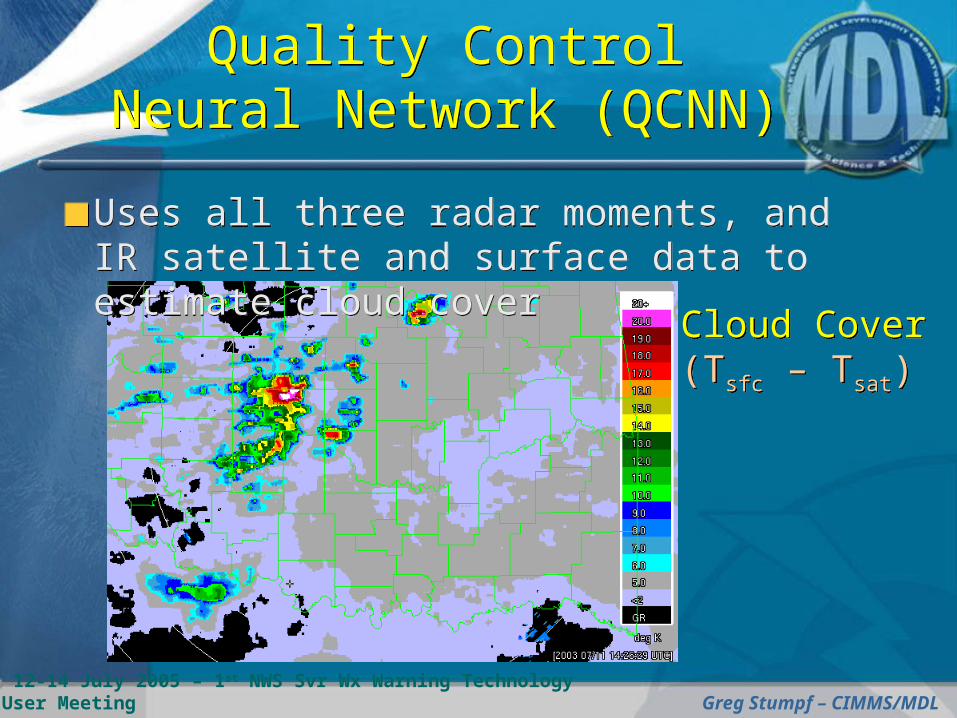
Uses all three radar moments, and IR satellite and surface data to estimate cloud cover
Uses all three radar moments, and IR satellite and surface data to estimate cloud cover
Cloud Cover(Tsfc – Tsat) Cloud Cover(Tsfc – Tsat)
Quality Control Neural Network (QCNN)
Quality Control Neural Network (QCNN)
12-14 July 2005 – 1st NWS Svr Wx Warning Technology User Meeting Greg Stumpf – CIMMS/MDL
Uses all three radar moments, and IR satellite and surface data to estimate cloud cover
Uses all three radar moments, and IR satellite and surface data to estimate cloud cover
Removed remainingNon-precip returns Removed remainingNon-precip returns
Kept precip cells Kept precip cells Multiple-sensorQCNN
Multiple-sensorQCNN
Quality Control Neural Network (QCNN)
Quality Control Neural Network (QCNN)
12-14 July 2005 – 1st NWS Svr Wx Warning Technology User Meeting Greg Stumpf – CIMMS/MDL
Original dBZ Original dBZ
Quality Control Neural Network (QCNN)
Quality Control Neural Network (QCNN)
12-14 July 2005 – 1st NWS Svr Wx Warning Technology User Meeting Greg Stumpf – CIMMS/MDL
Quality Control Neural Network (QCNN)Quality Control Neural Network (QCNN)
Quality Control Neural Network (QCNN)
Quality Control Neural Network (QCNN)
12-14 July 2005 – 1st NWS Svr Wx Warning Technology User Meeting Greg Stumpf – CIMMS/MDL
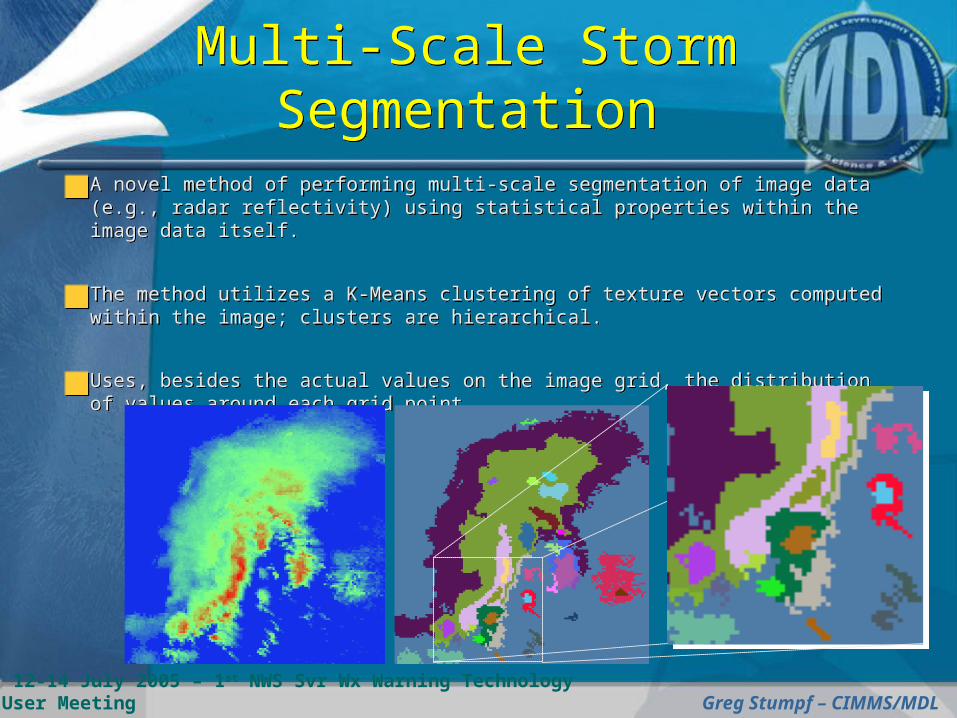
A novel method of performing multi-scale segmentation of image data (e.g., radar reflectivity) using statistical properties within the image data itself.
The method utilizes a K-Means clustering of texture vectors computed within the image; clusters are hierarchical.
Uses, besides the actual values on the image grid, the distribution of values around each grid point.
Multi-Scale Storm Segmentation
Multi-Scale Storm Segmentation
12-14 July 2005 – 1st NWS Svr Wx Warning Technology User Meeting Greg Stumpf – CIMMS/MDL
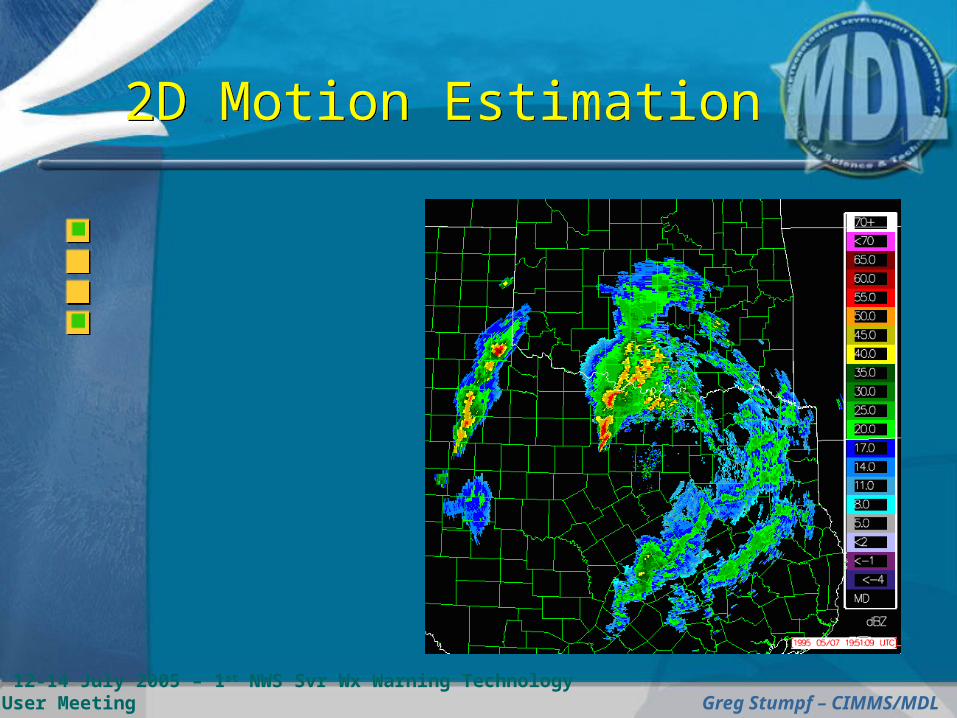
2D Motion Estimation2D Motion Estimation
12-14 July 2005 – 1st NWS Svr Wx Warning Technology User Meeting Greg Stumpf – CIMMS/MDL
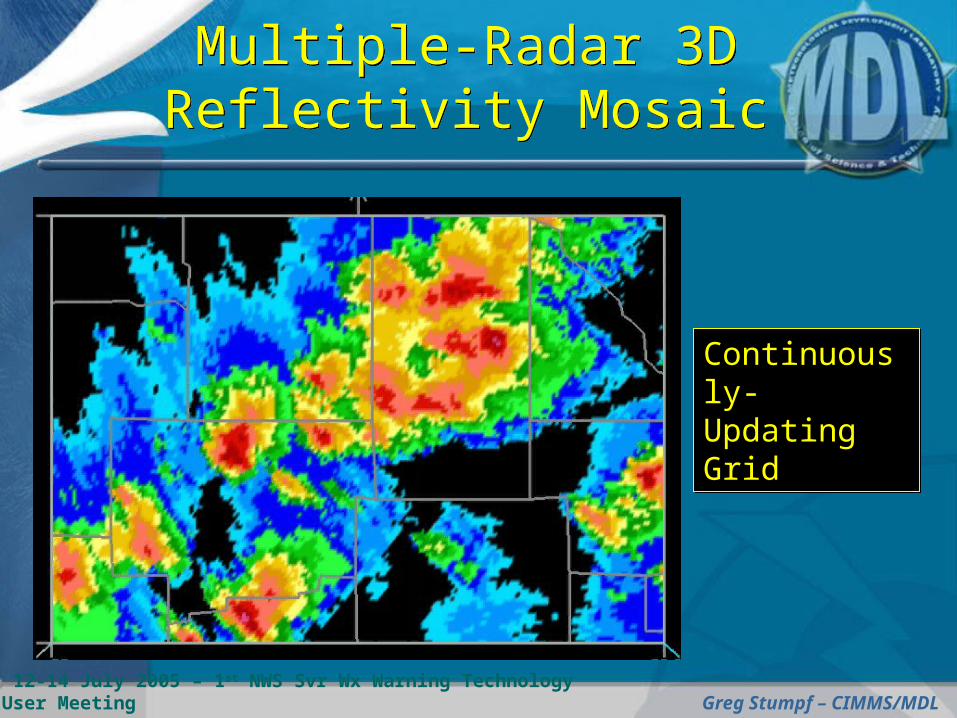
Multiple-Radar 3D Reflectivity MosaicMultiple-Radar 3D Reflectivity Mosaic
Continuously- Updating Grid
Continuously- Updating Grid
12-14 July 2005 – 1st NWS Svr Wx Warning Technology User Meeting Greg Stumpf – CIMMS/MDL
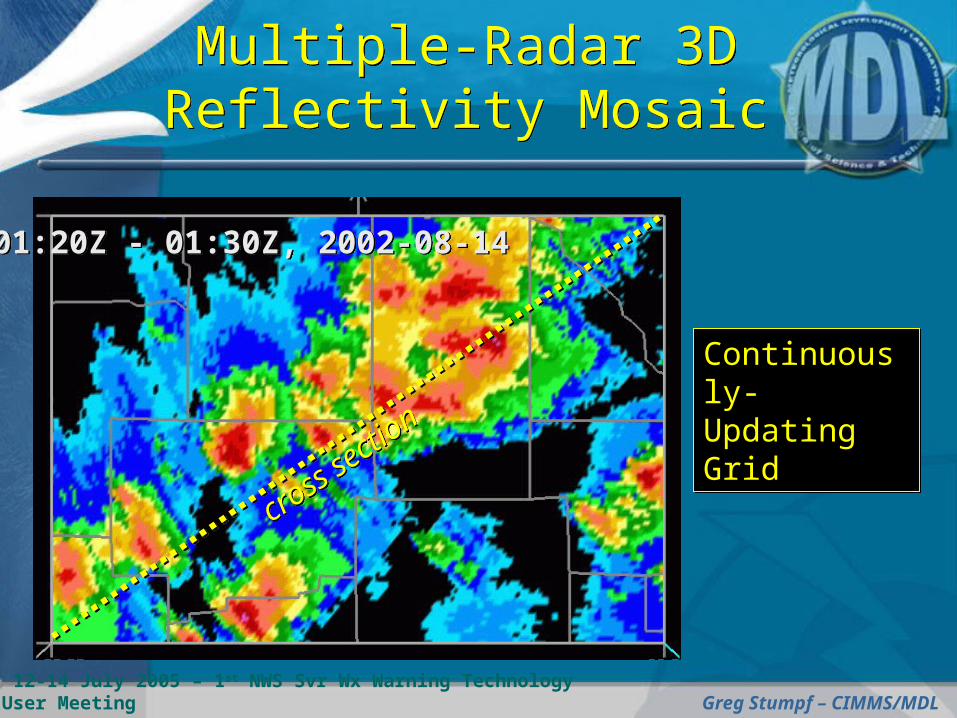
Multiple-Radar 3D Reflectivity MosaicMultiple-Radar 3D Reflectivity Mosaic
01:20Z - 01:30Z, 2002-08-14 01:20Z - 01:30Z, 2002-08-14
cross
secti
on
cross
secti
on
Continuously- Updating Grid
Continuously- Updating Grid
12-14 July 2005 – 1st NWS Svr Wx Warning Technology User Meeting Greg Stumpf – CIMMS/MDL
Multiple-Radar 3D Reflectivity MosaicMultiple-Radar 3D Reflectivity Mosaic
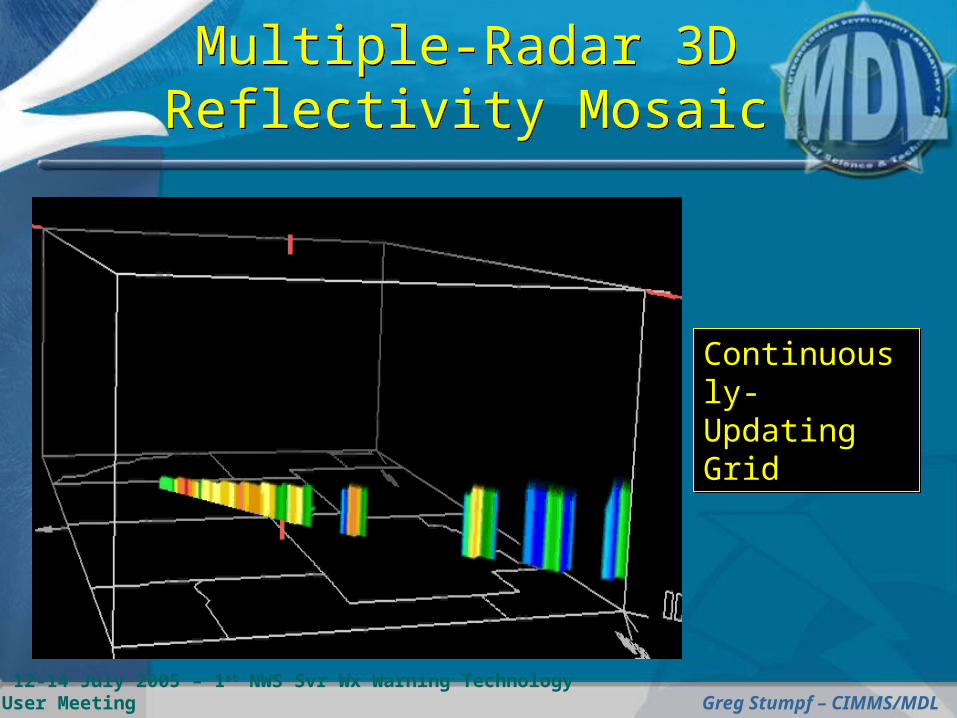
Continuously- Updating Grid
Continuously- Updating Grid
12-14 July 2005 – 1st NWS Svr Wx Warning Technology User Meeting Greg Stumpf – CIMMS/MDL
Multiple-Radar 3D Reflectivity MosaicMultiple-Radar 3D Reflectivity Mosaic
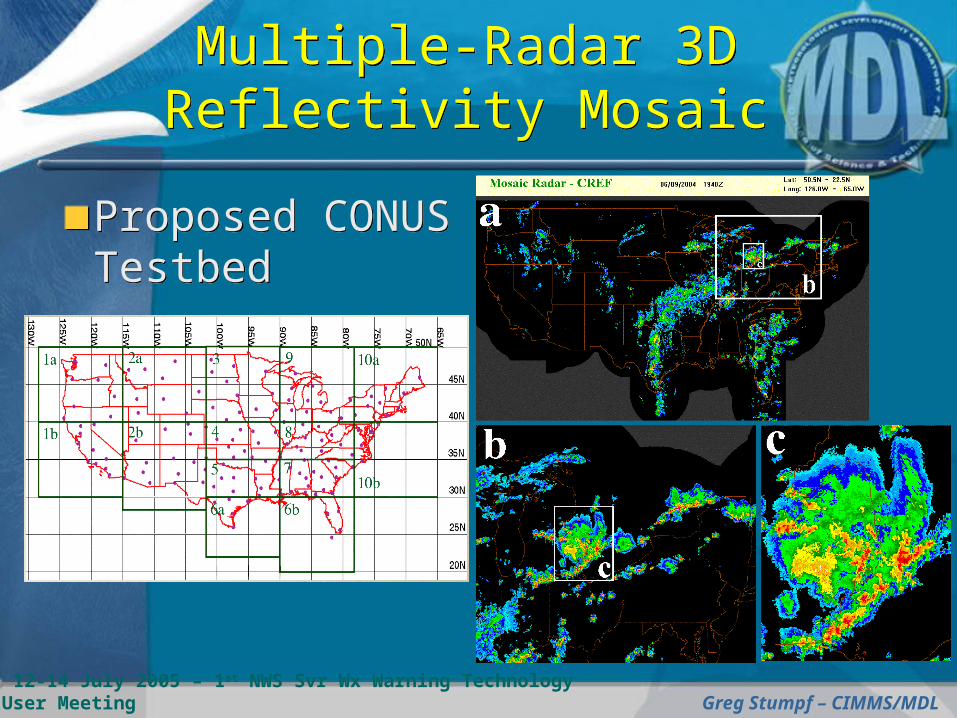
Proposed CONUS TestbedProposed CONUS Testbed
12-14 July 2005 – 1st NWS Svr Wx Warning Technology User Meeting Greg Stumpf – CIMMS/MDL
Multiple-Radar 3D Reflectivity MosaicMultiple-Radar 3D Reflectivity Mosaic
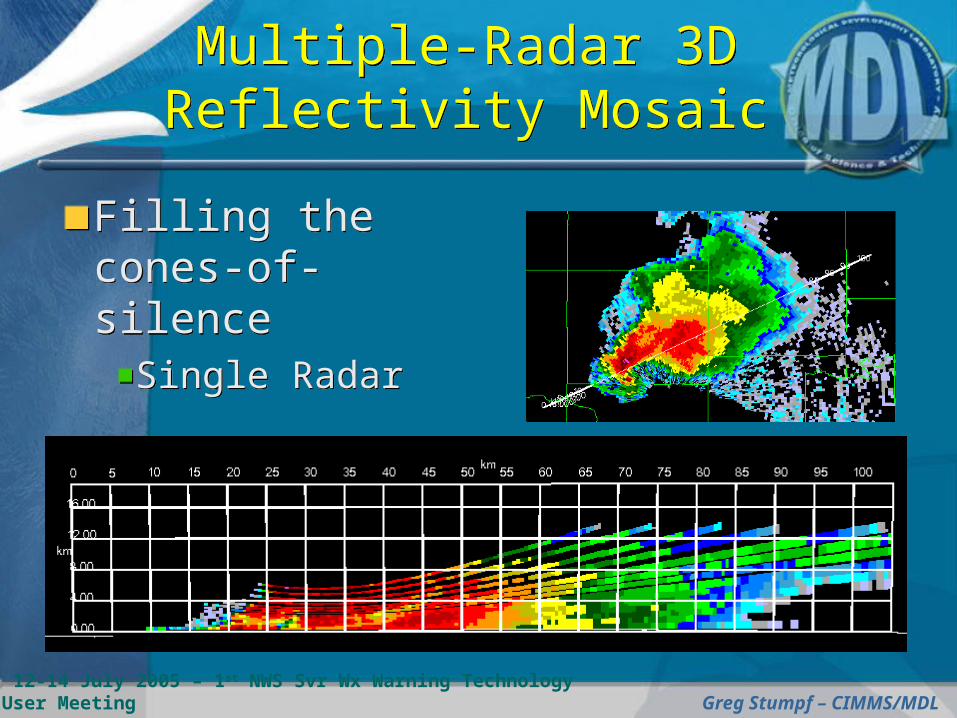
Filling the cones-of-silence
Single Radar
Filling the cones-of-silence
Single Radar
12-14 July 2005 – 1st NWS Svr Wx Warning Technology User Meeting Greg Stumpf – CIMMS/MDL
Multiple-Radar 3D Reflectivity MosaicMultiple-Radar 3D Reflectivity Mosaic
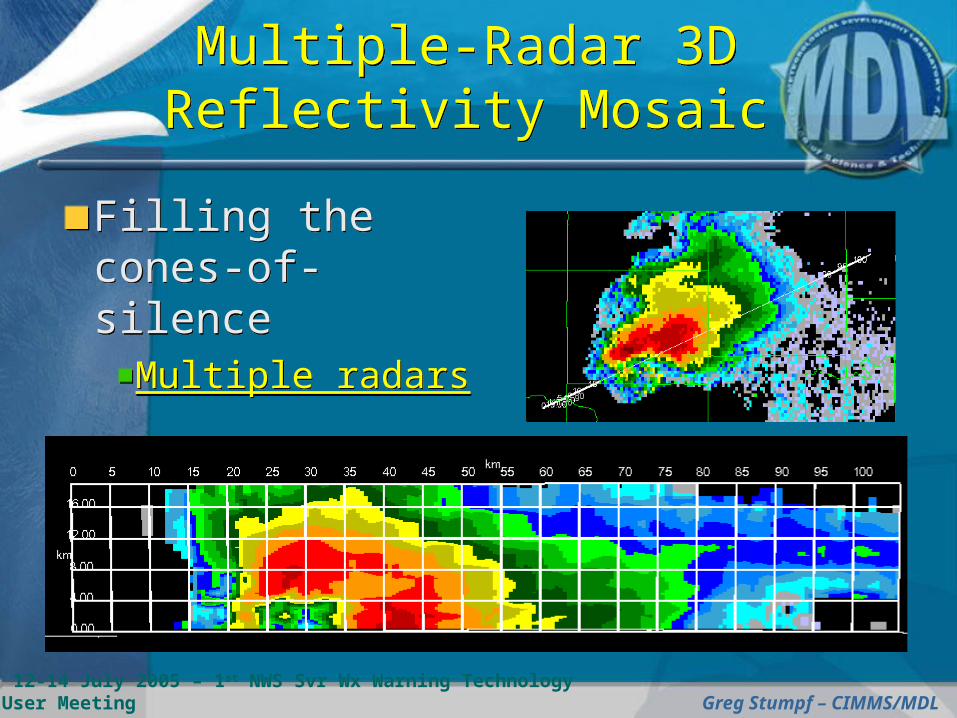
Filling the cones-of-silence
Multiple radars
Filling the cones-of-silence
Multiple radars
12-14 July 2005 – 1st NWS Svr Wx Warning Technology User Meeting Greg Stumpf – CIMMS/MDL
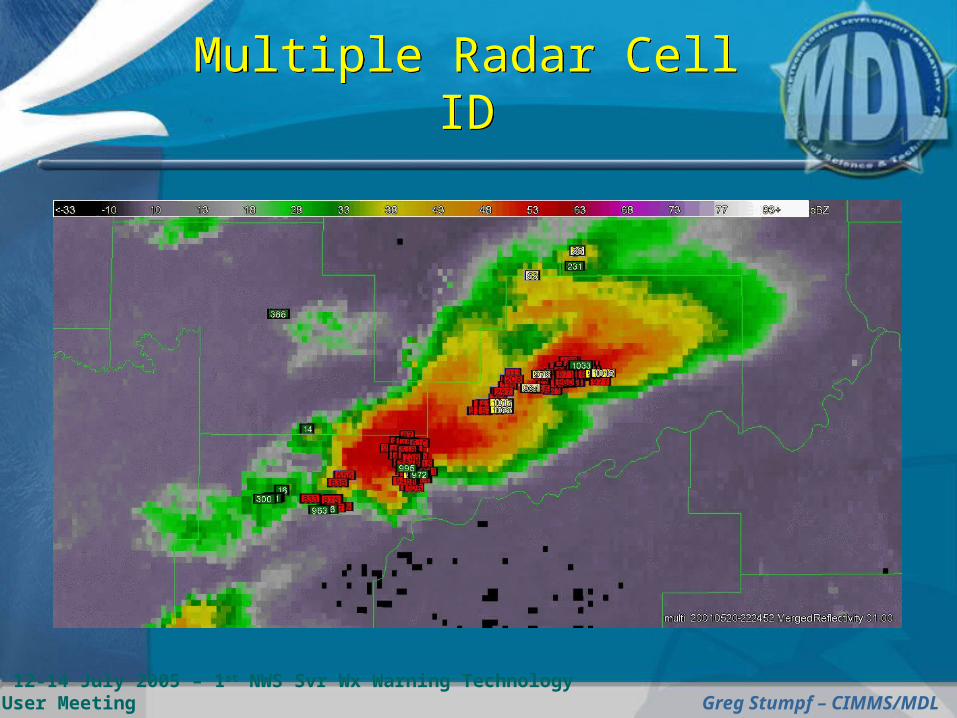
Multiple Radar Cell IDMultiple Radar Cell ID
12-14 July 2005 – 1st NWS Svr Wx Warning Technology User Meeting Greg Stumpf – CIMMS/MDL
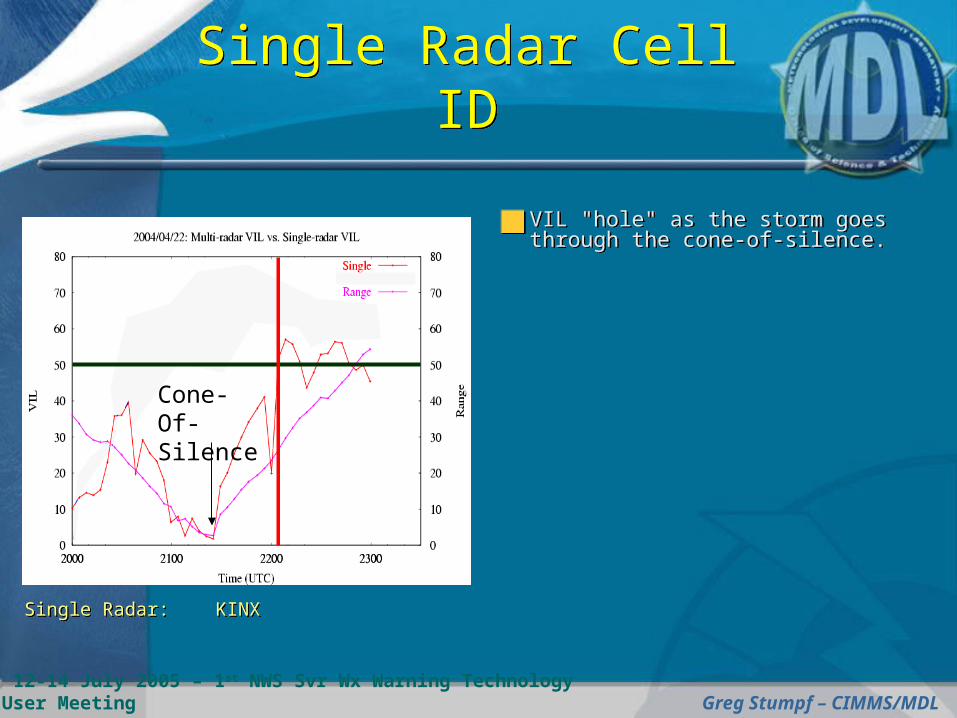
Single Radar Cell IDSingle Radar Cell ID
VIL "hole" as the storm goes through the cone-of-silence.VIL "hole" as the storm goes through the cone-of-silence.
Single Radar: KINXSingle Radar: KINX
Cone-Of-Silence
12-14 July 2005 – 1st NWS Svr Wx Warning Technology User Meeting Greg Stumpf – CIMMS/MDL
Multiple Radar Cell IDMultiple Radar Cell ID
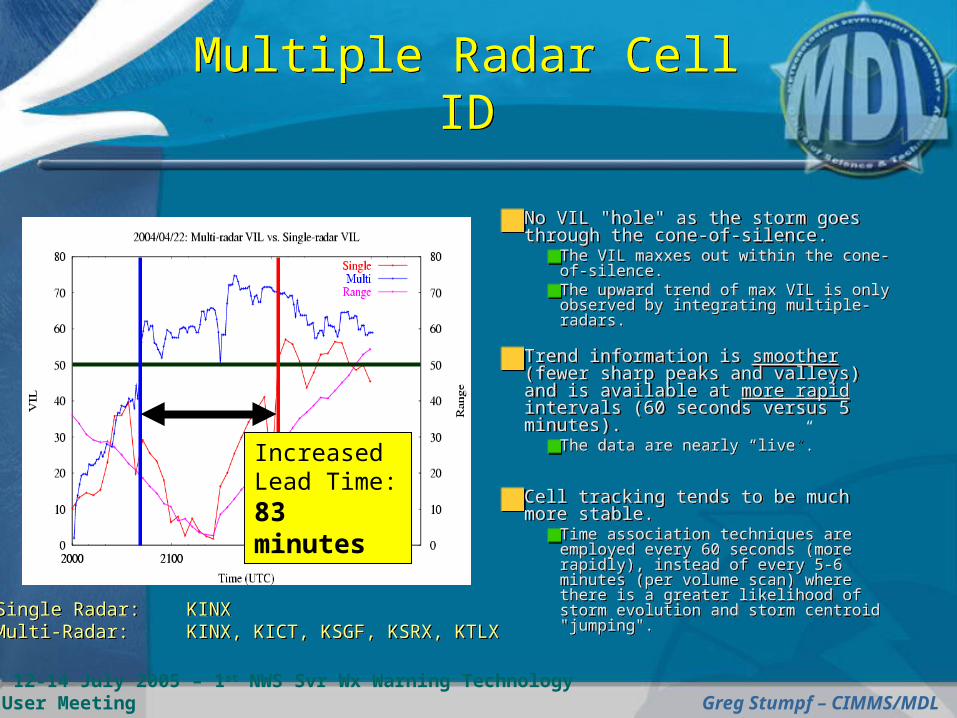
No VIL "hole" as the storm goes through the cone-of-silence.
The VIL maxxes out within the cone-of-silence.The upward trend of max VIL is only observed by integrating multiple-radars.
Trend information is smoother (fewer sharp peaks and valleys) and is available at more rapid intervals (60 seconds versus 5 minutes).
The data are nearly “live”.
Cell tracking tends to be much more stable.
Time association techniques are employed every 60 seconds (more rapidly), instead of every 5-6 minutes (per volume scan) where there is a greater likelihood of storm evolution and storm centroid "jumping".
Single Radar: KINXMulti-Radar: KINX, KICT, KSGF, KSRX, KTLX Single Radar: KINXMulti-Radar: KINX, KICT, KSGF, KSRX, KTLX
Increased Lead Time: 83 minutes
12-14 July 2005 – 1st NWS Svr Wx Warning Technology User Meeting Greg Stumpf – CIMMS/MDL
New Tools for Hail Diagnosis Using Conventional Radar
New Tools for Hail Diagnosis Using Conventional Radar
Taking the concept of cell-based HDA to a grid
Integrate multi-radar and NSE information
Provide intermediate products
Provide other “popular” hail-diagnosis products
Taking the concept of cell-based HDA to a grid
Integrate multi-radar and NSE information
Provide intermediate products
Provide other “popular” hail-diagnosis products
12-14 July 2005 – 1st NWS Svr Wx Warning Technology User Meeting Greg Stumpf – CIMMS/MDL
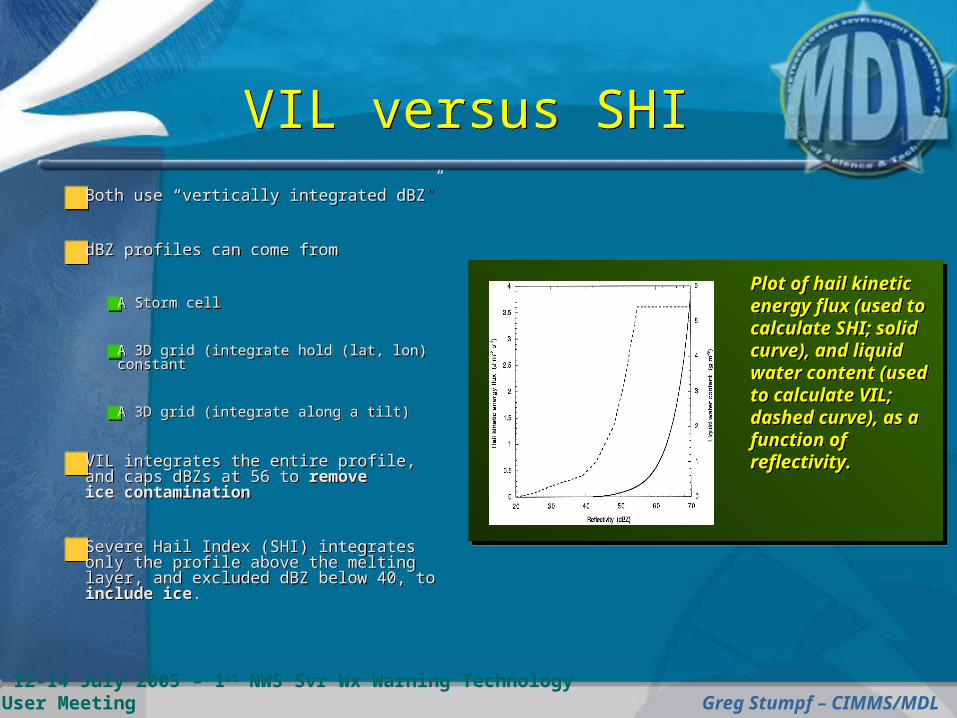
VIL versus SHIVIL versus SHIBoth use “vertically integrated dBZ”
dBZ profiles can come from
A Storm cell
A 3D grid (integrate hold (lat, lon) constant
A 3D grid (integrate along a tilt)
VIL integrates the entire profile, and caps dBZs at 56 to remove ice contamination
Severe Hail Index (SHI) integrates only the profile above the melting layer, and excluded dBZ below 40, to include ice.
Both use “vertically integrated dBZ”
dBZ profiles can come from
A Storm cell
A 3D grid (integrate hold (lat, lon) constant
A 3D grid (integrate along a tilt)
VIL integrates the entire profile, and caps dBZs at 56 to remove ice contamination
Severe Hail Index (SHI) integrates only the profile above the melting layer, and excluded dBZ below 40, to include ice.
Plot of hail kinetic energy flux (used to calculate SHI; solid curve), and liquid water content (used to calculate VIL; dashed curve), as a function of reflectivity.
Plot of hail kinetic energy flux (used to calculate SHI; solid curve), and liquid water content (used to calculate VIL; dashed curve), as a function of reflectivity.
12-14 July 2005 – 1st NWS Svr Wx Warning Technology User Meeting Greg Stumpf – CIMMS/MDL
Severe Hail Index (SHI)Severe Hail Index (SHI)
No reflectivities below 40 dBZ are used, all reflectivities above 50 dBZ are used, and reflectivities between 40 and 50 dBZ are linearly weighted from 0 to 1 (a proxy to the curve shown in Fig. 2).
Furthermore, only reflectivities (meeting the above criteria) above the melting layer are considered. Reflectivities between the 0C and -20C levels are weighted from 0 to 1, and all reflectivities (meeting the above criteria) above the -20C level are considered.
Temperature profile is made available from RUC 00h analysis grids.
Maximum Expected Size of Hail (MESH; inches) = 0.1 * (SHI)0.5
12-14 July 2005 – 1st NWS Svr Wx Warning Technology User Meeting Greg Stumpf – CIMMS/MDL
Cell versus GridCell versus Grid
dBZ profile from cell:
Pros: Follows max dBZ, inherent tilt
Cons: SCIT frequently misses detection of entire dBZ profile
dBZ profile from 3D grid:
Pros: There is always a complete dBZ profile, multiple-radar, motion estimation minimizes apparent tilt due to fast motion
Cons: Vertical integration may not capture storm tilt (BUT: we are working on this issue)
12-14 July 2005 – 1st NWS Svr Wx Warning Technology User Meeting Greg Stumpf – CIMMS/MDL
Tilted Storm CoresTilted Storm Cores
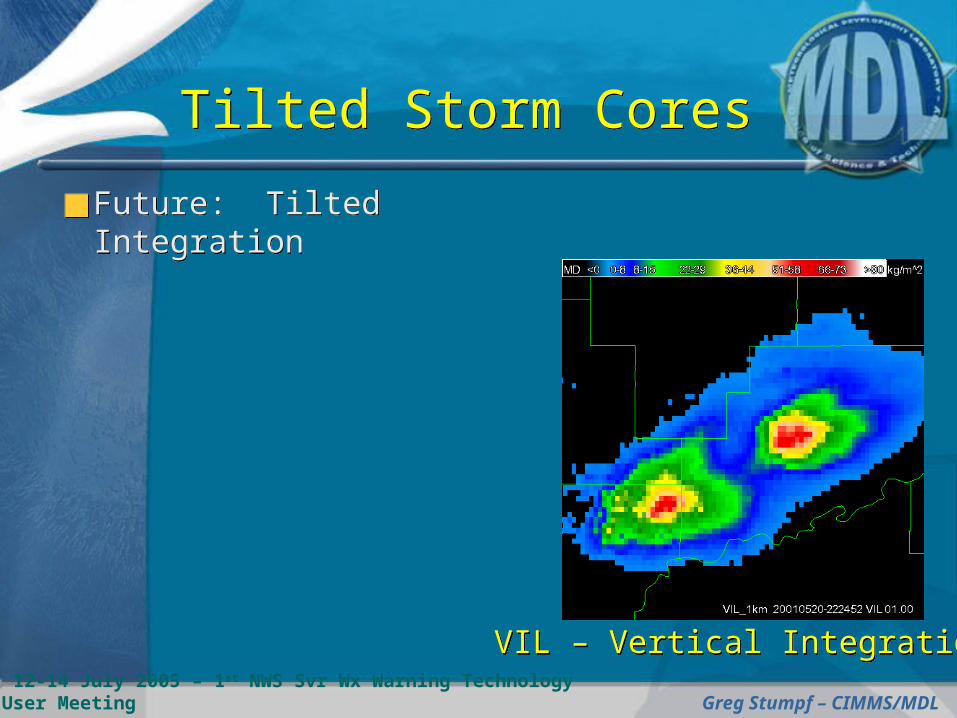
Future: Tilted IntegrationFuture: Tilted Integration
VIL – Vertical IntegrationVIL – Vertical Integration
12-14 July 2005 – 1st NWS Svr Wx Warning Technology User Meeting Greg Stumpf – CIMMS/MDL
Tilted Storm CoresTilted Storm Cores
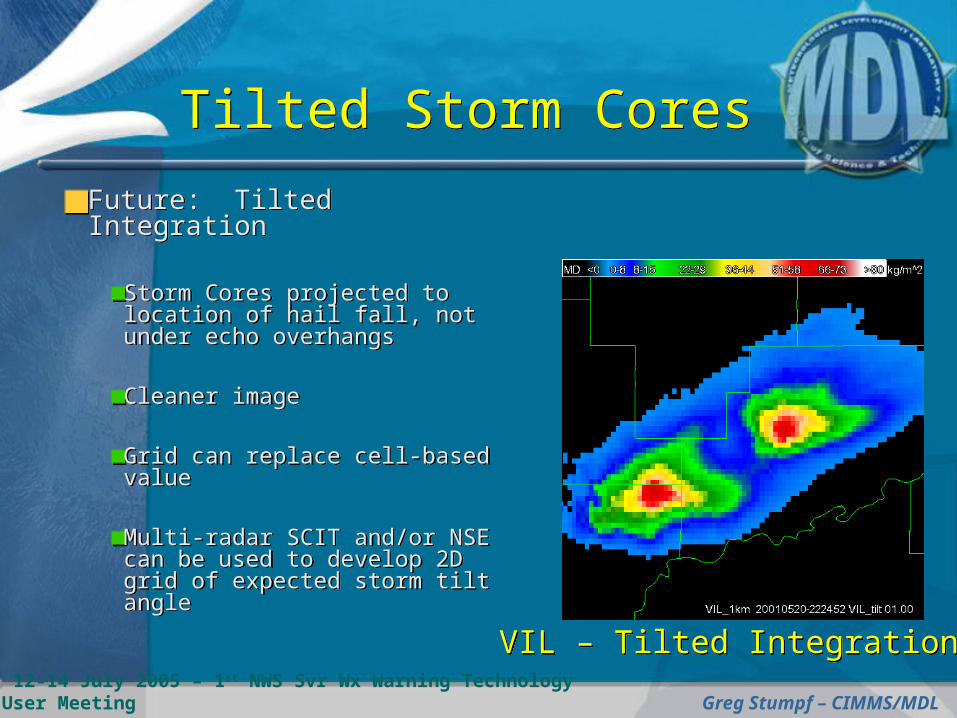
VIL – Tilted IntegrationVIL – Tilted Integration
Future: Tilted Integration
Storm Cores projected to location of hail fall, not under echo overhangs
Cleaner image
Grid can replace cell-based value
Multi-radar SCIT and/or NSE can be used to develop 2D grid of expected storm tilt angle
Future: Tilted Integration
Storm Cores projected to location of hail fall, not under echo overhangs
Cleaner image
Grid can replace cell-based value
Multi-radar SCIT and/or NSE can be used to develop 2D grid of expected storm tilt angle
12-14 July 2005 – 1st NWS Svr Wx Warning Technology User Meeting Greg Stumpf – CIMMS/MDL
Cell versus GridCell versus Grid
Cell-based VIL or SHI:
Only one value per volume scanAlways at end of volume scanSingle-radarNSE data is sparse, and must be manually-input
Multi-radar Grid based VIL or SHI:
Geospatial information: where in cell is largest hail falling?Can accumulate grid over time for hail swathsMuch easier for event verification (know where to make the probing calls).Storms are oversampled by multiple-radars, especially in cones-of-silenceOutput is essentially live (rapid update).
12-14 July 2005 – 1st NWS Svr Wx Warning Technology User Meeting Greg Stumpf – CIMMS/MDL
Intermediate and Popular products
Intermediate and Popular products
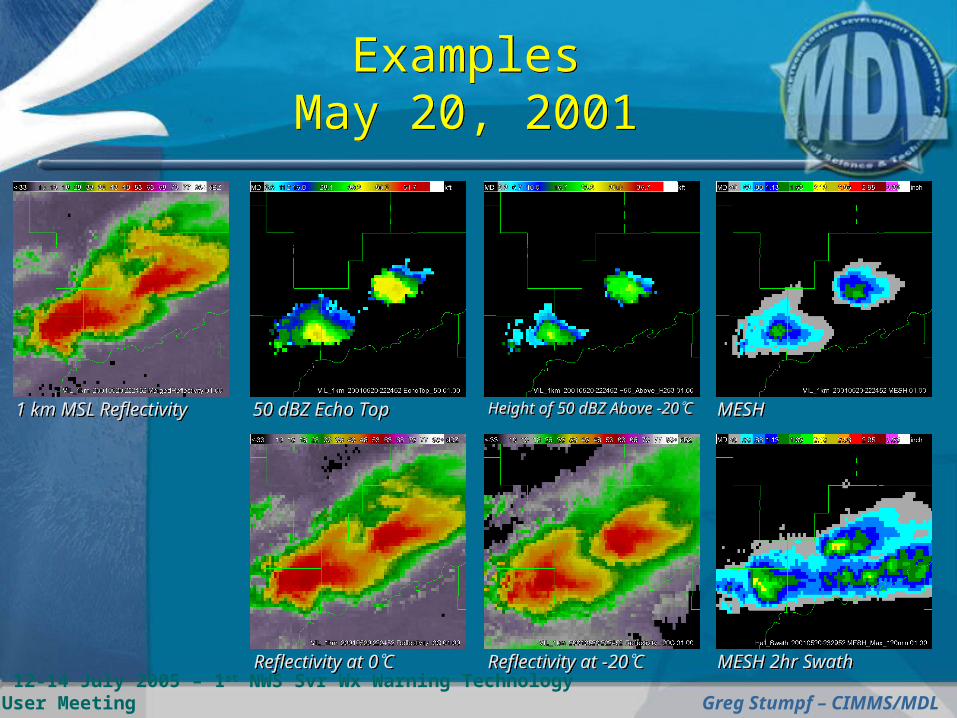
It’s nice to have the “final answer”, but what ingredients went into the gridded MESH?
dBZ relative to temperature altitudes Reflectivity at 0C, Reflectivity at -20C Height of 50 dBZ above -20C altitude
Echo tops of various dBZ thresholds 50 dBZ Echo Top
Eliminates the arduous task of using all-tilts and data sampling, as well as mental multi-radar and NSE integration, to determine these values for each and every storm at every time
What values correspond to what hail sizes? You tell us!
12-14 July 2005 – 1st NWS Svr Wx Warning Technology User Meeting Greg Stumpf – CIMMS/MDL
Rapidly-Updating Gridded Products from 3D MosaicRapidly-Updating Gridded Products from 3D Mosaic
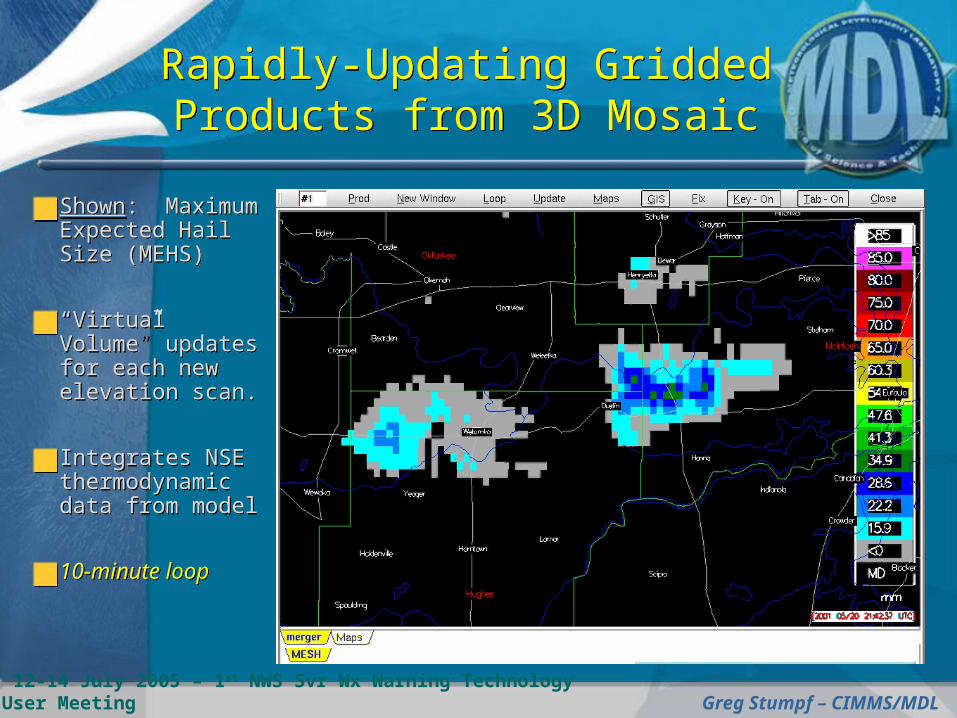
Shown: Maximum Expected Hail Size (MEHS)
“Virtual Volume” updates for each new elevation scan.
Integrates NSE thermodynamic data from model
10-minute loop
Shown: Maximum Expected Hail Size (MEHS)
“Virtual Volume” updates for each new elevation scan.
Integrates NSE thermodynamic data from model
10-minute loop
12-14 July 2005 – 1st NWS Svr Wx Warning Technology User Meeting Greg Stumpf – CIMMS/MDL
Gridded Hail Products integrated with NSE data
Gridded Hail Products integrated with NSE data
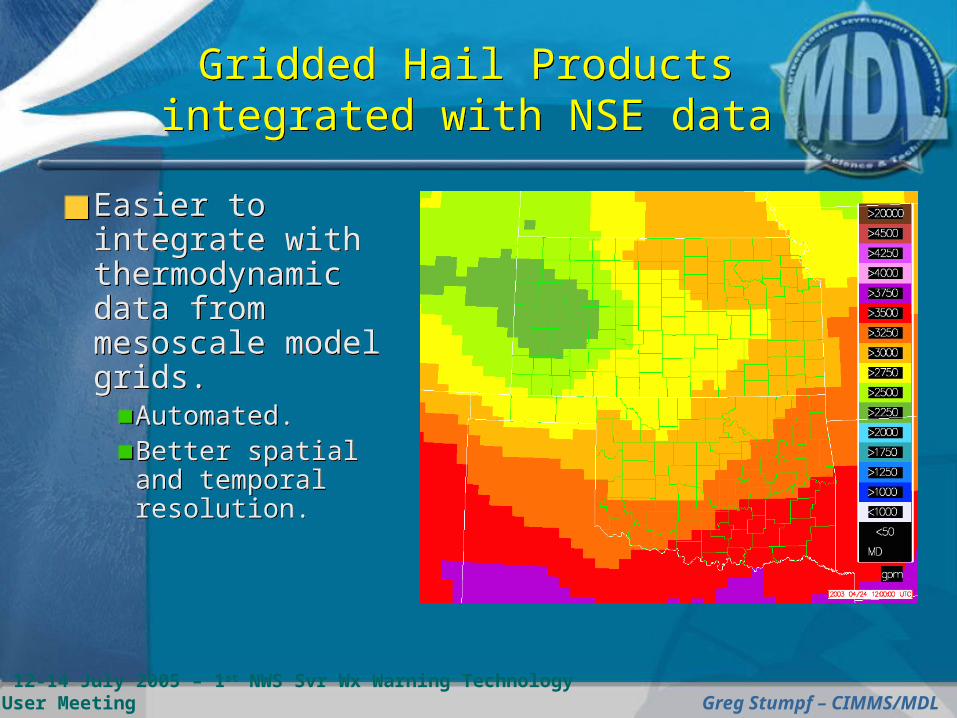
Easier to integrate with thermodynamic data from mesoscale model grids.
Automated.Better spatial and temporal resolution.
Easier to integrate with thermodynamic data from mesoscale model grids.
Automated.Better spatial and temporal resolution.
12-14 July 2005 – 1st NWS Svr Wx Warning Technology User Meeting Greg Stumpf – CIMMS/MDL
ExamplesMay 20, 2001
ExamplesMay 20, 2001
50 dBZ Echo Top50 dBZ Echo Top Height of 50 dBZ Above -20CHeight of 50 dBZ Above -20C MESHMESH
MESH 2hr SwathMESH 2hr SwathReflectivity at -20CReflectivity at -20C
1 km MSL Reflectivity1 km MSL Reflectivity
Reflectivity at 0CReflectivity at 0C
12-14 July 2005 – 1st NWS Svr Wx Warning Technology User Meeting Greg Stumpf – CIMMS/MDL
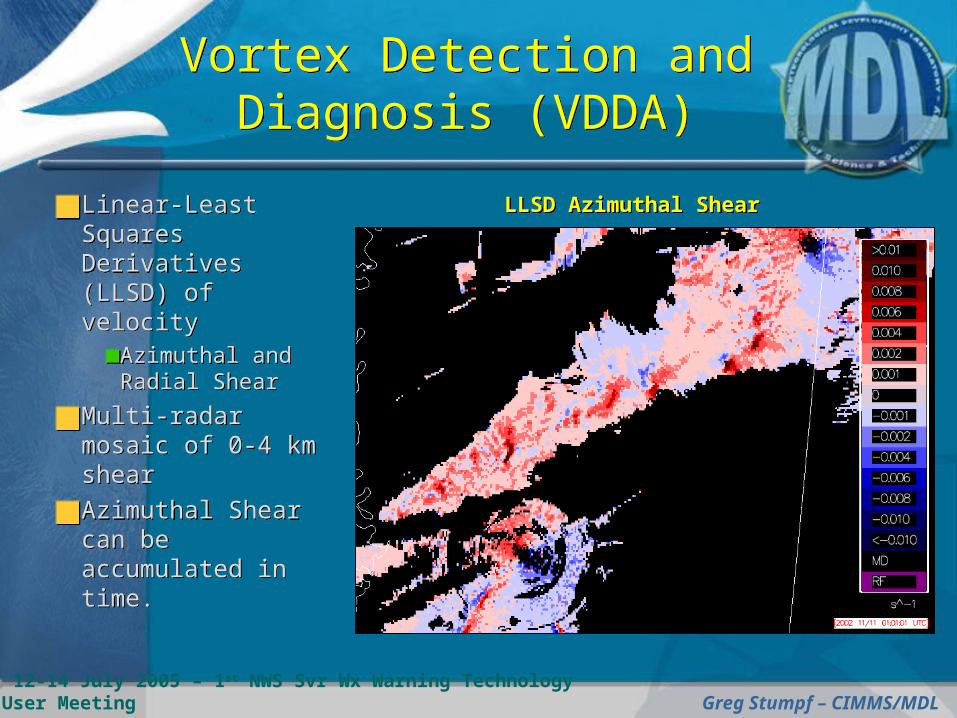
Vortex Detection and Diagnosis (VDDA)
Vortex Detection and Diagnosis (VDDA)
Linear-Least Squares Derivatives (LLSD) of velocity
Azimuthal and Radial Shear
Multi-radar mosaic of 0-4 km shearAzimuthal Shear can be accumulated in time.
Linear-Least Squares Derivatives (LLSD) of velocity
Azimuthal and Radial Shear
Multi-radar mosaic of 0-4 km shearAzimuthal Shear can be accumulated in time.
LLSD Azimuthal ShearLLSD Azimuthal Shear
12-14 July 2005 – 1st NWS Svr Wx Warning Technology User Meeting Greg Stumpf – CIMMS/MDL
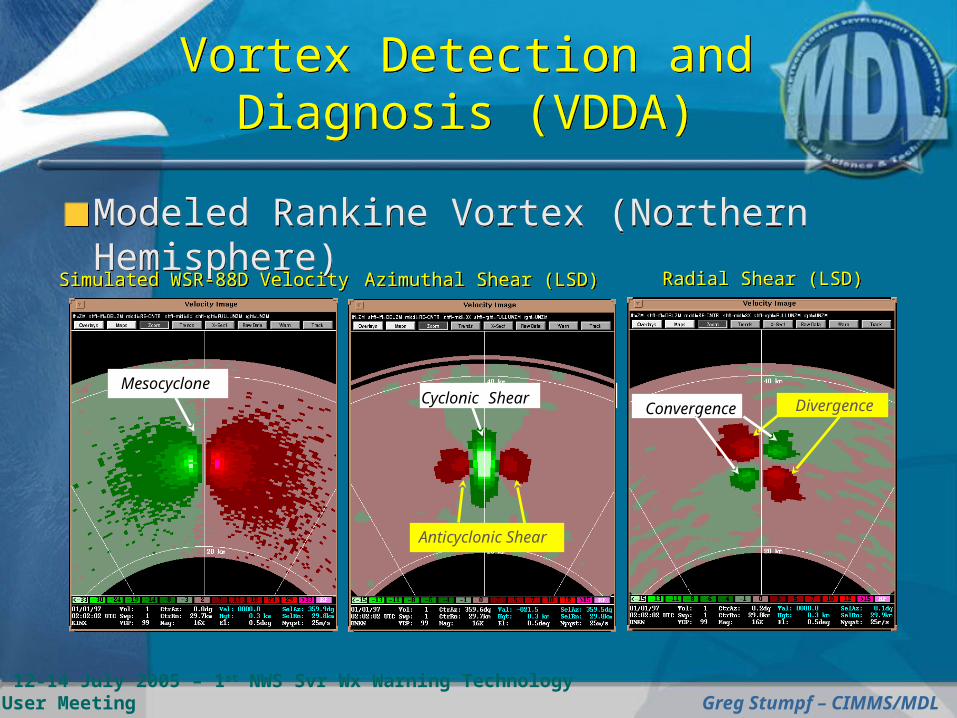
Modeled Rankine Vortex (Northern Hemisphere)Modeled Rankine Vortex (Northern Hemisphere)
Vortex Detection and Diagnosis (VDDA)
Vortex Detection and Diagnosis (VDDA)
Mesocyclone
Simulated WSR-88D VelocitySimulated WSR-88D Velocity Azimuthal Shear (LSD)Azimuthal Shear (LSD)
Cyclonic Shear
Anticyclonic Shear
Radial Shear (LSD)Radial Shear (LSD)
Convergence Divergence
12-14 July 2005 – 1st NWS Svr Wx Warning Technology User Meeting Greg Stumpf – CIMMS/MDL
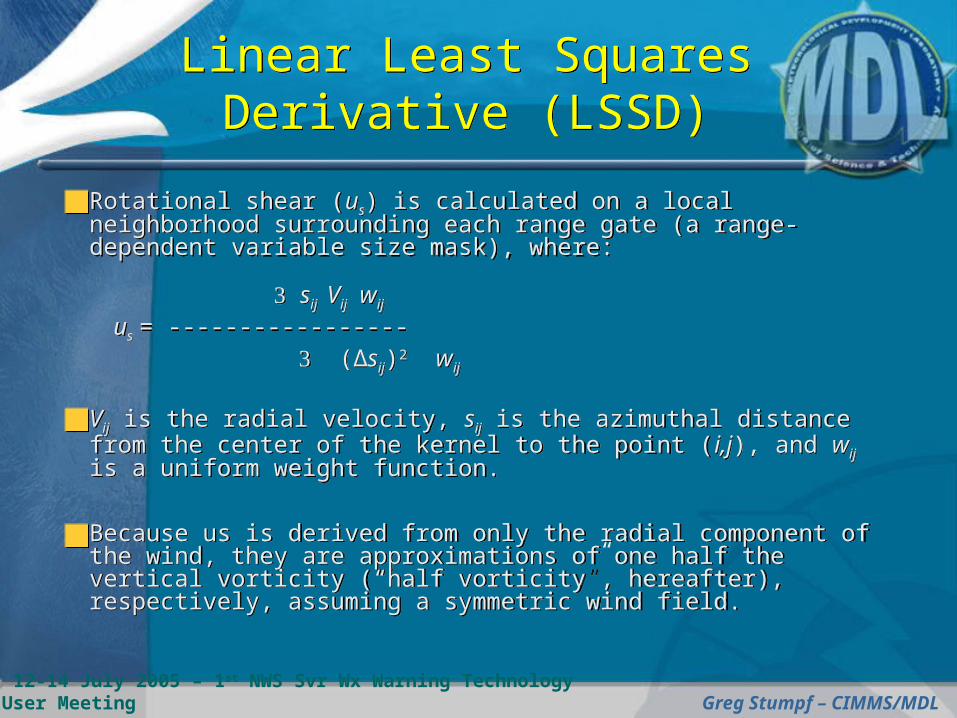
Linear Least Squares Derivative (LSSD)
Linear Least Squares Derivative (LSSD)
Rotational shear (us) is calculated on a local neighborhood surrounding each range gate (a range-dependent variable size mask), where:
sij Vij wij
us = ----------------- (Δsij)2 wij
Vij is the radial velocity, sij is the azimuthal distance from the center of the kernel to the point (i,j), and wij is a uniform weight function.
Because us is derived from only the radial component of the wind, they are approximations of one half the vertical vorticity (“half vorticity”, hereafter), respectively, assuming a symmetric wind field.
12-14 July 2005 – 1st NWS Svr Wx Warning Technology User Meeting Greg Stumpf – CIMMS/MDL
Multiple Radar Azimuthal ShearMultiple Radar
Azimuthal Shear
First, QCNN is run to id only precipitation echoes, “stamp” those out of the velocity field, and then the resulting field is dilated to include a small clear air buffer around storms.
Azimuthal shear is calculated for each single radar (since it is radar coordinate-system specific) for every sample volume in the 0-3 km MSL layer.
In addition, the 0.5 degree tilt is always used, regardless if it has an altitude above 3 km MSL.
The maximum value in the vertical column in this layer is projected to a 2D polar grid.
Using the same merging techniques as the dBZ data (but for a 2D grid) the azimuthal shear single radar grids are combined into a multi-radar grid.
The maximum positive azimuthal (cyclonic) shear over a 6 hour period is plotted to produce “Rotation Tracks”.
12-14 July 2005 – 1st NWS Svr Wx Warning Technology User Meeting Greg Stumpf – CIMMS/MDL
Vortex Detection and Diagnosis (VDDA)
Vortex Detection and Diagnosis (VDDA)
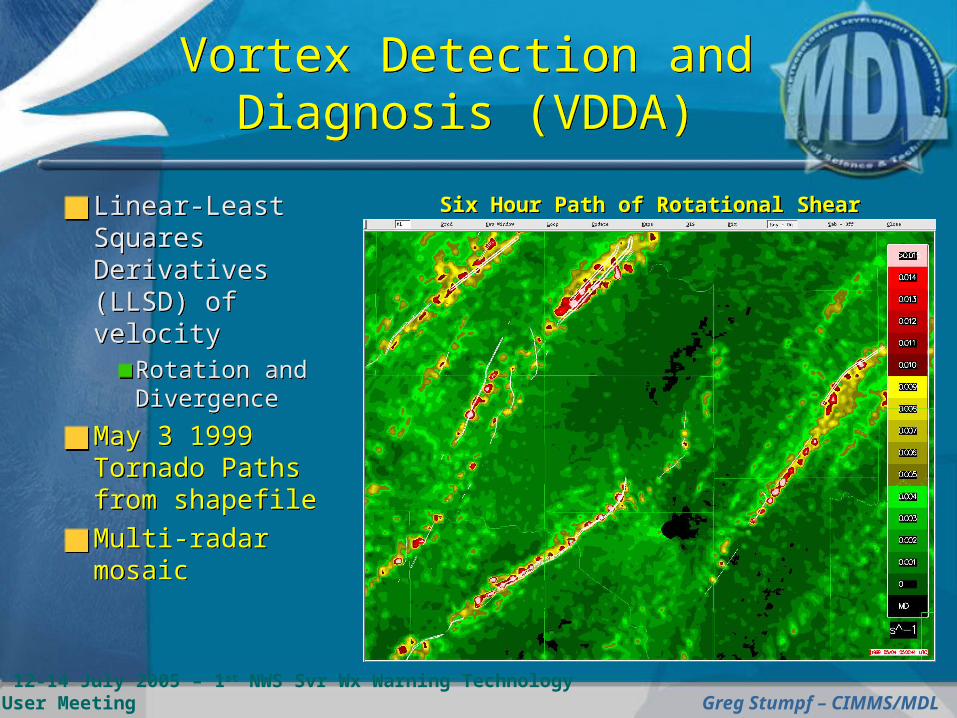
Six Hour Path of Rotational ShearSix Hour Path of Rotational ShearLinear-Least Squares Derivatives (LLSD) of velocity
Rotation and Divergence
May 3 1999 Tornado Paths from shapefileMulti-radar mosaic
Linear-Least Squares Derivatives (LLSD) of velocity
Rotation and Divergence
May 3 1999 Tornado Paths from shapefileMulti-radar mosaic
12-14 July 2005 – 1st NWS Svr Wx Warning Technology User Meeting Greg Stumpf – CIMMS/MDL
Rotation Track Usefulness
Rotation Track Usefulness
Real-time:
A simple diagnostic of the radial velocity data
Provides, in one image, information about the past locations and the past trend of intensity.
Doesn’t suffer from centroid matching failures (in 3D and 4D), threshold failures, etc, as does the MDA and TDA
Post-event:
Very useful for verification – first guess at where strongest rotation tracked – send survey teams there.
Eliminates need to manually replay radar data and track the mesos.
12-14 July 2005 – 1st NWS Svr Wx Warning Technology User Meeting Greg Stumpf – CIMMS/MDL
Vortex Detection and Diagnosis (VDDA)
Vortex Detection and Diagnosis (VDDA)
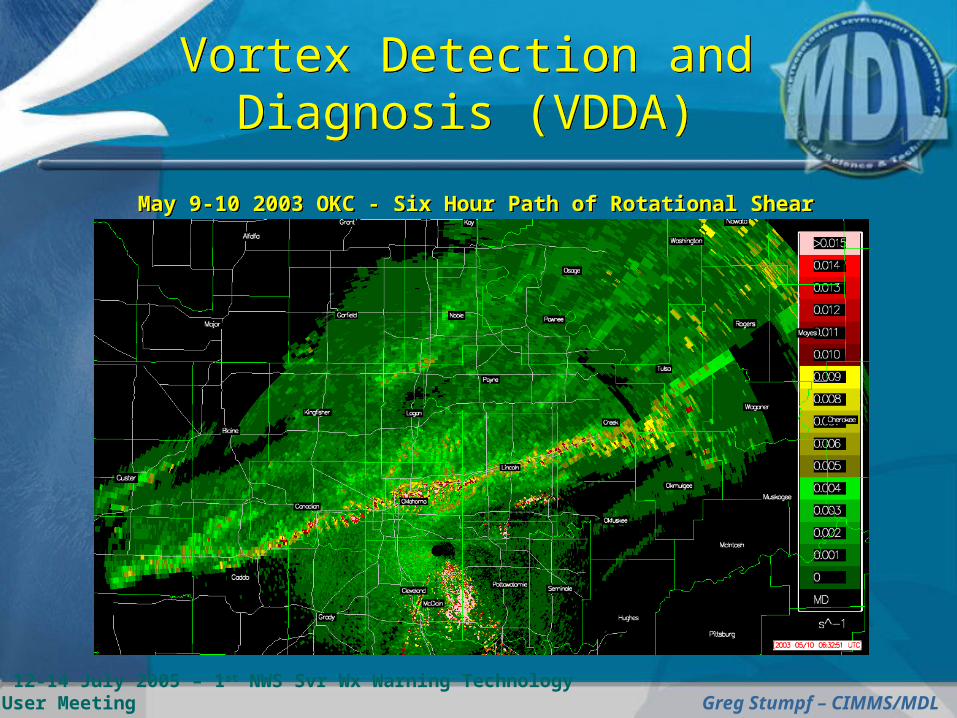
May 9-10 2003 OKC - Six Hour Path of Rotational ShearMay 9-10 2003 OKC - Six Hour Path of Rotational Shear
12-14 July 2005 – 1st NWS Svr Wx Warning Technology User Meeting Greg Stumpf – CIMMS/MDL
Multiple-sensorCG Lightning Prediction
Multiple-sensorCG Lightning Prediction
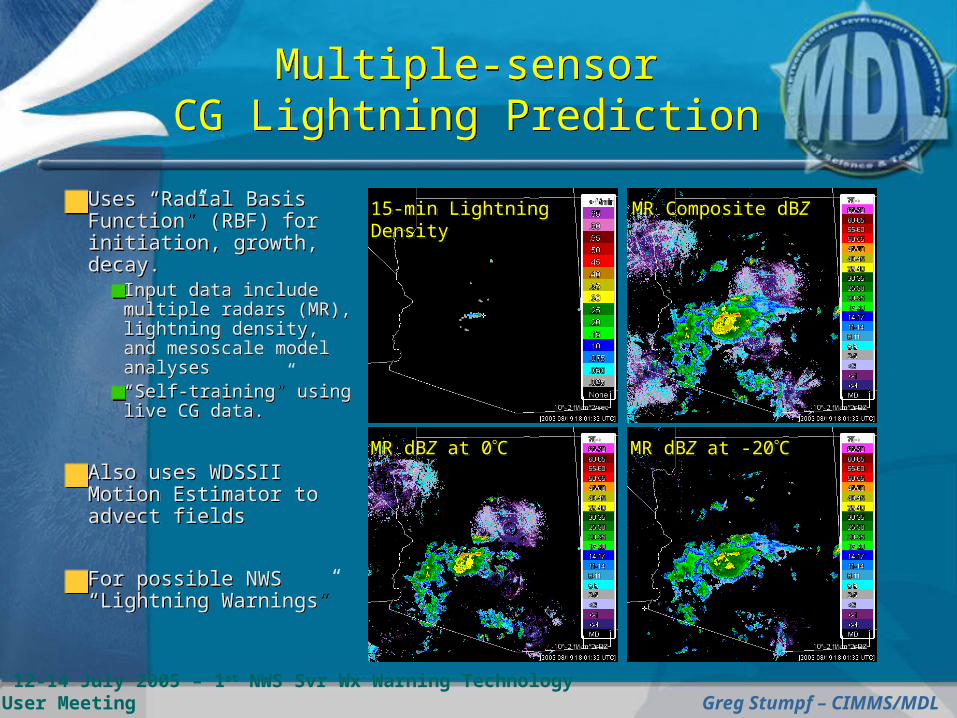
Uses “Radial Basis Function” (RBF) for initiation, growth, decay.
Input data include multiple radars (MR), lightning density, and mesoscale model analyses“Self-training” using live CG data.
Also uses WDSSII Motion Estimator to advect fields
For possible NWS “Lightning Warnings”
Uses “Radial Basis Function” (RBF) for initiation, growth, decay.
Input data include multiple radars (MR), lightning density, and mesoscale model analyses“Self-training” using live CG data.
Also uses WDSSII Motion Estimator to advect fields
For possible NWS “Lightning Warnings”
MR Composite dBZMR Composite dBZ15-min Lightning Density15-min Lightning Density
MR dBZ at -20CMR dBZ at -20CMR dBZ at 0CMR dBZ at 0C
12-14 July 2005 – 1st NWS Svr Wx Warning Technology User Meeting Greg Stumpf – CIMMS/MDL
Summary of WDSSII AWIPS Products
Summary of WDSSII AWIPS Products
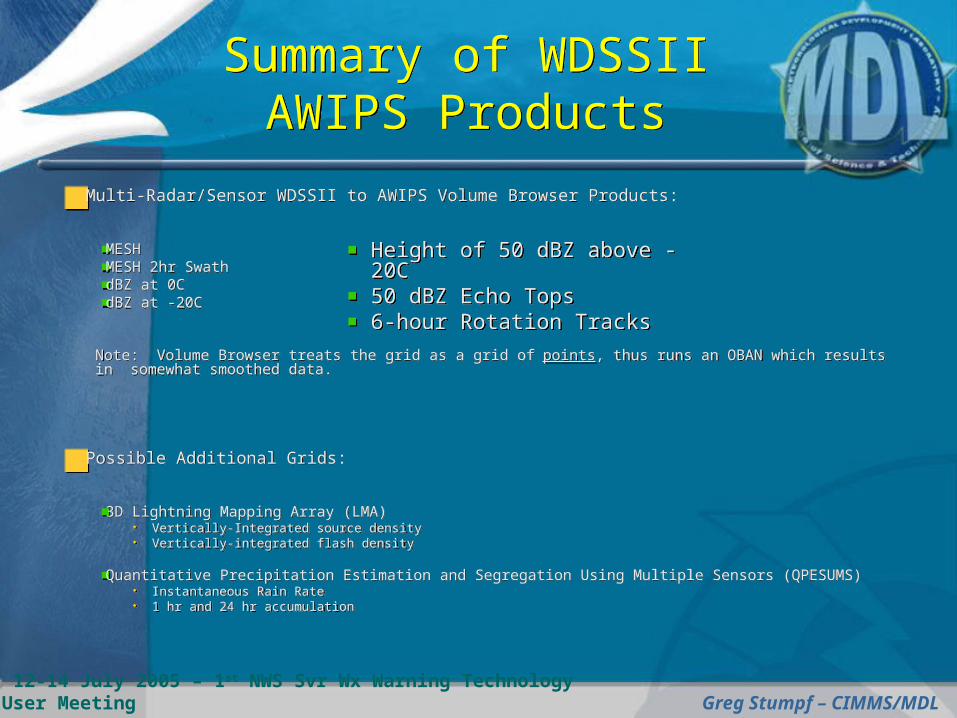
Multi-Radar/Sensor WDSSII to AWIPS Volume Browser Products:
MESHMESH 2hr SwathdBZ at 0CdBZ at -20C
Note: Volume Browser treats the grid as a grid of points, thus runs an OBAN which results in somewhat smoothed data.
Possible Additional Grids:
3D Lightning Mapping Array (LMA) Vertically-Integrated source density Vertically-integrated flash density
Quantitative Precipitation Estimation and Segregation Using Multiple Sensors (QPESUMS) Instantaneous Rain Rate 1 hr and 24 hr accumulation
Height of 50 dBZ above -20C50 dBZ Echo Tops6-hour Rotation Tracks
Height of 50 dBZ above -20C50 dBZ Echo Tops6-hour Rotation Tracks
12-14 July 2005 – 1st NWS Svr Wx Warning Technology User Meeting Greg Stumpf – CIMMS/MDL
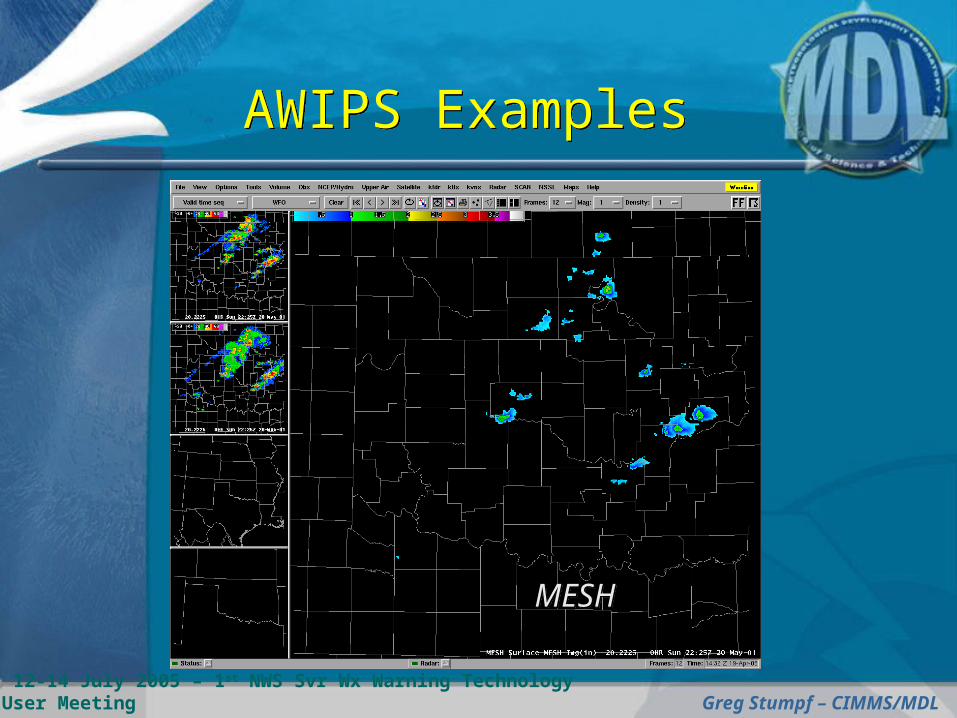
AWIPS ExamplesAWIPS Examples
MESHMESH
12-14 July 2005 – 1st NWS Svr Wx Warning Technology User Meeting Greg Stumpf – CIMMS/MDL
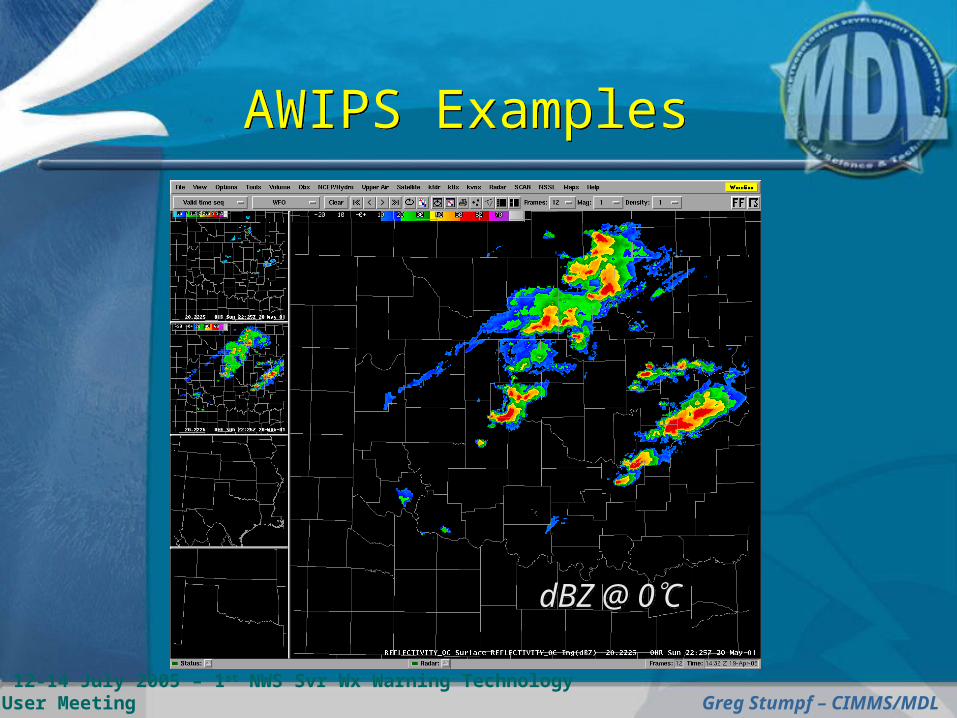
AWIPS ExamplesAWIPS Examples
dBZ @ 0CdBZ @ 0C
12-14 July 2005 – 1st NWS Svr Wx Warning Technology User Meeting Greg Stumpf – CIMMS/MDL
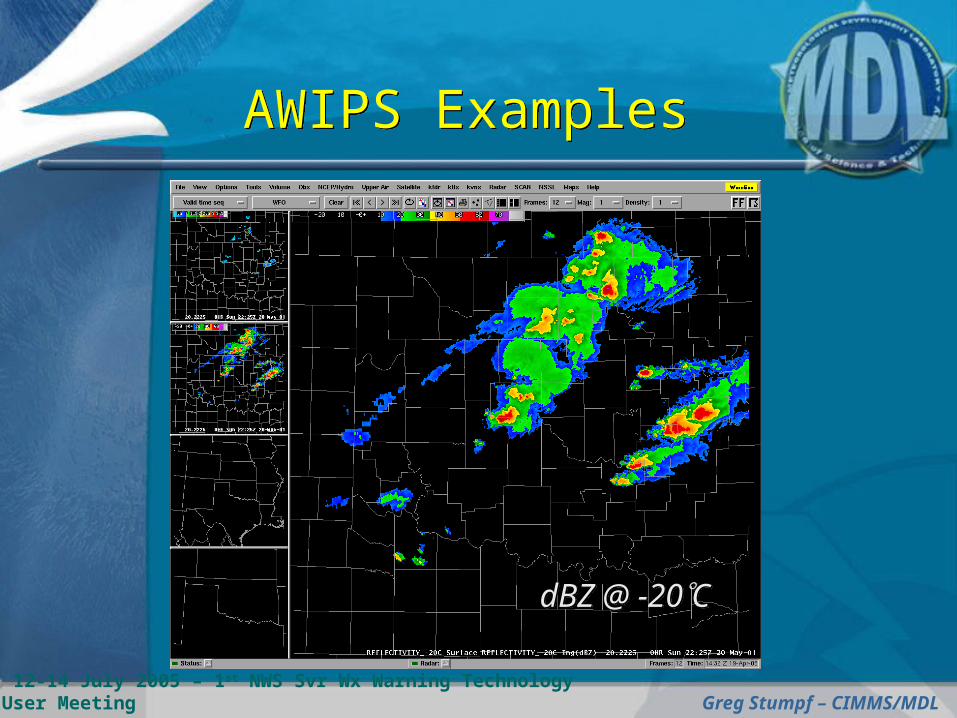
AWIPS ExamplesAWIPS Examples
dBZ @ -20CdBZ @ -20C
12-14 July 2005 – 1st NWS Svr Wx Warning Technology User Meeting Greg Stumpf – CIMMS/MDL
Experimental Warning Application Testbeds
Experimental Warning Application Testbeds
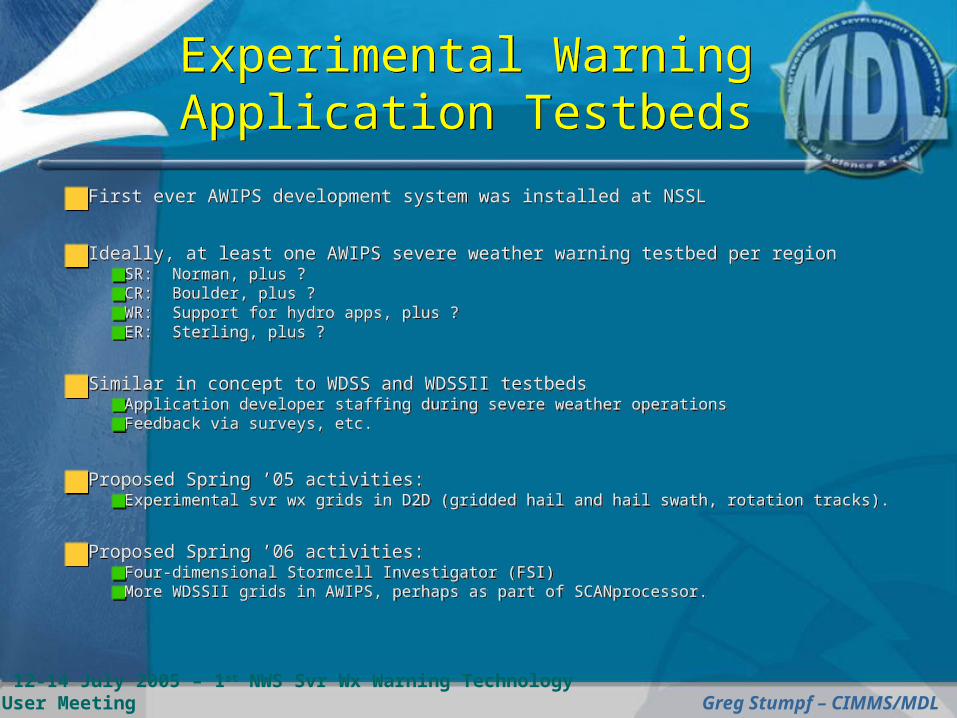
First ever AWIPS development system was installed at NSSL
Ideally, at least one AWIPS severe weather warning testbed per regionSR: Norman, plus ?CR: Boulder, plus ?WR: Support for hydro apps, plus ?ER: Sterling, plus ?
Similar in concept to WDSS and WDSSII testbedsApplication developer staffing during severe weather operationsFeedback via surveys, etc.
Proposed Spring ’05 activities:Experimental svr wx grids in D2D (gridded hail and hail swath, rotation tracks).
Proposed Spring ’06 activities:Four-dimensional Stormcell Investigator (FSI)More WDSSII grids in AWIPS, perhaps as part of SCANprocessor.
12-14 July 2005 – 1st NWS Svr Wx Warning Technology User Meeting Greg Stumpf – CIMMS/MDL
The WATADS replacement!
Linux OS
Available for FTP download at http://www.wdssii.org
A large number of new experimental multi-sensor warning applicationsCan run archive cases with Level-II data, from single or multiple radars, and with other sensor data (e.g., RUC20)
Innovative 4D display tool for intermediate and final application output and case analysis (the WDSSII GUI, or “wg”)
API support for multi-sensor severe weather and flash flood application development
“Peer-to-peer” support via an electronic forum: http://forum.nssl.noaa.gov
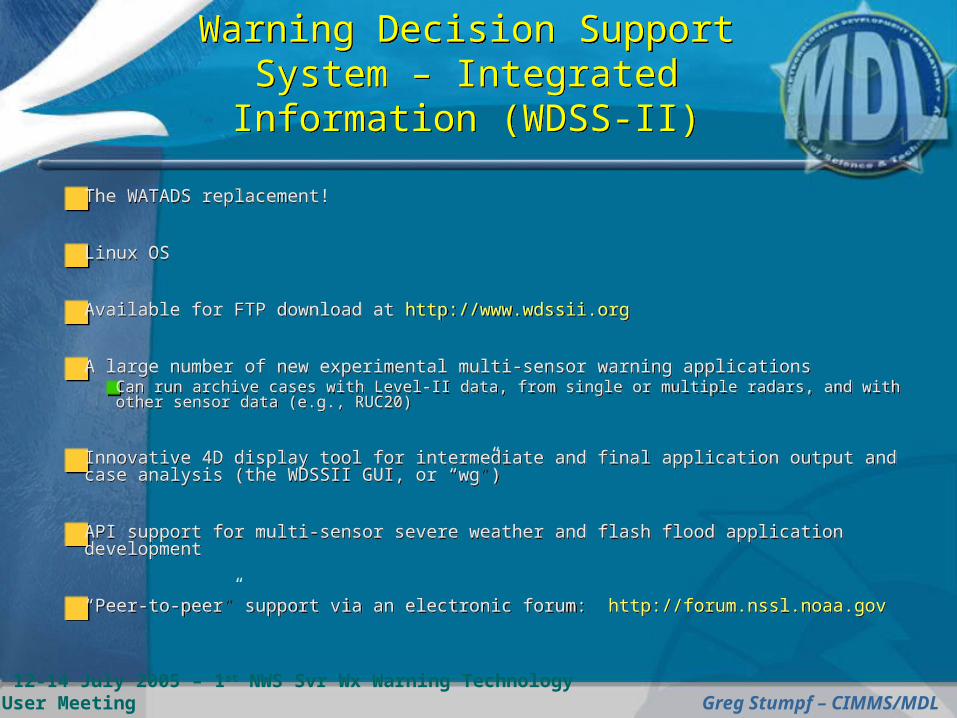
Warning Decision Support System – Integrated Information
(WDSS-II)
Warning Decision Support System – Integrated Information
(WDSS-II)
12-14 July 2005 – 1st NWS Svr Wx Warning Technology User Meeting Greg Stumpf – CIMMS/MDL
NSSL ForumNSSL Forum
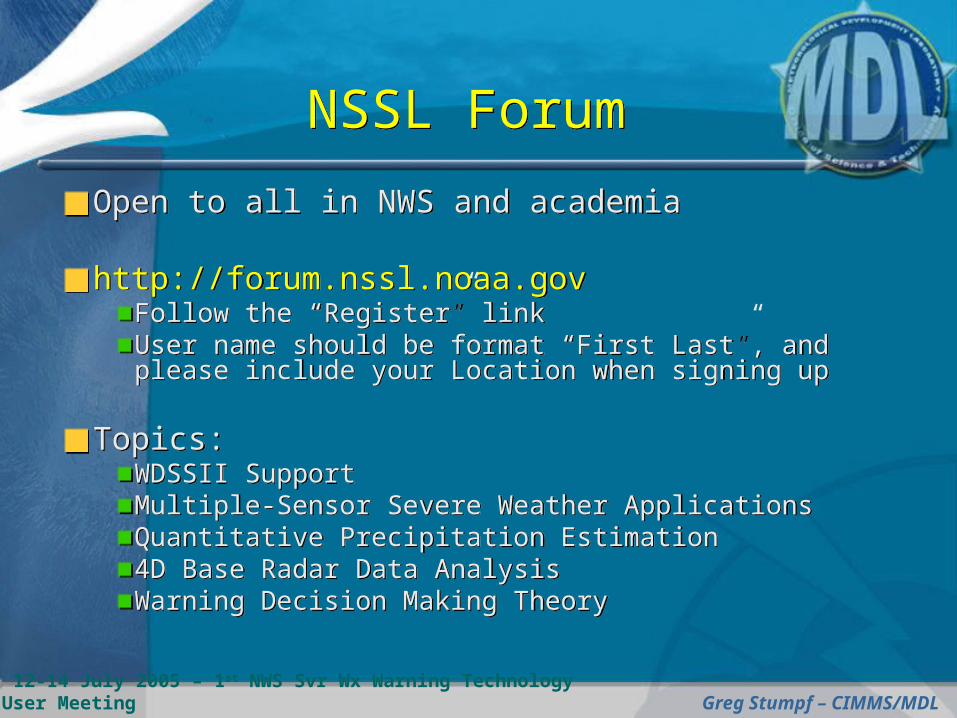
Open to all in NWS and academia
http://forum.nssl.noaa.govFollow the “Register” linkUser name should be format “First Last”, and please include your Location when signing up
Topics:WDSSII SupportMultiple-Sensor Severe Weather ApplicationsQuantitative Precipitation Estimation4D Base Radar Data AnalysisWarning Decision Making Theory
12-14 July 2005 – 1st NWS Svr Wx Warning Technology User Meeting Greg Stumpf – CIMMS/MDL
ResourcesResources
https://secure.nssl.noaa.gov/projects/feedback/
Go to: “NSSL Experimental Products in AWIPS”
Look for links to papers on:
New multi-sensor applicationsMulti-radar Merging
Hail DiagnosisLinear Least Squares Derivatives
https://secure.nssl.noaa.gov/projects/feedback/
Go to: “NSSL Experimental Products in AWIPS”
Look for links to papers on:
New multi-sensor applicationsMulti-radar Merging
Hail DiagnosisLinear Least Squares Derivatives