Embed Size (px)
Citation preview
12-1
Discontinued OperationsParts of a company’s operations that
are eliminatedA one-time occurrence
Income/loss from discontinued operations separately reportedNet of taxes
Gain/loss from disposal of discontinued operations separately reportedNet of taxes
12-2
Extraordinary ItemsEvents that are
Unusual in natureAbnormal
Infrequent in occurrenceNot reasonably expected to occur again in
the foreseeable futureMuch judgment required to determine if
an event is an extraordinary item
12-3
Reporting Taxes
Income taxes shown as separate line item
Last item before income from continuing operations
Does not include tax expense/savings from extraordinary items or discontinued operations
12-4
Horizontal AnalysisEvaluating financial statements
across timeExpress change in a financial statement
item in percentages instead of dollarsCurrent year amount – Base year amount
Base year amountReported as a percentage
Two ways to compute Choose a single year as base period for all years analyzed
Use the prior year as base period
12-5
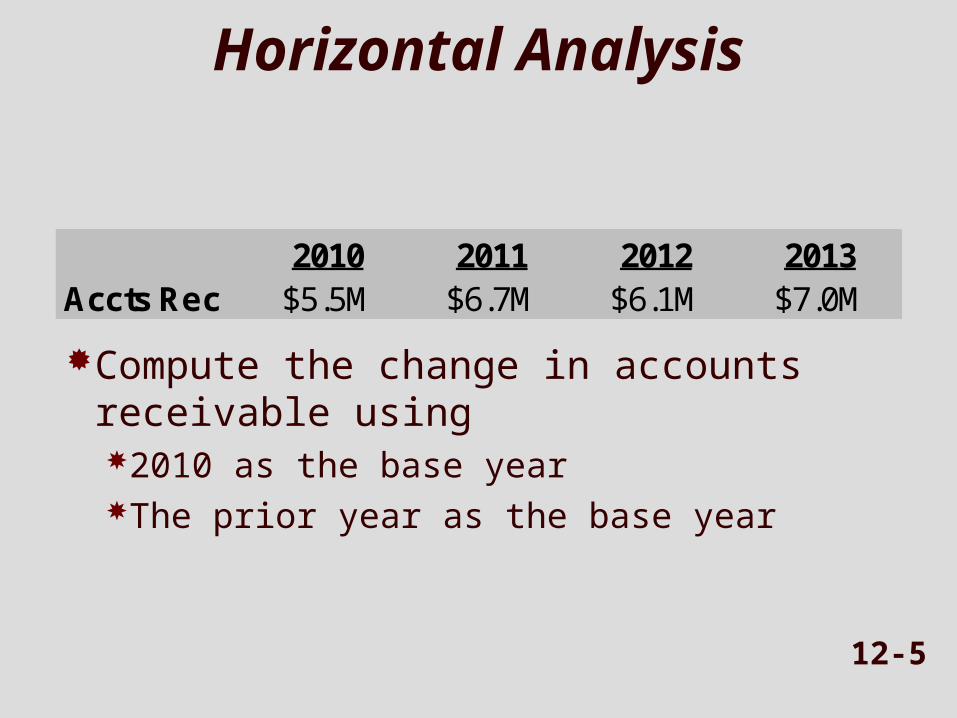
Horizontal Analysis
Compute the change in accounts receivable using2010 as the base yearThe prior year as the base year
2010 2011 2012 2013Accts Rec $5.5M $6.7M $6.1M $7.0M
12-6
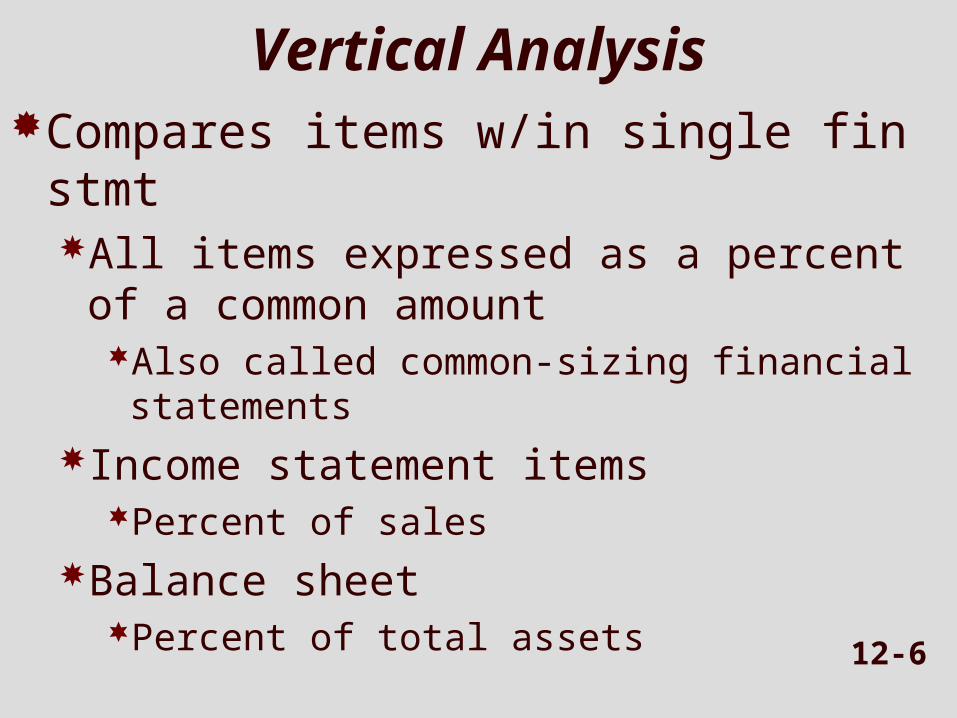
Vertical AnalysisCompares items w/in single fin stmt
All items expressed as a percent of a common amountAlso called common-sizing financial
statementsIncome statement items
Percent of salesBalance sheet
Percent of total assets
12-7
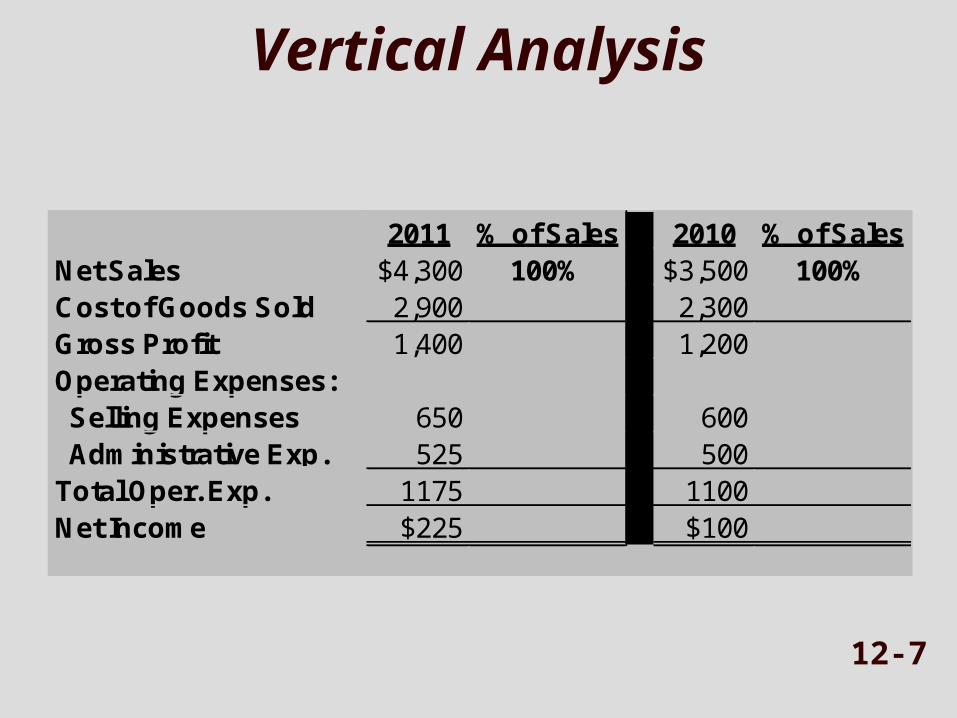
Vertical Analysis
2011 % of Sales 2010 % of SalesNet Sales $4,300 100% $3,500 100%Cost of Goods Sold 2,900 2,300Gross Profit 1,400 1,200Operating Expenses: Selling Expenses 650 600 Administrative Exp. 525 500Total Oper. Exp. 1175 1100Net Income $225 $100
12-8
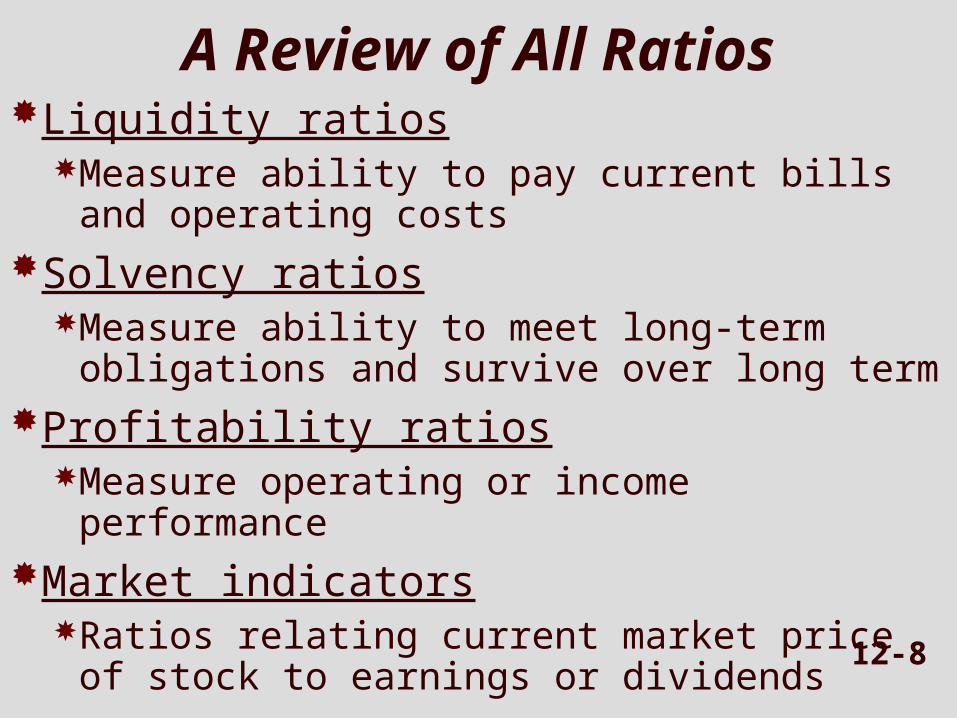
A Review of All RatiosLiquidity ratios
Measure ability to pay current bills and operating costs
Solvency ratiosMeasure ability to meet long-term
obligations and survive over long termProfitability ratios
Measure operating or income performance
Market indicatorsRatios relating current market price of
stock to earnings or dividends

12-9
Current Ratio Current Assets _ Current Liabilities
Measure ability to pay current liabilities with current assets
Helps creditors determine if a company can meet its short-term obligations
12-10
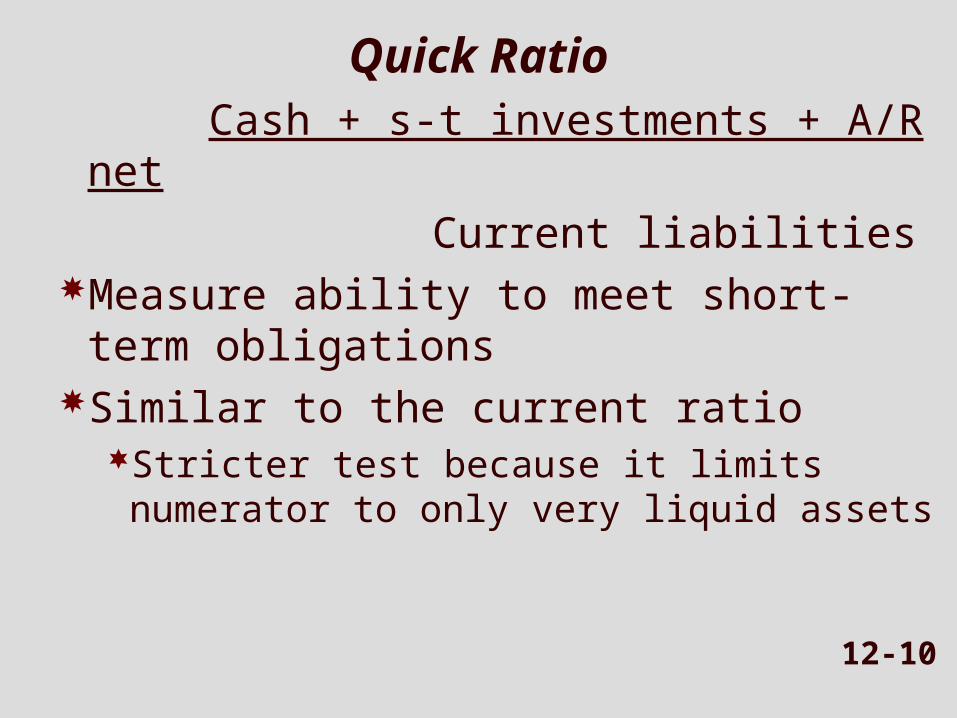
Quick Ratio Cash + s-t investments + A/R net Current liabilities
Measure ability to meet short-term obligations
Similar to the current ratioStricter test because it limits numerator to
only very liquid assets
12-11
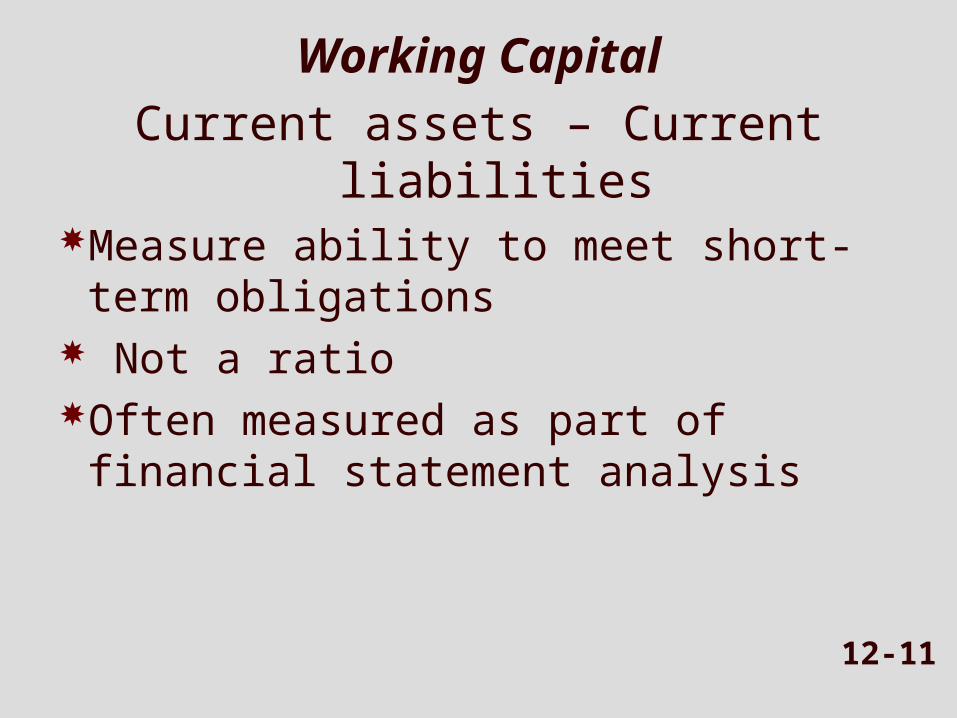
Working CapitalCurrent assets – Current liabilities
Measure ability to meet short-term obligations
Not a ratioOften measured as part of financial
statement analysis
12-12
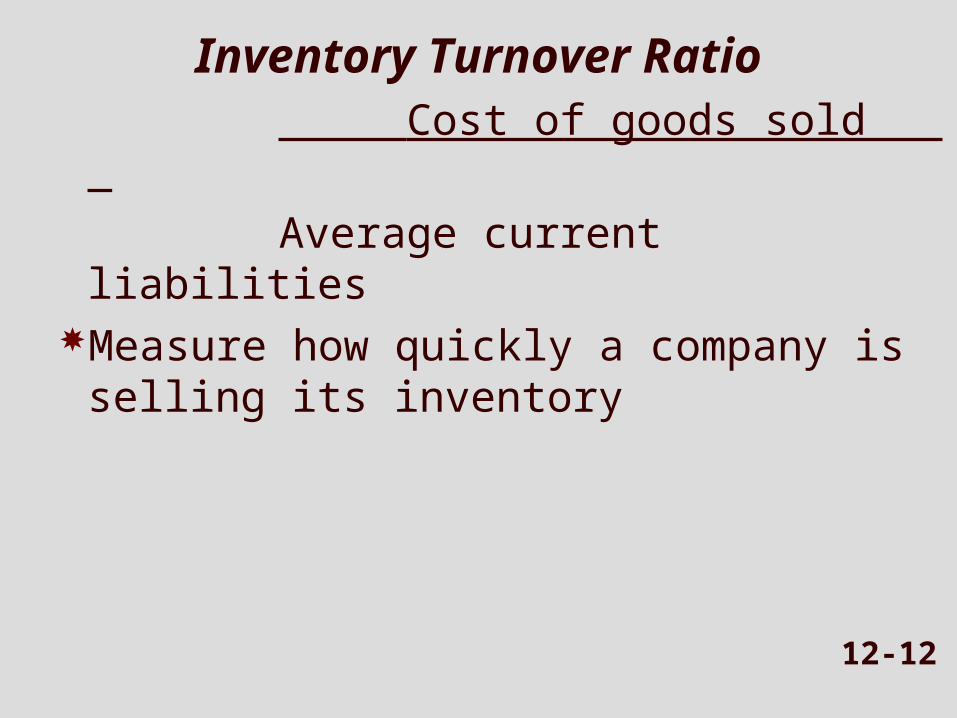
Inventory Turnover Ratio Cost of goods sold _Average current liabilities
Measure how quickly a company is selling its inventory
12-13
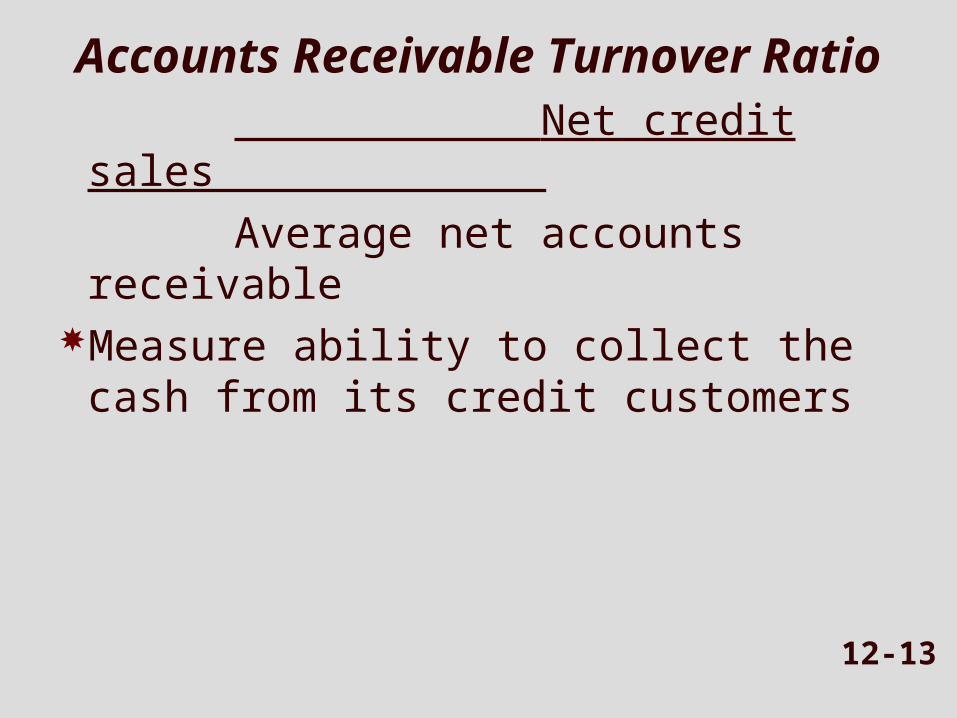
Accounts Receivable Turnover Ratio
Net credit sales _ Average net accounts receivable
Measure ability to collect the cash from its credit customers
12-14
Current Cash Debt Coverage Ratio Net cash from operating activities Average current liabilities
Measure ability to generate cash needed to pay current liabilities from company’s operations
12-15
Debt to Equity Ratio Total liabilities _Total shareholders’ equity
Compare amount of company’s debt with amount owners have invested in the company
12-16
Times Interest Earned RatioIncome from operations_ Interest expense
Compare amount of income earned in an accounting period (before interest) to interest obligation for same periodIf net income used in numerator, add back
interest expense and taxes
12-17
Cash Flow Adequacy Ratio Net cash from operating activities _Net cash required for investing activities
Cash required for investing activities Cash paid for capital expenditures and
acquisitions minus cash proceeds from disposal of capital assets
Measures the firm’s ability to generate enough cash from operating activities to pay for its capital expenditures
12-18
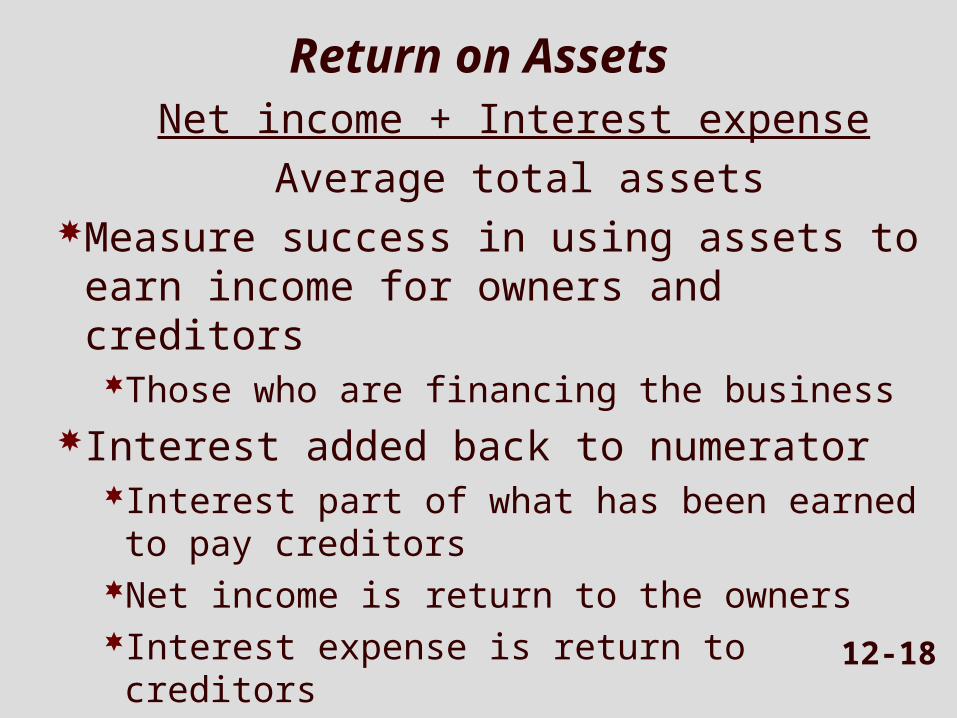
Return on Assets Net income + Interest expense_ Average total assets
Measure success in using assets to earn income for owners and creditorsThose who are financing the business
Interest added back to numeratorInterest part of what has been earned to
pay creditorsNet income is return to the ownersInterest expense is return to creditors
12-19
Asset Turnover Ratio Net sales _ Average total assets
Measure how efficiently a company uses its assets
12-20
Return on Equity Net income – preferred dividends _ Average common shareholders’ equityMeasure how much income is earned
with the common shareholders’ investment in the company
12-21
Gross Profit Ratio Gross profit_ Net sales
Describes percentage of sales price that is gross profitCarefully watched by managementA small shift usually indicates a big change
in the profitability of the company’s sales
12-22
Profit Margin Ratio Net income_ Net sales
Measure percentage of each sales dollar that results in net income
12-23
Earnings Per Share Net income – preferred dividends_
Weighted average # of shares of common stock outstanding
Calculate net income per share of common stock
12-24
Price-earnings Ratio Market price per common share_
Earnings per share Calculate market price for $1 of
earningsInvestors and analysts believe it
indicates future earnings potential
12-25
Dividend Yield Ratio Dividends per share _ Market price per share
Calculate percentage return on investment in a share of stock via dividends
12-26
Understanding Ratio Analysis
Ratios must be compared with something to be usefulSame company for prior periodsOther companies for same periodIndustry average for same period
12-27
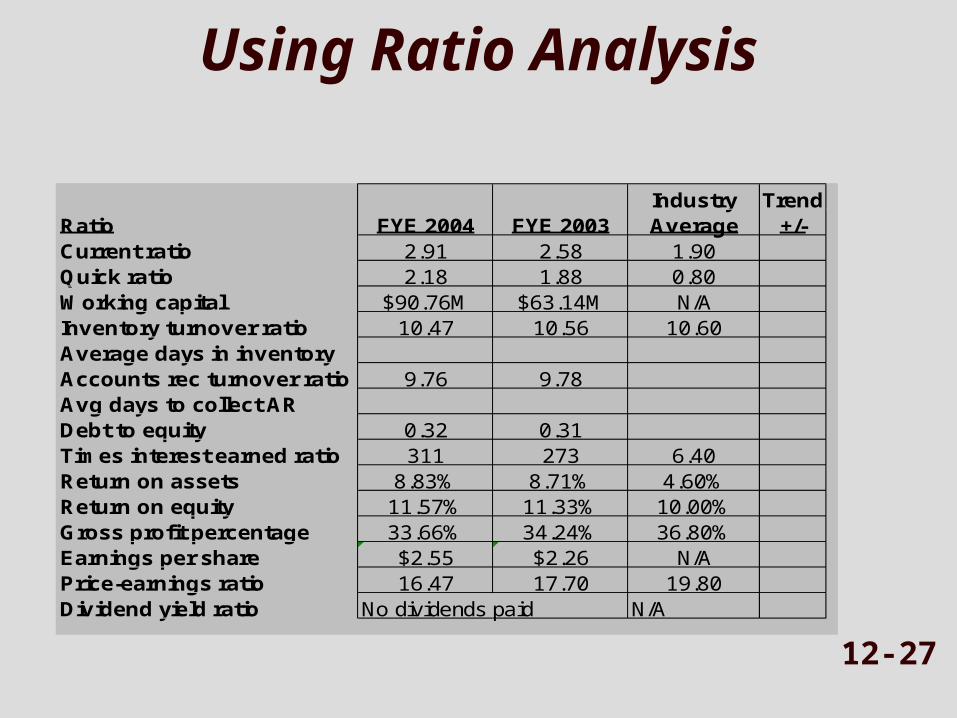
Using Ratio Analysis
Industry TrendRatio FYE 2004 FYE 2003 Average +/-Current ratio 2.91 2.58 1.90Quick ratio 2.18 1.88 0.80Working capital $90.76M $63.14M N/AInventory turnover ratio 10.47 10.56 10.60Average days in inventoryAccounts rec turnover ratio 9.76 9.78Avg days to collect ARDebt to equity 0.32 0.31Times interest earned ratio 311 273 6.40Return on assets 8.83% 8.71% 4.60%Return on equity 11.57% 11.33% 10.00%Gross profit percentage 33.66% 34.24% 36.80%Earnings per share $2.55 $2.26 N/APrice-earnings ratio 16.47 17.70 19.80Dividend yield ratio No dividends paid N/A
12-28
It’s More than Just the It’s More than Just the NumbersNumbers
Information found in notes to financial statementsInventory cost flow methodsDepreciation methodsHow various items are valuedDescription of accounting policies
12-29
Business Risk, Control, and Business Risk, Control, and EthicsEthics
Investor perspectiveHow do you minimize the risks of stock
ownership?Consult with a financial professionalDiversify your investments
What kinds of investments would make up a diversified portfolio?
Can you eliminate all investment risk?
12-30
Assign #9: pg. 644 - #E12-1A, #E12-2AAssign #10: pg. 655-656 - #P12-4A, #P12-5A