Embed Size (px)
Citation preview
11th annualsustainability report
The Society of Motor Manufacturers and Traders
2009 data
70283 Cover:Layout 1 04/10/2010 16:37 Page 1
2
The Society of Motor Manufacturers and Traders
© SMMT Ltd 2010. All rights reserved.
Chief executive’s statement From its environmental footprint to its economic contribution, sustainability remains a key priority for the UK motor industry. This report details the significant and ongoing improvements being made in the automotive sector and demonstrates why it is one of the clear leaders in sustainable development. We are emerging from an unprecedented economic crisis and the progress made in cutting emissions, waste and energy use, particularly during the last 12 months, is a testament to the resilience of the UK motor industry and its commitment to acting responsibly. While there remain challenges ahead, this is a time of opportunity for our sector. We develop, produce and export products that are in demand across the world and therefore, we have a vital role to play in helping to re-balance the UK economy. The UK motor industry is productive, home to more than 40 companies building cars, vans, trucks, buses and specialist vehicles as well as thousands more throughout the supply chain. We are a key delivery mechanism for the shift to a low carbon economy. We invest in R&D to deliver increasingly cleaner, safer and more fuel efficient vehicles and what’s more, recent investments indicate that the UK is becoming an increasingly attractive proposition for multinational OEMs. In July of this year, the coalition government published its strategy for sustainable growth. It highlighted the contribution the automotive sector is making to the economic recovery and delivering a sustainable future. With an increased recognition of the importance of manufacturing, we can help make economic growth sustainable. Automotive accounts for over 10% of the UK’s total export values, reaching £23.8 billion in 2009. The Automotive Council, a strategic partnership between industry and government to secure future jobs and prosperity for the UK motor industry, is making real progress in establishing the UK as a leader in the transition to exciting ultra-low carbon vehicles and creating opportunities for the UK supply base. Throughout this 11th annual report, you will see the progress made in environmental and social responsibility but the opportunity for further improvements is ever present. As we seek to grow our contribution to the UK economy, sustainable development will remain a core element of our business. Paul Everitt
Chief Executive The Society of Motor Manufacturers and Traders
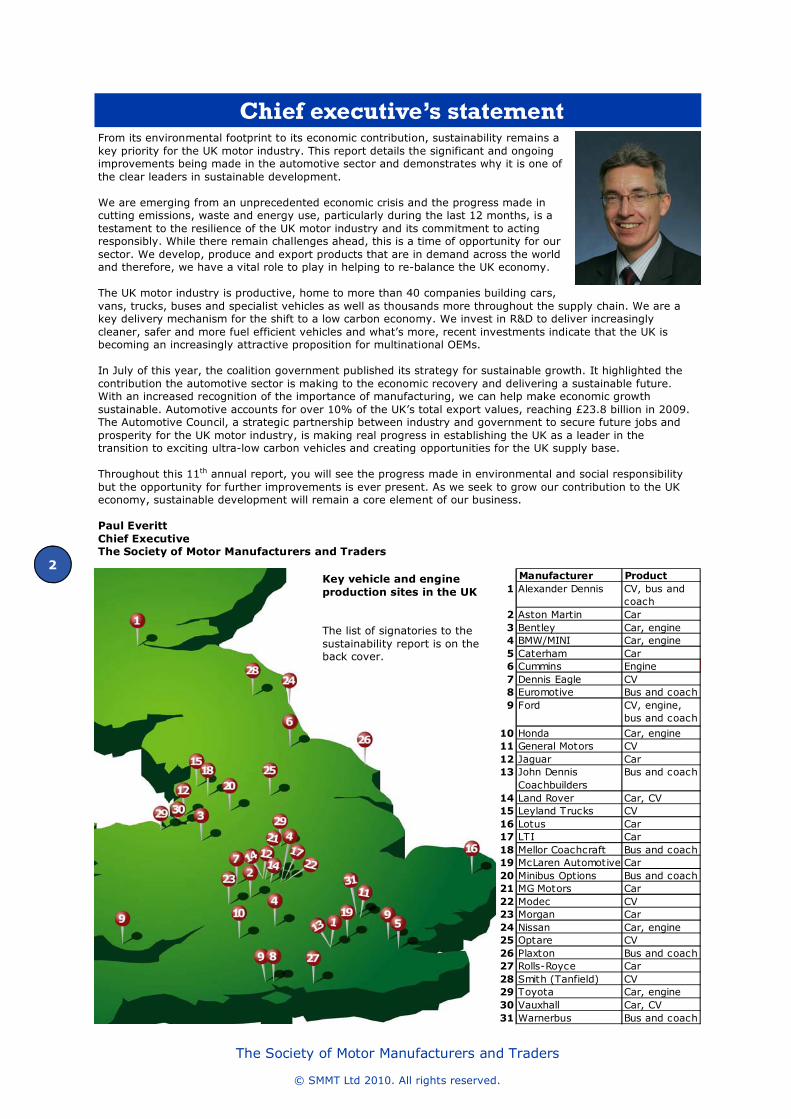
Key vehicle and engine
production sites in the UK
The list of signatories to the sustainability report is on the back cover.
Manufacturer Product
1 Alexander Dennis CV, bus and coach
2 Aston Martin Car3 Bentley Car, engine4 BMW/MINI Car, engine5 Caterham Car6 Cummins Engine7 Dennis Eagle CV8 Euromotive Bus and coach9 Ford CV, engine,
bus and coach
10 Honda Car, engine11 General Motors CV12 Jaguar Car13 John Dennis
CoachbuildersBus and coach
14 Land Rover Car, CV15 Leyland Trucks CV16 Lotus Car17 LTI Car18 Mellor Coachcraft Bus and coach19 McLaren Automotive Car20 Minibus Options Bus and coach21 MG Motors Car22 Modec CV23 Morgan Car24 Nissan Car, engine25 Optare CV26 Plaxton Bus and coach27 Rolls-Royce Car28 Smith (Tanfield) CV29 Toyota Car, engine30 Vauxhall Car, CV31 Warnerbus Bus and coach
3
The Society of Motor Manufacturers and Traders
© SMMT Ltd 2010. All rights reserved.
Contents
1. Chief executive’s statement and stakeholder commitments 2. Executive summary and key performance indicators 3. Economic performance 4. Environmental performance 5. Social performance 6. The future strategy 7. Appendices
Sustainability reporting 1. Improve and enhance sustainability reporting and
respond to stakeholder feedback (pages 4-5).
Production and distribution 2. Control and reduce the environmental impact of
company operations (pages 8-11). 3. Affirm economic growth, turnover and investment
toward securing competitiveness in the global economy (pages 6-7).
4. Add value to employment capital through
development, skills and training (pages 22-23). 5. Improve the working environment, health and
safety of employees (page 24). 6. Improve our understanding of the impact of pre
and post production logistics on the environment (page 11).
7. Support development of a high quality and strong
environmental supply and reverse supply chain network (pages 11, 28).
Use 8. Improve fuel efficiency of newly designed
products (page 15).
9. Research, develop and bring cleaner technologies
to the market to improve tailpipe emission standards and, where practical, to introduce vehicles with higher emission standards in advance of legislation (pages 16-18).
10. Improve the safety of new vehicles (page 19).
End of life 11. Provide facilities for consumers to return vehicles
for disposal at the end of their life (page 20). 12. Design and build vehicles to ensure that at least
95% of the weight of materials used can be recovered at the end of their life (pages 20-21).
Engagement and information 13. Engage proactively with external stakeholders
(page 27). 14. Provide information to consumers to enhance
awareness and understanding of the vehicle’s environmental and safety features (page 27).
15. Support strategies to reduce the environmental
impact of road transport through fuel, driver and infrastructure development and an overall integrated approach (pages 14, 27-29).
Our commitments
Page 2-3 Page 4-5 Page 6 Page 8 Page 22 Page 28 Page 30
4
The Society of Motor Manufacturers and Traders
© SMMT Ltd 2010. All rights reserved.
Executive summary
and key performance indicators
Data in the report is quoted in a number of ways:
Whole industry data (WI)
All car sales in the United Kingdom (AC)
All signatories (AS)
UK vehicle manufacturing signatories (VMs)
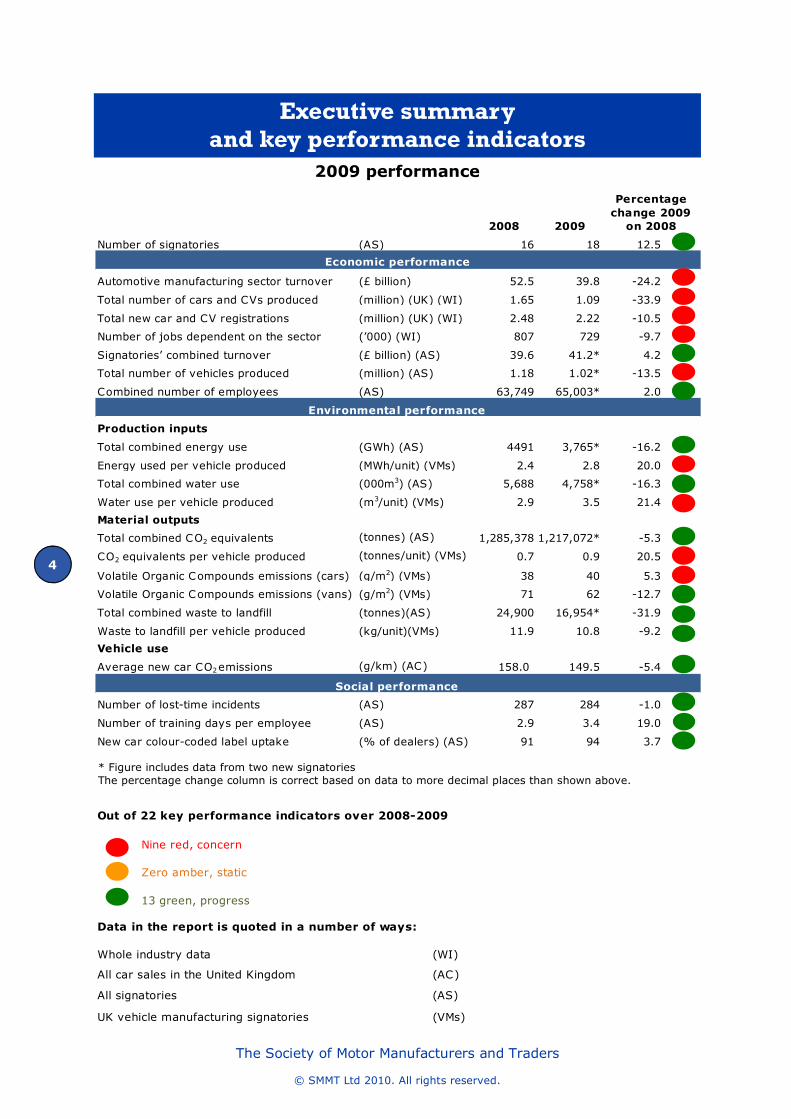
2009 performance
* Figure includes data from two new signatories The percentage change column is correct based on data to more decimal places than shown above.
Nine red, concern
Zero amber, static
13 green, progress
Out of 22 key performance indicators over 2008-2009
2008 2009
Number of signatories (AS) 16 18 12.5
Automotive manufacturing sector turnover (£ billion) 52.5 39.8 -24.2
Total number of cars and CVs produced (million) (UK) (WI) 1.65 1.09 -33.9
Total new car and CV registrations (million) (UK) (WI) 2.48 2.22 -10.5
Number of jobs dependent on the sector (’000) (WI) 807 729 -9.7
Signatories’ combined turnover (£ billion) (AS) 39.6 41.2* 4.2
Total number of vehicles produced (million) (AS) 1.18 1.02* -13.5
Combined number of employees (AS) 63,749 65,003* 2.0
Total combined energy use (GWh) (AS) 4491 3,765* -16.2
Energy used per vehicle produced (MWh/unit) (VMs) 2.4 2.8 20.0
Total combined water use (000m3) (AS) 5,688 4,758* -16.3
Water use per vehicle produced (m3/unit) (VMs) 2.9 3.5 21.4
Total combined CO2 equivalents (tonnes) (AS) 1,285,378 1,217,072* -5.3
CO2 equivalents per vehicle produced (tonnes/unit) (VMs) 0.7 0.9 20.5
Volatile Organic Compounds emissions (cars) (g/m2) (VMs) 38 40 5.3
Volatile Organic Compounds emissions (vans) (g/m2) (VMs) 71 62 -12.7
Total combined waste to landfill (tonnes)(AS) 24,900 16,954* -31.9
Waste to landfill per vehicle produced (kg/unit)(VMs) 11.9 10.8 -9.2
Average new car CO2 emissions (g/km) (AC) 158.0 149.5 -5.4
Number of lost-time incidents (AS) 287 284 -1.0
Number of training days per employee (AS) 2.9 3.4 19.0
New car colour-coded label uptake (% of dealers) (AS) 91 94 3.7
Percentage
change 2009
on 2008
Economic performance
Environmental performance
Production inputs
Material outputs
Vehicle use
Social performance
5
The Society of Motor Manufacturers and Traders
© SMMT Ltd 2010. All rights reserved.
Economic performance
Environmental performance
Social performance
• The number of jobs dependent on the automotive sector declined by almost 10% in 2009.
• The industry continues to invest in training and development of its employees despite the difficult economic situation.
• Automotive manufacturing provides a safe, rewarding and progressive working environment, which is reflected in low staff turnover.
• Community involvement continues to be a vital part of the industry’s corporate DNA.
• Managing their employees’ travel patterns is also recognised as an important part of signatories’ contribution to the local community.
Signatories
• Two additional signatories: Caterpillar and Leyland Trucks, which produce heavy equipment and heavy goods vehicles.
• The additional signatories do not significantly affect the overall results and the report now represents 94% of vehicle production in the UK.
• In 2009, recession reduced demand for vehicles leading to a sharp fall in vehicle production and hence turnover.
• Employment in the sector has decreased, despite continued efforts to protect the vital industrial capability by introducing short-time working, time banking etc.
• Government introduced the Scrappage Incentive Scheme (SIS) to bolster production volumes and help the industry, its supply chain and retailers in
the wake of falling sales during the recession. The scheme delivered almost 400,000 new car and van registrations, helping to stabilise the market.
• Average CO2 emissions of a SIS new car were under 132.3g/km, 10% below the average for all new cars and 27% below the scrapped car’s figure.
• Through 2010, and beyond, production is expected to recover. By 2014 output is projected to return to 2008 levels.
• Average new car CO2 emissions fell by 5.4% or 8.5g/km to 149.5g/km in 2009. This was the largest improvement since SMMT records began in 1997.
• Diesel penetration in the car market fell for the first time in a decade, largely due to the SIS.
• The European Commission proposed CO2 targets for new vans are expected to be agreed in 2011.
• The market share of alternative fuel vehicles rose to 0.8% in 2009.
• Total van CO2 emissions and distance travelled fell for the first time in 2008.
• Government withdrew the 20p/litre duty differential for biofuels from April 2010. The industry views this as unhelpful for such an embryonic sector which has seen high blends withdrawn from the market as they are uneconomical.
• Total CO2 from production phase activities fell by 20% in 2009, but CO2 per vehicle produced increased 21% as the ‘baseload’ of core energy
consumption was spread over much reduced production volumes.
• VOC emissions from car painting rose slightly due to falling production volumes.
• Waste to landfill fell to an all-time low of 10.8kg per vehicle, down 9%.
• 12 times more waste was recycled than landfilled.
• The 85% EU recovery target was achieved for end-of-life vehicles (ELVs) across the UK in 2008, an increase of 67,500t over 2007.
• Vehicle manufacturers’ contracted networks have achieved 85% recovery since 2006.
• Investments in ELV infrastructure are coming through to enable 95% recovery in 2015.
• Signatories recognise that their environmental impact extends beyond their manufacturing processes. Careful management of their inbound and outbound logistics is also important to reduce resource consumption and deliver cost savings.
6
The Society of Motor Manufacturers and Traders
© SMMT Ltd 2010. All rights reserved.
1.50
1.75
2.00
2.25
2.50
Jan-07 Jan-08 Jan-09 Jan-10 Jan-11
New
car registrations, Mns, 1
2MMAT
Actual Forecast Apr '09 Forecast Jul '10
New car registrations
Economic performance
Production and registrations
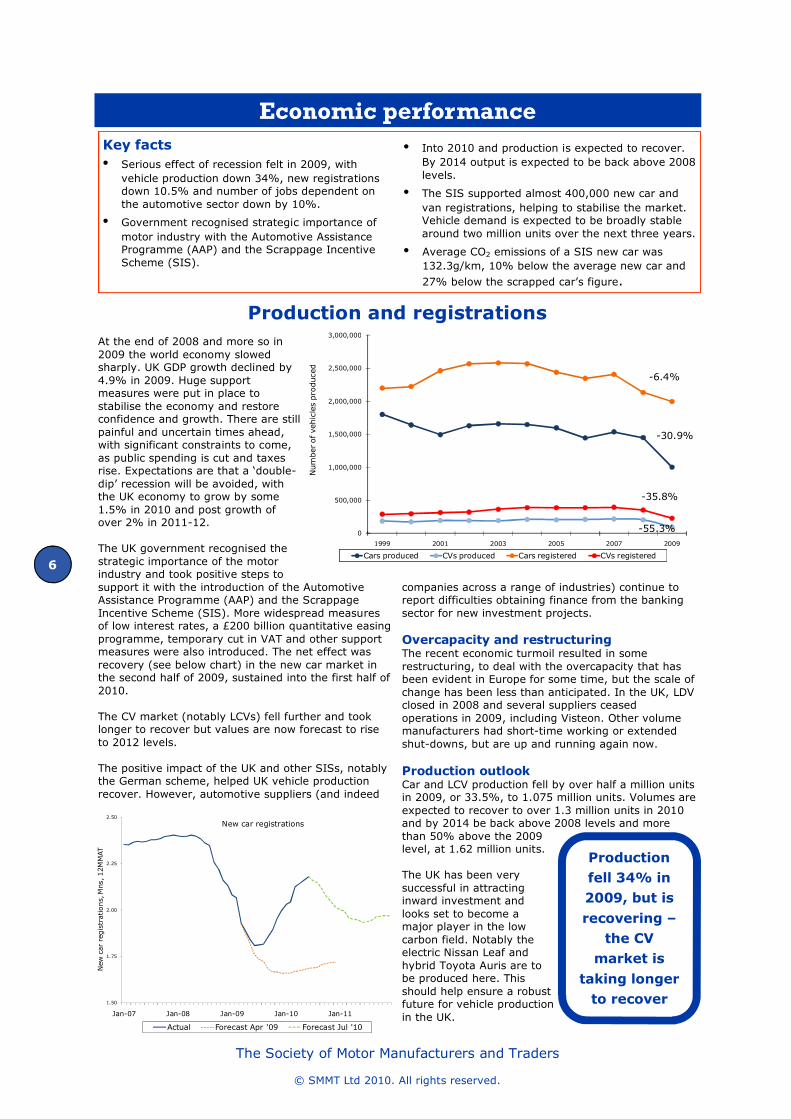
At the end of 2008 and more so in 2009 the world economy slowed sharply. UK GDP growth declined by 4.9% in 2009. Huge support measures were put in place to stabilise the economy and restore confidence and growth. There are still painful and uncertain times ahead, with significant constraints to come, as public spending is cut and taxes rise. Expectations are that a ‘double-dip’ recession will be avoided, with the UK economy to grow by some 1.5% in 2010 and post growth of over 2% in 2011-12. The UK government recognised the strategic importance of the motor industry and took positive steps to support it with the introduction of the Automotive Assistance Programme (AAP) and the Scrappage Incentive Scheme (SIS). More widespread measures of low interest rates, a £200 billion quantitative easing programme, temporary cut in VAT and other support measures were also introduced. The net effect was recovery (see below chart) in the new car market in the second half of 2009, sustained into the first half of 2010. The CV market (notably LCVs) fell further and took longer to recover but values are now forecast to rise to 2012 levels. The positive impact of the UK and other SISs, notably the German scheme, helped UK vehicle production recover. However, automotive suppliers (and indeed
companies across a range of industries) continue to report difficulties obtaining finance from the banking sector for new investment projects. Overcapacity and restructuring The recent economic turmoil resulted in some restructuring, to deal with the overcapacity that has been evident in Europe for some time, but the scale of change has been less than anticipated. In the UK, LDV closed in 2008 and several suppliers ceased operations in 2009, including Visteon. Other volume manufacturers had short-time working or extended shut-downs, but are up and running again now. Production outlook Car and LCV production fell by over half a million units in 2009, or 33.5%, to 1.075 million units. Volumes are expected to recover to over 1.3 million units in 2010 and by 2014 be back above 2008 levels and more than 50% above the 2009 level, at 1.62 million units. The UK has been very successful in attracting inward investment and looks set to become a major player in the low carbon field. Notably the electric Nissan Leaf and hybrid Toyota Auris are to be produced here. This should help ensure a robust future for vehicle production in the UK.
0
500,000
1,000,000
1,500,000
2,000,000
2,500,000
3,000,000
1999 2001 2003 2005 2007 2009
Cars produced CVs produced Cars registered CVs registered
-30.9%
-55.3%
-6.4%
-35.8%
Number of vehiclesproduced
Key facts
• Serious effect of recession felt in 2009, with vehicle production down 34%, new registrations down 10.5% and number of jobs dependent on the automotive sector down by 10%.
• Government recognised strategic importance of motor industry with the Automotive Assistance Programme (AAP) and the Scrappage Incentive Scheme (SIS).
• Into 2010 and production is expected to recover. By 2014 output is expected to be back above 2008 levels.
• The SIS supported almost 400,000 new car and van registrations, helping to stabilise the market. Vehicle demand is expected to be broadly stable around two million units over the next three years.
• Average CO2 emissions of a SIS new car was 132.3g/km, 10% below the average new car and
27% below the scrapped car’s figure.
Production
fell 34% in
2009, but is
recovering –
the CV
market is
taking longer
to recover
7
The Society of Motor Manufacturers and Traders
© SMMT Ltd 2010. All rights reserved.
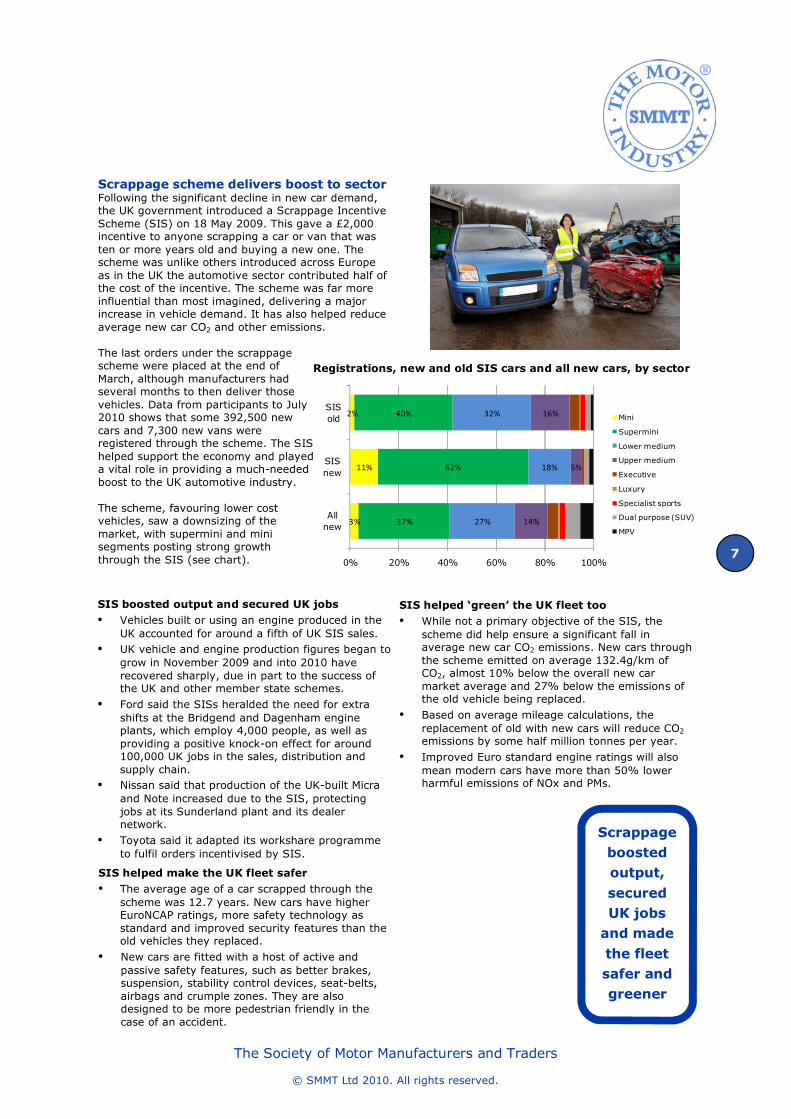
Scrappage scheme delivers boost to sector Following the significant decline in new car demand, the UK government introduced a Scrappage Incentive Scheme (SIS) on 18 May 2009. This gave a £2,000 incentive to anyone scrapping a car or van that was ten or more years old and buying a new one. The scheme was unlike others introduced across Europe as in the UK the automotive sector contributed half of the cost of the incentive. The scheme was far more influential than most imagined, delivering a major increase in vehicle demand. It has also helped reduce average new car CO2 and other emissions. The last orders under the scrappage scheme were placed at the end of March, although manufacturers had several months to then deliver those vehicles. Data from participants to July 2010 shows that some 392,500 new cars and 7,300 new vans were registered through the scheme. The SIS helped support the economy and played a vital role in providing a much-needed boost to the UK automotive industry. The scheme, favouring lower cost vehicles, saw a downsizing of the market, with supermini and mini segments posting strong growth through the SIS (see chart).
SIS helped make the UK fleet safer
• The average age of a car scrapped through the scheme was 12.7 years. New cars have higher EuroNCAP ratings, more safety technology as standard and improved security features than the old vehicles they replaced.
• New cars are fitted with a host of active and passive safety features, such as better brakes, suspension, stability control devices, seat-belts, airbags and crumple zones. They are also designed to be more pedestrian friendly in the case of an accident.
SIS boosted output and secured UK jobs
• Vehicles built or using an engine produced in the UK accounted for around a fifth of UK SIS sales.
• UK vehicle and engine production figures began to grow in November 2009 and into 2010 have recovered sharply, due in part to the success of the UK and other member state schemes.
• Ford said the SISs heralded the need for extra shifts at the Bridgend and Dagenham engine plants, which employ 4,000 people, as well as providing a positive knock-on effect for around 100,000 UK jobs in the sales, distribution and supply chain.
• Nissan said that production of the UK-built Micra and Note increased due to the SIS, protecting jobs at its Sunderland plant and its dealer network.
• Toyota said it adapted its workshare programme to fulfil orders incentivised by SIS.
SIS helped ‘green’ the UK fleet too
• While not a primary objective of the SIS, the scheme did help ensure a significant fall in average new car CO2 emissions. New cars through the scheme emitted on average 132.4g/km of CO2, almost 10% below the overall new car market average and 27% below the emissions of the old vehicle being replaced.
• Based on average mileage calculations, the replacement of old with new cars will reduce CO2 emissions by some half million tonnes per year.
• Improved Euro standard engine ratings will also mean modern cars have more than 50% lower harmful emissions of NOx and PMs.
Registrations, new and old SIS cars and all new cars, by sector
3%
11%
2%
37%
62%
40%
27%
18%
32%
14%
5%
16%
0% 20% 40% 60% 80% 100%
All new
SIS new
SIS old Mini
Supermini
Lower medium
Upper medium
Executive
Luxury
Specialist sports
Dual purpose (SUV)
MPV
Scrappage
boosted
output,
secured
UK jobs
and made
the fleet
safer and
greener
8
The Society of Motor Manufacturers and Traders
© SMMT Ltd 2010. All rights reserved.
Environmental performance
Production phase
Key facts
• Total CO2 from activities such as manufacturing fell by 20% in 2009, but CO2 per vehicle produced increased 21% as the ‘baseload’ of vital energy consumption was spread over much reduced production volumes.
• VOC emissions from painting vans fell by almost 13% in 2009.
• Waste to landfill fell to an all time low of 10.8kg per vehicle, down 9%.
• Twelve times more waste was recycled than landfilled.
• Signatories recognise that their environmental impact extends beyond their manufacturing processes. Careful management of their inbound and outbound logistics is also important to reduce resource consumption and deliver cost savings.
Environmental input
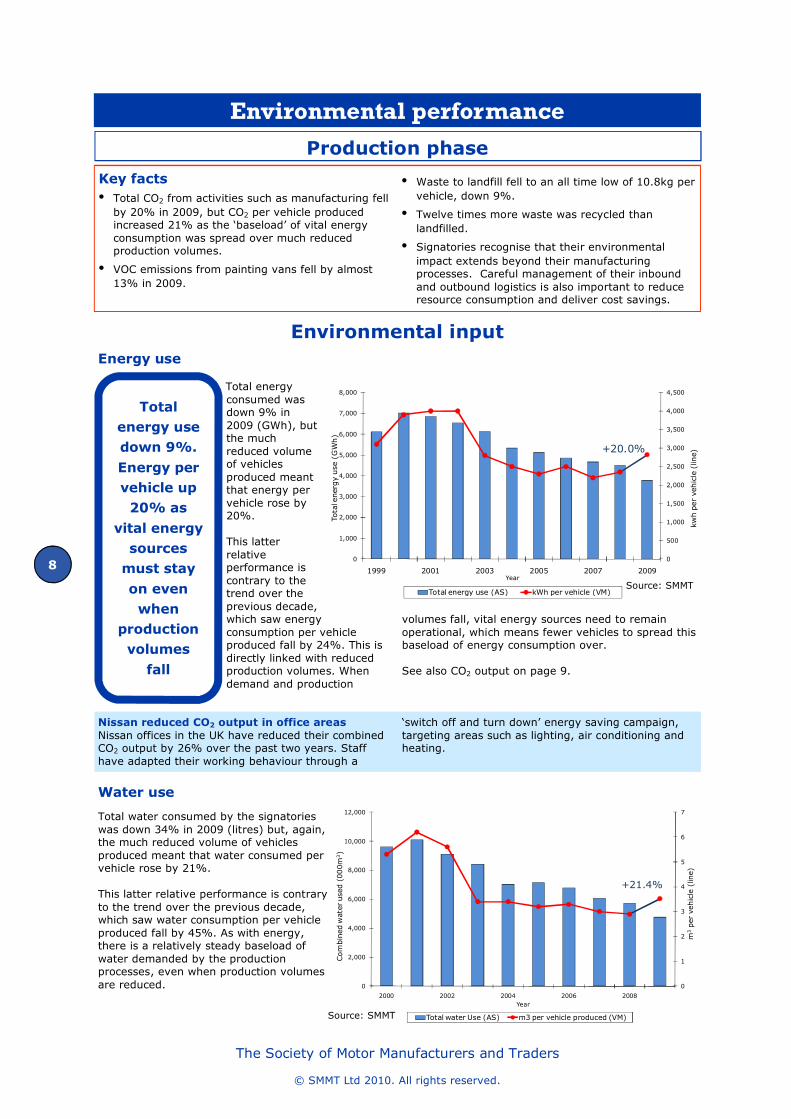
Total energy consumed was down 9% in 2009 (GWh), but the much reduced volume of vehicles produced meant that energy per vehicle rose by 20%. This latter relative performance is contrary to the trend over the previous decade, which saw energy consumption per vehicle produced fall by 24%. This is directly linked with reduced production volumes. When demand and production
volumes fall, vital energy sources need to remain operational, which means fewer vehicles to spread this baseload of energy consumption over. See also CO2 output on page 9.
Source: SMMT
Energy use
Total water consumed by the signatories was down 34% in 2009 (litres) but, again, the much reduced volume of vehicles produced meant that water consumed per vehicle rose by 21%. This latter relative performance is contrary to the trend over the previous decade, which saw water consumption per vehicle produced fall by 45%. As with energy, there is a relatively steady baseload of water demanded by the production processes, even when production volumes are reduced.
Water use
0
500
1,000
1,500
2,000
2,500
3,000
3,500
4,000
4,500
0
1,000
2,000
3,000
4,000
5,000
6,000
7,000
8,000
1999 2001 2003 2005 2007 2009
kwh per vehicle (line)
Total energy use (GWh)
Year
Total energy use (AS) kWh per vehicle (VM)
+20.0%
Source: SMMT
Nissan reduced CO2 output in office areas
Nissan offices in the UK have reduced their combined CO2 output by 26% over the past two years. Staff have adapted their working behaviour through a
‘switch off and turn down’ energy saving campaign, targeting areas such as lighting, air conditioning and heating.
0
1
2
3
4
5
6
7
0
2,000
4,000
6,000
8,000
10,000
12,000
2000 2002 2004 2006 2008
m3per vehicle (line)
Combined water used (000m
3)
Year
Total water Use (AS) m3 per vehicle produced (VM)
+21.4%
Total
energy use
down 9%.
Energy per
vehicle up
20% as
vital energy
sources
must stay
on even
when
production
volumes
fall
9
The Society of Motor Manufacturers and Traders
© SMMT Ltd 2010. All rights reserved.
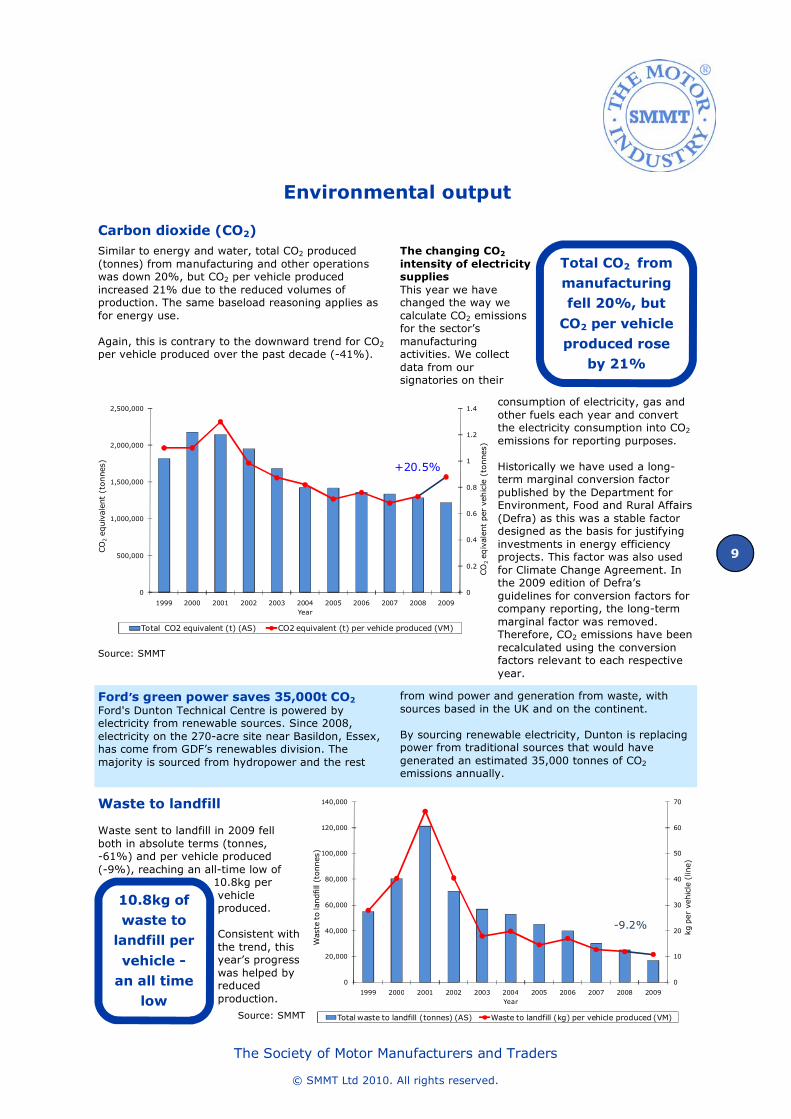
Similar to energy and water, total CO2 produced (tonnes) from manufacturing and other operations was down 20%, but CO2 per vehicle produced increased 21% due to the reduced volumes of production. The same baseload reasoning applies as for energy use. Again, this is contrary to the downward trend for CO2 per vehicle produced over the past decade (-41%).
The changing CO2
intensity of electricity supplies
This year we have changed the way we calculate CO2 emissions for the sector’s manufacturing activities. We collect data from our signatories on their
Carbon dioxide (CO2)
Environmental output
Waste to landfill Waste sent to landfill in 2009 fell both in absolute terms (tonnes, -61%) and per vehicle produced (-9%), reaching an all-time low of
10.8kg per vehicle produced. Consistent with the trend, this year’s progress was helped by reduced production.
Ford’s green power saves 35,000t CO2 Ford's Dunton Technical Centre is powered by electricity from renewable sources. Since 2008, electricity on the 270-acre site near Basildon, Essex, has come from GDF’s renewables division. The majority is sourced from hydropower and the rest
from wind power and generation from waste, with sources based in the UK and on the continent. By sourcing renewable electricity, Dunton is replacing power from traditional sources that would have generated an estimated 35,000 tonnes of CO2 emissions annually.
0
0.2
0.4
0.6
0.8
1
1.2
1.4
0
500,000
1,000,000
1,500,000
2,000,000
2,500,000
1999 2000 2001 2002 2003 2004 2005 2006 2007 2008 2009
CO
2eqivalent per vehicle (tonnes)
CO2equivalent (tonnes)
Year
Total CO2 equivalent (t) (AS) CO2 equivalent (t) per vehicle produced (VM)
+20.5%
0
10
20
30
40
50
60
70
0
20,000
40,000
60,000
80,000
100,000
120,000
140,000
1999 2000 2001 2002 2003 2004 2005 2006 2007 2008 2009
kg per vehicle (line)
Waste to landfill (tonnes)
Year
Total waste to landfill (tonnes) (AS) Waste to landfill (kg) per vehicle produced (VM)
-9.2%
Total CO2 from
manufacturing
fell 20%, but
CO2 per vehicle
produced rose
by 21%
10.8kg of
waste to
landfill per
vehicle -
an all time
low
Source: SMMT
Source: SMMT
consumption of electricity, gas and other fuels each year and convert the electricity consumption into CO2 emissions for reporting purposes. Historically we have used a long-term marginal conversion factor published by the Department for Environment, Food and Rural Affairs (Defra) as this was a stable factor designed as the basis for justifying investments in energy efficiency projects. This factor was also used for Climate Change Agreement. In the 2009 edition of Defra’s guidelines for conversion factors for company reporting, the long-term marginal factor was removed. Therefore, CO2 emissions have been recalculated using the conversion factors relevant to each respective year.
10
The Society of Motor Manufacturers and Traders
© SMMT Ltd 2010. All rights reserved.
Volatile organic compounds (VOC)
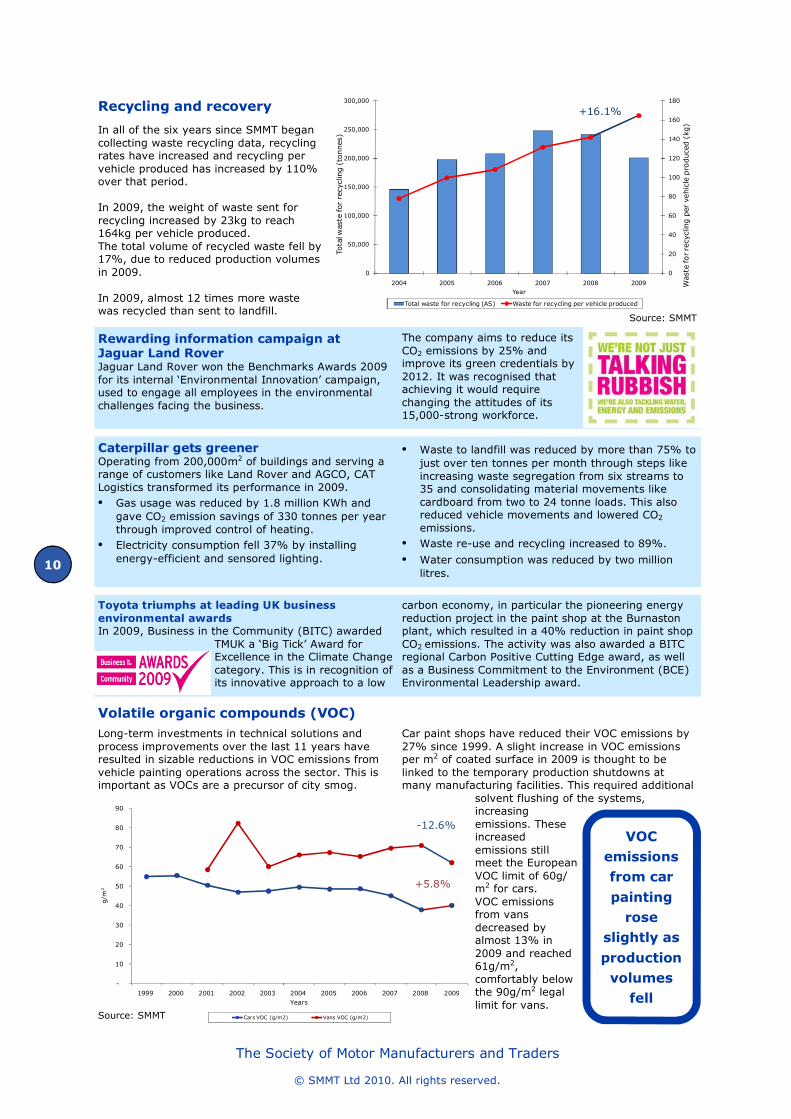
In all of the six years since SMMT began collecting waste recycling data, recycling rates have increased and recycling per vehicle produced has increased by 110% over that period. In 2009, the weight of waste sent for recycling increased by 23kg to reach 164kg per vehicle produced. The total volume of recycled waste fell by 17%, due to reduced production volumes in 2009. In 2009, almost 12 times more waste was recycled than sent to landfill.
Caterpillar gets greener Operating from 200,000m2 of buildings and serving a range of customers like Land Rover and AGCO, CAT Logistics transformed its performance in 2009. • Gas usage was reduced by 1.8 million KWh and
gave CO2 emission savings of 330 tonnes per year through improved control of heating.
• Electricity consumption fell 37% by installing energy-efficient and sensored lighting.
• Waste to landfill was reduced by more than 75% to just over ten tonnes per month through steps like increasing waste segregation from six streams to 35 and consolidating material movements like cardboard from two to 24 tonne loads. This also reduced vehicle movements and lowered CO2 emissions.
• Waste re-use and recycling increased to 89%.
• Water consumption was reduced by two million litres.
Recycling and recovery
Rewarding information campaign at Jaguar Land Rover Jaguar Land Rover won the Benchmarks Awards 2009 for its internal ‘Environmental Innovation’ campaign, used to engage all employees in the environmental challenges facing the business.
The company aims to reduce its CO2 emissions by 25% and improve its green credentials by 2012. It was recognised that achieving it would require changing the attitudes of its 15,000-strong workforce.
Long-term investments in technical solutions and process improvements over the last 11 years have resulted in sizable reductions in VOC emissions from vehicle painting operations across the sector. This is important as VOCs are a precursor of city smog.
Car paint shops have reduced their VOC emissions by 27% since 1999. A slight increase in VOC emissions per m2 of coated surface in 2009 is thought to be linked to the temporary production shutdowns at many manufacturing facilities. This required additional
solvent flushing of the systems, increasing emissions. These increased emissions still meet the European VOC limit of 60g/m2 for cars. VOC emissions from vans decreased by almost 13% in 2009 and reached 61g/m2, comfortably below the 90g/m2 legal limit for vans.
0
20
40
60
80
100
120
140
160
180
0
50,000
100,000
150,000
200,000
250,000
300,000
2004 2005 2006 2007 2008 2009 Waste for recycling per vehicle produced (kg)
Total w
aste for recycling (tonnes)
Year
Total waste for recycling (AS) Waste for recycling per vehicle produced
+16.1%
Source: SMMT
Source: SMMT
VOC
emissions
from car
painting
rose
slightly as
production
volumes
fell
Toyota triumphs at leading UK business
environmental awards In 2009, Business in the Community (BITC) awarded
TMUK a ‘Big Tick’ Award for Excellence in the Climate Change category. This is in recognition of its innovative approach to a low
carbon economy, in particular the pioneering energy reduction project in the paint shop at the Burnaston plant, which resulted in a 40% reduction in paint shop CO2 emissions. The activity was also awarded a BITC regional Carbon Positive Cutting Edge award, as well as a Business Commitment to the Environment (BCE) Environmental Leadership award.
-
10
20
30
40
50
60
70
80
90
1999 2000 2001 2002 2003 2004 2005 2006 2007 2008 2009
g/m
2
Years
Cars VOC (g/m2) Vans VOC (g/m2)
-12.6%
+5.8%
11
The Society of Motor Manufacturers and Traders
© SMMT Ltd 2010. All rights reserved.
Supply chain logistics
SMMT and the industry are working to ensure that the UK is well positioned to capture the green economy and build a robust supply chain capable of competing globally (for further detail see page 28). An important part of those efforts is ensuring that effective management of the supply chain delivers environmental benefits by reducing resource consumption and, therefore, cost savings. The industry has worked hard on the efficiency of its own and its suppliers’ logistics operations for many years. Recent examples of supply chain efficiency improvement include:
• More efficient planning, resulting in the vehicle fill being increased by approximately 5%.
• Better route planning and volume reduction reduced the collection fleet by about 25%.
• Training in fuel-efficient driving.
• Increasing the use of biofuels.
• Installation of vehicle telematics and live de-brief at the end of each route, which led to moving from an average fuel economy of approximately 7.5 mpg to 8.5 mpg over the past four years.
• Monthly reviews with all suppliers where operational, financial, safety and environmental results are presented. Key countermeasures and improvement theme activities are agreed and followed up at the next meeting.
• Maximising the use of rail, river and short sea transport for inbound parts and materials to reduce fuel costs, emissions and road congestion.
• The pioneering of a number of new ‘inter-modal’ routes that use a combination of road and rail
transport to achieve the environmental friendliness of rail for long distances and the flexibility of road transport at either end of the journey.
• Piloting systems where road-going truck trailers can be physically lifted on and off suitably designed rail wagons.
• Trials for using driving speed limiters to improve fuel economy and using deflectors on new trailers to improve the vehicle’s aerodynamics.
• Introducing more European, short-sea routes so that vehicles travel as near to the customer as possible by sea before final delivery by road. This led to reducing inland road-based transport within Spain by 29% through the expansion from three ports to six ports.
• Urging all new suppliers to sign up to Prince Charles’ Mayday Network to encourage their own carbon monitoring.
• Working with suppliers on the packaging guidelines to ensure that a neutral or positive environmental footprint is sought through zero waste to landfill and use of 100% recycled, renewable or recyclable materials.
Mercedes-Benz and Norfolkline shipping
partnership saves almost 500t CO2 per year Under a new shipping agreement with Norfolkline, Mercedes-Benz UK will now import vehicles destined for Scotland and the north of England via Rosyth, rather than to Killingholme, Lincs.
This is expected to save 245,556 road miles per year, which equates to 464 tonnes CO2.
Jaguar Land Rover cuts supply chain emissions
Jaguar Land Rover has removed more than 17,000 tonnes from its supply and delivery chain’s annual carbon footprint through efficiency measures over the past five years – a reduction of about 13%. The firm’s
supply and delivery chain is a huge operation, clocking up some 65 million road miles a year, 35 million nautical miles and 700,000 rail miles, all to deliver some 250,000 vehicles annually.
Ford green supply chain champion
Ford has been recognised by a 2009 Green Supply Chain award at the World Trade Group’s European Supply Chain and Logistics Summit for its continuous efforts in ‘greening’ company’s finished vehicle
logistics. This has been achieved by increasing sea and river transportation for finished vehicles and reducing miles driven by trucks to deliver vehicles and parts.
Efficient
logistics and
supply chains
can deliver
environmental
benefits and
cost savings
GEFCO improved vehicle distribution
GEFCO, part of the PSA Peugeot Citroën group, reduced its vehicle storage and distribution compounds in the UK from three to two in November
2009. This reduced internal movements by around 23%, or 40,500 miles per year. It also plans to increase the volume of vehicles transported by its existing fleet of 4,200 rail wagons.
12
The Society of Motor Manufacturers and Traders
© SMMT Ltd 2010. All rights reserved.
Use phase
Key facts
• The use phase is one of the most significant environmental, social and economic impacts in a vehicle’s life cycle. 85% of a vehicle’s life cycle CO2 emissions arise from its use.
• Average new car CO2 emissions fell by 5.4% to 149.5g/km in 2009.
• Diesel penetration in the car market fell for the first time in a decade, largely due to scrappage.
• The European Commission has proposed CO2 targets for new vans, expected to be agreed in 2011.
• Alternative fuel or propulsion vehicles rose to a record high of 0.8%.
• Total van CO2 emissions and distance travelled fell for the first time in 2008.
• Government withdrew the 20p/litre duty differential for biofuels except used cooking oil, which is unhelpful for such an embryonic sector and made high blends economically non-viable.
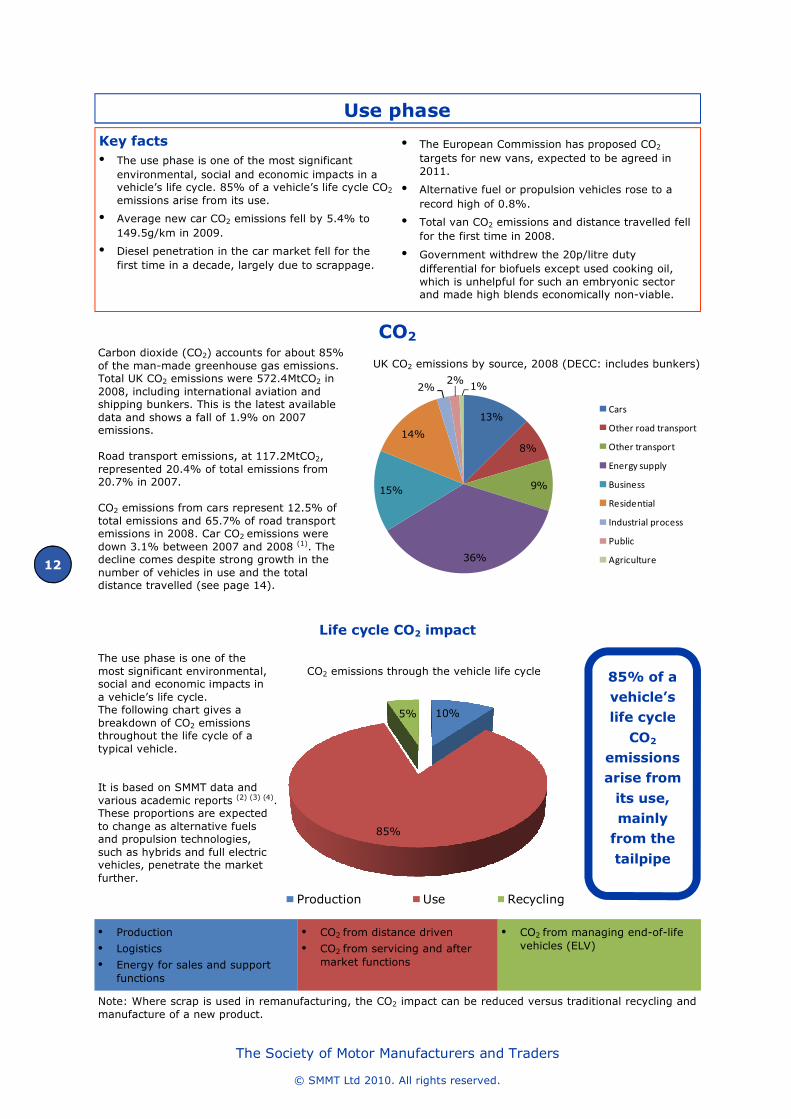
CO2 Carbon dioxide (CO2) accounts for about 85% of the man-made greenhouse gas emissions. Total UK CO2 emissions were 572.4MtCO2 in 2008, including international aviation and shipping bunkers. This is the latest available data and shows a fall of 1.9% on 2007 emissions. Road transport emissions, at 117.2MtCO2, represented 20.4% of total emissions from 20.7% in 2007. CO2 emissions from cars represent 12.5% of total emissions and 65.7% of road transport emissions in 2008. Car CO2 emissions were down 3.1% between 2007 and 2008 (1). The decline comes despite strong growth in the number of vehicles in use and the total distance travelled (see page 14).
Life cycle CO2 impact
• Production
• Logistics
• Energy for sales and support functions
• CO2 from managing end-of-life vehicles (ELV)
• CO2 from distance driven
• CO2 from servicing and after market functions
Note: Where scrap is used in remanufacturing, the CO2 impact can be reduced versus traditional recycling and manufacture of a new product.
The use phase is one of the most significant environmental, social and economic impacts in a vehicle’s life cycle. The following chart gives a breakdown of CO2 emissions throughout the life cycle of a typical vehicle. It is based on SMMT data and various academic reports (2) (3) (4). These proportions are expected to change as alternative fuels and propulsion technologies, such as hybrids and full electric vehicles, penetrate the market further.
85% of a
vehicle’s
life cycle
CO2
emissions
arise from
its use,
mainly
from the
tailpipe
13%
8%
9%
36%
15%
14%
2%2% 1%
Cars
Other road transport
Other transport
Energy supply
Business
Residential
Industrial process
Public
Agriculture
UK CO2 emissions by source, 2008 (DECC: includes bunkers)
CO2 emissions through the vehicle life cycle
10%
85%
5%
Production Use Recycling
13
The Society of Motor Manufacturers and Traders
© SMMT Ltd 2010. All rights reserved.
Jaguar XJ achieves environmental certification
Jaguar has received certification from the Vehicle Certification Agency for a comprehensive ‘cradle-to-grave’ study which analyses the environmental impact of its new lightweight XJ model. The detailed life cycle study will enable Jaguar to identify new opportunities to improve the sustainability of its vehicles, including developing the aerospace-inspired lightweight aluminium architecture. The VCA certification involved an audit of each aspect of the life cycle assessment carried out on the XJ, addressing product development, manufacturing processes and vehicle performance. This took account
of the principles, requirements and guidelines for life cycle assessments as described in the International Standards on LCA ISO 14040:2006 and ISO 14044:2006. The audit also reviewed evidence of the integration of environmental aspects into the vehicle’s design and development as described in ISO TR 14062:2002. To give an accurate assessment of the environmental impact, the life cycle study was based on the creation, use and disposal of a typical XJ vehicle over an assumed 200,000 km life, including the materials used, material processing, assembly and transport during manufacturing.
The automotive industry has applied a life cycle approach for many years to improve understanding of the full impact of the production, use and disposal of
the product. The following is a selection of applications of the Life Cycle Assessment (LCA) approach:
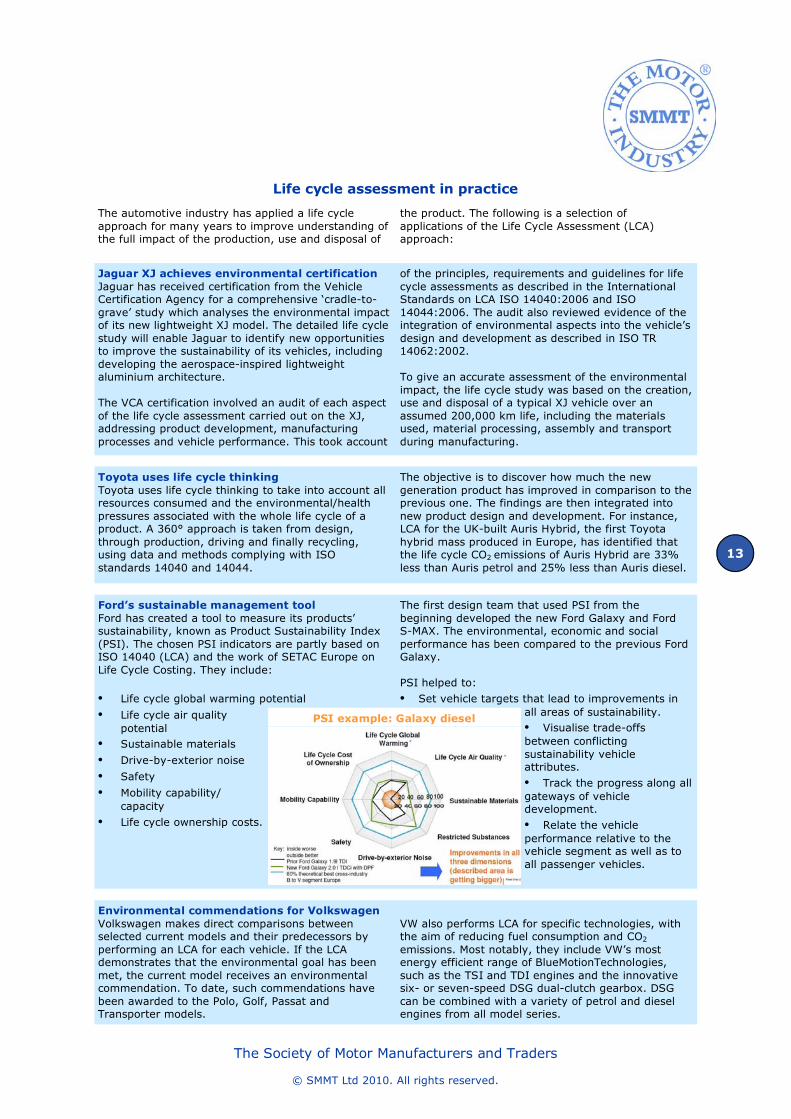
Ford’s sustainable management tool
Ford has created a tool to measure its products’ sustainability, known as Product Sustainability Index (PSI). The chosen PSI indicators are partly based on ISO 14040 (LCA) and the work of SETAC Europe on Life Cycle Costing. They include:
• Life cycle global warming potential
• Life cycle air quality potential
• Sustainable materials
• Drive-by-exterior noise
• Safety
• Mobility capability/ capacity
• Life cycle ownership costs.
The first design team that used PSI from the beginning developed the new Ford Galaxy and Ford S-MAX. The environmental, economic and social performance has been compared to the previous Ford Galaxy. PSI helped to:
• Set vehicle targets that lead to improvements in all areas of sustainability. • Visualise trade-offs between conflicting sustainability vehicle attributes.
• Track the progress along all gateways of vehicle development.
• Relate the vehicle performance relative to the vehicle segment as well as to all passenger vehicles.
Life cycle assessment in practice
Environmental commendations for Volkswagen
Volkswagen makes direct comparisons between selected current models and their predecessors by performing an LCA for each vehicle. If the LCA demonstrates that the environmental goal has been met, the current model receives an environmental commendation. To date, such commendations have been awarded to the Polo, Golf, Passat and Transporter models.
VW also performs LCA for specific technologies, with the aim of reducing fuel consumption and CO2 emissions. Most notably, they include VW’s most energy efficient range of BlueMotionTechnologies, such as the TSI and TDI engines and the innovative six- or seven-speed DSG dual-clutch gearbox. DSG can be combined with a variety of petrol and diesel engines from all model series.
Toyota uses life cycle thinking
Toyota uses life cycle thinking to take into account all resources consumed and the environmental/health pressures associated with the whole life cycle of a product. A 360° approach is taken from design, through production, driving and finally recycling, using data and methods complying with ISO standards 14040 and 14044.
The objective is to discover how much the new generation product has improved in comparison to the previous one. The findings are then integrated into new product design and development. For instance, LCA for the UK-built Auris Hybrid, the first Toyota hybrid mass produced in Europe, has identified that the life cycle CO2 emissions of Auris Hybrid are 33% less than Auris petrol and 25% less than Auris diesel.
PSI example: Galaxy diesel
14
The Society of Motor Manufacturers and Traders
© SMMT Ltd 2010. All rights reserved.
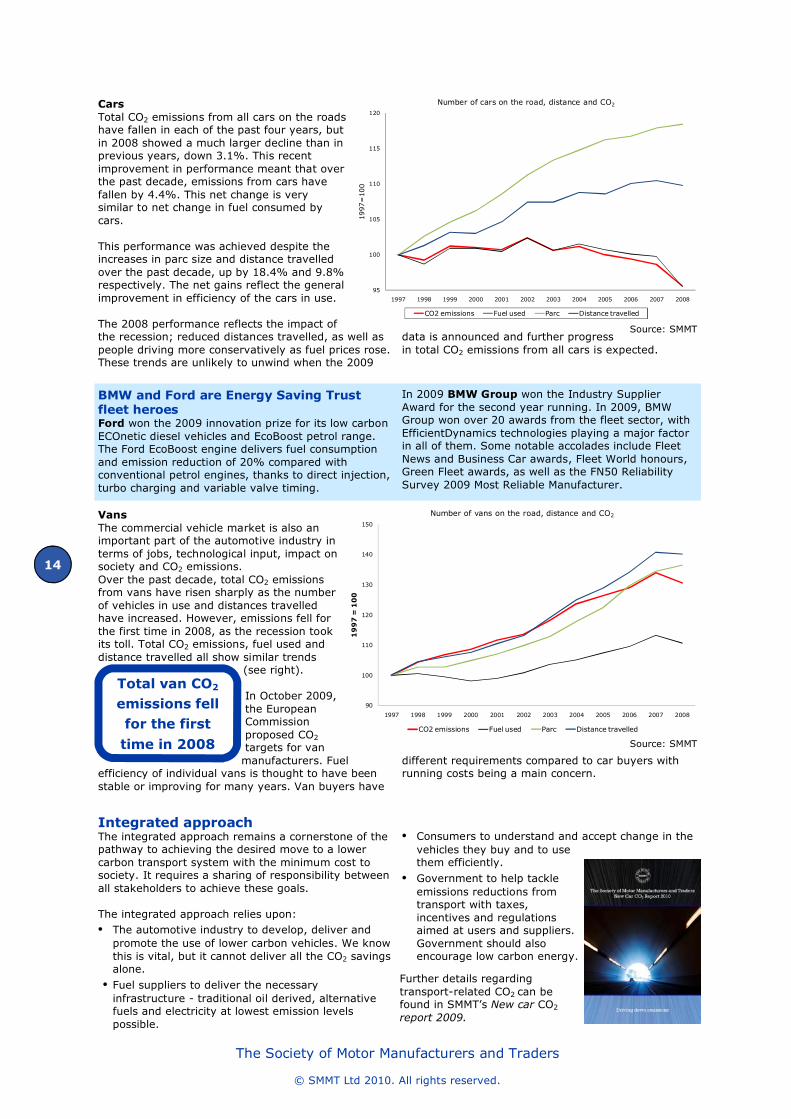
Cars
Total CO2 emissions from all cars on the roads have fallen in each of the past four years, but in 2008 showed a much larger decline than in previous years, down 3.1%. This recent improvement in performance meant that over the past decade, emissions from cars have fallen by 4.4%. This net change is very similar to net change in fuel consumed by cars. This performance was achieved despite the increases in parc size and distance travelled over the past decade, up by 18.4% and 9.8% respectively. The net gains reflect the general improvement in efficiency of the cars in use. The 2008 performance reflects the impact of the recession; reduced distances travelled, as well as people driving more conservatively as fuel prices rose. These trends are unlikely to unwind when the 2009
data is announced and further progress in total CO2 emissions from all cars is expected.
Vans
The commercial vehicle market is also an important part of the automotive industry in terms of jobs, technological input, impact on society and CO2 emissions. Over the past decade, total CO2 emissions from vans have risen sharply as the number of vehicles in use and distances travelled have increased. However, emissions fell for the first time in 2008, as the recession took its toll. Total CO2 emissions, fuel used and distance travelled all show similar trends
(see right). In October 2009, the European Commission proposed CO2 targets for van manufacturers. Fuel
efficiency of individual vans is thought to have been stable or improving for many years. Van buyers have
different requirements compared to car buyers with running costs being a main concern.
BMW and Ford are Energy Saving Trust fleet heroes Ford won the 2009 innovation prize for its low carbon ECOnetic diesel vehicles and EcoBoost petrol range. The Ford EcoBoost engine delivers fuel consumption and emission reduction of 20% compared with conventional petrol engines, thanks to direct injection, turbo charging and variable valve timing.
In 2009 BMW Group won the Industry Supplier Award for the second year running. In 2009, BMW Group won over 20 awards from the fleet sector, with EfficientDynamics technologies playing a major factor in all of them. Some notable accolades include Fleet News and Business Car awards, Fleet World honours, Green Fleet awards, as well as the FN50 Reliability Survey 2009 Most Reliable Manufacturer.
Integrated approach The integrated approach remains a cornerstone of the pathway to achieving the desired move to a lower carbon transport system with the minimum cost to society. It requires a sharing of responsibility between all stakeholders to achieve these goals.
The integrated approach relies upon: • The automotive industry to develop, deliver and
promote the use of lower carbon vehicles. We know this is vital, but it cannot deliver all the CO2 savings alone.
• Fuel suppliers to deliver the necessary infrastructure - traditional oil derived, alternative fuels and electricity at lowest emission levels possible.
• Consumers to understand and accept change in the vehicles they buy and to use them efficiently.
• Government to help tackle emissions reductions from transport with taxes, incentives and regulations aimed at users and suppliers. Government should also encourage low carbon energy.
Further details regarding transport-related CO2 can be found in SMMT’s New car CO2
report 2009.
Total van CO2
emissions fell
for the first
time in 2008
Source: SMMT
Source: SMMT
95
100
105
110
115
120
1997 1998 1999 2000 2001 2002 2003 2004 2005 2006 2007 2008
1997=100
Number of cars on the road, distance and CO2
CO2 emissions Fuel used Parc Distance travelled
90
100
110
120
130
140
150
1997 1998 1999 2000 2001 2002 2003 2004 2005 2006 2007 2008
1997 = 100
Number of vans on the road, distance and CO2
CO2 emissions Fuel used Parc Distance travelled
15
The Society of Motor Manufacturers and Traders
© SMMT Ltd 2010. All rights reserved.
Diesel vehicles
SMMT’s 2008 CO2 report showed that diesel variants, on a like-for-like power rating, emit 10-20% less CO2 than petrol-fuelled variants. Since 2000, a key trend in the UK market has been the shift towards diesels. However, in 2009, diesel penetration fell for the first time since 1999. An important factor is the Scrappage Incentive Scheme (SIS). Diesels only accounted for 16.1% of cars bought through the SIS in 2009, compared to 41.7% of all registrations.
On a sales-weighted basis the performance was very similar, with CO2 emissions from petrol cars averaging 0.5% lower at 148.7g/km, than diesel’s 151.2g/km in 2009. The graph shows that the gap has closed in recent years, but 2009 was the first year with average CO2 emissions from petrol cars below the diesel average. This can also be explained by the SIS, which saw consumers favouring petrol models, especially from the mini and supermini segments. Average new car CO2 emissions of petrol and diesel cars fell by 6.6% and 3.8% respectively in 2009.
Since 1997, petrol car emissions have come down by 21.9% and diesel cars by 19.0%.
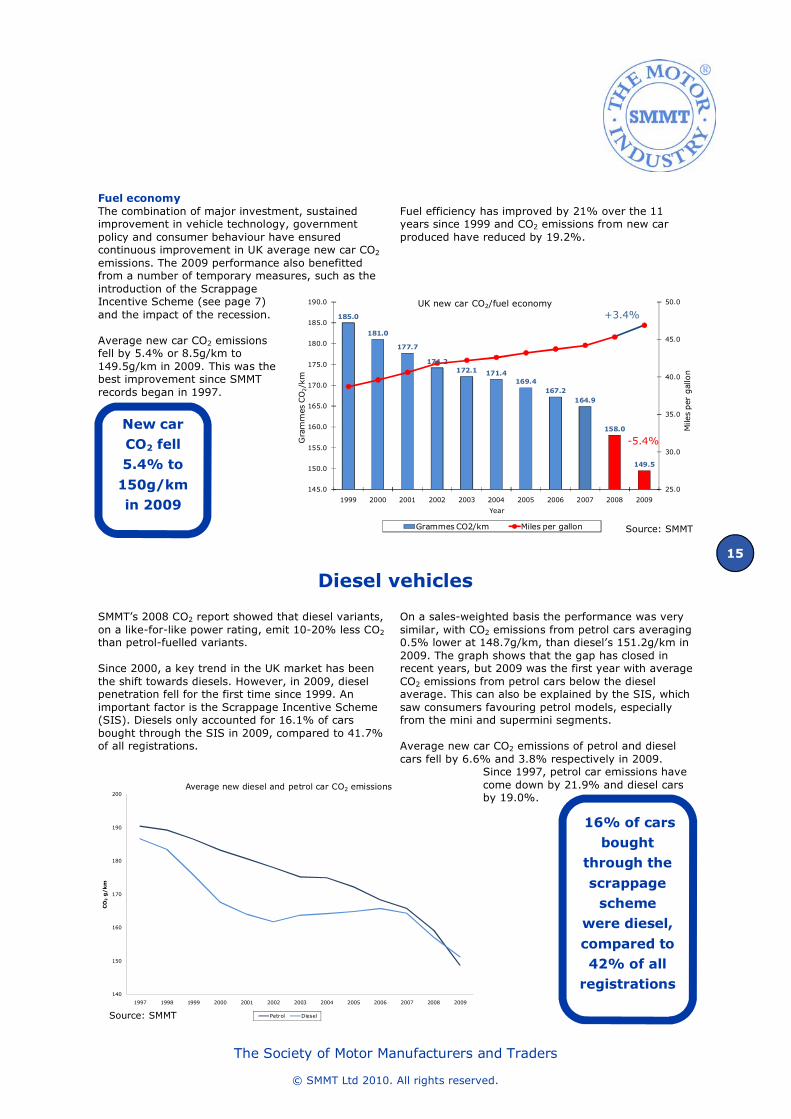
Fuel economy
The combination of major investment, sustained improvement in vehicle technology, government policy and consumer behaviour have ensured continuous improvement in UK average new car CO2 emissions. The 2009 performance also benefitted from a number of temporary measures, such as the introduction of the Scrappage Incentive Scheme (see page 7) and the impact of the recession. Average new car CO2 emissions fell by 5.4% or 8.5g/km to 149.5g/km in 2009. This was the best improvement since SMMT records began in 1997.
Fuel efficiency has improved by 21% over the 11 years since 1999 and CO2 emissions from new car produced have reduced by 19.2%.
New car
CO2 fell
5.4% to
150g/km
in 2009
16% of cars
bought
through the
scrappage
scheme
were diesel,
compared to
42% of all
registrations
185.0
181.0
177.7
174.2
172.1 171.4
169.4
167.2
164.9
158.0
149.5
25.0
30.0
35.0
40.0
45.0
50.0
145.0
150.0
155.0
160.0
165.0
170.0
175.0
180.0
185.0
190.0
1999 2000 2001 2002 2003 2004 2005 2006 2007 2008 2009
Miles per gallon
Grammes CO2/km
Year
UK new car CO2/fuel economy
Grammes CO2/km Miles per gallon
-5.4%
+3.4%
Source: SMMT
140
150
160
170
180
190
200
1997 1998 1999 2000 2001 2002 2003 2004 2005 2006 2007 2008 2009
CO2g/km
Average new diesel and petrol car CO2 emissions
Petrol DieselSource: SMMT
16
The Society of Motor Manufacturers and Traders
© SMMT Ltd 2010. All rights reserved.
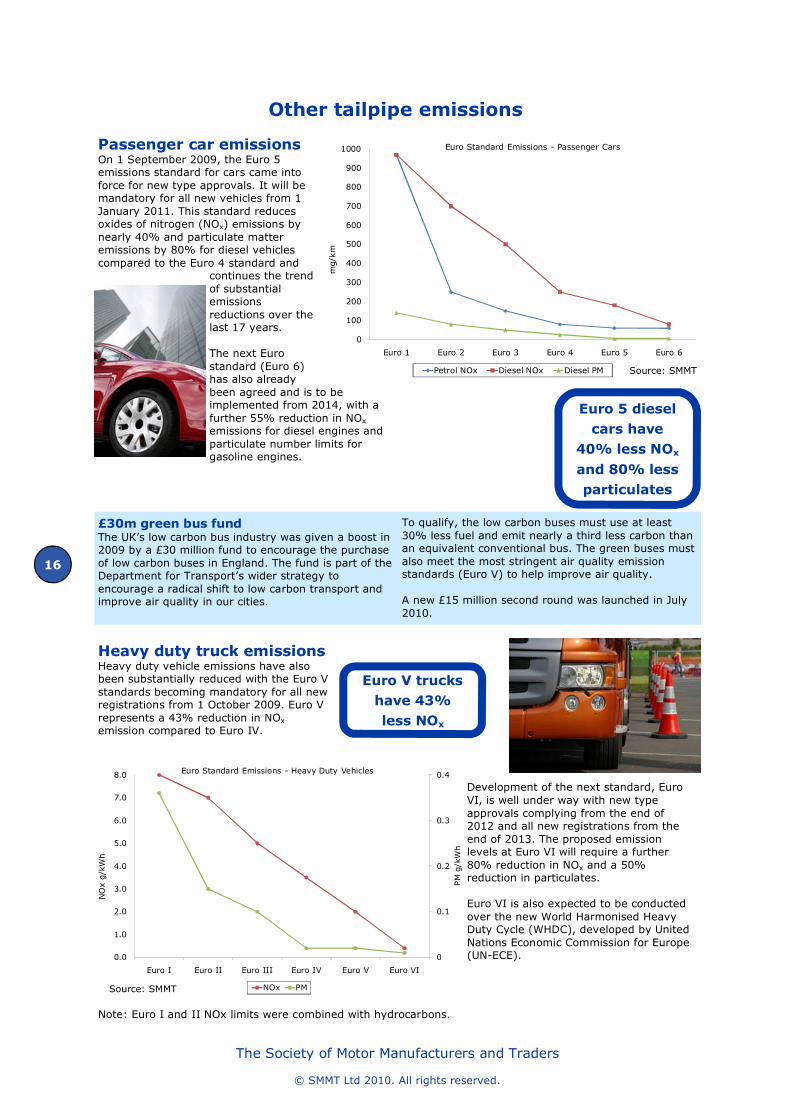
Other tailpipe emissions
Passenger car emissions On 1 September 2009, the Euro 5 emissions standard for cars came into force for new type approvals. It will be mandatory for all new vehicles from 1
January 2011. This standard reduces oxides of nitrogen (NOx) emissions by nearly 40% and particulate matter emissions by 80% for diesel vehicles compared to the Euro 4 standard and
continues the trend of substantial emissions reductions over the last 17 years. The next Euro standard (Euro 6) has also already been agreed and is to be implemented from 2014, with a further 55% reduction in NOx emissions for diesel engines and particulate number limits for gasoline engines.
Heavy duty truck emissions Heavy duty vehicle emissions have also been substantially reduced with the Euro V standards becoming mandatory for all new registrations from 1 October 2009. Euro V represents a 43% reduction in NOx emission compared to Euro IV.
Development of the next standard, Euro VI, is well under way with new type approvals complying from the end of 2012 and all new registrations from the end of 2013. The proposed emission levels at Euro VI will require a further 80% reduction in NOx and a 50% reduction in particulates. Euro VI is also expected to be conducted over the new World Harmonised Heavy Duty Cycle (WHDC), developed by United Nations Economic Commission for Europe (UN-ECE).
Note: Euro I and II NOx limits were combined with hydrocarbons.
£30m green bus fund The UK’s low carbon bus industry was given a boost in 2009 by a £30 million fund to encourage the purchase of low carbon buses in England. The fund is part of the Department for Transport’s wider strategy to encourage a radical shift to low carbon transport and improve air quality in our cities.
To qualify, the low carbon buses must use at least 30% less fuel and emit nearly a third less carbon than an equivalent conventional bus. The green buses must also meet the most stringent air quality emission standards (Euro V) to help improve air quality. A new £15 million second round was launched in July 2010.
0
100
200
300
400
500
600
700
800
900
1000
Euro 1 Euro 2 Euro 3 Euro 4 Euro 5 Euro 6
mg/km
Euro Standard Emissions - Passenger Cars
Petrol NOx Diesel NOx Diesel PM
Euro 5 diesel
cars have
40% less NOx
and 80% less
particulates
Euro V trucks
have 43%
less NOx
Source: SMMT
Source: SMMT
0
0.1
0.2
0.3
0.4
0.0
1.0
2.0
3.0
4.0
5.0
6.0
7.0
8.0
Euro I Euro II Euro III Euro IV Euro V Euro VI
PM g/kWh
NOx g/kWh
Euro Standard Emissions - Heavy Duty Vehicles
NOx PM
17
The Society of Motor Manufacturers and Traders
© SMMT Ltd 2010. All rights reserved.
Alternatively fuelled and advanced propulsion vehicles Biofuels The Renewable Fuels Agency published its second report on the Renewable Transport Fuels Obligation (RTFO) covering the first full year of the obligation to April 2009 in the UK(5). The report highlights that 1,284 million litres of biofuel were supplied during the year, amounting to 2.7% of transport fuels and ahead of the target for 2008/9 of 2.5%. For the next year
the target increases to 3.25%. Of the biofuel supplied, 82% was biodiesel and the biofuel had an average greenhouse gas saving of 46% over fossil fuel, ahead of the 40% target. 99% of feedstocks sourced from the UK met the approved environmental sustainability standard. Unfortunately only 24% of the total feedstocks used met the standard, behind the target of 40%. The main feedstocks were soy (35%),
oil seed rape (25%) and sugar cane (14%), with the majority of supplies coming from US (32%), Brazil (15%) and Germany (10%). The Treasury announced that from April 2010, the 20p/litre duty differential for biofuels would be removed for all biofuels, except used cooking oil. This made it uneconomical to continue supplying high blend fuels such as E85 and B30 and they have been withdrawn from the market entirely. It is expected that prices for standard road fuels, which contain up to 5% ethanol or 7% biodiesel, will also rise as a result of the increased cost of the bio-content. SMMT considers this to be an unhelpful development given the importance of biofuels to the fight against climate change and the embryonic state of the supply industry.
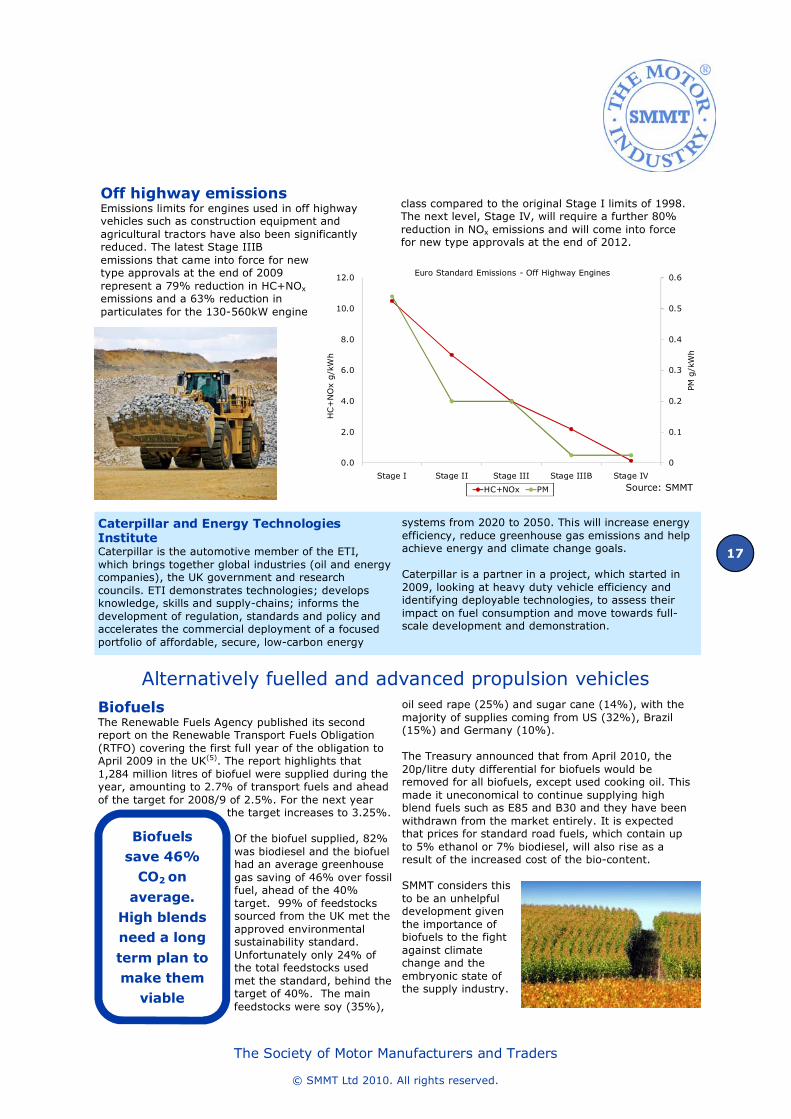
Off highway emissions Emissions limits for engines used in off highway vehicles such as construction equipment and agricultural tractors have also been significantly reduced. The latest Stage IIIB emissions that came into force for new type approvals at the end of 2009 represent a 79% reduction in HC+NOx emissions and a 63% reduction in particulates for the 130-560kW engine
class compared to the original Stage I limits of 1998. The next level, Stage IV, will require a further 80% reduction in NOx emissions and will come into force for new type approvals at the end of 2012.
Caterpillar and Energy Technologies Institute Caterpillar is the automotive member of the ETI, which brings together global industries (oil and energy companies), the UK government and research councils. ETI demonstrates technologies; develops knowledge, skills and supply-chains; informs the development of regulation, standards and policy and accelerates the commercial deployment of a focused portfolio of affordable, secure, low-carbon energy
systems from 2020 to 2050. This will increase energy efficiency, reduce greenhouse gas emissions and help achieve energy and climate change goals. Caterpillar is a partner in a project, which started in 2009, looking at heavy duty vehicle efficiency and identifying deployable technologies, to assess their impact on fuel consumption and move towards full-scale development and demonstration.
Biofuels
save 46%
CO2 on
average.
High blends
need a long
term plan to
make them
viable
Source: SMMT
0
0.1
0.2
0.3
0.4
0.5
0.6
0.0
2.0
4.0
6.0
8.0
10.0
12.0
Stage I Stage II Stage III Stage IIIB Stage IV
PM g/kWh
HC+NOx g/kWh
Euro Standard Emissions - Off Highway Engines
HC+NOx PM
18
The Society of Motor Manufacturers and Traders
© SMMT Ltd 2010. All rights reserved.
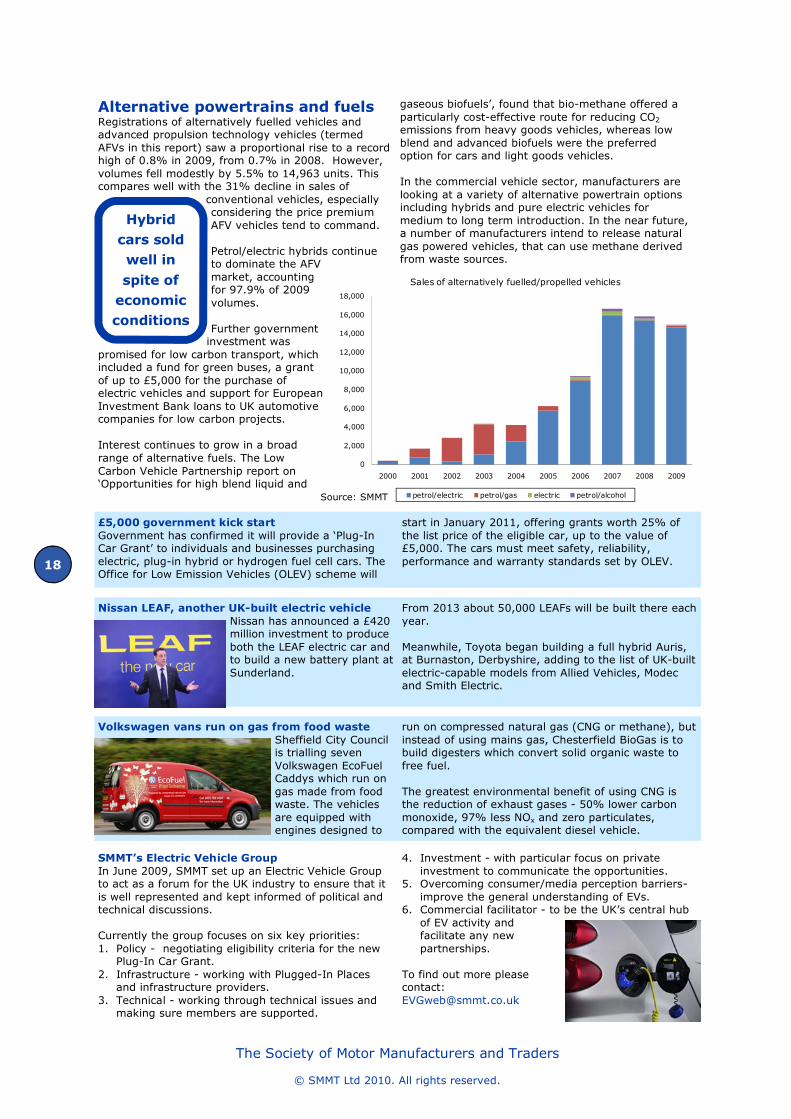
Alternative powertrains and fuels Registrations of alternatively fuelled vehicles and advanced propulsion technology vehicles (termed AFVs in this report) saw a proportional rise to a record high of 0.8% in 2009, from 0.7% in 2008. However, volumes fell modestly by 5.5% to 14,963 units. This compares well with the 31% decline in sales of
conventional vehicles, especially considering the price premium AFV vehicles tend to command. Petrol/electric hybrids continue to dominate the AFV market, accounting for 97.9% of 2009 volumes. Further government investment was
promised for low carbon transport, which included a fund for green buses, a grant of up to £5,000 for the purchase of electric vehicles and support for European Investment Bank loans to UK automotive companies for low carbon projects. Interest continues to grow in a broad range of alternative fuels. The Low Carbon Vehicle Partnership report on ‘Opportunities for high blend liquid and
gaseous biofuels’, found that bio-methane offered a particularly cost-effective route for reducing CO2 emissions from heavy goods vehicles, whereas low blend and advanced biofuels were the preferred option for cars and light goods vehicles. In the commercial vehicle sector, manufacturers are looking at a variety of alternative powertrain options including hybrids and pure electric vehicles for medium to long term introduction. In the near future, a number of manufacturers intend to release natural gas powered vehicles, that can use methane derived from waste sources.
SMMT’s Electric Vehicle Group In June 2009, SMMT set up an Electric Vehicle Group to act as a forum for the UK industry to ensure that it is well represented and kept informed of political and technical discussions. Currently the group focuses on six key priorities: 1. Policy - negotiating eligibility criteria for the new
Plug-In Car Grant. 2. Infrastructure - working with Plugged-In Places
and infrastructure providers. 3. Technical - working through technical issues and
making sure members are supported.
4. Investment - with particular focus on private investment to communicate the opportunities.
5. Overcoming consumer/media perception barriers-improve the general understanding of EVs.
6. Commercial facilitator - to be the UK’s central hub of EV activity and facilitate any new partnerships.
To find out more please contact: [email protected]
£5,000 government kick start
Government has confirmed it will provide a ‘Plug-In Car Grant’ to individuals and businesses purchasing electric, plug-in hybrid or hydrogen fuel cell cars. The Office for Low Emission Vehicles (OLEV) scheme will
start in January 2011, offering grants worth 25% of the list price of the eligible car, up to the value of £5,000. The cars must meet safety, reliability, performance and warranty standards set by OLEV.
Volkswagen vans run on gas from food waste
Sheffield City Council is trialling seven Volkswagen EcoFuel Caddys which run on gas made from food waste. The vehicles are equipped with engines designed to
run on compressed natural gas (CNG or methane), but instead of using mains gas, Chesterfield BioGas is to build digesters which convert solid organic waste to free fuel. The greatest environmental benefit of using CNG is the reduction of exhaust gases - 50% lower carbon monoxide, 97% less NOx and zero particulates, compared with the equivalent diesel vehicle.
Hybrid
cars sold
well in
spite of
economic
conditions
Nissan LEAF, another UK-built electric vehicle
Nissan has announced a £420 million investment to produce both the LEAF electric car and to build a new battery plant at Sunderland.
From 2013 about 50,000 LEAFs will be built there each year. Meanwhile, Toyota began building a full hybrid Auris, at Burnaston, Derbyshire, adding to the list of UK-built electric-capable models from Allied Vehicles, Modec and Smith Electric.
0
2,000
4,000
6,000
8,000
10,000
12,000
14,000
16,000
18,000
2000 2001 2002 2003 2004 2005 2006 2007 2008 2009
Sales of alternatively fuelled/propelled vehicles
petrol/electric petrol/gas electric petrol/alcoholSource: SMMT
19
The Society of Motor Manufacturers and Traders
© SMMT Ltd 2010. All rights reserved.
Road and vehicle safety
General Motors is first manufacturer to join at-
work driving safety campaign GM has become the first motor company to join the government-backed ‘Driving for Better Business’ campaign, which is delivered by RoadSafe. After boosting its occupational road risk management measures five years ago with the launch of its ‘Safe Driving Programme’, the company has introduced a string of initiatives that has resulted in halving the number of road crashes involving vehicles on its 600-strong fleet and a 20% cut in annual insurance premiums.
GM’s ‘Safe Driving Programme’ covers its 600 employees who drive around 20-25,000 miles a year in company cars. Additionally, many of the initiatives also extend to the company’s 5,400 other employees who clock up private miles and are part of the company’s Car Plan scheme. In the future, GM is looking to introduce compulsory eye-sight testing for all drivers, an online driver training programme for families of all drivers, whether they travel on business or not, and to share its best practice with more customers and suppliers.
Britain’s roads are among the safest in the world. In 2009, the number of people killed in road accidents reported to the police fell by 12%, from 2,538 in 2008 to 2,222 in 2009(6).Innovations at national and regional levels have helped achieve this. New vehicles, with increasing levels of passive and active safety features, have played a major role in reducing deaths among car occupants, where there has been a 16% reduction between 2008 and 2009(6).Continual vehicle safety enhancements are set to reduce these casualty levels even further. This rapid improvement of primary safety systems using new technology, as well as enhanced crash protection, has already been an important contributor to casualty reduction. One of the most effective and now widely available is electronic stability control (ESC), which regulates a vehicle’s braking to prevent skidding and enable accident avoidance, and can prevent 40% of crashes. It is an enabling technology, as it supports many other new lifesaving electronic safety (eSafety) technologies, including warning and emergency braking systems. Other systems designed to inform drivers and prevent or mitigate crashes include: • Blind spot monitoring.
• Lane support systems.
• Automatic speed alert.
• Adaptive headlights.
• Tyre pressure monitoring systems (TPMS). The automotive industry has led the way in improving vehicle safety by bringing these technologies to market. As a result, manufacturers are enabling fleets to adopt these technologies well ahead of legislation. For example, ESC is now widely available, but does
not become mandatory in new models until 2012, and in every new vehicle produced by 2014. However, there remains a low level of customer awareness of these systems despite investment in promotional campaigns supported by the industry. Of the many factors affecting road safety, driver behaviour is key. Despite improvements in driver training and testing, young drivers remain ‘high risk’. One in five novices crashes within the first six months of driving(7). Young drivers remain a concern for the industry, and many manufacturers are involved in measures to increase awareness, improve skills and reduce casualties. Those who drive for work also pose a high risk, as up to one third of all crashes occur when the driver travelling for business. Through RoadSafe, the industry also supports the government-backed Driving for Better Business Campaign, to raise awareness of the importance of work-related road safety in the business community and public sector, by using advocates drawn from these communities to promote the business benefits of managing it effectively.
RoadSafe is acknowledged as a leading forum for promoting and devising solutions to road safety problems. Its mission is to reduce road deaths and injuries by supporting and encouraging partnerships between the motor industry and related companies, traffic engineers, the police, public health authorities and road safety professionals. Through these partnerships, RoadSafe promotes the safe design and use of vehicles and roads by sharing knowledge and encouraging innovation.
PSA Peugeot Citroën uses telematics to improve
user safety At end-2009, 630,000 Peugeots and Citroëns on the road were equipped with an emergency call system in
the nine European countries where the service is available. If the vehicle’s airbags or pyrotechnic seat belts are triggered, it automatically transmits an
emergency call. PEUGEOT CONNECT SOS then locates the car, contacts the passenger by phone in his/her own language and arranges for the appropriate emergency assistance to be despatched as required. Peugeot plans to have one million vehicles on the road in Europe with the emergency call system in 2011.
20
The Society of Motor Manufacturers and Traders
© SMMT Ltd 2010. All rights reserved.
Vehicle end-of-life phase
Key facts:
• 85% recovery target achieved for ELVs across the UK in 2008, an increase of 67,477t over 2007.
• Vehicle manufacturers’ contracted networks have achieved 85% recovery since 2006.
• A new vehicle registration document (V5C) will help reduce the number of scrap cars falling into the hands of illegal operators.
• Investments in ELV infrastructure coming through to enable 95% recovery in 2015.
85% ELV re-use, recycling and recovery
The latest data reported by government shows the UK achieved 85% re-use, recycling and recovery of end-of-life vehicles (ELVs) in 2008, representing an increase of 67,477 tonnes over the previous year (84.2%). The UK’s overall result of 85% is calculated from the recovery/recycling achieved by the networks
contracted to manufacturers and non-contracted facilities. Vehicle manufacturers’ approved networks of authorised treatment facilities (ATFs) have achieved the 85% EU target each year from 2006 to 2009.
95% recovery in 2015 - an integrated approach
The ambitious 95% re-use, recycling and recovery European target for 2015 can only be met with an integrated approach - where all stakeholders work together, in particular manufacturers, governments and the recycling industry. Car manufacturers accept responsibility for their products by complying with the RRR-Directive 2005/64/EC, which ensures the recyclability and recoverability of their products. In addition, the following specific actions are required to ensure that the 2015 target can be met: 1. Harmonise legislation. National recycling definitions must follow the definition given by the waste framework directive. There should be no constraint for acceptance of applications with regard to definition of recycling throughout EU Member States. As an example, the use of plastic granules as a
reducing agent in a blast furnaces should be classed as recycling. 2. Harmonise and establish quota calculation
systems. Use fixed assumptions for those fractions of ELVs which are constant, like metals, oils and other fluids, tyres and non-metallic re-use. 3. Use of existing infrastructure. Select most professional and efficient operators for ELV collection and treatment. 4. Enforce landfill ban. This will help directing shredder and post-shredder material streams into recycling and energy recovery routes. If it is prohibited to dispose of more than 5% in landfills there will be more pressure to build a recycling and recovery infrastructure and to increase the performance of the whole recycling chain. 5. Put pressure on unauthorised facilities. They increase the risk of non-achievement of quotas, by undermining the legitimate facilities.
Investing for 2015
Preparing the ground for meeting the European Directive’s 95% recovery target in 2015, a major metal recycler has been granted planning permission for two gasification plants in Bootle, Merseyside and Oldbury, West Midlands this year. Each plant will have capacity to process nearly 140,000tpa of post-shredder residue, known as automotive shredder residue (ASR), each producing
30MWh of electricity. The Oldbury plant will be principally supplied by ASR delivered by rail. The Bootle site is already home to one of the biggest shredders in the world. It would be able to recover 22,800 tonnes of recyclates, including copper, ferrous metals, glass, aluminium and aggregates using plastics and magnetic separation and much of the remainder will count as energy recovery(9).
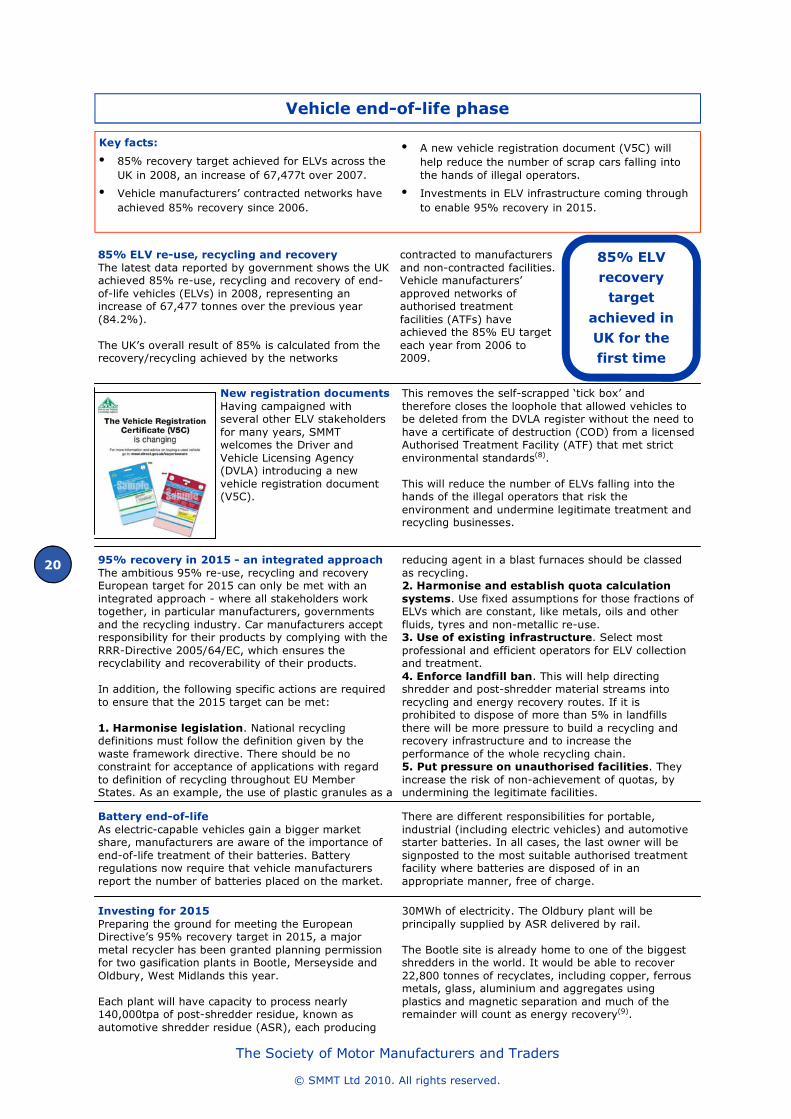
New registration documents
Having campaigned with several other ELV stakeholders for many years, SMMT welcomes the Driver and Vehicle Licensing Agency (DVLA) introducing a new vehicle registration document (V5C).
This removes the self-scrapped ‘tick box’ and therefore closes the loophole that allowed vehicles to be deleted from the DVLA register without the need to have a certificate of destruction (COD) from a licensed Authorised Treatment Facility (ATF) that met strict environmental standards(8). This will reduce the number of ELVs falling into the hands of the illegal operators that risk the environment and undermine legitimate treatment and recycling businesses.
85% ELV
recovery
target
achieved in
UK for the
first time
Battery end-of-life
As electric-capable vehicles gain a bigger market share, manufacturers are aware of the importance of end-of-life treatment of their batteries. Battery regulations now require that vehicle manufacturers report the number of batteries placed on the market.
There are different responsibilities for portable, industrial (including electric vehicles) and automotive starter batteries. In all cases, the last owner will be signposted to the most suitable authorised treatment facility where batteries are disposed of in an appropriate manner, free of charge.
21
The Society of Motor Manufacturers and Traders
© SMMT Ltd 2010. All rights reserved.
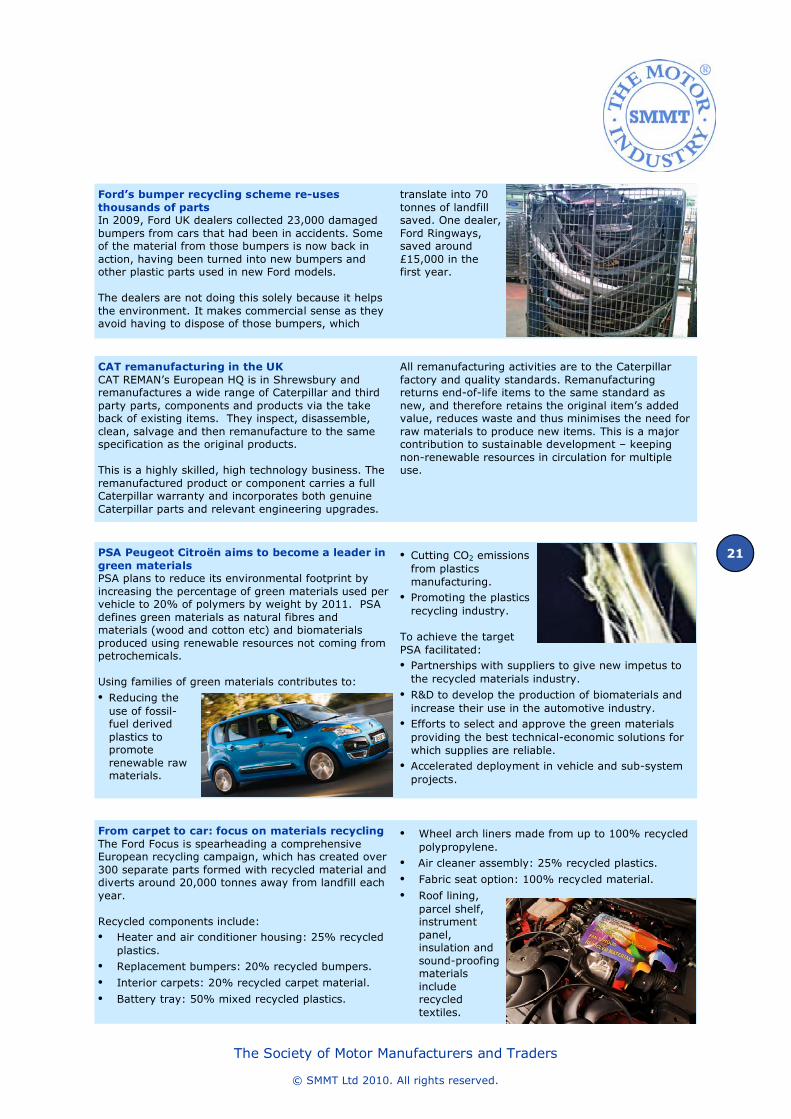
Ford’s bumper recycling scheme re-uses
thousands of parts In 2009, Ford UK dealers collected 23,000 damaged bumpers from cars that had been in accidents. Some of the material from those bumpers is now back in action, having been turned into new bumpers and other plastic parts used in new Ford models. The dealers are not doing this solely because it helps the environment. It makes commercial sense as they avoid having to dispose of those bumpers, which
translate into 70 tonnes of landfill saved. One dealer, Ford Ringways, saved around £15,000 in the first year.
CAT remanufacturing in the UK
CAT REMAN’s European HQ is in Shrewsbury and remanufactures a wide range of Caterpillar and third party parts, components and products via the take back of existing items. They inspect, disassemble, clean, salvage and then remanufacture to the same specification as the original products. This is a highly skilled, high technology business. The remanufactured product or component carries a full Caterpillar warranty and incorporates both genuine Caterpillar parts and relevant engineering upgrades.
All remanufacturing activities are to the Caterpillar factory and quality standards. Remanufacturing returns end-of-life items to the same standard as new, and therefore retains the original item’s added value, reduces waste and thus minimises the need for raw materials to produce new items. This is a major contribution to sustainable development – keeping non-renewable resources in circulation for multiple use.
PSA Peugeot Citroën aims to become a leader in
green materials PSA plans to reduce its environmental footprint by increasing the percentage of green materials used per vehicle to 20% of polymers by weight by 2011. PSA defines green materials as natural fibres and materials (wood and cotton etc) and biomaterials produced using renewable resources not coming from petrochemicals. Using families of green materials contributes to:
• Reducing the use of fossil-fuel derived plastics to promote renewable raw materials.
• Cutting CO2 emissions from plastics manufacturing.
• Promoting the plastics recycling industry.
To achieve the target PSA facilitated: • Partnerships with suppliers to give new impetus to the recycled materials industry.
• R&D to develop the production of biomaterials and increase their use in the automotive industry.
• Efforts to select and approve the green materials providing the best technical-economic solutions for which supplies are reliable.
• Accelerated deployment in vehicle and sub-system projects.
From carpet to car: focus on materials recycling
The Ford Focus is spearheading a comprehensive European recycling campaign, which has created over 300 separate parts formed with recycled material and diverts around 20,000 tonnes away from landfill each year. Recycled components include: • Heater and air conditioner housing: 25% recycled
plastics.
• Replacement bumpers: 20% recycled bumpers.
• Interior carpets: 20% recycled carpet material.
• Battery tray: 50% mixed recycled plastics.
• Wheel arch liners made from up to 100% recycled polypropylene.
• Air cleaner assembly: 25% recycled plastics.
• Fabric seat option: 100% recycled material.
• Roof lining, parcel shelf, instrument panel, insulation and sound-proofing materials include recycled textiles.
22
The Society of Motor Manufacturers and Traders
© SMMT Ltd 2010. All rights reserved.
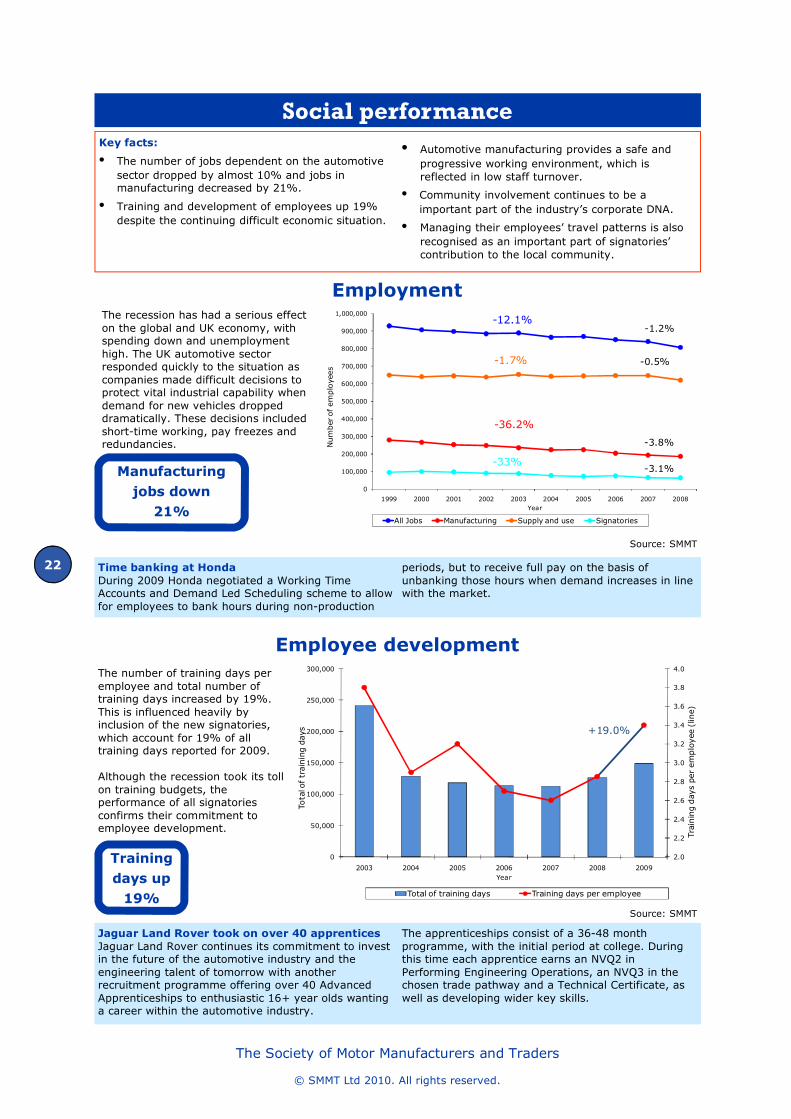
Social performance Key facts:
• The number of jobs dependent on the automotive sector dropped by almost 10% and jobs in manufacturing decreased by 21%.
• Training and development of employees up 19% despite the continuing difficult economic situation.
• Automotive manufacturing provides a safe and progressive working environment, which is reflected in low staff turnover.
• Community involvement continues to be a important part of the industry’s corporate DNA.
• Managing their employees’ travel patterns is also recognised as an important part of signatories’ contribution to the local community.
Employee development
The number of training days per employee and total number of training days increased by 19%. This is influenced heavily by inclusion of the new signatories, which account for 19% of all training days reported for 2009. Although the recession took its toll on training budgets, the performance of all signatories confirms their commitment to employee development.
Employment The recession has had a serious effect on the global and UK economy, with spending down and unemployment high. The UK automotive sector responded quickly to the situation as companies made difficult decisions to protect vital industrial capability when demand for new vehicles dropped dramatically. These decisions included short-time working, pay freezes and redundancies.
Time banking at Honda
During 2009 Honda negotiated a Working Time Accounts and Demand Led Scheduling scheme to allow for employees to bank hours during non-production
periods, but to receive full pay on the basis of unbanking those hours when demand increases in line with the market.
Jaguar Land Rover took on over 40 apprentices
Jaguar Land Rover continues its commitment to invest in the future of the automotive industry and the engineering talent of tomorrow with another recruitment programme offering over 40 Advanced Apprenticeships to enthusiastic 16+ year olds wanting a career within the automotive industry.
The apprenticeships consist of a 36-48 month programme, with the initial period at college. During this time each apprentice earns an NVQ2 in Performing Engineering Operations, an NVQ3 in the chosen trade pathway and a Technical Certificate, as well as developing wider key skills.
2.0
2.2
2.4
2.6
2.8
3.0
3.2
3.4
3.6
3.8
4.0
0
50,000
100,000
150,000
200,000
250,000
300,000
2003 2004 2005 2006 2007 2008 2009
Training days per em
ployee (line)
Total of training days
Year
Total of training days Training days per employee
+19.0%
Training
days up
19%
Manufacturing
jobs down
21%
Source: SMMT
Source: SMMT
0
100,000
200,000
300,000
400,000
500,000
600,000
700,000
800,000
900,000
1,000,000
1999 2000 2001 2002 2003 2004 2005 2006 2007 2008
Number of em
ployees
Year
All Jobs Manufacturing Supply and use Signatories
-1.2%
-0.5%
-3.8%
-3.1%
-12.1%
-36.2%
-1.7%
-33%
23
The Society of Motor Manufacturers and Traders
© SMMT Ltd 2010. All rights reserved.
Professional development at Volkswagen Group VWG has a number of staff undertaking soft skills and technical training, professional qualifications (CIMA, AAT) and language courses across the organisation. VWG also offers an Institute of Leadership and Management (ILM) qualification after a Management Development Programme and a Professional Field
Force Award (PFFA) after completing a Field Force Development Programme. Over the last three years over 100 employees have attended the field force programmes and 39 have already successfully achieved the PFFA award.
Bentley is apprentice employer of the year
Bentley Motors’ successful apprenticeship programme was recognised at the National Apprentice Employer of the Year Awards for 2009. The company was highly commended for its commitment to developing its workforce through apprenticeships.
Bentley Motors employs 51 apprentices who follow a three to four year training programme across a number of disciplines. Apprentices undertake day release to a local college to complete the necessary academic qualifications and develop the required underpinning knowledge.
Leyland Trucks upskilling workforce
In 2009 around 125 assembly workers at Leyland Trucks had their skills and qualifications improved under the contract placed with Preston College. Each of the employees had a minimum three month programme of training and assessment leading to an NVQ Level 2 in Performing Manufacturing Operations or in Warehousing, Handling and Storage.
Assessors from Preston College had been at the Farington plant on a full-time basis to ensure that the key tasks covered by the chosen NVQ subject is to the required standard. This ‘on the job’ assessment had been complemented by other knowledge-based learning. Each employee is required to submit written evidence of his or her competence and knowledge of key factors related to their work.
Apprentices join the Rolls-Royce success story In 2009 Rolls-Royce Motor Cars offered permanent positions to nine of the company’s first year apprentices. All nine successfully completed three-year apprenticeships at the head office and manufacturing plant at Goodwood, West Sussex. The company’s apprenticeship programme was successfully launched in 2006 and has received applications from around the world. The programme provides people aged 16-24 with the opportunity of
an apprenticeship lasting for up to four years, which combines on-the-job training with studying for nationally recognised qualifications. The programme has been designed in conjunction with the Learning Skills Council (LSC), South East England Development Agency (SEEDA) and Chichester College.
New Ford workshop for dealership apprentice
technicians Since February 2009 Ford apprentice technicians in the South East can now learn the skills of their profession in a new Ford Workshop at Central Sussex College. Around 120 technicians on the Ford Masters Apprenticeship Programme will be trained in the new workshop while on block release at the college.
Ford has supplied three vehicles, engines, transmissions and tools to aid apprentices’ instruction in the workshop, where apprentices will be trained for four annual two-week blocks throughout their course.
Toyota leading the way to award success
Once again Toyota UK has won a regional award in the National Training Awards – the 2009 UK’s premier awards for training and development. The award, presented in recognition of our leadership training programme, recognises excellence and success through training. The leadership training programme
was developed together with an external training company to strengthen Toyota UK’s leadership capability. The ultimate aim was to provide supervisors with the opportunity to develop their soft skills and knowledge, enabling them to support teams, give direction and create a supportive environment.
Nissan trains long-term unemployed
In 2009, a pre-employment training course for the long-term unemployed was launched at Nissan in Sunderland. The five-week course forms part of Nissan’s commitment to the Local Employment Partnership signed last year with the UK government.
It provides individuals with the skills needed to apply for a manufacturing position at Nissan, or at one of its local suppliers. To date around 180 people have started work at the plant with a further 160 people on hold for an available position.
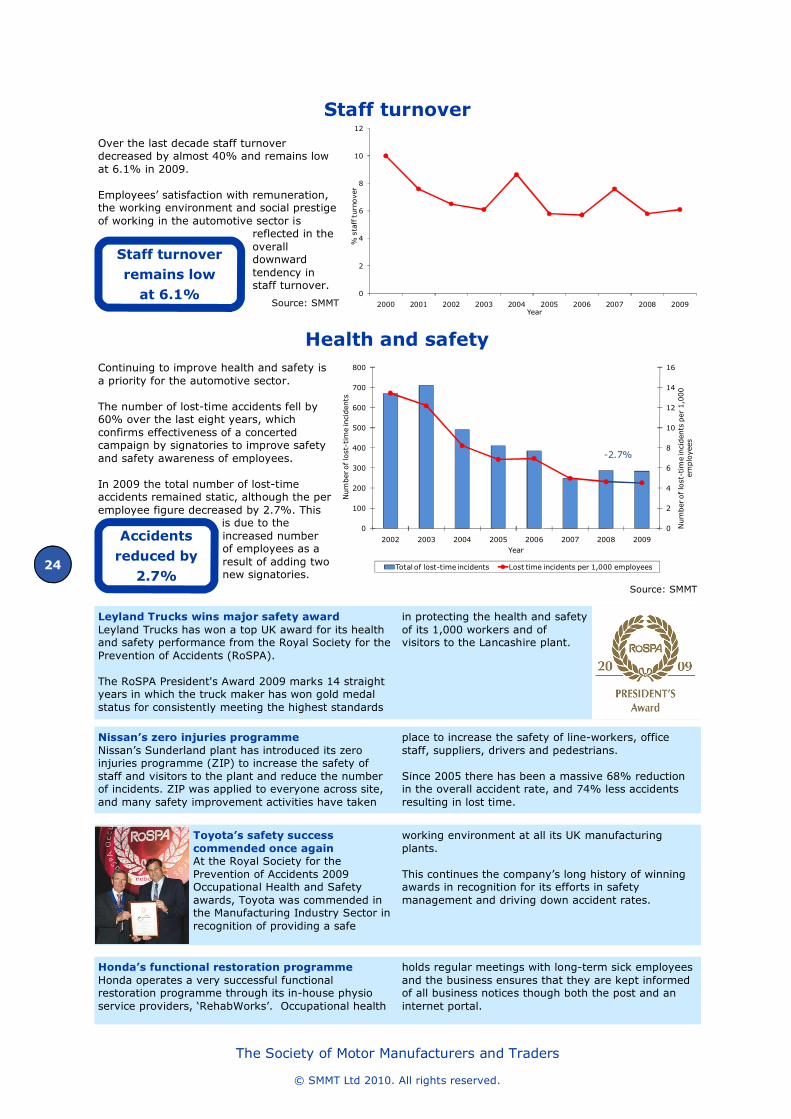
24
The Society of Motor Manufacturers and Traders
© SMMT Ltd 2010. All rights reserved.
Health and safety
Continuing to improve health and safety is a priority for the automotive sector. The number of lost-time accidents fell by 60% over the last eight years, which confirms effectiveness of a concerted campaign by signatories to improve safety and safety awareness of employees. In 2009 the total number of lost-time accidents remained static, although the per employee figure decreased by 2.7%. This
is due to the increased number of employees as a result of adding two new signatories.
Leyland Trucks wins major safety award Leyland Trucks has won a top UK award for its health and safety performance from the Royal Society for the Prevention of Accidents (RoSPA). The RoSPA President's Award 2009 marks 14 straight years in which the truck maker has won gold medal status for consistently meeting the highest standards
in protecting the health and safety of its 1,000 workers and of visitors to the Lancashire plant.
Over the last decade staff turnover decreased by almost 40% and remains low at 6.1% in 2009. Employees’ satisfaction with remuneration, the working environment and social prestige of working in the automotive sector is
reflected in the overall downward tendency in staff turnover.
Staff turnover
Honda’s functional restoration programme
Honda operates a very successful functional restoration programme through its in-house physio service providers, ‘RehabWorks’. Occupational health
holds regular meetings with long-term sick employees and the business ensures that they are kept informed of all business notices though both the post and an internet portal.
Staff turnover
remains low
at 6.1%
Accidents
reduced by
2.7%
Toyota’s safety success
commended once again At the Royal Society for the Prevention of Accidents 2009 Occupational Health and Safety awards, Toyota was commended in the Manufacturing Industry Sector in recognition of providing a safe
working environment at all its UK manufacturing plants. This continues the company’s long history of winning awards in recognition for its efforts in safety management and driving down accident rates.
Nissan’s zero injuries programme
Nissan’s Sunderland plant has introduced its zero injuries programme (ZIP) to increase the safety of staff and visitors to the plant and reduce the number of incidents. ZIP was applied to everyone across site, and many safety improvement activities have taken
place to increase the safety of line-workers, office staff, suppliers, drivers and pedestrians. Since 2005 there has been a massive 68% reduction in the overall accident rate, and 74% less accidents resulting in lost time.
0
2
4
6
8
10
12
2000 2001 2002 2003 2004 2005 2006 2007 2008 2009
% staff turnover
YearSource: SMMT
Source: SMMT
0
2
4
6
8
10
12
14
16
0
100
200
300
400
500
600
700
800
2002 2003 2004 2005 2006 2007 2008 2009
Number of lost-tim
e incidents per 1,000
employees
Number of lost-tim
e incidents
Year
Total of lost-time incidents Lost time incidents per 1,000 employees
-2.7%
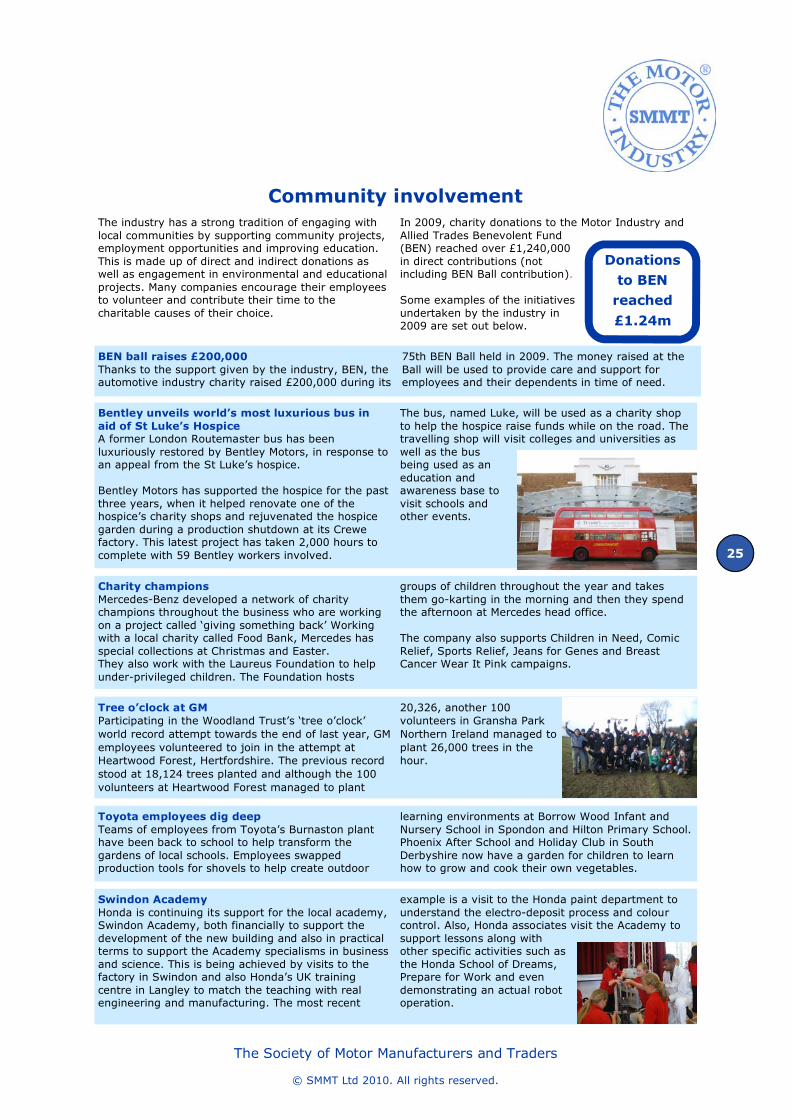
25
The Society of Motor Manufacturers and Traders
© SMMT Ltd 2010. All rights reserved.
Bentley unveils world’s most luxurious bus in
aid of St Luke’s Hospice A former London Routemaster bus has been luxuriously restored by Bentley Motors, in response to an appeal from the St Luke’s hospice. Bentley Motors has supported the hospice for the past three years, when it helped renovate one of the hospice’s charity shops and rejuvenated the hospice garden during a production shutdown at its Crewe factory. This latest project has taken 2,000 hours to complete with 59 Bentley workers involved.
The bus, named Luke, will be used as a charity shop to help the hospice raise funds while on the road. The travelling shop will visit colleges and universities as well as the bus being used as an education and awareness base to visit schools and other events.
Swindon Academy
Honda is continuing its support for the local academy, Swindon Academy, both financially to support the development of the new building and also in practical terms to support the Academy specialisms in business and science. This is being achieved by visits to the factory in Swindon and also Honda’s UK training centre in Langley to match the teaching with real engineering and manufacturing. The most recent
example is a visit to the Honda paint department to understand the electro-deposit process and colour control. Also, Honda associates visit the Academy to support lessons along with other specific activities such as the Honda School of Dreams, Prepare for Work and even demonstrating an actual robot operation.
Tree o’clock at GM
Participating in the Woodland Trust’s ‘tree o’clock’ world record attempt towards the end of last year, GM employees volunteered to join in the attempt at Heartwood Forest, Hertfordshire. The previous record stood at 18,124 trees planted and although the 100 volunteers at Heartwood Forest managed to plant
20,326, another 100 volunteers in Gransha Park Northern Ireland managed to plant 26,000 trees in the hour.
Charity champions
Mercedes-Benz developed a network of charity champions throughout the business who are working on a project called ‘giving something back’ Working with a local charity called Food Bank, Mercedes has special collections at Christmas and Easter. They also work with the Laureus Foundation to help under-privileged children. The Foundation hosts
groups of children throughout the year and takes them go-karting in the morning and then they spend the afternoon at Mercedes head office. The company also supports Children in Need, Comic Relief, Sports Relief, Jeans for Genes and Breast Cancer Wear It Pink campaigns.
Community involvement
The industry has a strong tradition of engaging with local communities by supporting community projects, employment opportunities and improving education. This is made up of direct and indirect donations as well as engagement in environmental and educational projects. Many companies encourage their employees to volunteer and contribute their time to the charitable causes of their choice.
In 2009, charity donations to the Motor Industry and Allied Trades Benevolent Fund (BEN) reached over £1,240,000 in direct contributions (not including BEN Ball contribution). Some examples of the initiatives undertaken by the industry in 2009 are set out below.
BEN ball raises £200,000
Thanks to the support given by the industry, BEN, the automotive industry charity raised £200,000 during its
75th BEN Ball held in 2009. The money raised at the Ball will be used to provide care and support for employees and their dependents in time of need.
Donations
to BEN
reached
£1.24m
Toyota employees dig deep Teams of employees from Toyota’s Burnaston plant have been back to school to help transform the gardens of local schools. Employees swapped production tools for shovels to help create outdoor
learning environments at Borrow Wood Infant and Nursery School in Spondon and Hilton Primary School. Phoenix After School and Holiday Club in South Derbyshire now have a garden for children to learn how to grow and cook their own vegetables.
26
The Society of Motor Manufacturers and Traders
© SMMT Ltd 2010. All rights reserved.
Greener commuting and business travel
BMW and MINI have Drivesense BMW and MINI have partnered with the Energy Saving Trust to provide a fleet of cars to support its ‘Smarter Driving’ programme. Smarter Driving is a course that lets organisations teach their employees the skills needed to drive more efficiently, for just £25 per person. By following the advice from the Energy Saving Trust, delivered through DriveSense, this smarter driving style can
save on average £250 per person per year in fuel and slash an individual’s CO2 emissions (based on annual average of 12,000 miles). The fleet of BMWs and MINIs is expected to help teach up to 26,000 people more economical driving techniques.
Vehicle manufacturers recognise that the impact of their activities is not just about ‘greening’ their production processes. Managing the travel patterns of their employees can have
an important contribution to reducing the social and environmental impact of travel in the local community. Our signatories have developed and supported systems to allow their employees and visitors to their facilities to choose between various modes of transport and minimising the need to travel.
Some of the many initiatives undertaken in 2009 are listed below:
• Coaches commuting daily between the major sites and nearest airport.
• Covered racking and parking for cycles/motorbikes and showers available for cyclists.
• Pool cars for travel within the sites and between other facilities in the area.
• Alternative and low emission vehicles used as pool cars.
• Provision for tele-working and other forms of flexible office working arrangements.
• Relocation packages to allow new recruits to live locally, where appropriate.
• Advice available to staff on sustainable travel issues using the most appropriate media to develop awareness and encourage car sharing, cycling, walking or other alternative methods of commuting.
• Business travel options: clear business travel policy, phone/e-mail and video conferencing.
• Encourage suppliers to locate close to production plants to minimise transport associated with deliveries.
• Car sharing
− Run by 234car.com - internet-based car sharing system that utilises ordinance survey technology to match journeys of employees registered in the system. A secure e-mail communicates potential matches to employees. The system is now in its seventh year of usage.
− Potential incentives to encourage lift sharing at a number of sites are being reviewed.
− Another system run by liftshare.com, an on-line system that matches partners based on post code and time.
− Emergency taxi cover (for home emergencies).
• Eco-driving
− Sponsoring UNEP Greener Driving Program (www.greener-driving.net).
− Launched a smarter driving challenge together with the Energy Saving Trust at six UK locations. Nearly 500 people participated and the challenge achieved an average 33.4% improvement in mpg.
• Promotion and incentive schemes, which include:
− Intranet site and newsletters.
− Token based incentive scheme.
− Prize draw card and sticker system.
− Weekly prize draw for £50 gift voucher.
− Monthly prize draw for £100 gift voucher.
Employee travel
patterns are an
important
environmental
aspect too
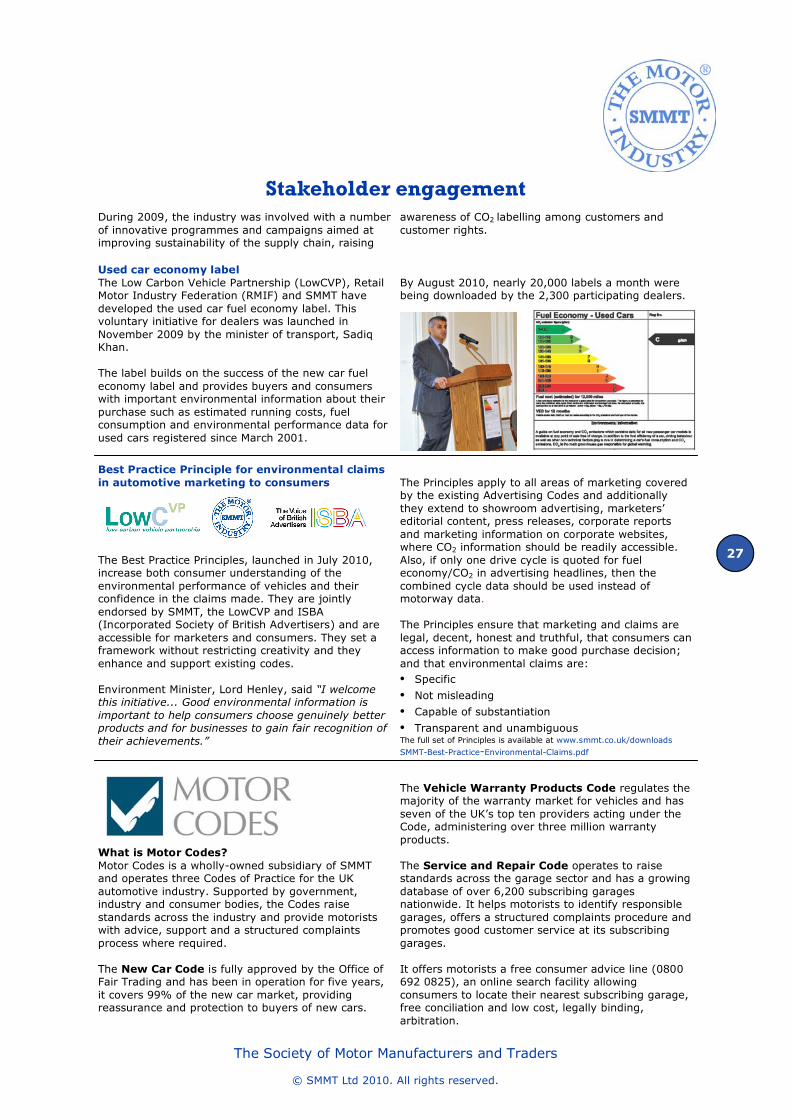
27
The Society of Motor Manufacturers and Traders
© SMMT Ltd 2010. All rights reserved.
Stakeholder engagement
Used car economy label The Low Carbon Vehicle Partnership (LowCVP), Retail Motor Industry Federation (RMIF) and SMMT have developed the used car fuel economy label. This voluntary initiative for dealers was launched in November 2009 by the minister of transport, Sadiq Khan. The label builds on the success of the new car fuel economy label and provides buyers and consumers with important environmental information about their purchase such as estimated running costs, fuel consumption and environmental performance data for used cars registered since March 2001.
By August 2010, nearly 20,000 labels a month were being downloaded by the 2,300 participating dealers.
Best Practice Principle for environmental claims
in automotive marketing to consumers
The Best Practice Principles, launched in July 2010, increase both consumer understanding of the environmental performance of vehicles and their confidence in the claims made. They are jointly endorsed by SMMT, the LowCVP and ISBA (Incorporated Society of British Advertisers) and are accessible for marketers and consumers. They set a framework without restricting creativity and they enhance and support existing codes. Environment Minister, Lord Henley, said “I welcome this initiative... Good environmental information is
important to help consumers choose genuinely better products and for businesses to gain fair recognition of
their achievements.”
The Principles apply to all areas of marketing covered by the existing Advertising Codes and additionally they extend to showroom advertising, marketers’ editorial content, press releases, corporate reports and marketing information on corporate websites, where CO2 information should be readily accessible. Also, if only one drive cycle is quoted for fuel economy/CO2 in advertising headlines, then the combined cycle data should be used instead of motorway data. The Principles ensure that marketing and claims are legal, decent, honest and truthful, that consumers can access information to make good purchase decision; and that environmental claims are: • Specific • Not misleading
• Capable of substantiation • Transparent and unambiguous The full set of Principles is available at www.smmt.co.uk/downloads
SMMT-Best-Practice-Environmental-Claims.pdf
What is Motor Codes?
Motor Codes is a wholly-owned subsidiary of SMMT and operates three Codes of Practice for the UK automotive industry. Supported by government, industry and consumer bodies, the Codes raise standards across the industry and provide motorists with advice, support and a structured complaints process where required. The New Car Code is fully approved by the Office of Fair Trading and has been in operation for five years, it covers 99% of the new car market, providing reassurance and protection to buyers of new cars.
The Vehicle Warranty Products Code regulates the majority of the warranty market for vehicles and has seven of the UK’s top ten providers acting under the Code, administering over three million warranty products. The Service and Repair Code operates to raise standards across the garage sector and has a growing database of over 6,200 subscribing garages nationwide. It helps motorists to identify responsible garages, offers a structured complaints procedure and promotes good customer service at its subscribing garages. It offers motorists a free consumer advice line (0800 692 0825), an online search facility allowing consumers to locate their nearest subscribing garage, free conciliation and low cost, legally binding, arbitration.
During 2009, the industry was involved with a number of innovative programmes and campaigns aimed at improving sustainability of the supply chain, raising
awareness of CO2 labelling among customers and customer rights.
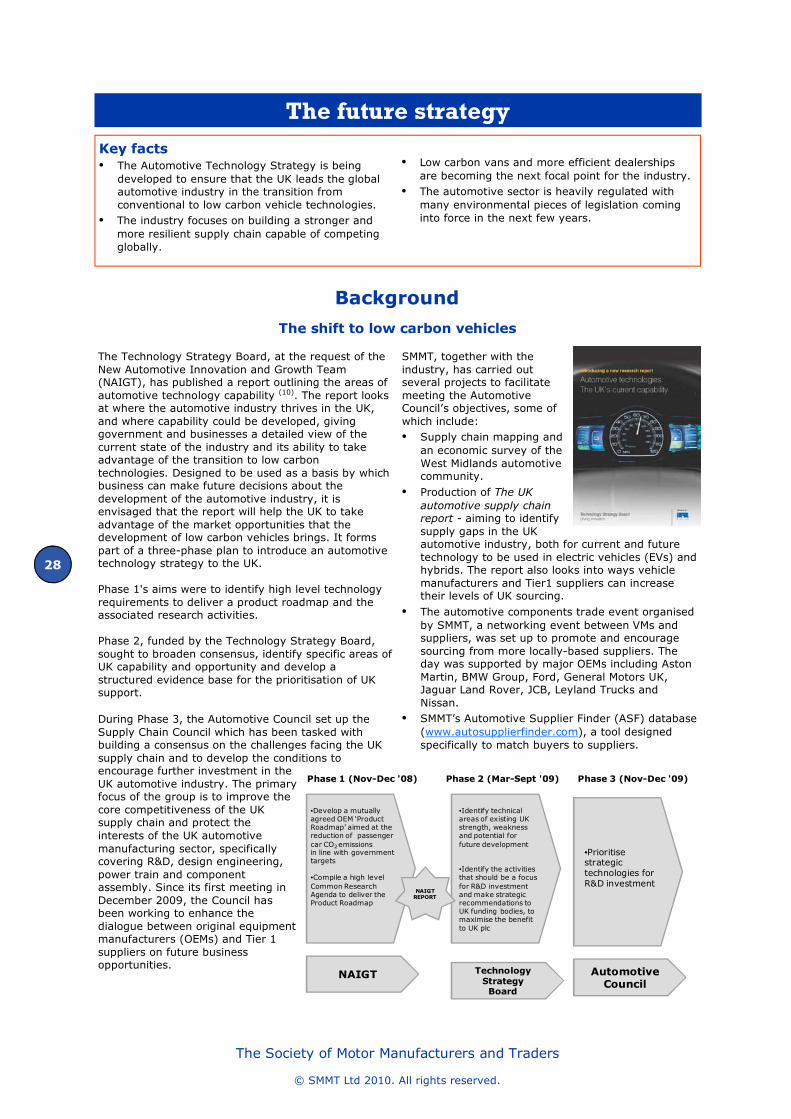
28
The Society of Motor Manufacturers and Traders
© SMMT Ltd 2010. All rights reserved.
The future strategy
Key facts • The Automotive Technology Strategy is being
developed to ensure that the UK leads the global automotive industry in the transition from conventional to low carbon vehicle technologies.
• The industry focuses on building a stronger and more resilient supply chain capable of competing globally.
• Low carbon vans and more efficient dealerships are becoming the next focal point for the industry.
• The automotive sector is heavily regulated with many environmental pieces of legislation coming into force in the next few years.
Background
The shift to low carbon vehicles
The Technology Strategy Board, at the request of the New Automotive Innovation and Growth Team (NAIGT), has published a report outlining the areas of automotive technology capability (10). The report looks at where the automotive industry thrives in the UK, and where capability could be developed, giving government and businesses a detailed view of the current state of the industry and its ability to take advantage of the transition to low carbon technologies. Designed to be used as a basis by which business can make future decisions about the development of the automotive industry, it is envisaged that the report will help the UK to take advantage of the market opportunities that the development of low carbon vehicles brings. It forms part of a three-phase plan to introduce an automotive technology strategy to the UK. Phase 1's aims were to identify high level technology requirements to deliver a product roadmap and the associated research activities. Phase 2, funded by the Technology Strategy Board, sought to broaden consensus, identify specific areas of UK capability and opportunity and develop a structured evidence base for the prioritisation of UK support. During Phase 3, the Automotive Council set up the Supply Chain Council which has been tasked with building a consensus on the challenges facing the UK supply chain and to develop the conditions to encourage further investment in the UK automotive industry. The primary focus of the group is to improve the core competitiveness of the UK supply chain and protect the interests of the UK automotive manufacturing sector, specifically covering R&D, design engineering, power train and component assembly. Since its first meeting in December 2009, the Council has been working to enhance the dialogue between original equipment manufacturers (OEMs) and Tier 1 suppliers on future business opportunities.
SMMT, together with the industry, has carried out several projects to facilitate meeting the Automotive Council’s objectives, some of which include: • Supply chain mapping and
an economic survey of the West Midlands automotive community.
• Production of The UK automotive supply chain report - aiming to identify supply gaps in the UK automotive industry, both for current and future technology to be used in electric vehicles (EVs) and hybrids. The report also looks into ways vehicle manufacturers and Tier1 suppliers can increase their levels of UK sourcing.
• The automotive components trade event organised by SMMT, a networking event between VMs and suppliers, was set up to promote and encourage sourcing from more locally-based suppliers. The day was supported by major OEMs including Aston Martin, BMW Group, Ford, General Motors UK, Jaguar Land Rover, JCB, Leyland Trucks and Nissan.
• SMMT’s Automotive Supplier Finder (ASF) database (www.autosupplierfinder.com), a tool designed specifically to match buyers to suppliers.
NAIGTREPORT
NAIGT Technology Strategy Board
Automotive Council
•Develop a mutually agreed OEM ‘Product Roadmap’ aimed at the reduction of passenger car CO2 emissions in line with government targets
•Compile a high level Common Research Agenda to deliver the Product Roadmap
•Identify technical areas of existing UK strength, weakness and potential for future development
•Identify the activities that should be a focus for R&D investment and make strategic recommendations to UK funding bodies, to maximise the benefit to UK plc
•Prioritise strategic technologies for R&D investment
Phase 1 (Nov-Dec '08) Phase 2 (Mar-Sept '09) Phase 3 (Nov-Dec '09)
29
The Society of Motor Manufacturers and Traders
© SMMT Ltd 2010. All rights reserved.
Dealer efficiency project seeks 50,000 tonnes
CO2 savings The automotive industry has made significant improvements to the efficiency of the products it sells and how it manufacturers them. Industry is now turning its attention to improving the energy efficiency within dealerships. SMMT and RMIF have combined to take forward a project to reduce dealers’ energy use. The project will see industry working with the Carbon Trust to assess and then disseminate ways dealers can use less energy. Improving energy efficiency will help reduce costs for dealers and so provide additional benefits beyond the carbon savings.
The project is timely given the move to implement the Carbon Reduction Commitment, which is a UK-based scheme to encourage energy efficiency amongst medium to high energy users whose emissions are not covered by the Climate Change Agreements or the EU Emissions Trading Scheme. Carbon Trust typically finds it is able to recommend energy savings potentials of 10-20% for zero or minimum investment in energy efficiency. If 30% of dealers took action then savings of 50,000tons of CO2 per annum could be generated through the project. The project is due to begin in the second half of 2010.
SMMT low carbon truck strategy Heavy goods vehicle manufacturers (HGVs, above 3.5 tonnes), importers, aftermarket and operators are committed to CO2 reduction and have developed a strategy in 2010 through the SMMT, based on the need for a holistic approach. The strategy aims to provide the necessary focus on HGVs and their role in driving down CO2 emissions. The strategy recommends: • Government action to provide an incentives
package for promoting the uptake of Ultra-Low Carbon (ULC) technologies by industry from 2011.
• Clearly defined measurement of HGV CO2 emissions must be established to determine the true ‘well to wheel’, ‘well to tank’ and ‘tank to tail pipe’ emissions.
• Whole life accountability - technologies must be proven to have positive benefits in a life cycle
context, before the industry is encouraged to adopt them.
• All policy options should be objectively considered before selecting preferred options. Alternative fuels, emissions trading and road user charging must not be overlooked.
In parallel to the focus on long-term low carbon technical solutions, industry needs to identify and develop bridging technologies that are commercially viable. All operators can help to reduce their CO2 emissions but a clear strategy for the next ten, 20 and 50 years needs to be established and then applied. Policies that focus only on the next three to five years are not helpful as it takes longer than this to develop new vehicles and engines. Industry is keen to be an active and central stakeholder along the way.
Positive step changes
Forthcoming changes and dates by which all manufacturers must comply (please note that some will adopt these measures early, where possible): • Carbon Reduction Commitment (CRC) – from April 2010 relatively medium to large emitting companies need to report their energy consumption and pay for the CO2 they emit. Revenue from the sale of CRC allowances is recycled back to participants on the basis of their emissions reduction performance.
• Mobile Air Conditioning (MAC) - from 2011 all new vehicle types must use refrigerant with a low global warming potential (from 1 January 2017 for all new registrations).
• EU New Car CO2 Regulation - 2012 start of phase-in for 130g/km EU fleet average by 2015.
• EU Emissions Trading Scheme Phase III – from 2013 there will be much tougher allocations for existing industrial installations and therefore they must reduce their CO2 emissions or pay for credits where other installations can do so more cost effectively.
• Xenon headlamp bulbs– from 2011 new lower power 25w bulbs with reduced light output will negate the need for the headlamp washing
system, currently a legal requirement. This will reduce weight by removing the water tank and pump, so improving the vehicle’s overall CO2 performance.
• EU whole vehicle type approval (EWVTA) April 2010 applies to all vehicle models. Approval allows the vehicle to be registered across all EU member states without the need for further testing in each country but without it, the vehicle cannot be sold. (SMMT has launched SENTA - a web-based guide on type approval for vehicle manufacturers and bodybuilders).
• LED lamps Heavy Goods Vehicles (HGV) - 2010, much lower energy consumption than traditional bulbs, so less CO2 .
• Tyre labelling for fuel efficiency, wet grip and noise performance –2012.
Safety technologies mandated: • Tyre pressure warning systems (TPMS) - 2010.
• Gear shift indicators (GSI) - 2010. • Lane departure warning systems - around 2011.
• Advanced emergency braking systems (AEBS) 2012 (note that ABS was standard from 2001).
• Electronic vehicle stability control (EVSV) - by 2016 all vehicle categories will be covered.
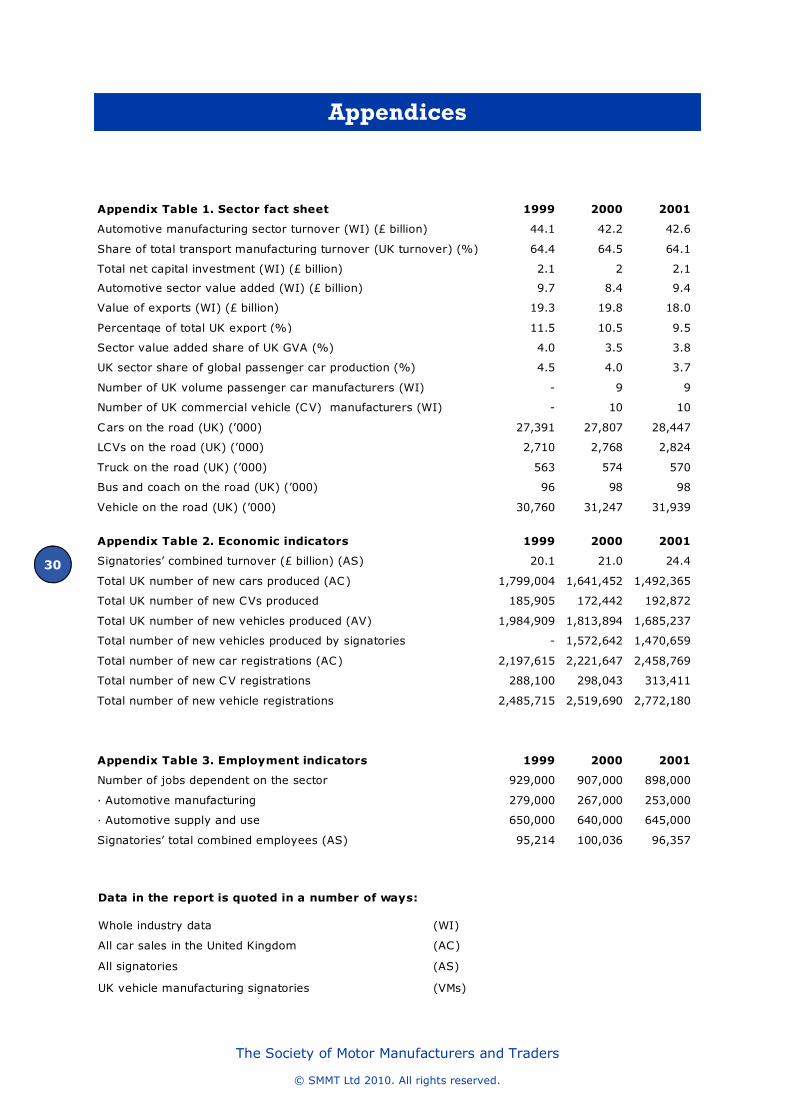
30
The Society of Motor Manufacturers and Traders
© SMMT Ltd 2010. All rights reserved.
Appendices
Data in the report is quoted in a number of ways:
Whole industry data (WI)
All car sales in the United Kingdom (AC)
All signatories (AS)
UK vehicle manufacturing signatories (VMs)
Appendix Table 1. Sector fact sheet 1999 2000 2001
Automotive manufacturing sector turnover (WI) (£ billion) 44.1 42.2 42.6
Share of total transport manufacturing turnover (UK turnover) (%) 64.4 64.5 64.1
Total net capital investment (WI) (£ billion) 2.1 2 2.1
Automotive sector value added (WI) (£ billion) 9.7 8.4 9.4
Value of exports (WI) (£ billion) 19.3 19.8 18.0
Percentage of total UK export (%) 11.5 10.5 9.5
Sector value added share of UK GVA (%) 4.0 3.5 3.8
UK sector share of global passenger car production (%) 4.5 4.0 3.7
Number of UK volume passenger car manufacturers (WI) - 9 9
Number of UK commercial vehicle (CV) manufacturers (WI) - 10 10
Cars on the road (UK) (’000) 27,391 27,807 28,447
LCVs on the road (UK) (’000) 2,710 2,768 2,824
Truck on the road (UK) (’000) 563 574 570
Bus and coach on the road (UK) (’000) 96 98 98
Vehicle on the road (UK) (’000) 30,760 31,247 31,939
Appendix Table 2. Economic indicators 1999 2000 2001
Signatories’ combined turnover (£ billion) (AS) 20.1 21.0 24.4
Total UK number of new cars produced (AC) 1,799,004 1,641,452 1,492,365
Total UK number of new CVs produced 185,905 172,442 192,872
Total UK number of new vehicles produced (AV) 1,984,909 1,813,894 1,685,237
Total number of new vehicles produced by signatories - 1,572,642 1,470,659
Total number of new car registrations (AC) 2,197,615 2,221,647 2,458,769
Total number of new CV registrations 288,100 298,043 313,411
Total number of new vehicle registrations 2,485,715 2,519,690 2,772,180
Appendix Table 3. Employment indicators 1999 2000 2001
Number of jobs dependent on the sector 929,000 907,000 898,000
� Automotive manufacturing 279,000 267,000 253,000
� Automotive supply and use 650,000 640,000 645,000
Signatories’ total combined employees (AS) 95,214 100,036 96,357
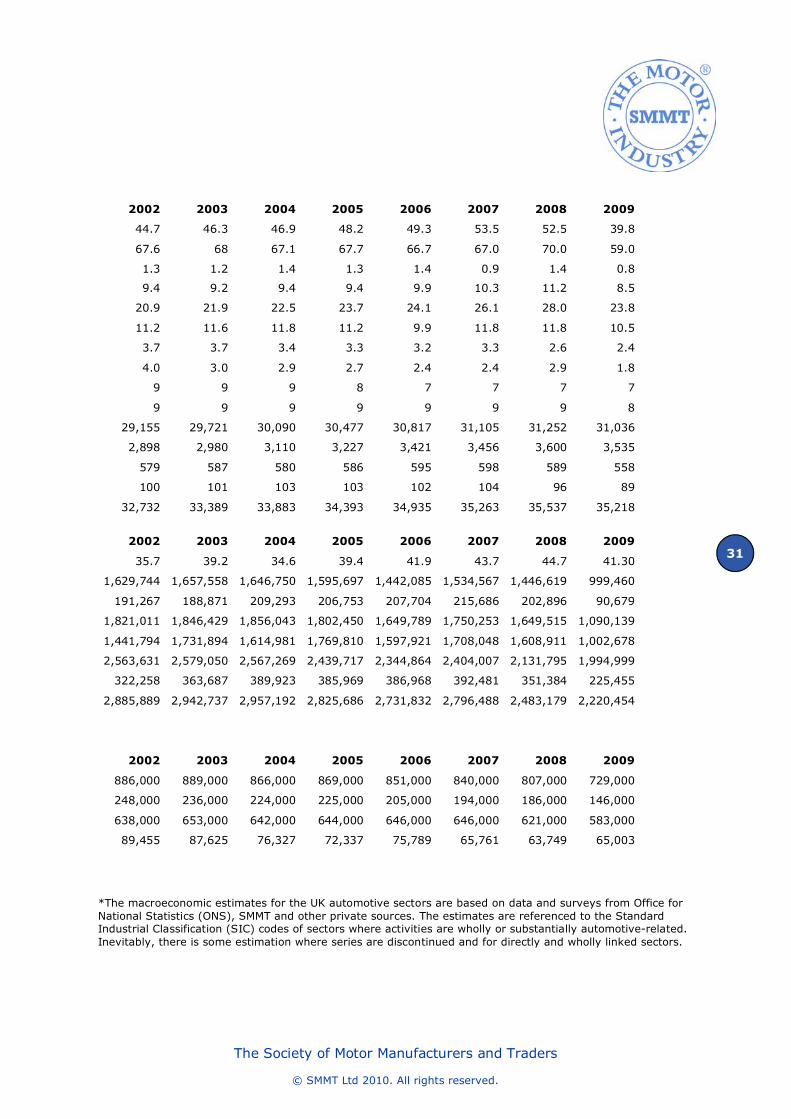
31
The Society of Motor Manufacturers and Traders
© SMMT Ltd 2010. All rights reserved.
*The macroeconomic estimates for the UK automotive sectors are based on data and surveys from Office for National Statistics (ONS), SMMT and other private sources. The estimates are referenced to the Standard Industrial Classification (SIC) codes of sectors where activities are wholly or substantially automotive-related. Inevitably, there is some estimation where series are discontinued and for directly and wholly linked sectors.
2002 2003 2004 2005 2006 2007 2008 2009
44.7 46.3 46.9 48.2 49.3 53.5 52.5 39.8
67.6 68 67.1 67.7 66.7 67.0 70.0 59.0
1.3 1.2 1.4 1.3 1.4 0.9 1.4 0.8
9.4 9.2 9.4 9.4 9.9 10.3 11.2 8.5
20.9 21.9 22.5 23.7 24.1 26.1 28.0 23.8
11.2 11.6 11.8 11.2 9.9 11.8 11.8 10.5
3.7 3.7 3.4 3.3 3.2 3.3 2.6 2.4
4.0 3.0 2.9 2.7 2.4 2.4 2.9 1.8
9 9 9 8 7 7 7 7
9 9 9 9 9 9 9 8
29,155 29,721 30,090 30,477 30,817 31,105 31,252 31,036
2,898 2,980 3,110 3,227 3,421 3,456 3,600 3,535
579 587 580 586 595 598 589 558
100 101 103 103 102 104 96 89
32,732 33,389 33,883 34,393 34,935 35,263 35,537 35,218
2002 2003 2004 2005 2006 2007 2008 2009
35.7 39.2 34.6 39.4 41.9 43.7 44.7 41.30
1,629,744 1,657,558 1,646,750 1,595,697 1,442,085 1,534,567 1,446,619 999,460
191,267 188,871 209,293 206,753 207,704 215,686 202,896 90,679
1,821,011 1,846,429 1,856,043 1,802,450 1,649,789 1,750,253 1,649,515 1,090,139
1,441,794 1,731,894 1,614,981 1,769,810 1,597,921 1,708,048 1,608,911 1,002,678
2,563,631 2,579,050 2,567,269 2,439,717 2,344,864 2,404,007 2,131,795 1,994,999
322,258 363,687 389,923 385,969 386,968 392,481 351,384 225,455
2,885,889 2,942,737 2,957,192 2,825,686 2,731,832 2,796,488 2,483,179 2,220,454
2002 2003 2004 2005 2006 2007 2008 2009
886,000 889,000 866,000 869,000 851,000 840,000 807,000 729,000
248,000 236,000 224,000 225,000 205,000 194,000 186,000 146,000
638,000 653,000 642,000 644,000 646,000 646,000 621,000 583,000
89,455 87,625 76,327 72,337 75,789 65,761 63,749 65,003
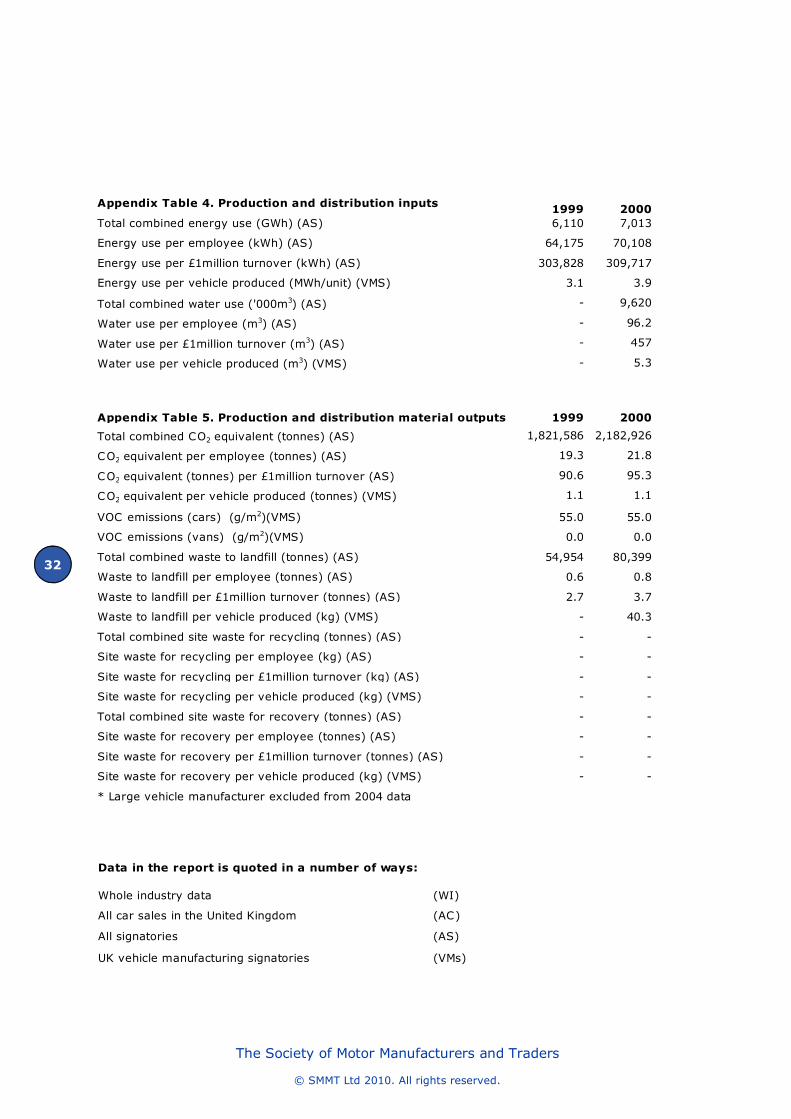
32
The Society of Motor Manufacturers and Traders
© SMMT Ltd 2010. All rights reserved.
Data in the report is quoted in a number of ways:
Whole industry data (WI)
All car sales in the United Kingdom (AC)
All signatories (AS)
UK vehicle manufacturing signatories (VMs)
Appendix Table 4. Production and distribution inputs1999 2000
Total combined energy use (GWh) (AS) 6,110 7,013
Energy use per employee (kWh) (AS) 64,175 70,108
Energy use per £1million turnover (kWh) (AS) 303,828 309,717
Energy use per vehicle produced (MWh/unit) (VMS) 3.1 3.9
Total combined water use ('000m3) (AS) - 9,620
Water use per employee (m3) (AS) - 96.2
Water use per £1million turnover (m3) (AS) - 457
Water use per vehicle produced (m3) (VMS) - 5.3
Appendix Table 5. Production and distribution material outputs 1999 2000
Total combined CO2 equivalent (tonnes) (AS) 1,821,586 2,182,926
CO2 equivalent per employee (tonnes) (AS) 19.3 21.8
CO2 equivalent (tonnes) per £1million turnover (AS) 90.6 95.3
CO2 equivalent per vehicle produced (tonnes) (VMS) 1.1 1.1
VOC emissions (cars) (g/m2)(VMS) 55.0 55.0
VOC emissions (vans) (g/m2)(VMS) 0.0 0.0
Total combined waste to landfill (tonnes) (AS) 54,954 80,399
Waste to landfill per employee (tonnes) (AS) 0.6 0.8
Waste to landfill per £1million turnover (tonnes) (AS) 2.7 3.7
Waste to landfill per vehicle produced (kg) (VMS) - 40.3
Total combined site waste for recycling (tonnes) (AS) - -
Site waste for recycling per employee (kg) (AS) - -
Site waste for recycling per £1million turnover (kg) (AS) - -
Site waste for recycling per vehicle produced (kg) (VMS) - -
Total combined site waste for recovery (tonnes) (AS) - -
Site waste for recovery per employee (tonnes) (AS) - -
Site waste for recovery per £1million turnover (tonnes) (AS) - -
Site waste for recovery per vehicle produced (kg) (VMS) - -
* Large vehicle manufacturer excluded from 2004 data
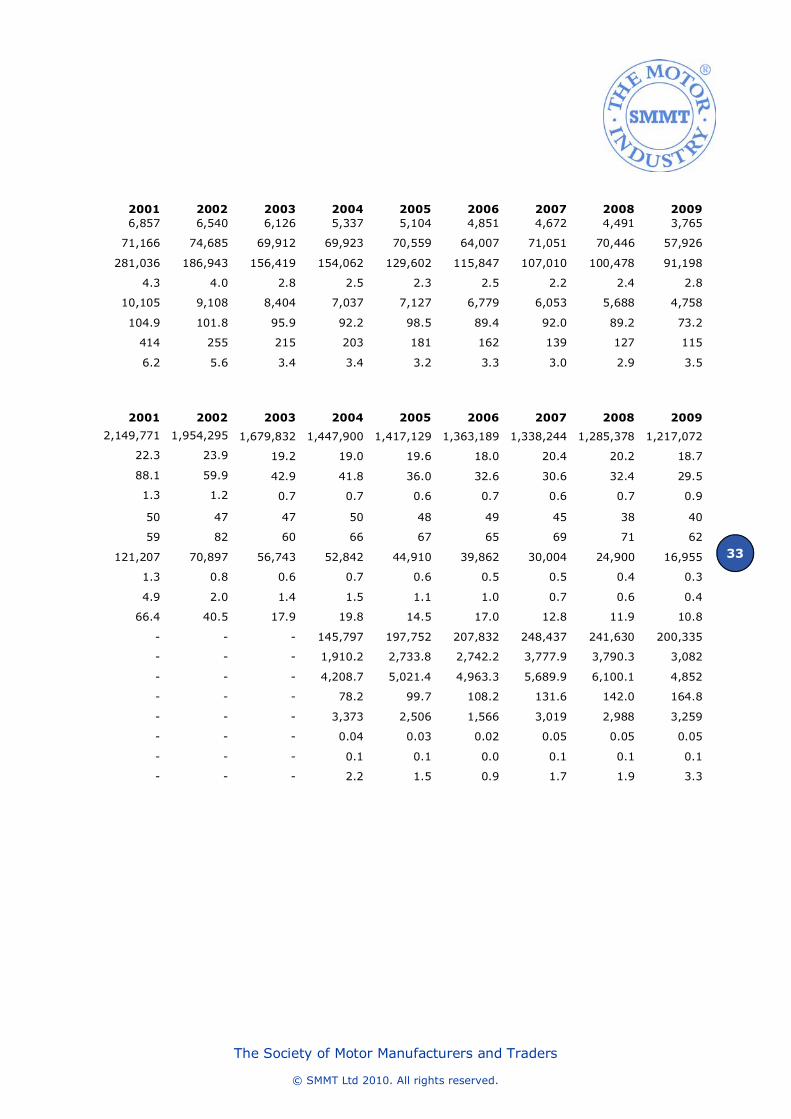
33
The Society of Motor Manufacturers and Traders
© SMMT Ltd 2010. All rights reserved.
2001 2002 2003 2004 2005 2006 2007 2008 2009
6,857 6,540 6,126 5,337 5,104 4,851 4,672 4,491 3,765
71,166 74,685 69,912 69,923 70,559 64,007 71,051 70,446 57,926
281,036 186,943 156,419 154,062 129,602 115,847 107,010 100,478 91,198
4.3 4.0 2.8 2.5 2.3 2.5 2.2 2.4 2.8
10,105 9,108 8,404 7,037 7,127 6,779 6,053 5,688 4,758
104.9 101.8 95.9 92.2 98.5 89.4 92.0 89.2 73.2
414 255 215 203 181 162 139 127 115
6.2 5.6 3.4 3.4 3.2 3.3 3.0 2.9 3.5
2001 2002 2003 2004 2005 2006 2007 2008 2009
2,149,771 1,954,295 1,679,832 1,447,900 1,417,129 1,363,189 1,338,244 1,285,378 1,217,072
22.3 23.9 19.2 19.0 19.6 18.0 20.4 20.2 18.7
88.1 59.9 42.9 41.8 36.0 32.6 30.6 32.4 29.5
1.3 1.2 0.7 0.7 0.6 0.7 0.6 0.7 0.9
50 47 47 50 48 49 45 38 40
59 82 60 66 67 65 69 71 62
121,207 70,897 56,743 52,842 44,910 39,862 30,004 24,900 16,955
1.3 0.8 0.6 0.7 0.6 0.5 0.5 0.4 0.3
4.9 2.0 1.4 1.5 1.1 1.0 0.7 0.6 0.4
66.4 40.5 17.9 19.8 14.5 17.0 12.8 11.9 10.8
- - - 145,797 197,752 207,832 248,437 241,630 200,335
- - - 1,910.2 2,733.8 2,742.2 3,777.9 3,790.3 3,082
- - - 4,208.7 5,021.4 4,963.3 5,689.9 6,100.1 4,852
- - - 78.2 99.7 108.2 131.6 142.0 164.8
- - - 3,373 2,506 1,566 3,019 2,988 3,259
- - - 0.04 0.03 0.02 0.05 0.05 0.05
- - - 0.1 0.1 0.0 0.1 0.1 0.1
- - - 2.2 1.5 0.9 1.7 1.9 3.3
34
The Society of Motor Manufacturers and Traders
© SMMT Ltd 2010. All rights reserved.
(1) UK Climate Change sustainable development indicator: 2008 Greenhouse gas emissions, final figures, February 2010, DECC: www.decc.gov.uk (2) Life Cycle Assessment of Lightweight and End-of-Life Scenarios for Generic Compact Class Passenger Vehicles, Wulf-Peter Schmidt, Elisabeth Dahlqvist, Matthias Finkbeiner, Stephan Krinke, Silvia Lazari, Dirk Oschmann, Sophie Pichon and Christian Thiel, International Journal of Life Cycle Assessment (2004) www.acea.be/index.php/files/P850/ (3) Sustainable resource use in the motor industry: a mass balance approach, Elghali, McColl-Grubb, Schiavi and Griffiths, TRL (2004) www.trl.co.uk (4) Life cycle inventory for the Golf A4, Schweimer and Levin (2000) www.volkswagenag.com/vwag/vwcorp/content/en/homepage.html (5) Year one of the RTFO; Renewable Fuels Agency; www.renewablefuelsagency.gov.uk/sites/renewablefuelsagency.gov.uk/files/_documents/ year_one_of_the_rtfo_a3.pdf (6) Road Statistics 2008: Traffic, Speed and Congestion, DfT (2010) www.dft.gov.uk (7) Driving Standard Agency, Road Statistics 2008 (8) The Driver and Vehicle Licensing Agency (2010) www.direct.gov.uk/en/Nl1/Newsroom/DG_189469 (9) Ref www.letsrecycle.com/do/ecco.py/view_item?listid=37&listcatid=5477&listitemid=54611 and www.letsrecycle.com/do/ecco.py/view_item?listid=37&listcatid=5413&listitemid=53993 (10) Technology strategy board; Automotive technologies: The UK’s current capability www.innovateuk.org/_assets/pdf/Automotive%20Technologies%20-%20The%20UKs%20Current% 20Capabilities%20-%20Summary.pdf
Report coverage
Unless otherwise stated: • The data in this report relates to the 2009 calendar year.
• Sector data was provided by SMMT and relates only to the UK automotive sector activities.
• Signatory data reported for 2009 relates to the signatories listed above.
• Case studies are based on initiatives introduced 2009.
References
Disclaimer
This publication contains general information and, although SMMT endeavours to ensure that the content is accurate and up-to-date at the date of publication, no representation or warranty, express or implied, is made as to its accuracy or completeness and therefore the information in this publication should not be relied upon. Readers should always seek appropriate advice from a suitably qualified expert before taking, or refraining from taking, any action. The contents of this publication should not be construed as advice or guidance and SMMT disclaims liability for any loss, howsoever caused, arising directly or indirectly from reliance on the information in this publication.
35
The Society of Motor Manufacturers and Traders
© SMMT Ltd 2010. All rights reserved.
Contact information
Published by
The Society of Motor Manufacturers and Traders Ltd, October 2010. SMMT and the SMMT Logo are registered trademarks of SMMT Ltd. © All rights reserved. Printed on Greencoat Velvet manufactured from 80% recycled post-consumer fibre, 10% TCF fibre and 10% ECF fibre sourced from sustainable forests. Images from www.newspress.co.uk, www.dreamtime.com
Signatory Website
Bentley Motors Limited www.bentleymotors.com
BMW Group www.bmw.co.uk and www.mini.co.uk
Caterpillar www.uk.cat.com
Chrysler UK Limited www.chrysler.co.uk
Ford Motor Company Limited www.ford.co.uk
General Motors UK Limited www.gm.com and www.vauxhall.co.uk
GKN Driveline Limited www.gknplc.com
Honda UK Manufacturing Limited www.mfg.honda.co.uk
Jaguar Cars www.jaguar.com
Land Rover www.landrover.com
Leyland Trucks Limited www.leylandtrucksltd.co.uk
Mercedes-Benz UK Limited www.mercedes-benz.co.uk
Nissan Motor Manufacturing (UK) Limited www.nissan.co.uk and www.nissan-global.com
PSA Peugeot Citroën Automobiles UK Limited www.sustainability.psa-peugeot-citroen.com
Toyota Motor Manufacturing UK Limited www.toyotauk.com
Volkswagen Group www.volkswagen.co.uk
Volvo Cars UK Limited www.volvocars.com
Look for links to ‘about us’ or ‘company’ to be directed to sustainability and environmental information.
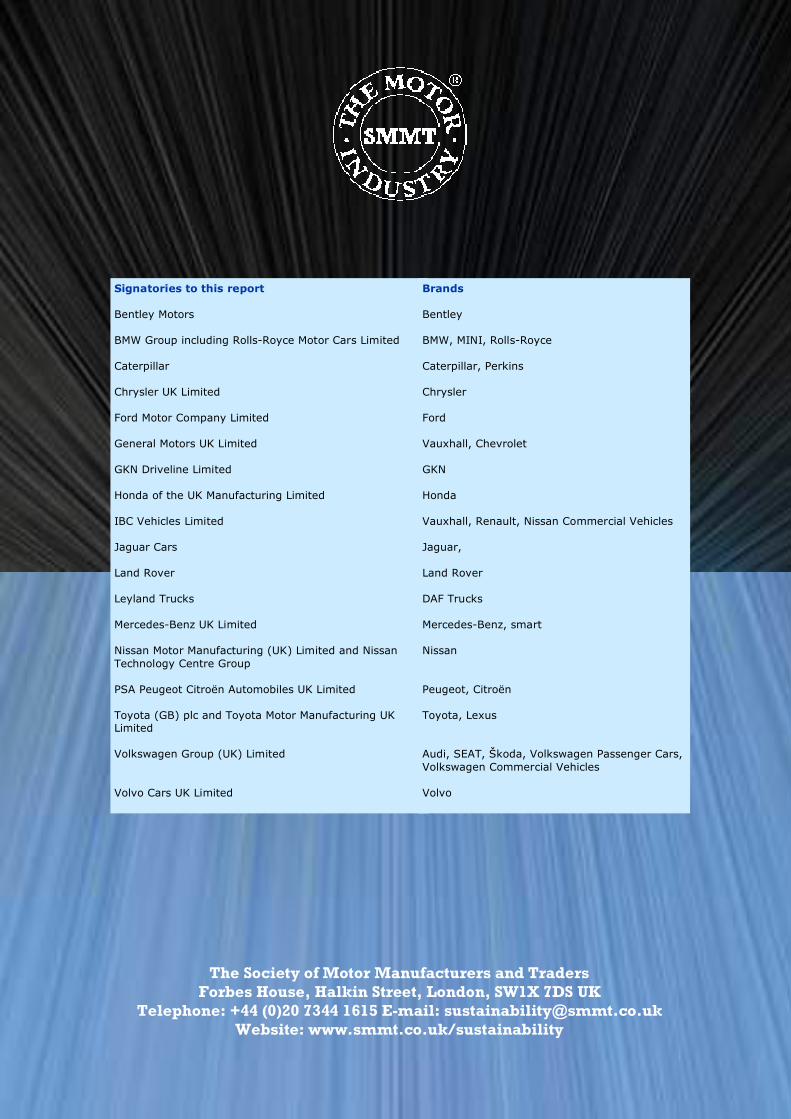
36
The Society of Motor Manufacturers and Traders
The Society of Motor Manufacturers and Traders
Forbes House, Halkin Street, London, SW1X 7DS UK
Telephone: +44 (0)20 7344 1615 E-mail: [email protected]
Website: www.smmt.co.uk/sustainability
Signatories to this report
Bentley Motors BMW Group including Rolls-Royce Motor Cars Limited Caterpillar Chrysler UK Limited Ford Motor Company Limited General Motors UK Limited GKN Driveline Limited Honda of the UK Manufacturing Limited IBC Vehicles Limited Jaguar Cars Land Rover Leyland Trucks Mercedes-Benz UK Limited Nissan Motor Manufacturing (UK) Limited and Nissan Technology Centre Group PSA Peugeot Citroën Automobiles UK Limited Toyota (GB) plc and Toyota Motor Manufacturing UK Limited Volkswagen Group (UK) Limited Volvo Cars UK Limited
Brands
Bentley BMW, MINI, Rolls-Royce Caterpillar, Perkins Chrysler Ford Vauxhall, Chevrolet GKN Honda Vauxhall, Renault, Nissan Commercial Vehicles Jaguar, Land Rover DAF Trucks Mercedes-Benz, smart Nissan Peugeot, Citroën Toyota, Lexus Audi, SEAT, Škoda, Volkswagen Passenger Cars, Volkswagen Commercial Vehicles Volvo