Embed Size (px)
Citation preview

Pacific Islands Renewable SPREP Energy Project
PIREPour islands, our lives…
Pacific Regional Energy Assessment
2004An Assessment of the Key Energy Issues,
Barriers to the Development of Renewable Energyto Mitigate Climate Change, and Capacity
Development Needs for Removing the Barriers
FIJINational Report
A climate change partnership of GEF, UNDP, SPREP and the Pacific Islands
U
D P
N
Th
e Se
cret
aria
t of
th
e Pa
cifi
c R
egio
nal
En
viro
nm
ent
Pro
gram
me
Volume 4

SPREP IRC Cataloguing-in-Publication Data
Johnston, Peter. Pacific Regional Energy Assessment 2004 :an assessment of the key energy issues, barriersto the development of renewable energy tomitigate climate change, and capacity developmentneeds to removing the barriers : Fiji NationalReport / Peter Johnston; John Vos; HerbertWade. – Apia, Samoa : SPREP, 2005.
xxi, 96 p. : figs., tables ; 29 cm. – (Pacific Islands RenewableEnergy Project. Technical report ; no. 04).
“This report is based on information gathered by aPIREP team consisting of Makereta Sauturaga,Luis Vega, John Vos, Peter Johnston and HerbertWade”.
ISBN: 982-04-0291-3
1. Energy development – Fiji. 2. Energy sources, Renewable- Fiji. 3. Energy research – Fiji. 4. Conservation of energyresources – Fiji. 5. Conservation of natural resources– Fiji. 6. Energy consumption - Climate factors – Fiji.I. Vos, John. II. Wade, Herbert. III. Sauturaga, Makereta.IV. Vega, Luis. V. Pacific Islands Renewable EnergyProject (PIREP). VI. Secretariat of the Pacific RegionalEnvironment Programme (SPREP). VII. Title. VIII. Series.
333.794159611
ii
Currency Equivalent: 1.00 F$ (FJD) ≈ US$ 0.56 (Aug 2004)
Fiscal Year: 1 January – December 31
Time Zone: GMT / UTC +12 hours
This report is based on information gathered by a PIREP team consisting of:
Ms. Makereta Sauturaga, National PIREP Co-ordinator;
Dr. Luis Vega, National PIREP Consultant;
Mr. John Vos, International PIREP Consultant;
Mr. Peter Johnston, International PIREP Consultant; and
Mr. Herbert Wade, International PIREP Consultant / Team Leader
The international consultants visited Fiji separately at various times between November 2003 and March 2004, each spending several days to over a week in the country. Several additional meetings were held in late July/early August. Data for the report was gathered by the national consultant, Dr Luis Vega (assisted by Sokoveti Namoumou), before and between the international visits. The national co-ordinator provided generous support and assistance during the several visits. In all participating countries, including Fiji, there were issues of outdated, unavailable or inconsistent data. In general, however, the Fiji Department of Energy has done a very good job of collecting and publishing energy statistics. This report reviews the status of energy sector activities in Fiji through mid 2004. An August 2004 draft of this report was reviewed by the Fiji National PIREP Coordinating Committee, Secretariat of the Pacific Regional Environment Programme, the United Nations Development Programme and others. However, the contents are the responsibility of the undersigned and do not necessarily represent the views of the Government of the Republic of the Fiji Islands, the national PIREP committee, SPREP, UNDP, Global Environment Facility (GEF) or the many individuals who kindly provided information on which the study is based.
Peter Johnston
John Vos
Herbert Wade
October 2004

iii
ACRONYMS GENERAL: AAGR Average Annual Growth Rate ACP African, Caribbean and Pacific countries (associated with EU) ADB Asian Development Bank ADO Automotive Diesel Oil, also ‘Asian Development Outlook’ (ADB) BOS Bureau of Statistics (now Fiji Islands Statistics Bureau) BP BP was formerly “British Petroleum” CAIT Climate Analysis Indicators Tool (WRI) CCA Common Country Assessment (of the UN) CHRIS Fiji Computerised Human Resources Information (GOF) CIDA Coconut Industry Development Authority CIRAD Centre de Coopération Internationale en Recherche Agronomique pour le Développement (France) CO2 Carbon dioxide, a key greenhouse gas CROP Council of Regional Organisations of the Pacific CURES Citizens United for Renewable Energy and Sustainability (NGO umbrella), DoE Department of Energy and Rural Electrification DoEnv Department of Environment EC European Community EDF European Development Fund EEZ Exclusive Economic Zone EIA Environmental Impact Assessment ENSO El Niño / El Niña oceanic climate cycle ESCAP Economic and Social Commission for Asia and the Pacific (UN) EU European Union EWC East-West Center (Hawaii) EWG Energy Working Group of CROP FAO Forest and Agriculture Organization (UN) FEA Fiji Electricity Authority FHCL Fiji Hardwood Corporation Limited FIMS Fiji Islands Meteorological Service FINAPECO Fiji National Petroleum Company (early 1990s) FISB Fiji Islands Statistics Bureau FLP Fiji Labour Party FNPF Fiji National Provident Fund FSC Fiji Sugar Corporation FTIB Fiji Islands Trade and Investment Bureau FY Fiscal Year GDP Gross Domestic Product GEF Global Environment Facility GHG Greenhouse Gas GMT/UTC Greenwich Mean Time / Universal Time Coordinate GNP Gross National Product GOF Government of the Fiji Islands GTZ Deutsche Gesellschaft für Technische Zusamenarbeit (German Technical Cooperation) HDI Human Development Index (UNDP) HFO Heavy fuel oil IMF International Monetary Fund IPP Independent Power Producer

iv
IRN International Rivers Network (NGO), IRR Internal Rate of Return IUCN International Union for the Conservation of Nature JICA Japan International Cooperation Agency JOCV Japan Overseas Cooperation Volunteers JV Joint venture LPG Liquified Petroleum Gas LTA Land Transport Authority MAFF Ministry of Fisheries and Forests MASLR Ministry of Agriculture, Sugar and Land Resources MDG Millennium Development Goals MoF Ministry of Finance and National Planning MWE Ministry of Works and Energy NASA National Aeronautics and Space Administration (US) NLTB Native Lands Trust Board NORAD Norwegian Agency for International Development O&M Operations and maintenance OPEC Organisation of Petroleum Exporting Countries OPRET Office for the Promotion of Renewable Energy Technologies (DoE) OTEC Ocean Thermal Energy Conversion PACER Pacific Agreement on Closer Economic Relations PDMC Pacific Developing Member Country (of ADB) PEDP Pacific Energy Development Programme (UN 1982-1991) PIB Prices and Incomes Board PIC Pacific Island Country PICCAP Pacific Islands Climate Change Assistance Programme (GEF/UNDP) PICHTR Pacific International Center for High Technology Research (Hawaii) PICTA Pacific Island Countries Trade Agreement PIDP Pacific Islands Development Program (of EWC) PIEPP Pacific Islands Energy Policy and Plan (CROP EWG) PIEPSAP Pacific Islands Energy Policy and Strategic Action Planning (DANIDA/UNDP/SOPAC 2004-2007) PIFS Pacific Islands Forum Secretariat PIREP Pacific Island Renewable Energy Project (GEF/UNDP) PPA Pacific Power Association PREA Pacific Regional Energy Assessment (World Bank, et. al., 1992) PV Photovoltaic PWD Public Works Department RBF Reserve Bank of the Fiji Islands RE Renewable Energy REEP Renewable Energy and Energy Efficiency Programme (ADB) REM Regional Energy Meeting (of Pacific Islands) REP Rural Electrification Policy (GoF) RESCO Renewable Energy Service Company RET Renewable Energy Technology REU Rural Electrification Unit (DoE) RFO Residual fuel oil (heavy fuel oil) RFP Request for Proposal SDL/CAMV Soqosoqo Duavata ni Lewenivanua / Conservative Alliance Matanitu Vanua coalition SHS Solar Home System

v
SOPAC South Pacific Applied Geoscience Commission SPC Secretariat of the Pacific Community SPREP Secretariat of the Pacific Regional Environment Programme SVT Soqosoqo Vakavulewa Ni Taukei political party SWH Solar water heater UN United Nations UNDP United Nations Development Programme UNEP United Nations Environment Programme UNESCO United Nations Educational, Scientific and Cultural Organisation UNFCCC United Nations Framework Convention on Climate Change US United States USAID United States Agency for International Development USDoE United States Department of Energy USGIC United States Geothermal Industries Corporation USP The University of the South Pacific VAT Value Added Tax VLIS Viti Levu Integrated System (FEA) WB World Bank WCD World Commission on Dams (World Bank/IUCN) WRI World Resources Institute WSSD World Summit on Sustainable Development WTO World Trade Organisation
ENERGY AND POWER UNITS:
AC Alternating Current DC Direct Current KGOE Kilogrammes of Oil Equivalent kV Kilo-Volts (thousands of volts) kVA Kilo-Volt-Amperes (Thousands of Volt Amperes of power) kW Kilo-Watt (Thousands of Watts of power) kWh Kilo-Watt-Hour (Thousands of Watt Hours of energy) kWp Kilo-Watts peak power (at standard conditions) from PV panels MW Mega-Watt (millions of watts of power) toe Tonnes of Oil Equivalent V Volts W Watts Wh Watt hours (of energy)
vi
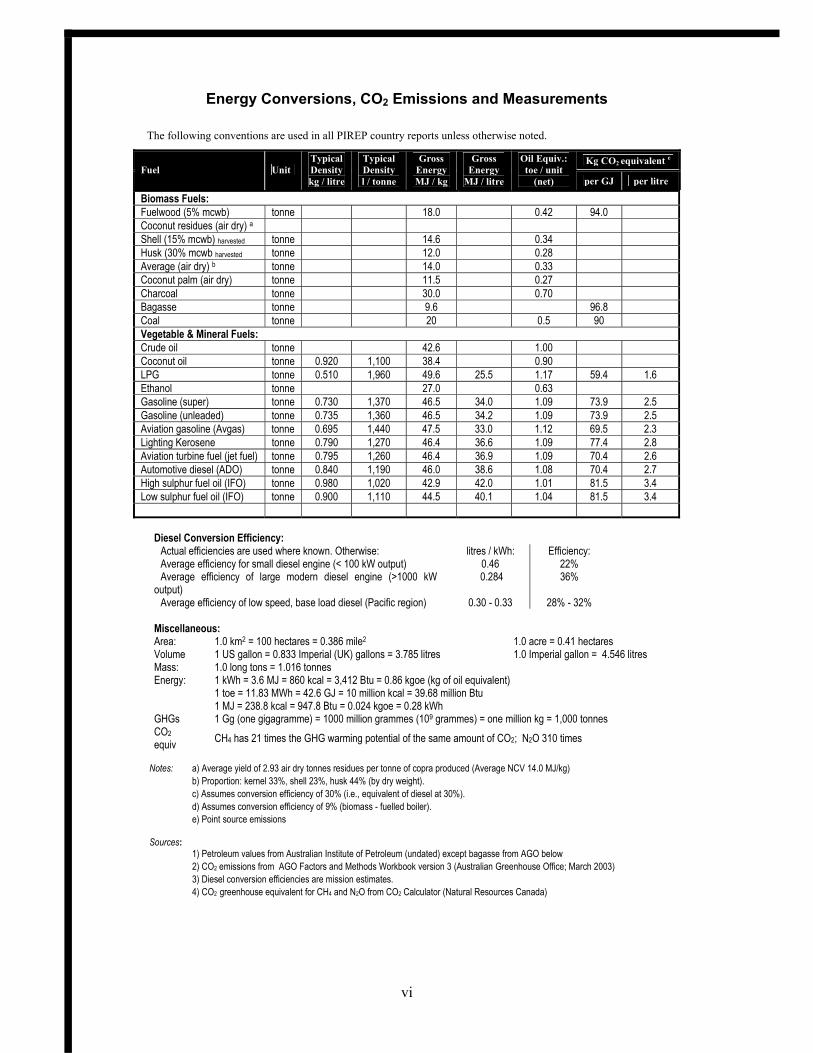
Energy Conversions, CO2 Emissions and Measurements
The following conventions are used in all PIREP country reports unless otherwise noted.
Kg CO2 equivalent e Fuel Unit
TypicalDensitykg / litre
Typical Density l / tonne
Gross EnergyMJ / kg
Gross Energy
MJ / litre
Oil Equiv.:toe / unit
(net) per GJ per litre
Biomass Fuels: Fuelwood (5% mcwb) tonne 18.0 0.42 94.0 Coconut residues (air dry) a Shell (15% mcwb) harvested tonne 14.6 0.34 Husk (30% mcwb harvested tonne 12.0 0.28 Average (air dry) b tonne 14.0 0.33 Coconut palm (air dry) tonne 11.5 0.27 Charcoal tonne 30.0 0.70 Bagasse tonne 9.6 96.8 Coal tonne 20 0.5 90 Vegetable & Mineral Fuels: Crude oil tonne 42.6 1.00 Coconut oil tonne 0.920 1,100 38.4 0.90 LPG tonne 0.510 1,960 49.6 25.5 1.17 59.4 1.6 Ethanol tonne 27.0 0.63 Gasoline (super) tonne 0.730 1,370 46.5 34.0 1.09 73.9 2.5 Gasoline (unleaded) tonne 0.735 1,360 46.5 34.2 1.09 73.9 2.5 Aviation gasoline (Avgas) tonne 0.695 1,440 47.5 33.0 1.12 69.5 2.3 Lighting Kerosene tonne 0.790 1,270 46.4 36.6 1.09 77.4 2.8 Aviation turbine fuel (jet fuel) tonne 0.795 1,260 46.4 36.9 1.09 70.4 2.6 Automotive diesel (ADO) tonne 0.840 1,190 46.0 38.6 1.08 70.4 2.7 High sulphur fuel oil (IFO) tonne 0.980 1,020 42.9 42.0 1.01 81.5 3.4 Low sulphur fuel oil (IFO) tonne 0.900 1,110 44.5 40.1 1.04 81.5 3.4
Diesel Conversion Efficiency: Actual efficiencies are used where known. Otherwise: litres / kWh: Efficiency: Average efficiency for small diesel engine (< 100 kW output) 0.46 22% Average efficiency of large modern diesel engine (>1000 kW output)
0.284 36%
Average efficiency of low speed, base load diesel (Pacific region) 0.30 - 0.33 28% - 32% Miscellaneous:
Area: 1.0 km2 = 100 hectares = 0.386 mile2 1.0 acre = 0.41 hectares Volume 1 US gallon = 0.833 Imperial (UK) gallons = 3.785 litres 1.0 Imperial gallon = 4.546 litres Mass: 1.0 long tons = 1.016 tonnes Energy: 1 kWh = 3.6 MJ = 860 kcal = 3,412 Btu = 0.86 kgoe (kg of oil equivalent) 1 toe = 11.83 MWh = 42.6 GJ = 10 million kcal = 39.68 million Btu 1 MJ = 238.8 kcal = 947.8 Btu = 0.024 kgoe = 0.28 kWh GHGs 1 Gg (one gigagramme) = 1000 million grammes (109 grammes) = one million kg = 1,000 tonnes CO2 equiv CH4 has 21 times the GHG warming potential of the same amount of CO2; N2O 310 times
Notes: a) Average yield of 2.93 air dry tonnes residues per tonne of copra produced (Average NCV 14.0 MJ/kg) b) Proportion: kernel 33%, shell 23%, husk 44% (by dry weight). c) Assumes conversion efficiency of 30% (i.e., equivalent of diesel at 30%). d) Assumes conversion efficiency of 9% (biomass - fuelled boiler). e) Point source emissions Sources:
1) Petroleum values from Australian Institute of Petroleum (undated) except bagasse from AGO below 2) CO2 emissions from AGO Factors and Methods Workbook version 3 (Australian Greenhouse Office; March 2003) 3) Diesel conversion efficiencies are mission estimates. 4) CO2 greenhouse equivalent for CH4 and N2O from CO2 Calculator (Natural Resources Canada)

vii
EXECUTIVE SUMMARY
1. COUNTRY CONTEXT
Physical characteristics. Fiji lies between 177° E and 178° W Longitude and 12° to 22° S Latitude with a land area of 18,333 km2. This includes 320 islands of which about a third are inhabited. The majority of the land is on continental-like volcanic islands that rise to well over 1,000 metres in elevation. Over 87% of the land is concentrated in the islands of Viti Levu and Vanua Levu. Fiji’s climate is tropical, averaging 26oC with annual rainfall ranging from 1800 to 2600 mm. It is considerably richer in natural resources than its Polynesian and Micronesian neighbours with extensive timber, rich soils, mineral deposits and fish. The country is subject to earthquakes, landslides, cyclones, flooding and storm surges and is second only to Papua New Guinea as the Pacific Island state most affected by natural disasters since 1990. Natural hazards, made worse by inadequate environmental management, can affect the economic and technical viability of otherwise appropriate renewable energy investments. Historical and political development. Fiji won independence from Britain in 1970 when it adopted a Westminster form of parliamentary government. Until 1987 Fiji was ruled by the multi-ethnic Alliance Party, dominated by ethnic Fijians, under Prime Minister Ratu Sir Kamisese Mara. Following an election victory by an Indo-Fijian dominated party in April 1987, Fiji entered a period of instability with three coups between May 1987 and May 2000. The current government is headed by elected Prime Minister Laisenia Qarase, with elections next due by September 2006. Population. The most recent census was held in 1996 when Fiji’s population was 775,000 showing an annual average growth rate of only 0.8% since 1986. Of the total, 51% were Fijian, 44% Indo-Fijian, and 5% other. About 46% were urban with over 250,000 people in the Suva-Nausori-Lami corridor. By 2004, Fiji’s population was estimated to have reached 844,000 with 52% urban and indigenous Fijians comprising nearly 53%. Nearly 80% of the population live in Viti Levu, with 57% of land area, and 95% live in the three largest islands, with 90% of land area. Between 1986- 1996, 12% of Fiji’s 1986 labour force emigrated, resulting in a huge loss of skilled, experienced people. Continuing emigration remains a serious problem. The economy. For several decades, Fiji’s economy has been highly dependent on sugar and other agricultural exports, garments and other manufactured goods, gold and other primary products (timber, timber products, fish) and tourism. From 1995 through 2002, Fiji’s Gross Domestic Product (GDP) grew in real terms at 2.4% per year to F$2.8 billion in 1995 dollars. Expressed in current dollars, GDP in 2002 was F$3.44 billion or F$4,165 (US$2,290) per capita. In 2002, Fiji’s exports were valued at F$1.2 billion led by garments (32%), sugar and molasses (29%), gold and fish (9% each). Imports were F$2.0 billion, a visible trade deficit of F$760 million. The Asian Development Bank characterises economic performance in 2003 as strong and expects moderate growth in 2004 and 2005 of 3.9% and 3.0% respectively. However, investment in Fiji has steadily dropped from 35% of GDP in 1983 to about 12.5% since 1997. A low investment rate over a long period, particularly a sharp decline in private investment, has caused various observers to question whether the country can sustain growth in the future. The sugar industry, Fiji’s economic backbone, has been in decline since 1994 and requires considerable restructuring to survive. One aspect of political instability has been the inability to address this issue that includes land lease arrangements, poor

viii
cane supply, deteriorating transportation, and mill inefficiencies. According to the International Monetary Fund, the 68% government-owned Fiji Sugar Corporation (FSC) could face increasingly heavy losses reaching F$33 million by 2008 if no action is taken soon. Uncertainty over the future of the sugar industry has implications for Fiji’s national energy use and development since the FSC produces a significant amount of electricity, some of which is sold to, and distributed by, the Fiji Electricity Authority (FEA). A Strategic Development Plan 2003-2005 was formulated after wide consultation and includes a range of public service reforms, legislative changes, tax reforms, etc. meant to stimulate investment and promote economic growth. Among the goals is an increase in overall investment to 25% of GDP. Noting that the percentage of households living in poverty grew from 15% in 1983 to nearly 26% in 1996 (worsening further after the 2000 political crisis), the plan includes measures to reduce poverty. Rural income and expenditure. In 2003, a survey of rural households in unelectrified communities showed average monthly expenditure on lighting fuels and batteries for radios of F$18.60 with 38% spending F$20 or more, the amount necessary for the operating and maintenance costs of solar lighting. This suggests that at least 4,600 households could spend F$20 per month for solar lighting and at least 9,000 families could spend F$15 or more. Millennium development goals (MDG). Fiji has adopted the MDGs, a set of development targets with quantifiable indicators. The ADB has concluded that Fiji has achieved or almost achieved some targets but the “incidence of poverty has increased to possibly 33 - 50%” with urban slum dwellers a problem. Fiji has very high literacy rates, with universal primary education for boys and girls but quality and retention are problems, particularly in outer islands. Rural areas and outer islands compare unfavourably regarding access to, and quality of, basic social services. Available data suggests that only half the population has access to a good water source. Access to good sanitation is 75% in urban areas and only 12% in rural areas. Environmental context. Fiji’s current development plan emphasises proper management of the environment and sustainable use of natural resources as critical for sustainable development. The plan lists key national environmental issues as land degradation, air and water pollution, refuse disposal, and the expected effects of climate change and sea level rise. Planned actions include better enforcement of legislation, increased public awareness of environmental issues legislation to minimise environmental damage. Energy-related objectives to be addressed by 2005 include a strategy on climate change, the reduction of vehicle emissions by 50%, identification of feasible biofuels to replace petroleum, a ban on adulterated fuels, and environmental audits for all public organisations.
2. ENERGY INSTITUTIONS, POLICIES AND LEGISLATION Institutional context. The Department of Energy (DoE, with 13 professional positions and 15 support staff) is responsible for energy policy and off-grid rural electrification. In general, the budget for capital investment, studies, and operation and maintenance of projects implemented has been inadequate. The Fiji Electricity Authority (FEA), the government-owned power utility with about 640 staff, is responsible for electricity supply nationally “where financially and economically viable” and operates on the islands of Viti Levu, Vanua Levu and Ovalau. The Ministry of Finance establishes and enforces maximum petroleum prices for motor

ix
spirit, kerosene and automotive diesel oil through its Price and Incomes Board. Three companies (Mobil, Shell and BP) import petroleum products into Fiji. Liquid petroleum gas (LPG), which is not under price control, is imported by Fiji Gas and Bluegas. Energy policies and plans. The overall energy sector goal of the national plan is efficient, cost effective and environmentally sustainable energy development. Specific objectives include formulation of a comprehensive national energy policy, power sector reform, establishing Renewable Energy Service Companies (RESCOs) and increased funding for the rural electrification programme (REP). The heavily-subsidised REP provides rural connections to the FEA grid, diesel gensets with a mini-grid system operated at the village level, and solar photovoltaics (PV) for lighting and basic appliances. FEA has a rolling development plan. Legislation. A number of Acts of Parliament provide legal means for overseeing the energy sector. These include the Electricity Act which established FEA, the Petroleum Act establishing standards for fuel storage and transport, the Fuel and Power Emergency Act which regulates supply, distribution and use of fuel and electric power during emergencies, the Public Enterprise Act for restructuring and regulating government commercial companies in the public interest; and the Commerce Act which promotes competition and considers electricity tariffs. Two bills are being considered by parliament, an Environment Management Bill which, if enacted, will require environmental impact assessments and codes for resource planning; and a Renewable Energy Service Company Bill to provide a private sector mechanism for managing renewable energy services, particularly in remote areas.
3. ENERGY SUPPLY AND PRICING Petroleum. Retained petroleum imports to Fiji including Liquified Petroleum Gas apparently grew by about 1% annually from 1990-2003 to about 350 million litres. However, there are numerous gaps, anomalies and errors, and the oil companies would not provide data, so this is an estimate. Fiji has a larger fuel market than most neighbouring countries and prices are generally lower. For motor spirit, the wholesale price (excluding import duties and taxes) is about 25% below the average for PICs. For LPG, Fiji’s wholesale price is below average for the region but the retail price is higher. Electricity. FEA has an extensive grid system on Viti Levu and three smaller grids on Vanua Levu and Ovalau. Over half of Viti Levu’s power comes from hydro with numerous diesel generators and some generated from burning bagasse and wood mill waste. Except for a small hydro system on Vanua Levu, all other FEA generation is diesel based. In 2003, hydro provided only 53% of FEA’s generation of 699 GWh due to a drought, but hydro has been steadily declining as a percentage of the total over the past decade. In 2003 FEA had 14 power stations with 194 MW of installed capacity, including over 80 MW of hydro. Viti Levu accounts for 90% of generation, Vanua Levu 8% and Ovalau with two percent . Growth in generation has been uneven but averaged 6.4% from 1997 through 2003. Average transmission and distribution losses were 9.9%, 8.2% and 11.7% for the Viti Levu system, Savusavu and Labasa respectively. In 2003, FEA signed a joint venture agreement to further develop hydro and establish wind energy projects. Planned new investment in hydro and wind energy, and increased purchases of energy produced from biomass, are expected to increase the renewable component of FEA generation to 80% by 2007. Afterwards, FEA hopes that additional national

x
investments, including private, in hydro, geothermal, wind, biomass and municipal waste will help it reach its highly-ambitious goal of 100% renewable energy by 2011. If these are not developed, the demand for diesel fuel, or possibly diesel fuel substitutes, will grow rapidly after 2008. FEA’s charge to consumers is lower in 2004 than in 1993 but charges are expected to increase by 20% (households) to nearly 30% (business and commercial) shortly. There is a national tariff but the real cost varies greatly, with supply to rural Ovalau being ten times the cost to urban Viti Levu, implying a cross-subsidy from urban to rural consumers. FEA does not provide service to uneconomic remote areas along its grid unless there is a subsidy from the government or sufficient capital contribution from the customer. Although a national tariff is politically expedient, it has hindered efforts to develop rural electrification since generation costs in rural areas are substantially higher than the national tariff. Rural electrification. The Public Works Department (PWD) operates small power grids at five provincial centres. Though initially intended to support government facilities at those centres, grids have expanded to include many households and small businesses in the surrounding area. The national tariff is charged though generation cost is several times the tariff charge making the facilities heavily subsidised through the PWD budget. Since 1993, about 900 communities have applied to DoE for rural electrification and over 250 diesel systems have been commissioned, serving around 7,500 households for typically 4.5 hours daily. Villagers contribute only 10% of capital costs but are responsible for operating costs. An unknown but significant number no longer function due to poor management, poor operation and maintenance, and high fuel costs. Doe has estimated the cost of electricity supply for 15 villages electrified since 1993 as $2.44/kWh generated or $2.70 including transmission losses. The implied subsidy through the government’s capital grants averaged 60% of total cost of the service.
4. ENERGY DEMAND Most information on household energy use is from the 1996 census and thus out of date. Roughly half of households cooked mainly with wood on open fires, 30% used LPG, 21% kerosene, and 3% electricity. Eighty two percent had electric lighting and 37% kerosene or benzine lamps. About 55% of petroleum fuel was used for transport, 26% for electricity generation (public and private), 8% for industry, 8% for households and 3% in businesses. In 2000, the most recent year for which DoE has attempted to prepare an energy balance, Fiji imported about 330 ML of petroleum fuels, excluding LPG and re-exports. The available data are too inexact to be precise. In 1996, 67% of households had some sort of electricity supply. Of these, 86% were supplied by the FEA, 7% used their own generators, 5% were connected to village grids, and 2% received power from other small industrial or government grids. Eighty seven percent of urban and 49% of rural households had electricity, the latter often for only several hours per day. Projected fuel use and GHG emissions. In 2000 Fiji emitted about 900 gigagrammes (Gg) of greenhouse gases (GHG) from petroleum fuel consumption. This is only approximate as petroleum imports have been erratic and data are questionable. Assuming that Fiji’s economy grows slightly faster than population, as it has since Independence, by 2010 GHG emissions will reach 1500 Gg in the absence of new investments in renewable energy or energy efficiency (RE/EE). Ignoring

xi
possible economic, financial, social and environmental constraints, in principle, Fiji could reduce GHG emissions by over 500 Gg per year in a decade through substantial investments in renewable energy (over 90% of total) and to a lesser extent energy efficiency (under 10%). Renewable energy from a variety of sources – hydropower, geothermal, wind, solar energy, biofuels, bagasse, municipal solid waste, etc. could in principle be combined to produce all electricity for the grid system.
5. RENEWABLE ENERGY Resources.Fiji has a wide range of renewable energy resources. • Biomass. Biomass provides about 50% of gross energy use in Fiji. About 700 kT
of bagasse is burned at sugar mills producing process heat and electricity, perhaps 250 kT of biomass are used for household cooking and under 100 kT for copra drying. Forests cover about 47% of total land area, with plantation forests accounting for 13% of the total. Although large amounts of biomass are available from forest waste, most is located where it has little economic value and in practice is a very limited energy resource. As Fiji’s sugar production drops, less bagasse is available for power generation, increasing diesel fuel use. Fiji produces about 10,000 tonnes of coconut oil per year, which in principle could be used as a diesel oil replacement, but this is not currently economic on a large scale. Sugar and other crops could be used to produce sufficient ethanol to replace perhaps 10% of petrol use. Nearly 100 kilotonnes per year of municipal solid waste is delivered to a new landfill serving the greater Suva area. This should reach 135 kT by 2013, sufficient to produce about 5 MW of electricity for the FEA grid. Biogas generation from urban sewage can add over 1 MW of electricity for FEA. Fiji’s numerous piggeries, dairy farms and poultry farms suggest a reasonable resource for small-scale biogas production but the scale of the practical resource is not known.
• Solar. Solar radiation has been measured at nine stations in Fiji for some years. Nadi records the highest long-term annual average of 5.1 kWh/m
2 peaking from
about November- February, Vanua Balavu (Lau) 5 kWh/m2, and Bua (Vanua
Levu) 4.5 kWh/m2. The lowest long-term readings are near the Monasavu hydro
site in Viti Levu’s highlands with 3.7 kWh/m2. Measurements are based on
horizontally mounted pyranometers. Actual solar energy received by PV or thermal collectors will be both higher and more evenly distributed throughout the year due to tilting toward the sun.
• Wind. There are long-term wind data records available for eight sites in Fiji but these are for monitoring weather, and are not at locations or heights appropriate for accurately estimating the wind energy resource. At one site, the DoE assessed wind potential at 4.8 m/s whereas the nearby government station recorded 3.7 m/s. Overall, Fiji’s wind speeds are marginal for energy compared to FEA generation costs but some sites may be cost effective compared to FEA’s marginal costs for new diesel generator investments.
• Hydro. The untapped developable hydroelectric potential on Viti Levu is probably on the order of 200 MW with an average annual output of 1,000 GWh. Microhydro (under 100 kW) and mini-hydro (100-1,500 kW) potential has been studied by DoE for sites near communities not served by the FEA. There are 38 of these smaller sites on six islands totalling 3.2 MW which appear to be technically and economically feasible, 20 sites with totalling about 0.4 MW that require more monitoring, and many other sites yet to be assessed.

xii
• Ocean. The temperature difference between the ocean surface and depth can in principle be harnessed for electric power using Ocean Thermal Energy Conversion (OTEC) technology. Measurements by Japanese experts off southern Viti Levu in 1991 indicate a promising differential of 22ºC between the surface and 800 metres depth.
• As long ago as 1980, proponents of sea wave energy suggested that Fiji had a substantial wave energy resource. In the early 1990s, Waverider buoys measured an annual average wave power of 22.9 kW per metre of wavefront near Kadavu and satellite altimeter calculations suggested 6-29 kW/m at a number of near shore locations. Wave and ocean thermal energy are promising in the long term but no suitable commercial equipment is available for installation. The tidal energy resource in Fiji is very low and has little potential for development.
• Geothermal. Preliminary assessments indicate considerable potential for geothermal steam generation in Labasa. There are numerous other sites in Vanua Levu and Viti Levu where perhaps 5-15 MW or more of power could be generated. However, costly drilling is necessary to confirm the magnitude of the resource and the cost of development is high.
Past experience. Fiji’s experience with renewable energy from about 1980 until about 2000 has generally been good and, of the PICs, Fiji currently has the highest percentage of renewable energy in its mix of energy sources. • Biomass. Biomass has traditionally been used mainly for cooking and copra
drying. In the 1980’s, several hundred wood stoves were produced to improve cooking conditions and to reduce the need for gathering fuelwood. Although unsuccessful, this led to wider acceptance and use of biomass burning institutional stoves in schools, which are widely used today. In 1979 a robust 20 kW wood/coconut waste steam power system was installed in Taveuni for copra drying and electricity production; it is still operating, though the technology has been updated several times. In 1987 a similar system was commissioned at a nearby village supplying electricity to 47 homes for 4-8 hours daily and operated intermittently for a decade. The U.S government promised funding for an additional 16 systems but the military coups of 1987 ended the U.S support for such projects.
• Biodiesel. Coconut oil has been used as an alternative to diesel fuel to operate diesel generators at two rural locations, an 80 kVA generator provided electricity for 198 households in Vanuabalavu, Lau and a 45 kVA generator was used to electrify 60 households in Taveuni. The technology appears to be technically viable but there have been difficulties with local management for operations and in situ production of oil.
• Biogas. Biogas digesters have been tried at small piggeries and dairies for 30 years in Fiji but there have been problems with maintenance and farmers found the effort to keep them operating excessive for the energy gained. New designs better suited to Fiji emphasising waste control rather than energy have been tried and the results thus far have been more successful. DoE has also installed several pilot projects using biogas produced through anaerobic digestion of rural and urban waste. The biogas is used for domestic cooking purposes and the digested material is used as fertiliser.
• Ethanol. Around 1980, the government, the FSC and oil companies considered several alternative approaches (sugar, molasses, sorghum) to produce 10-15 ML

xiii
per year of ethanol to blend with petrol. All were economically and financially marginal and plans were abandoned.
• Gasifiers. In the 1980s, FEA experimented with biomass gasification for power production but found the technology unsuited to their needs.
• Microhydro. There have been small hydro systems at missions and plantations for a century. Since 1980, five village-scale hydro systems have been built in Fiji for small electrical loads. The main technical problems have been with the electrical systems. Difficult site access and limited technical skills in the villages have resulted in long power outages and high repair costs.
• Solar PV. Rural electrification through PV with a Renewable Energy Service Company (RESCO) management structure was first tried in Fiji at Namara (Kadavu) and Vatulele (Koro), with 30-40 PV systems each, and households paying F$25 initially then $3-4 per month. The Koro project failed after a Peace Corps volunteer manager left and the village cooperative spent the accumulated funds. Namara attempted to maintain systems through a community structure and by 1993, about half of installed systems remained more-or-less operational although the co-op no longer functioned. These pilot projects provided much useful information for later PV efforts but were not themselves considered successful rural electrification projects. Around 1987, over 100 solar home systems (SHS), similar to the 1983 designs, were installed in cane farm settlements in Viti Levu. They were maintained by DoE with a monthly fee of F$4.50. Due to undersizing of systems causing customer dissatisfaction and the embezzlement by a DoE employee of the funds intended for maintenance, the project was abandoned. In the late 1980s PV electrification was tried at ten community centres to provide lighting and video power. Results were mixed, neither very positive nor failures.
• Solar Thermal. Solar water heaters are considered commercially viable and have been locally manufactured since the 1970s with thousands of locally made and imported systems installed in homes and tourist facilities.
• Solar pumping. PWD has installed several solar powered borehole pumps for village water supply, all of which have had technical problems and most are not currently in service.
Some lessons learned. The experiences of the above efforts provide some lessons for future rural renewable energy technology applications in Fiji: • rural RET installations require high quality, reliable components. The more
remote the site, the more important long life and high reliability of service; • village technical management, maintenance, money management and repair have
generally been poor, even when fees have been charged to households for services. Better training of technicians is essential and is needed on a continuing basis;
• recipients need to place a high priority on the services provided by RE systems or the systems are very likely to fail. There must be a recipient’s commitment to properly operate, pay for costs and care for the project;
• undersizing of systems results in overloading and high failure rates. In the long run, it is more cost effective to oversize systems;

xiv
• Fiji’s tropical environment is hard on energy equipment, particularly electronics. Reliability requires properly designed components proven to perform well in the local environment;and
• an authority external to the village for operation, maintenance and fee collection is needed if village energy systems are to be successful in the long term. Village based institutional structures do not generally have the technical or management competence or discipline to enforce fee collection and proper maintenance.
Current experience. Excluding FEA, The current Fiji experience with renewable energy and current plans for the future are described below.: • Micro/mini hydro. The installed capacity of micro/mini hydro is 1,000 kW, 80%
of which is accounted for by FEA’s Wainikeu system in Vanua Levu. Four sites being monitored and considered for development by DoE have a combined potential of at least 220 kW and possibly far more.
• Biodiesel. The Vanuabalavu and Tavueni trial projects using coconut oil for diesel engines are not currently operating. The Vanuabalavu production system broke down requiring the expensive import of coconut oil from other islands so the engines are reportedly now using diesel fuel. The Taveuni system awaits parts for repair.
• Biogas. Several small-scale biogas digesters have been installed on pig farms and dairies through DoE. In 2003, PWD began building a locally financed biogas system at Suva’s sewage treatment plant. When complete, it will fuel a 250 kW engine providing electricity for internal use. An ADB loan to extend sewerage coverage may include a 1 MW biogas-fuelled generator.
• Solar PV. In mid-2004, there are nearly 400 households with electrification through solar PV producing about 40 MWh/year. Many outer island telephone exchanges and remote installations on the main islands use solar power but no details are available.
• Wind systems. DoE is monitoring the wind resource in several islands. FEA is beginning monitoring for proposed wind farms of 25 MW capacity on all three islands served. 5-15 MW of wind systems may be commissioned by 2007. A small 20 kW Vergnet wind system was installed at SOPAC’s headquarters in Suva in 2004.
Diesel/wind/PV hybrid. In 1997, PV and wind energy were integrated with an existing diesel generator at Nabouwalu government station in Vanua Levu. There are eight 6.7 kW wind turbines, 37.4 kW of PV and 200 kVA of diesel. The design demand is 720 kWh/day, with 60% intended to come from renewable sources. Initially, wind and solar did contribute over 60% but this fell steadily to less than 15% due to the loss of overseas technical support, lack of local capacity to train operators and technicians, and component failures, particularly the complex automatic interface between the solar, wind and diesel generators. Because fees only cover 30% of operating costs, PWD has no incentive to maintain the wind and solar components resulting in “diesel creep” – the increase in the diesel component of hybrid energy systems – as diesel operation is easier and better understood than maintaining and including the wind and solar components. Planned renewable energy investments. A number of RE projects are currently planned or under consideration in Fiji:

xv
• a proof-of-concept RESCO trial for 3,200 solar home systems in 75 remote communities. Funding is tentatively being sought from ADB with co-finance from France;
• the ADB’s Renewable Energy and Energy Efficiency Programme (REEP) is expected to develop at least one renewable energy project and one energy efficiency project for Fiji in 2005 for completion before 2010;
• Japan is funding about 100 household PV systems per year in Vanua Levu; • Tropik Wood plans to double wood waste for electricity production by 2005 with
most sold to FEA; • FSC is establishing a power subsidiary to use surplus bagasse (crushing season)
plus wood and coal (off season) tentatively to generate 25 MW of electricity for FEA;
• FEA is developing a wind farm near Sigatoka (Viti Levu) and investigating wind for the Labasa, Savusavu and Ovalau grids;
• companies have submitted proposals to FEA for possible geothermal development for Vanua Levu and FEA hopes to study the geothermal potential of Viti Levu;
• FEA is assessing the economics of distributed grid-connected solar power, up to 1 MW, in the Lautoka/Nadi area;and
• FEA is developing hydro at Vaturu and hopes to develop a new 40 MW project, both on Viti Levu.
6. BARRIERS TO DEVELOPMENT AND COMMERCIALISATION OF RENEWABLE ENERGY There are numerous barriers, which include fiscal, financial, legislative, regulatory and policy, institutional, technical, market and business, information, knowledge and public awareness, and miscellaneous. Barriers identified include: • there are no incentives to promote RET investments, (e.g. “green” interest rates,
tax incentives for businesses, assistance in accessing foreign investment for RETs).
• there are no preferential import duties on energy efficient appliances or renewable energy technologies;
• funds allocated annually to DoE are not adequate to meet the current demand for rural electrification in isolated rural communities or to address the huge backlog in demand;
• there are inadequate financial mechanisms available in rural areas, and to rural people, for the private development of renewable energy technologies for household and productive use;
• FEA is increasingly reliant on diesel for growth in generation and is actively seeking renewable options to replace diesel fuel. At current fuel costs, it appears that some investment in renewable energy may be attractive, development bank finance appears to be available and finance is not a key obstacle if FEA tariffs are increased. However, if the GoF refuses to allow FEA’s average tariff to rise sufficiently cover costs and finance loans, finance will be a serious barrier to FEA’s ambitious renewable energy programme;
• the policy of a single national tariff for grid-based electrification, and heavily subsidised PWD and village electrification, has made it impossible for private developers to profitably take over rural public grid systems (e.g. those at

xvi
government provincial centres) or to develop new ones (e.g. Fiji’s third largest island of Taveuni).
• there is no consistent national energy policy that provides for continuity of programmes through changes of government or changes of FEA management;
• legislation needs to be enacted to provide the legal basis for RESCO operations; • electricity legislation should be revised so that FEA’s objectives include cost-
effective energy conservation (i.e. demand side management), and preference for renewable energy where cost-effective. FEA should have the legal basis and incentives to provide efficient energy services, not just sell electricity;
• there is no sustainable institutional framework to develop and operate rural electrification on a commercial basis, including fee collections, and provide reliable service. FEA grid extensions are a partial exception but the capital costs of some remote extensions are highly subsidised;
• the allocation of funds to the DoE is insufficient for the development of adequate internal capacity to prepare the complex project documents needed for accessing international finance, for resource assessment, the management of large-scale renewable energy development processes and for the day-to-day regulation of those processes;
• secure access to land over the long term can be a serious barrier for both community scale and large-scale grid-connected renewable energy. There have been conflicts regarding remuneration for land, ending in court, between FEA and the landowners at its Monasavu hydro site for over twenty years. Since 2000, there have been a number of cases of landowners refusing to renew leases for land on which water supply dams, health centres, schools or government installations are located;
• the continuing high rate of migration from Fiji to other countries is a barrier that hinders sustainable institutional development for planning and operating renewable energy systems at both the village scale and the large scale;
• as in other PICs, there are no national standards or certifications to assure that RETs imported into Fiji are suitable for local conditions. (A similar barrier exists for effective energy efficiency services.);
• there is insufficient knowledge of Fiji’s large-scale (and mini) hydroelectric resource, with little long-term monitoring in recent years and relatively poor knowledge of the geothermal and wind energy resource;
• Fiji appears to have substantial near-shore sea wave and ocean thermal resources. However, there is no proven, commercially available technology to allow Fiji to exploit these resources;
• past project failures suggest to potential investors that renewable energy development is risky, making private sector involvement difficult to obtain without the inclusion of risk abatement incentives;
• there is limited understanding of the rural market for energy, making it difficult to determine the appropriate technology for use in different areas;
• there is limited expertise in business management and marketing strategies; • travel to outer islands is expensive, often time-consuming and irregular. Along
with small outer island populations, this makes it difficult to economically develop both public and private energy systems away from the main islands;

xvii
• training is not readily available for private sector development that focuses on rural project management and RESCO business operation. Technical training is not readily available for local maintenance and operation for technologies used in rural areas;and
• Fiji is susceptible to natural disasters, particularly cyclones, that can damage equipment and the resources needed to produce energy, e.g. hydro power systems, coconut trees, etc.
7. IMPLICATIONS OF LARGE SCALE RENEWABLE ENERGY USE Large scale PV development for rural electrification could improve education, health, productivity and better integration of rural areas into the national economy. Negative impacts could include poor management of spent batteries and other failed components, and increased pressure on the rural economy for cash to pay for appliances and services. Large-scale biofuel development could have a very positive economic benefit for rural areas by improving demand for coconuts or other oil-bearing crops and increasing cash incomes in rural areas. However there could be land access problems and constraints due to transport and logistics. There could be increased economic stability and security due to lowered dependence on imported oil and avoidance of some of the effects of variable petroleum prices. Large-scale development of alcohol-based biofuels could benefit the ailing sugar industry and help retain the economic base of the rural settlements of Viti Levu and Vanua Levu. Grid connected wind, hydro, geothermal and solar energy would reduce fuel imports, increasing economic stability and security, broadening the base of energy inputs to the grid, and mitigating the effects of drought. RETs could also increase private sector delivery of energy. Negative effects would include the need for FEA to greatly broaden its technical support capacity to include a wide range of generation technologies. There are environmental issues related to RE development but all can be managed if the systems are carefully planned.
8. CAPACITY DEVELOPMENT NEEDS Capacity development needs to remove barriers to RE in Fiji include those listed below. Fiscal. Increasedcapacity within DoE and MoF to assess the merits and disadvantages of a single national FEA tariff. Financial Green interest schemes and micro-credit schemes for private RE development require capacity development for rural credit management. Legislative, Regulatory and Policy. 1) Building capacity development into DoE’s efforts with PIEPSAP to develop a new national energy plan; 2) a current ADEME review of RESCO regulation may identify additional capacity development needs; and 3) capacity may be needed within DoE to revise and update national electricity legislation. Institutional. 1) The planned rapid expansion of solar home PV under RESCOs requires development of a wide range of technical, financial, planing and project implementation and monitoring skills within DoE; 2) FEA’s aggressive planned expansion of grid-connected RE will require significant skill development in technical

xviii
and operational aspects of those technologies, including wind and possibly also solar and geothermal. 3) Focused training for DoE in RE project design suitable for external funding; and 4) Improved DoE capacity to prepare documentation for accessing international finance. Technical. 1) Capacity development is needed for creating standards, inspection processes, and technical labour certification processes; and 2) Village-level hydro systems require increasing DoE skills in operation, troubleshooting and maintenance that are quite different from other RETs. 3) DoE and FEA require improved capacity to carry out wind and hydro resource assessments and evaluate results. Market and Business. 1) Private sector training for RESCO business operations and technical training for field technicians will be critical; 2) Capacity development may be appropriate for financial institutions to devise risk abatement incentives for RE energy development. Information, Knowledge and Public Awareness. Information needs to be developed and delivered to decision makers in both the public and private sectors regarding renewable energy and energy efficiency and there need to be public awareness programmes regarding energy efficiency and renewable energy to increase acceptance of RETs and energy efficiency measures. Other. DoE, FEA and NLTB may require increased capacity for developing mechanisms to involve landowners as partners in the development of community scale and large-scale grid-connected renewable energy.
9. IMPLEMENTATION OF CAPACITY DEVELOPMENT NEEDS AND CO-FINANCING OPPORTUNITIES The proposed parallel expansion of RE for both rural energy and grid-linked energy provides an opportunity for a focused capacity building programme creating long-term training and support systems for the technologies and processes used. Technical training relating to installation and maintenance of RE technologies will be required but management of the operational aspects of RE programmes will also require specialist training on a continuing basis for the decade (or more) duration of expansion of RE systems for rural and grid electrification. A strong base is required for private sector training in operating and maintaining RESCO operations for rural electrification. Since the RESCO concept is expected to be used for solar, biofuel, hybrid and wind technologies, a broad-based training capability will need to be developed, with a common focus of quality service provision. There are a number of renewable energy investments confirmed, planned or proposed in Fiji (most listed in 5 above under planned renewable energy investments) involving significant levels of loan and grant finance between 2005 and 2011. There could be several hundred millions of Fijian dollars in investment, probably all offering co-financing opportunities.

xix
TABLE OF CONTENTS
EXECUTIVE SUMMARY..................................................................................VII
1 COUNTRY CONTEXT...................................................................................1 1.1 PHYSICAL CHARACTERISTICS .....................................................................1 1.2 HISTORICAL AND POLITICAL DEVELOPMENT.......................................................2 1.3 POPULATION TRENDS............................................................................3 1.4 THE FIJI ECONOMY..............................................................................5 1.5 ENVIRONMENTAL CONTEXT .................................................................... 10
2 ENERGY INSTITUTIONS, POLICIES AND LEGISLATION ................................................ 12 2.1 INSTITUTIONAL CONTEXT FOR ENERGY......................................................... 12 2.2 ENERGY POLICIES AND PLANS.................................................................. 15 2.3 LEGISLATION RELATED TO ENERGY AND ENERGY-ENVIRONMENT MATTERS....................... 17
3 ENERGY SUPPLY AND PRICING ...................................................................... 20 3.1 PETROLEUM................................................................................... 20 3.2 ELECTRICITY .................................................................................. 22
4 ENERGY DEMAND ................................................................................... 30 4.1 HOUSEHOLD .................................................................................. 30 4.2 PETROLEUM................................................................................... 30 4.3 ELECTRICITY .................................................................................. 32 4.4 PROJECTED FOSSIL FUEL USE AND GHG EMISSIONS ............................................ 34
5 RENEWABLE ENERGY................................................................................ 39 5.1 RESOURCES ................................................................................... 39 5.2 PROJECT EXPERIENCE ......................................................................... 48
6 BARRIERS TO DEVELOPMENT AND COMMERCIALISATION OF RENEWABLE ENERGY.................... 64 6.1 FISCAL........................................................................................ 65 6.2 FINANCIAL .................................................................................... 65 6.3 LEGISLATIVE, REGULATORY AND POLICY ....................................................... 66 6.4 INSTITUTIONAL................................................................................ 66 6.5 TECHNICAL ................................................................................... 67 6.6 MARKET AND BUSINESS ........................................................................ 67 6.7 INFORMATION, KNOWLEDGE AND PUBLIC AWARENESS .......................................... 68 6.8 OTHER........................................................................................ 68
7 IMPLICATIONS OF LARGE SCALE RENEWABLE ENERGY USE .......................................... 69 7.1 GENERAL BENEFITS OF RENEWABLE ENERGY ................................................... 69 7.2 ENVIRONMENTAL IMPLICATIONS OF WIDESPREAD USE OF RENEWABLE ENERGY................... 69

xx
8 CAPACITY DEVELOPMENT NEEDS.................................................................... 73 8.1 FISCAL........................................................................................ 73 8.2 FINANCIAL .................................................................................... 73 8.3 LEGISLATIVE, REGULATORY AND POLICY ....................................................... 73 8.4 INSTITUTIONAL................................................................................ 74 8.5 TECHNICAL ................................................................................... 74 8.6 MARKET AND BUSINESS ........................................................................ 75 8.7 INFORMATION, KNOWLEDGE AND PUBLIC AWARENESS .......................................... 75
9 IMPLEMENTATION OF THE CAPACITY DEVELOPMENT NEEDS & CO-FINANCING OPPORTUNITIES ..... 76
10 ANNEXES............................................................................................ 77 ANNEX A – PEOPLE INTERVIEWED IN FIJI ................................................................ 77 ANNEX B - REFERENCES FOR FIJI PIREP REPORT ....................................................... 79 ANNEX C – FIJI DEPARTMENT OF ENERGY STAFF TRAINING (1994-2002)................................ 84 ANNEX D – NAMARA, KADAVU SOLAR HOME SYSTEM INSTALLATIONS ..................................... 87 ANNEX E - NAROI, LAU GROUP, SOLAR HOME SYSTEM INSTALLATIONS................................... 89 ANNEX F - VUNIVAU SOLAR HOME SYSTEM INSTALLATIONS............................................... 93 ANNEX G – OVERVIEW OF FIJI OUTER ISLAND SOLAR HOME SYSTEM INSTALLATIONS ...................... 95

xxi
Map showing the location and main islands of the Republic of the Fiji Islands
Source: www.lib.utexas.edu/maps

1
1 COUNTRY CONTEXT
1.1 Physical Characteristics
The Republic of the Fiji Islands consists of more than 320 islands, about one-third of which are inhabited. Lying between 177° E and 178° W Longitude and 12° and 22° S Latitude, the islands encompass an Exclusive Economic Zone (EEZ) of 1.6 million km² and a land area of 18,333 km2. The capital Suva is 3,200 km NE of Sydney, Australia and 2,100 km north of Auckland, New Zealand. Although many islands are low-lying coral structures with limited soil and water, the majority of the land is on continental-like volcanic islands that rise to well over 1000 metres in elevation. As Table 1-1 shows, over 87% of the land is concentrated in the two islands of Viti Levu and Vanua Levu. The six largest islands account for over 93% of all land areas.
The larger volcanic islands are characterised by steep, mountainous country, deeply incised by rivers and streams, supporting a wide variety of ecosystems with significant areas of natural forest and coastal and marine ecosystems including mangrove forests and coral formations. The islands are bordered by an extensive system of fringing and barrier reef including the Astrolabe Reef, the third largest barrier reef structure in the world. The climate is tropical with an average annual temperature of 26oC and relatively heavy annual rainfall, especially on the windward sides of the larger islands. The average annual rainfall ranges from 1800 - 2600 mm. Fiji is considerably richer in natural resources than its Polynesian and Micronesian neighbours. There are areas of tropical rainforest containing valuable timbers, alluvial plains rich in soil, cool high uplands suitable for temperate produce, and commercially viable mineral deposits, fish, and other marine resources.
Table 1-1 – Physical Characteristics of Fiji’s Islands
Island Area (km2)
% of total Features
Viti Levu 10,429 56.9 Volcanic, well forested with 29 peaks >900 m (highest is 1325 m), about 50 rivers (largest is Rewa of which 130 km is navigable). SE is wettest and W / NW driest.
Vanua Levu 5,556 30.3 Volcanic, well-forested with peaks over 1,000 m, about 40 rivers and over 20 thermal springs spread over 3,900 km2
Taveuni 470 2.6 Volcanic, well-forested with highest peak of 1,230 m; numerous waterfalls, many inaccessible. One small lake.
Kadavu 411 2.2 Volcanic with highest peak of 835 m. Well-watered by short streams Gau 140 0.8 Rugged, hilly with 550 m peak. Well-watered by short streams. Koro 104 0.6 Rugged with two peaks over 700m and both rainforest and dry zone
vegetation. About 300 others 1,223 6.6 Vary but mostly low islands, many coral Total 18,333 100 Sources: Fiji government (GoF, 1997)
Fiji is subject to natural hazardous events including earthquakes, landslides, cyclones, flooding and storm surges. Since 1931 natural disasters (winds, earthquakes, floods and drought) have caused over US$715 million in damage and there have been at least ten events since 1972 which each affected between 30,000 and 265,000 people. Among the Pacific Island Countries (PICs), Fiji is second only to Papua New Guinea

2
(PNG) as the most affected by natural disasters from 1990-1999.1 These natural hazards, often exacerbated by inadequate environmental management, can have a considerable practical impact on the economic and technical viability of otherwise appropriate renewable energy (RE) investments.
1.2 Historical and Political Development
After nearly a century as a British colony, on 10 October 1970 Fiji became an independent dominion within the Commonwealth. Under the 1970 constitution, Fiji adopted a Westminster form of parliamentary government with a complicated cross-voting system that assured a reasonable balance within parliament between indigenous Fijians and Indo-Fijians (descendants of indentured Indian labourers, brought to work the sugarcane fields between 1879 - 1916). From 1970 until April 1987, except for several weeks, Fiji was ruled by the Alliance Party, a multi-ethnic grouping dominated by ethnic Fijians, under the late Prime Minister Ratu Sir Kamisese Mara, the eastern Fiji high chief, or Tui Nayau.
In April 1987, the Fiji Labour Party (FLP), in coalition with the Indo-Fijian-dominated National Federation Party (NFP), won the national elections and Fijian Dr Timoci Bavadra became Prime Minister. Within a month, the coalition government was overthrown by a military coup led by Lieutenant-Colonel Sitiveni Rabuka, followed by a period of uncertainty and a second coup in September 1987. Coup leader Rabuka, by then a major-general, declared Fiji a republic on 6 October 1987. A new constitution in 1990 shifted political power further to ethnic Fijians, and former Prime Minister Mara headed an interim civilian government from 1990 pending new elections. In 1992, Rabuka was elected as prime minister, a position he held until 1999.
In 1997, following extensive deliberations and widespread public consultations, a new constitution was promulgated. It has been widely praised internationally for its balance and protection of human rights but has also been heavily criticised by some traditional leaders and nationalists. In May 1999, free and peaceful elections under the 1997 constitution were won by the “People’s Coalition” under FLP leader and Indo-Fijian Mahendra Chaudhry who became prime minister. Barely a year later, a civilian coup d’état led to the coalition’s ouster and yet another period of political turmoil and uncertainty, including a military-appointed government.
Parliamentary elections in August 2001 provided Fiji with a democratically elected government under current Prime Minister Laisenia Qarase. Under the 1997 constitution, the prime minister establishes a multi-party cabinet, inviting all parties with more than 10% of the membership of the elected House of Representatives to form cabinet. The numbers and membership within cabinet, i.e. interpretation of the rules for power sharing, have been issues of contention from 2001 until the present, with the matter going twice to the Supreme Court. As of October 2004, the FLP, under former Prime Minister Chaudhry, remains outside of cabinet.2
Fiji’s current head of state is President Ratu Josefa Iloilovatu Uluivuda (since 2000) and the Prime Minister is Laisenia Qarase (since 10 September 2000). Cabinet is
1 The sources are the WHO website www.who.int/disasters summarising UN-OCHA’s Situation Reports on Natural Disasters
and the International Disaster Database (www.em-dat.net - Université catholique de Louvain, Brussels). 2 The Supreme Court ruled in 2004 that the Fiji Labour Party (FLP) is entitled to nearly half of all cabinet positions but
cabinet numbers and membership remain unresolved.

3
appointed by the prime minister from among the members of parliament and is responsible to parliament. The Bose Levu Vakaturaga, or Great Council of Chiefs, consisting of the highest-ranking members of the traditional chiefly system, elects the president for a five-year term, with the prime minister appointed by the president. Parliament is bicameral, consisting of a Senate (34 seats; 24 appointed by the Great Council of Chiefs, nine appointed by the president, and one appointed by the council of Rotuma), and a House of Representatives (71 seats; 23 reserved for ethnic Fijians, 19 for Indo-Fijian, three for other ethnic groups, one for Rotumans, and 25 open seats). Members serve five-year terms. Elections were last held in August-September 2001, and are scheduled to be next held by September 2006.
Fiji’s government leadership since 1990, and responsibility for the energy sector, are summarised in Table 1-2. During this period, there have been three elections. The first in 1992 elected Sitiveni Rabuka’s Soqosoqo Vakavulewa Ni Taukei (SVT) party and its coalition partners into government. The second, in 1994, returned the SVT and a slightly changed coalition to power. The third, in October 2001, elected the current Soqosoqo Duavata Ni Lewenivanua/Conservative Alliance Matanitu Vanua (SDL/CAMV) coalition under Prime Minister Qarase.
Table 1-2 – Fiji Government Leadership and Energy Minister Since 1990 Period Government Prime Minister Minister for Energy Jan 1990 - June 1992 Interim Civilian Government Ratu Sir Kamasese K. Mara David Pickering ?? June 1992 - Mar 1994 SVT / General Voters
coalition Sitiveni L. Rabuka M. Narawa
Mar 1994 - May 1999 SVT / General Voters / Fijian Association coalition
Sitiveni L. Rabuka Ratu Timoci Vesikula; Ratu Inoke Kubuabola
May 1999 - May 2000 Peoples’ Coalition Mahendra P. Chaudhry S.S. Sharma May 2000 - Mar 2001 See note below None none Mar 2001 - Oct 2001 Interim Civilian Government Laisenia Qarase Jokatani Cokanasiga Oct 2001 - Aug 2004 SDL / CAMV Coalition Laisenia Qarase Savenanca Draunidalo
Note: Executive Authority vested in H. E. the President Ratu Sir Kamasese K. Mara then in Vice-President H.E. Ratu Josefa Iloilo (later President) following prorogation of parliament
1.3 Population Trends
A national census of population and housing is normally carried out every ten years in Fiji. As the most recent census was held in 1996, some information useful for energy planning is considerably out of date. Figure 1-1 summarises overall population growth from 1881 to 1996, with projections through 2006. The slowdown in growth after 1986 is due largely to increased outward migration. In August 1996, Fiji’s population was 775,077, an annual average growth rate (AAGR) of only 0.8% since 1986. Of the total, 50.8% were Fijian, 43.7% were Indo-Fijian, and 5.5% were from other ethnic communities. Urban dwellers constituted 46.4% of Fiji’s people and rural dwellers 53.6%. Suva, the national capital and largest city (Table 1-3), had nearly 170,000 people or 47% of
Figure 1-1 – Fiji Census Population 1881-1996 & Projections to 2006
0
200,000
400,000
600,000
800,000
1,000,000
1881 1901 1921 1946 1966 1986 2006
Source: Fiji Bureau of Statistics, 2004

4
the urban population of Fiji. The Suva-Nausori-Lami corridor has well over a quarter of a million people.
By 2004, Fiji’s population had reached an estimated 844,000 with the rapidly-growing urban population over 48% of the total (Table 1-4). Indigenous Fijians, according to the Bureau of Statistics (BOS), now comprise 52.6% of the population, Indo-Fijians 41.0%, and others 6.4 percent.
Table 1-5 shows the concentration of population by island. In 1996, 77% of the population was concentrated in the largest island of Viti Levu (with 57% of land area) and 95% lived in the three largest islands, including nearby small islands (with 90% of Fiji’s land area). With over 90% of Fiji’s urban population living in Viti Levu in 1996, and the urban population increasing at an AAGR of 4%, the percentage of the population on the main island is even higher today.
Table 1-5 – Population by Island Group in 1996
Location Population % of Fiji’s population
% of Fiji’s Land area
Viti Levu * 594,791 77 56.9 Vanua Levu / Taveuni ** 139,516 18 32.9 Other islands *** 40,770 5 10.2 Total 775,077 100 100 * Central & Western Divisions. Includes Yasawa / Mamanuca groups & offshore islands ** All of Macuatu, Cakaudrove & Bua Provinces *** Eastern Division Source: Report of 1996 Census (GoF, 1998)
According to the Ministry of Finance and National Planning (MoF)3 between 1986 and 1996, an estimated net 12% of Fiji’s 1986 labour force emigrated (33,000 of 274,000): “From the standpoint of occupational distribution of this workforce, the loss through emigration of persons with middle-and high-level manpower (defined as those requiring post-secondary qualifications) was particularly severe both in qualitative and quantitative terms. The emigration of the 19,000 managers, professionals, technicians and associate professionals, and clerical workers represents 53% of the 1986 stock of such workers.” This loss of over half of Fiji’s skilled workforce, that can only be replaced slowly through training and work experience, along with continuing migration, is the most worrying demographic trend in Fiji.
3 The source is the Fiji Computerised Human Resources Information System (CHRIS), which is available at
http://www.fijichris.gov.fj/).
Table 1-3 – Main Cities and Towns, 1996
Location Population Viti Levu: Suva 167,975 Lautoka 43,274 Nadi 30,884 Nausori 21,617 Lami 18,928 Ba 14,716 Sigatoka 7,862 Tavua 2,419 Vanua Levu: Labasa 24,095 Savusavu 4,970 Ovalua: Levuka 3,746 Note: includes urban and peri-urban populations
Table 1-4 – Population from 1986 and 1996 Census Reports and
Projections Year Population Source Urban Rural 1986 715,375 1986 census 38.7% 61.3% 1996 775,077 1996 census 46.4% 53.6% 2004 844,421 BoS Estimate 48.0% 52.0% 2006 863,294 BoS Estimate 48.3% 51.7%
Source: Bureau of Statistics, February 2004

5
1.4 The Fiji Economy
1.4.1 Overview of the economy
For several decades, Fiji’s economy has been highly dependent on agricultural exports (mostly sugar and molasses), a range of manufactured goods (led by garments), minerals (gold), other primary products (timber, timber products, fish), and tourism (the largest tourist industry among the PICs).
From 1995 through 2002, Fiji’s Gross Domestic Product (GDP; Table 1.6) grew in real terms at an AAGR of 2.4% from F$2.37 billion to F$2.795 billion in 1995 dollars, equivalent to GDP/capita in 2002 of F$3,382. Expressed in current dollars, GDP in 2002 was F$3.44 billion or F$4,165 (about US$2,290) per capita.
Table 1-6 – Fiji’s GDP By Activity at Constant Prices of 1995 at Factor Cost (F$ thousands))
Activity 1995 1996 1997 1998 1999 2000 2001 2002
1 AGRICULTURE, FORESTRY & FISHING 475,901 498,373 443,037 412,265 467,816 462,433 435,567 454,250 1.1 Crops 233,422 247,339 202,479 163,374 207,977 199,329 186,309 197,718 1.1.1 Sugarcane 178,607 178,607 136,497 100,689 143,059 131,761 121,853 124,721 1.12 Other Crops 54,815 68,732 65,982 62,685 64,918 67,568 64,456 72,997 I.2 Livestock Products 16,679 17,757 15,259 16,125 15,886 16,028 15,822 16,168 1.3 Fishing 65,765 71,666 65,857 68,740 82,292 84,617 70,986 80,959 1.4 Forestry 38,806 39,657 35,924 39,222 34,790 36,334 35,370 30,706 1.5 Subsistence 103,152 108,914 110,298 111,543 112,097 112,789 114,311 2 MINING & QUARRYING 37,650 48,945 50,128 40,178 47,633 40,845 41,566 40,081 3 MANUFACTURING 330,612 346,272 372,550 392,101 421,004 391,660 435,845 436,268 3.1 Sugar 88,579 88,579 67,702 49,948 70,239 65,556 60,483 61,849 3.2 Other Food Industries 32,743 32,874 29,862 31,040 30,484 26,325 30,058 33,267 3.3 Non-Food Industries 178,282 192,706 240,931 275,437 280,213 259,061 299,808 292,487 3.2.1 Clothing and Footwear 54,534 68,331 110,213 139,934 147,242 139,825 178,054 156,349 3.3.2 Other Non-Food Industries 123,748 124,375 130,718 135,503 132,971 119,236 121,754 136,138 3.3 Informal Sector 9,617 10,123 10,461 10,798 11,169 11,541 11,912 12,215 4 ELECTRICITY AND WATER 76,438 81,971 84,165 87,043 95,444 93,980 100,150 104,419 5 CONSTRUCTION 132,179 142,250 129,157 124,766 131,942 114,351 121,817 139,045 6 WHOLESALE & RETAIL TRADE & RESTAURANTS & HOTELS 361,484 368,113 382,987 407,707 438,541 413,646 442,126 457,559 6.1 Wholesale & Retail Trade 248,954 253,961 263,368 279,948 297,520 300,180 319,157 323,610 6.2 Restaurants & Hotels 112,530 114,152 119,619 127,759 141,020 113,466 122,969 133,948 7 TRANSPORT & COMMUNICATION 293,624 321,038 330,348 342,667 380,338 362,215 353,333 375,316 7.1 Transport and Storage 208,510 222,379 232,814 245,235 273,361 249,860 249,568 274,978 7.2 Communication 85,114 98,659 97,534 97,432 106,977 112,355 103,765 100,338 8 FINANCE, INSURANCE, REAL ESTATE & BUSINESS SERVICES 383,412 390,232 348,746 339,269 316,939 345,113 368,634 365,399 8.1 Finance 141,909 137,967 127,295 131,971 77,672 92,663 102,957 98,448 8.2 Insurance 52,681 56,311 33,810 28,256 60,975 67,088 91,526 107,647 8.3 Real Estate & Business Services 188,822 195,954 187,640 179,042 178,293 185,362 174,151 159,304 8.4 Ownership Dwellings 114,476 115,519 117,457 118,799 120,140 120,736 121,482 123,121 9 Community SOCIAL & PERSONAL SERVICES 433,579 435,665 424,119 454,288 468,928 484,484 491,068 527,992 OTHERS 382,206 382,974 371,181 400,399 412,612 426,663 431,732 467,387 LESS IMPUTED BANK SERVICE CHARGES 151,891 147,672 136,250 141,255 83,136 99,181 110,199 105,374 GRAND TOTAL 2,372,987 2,485,187 2,428,987 2,459,029 2,685,449 2,609,548 2,679,907 2,794,965 MEMORANDUM ITEMS: SUGAR PRODUCTION (thousand tonnes) 454 454 347 256 364 335 310 317 VISITOR ARRIVALS (thousands) 318 340 359 371 410 294 348 398 Source: Key Statistics (Fiji Islands Bureau of Statistics, March 2004)
As Figure 1-2 illustrates, since independence in 1980, GDP has been extremely variable, frequently vacillating between contraction and expansion, with a long-term trend somewhat above population growth, i.e. growth per capita has increased only modestly.

6
Figure 1-2 – Real GDP Growth in Fiji 1980-2005
-10
-8
-6
-4
-2
0
2
4
6
8
10
'80 '81 '82 '83 '84 '85 '86 '87 '88 '89 '90 '91 '92 '93 '94 '95 '96 '97 '98 '99 '00 '01 '02 '03 '04 '05
Sources: BoS, 2004 for 1980-2002; ADB, 2004 for 2003-2005 projections
In 2002, Fiji’s exports were valued at F$1.2b dollars led by garments (32%), sugar and molasses (29%), and gold and fish (9% each), shown in Figure 1-3. Imports totalled nearly F$2.0b dollars led by machinery (31%), manufactured goods (20%) and petroleum products (15%), a trade deficit of F$760m dollars.
Figure 1-3 – Fiji’s Main Exports and Imports in 2002
Source: Key Statistics (BoS, March 2004)
7
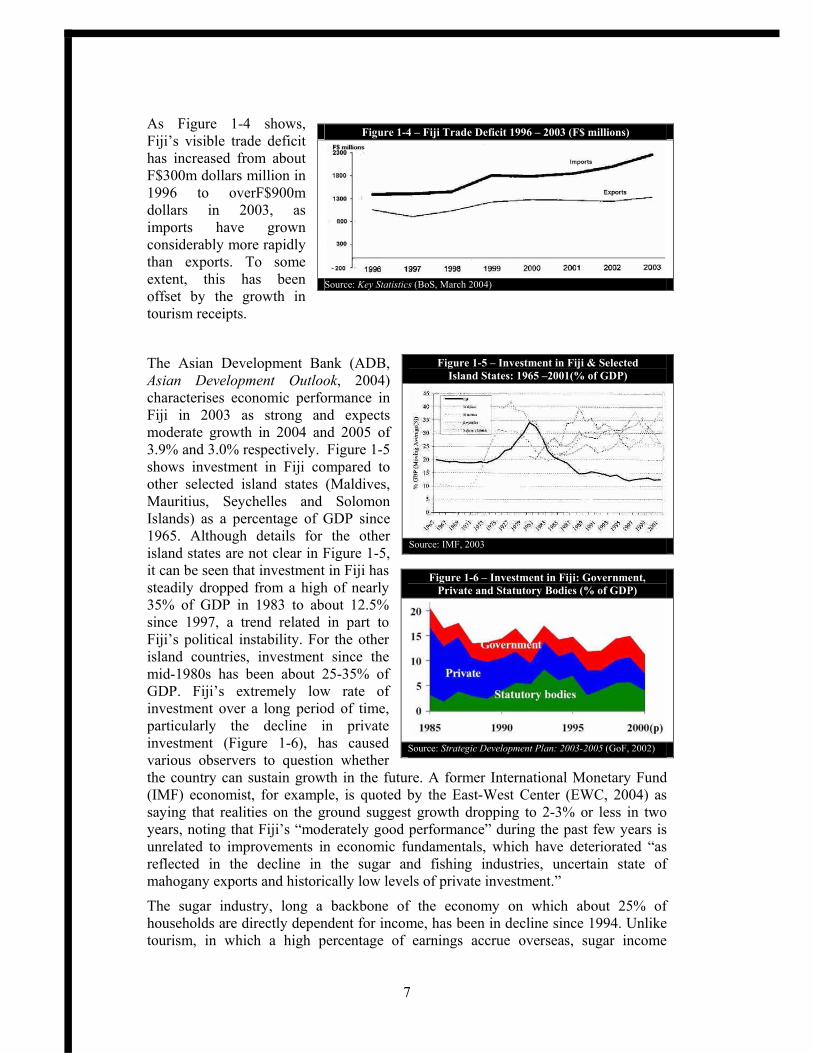
As Figure 1-4 shows, Fiji’s visible trade deficit has increased from about F$300m dollars million in 1996 to overF$900m dollars in 2003, as imports have grown considerably more rapidly than exports. To some extent, this has been offset by the growth in tourism receipts.
The Asian Development Bank (ADB, Asian Development Outlook, 2004) characterises economic performance in Fiji in 2003 as strong and expects moderate growth in 2004 and 2005 of 3.9% and 3.0% respectively. Figure 1-5 shows investment in Fiji compared to other selected island states (Maldives, Mauritius, Seychelles and Solomon Islands) as a percentage of GDP since 1965. Although details for the other island states are not clear in Figure 1-5, it can be seen that investment in Fiji has steadily dropped from a high of nearly 35% of GDP in 1983 to about 12.5% since 1997, a trend related in part to Fiji’s political instability. For the other island countries, investment since the mid-1980s has been about 25-35% of GDP. Fiji’s extremely low rate of investment over a long period of time, particularly the decline in private investment (Figure 1-6), has caused various observers to question whether the country can sustain growth in the future. A former International Monetary Fund (IMF) economist, for example, is quoted by the East-West Center (EWC, 2004) as saying that realities on the ground suggest growth dropping to 2-3% or less in two years, noting that Fiji’s “moderately good performance” during the past few years is unrelated to improvements in economic fundamentals, which have deteriorated “as reflected in the decline in the sugar and fishing industries, uncertain state of mahogany exports and historically low levels of private investment.”
The sugar industry, long a backbone of the economy on which about 25% of households are directly dependent for income, has been in decline since 1994. Unlike tourism, in which a high percentage of earnings accrue overseas, sugar income
Figure 1-4 – Fiji Trade Deficit 1996 – 2003 (F$ millions)
Source: Key Statistics (BoS, March 2004)
Figure 1-5 – Investment in Fiji & Selected Island States: 1965 –2001(% of GDP)
Source: IMF, 2003
Figure 1-6 – Investment in Fiji: Government, Private and Statutory Bodies (% of GDP)
Source: Strategic Development Plan: 2003-2005 (GoF, 2002)

8
remains largely within Fiji, circulating through the economy. It has been clear for a decade or more that Fiji’s preferential access to the European sugar market at highly subsidised prices cannot be sustained and that significant restructuring of, the industry is both overdue and essential if Fiji is to remain, or become, competitive. However, one aspect of Fiji’s political instability has been the inability to address this issue, which encompasses land lease arrangements for primarily Indo-Fijian tenant farmers, poor supply of cane to mills, transportation, and mill inefficiencies.
The Fiji Sugar Corporation (FSC) is 68% owned by the Government of Fiji (GoF), with 17% of shares held by the Fiji National Provident Fund (FNPF). The IMF, based on information from FSC, has projected increasingly heavy FSC losses reaching over F$33 million by 2008 if no action is taken very soon (Table 1-7).
Table 1-7 – FSC’s Estimated Profits and Losses in F$ millions
Year 1997 1998 1999 2000 2001 2002 2003 2004 2005 2006 2007 2008 Profit or loss -1.2 -3.0 2.0 -3.3 -20.8 -19.0 -11.0 -16.1 -18.7 -21.9 -32.0 -33.5 Source: Fiji Selected Issues and Statistical Annex (IMF, 2003)
Since this analysis was carried out, the World Trade Organisation (WTO) has issued a ruling against internal European Union (EU) sugar subsidies. This will affect the EU agreement with Asia-Caribbean-Pacific countries (the ACP group) providing for subsidised sugar exports from the ACP to the EU. This decision, if upheld as expected, would reportedly (Fiji Times, 2004) cost Fiji about F$7 million annually in lost export revenue. According to the FSC chair (reported by Radio Australia, 2004), the impact on Fiji could be ‘catastrophic’.
Uncertainty over the future of the Fiji sugar industry has considerable implications for Fiji’s national energy use and development. The FSC produces processing steam from bagasse (sugar cane waste), plus a significant amount of electricity, some of which is sold to the Fiji Electricity Authority (FEA) for distribution through its distribution grids. There have been discussions between FSC and FEA regarding proposed investments that could substantially increase the amount of electricity provided by FSC to FEA. This is discussed in chapters 4 - 5.
The GoF is well aware of the need to restructure the sugar industry and to increase investment in education, health, and infrastructure. The government’s Strategic Development Plan: 2003-2005 (GoF, 2002) was formulated after wide consultation and includes a range of public service reforms, legislative changes, tax reforms, etc. meant to stimulate investment and promote economic growth. Among the goals is an increase in overall investment to the level of 25% of GDP. Noting that the percentage of households living in poverty grew from an estimated 15% in 1983 to nearly 26% in 1996 (worsening further following the 2000 political crisis according to ADB, 2003), the plan includes a range of measures meant to reduce poverty.
As shown in Table 1.8, Fiji is signatory to the three Pacific regional trade and economic agreements, the most important of which are the Pacific Island Countries Trade Agreement (PICTA) and the Pacific Agreement on Closer Economic Relations (PACER; between PICTA signatories and Australia and New Zealand). The GoF has also signed the Cotonou
Table 1-8 – Fiji and Regional Economic Treaties
Status SPARTECA PACER PICTA
Signed Ratified Entered into force
– 02 Dec 1980 01 Jan 1981
18 Aug 2001 16 Oct 2001 03 Oct 2002
18 Aug 2001 16 Oct 2001 13 April 2003
Source: Discussions with Pacific Islands Forum Secretariat (Jan. 2004)
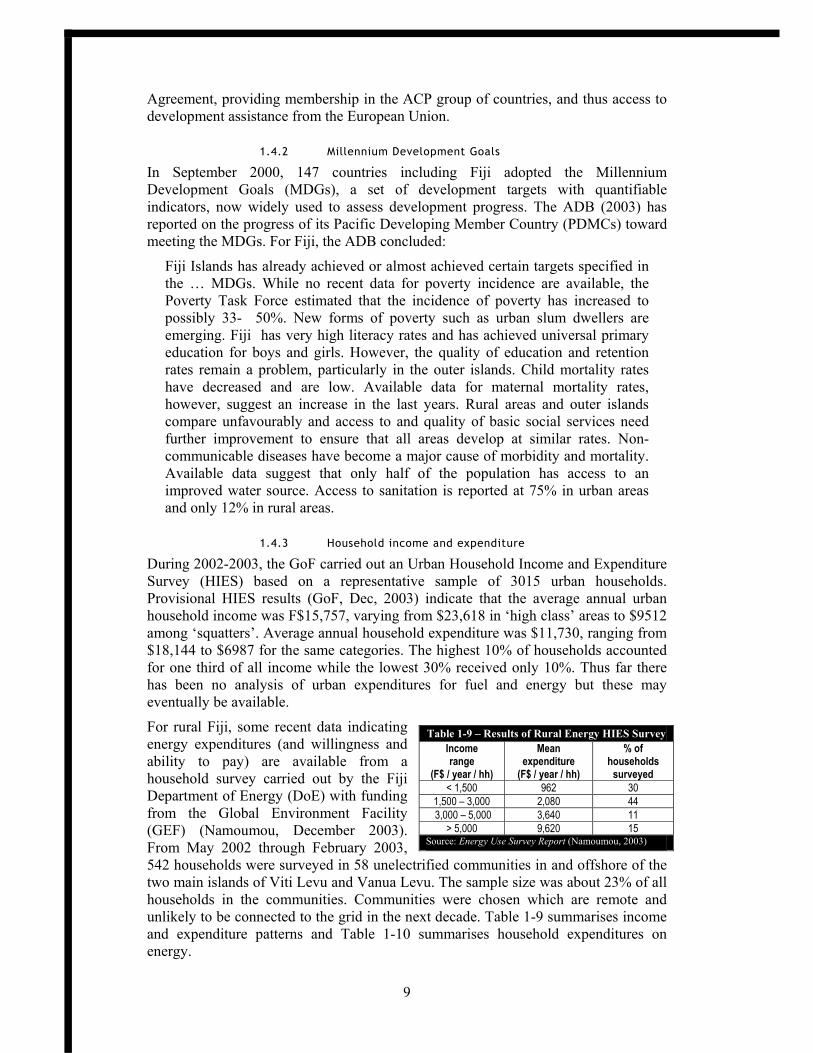
9
Agreement, providing membership in the ACP group of countries, and thus access to development assistance from the European Union.
1.4.2 Millennium Development Goals
In September 2000, 147 countries including Fiji adopted the Millennium Development Goals (MDGs), a set of development targets with quantifiable indicators, now widely used to assess development progress. The ADB (2003) has reported on the progress of its Pacific Developing Member Country (PDMCs) toward meeting the MDGs. For Fiji, the ADB concluded:
Fiji Islands has already achieved or almost achieved certain targets specified in the … MDGs. While no recent data for poverty incidence are available, the Poverty Task Force estimated that the incidence of poverty has increased to possibly 33- 50%. New forms of poverty such as urban slum dwellers are emerging. Fiji has very high literacy rates and has achieved universal primary education for boys and girls. However, the quality of education and retention rates remain a problem, particularly in the outer islands. Child mortality rates have decreased and are low. Available data for maternal mortality rates, however, suggest an increase in the last years. Rural areas and outer islands compare unfavourably and access to and quality of basic social services need further improvement to ensure that all areas develop at similar rates. Non-communicable diseases have become a major cause of morbidity and mortality. Available data suggest that only half of the population has access to an improved water source. Access to sanitation is reported at 75% in urban areas and only 12% in rural areas.
1.4.3 Household income and expenditure
During 2002-2003, the GoF carried out an Urban Household Income and Expenditure Survey (HIES) based on a representative sample of 3015 urban households. Provisional HIES results (GoF, Dec, 2003) indicate that the average annual urban household income was F$15,757, varying from $23,618 in ‘high class’ areas to $9512 among ‘squatters’. Average annual household expenditure was $11,730, ranging from $18,144 to $6987 for the same categories. The highest 10% of households accounted for one third of all income while the lowest 30% received only 10%. Thus far there has been no analysis of urban expenditures for fuel and energy but these may eventually be available.
For rural Fiji, some recent data indicating energy expenditures (and willingness and ability to pay) are available from a household survey carried out by the Fiji Department of Energy (DoE) with funding from the Global Environment Facility (GEF) (Namoumou, December 2003). From May 2002 through February 2003, 542 households were surveyed in 58 unelectrified communities in and offshore of the two main islands of Viti Levu and Vanua Levu. The sample size was about 23% of all households in the communities. Communities were chosen which are remote and unlikely to be connected to the grid in the next decade. Table 1-9 summarises income and expenditure patterns and Table 1-10 summarises household expenditures on energy.
Table 1-9 – Results of Rural Energy HIES Survey Income range
(F$ / year / hh)
Mean expenditure
(F$ / year / hh)
% of households
surveyed < 1,500 962 30
1,500 – 3,000 2,080 44 3,000 – 5,000 3,640 11
> 5,000 9,620 15 Source: Energy Use Survey Report (Namoumou, 2003)

10
A further analysis of monthly expenditure on lighting fuels and batteries for radios for a smaller sample of Viti Levu and Vanua Levu households in the two islands is shown in Figure 1-7. Average monthly expenditure is F$18.60 with 38% of households spending F$20 or more, the amount DoE calculates is necessary for household solar lighting to be viable (i.e. meeting full operating and maintenance costs). The study estimates that 12,000 unelectrified rural households are potential users of PV systems. Extrapolating the survey results, about 4600 households already pay F$20/m or more for lighting and batteries and thus can afford this amount for PV systems providing the same services. About 9000 families could afford F$15 or more.
Figure 1-7 – Monthly Kerosene and Benzine Expenditures for Lighting and Radio Batteries; Un-electrified Villages
Source: Prepared by Luis Vega from data in Energy Use Survey Report (Namoumou, Dec. 2003
1.5 Environmental Context
Fiji’s national development plan for 2003-2005 (GoF, 2002) notes that proper management of the environment and sustainable use of natural resources are critical for the sustainable development of Fiji's largely natural resource based economy. The plan lists the key national environmental issues as land degradation, air and water pollution, refuse disposal, and the future effects of climate change and sea level rise. Planned actions during the plan period include better enforcement of existing
Table 1-10 – Rural Household Expenditure on Energy Expenditure
(F$/m) Appliances and
applications Notes
< 20 Two lanterns, flashlight, radio, 2-burner stove
Low income household; small house one – two bedrooms; basic lighting needs three – four occupants
20 – 40 Two – three lanterns, radio, flashlight, 1 or 2 -burner stove
As above
40-45 2-3 lanterns, radio, torch, stove, brush-cutter, chain saw
Medium size house; three to four bedrooms/rooms; six occupants
> 45
Tube lighting, TV/video, radio, outboard motor (coastal villages), brush-cutter, chain saw, refrigeration
90% own diesel genset – often power extension cords connecting neighbouring houses
Source: Energy Use Survey Report (Namoumou, Dec. 2003)
0 1 2 3 4 5 6 7 8 9
1 0%
1 1%
1 2%
1 3%
1 4%
1 5%
1 6%
1 7%
1 8%
1 9%
2 0%
3 .7 7 .5 1 2 . 1 7 . 2 2 . 27 . 3 2 . 3 7 . 4 2 . 4 6 . 5 2 . 5 7 . 6 2 . 69 .
A v e ra ge E xp e n d itu res in $5 R a n g e In c re m e n ts
A ve ra g e : F $ 1 8 .6 M a x im u m : F $ 6 9 .6 M in im u m : F $ 1 .2 3 8% e xc ee d F $ 2 0
M o n th ly K ero sen e & B en z in e E x p en d itu re fo r L ig h tin g an d R ad io B a tte r ies F o r 4 2 3 h ou seh o ld s in 4 7 un e lec tr ified v illag es (V iti L ev u an d V an u a L ev u )
Perc
ent O
ccur
renc
e

11
legislation, increased public awareness of environmental issues and new legislation (discussed in the next chapter) to minimise continuing damage to the environment.
Environmental sector objectives to be addressed by 2005 related to energy include development of a national implementation strategy on climate change, improved waste management, the reduction of vehicle emissions by 50%, the identification of feasible biofuels to replace petroleum, a ban on all adulterated fuels, and environmental audits for all public organisations.
Fiji has ratified a number of important international environmental conventions including the Convention on Biological Diversity), the Ramsar Wetlands Convention, the Framework Convention on Climate Change (UNFCCC), the London Convention on the Prevention of Marine Pollution, the Montreal Protocol on Ozone-depleting Substances, the Convention on the Illegal Trade in Endangered Species (CITES), the Convention on the Conservation and Management of Highly Migratory Fish Stocks in the Western and Central Pacific Ocean and the Apia Convention on the Conservation of Nature in the South Pacific. These conventions bind signatory countries to observe the regulatory measures contained in them. Table 1-11 summarises the status and date of signing of some key environmental conventions.
Table 1-11 – Ratification of Environmental Treaties and Conventions by Fiji
Status in Fiji
Protection of natural resources (SPREP
Convention)
Conservation of nature
(Apia Convention)
Hazardous wastes
(Waigani Convention)
Nuclear free Pacific
(Rarotonga Treaty)
GHG reductions
(Kyoto Protocol)
Ozone depleting substances
(Montreal Protocol, et al.)
Signed Ratified Entered into force
– 14 Sep 89 22 Aug 90
– 08 Sep 89 26 Jun 90
16 Sep 95 16 Apr 96 21 Oct 01
06 Aug 85 04 Oct 85 11 Dec 86
17 Sep 98 17 Sep 98
n/a *
– Acceded: 23 Oct 89
Notes: Treaties & conventions are briefly described in Volume 1, the PIREP Regional Overview report * The Kyoto Protocol is in force from 15 February 2004 for European Union members only. Sources: Websites for conventions, PIFS and SPREP (Jan. – March 2004)
The Fiji Department of Environment (DoEnv) is responsible for developing and implementing a national environment strategy. In 1997, the DoEnv completed a national greenhouse gas (GHG) inventory, apparently based on data through 1991. A revised GHG inventory and initial national communication to the UNFCC are underway and should be completed and submitted by 2005. The DoEnv is responsible for coordinating Fiji’s climate change activities.

12
2 ENERGY INST ITUTIONS, POL IC IES AND LEG ISLAT ION
2.1 Institutional Context for Energy
The Department of Energy (DoE) is responsible for overall national energy policy and for off-grid rural electrification. The Fiji Electricity Authority (FEA) is the national utility responsible for urban and per-urban electricity supply. The Ministry of Finance and National Planning (MoF) is responsible for establishing and enforcing maximum petroleum fuel prices but private oil companies import and distribute fuel products. The key energy sector organisational arrangements are described below.
2.1.1 The Fiji Department of Energy
The structure of the DoE, located within the Ministry of Works and Energy (MWE), is shown in Figure 2-1.
Figure 2-1 – Structure of Fiji Department of Energy in August 2004
Minister for Works and EnergyHON RATU SAVENACA DRAUNIDALO
Chief Executive Officer for Works and Energy Anasa Vocea
Principal Scientific Officer Peceli Nakavulevu
(Rural Electrification Unit Manager)
Director of Energy (Vacant)
Principal Scientific Officer Makereta Sauturaga
(Acting Director)
Senior Scientific Officer Intiyaz Khan
Senior Scientific Officer (Vacant)
Senior Scientific Officer Arieta Gonelevu
Scientific Officer Taleshul Gani (Acting SSO)
Scientific Officer Avinesh Naidu
Scientific Officer Paula
Katirewa
Senior Tech Assistant
Arbin Lal
Administrative Officer Alumita Cakau
Executive Officer Maciu Vatuloka
Asst Accounts Officer Vacant
Sr Clerical Officer
Samuela Liwaiono
Sr Clerical Officer Prem Sahai
Sr Clerical Officer Suman
Lata
Typist Jasili
Vabulou (Temp)
Information Officer
Jyoti Vikash
Driver (REU) Iliesa Nailawa
Messenger / Driver Jaswant Singh
Messenger / Filing Clerk Samsher Ali
Handyman / Driver Tevita Manamana
Steno / Typist Patricia Khan (Acting Sec. to Director)
Clerical Officer Paulini
Koli
Supervisor H / Grade
Jimione Fereti (FEA schemes)
Supervisor H / Grade (Vacant) (Diesel)
Information Officer
Sera Kama
Technical Officer Semi
Kedrawaci
Source: Provided by DoE and modified following discussions with DoE staff (August 2004)
DoE had thirteen professional technical/administrative staff (including two vacancies) and fifteen support and clerical staff (including one vacancy) in August 2004 making

13
it the largest government energy office among the PICs with the possible exception of PNG. Main responsibilities include overall energy policies and plans, energy efficiency and conservation, renewable energy (RE) and rural electrification. The Director of Energy sits on the board4 of the FEA as the representative of the Chief Executive Officer (CEO) of MWE. Five staff attached to the Rural Electrification Unit (REU), and two other DoE staff, deal with planning of rural electrification, primarily through small off-grid diesel plants – implemented in conjunction with the Public Works Department (PWD – and grid extensions to rural areas –) implemented through the FEA. A considerable amount of DoE staff time is spent on planning, seeking funding for, and implementing RE projects including microhydro electricity, solar photovoltaics (PV), biofuels, wind, biogas and resource assessments for RE development. As many RE projects are for the provision of rural electrification, the REU and the rest of the DoE work pretty much as a single unit. In general, the DoE budget allocations for capital investment, studies, energy audits, and operation and maintenance (O&M) of projects implemented have been inadequate.
2.1.2 The Fiji Electricity Authority
The FEA is a 100 percent government-owned utility established under the provisions of the Electricity Act of 1966, with a board of directors appointed by the minister responsible for energy. The CEO is an ex-officio member and is responsible to the board for implementation of board policies. FEA has responsibility for development and extension of electricity nationally where financially viable and economically sound. It currently operates only in those three islands with sufficient demand and population density to justify grid systems: Viti Levu, Vanua Levu and Ovalau.
As noted in chapter 1, Fiji has experienced considerable political and economic uncertainty since 1987. During this period, successive Fiji governments have also had very different policies regarding public enterprises and their restructuring, with five distinct phases (described in Appana, 2003) involving different policies, legal reforms, initial implementation, reversals, and recommencement of reforms similar to some earlier efforts. In general, these changes have preceded wider civil service reforms in both pace and magnitude.
Under a Reorganisation Charter of 1998, FEA was divided for a time into three distinct companies responsible for generation, distribution and sales (PowerGen Fiji, PowerLines Fiji and MegaPower Fiji). The charter was repealed in 1999, with the companies reconsolidated into FEA at some cost. There have been recent media reports (Chaudhari, 2004) that the GoF is seriously considering placing all of its commercial operations (eleven state owned enterprises including FEA) under a single umbrella organisation with one CEO and one overall board of directors, a move which would probably significantly slow or reverse FEA’s commitment to RE (discussed in chapter 3), a recent change which has been due very much to a dynamic chairperson committed to renewable energy for FEA. This paper discusses the current structure, legal framework and operations for electric power, which could change again, depending on emerging policies of the current and future governments.
FEA had 640 staff in 2003 (FEA Annual Report for 2003) and has about five full-time equivalent staff working on renewable energy and energy efficiency matters, in
4 In August 2004, the GoF announced that public servants will no longer be appointed to boards of public corporations and
that sitting members will soon be replaced.

14
addition to about five in hydropower operations. FEA has also advertised for a full-time wind power engineer.
2.1.3 Petroleum and LPG
Three international oil companies (Mobil, Shell and BP) import petroleum products into Fiji, distribute their products at wholesale and retail levels, and re-export to other PICs. Supply is by medium-range tankers from refineries in Australia, Singapore and New Zealand. Currently the GoF itself is supplied by Shell through a five-year contract with the PWD.
The MoF’s Prices and Incomes Board (PIB) regulates wholesale and retail prices of motor spirit (also called gasoline or petrol), kerosene and automotive diesel oil (ADO) and influences to some extent the technical specification of fuels. The three companies submit their costs four times per year to PIB, which selects the least expensive for calculation of a maximum price under an agreed formula. Prices vary in different geographical areas. Large consumers such as FEA negotiate bulk contracts.
There are two retail distribution methods. The dealer-owned dealer-operated (DODO) system involves a private company selling fuel from its own premises, for example the Carpenter’s Group which has a supply arrangement with Mobil. Under the second arrangement, company-owned dealer-operated (CODO), the oil company owns the assets and leases them to a private company which operates for typically 5-10 years. An example is the Shell service station on Victoria Parade in downtown Suva.
In 1990, the GoF established a government-owned Fiji National Petroleum Company (FINAPECO), with the sole right to import petroleum fuels, which were expected to be distributed by the traditional oil companies. At the time, it was anticipated by the GoF that FINAPECO would later construct and operate a small refinery of about 25,000 barrels per day capacity. After a loss of some millions of dollars, FINAPECO closed without ever importing any fuel.
Liquid petroleum gas (LPG) is imported and marketed by two companies, Fiji Gas which has operated in the country for several decades and Bluegas, which began in 1989. LPG is not under government price control.
2.1.4 Other institutions
There are numerous government bodies and other organisations with responsibilities which include some aspects of energy. The MoF prepares the national strategic plan (which establishes the framework for energy) and the national budget (which provides or withholds funds for implementing the policies and projects). The Land Transport Authority (LTA) deals with motor vehicle regulation, licensing and inspections. LTA has a potential role in improving energy efficiency while reducing GHG emissions, which is a stated GoF objective. The Commerce Commission must consider any FEA tariff increase or change in its tariff structure. The DoEv deals with climate change activities and thus, greenhouse gases.
For RE, an important institution is the Native Land Trust Board (NLTB), that administers all customary (native) land for the benefit of indigenous landowners, both current and future generations. Native land includes a “non-reserve” classification, which can be leased or licensed for up to 99 years for use by owners or others. There are nearly 32,000 outstanding NLTB leases, about 14,000 each for agricultural and residential purposes, and the rest for commercial, industrial, government and

15
miscellaneous developments. Because about 90% of all land is native, and land lease issues have been contentious in recent years, the success of most large-scale (and many small-scale) RE systems in Fiji will be dependent on the policies of NLTB and attitudes of traditional landowners. Table 2-1 shows the distribution of native and freehold leases by province and the status of leases.5
Table 2-1 – Land Tenure in Fiji
Province Freehold Land
State Admin. Land
Native Land
Native Land
Leased
% of Native Land
Leased Total Land *
(ha)
Ba 10,323 34,525 203,505 77,706 38% 248,354 Bua 17,725 286 117,086 33,144 28% 135,097 Cakaudrove 50,512 4,483 216,454 22,711 10% 271,449 Kadavu 1,717 51.05 45,328 2,188 5% 47,096 Lau 4,490 315.65 44,933 1,133 3% 49,738 Lomaiviti 5,583 678 29,903 2,551 9% 36,164 Macuata 12,595 4,054 178,230 67,475 38% 194,880 Nadroga/Navosa 6,205 3,752 206,578 45,236 22% 216,536 Naistisiri 7,343 4,290 144,414 21,000 15% 156,047 Namosi 386 11,241 52,894 3,945 7% 64,521 Ra 5,815 2,145 98,682 29,289 30% 106,642 Rewa 2,661 344 21,380 1,483 7% 24,385 Serua 12,297 98.62 45,303 28,553 63% 57,699 Tailevu 4,437 1,364 86,934 23,059 27% 92,234 Total 142,089 67,628 1,491,125 359,473 1,770,842 Source: NLTB website ww.nltb.com.fj * Apparently above high water mark
2.2 Energy Policies and Plans
Within the Strategic Development Plan for 2003-2005 (GoF, 2002), the energy sector goal is “to facilitate the development of a resource efficient, cost effective and environmentally sustainable energy sector.” Specific objectives include: 1) formulation of “a comprehensive national energy policy to address renewable energy, efficiency and affordability, and environmental sustainability”, 2) reform of the power sector “through internal restructuring of FEA and the encouragement of private sector participation through Independent Power Producers (IPPs) and Renewable Energy Service Companies (RESCOS) in electricity generation”, and 3) increased funding over the next three years for the DoE’s rural electrification programme. Energy policy objectives, some behind schedule, and indicators of performance are shown in Table 2-2.
Although DoE has not yet begun development of the new national energy policy, it expects to do so in late 2004 or early 2005, with assistance from UNDP’s Danish-funded Pacific Islands Energy Policy and Strategic Action Planning project (PIEPSAP), managed by the South Pacific Applied Geoscience Commission (SOPAC).
5 The NLTB website appears to be out of date. Recently some state land has been converted to native land. The Fiji report on
the Barbados Plan of Action (GoF, October 2003) shows 90% of all land as native land.

16
Table 2-2 – Energy Policy Objectives and Indicators of Success in GoF’s National Strategic Plan Policy Objectives Key Performance Indicators To ensure that demand for reliable and affordable electricity is adequately met by FEA and the Rural Electrification Programme•
• 95 percent of the urban population have access to electricity by 2005. • 50 percent reduction of FEA power disruptions by 2005 • 300 additional villages and settlements having access to electricity by 2005 • National Energy Policy formulated by 2003/2004 and implemented by 2005.
To ensure that the diesel power generation systems installed under the old Rural Electrification policy (1974) are overhauled and incorporated under the terms of the current Rural Electrification Policy (1993).•
• Overhauling of 185 schemes installed under the old RE policy by 2005 • Savings from reduction in maintenance and repair of old schemes of $1600 per annum
per scheme from 2003.
To encourage private sector participation in power generation.• • At least one Independent Power Producer by 2005. To increase efficiency, accountability and cost effectiveness in FEA operations• • Implementation of current FEA Restructure Plan by 2003
To promote energy conservation technologies through increased community awareness•
• 30-40 percent in total energy savings from identified government buildings by 2005. • Department of Energy and FEA actively promoting their conservation services.
To develop and establish an infrastructure that will remove barriers that hinder the adoption of renewable energy systems and thus enable the establishment of Renewable Energy Service Companies (RESCOS).•
• RESCOS providing 146 MWh of electricity from renewable sources for rural communitiesby 2005.
• Charter for establishment of RESCOS introduced by 2003. Source: Strategic Development Plan: 2003-2005 (GoF, Nov. 2002)
The DoE has a departmental DoE Strategic Development Plan, apparently the first GoF department to develop such a plan, key features of which are summarised in Table 2-3. Some indicators are vague but the plan nonetheless provides a concise summary of DoE’s expected areas of emphasis over the next several years.
Table 2-3 – Summary of DoE’s Departmental Strategic Development Plan for 2005 - 2007 Policy Objectives Key Performance Indicators Timeframe To assess and determine the feasibility of renewable energy resources and implement appropriate and sustainable renewable energy based technologies in Fiji
1. Construction of the following projects: 2. Solar – 1 project per year 3. Biogas – I project per year 4. Hybrid – 1 project every three years. 5. Hydro – 1 project every three years 6. Biofuel – 1 project every three years 7. Muani Wave Project to be constructed within 3 years
(if funds are available).
1. Implement all projects between 2005 – 2007
To ensure the efficiency, accountability and cost effectiveness in FEA operations in relation to electricity generation and supply
1. Facilitate the penetration of FEA network into rural areas. 2. Provide assistance and advice to FEA on renewable energy
resources and technologies. 3. Encourage private sector participation in power generation
1. 15 schemes access to FEA grid per year
2. Ongoing 3. At least one Independent
Power Producer (IPP) by 2007
To promote efficient environmentally friendly fuels and benign practices in the transport sector
1. Conduct study on fuel consumption in relation to the overall vehicle performance (air conditioning systems)
2. Research, design and construct at least one alternative fuel powered vehicle
1. Complete by 2006. 2. Implement by 2007
Establish and maintain a concise, up-to-date and user-friendly system for collection, compilation, management and distribution of energy data
1. Undertake urban and rural energy survey 2. Production of Energy Statistics Booklet for 2001–2003 3. Establish and update the Energy Information System
1. Complete by 2006 2. Complete by 2005 3. Complete by 2005
To promote efficient use and conservation of energy in Fiji
1. Production of an energy conservation media campaign (video, advertisements, radio interviews)
2. 20% total energy savings from identified buildings 3. Development of an Energy Conservation Policy
1. 2005 –2006 2. Yearly basis 3. Complete by 2007

17
Table 2-3 – Summary of DoE’s Departmental Strategic Development Plan (continued)
Policy Objectives Key Performance Indicators Timeframe To assist rural communities in the provision of electricity for both social and economic development.
1. 300 additional rural communities with access to electricity 2. Utilise media sources to publicise assistance provided under
the policy 3. Enact Rural Electrification Bill 4. Active participation of private sector companies e.g.
involvement of RESCO’s in construction, O&M & management of rural electrification schemes
1. Complete by 2007 2. Yearly basis 3. Complete by 2005 4. Yearly basis
To incorporate gender mainstreaming approaches in energy activities
1. Public awareness in recognising women’s role in energy related activities
2. Encouraging active participation of women in energy projects
1. Yearly basis 2. Yearly basis
To strengthen in-house capacity to enable the development of a sustainable energy sector
1. Active participation with regional and international organisations on energy related activities
2. Appropriate energy related training for staff at local and overseas institutions
1. Yearly basis 2. Yearly basis
Source: DoE Strategic Plan for 2005-2007 (GoF, 2004)
In 1993, Cabinet endorsed a Rural Electrification Policy (REP) that still remains in force. Under the REP, any rural village or settlement can request GoF assistance for electrification. A Rural Electrification Unit was set up within DoE to implement the policy, the impact of which is discussed in chapter 3.
The REP provides several service options: 1) extension of the FEA grid or government station mini-grid providing 24 hour service; 2) a diesel generator with a mini-grid system operated by a village committee; 3) solar PV for lighting and basic appliances, also operated by a village committee; and 4) small hydroelectric plant and mini-grid, also operated by a village committee. Applicants must initially pay 10% of the estimated capital cost, with the remaining 90% provided by the GoF. Those connected to the FEA grid pay the normal FEA tariff. The others have fees established by the community committee, which is in responsible for all O&M costs beginning three years after commissioning. As discussed in the next chapter, the REP has had mixed success, with poor maintenance and frequent power outages common for all classes of systems except FEA grid extensions.
In 2003, the United Nations Economic and Social Commissions for Asia and the Pacific (ESCAP) reviewed the REP. The resulting report (Matakiviti and Pham, 2003) is being reviewed by DoE. It is understood that Cabinet will be approached to revise the REP, based in part on the ESCAP recommendations, but no details of likely changes are yet available.
The FEA does not have a formal policy document. It has a vague corporate “vision”, “Energising our People and our Nation” and its “mission” is to “provide clean and affordable energy solutions to Fiji and the Pacific. We aim to provide all energy through renewable resources by 2011” (Annual Report for 2003, FEA, August 2004). The mission statement suggests that FEA hopes to expand services beyond Fiji to the wider Pacific. FEA had a Ten Year Power Development Programme: 1998-2007 agreed by its board and occasionally updated. Today the development programme is based on a frequently-revised rolling plan rather than a formal ten-year document.
2.3 Legislation Related to Energy and Energy-Environment Matters
A number of bills have been drafted in recent years for consideration by Fiji’s Parliament, several have been passed by parliament (and become Acts) and other

18
legal instruments have been prepared which affect, or could affect, the energy sector. The most important are listed below, including several dealing with restructuring and later reversed.
• Electricity Act (Cap. 180). This 1966 Act established the Fiji Electricity Authority as a corporate body responsible for electricity supply in Fiji and states the limits of those responsibilities. It specifies that it is FEA’s duty to promote and encourage the generation of energy (i.e. electricity) for Fiji’s economic development and to secure electricity supply at reasonable cost. There is no formal requirement for FEA to assess or develop indigenous energy resources, consider environmental impacts, or promote the efficient use of electrical energy. The Act was to be repealed by an Electricity Reform Bill drafted in 1999 but it remains in force.
• Petroleum Act (Cap. 190) The Act regulates the standards for the storage and transportation of petroleum fuels into and within Fiji.
• Fuel and Power Emergency Act (Cap. 191). The Act provides for the regulation of the supply, distribution and use of fuel and electric power in Fiji during emergencies relating to fuel and power. It remains in force but has not been used since the ‘energy crisis’ of the early 1980s and even then was used only to acquire information from the oil industry for planning.
• Petroleum (Exploration and Exploitation) Act (Cap. 148). This Act provides for the regulation of exploration and exploitation of petroleum in Fiji.
• Public Enterprise Act (1996). The PEA provides for the reform and restructuring of nominated government entities, to be reorganised initially as government commercial companies (and subsequently commercialised, corporatised, or privatised) and regulated in the public interest.
• FEA Reorganisation Charter (1998). Pursuant to the PEA, the FEA was re-organised into three government-owned commercial companies for generation, transmission and sales of electricity (i.e.PowerGen,PowerLinesand MegaPower), with provisions for the generating and distribution companies to be partially privatised. The Charter was rescinded in 1999 and the three entities re-integrated into FEA.
• Electricity Reform Bill (1998). Pursuant to the FEA Charter, this bill was to legalise the separation of FEA into the three above companies under a Director-General (DG) and provide a framework for competition. The transmission company was to remain 100% government-owned. Private companies could compete with the generation and sales companies which would be at least 51% government-owned. There would no longer be a national electricity tariff: the DG could establish a maximum national retail electricity price but vary prices for different locations and consumer classes. The bill required promotion of efficient use of electricity but there were no specific environmental requirements. Although FEA was temporarily reorganised, the bill was never passed by Parliament and is dead or at least dormant.
• Hotels Aid Act (amended 1999). This Act allows investors to build private generation plant for tourism facilities with surplus energy sold to the grid. Incentives include an accelerated depreciation allowance and a twenty-year income tax exemption.
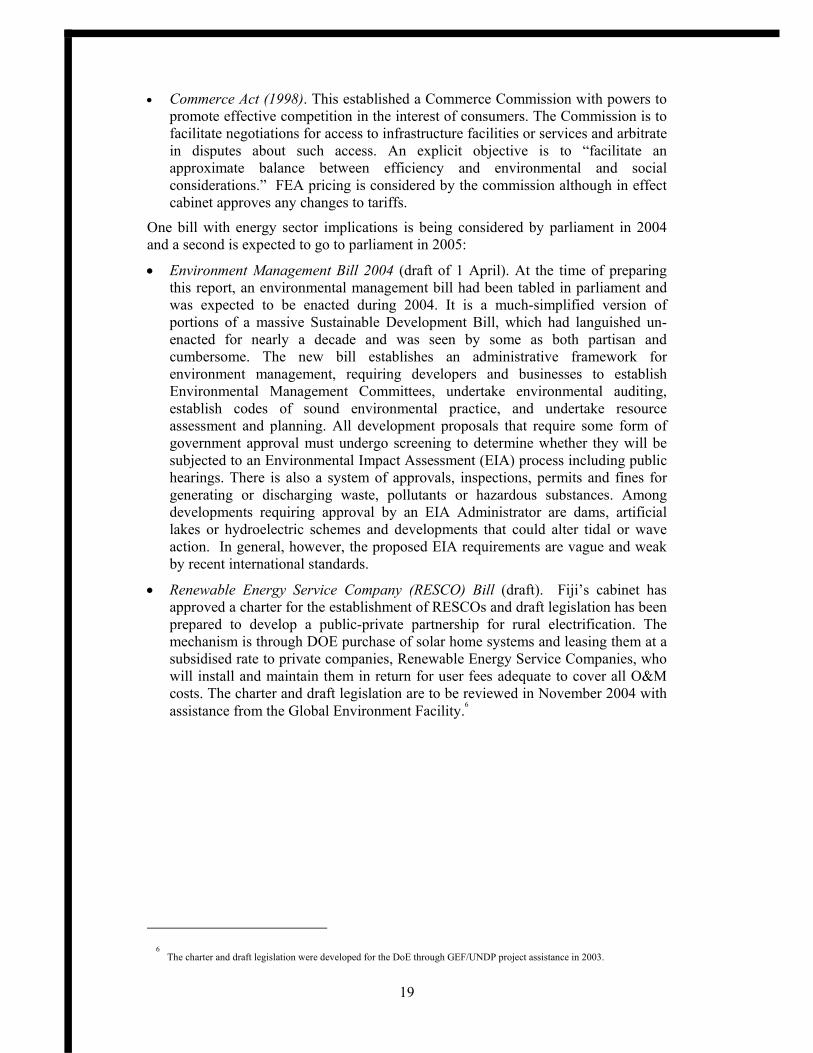
19
• Commerce Act (1998). This established a Commerce Commission with powers to promote effective competition in the interest of consumers. The Commission is to facilitate negotiations for access to infrastructure facilities or services and arbitrate in disputes about such access. An explicit objective is to “facilitate an approximate balance between efficiency and environmental and social considerations.” FEA pricing is considered by the commission although in effect cabinet approves any changes to tariffs.
One bill with energy sector implications is being considered by parliament in 2004 and a second is expected to go to parliament in 2005:
• Environment Management Bill 2004 (draft of 1 April). At the time of preparing this report, an environmental management bill had been tabled in parliament and was expected to be enacted during 2004. It is a much-simplified version of portions of a massive Sustainable Development Bill, which had languished un-enacted for nearly a decade and was seen by some as both partisan and cumbersome. The new bill establishes an administrative framework for environment management, requiring developers and businesses to establish Environmental Management Committees, undertake environmental auditing, establish codes of sound environmental practice, and undertake resource assessment and planning. All development proposals that require some form of government approval must undergo screening to determine whether they will be subjected to an Environmental Impact Assessment (EIA) process including public hearings. There is also a system of approvals, inspections, permits and fines for generating or discharging waste, pollutants or hazardous substances. Among developments requiring approval by an EIA Administrator are dams, artificial lakes or hydroelectric schemes and developments that could alter tidal or wave action. In general, however, the proposed EIA requirements are vague and weak by recent international standards.
• Renewable Energy Service Company (RESCO) Bill (draft). Fiji’s cabinet has approved a charter for the establishment of RESCOs and draft legislation has been prepared to develop a public-private partnership for rural electrification. The mechanism is through DOE purchase of solar home systems and leasing them at a subsidised rate to private companies, Renewable Energy Service Companies, who will install and maintain them in return for user fees adequate to cover all O&M costs. The charter and draft legislation are to be reviewed in November 2004 with assistance from the Global Environment Facility.6
6 The charter and draft legislation were developed for the DoE through GEF/UNDP project assistance in 2003.

20
3 ENERGY SUPPLY AND PRIC ING
3.1 Petroleum
3.1.1 Petroleum product supply
Twenty-one years ago, a World Bank (WB) / United Nations Development Programme (UNDP) study (Fiji: Issues and Options in the Energy Sector; WB/UNDP, 1983) predicted zero growth in Fiji’s petroleum imports for the period 1982-2000. A similar study a decade later with the same title (volume 4, of the Pacific Regional Energy Assessment, or PREA; WB, et. al., 1992) projected an AAGR in retained petroleum fuel imports of 4.8% from 1990-2000. Table 3-1 and Figure 3-1 show the approximate quantity of retained petroleum imports (total imports minus re-exports) to Fiji from 1990 through 2003 as reported by the Bureau of Statistics (BoS). For some years, data are confusing, inconsistent or unavailable. There are clearly serious errors in the data.7 The trend line (dashed line of Figure 3-1), which should be more accurate than data of any given year, suggests an actual AAGR of about 1% during the past thirteen years, which seems low but may be reasonable. For the past five years, the data for any given year should be treated with caution.
Table 3-1 – Summary of Fuel Use in Fiji 1990-2003 (million litres except LPG in kilotonnes) Fuel 1990 1991 1992 1993 1994 1995 1996 1997 1998 1999 2000 2001 2002 2003 Motor Spirit 65.763 n/a n/a 65.544 83.755 65.331 67.20 78.98 75.55 n/a 46.739 58.871 82.511 -2.902 Avgas 3.291 n/a n/a 15.021 56.486 35.568 51.27 71.90 31.27 n/a 62.779 0 0 0 Kerosene * 45.633 n/a n/a 7.548 9.563 9.799 12.94 13.30 11.94 n/a 5.300 42.574 41.750 17.567 Jet A1 * 13.661 8.753 -177.595 ADO 92.797 n/a n/a 166.067 122.621 123.830 131.88 100.25 148.69 n/a 45.588 65.339 125.759 55.361 IDO 40.776 n/a n/a 36.326 48.945 57.884 70.10 120.57 104.86 n/a 91.783 134.332 265.279 248.372 IFO /RFO 3.998 n/a n/a 3.536 6.395 3.266 9.49 5.08 2.47 n/a 7.170 90.014 -9.986 -0.908 Other -13.278 1.776 0.807 Total 252.3 – – 294.0 327.8 295.7 342.9 390.1 374.8 – 259.4 391.5 515.8 140.7 LPG (kT) 6.105 8.05 8.034 9.607 9.716 11.017 10.58 11.38 8.07 10.49 11.996 n/a 13.00 11.11 Sources: 1990-2000 prepared by L Vega from net domestic use as estimated by DoE in 1993-2000 statistics. 1999 data are incorrect and cannot be used.. 2000-2003 are retained imports from Bureau of Statistics, August 2004 Notes: n/a = not available * For 1990-2000, kerosene presumably includes aviation turbine fuel (Jet A1). BOP says negatives are surpluses from previous stock.
7 The data of Table 3-1 differ for some years from the retained imports shown in DoE’s 1993-2000 data yearbook. (As stock
changes are shown in the DoE report as zero, consumption should equal retained imports.) There may be some fuels that have been misallocated (e.g. mixing up aviation gasoline or avgas with aviation turbine fuel or kerosene with aviation turbine fuel which is a type of kerosene) but this does not account for the huge year-to-year differences. .
Figure 3-1 – Fiji’s Retained Petroleum Imports
0
100
200
300
400
500
600
1990
1992
1994
1996
1998
2000
2002
Source: Data of Table 3-1.

21
3.1.2 Petroleum product pricing
For some years, the Pacific Islands Forum Secretariat (PIFS) has provided comparative prices for petroleum products marketed in the PICs. For the most recent PIFS Fuel Price Monitor available at the time of writing, the wholesale prices of gasoline (also called petrol, motor spirit and mogas) and ADO, excluding all taxes and duties, are shown in Figure 3-2. Fiji prices were about 25% below the average for PICs. Although Fiji re-exports these products to Samoa, which has a much smaller market, the Samoan prices were lower than those in Fiji.8
Figure 3-2 – PIC Wholesale Petrol and ADO Prices (excluding import duties and taxes; Nov/Dec 2003)
Source: Pacific Fuel Price Monitor, Edition 7 version 2 (PIFS; 12 May 2004)
For kerosene (Figure 3-3) Fiji’s prices are considerably lower than those of most PICs (and lower than Samoa’s).
Figure 3-3 – Wholesale and Retail Kerosene Prices (excluding import duties & taxes; Nov/Dec 2003)
Source: as for Figure 3-2
8 Samoa has had a consistent and aggressive approach to petroleum supply and pricing for nearly two decades. Unlike Fiji,
Samoa owns its own petroleum storage facilities and tenders for the national fuel supply.
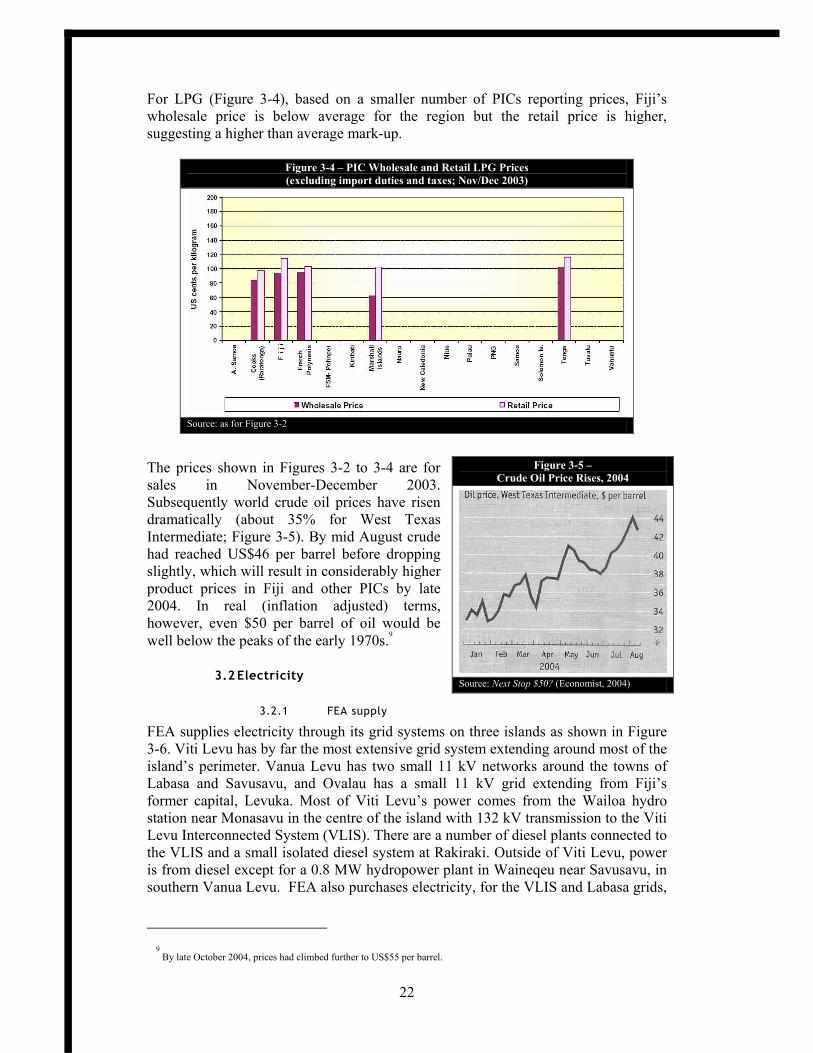
22
For LPG (Figure 3-4), based on a smaller number of PICs reporting prices, Fiji’s wholesale price is below average for the region but the retail price is higher, suggesting a higher than average mark-up.
Figure 3-4 – PIC Wholesale and Retail LPG Prices (excluding import duties and taxes; Nov/Dec 2003)
Source: as for Figure 3-2
The prices shown in Figures 3-2 to 3-4 are for sales in November-December 2003. Subsequently world crude oil prices have risen dramatically (about 35% for West Texas Intermediate; Figure 3-5). By mid August crude had reached US$46 per barrel before dropping slightly, which will result in considerably higher product prices in Fiji and other PICs by late 2004. In real (inflation adjusted) terms, however, even $50 per barrel of oil would be well below the peaks of the early 1970s.9
3.2 Electricity
3.2.1 FEA supply
FEA supplies electricity through its grid systems on three islands as shown in Figure 3-6. Viti Levu has by far the most extensive grid system extending around most of the island’s perimeter. Vanua Levu has two small 11 kV networks around the towns of Labasa and Savusavu, and Ovalau has a small 11 kV grid extending from Fiji’s former capital, Levuka. Most of Viti Levu’s power comes from the Wailoa hydro station near Monasavu in the centre of the island with 132 kV transmission to the Viti Levu Interconnected System (VLIS). There are a number of diesel plants connected to the VLIS and a small isolated diesel system at Rakiraki. Outside of Viti Levu, power is from diesel except for a 0.8 MW hydropower plant in Waineqeu near Savusavu, in southern Vanua Levu. FEA also purchases electricity, for the VLIS and Labasa grids,
9 By late October 2004, prices had climbed further to US$55 per barrel.
Figure 3-5 – Crude Oil Price Rises, 2004
Source: Next Stop $50? (Economist, 2004)

23
produced by FSC using biomass (bagasse) from the milling process and has also purchased electricity from Emperor Gold mines (EGM) and Tropik Woods.
Since the 80 MW Wailoa hydropower system was commissioned in 1983, hydro has provided the bulk of generation for FEA, although the percentage has decreased over time. Figure 3-7 illustrates the trend with hydro declining from 92% in 1995 to 80% in 2000 to only 55% in 2003, a year of drought in Fiji resulting in very low water levels in the Monasavu reservoir. Most of FEA’s non-hydro generation is diesel-based, with solar photovoltaics (PV) providing between 9-14 MWh per year (well below 1%) from 1998-2003.
In 2003, FEA had fourteen power stations (Table 3-2) with a total of 194 MW of capacity, which generated 699 GWh10 during the year. Two were hydro-based and the rest were diesel. Viti Levu accounted for slightly over 90% of generation, Vanua Levu 8% and Ovalau 2%. A new 6 MW hydroelectric project (Wainikasau near Monasavu, Viti Levu) was completed in 2004 and a 3 MW hydro project (Vaturu, Viti Levu) was under construction and due for completion in 2005.
10
FEA’s generation of 699 GWh in 2003 (Table 3-2) differs by 11% from the 628 GWh shown in FEA’s 2003 Annual Report (Figure 3-7). This may be because the table actually includes power purchases. Also 2003 was a difficult year for DEA with a number of small diesel systems leased and imported in 2003 to make up for the hydro shortfall. Records in 2003 may not be as accurate as earlier years. Despite some inconsistencies, the information in Figure 3-7, Table 3-2, Table 3-8 and others in this report is indicative of the electricity situation in Fiji.
Figure 3-6 – FEA Grid Systems
Source: adapted from FEA Annual Report for 2003
Figure 3-7 – FEA Generation, 1995 – 2003 (GWh)
200300400500600700
1995
1996
1997
1998
1999
2000
2001
2002
2003
Hydro Total
Note: Excludes purchases of electricity from outside FEA Source: FEA Annual Report for 2003

24
Table 3-2 -- FEA’s Power Stations in 2003
Location Type Power Station
Capacity (MW)
Output (GWh)
Commissioned (Year)
Viti Levu Hydro Wailoa 83.2 340.0 1983 Diesel Kinoya 35.5 158.0 1972 - 2001 Diesel Vuda 24.0 78.5 1976 - 2001 Diesel Nadi 8.0 8.1 1962 - 1970 Diesel Sigatoka 8.8 2.4 1951 - 2009 Diesel Deuba 5.7 0.3 1954 1979 Diesel Rakiraki 1.0 1.7 1997 Diesel Korovou 1.2 0 1999 - 2001 Diesel Rokobilli 3.3 6.3 - Others 3.7 29.2 - Subtotal: 174.4 624.3 Vanua Levu Diesel Savusavu 2.5 6.5 1995 - 2004 Hydro Wainiqeu 0.8 0.1 1992 Diesel Labasa 14.3 51.0 1974 - 2004 Subtotal: 17.6 57.6 Ovalau Diesel Levuka 2.0 16.8 1998 Totals 194.0 698.9 Source: Proposed Rural Electrification Loan to Fiji (draft, ADB, Aug. 2004) based on FEA data Note: Excludes minor solar PV contribution
Table 3-3 shows FEA generation from 1990 through 2003. Just as Fiji’s economy has varied considerably, FEA’s growth has been uneven, with an AAGR of 4% throughout the period and 6.4% from 1997-2003.
Table 3-3 – FEA Generation in GWh (excluding Ovalau)
Year VLIS Hydro
VLIS Diesel
VLIS IPP
Savu All
Labasa IPP
Labasa Diesel
Total GWh
VLIS PV
Increase (%)
1990 379 4 0 2.7 2.5 12.6 401 1991 383 8 0 2.6 2.2 14.4 410 2.2% 1992 377 12 0 2.9 2.9 14.4 409 -0.2% 1993 377 8 0 2.8 3.5 14.6 406 -0.8% 1994 387 6 5 2.6 3.5 17.0 421 3.7% 1995 383 10 8 2.8 0.2 22.9 426 1.3% 1996 363 43 14 3.0 0.3 25.1 448 5.1% 1997 402 16 11 3.1 3.4 22.8 458 0.002 2.2% 1998 417 51 9 3.8 4.4 22.2 507 0.012 10.8% 1999 448 45 19 4.0 5.1 22.9 544 0.009 7.3% 2000 418 77 23 4.1 8.5 22.3 553 0.011 1.6% 2001 459 68 14 4.9 7.6 22.7 576 0.014 4.2% 2002 448 117 16 4.7 6.3 23.9 616 0.010 7.0% 2003 448 164 17 5.1 6.3 24.5 666 0.010 8.0% Source: Prepared by Dr Luis Vega from data provided by FEA in 2004. Note: IPP indicates power provided to FEA by Independent Power Producers such as FSC

25
Table 3-4 shows the relative contribution of FEA’s energy production including power purchases from 1990-2002. Electricity from bagasse, sold to FEA from FSC production excess to its internal needs, has increased slightly over time. In 2003, 3.5% of the electricity generated was produced using bagasse.11 From 1990-2003, FEA reports average transmission and distribution losses of 9.9%, 8.2% and 11.7% for the VLIS, Savusavu and Labasa grids respectively.
In 2003 (Table 3-5), FEA’s medium scenario forecast for AAGR of demand and energy through 2015 was 4.5% for the Viti Levu VLIS and 3% for all others, about 4.3% overall. More recent forecasts (Figure 3-8) suggest slightly higher growth in generation of 4.7% from 2004-2015.
In 2003, FEA signed a twenty-year agreement with Telesource Fiji Ltd, a subsidiary of an American company, to operate and maintain its diesel power stations at Vuda and Kinoya on Viti Levu, later extended to all FEA diesel plant. FEA also entered a joint venture (JV) relationship with Pacific Hydro Ltd of Australia to develop hydropower and wind farm projects.
Figure 3-8 indicates the contribution to generation from all firm investment, and anticipated new investment, between 2004 and 2008, by which time renewable energy is expected account for well over 80% of the total. Beyond 2008, plans are not firm but options being considered include new large-scale hydropower, geothermal, additional wind systems, and municipal waste. Some new capacity will be developed and owned by FEA, some energy (for example from geothermal resources) could be purchased from independent power producers (IPPs), and some projects (e.g. wind farms) are likely to be JV developments with outside investors. If none of these eventuate, the demand for diesel fuel (pink area of Figure 3-8), or possibly diesel fuel substitutes, will grow rapidly after 2008.
11
Installed capacity at the sugar mills for electricity production from bagasse is 5 MW at Lautoka, 4 MW at Ba, 3 MW at the Rakiraki, and 4 MW at Labasa.
Table 3-4 – Percentage of energy from hydro, diesel & bagasse 1990-2003
Year Bagasse Diesel Hydro 1990 0.6% 4.2% 94.5% 1991 0.5% 5.4% 93.4% 1992 0.7% 6.5% 92.1% 1993 0.9% 5.7% 92.8% 1994 2.0% 5.4% 91.9% 1995 1.9% 7.7% 89.8% 1996 3.2% 15.1% 81.1% 1997 3.2% 8.4% 87.8% 1998 2.6% 14.5% 82.2% 1999 4.5% 12.5% 82.3% 2000 5.7% 18.0% 75.6% 2001 3.8% 15.8% 79.6% 2002 3.6% 22.9% 72.7% Source: prepared by Dr Luis Vega from information provided by FEA, 2004
Table 3-5 – FEA Growth Scenarios
Growth VLIS Other Low: 2.5% 2.0% Medium 4.5% 3.0% High: 6.5% 5.0% Source: Vega, 2003, from FEA
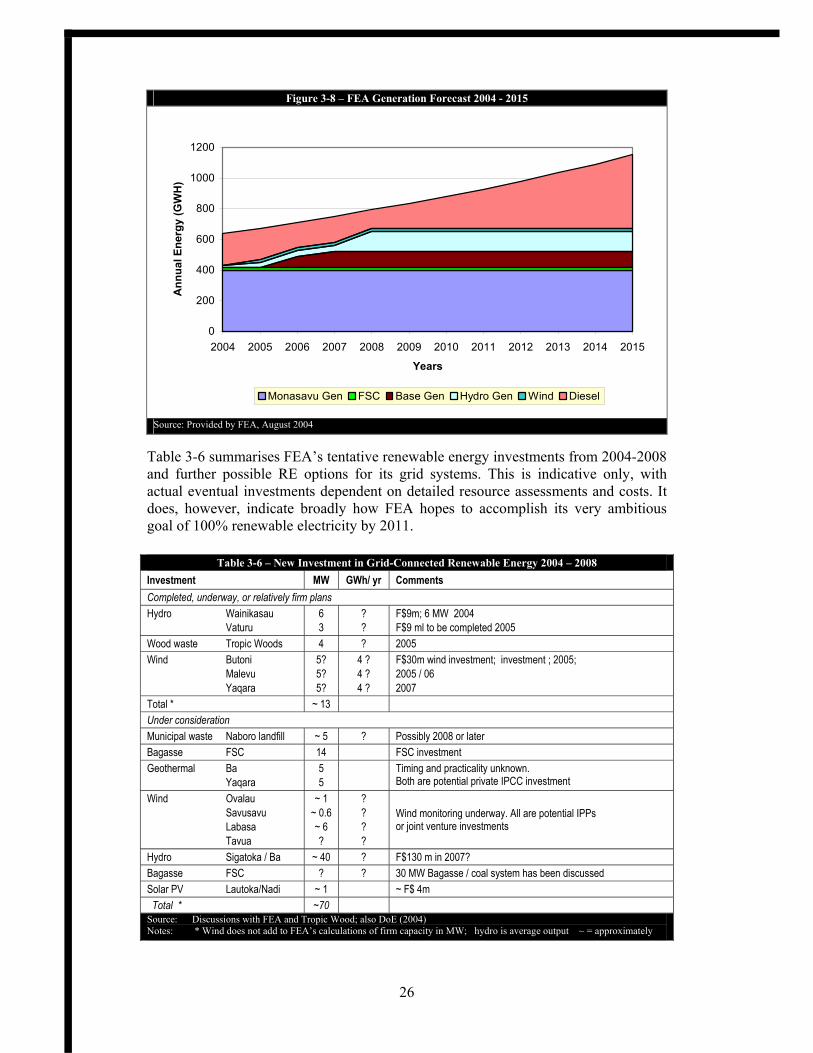
26
Figure 3-8 – FEA Generation Forecast 2004 - 2015
0
200
400
600
800
1000
1200
2004 2005 2006 2007 2008 2009 2010 2011 2012 2013 2014 2015
Years
Ann
ual E
nerg
y (G
WH
)
Monasavu Gen FSC Base Gen Hydro Gen Wind Diesel
Source: Provided by FEA, August 2004
Table 3-6 summarises FEA’s tentative renewable energy investments from 2004-2008 and further possible RE options for its grid systems. This is indicative only, with actual eventual investments dependent on detailed resource assessments and costs. It does, however, indicate broadly how FEA hopes to accomplish its very ambitious goal of 100% renewable electricity by 2011.
Table 3-6 – New Investment in Grid-Connected Renewable Energy 2004 – 2008 Investment MW GWh/ yr Comments Completed, underway, or relatively firm plans Hydro Wainikasau Vaturu
6 3
? ?
F$9m; 6 MW 2004 F$9 ml to be completed 2005
Wood waste Tropic Woods 4 ? 2005 Wind Butoni Malevu Yaqara
5? 5? 5?
4 ? 4 ? 4 ?
F$30m wind investment; investment ; 2005; 2005 / 06 2007
Total * ~ 13 Under consideration Municipal waste Naboro landfill ~ 5 ? Possibly 2008 or later Bagasse FSC 14 FSC investment Geothermal Ba Yaqara
5 5
Timing and practicality unknown. Both are potential private IPCC investment
Wind Ovalau Savusavu Labasa Tavua
~ 1 ~ 0.6 ~ 6 ?
? ? ? ?
Wind monitoring underway. All are potential IPPs or joint venture investments
Hydro Sigatoka / Ba ~ 40 ? F$130 m in 2007? Bagasse FSC ? ? 30 MW Bagasse / coal system has been discussed Solar PV Lautoka/Nadi ~ 1 ~ F$ 4m Total * ~70 Source: Discussions with FEA and Tropic Wood; also DoE (2004) Notes: * Wind does not add to FEA’s calculations of firm capacity in MW; hydro is average output ~ = approximately

27
3.2.2 FEA tariffs and supply costs
FEA has a single national tariff structure throughout all supply areas, with charges varying by consumer classification. As Figure 3-9 illustrates, the charge to consumers (excluding Value Added Tax or VAT) has declined slightly in current dollar terms since 1993, and has been static since 1999. However, the cost of supply varies greatly by delivery area (Table 3-7). In 2001, for example, the cost to supply urban consumers in Viti Levu was about half the cost of urban customers in Vanua Levu or Ovalau. If the cost for urban Viti Levu is set at a baseline of 1.0, rural supply costs in 2001 were 2.68 in Viti Levu, 6.42 in Vanua Levu and 9.89 in rural Ovalau. It has long been argued at the political level in Fiji that a tariff varying by geographical area according to supply cost is unpalatable. Although this may be true, the policy of a single national tariff has reduced the incentives for FEA to extend its supply to other islands – and more remote parts of current supply areas – where costs per kWh may well exceed ten times Suva/Nadi/Lautoka supply costs. The current policy, whatever its merits, also requires a considerable level of subsidy from urban Viti Levu users to the rest of FEA’s customers. It has also hindered past efforts to develop grid-based renewable energy systems, which could be less expensive than diesel alternatives but nonetheless financially unattractive under a national power tariff.
Figure 3-9 – FEA Tariff 1993 - present
Adapted from Energy Statistics Yearbook 1993 - 2000 (DoE, 2003)
Table 3-7 – FEA Cost
of Power Delivery 2001 Delivery area F$/kWh Viti Levu Urban $ 0.19 Viti Levu Rural $ 0.51 Vanua Levu Urban $ 0.40 Vanua Levu Rural $ 1.22 Ovalau Urban $ 0.38 Ovalau Rural $ 1.88 Source: DoE/GEF Fiji documents
From August 1999, the FEA tariff was reduced, in essence by a Prime Ministerial decision imposed on FEA, from 22.51 F¢/kWh for domestic consumers to the current (October 2004) level of 20.59 ¢/kWh, shown in Table 3-8.
Table 3-8 - Details of FEA Tariffs, August 2004 * Categories Tariff (VAT Exclusive) Domestic and Institutional (private schools, churches, temples and mosques)
20.59 ¢ / kWh Minimum charge = $4.12 / month
Commercial / Industrial 20.71 ¢ / kWh if < 14,999 kWh / month 20.00 ¢ / kWh if ≥ 15,000 kWh / month Minimum charge $8.28 / month
Street Lighting 17.98 ¢ / kWh Maximum Demand (> 75 kW) 75 - 500 kW 14.00 ¢ / kWh (energy) + 18.3534 $ /kW / month (demand) 501 - 1000 kW 13.50 ¢ / kWh (energy) + 18.3534 $ /kW / month (demand) 1001 - 5000 kW 12.00 ¢ / kWh (energy) + 18.3534 $ /kW / month (demand) > 5000 kW Negotiated price If demand < 75 kW any month 14.00 ¢ / kWh (energy) + $1,376.51 (demand) If client opts for high voltage supply 4% reduction of tariff For manufacturing industry, < 200,000 kWh / month between 9:30 pm & 6:00 am, and can accept interruptible supply
Maximum demand negotiated discount available
Excess reactive power charge (If power factor < 0.85) 13.14 ¢ /kVA + ordinary energy tariff Source: FEA, 2004 * For all prices, a Value Added Tax of 12.5% is added Consistent with its 2001 election manifesto, the SDL/CAMV coalition government froze FEA charges until at least September 2004. FEA’s charges have declined
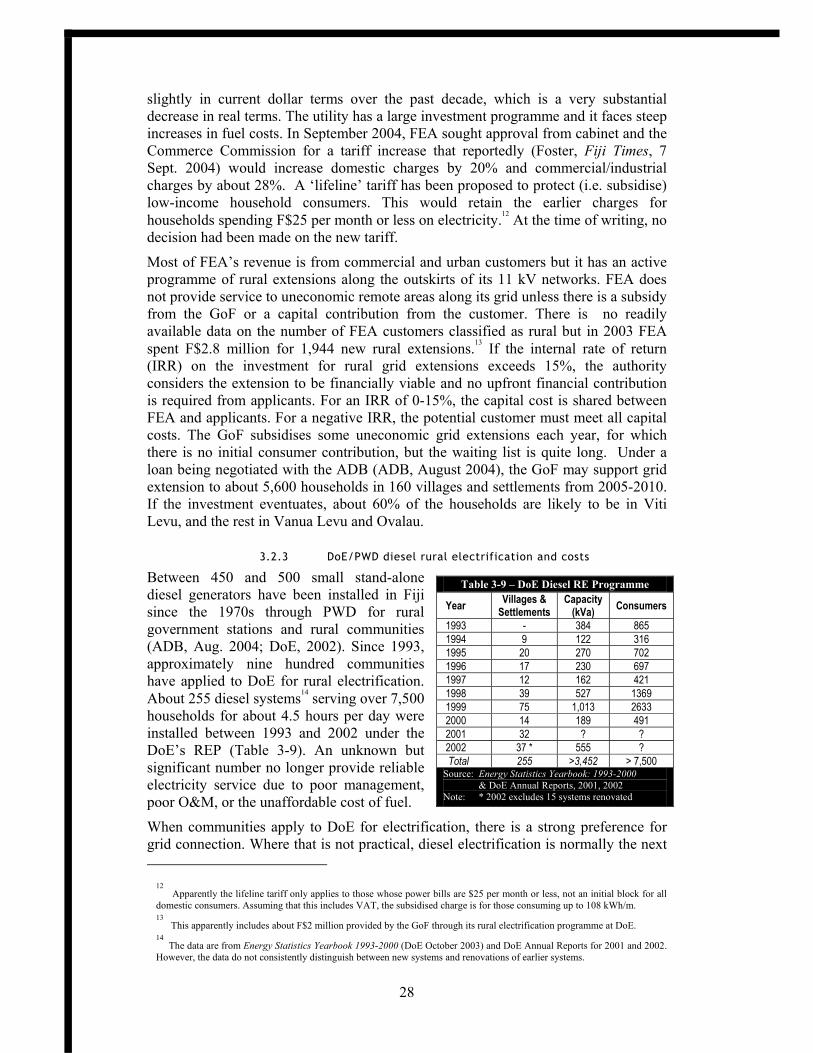
28
slightly in current dollar terms over the past decade, which is a very substantial decrease in real terms. The utility has a large investment programme and it faces steep increases in fuel costs. In September 2004, FEA sought approval from cabinet and the Commerce Commission for a tariff increase that reportedly (Foster, Fiji Times, 7 Sept. 2004) would increase domestic charges by 20% and commercial/industrial charges by about 28%. A ‘lifeline’ tariff has been proposed to protect (i.e. subsidise) low-income household consumers. This would retain the earlier charges for households spending F$25 per month or less on electricity.12 At the time of writing, no decision had been made on the new tariff.
Most of FEA’s revenue is from commercial and urban customers but it has an active programme of rural extensions along the outskirts of its 11 kV networks. FEA does not provide service to uneconomic remote areas along its grid unless there is a subsidy from the GoF or a capital contribution from the customer. There is no readily available data on the number of FEA customers classified as rural but in 2003 FEA spent F$2.8 million for 1,944 new rural extensions.13 If the internal rate of return (IRR) on the investment for rural grid extensions exceeds 15%, the authority considers the extension to be financially viable and no upfront financial contribution is required from applicants. For an IRR of 0-15%, the capital cost is shared between FEA and applicants. For a negative IRR, the potential customer must meet all capital costs. The GoF subsidises some uneconomic grid extensions each year, for which there is no initial consumer contribution, but the waiting list is quite long. Under a loan being negotiated with the ADB (ADB, August 2004), the GoF may support grid extension to about 5,600 households in 160 villages and settlements from 2005-2010. If the investment eventuates, about 60% of the households are likely to be in Viti Levu, and the rest in Vanua Levu and Ovalau.
3.2.3 DoE/PWD diesel rural electrification and costs
Between 450 and 500 small stand-alone diesel generators have been installed in Fiji since the 1970s through PWD for rural government stations and rural communities (ADB, Aug. 2004; DoE, 2002). Since 1993, approximately nine hundred communities have applied to DoE for rural electrification. About 255 diesel systems14 serving over 7,500 households for about 4.5 hours per day were installed between 1993 and 2002 under the DoE’s REP (Table 3-9). An unknown but significant number no longer provide reliable electricity service due to poor management, poor O&M, or the unaffordable cost of fuel.
When communities apply to DoE for electrification, there is a strong preference for grid connection. Where that is not practical, diesel electrification is normally the next
12 Apparently the lifeline tariff only applies to those whose power bills are $25 per month or less, not an initial block for all
domestic consumers. Assuming that this includes VAT, the subsidised charge is for those consuming up to 108 kWh/m. 13
This apparently includes about F$2 million provided by the GoF through its rural electrification programme at DoE. 14
The data are from Energy Statistics Yearbook 1993-2000 (DoE October 2003) and DoE Annual Reports for 2001 and 2002. However, the data do not consistently distinguish between new systems and renovations of earlier systems.
Table 3-9 – DoE Diesel RE Programme
Year Villages & Settlements
Capacity (kVa) Consumers
1993 - 384 865 1994 9 122 316 1995 20 270 702 1996 17 230 697 1997 12 162 421 1998 39 527 1369 1999 75 1,013 2633 2000 14 189 491 2001 32 ? ? 2002 37 * 555 ? Total 255 >3,452 > 7,500 Source: Energy Statistics Yearbook: 1993-2000 & DoE Annual Reports, 2001, 2002 Note: * 2002 excludes 15 systems renovated
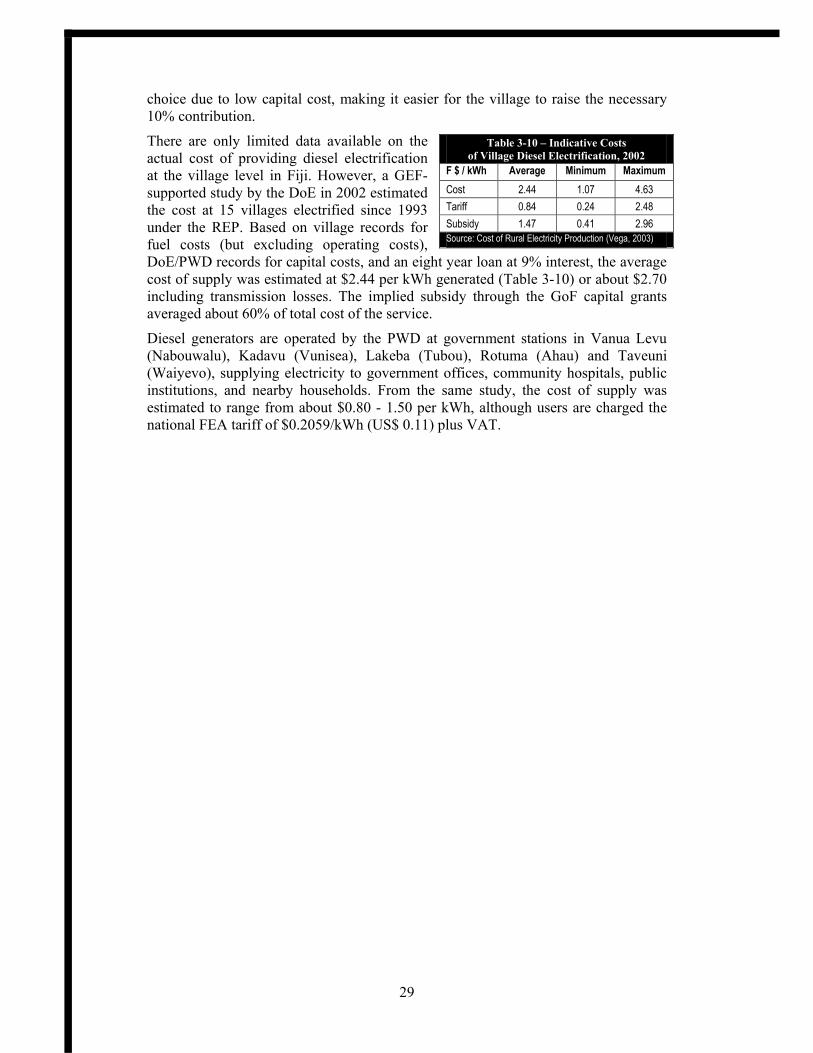
29
choice due to low capital cost, making it easier for the village to raise the necessary 10% contribution.
There are only limited data available on the actual cost of providing diesel electrification at the village level in Fiji. However, a GEF-supported study by the DoE in 2002 estimated the cost at 15 villages electrified since 1993 under the REP. Based on village records for fuel costs (but excluding operating costs), DoE/PWD records for capital costs, and an eight year loan at 9% interest, the average cost of supply was estimated at $2.44 per kWh generated (Table 3-10) or about $2.70 including transmission losses. The implied subsidy through the GoF capital grants averaged about 60% of total cost of the service.
Diesel generators are operated by the PWD at government stations in Vanua Levu (Nabouwalu), Kadavu (Vunisea), Lakeba (Tubou), Rotuma (Ahau) and Taveuni (Waiyevo), supplying electricity to government offices, community hospitals, public institutions, and nearby households. From the same study, the cost of supply was estimated to range from about $0.80 - 1.50 per kWh, although users are charged the national FEA tariff of $0.2059/kWh (US$ 0.11) plus VAT.
Table 3-10 – Indicative Costs of Village Diesel Electrification, 2002
F $ / kWh Average Minimum Maximum Cost 2.44 1.07 4.63 Tariff 0.84 0.24 2.48 Subsidy 1.47 0.41 2.96 Source: Cost of Rural Electricity Production (Vega, 2003)

30
4 ENERGY DEMAND
4.1 Household
There are only limited data available on energy demand within households, and demand within different economic sectors for petroleum fuels and electricity. At the household level, most information is out of date as the most recent census was carried out eight years ago in August 1996. According to the census, nearly half of households cooked mainly with wood in 1996, mostly on open fires, nearly 30% used LPG, nearly 21% kerosene, and less than 3% electricity. Over 82% of households had electric lighting, over 29% wick-type kerosene lamps, and nearly 8% pressure-type benzine or kerosene lamps. Energy for household cooking and lighting for all households, urban and rural, is summarised in Tables 4-1 and 4-2.
Table 4-1 – Main Energy Source for Household Lighting in 1996
Energy Source No. of hh % Electricity 89,806 62.1 Pressure lamp 10,856 7.5 Wick Lamp 42,121 29.1 Other 1,834 1.3 Total 144,617 100.0 Source: Report of 1996 Census (GoF, 1998)
Table 4-2 –
Main Fuel, Household Cooking, 1996 Fuel No. of hh % Electricity 3,785 2.6 LPG 40,770 28.2 Kerosene 29,951 20.7 Wood, stove 7,740 5.4 Wood, open fire 61,761 42.7 Other 610 0.4 Total 144,617 100.0 Source: Report of 1996 Census (GoF, 1998)
In principle, the information from Tables 4-1 and 4-2 should allow estimates of household demand for the fuels covered. However, as Table 4-3 illustrates, households obviously use a range of energy sources, not just one, particularly for cooking, so the census data are only indicative. Unsurprisingly, the demand for kerosene and LPG is higher in electrified households, which tend to be more affluent.
4.2 Petroleum
Table 3-1 and Figure 3-1 in the previous chapter show the reported quantity of retained petroleum imports (total imports minus re-exports) to Fiji from 1990 through 2003. There is wide variation by product from year to year, making it difficult to accurately estimate sectoral demand by product. Some of the difference is probably due to differences in stock levels from year to year; the volume of retained imports during a year does not necessarily correspond closely to actual consumption during the same year. In some cases, data are simply inconsistent. To better estimate net demand (consumption) by fuel type, the DoE requested sales data for 2003 from Shell, Mobil and BP. Despite
Table 4-3 – Cooking Fuel in Rural Households, 2003 Fuel Electrified
hh (%) Unelectrified
hh (%) Wood (including agr. wastes) 35 67 Wood and LPG 34 25 Wood and kerosene 22 6 Wood, LPG and kerosene 7 2 LPG only 2 0 Total 100 100
Sample size 271 hh 542 hh hh with income <F$3,000/year 51 74 Source: Energy Use Survey Report (Namouou, 2003 ) Note: Electrified is from stand-alone diesel gensets, not FEA
Table 4-4 – Fuel Sales by Fiji Shell, 2003 Category Megalitres
(Ml) Transport 67 Government 8 Marine (Domestic & International) 75 Aviation (International) 22 Home Use (Kerosene) 11 Boilers / Industrial 6 Total 189 Source: L Vega from Fiji Shell, March 2004

31
frequent reminders, only Shell provided any information (Table 4-4) and this is insufficient for meaningful analysis. Accordingly, and considering the serious errors in Table 3-1, any breakdown of petroleum use by sector is approximate and indicative only. Table 4-5 provides such an estimate for 2000, the most recent year for which the DoE has prepared an energy balance. Because the import data are so inaccurate, the table uses the trendline of Figure 3-1 to estimate total retained imports (330 ML, excluding LPG), with the consumption of each product assumed to be its average reported percentage over the period 1997-2001 (calculated from Table 3-1).
Table 4-5 - Estimated Consumption of Petroleum in Fiji by Sector (ML; 2000)
Fuel Retained Imports (ML) Transport Electricity House-
holds Commercial
sector Industry
Motor spirit 60.6 55.0 0 0.1 0 5.5 ADO 83.8 76.9 1.0 0 1.7 4.2 IDO 105.1 0 91.0 0 0 14.1 RFO 12.1 8.8 0 0 0 3.3 Kerosene 17.0 0 0 16.4 0.3 0.3 Avgas 38.6 38.6 0 0 0 0 Avtur (Jet A-1) 12.8 12.8 0 0 0 0 LPG 20.0 0 0 12.3 7 0.7 Total 350 192.1 92.0 28.8 9 28.1 % of total 100 55 26 8 3 8 Source: Estimated from Table 3-1 and Figure 3-1. Note: LPG calculated from conversion table of page vi.
As explained below, Table 4-5 is only very roughly indicative
• Industrial Fuel Use. The DoE has estimated industrial petroleum fuel use (Table 4-6) from 1993-2000 incorporating information extrapolated from the Census of Building and Industry (1993-1994), which includes detailed information on expenditures for fuel use disaggregated by industry and type of fuel. DoE converted money values into physical units of energy. Industrial census data are a decade old, and the structure of the Fiji economy has since changed so this method is probably not a very accurate indication of business and industrial energy use. However, there are no better data available.
Table 4-6 - Estimated Consumption of Petroleum in Fiji by Industry (kilolitres; 2000)
Industrial sector Petrol ADO IDO RFO Kerosene LPG Mining & quarrying 287 151 10,508 11 0 0 Food manufacture 1535 1418 1395 1692 43 288 Clothing & footwear 1209 74 547 4 4 269 Wood products 165 248 182 643 240 4 Paper & printing 460 45 175 20 2 133 Chemical products 305 40 55 3 11 0 Building & construction 787 1651 85 883 1 33 Other industry 734 533 1,118 71 0 10 Total 5,482 4,160 14,065 3,327 300 737 Source: Energy Statistics Yearbook: 1993 –2000 (DoE, Dec. 2003) See page vi for converting LPG from t to kL.
• Land Transport. The majority of motor spirit use is for vehicular transport. Minor use is for outboard motor fuel. Some vehicle transport (e.g. buses and lorries) uses ADO as a fuel. There are no data showing the allocation of fuels for land transport.

32
• Marine Transport. Marine transport uses ADO as the primary fuel. No data are available showing the separation of land and marine transport.
• Air Transport. The jet fuel (Avtur or Jet A1) and aviation gasoline shown in Table 4-5 is assumed to be for internal flights only but in fact probably include some fuel used by local airlines for some regional flights.
• Electricity Generation. Electricity generation uses both ADO and IDO according to the type of engine in service. Data showing FEA’s use of fuel were not made available to the PIREP team. From Table 3-4, only 18% of FEA’s 2000 generation was from petroleum fuels, mainly IDO. Using an average of 0.3 l/kWh generated, this would require 30 ML of IDO. The DoE REP diesel installations use about 1 ML per year.15 The PWD’s gensets use no more (Table 4-11) than about 0.5 ML. Other industrial generation is unlikely to use more than 10 ML for a total of 41.5 ML of fuel, about 40.5 ML of IDO and 1 ML of ADO. However, Table 4-5 shows over 105 ML of retained IDO imports so there is a serious error somewhere. 16
• Household Lighting and Cooking. Kerosene is primarily used for household lighting and cooking though there are some outboard motors in Fiji that operate on kerosene
• LPG. LPG is used mainly for cooking.
4.3 Electricity
4.3.1 Household electricity demand
As Table 4-7 shows, of 144,617 households at the time of the August 1996 census, 67% had some form of electricity supply. Of the electrified households, 86% were supplied by the FEA, 7% used their own generators, about 5% were connected to village grids, and nearly 2% received power from other small industrial or government grids (FSC, EGM and PWD). For households overall, 53% of Fijian, 78% of Indo-Fijian, 87% of urban and 49% of rural had access to electricity. A decade earlier in 1986, 75% of urban and only 31% of rural households had electricity. The census report provided no information on households electrified through solar photovoltaic systems.
15
This assumes optimistically that 350 systems of the 450 or so installed between 1973 and 2000 are functioning, that they typically produce 30 kWh/day for 200 days per year and use about 0.46 l/kWh. Vega (PIREP national consultant’s report, 2003) more optimistically assumes 473 REP gensets operating in 2003 using 1.4 ML of ADO. 16
The DoE’s energy balance for 2000 (which shows no electricity production from IDO and an insignificant amount from ADO) shows a ‘statistical difference’, i.e. error, of 77 ML of IDO consumption.
Table 4-7 – Electrified Households by Supplier in 1996
Source of electricity No. of hh % Fiji Electricity Authority (FEA) 83,031 57.4 Fiji Sugar Corporation (FSC) 551 0.4 Emperor Gold Mine (EGM) 639 0.4 Village systems 5,178 3.6 Public Works Dept. (PWD) 534 0.4 Own power plant 6,823 4.8 Total electrified 96,756 67.0 Not electrified 47,861 33.0 Source: Report of 1996 Census (GoF, 1998)
Table 4-8 – Electrified Households by Location in 1996
Location Electrified households
% of hh electrified
Viti Levu * 81,072 73.0 Vanua Levu / Taveuni ** 11,931 46.6 Other islands 3,753 47.5 Total electrified 96,756 67.0 * Includes Yasawa/Mamanuca groups & offshore islands ** all of Macuatu, Cakaudrove & Bua Provinces Source: Report of 1996 Census (GoF, 1998)

33
Table 4-8 shows the difference in electrification by location in 1996. The main island of Viti Levu (including close offshore islands) was 73% electrified, with the rest of the country below 50%. The more remote islands or island groups of Kadavu, Lomaiviti, Lau and Rotuma had 42%, 48%, 49% and 62% household electrification respectively, but for the most part these were basic systems operating a few hours per day, and often out of operation for long periods.
4.3.2 FEA
FEA sales by consumer classification are shown in Figure 4-1 for 1999 through 2003. The decline in 2000 was due to the extended political crisis of that year. The slight 2003 decrease was because of FEA conservation efforts during the drought, which badly affected hydropower output.
Table 4-9 provides more detail on sales by consumer classification in 2003. Commercial, industrial, residential and others accounted for 36%, 25%, 23% and 15% respectively of total sales. Of the 660 GWh sold, over 90% were in Viti Levu.
Figure 4-1 – FEA Sales 1999-2003
Source: FEA for 2003
Table 4-9 – FEA Sales by Category in 2003 Category Customers Sales
(GWh) KWH / month per customer
Commercial n/a 240.7 n/a Industrial n/a 163.9 n/a Residential n/a 154.2 n/a Other n/a 101.3 n/a Total 125,000 660.1 Source: FEA
4.3.3 PWD/DoE diesel systems
Roughly half of Fiji’s rural population are without electricity17 or have a poorly functioning part-time supply. Since the early 1970s, PWD and/or DoE have installed some 473 community diesel systems, in principle serving about 15,000 people. However, the 1993 REP requires recipient communities to be responsible for O&M, an approach that has not worked well for diesel gensets. DoE and PWD do not have sufficient funds to regularly determine the operational status of the diesel gensets they have installed. Accordingly, the number of functioning systems and the population served is not accurately known. Table 4-10 summarises characteristics of diesel systems installed under the REP since 1993. Table 4-11 summarises operations of the PWD systems at government provincial centres. The Nabouwalu station in Vanua Levu is a wind/solar/diesel hybrid and is discussed in chapter 5.
17
The precise percentage is unknown. There have been many households added to the FEA grid and the DoE/PWD systems since the 1996 census but the incidence of poverty in Fiji has also increased in the past decade.

34
Table 4-10 – Off-Grid
Diesel Generation System Characteristics
Parameter Range Average
Size (kVa) 8 to 35 18 Houses per village 25 to 100 47 People / house 2 to 6 4.6 Service (hours / day) 3 to 5 3.6 Generation (kWh/day) 5.5 to 47.6 19. Generation per house (Wh/day) 92 to 993 501 Fuel consumption (litres/day) 3 to 28 8.2
Source: DoE records analysed by Luis Vega.18
Table 4-11 – Electricity Production by Diesel Generators at Government Stations (2002)
Site Generation (MWH / year)
Fuel use (kL)
Efficiency (kWh / litre)
Lakeba 177 70.956 2.5 Nabouwalu* 216 80.165 2.7 Taveuni 228 95.204 2.39 Vunisea 245 94.198 2.6 Rotuma n/a n/a n/a
Source: Fiji RESCO GEF project report (2003). Note: * Nabuwalu is diesel genset only
4.4 Projected Fossil Fuel Use and GHG Emissions
Fiji has never submitted a formal GHG inventory to the UNFCCC. According to a draft GEF-supported analysis (GoF, 1997), Fiji emitted 779 gigagrammes (Gg) of carbon dioxide (CO2) in 1991 from 10,203 terajoules (TJ) of petroleum and 571 TJ of coal. Based on the DoE data on fuel imports, a time series of CO2 emissions (Table 4-12) was developed by Dr. Luis Vega for PIREP. As noted, there are discrepancies and errors in fuel use data for Fiji and Table 4-12 shows significant year-by-year variation in estimated GHG emissions.19 The choice of a baseline year for projections (preferably a ‘typical’ year), baseline fossil fuel use and corresponding baseline emissions are thus not straightforward. The choice affects the estimates within this report of the potential for GHG reductions in percentage terms, but not the magnitude of these reductions.
Table 4-12 – Summary of Fossil Fuel CO2 Emissions 1990-2000, Gg of CO2 per year
FOSSIL FUELS 1990 1991 1992 1993 1994 1995 1996 1997 1998 1999 2000 Coal 39.0 25.6 43.2 43.4 37.2 5.7 3.4 3.7 6.6 N/A N/A Motor Spirit 155.9 NA NA 155.3 198.5 154.8 159.3 187.2 179.1 N/A 110.8 Avgas 7.8 NA NA 35.4 133.3 83.9 121.0 169.6 73.8 N/A 148.1 Kerosene 120.7 NA NA 20.0 25.3 25.9 34.2 35.2 31.6 N/A 14.0 Diesel-ADO 265.3 NA NA 474.8 350.6 354.0 377.0 286.6 425.1 N/A 130.3 Diesel-IDO 116.6 NA NA 103.9 139.9 165.5 200.4 344.7 299.8 N/A 262.4 RFO or IFO 12.4 NA NA 11.0 19.8 10.1 29.4 15.8 7.7 N/A 22.2 LPG 17.5 23.0 23.0 27.5 27.8 31.5 30.3 32.6 23.1 30.0 34.3 Total (rounded off) 735 – – 871 932 831 955 1075 1047 – 722 Source: Dr. Luis Vega, 2004 1 Gg (one gigagramme) = 1,000 tonnes N/A = not available
For a small economy, which has shifted between growth and slumps during the past twenty years, accurately projecting future patterns of energy demand is difficult. A new gold mine, a large tourist complex, an unfavourable WTO trade ruling, continued
18
The estimates are based on the assumption that the systems installed operated as intended, typically 4 hours per day every day of the year with 100W demand per household. The actual energy generated is probably lower due to frequent power outages and long periods between break down and repairs. 19
For 1998, using the conversion table (page vi), the petroleum fuel import data of Table 3.1 and 4.36 kt of coal imports, CO2 emissions are 990 Gg, about 6% less than those estimated by Vega. The difference is small considering the inaccuracies in fuel import data.

35
contraction of the sugar industry, or concerns overseas about possible terrorist activity in Fiji,20 could all have large and rapid impacts.
In section 1.3 it was noted that recent population growth has been 0.8-1% per year with a high emigration rate for skilled workers required for sustained future growth. No official projections have been made, but population over the next decade seems unlikely to exceed an AAGR of about 1 percent. Section 1.4 showed the highly variable pattern of past economic growth since Independence, with long term real GDP growth from 1980 being a percentage point or two above population growth. There are serious concerns regarding the declining and very low rate of investment over many years as a percentage of GDP (Figures 1-5 and 1-6), which will hamper future growth if the trend continues. It is assumed for the purposes of this study that real economic growth over the next 10-15 years will be modest, about 2-3%, or 1-2 percentage points above population growth. FEA (section 2.3) expects growth in its electricity generation and power demand to be somewhat higher, about 4.5-5% per year compared to 4% from 1990-2003. This PIREP study assumes a 4.5% annual increase in FEA generation and 3% for other energy use in order to estimate opportunities for replacing fossil fuels with renewable energy, and thus reduce GHG emissions.
For this purpose, it is assumed as a ‘baseline’ case that all growth in commercial energy use is from fossil fuels, i.e. oil. Table 4-13 summarises fossil fuel use and GHG emissions from 2000 to 2010 assuming no significant new investment in renewable energy. Obviously it would have been preferable to use 2003 as the base year but the petroleum import data for the last several years is clearly erroneous (Figure 3-1) and cannot be used. Also note that the baseline year 2000 GHG emissions of Table 4-13 are about 24% higher than the 2000 estimates of Table 4-12. Therefore, the projections below are no more than broad indications of the growth of commercial energy use and energy sector GHG emissions in Fiji over the next decade.
Table 4-13: Petroleum Demand (Retained Imports) and GHG Emissions in 2000 and Baseline Projections for 2010
2000 baseline 2010 projections Product Imports
(ML ) GHGs
(Gg CO2) AAGR
(%) Imports
(ML) GHGs
(Gg CO2 Motor spirit 60.6 152 3 81.4 204
Distillate for electricity21 42 113 14.4 161 435 Other distillate use 159 543 3 213.7 577 Kerosene 17.0 48 3 22.9 64 Avgas 38.6 89 3 51.9 119 Avtur 12.8 33 3 17.2 45
LPG 20.0 32 3 26.9 43
Total 350 897 5.1 575 1487
Source: Fuel imports for 2000 are from Table 4-5 Distillate includes a small amount of fuel oil Notes: Ignores lube and small amount of coal; Calculation of GHGs from data of page vi.
20
In 2004, Fiji had hundreds of citizens working as security guards in Iraq and planned to send a military contingent to guard United Nations personnel. 21
The very high AAGR for distillate for electricity generation in the absence of new renewable energy is explained as follows: In 2000 FEA generated 553 GWh (Table 3-3) of which diesel accounted for 135 GWh and hydro 418. In 2010, FEA expects to generate about 900 GWh (Figure 3-8). Except for small hydro added in 2004 (ignored as it is small and well after the base year), all growth of 900 – 418 = 482 GWh is from diesel in the absence of new renewable energy investment. At 0.3 l/kWh, this requires 145 ML of fuel. Other growth of distillate for electricity is assumed to be 3% per year for a 2010 demand of (1.03)10 x 42 ML = 56 ML for a total of 161 ML.

36
As discussed in the next chapter, Fiji has significant potential for further commercial energy production from indigenous renewable resources, including further hydropower development, biofuels and geothermal. FEA already has plans for considerable investment in RE. Ignoring promising technologies that are unlikely to be commercialised in the next decade or so, such as seawave or ocean thermal energy, Table 4-14 provides indicative, order-of-magnitude estimates of the potential from renewable resources and energy efficiency improvements with their associated GHG reductions. The estimates are based on the information in the next chapter, with key assumptions summarised below the table.
Table 4-14: Indicative Potential Maximum Energy Savings and GHG Savings from Renewable Energy and Energy Efficiency in Fiji, 2010
Resource or Technology
Potential fuel savings, energy or power
production
Potential GHG
reduction (Gg)
% of total
savings Comments
Large Hydro 300 ML of IDO 810 83.4 200 MW of new hydro Micro / mini hydro 3 ML of ADO 8 0.8 40 systems of 3.3 MW total Geothermal 16 ML of IDO 43 4.5 15 MW Wind 3.8 ML of diesel 19 2.0 20 MW Bio-diesel 1.7 ML of ADO 4 0.4 20% of coconut oil used as fuel Fuel ethanol 11 ML of petrol 27 2.8 15% petrol replacement
Bagasse22
25 MW e 0 0 Gains possibly offset by use of coal to supplement bagasse
Wood waste 4 MWe small 0 Relatively small; not estimated Other biomass ? small 0 Relatively small; not estimated Municipal waste 5 MW 17 1.8 Naboro landfill; emissions uncertain Solar PV 0.4 ML of diesel 1 0.1 10,000 household PV systems Energy efficiency electricity transport
16 ML
13.5 ML
0 * 37
3.8
Aggressive transport energy savings: 10% of electricity fuel use in 2010 5% of ground transport energy use in 2010
Total 966 100 See text below table for assumptions. This is explained below the table.
The following assumptions were made for the potential savings of Table 4-14:
• all new proposed and planned FEA investments indicated Table 3-11, and those being investigated, are viable and are implemented;
• large hydro assumes (Table 5-9) about 200 MW (including Wainikasau & Vaturu) with 1,000 GWh per year average output. Assume the additional 200 MW replaces IDO which saves 810 Gg of CO2 :
23 • small hydro potential (Table 5-10) assumes 40 small systems with 3.3 MW
installed capacity. Assuming small isolated systems at sites with small loads produce 2 GWh/MW installed and displace ADO at 0.46 litres per kWh, savings are 8.1 Gg of CO2;
• preliminary estimates suggest about 10 MW of geothermal potential on Viti Levu (section 5.1) and perhaps as much in Vanua Levu. Assume 15 MW is developed
22
There has reportedly been some concern that pine prices may decline over the next decade, and consideration of pine for use as biomass fuel for power generation. In this case, a bagasse and wood system, with no coal, would have very significant GHG benefits. 23
The estimate (see conversion table of page vi) assumes 1,000 million kWh, 0.3 litres of IDO per kWh, and 2.7 kg of CO2 per litre of fuel. The other calculations are similar.

37
generating 3.5 GWh/MW and replacing diesel (IDO) system using 0.30 l / kWh. The savings would be 42.5 Gg of CO2;
• assume 20 MW of wind turbines (Table 3.11) with 1 GWh/MW of installed capacity. If wind systems replaced reasonably efficient small gensets (0.35 l/kWh), it would replace 7 ML of IDO, saving 18.9 Gg of CO2 emissions;
• Fiji produces about 8,000 tonnes per year of coconut oil or about 8.8 ML, equivalent in energy value to about 8.3 ML of distillate. If 20% were used as diesel (ADO or IDO) replacement, CO2 reduction would be about 4.5 Gg;
• there is potential for producing ethanol from sugar cane (even if sugar exports collapsed). Assume 73 ML of petrol imports (Table 4-13) with 15% replaced by ethanol, i.e. vehicles using a 15% ethanol/85% petrol blend. This would reduce petrol imports by 11 ML in 2015. Ignoring CO2 produced during manufacture, CO2 emissions would be reduced by 27.5 Gg;
• there have been various proposals for investment in the FSC to enable substantially greater sales of electricity to FEA, with a 25 MW plant tentatively planned. About 970 kg of CO2 are released per tonne of bagasse burned. If additional electricity is produced from more efficient use of bagasse already used as boiler fuel to produce sugar, there would be net GHG reductions. However, there have been discussions of a bagasse/hogwood/coal fuelled system which (depending on the amount of coal used) could increase GHG emissions. For the purposes of this study, it is assumed that any additional bagasse for electricity would at best be CO2 neutral. (As discussed below, the savings calculated overall for Table 4-14 are unrealistically high so the overall effect of a fully bagasse/wood system would not reduce Fiji’s net GHG emissions);
• there have been various proposals for using waste from wood processing plants for more electricity production. Even with a new 4 MW system, GHG savings would be small;
• a new municipal waste landfall at Naboro (section 5.1) is expected to process over 140,000 tonnes of waste per annum by 2015. A 4.5 - 5 MW waste-to-energy incinerator has been proposed, from which GHG emissions can vary considerably depending on the technology used and the quality of O&M. Assume a 5 MW system produces 2.5 GWh/MW, and reduces CO2 emissions by 50% compared to a diesel-fuelled system. The reductions would be about 17 Gg;
• there are about 150,000 households in Fiji of which at least 50,000 live in areas of high solar insolation. DoE estimates 12,000 households as candidates for PV. Assume that 10,000 rural households receive PV systems of 100 Wp & 0.25 kWh/day. Assume 300 days/yr operation = 0.26 million kWh/year. At 0.46 l/kWh for small diesel systems, this would displace 0.35 ML of fuel, equivalent to only 0.93 Gg per year;
• there are significant opportunities for GHG reductions through improved efficiency of electricity use. An aggressive demand side management programme could in principle reduce electricity use by 10% with a decade, reducing fuel use by 10% of 161 ML (Table 4-13) or 16 ML. However, as discussed below, the information in Table 4-14 suggests that 100% of fuel used for electricity generation in Fiji can in principle be replaced by renewable energy. In this case, a DSM programme would certainly save fuel (and money) but not reduce GHG emissions any further; and

38
• an aggressive energy efficiency programme could also reduce ground transport fuel use by up to 5% within a decade. This suggests that about demand could decrease by 13.5 ML,24 reducing emissions by 36.7 Gg.
Table 4-14 suggests that in principle, Fiji could reduce CO2 equivalent GHG emissions through renewable energy investments by nearly 1,000 Gg per year in ten years, roughly the level of current emissions. This indicative and crude estimate is based on proven technologies and more-or-less known resources but does not consider all economic, financial, political, social, physical, environmental or other practical constraints.
However, Table 4-14 is misleading in practice. Developing all potential large hydropower alone would reduce fuel consumption for electric power generation in 2010 by 300 ML but the projected demand for this use (Table 4-13) is only 161 ML. Table 4-15 below assumes that all electricity is generated by some form of renewable energy but power sector fuel savings are limited to the expected demand of 161 ML.
Table 4-15: Revised Estimate of indicative Maximum Energy and GHG Savings from Renewable Energy and Energy Efficiency in Fiji, 2010
Resource or Technology
Potential fuel savings
Potential GHG
reduction (Gg)
% of total
savings Comments
Grid-based electricity from renewable energy * 161 ML of ADO 435 86.4 100% of electricity from renewables
Bio-diesel 1.7 ML of ADO 4 0.8 20% of coconut oil used as fuel Fuel ethanol 11 ML of petrol 27 5.4 15% petrol replacement Solar PV 0.4 ML of diesel 1 0.2 10,000 household PV systems Energy efficiency electricity transport
16 ML
13.5 ML
0 37
7.3
Aggressive transport energy savings: 10% of electricity fuel use in 2010 5% of ground transport energy use in 2010
Total 504 100 * This also includes major industrial producers, who might self-generate and connect to the grid.
In principle, Fiji could replace all imported fuels used for electric power generation by combining a wide range of renewable energy technologies. This would account for 86% of the potential GHG reductions in 2010 of 504 Gg, about half of the current level of emissions. Overall, renewable energy would account for about 93% of savings and efficiency measures about seven percent.
However, unless there is a considerable effort to remove barriers to renewable energy, and a significant increase in capital investment for renewable energy after 2008 that includes major hydro, geothermal and biofuel development, a large reduction in growth of CO2 emissions from new energy sources appears to be unlikely.
24
For petrol, 5% of 81.4 ML reduces demand by 4.1 ML. If distillate for transport grows 3% per year, assuming that 70 ML of the ADO used for transport (of Table 4-5) is for land transport, then savings are 5% x (1.03)10 x 70 ML = 9.4 ML. GHG savings would be 10.3 GG for petrol and 25.4 GG for distillate.

39
5 RENEWABLE ENERGY
5.1 Resources
5.1.1 Biomass resource
Biomass provides about 50% of all gross energy consumed throughout Fiji. Rural households use fuelwood, coconut husks, shells and fronds for cooking and there is also some trade in fuelwood (Figure 5-1) in urban areas. Coconut residues are used for copra drying. The bulk of the bagasse available at the sugar mills during the crushing season is used to produce process heat and electricity for internal use with surplus electricity sold to FEA. The Labasa (Vanua Levu) sugar mill supplies to FEA most of the electricity distributed through the Labasa grid during the peak of the crushing season. Table 5-1 provides an overview of the approximate amount of biomass used for energy production in Fiji from 1990 - 2002.
Table 5-1 – Summary of Approximate Renewable Energy Use in Fiji 1990-2002 (kT) Fuel or Energy 1990 1991 1992 1993 1994 1995 1996 1997 1998 1999 2000 2001 2002 Household Fuelwood 244 244 244 243 243 242 242 244 246 249 251 252 253
Pine 35 42 39 47 497 55 54 41 53 47 50 44 n/a Native wood 20 15 14 17 18 16 19 19 17 14 14 14 n/a Bagasse 1051 698 730 764 876 883 901 744 390 784 755 579 707 Coconut husk 103 96 98 88 84 84 88 89 93 98 92 98 94 Note: Extracted and rounded off from table prepared by Dr Luis Vega (PIREP national consultant’s report, 2004) Sources and explanation:: n/a = not available 1) Domestic Fuelwood: Extrapolated from Siwatibau (1978) per capita consumption for the rural sector (506 kg/year) the
undocumented consumption assumed by DoE for urban sector (87 kg/year). 2) See Table 5-7 for pine and native wood 3) Bagasse estimated from BoS sugar cane harvest records and relationships between sugar cane and sugar and bagasse
production. 4) Coconut Husks. Relationship between copra and coconut husk production derived using data from FAO, generic information
from United Coconut Association of the Philippines and experience from the DoE Welagi (Taveuni) biofuel project records. The BoS provided copra production data.
Forestry sector
Fiji's forest resources cover approximately 870,000 ha or about 47% of total land area. Plantation forests, mainly pine and mahogany, account for 13% of total forest area. Extrapolating from a 1991 Forestry Department estimate of available timber volume of 124.78 million m3, the Department estimates growth minus logging to result in a current forest biomass of around 139.6 million m3. The forestry sector contributed approximately 0.9% of GDP and 3.4% of total export earnings in 2001. It covers
Figure 5-1 – Fuelwood Sales at Suva Petrol Station
Photograph: P Johnston, 2004 Note: F$1.0 for about 3 kg

40
indigenous and plantation (exotic) forest. About 300,000 ha of indigenous forest have considerable potential for producing veneer, plywood and quality furniture. However, the rate of extraction has been excessive.
Fiji Pine Limited owns and manages 40,730 hectares of pine plantations in Viti Levu and Vanua Levu, now being harvested and processed by Tropik Woods as timber and chips for export. Fiji Hardwood Corporation Limited (FHCL) was established in 1998 to manage Fiji's hardwood plantations. There are 44,760 ha of hardwood plantation forests with mahogany accounting for 80% of planted area. Fiji may now have the largest mahogany resource in the world. Mahogany requires about 30 years to mature and produce prime quality timber. Current mature stocks allow for the sustainable harvesting of 80,000 m3 of mahogany logs per year. Unfortunately, FHCL is not replanting mahogany to ensure a future resource.
Table 5-2 summarises Forestry Department estimates of logging volume from 1992 through 2003.
Table 5-2 – Log volume harvested in thousand cubic metres 1992 1993 1994 1995 1996 1997 1998 1999 2000 2001 2002 2003 109.4 128.5 145.9 128.8 147.9 141.4 144.7 80.3 106.7 113.8 103.9 132.6 Source: Forestry Department 2004 Note: Minor discrepancies between this and other forestry data obtained
Sugar Cane
Sugar production in 2001 provided direct and indirect employment to 41,000 people, consisting of 21,000 growers; 3,000 FSC employees; and 17,000 cutters and drivers. As noted in section 1.4, sugar production has steadily dropped since 1994 and the FSC is facing annual losses, and projected losses, of between F$11 m and F$30 m between 2001 and 2008 (Table 1-7). As sugar production drops, so does electricity generation from bagasse, forcing FEA to generate or purchase from other sources, generally diesel-based suppliers. Figure 5-2 shows sugarcane and sugar production from 1999 through 2003. In principle, should the sugar industry further decline, cane could still be grown expressly for energy production for combustion in boilers, for conversion to ethanol, or both. The FSC has established a subsidiary, Pacific Co-Generation, for construction of new facilities for electric power using bagasse, wood waste and possibly coal.
Coconut
Heat released from the combustion of coconut husks is used for copra drying and cooking. Figure 5-3 shows recent trends in copra and coconut oil production and Table 5-3 estimates25 the amount of dry coconut husks available as an energy resource. In principle,
25 This was calculated by Dr Luis Vega from the following FAO formula: Dry-Husk (Tonnes) = 1.797 x Copra (Tonnes) +
68,614, (applicable for 8,000 - 20,000 t of copra) using UN Forest and Agricultural Organisation (FAO) data for coconut production in Fiji and BoS data for copra production.
Figure 5-2 – Sugarcane and Sugar Production
Source: BoS, 2004
Figure 5-3 – Copra and Coconut Oil Production
Source: BoS, 2004

41
almost any vegetable oil (often in the form of an ester of the oil) can be used as a diesel oil replacement or for blending with diesel fuel.
Table 5-3 – Copra production and coconut husk availability (kT) Year 1990 1991 1992 1993 1994 1995 1996 1997 1998 1999 2000 2001 2002 Copra 19.1 15.2 16.4 10.7 8.4 8.8 11.0 11.5 13.7 16.2 13.2 16.6 14.3 Husk 102.8 95.9 98.0 87.8 83.7 84.4 88.4 89.3 93.1 97.7 92.3 98.3 94.4 Source: rounded off from calculations by Dr. Luis Vega
Household fuelwood use
Except for very small sample sizes, there have been few measurements or surveys of wood energy consumption by rural households in Fiji since A Survey of Domestic Rural Energy Use and Potential in Fiji (Siwatibau (1978), which measured annual per capita consumption of 506 kg (oven-dry; 20.4 TJ/kT) of which 1 kg/day was used for cooking and food preservation. These estimates, and results of other surveys showing annual urban per capita fuelwood use of 87 kg, have been used ever since by DoE to estimate Fiji’s rural household fuelwood consumption, shown in Table 5.4.
Agro-industrial fuelwood
In 1991 an energy audit was carried out of Tropic Woods for DoE (Macallan, 1991). Although out of date, there are no recent public reports on the mill’s energy use. Output in 1991 is shown in Table 5-5. The mill uses wood waste as fuel for the milling process and for production of electricity. The installed capacity of the steam driven turbo-generator is 3 MW, with an operational load a decade ago of 1.8 MW and a peak of 2.2 MW. During plant start-up and maintenance electricity is purchased from FEA (approximately 1% of annual consumption) but normally surplus electricity is sold to FEA. From 1989 to 1991, internal consumption of fuelwood was about 67% of the average production of about 60,000 tonnes per year. Discussions in early 2004 (Vos with Tropik Woods) confirm that the company still operates a 3 MW cogeneration plant but internal use is now as much as 2.5 MW with surplus sold to FEA and to FSC. Much of the processing residue is put to productive use. Bark is sold to hotels for gardens, off-cuts from sawmilling are fed into the chipmill, sawdust and other residues are used in the cogeneration plant, and surplus wood residue is sold as hogfuel to FSC. Nonetheless, in the recent past considerable quantities of residues remained unused and a huge pile of residue has built up over the years. Tropik Woods has considered the establishment of short
Table 5-4 – Estimated fuelwood use in Fiji, 1990-2003
Population Fuelwood Rural Fuelwood Urban Year
Urban Rural kT TJ kT TJ Total TJ
1990 308,677 430,007 217.6 4,438.7 26.9 547.8 4,987 1991 316,863 427,765 216.4 4,415.6 27.6 562.4 4,978 1992 325,160 425,460 215.3 4,391.8 28.3 577.1 4,969 1993 333,571 423,090 214.1 4,367.3 29.0 592.0 4,959 1994 342,096 420,654 212.9 4,342.2 29.8 607.2 4,949 1995 350,737 418,152 211.6 4,316.3 30.5 622.5 4,939 1996 359,495 415,582 210.3 4,289.8 31.3 638.0 4,928 1997 364,233 419,533 212.3 4,330.6 31.7 646.4 4,977 1998 369,032 423,520 214.3 4,371.7 32.1 655.0 5,027 1999 373,893 427,543 216.3 4,413.3 32.5 663.6 5,077 2000 378,817 431,604 218.4 4,455.2 33.0 672.3 5,128 2001 383,606 431,958 218.6 4,458.8 33.4 680.8 5,140 2002 394,177 432,104 218.6 4,460.4 34.3 699.6 5,160 2003 403,146 432,775 219.0 4,467.3 35.1 715.5 5,184
Source: Estimates by L Vega from DoE Energy Statistics Yearbook 1990-2003
Table 5-5 – Tropik Wood Production (1991)
Product kT Posts and poles 5 Wood chips 213 Saw timber 42 Fuelwood 56 Source: (Macallan, DoE, 1991)
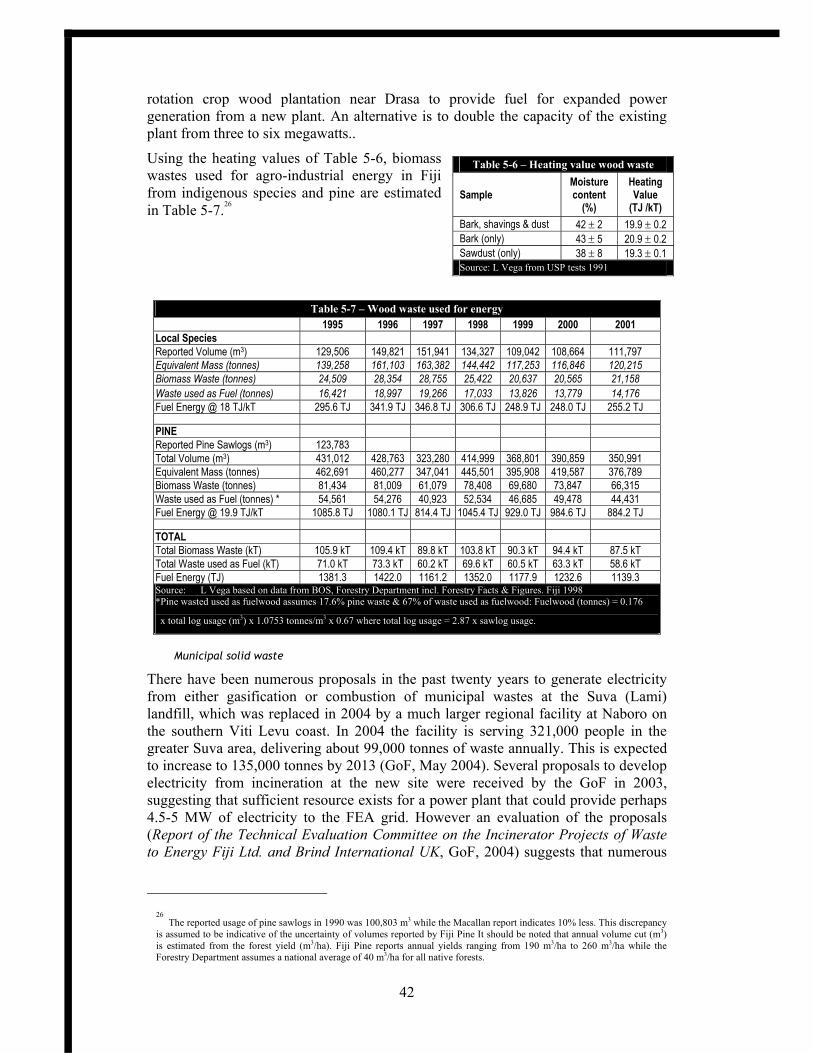
42
rotation crop wood plantation near Drasa to provide fuel for expanded power generation from a new plant. An alternative is to double the capacity of the existing plant from three to six megawatts..
Using the heating values of Table 5-6, biomass wastes used for agro-industrial energy in Fiji from indigenous species and pine are estimated in Table 5-7.26
Table 5-7 – Wood waste used for energy
1995 1996 1997 1998 1999 2000 2001 Local Species Reported Volume (m3) 129,506 149,821 151,941 134,327 109,042 108,664 111,797 Equivalent Mass (tonnes) 139,258 161,103 163,382 144,442 117,253 116,846 120,215 Biomass Waste (tonnes) 24,509 28,354 28,755 25,422 20,637 20,565 21,158 Waste used as Fuel (tonnes) 16,421 18,997 19,266 17,033 13,826 13,779 14,176 Fuel Energy @ 18 TJ/kT 295.6 TJ 341.9 TJ 346.8 TJ 306.6 TJ 248.9 TJ 248.0 TJ 255.2 TJ PINE Reported Pine Sawlogs (m3) 123,783 Total Volume (m3) 431,012 428,763 323,280 414,999 368,801 390,859 350,991 Equivalent Mass (tonnes) 462,691 460,277 347,041 445,501 395,908 419,587 376,789 Biomass Waste (tonnes) 81,434 81,009 61,079 78,408 69,680 73,847 66,315 Waste used as Fuel (tonnes) * 54,561 54,276 40,923 52,534 46,685 49,478 44,431 Fuel Energy @ 19.9 TJ/kT 1085.8 TJ 1080.1 TJ 814.4 TJ 1045.4 TJ 929.0 TJ 984.6 TJ 884.2 TJ TOTAL Total Biomass Waste (kT) 105.9 kT 109.4 kT 89.8 kT 103.8 kT 90.3 kT 94.4 kT 87.5 kT Total Waste used as Fuel (kT) 71.0 kT 73.3 kT 60.2 kT 69.6 kT 60.5 kT 63.3 kT 58.6 kT Fuel Energy (TJ) 1381.3 1422.0 1161.2 1352.0 1177.9 1232.6 1139.3 Source: L Vega based on data from BOS, Forestry Department incl. Forestry Facts & Figures. Fiji 1998 *Pine wasted used as fuelwood assumes 17.6% pine waste & 67% of waste used as fuelwood: Fuelwood (tonnes) = 0.176
x total log usage (m3) x 1.0753 tonnes/m3 x 0.67 where total log usage = 2.87 x sawlog usage.
Municipal solid waste
There have been numerous proposals in the past twenty years to generate electricity from either gasification or combustion of municipal wastes at the Suva (Lami) landfill, which was replaced in 2004 by a much larger regional facility at Naboro on the southern Viti Levu coast. In 2004 the facility is serving 321,000 people in the greater Suva area, delivering about 99,000 tonnes of waste annually. This is expected to increase to 135,000 tonnes by 2013 (GoF, May 2004). Several proposals to develop electricity from incineration at the new site were received by the GoF in 2003, suggesting that sufficient resource exists for a power plant that could provide perhaps 4.5-5 MW of electricity to the FEA grid. However an evaluation of the proposals (Report of the Technical Evaluation Committee on the Incinerator Projects of Waste to Energy Fiji Ltd. and Brind International UK, GoF, 2004) suggests that numerous
26
The reported usage of pine sawlogs in 1990 was 100,803 m3 while the Macallan report indicates 10% less. This discrepancy is assumed to be indicative of the uncertainty of volumes reported by Fiji Pine It should be noted that annual volume cut (m3) is estimated from the forest yield (m3/ha). Fiji Pine reports annual yields ranging from 190 m3/ha to 260 m3/ha while the Forestry Department assumes a national average of 40 m3/ha for all native forests.
Table 5-6 – Heating value wood waste
Sample Moisture content
(%)
Heating Value
(TJ /kT) Bark, shavings & dust 42 ± 2 19.9 ± 0.2 Bark (only) 43 ± 5 20.9 ± 0.2 Sawdust (only) 38 ± 8 19.3 ± 0.1 Source: L Vega from USP tests 1991

43
technical, operational and environmental concerns may delay the project for at least several years.
Biogas
There is an unquantified resource from city sewage and confined animals for producing biogas, a gaseous fuel mixture of methane and CO2 produced as organic matter decays in the absence of air.
5.1.2 Solar resource
The Fiji Islands Meteorological Service (FIMS) has nine stations which measure incoming solar radiation (insolation) with pyranometers: six in Viti Levu (Nadi, Vaturu, Monasavu, Nacocolevu, Koronivia, Laucala Bay); one in the east (Vanuabalavu, Lau); and two in the north (Dreketi and Seaqaqa in Vanua Levu). There has also been data recorded for eight years at the Nabouwalu hybrid power station. Figure 5-4 provides monthly average daily insolation over several years for seven of these stations ranging from locations with the highest to the lowest insolation levels in Fiji. Nadi Airport has the highest long-term annual average of 5.1 kWh/m2. Vanua Balavu (Lau) has a relatively high average of 5 kWh/m2. In Bua Province (Vanua Levu) the average is about 4.5 kWh/m2. The lowest long-term readings are in the rainy highlands (808 m elevation) of Viti Levu at the Monasavu hydro dam site with 3.7 kWh/m2.
Nabouwalu, not included in the graph, has averaged 4.5 kWh/m2 per day since 1996. There is a two-year (1995-1996) average of 4.8 kWh/m2-day at Vunatovau obtained from a PIFS Southern Pacific Monitoring Project. All measurements have been made using horizontally mounted pyranometers. The actual solar energy received by both PV and thermal collectors will be both higher and more evenly distributed over the year as a result of tilting toward the sun’s actual position. Although there are algorithms available to provide estimates of the tilted surface energy from horizontal measurements, uncertainty exceeds twenty percent..
Figure 5-4 – Monthly Average Horizontal Global Insolation at Seven Fiji Sites (kWh/m2)
Source: Dr. Luis Vega Note: the numbers following the location are the years measurements were carried out.
0
1
2
3
4
5
6
7
8
1 2 3 4 5 6 7 8 9 10 11 12 Month
Nadi (82-86)
Vaturu Dam (82-86) Monosavu (82-86)
Nacocolevu (87-95)
Koronivia (87-95)
Vanuabalavu (90-98)
Suva (83-00)

44
The actual solar energy received by both PV and thermal collectors will average higher and be more evenly distributed over the year as a result of tilting toward the sun’s actual position. All designs for solar systems should be based on the amount of solar energy received on the tilted surface of collectors, not on a horizontal surface such as is used for meteorological and agricultural solar energy measurements. To be accurate, resource assessments for solar energy must use pyranometers tilted at the angle to be used for solar collectors, typically equivalent to the latitude angle or slightly steeper. Although there are algorithms available to provide estimates of the tilted surface energy from horizontal measurements, their uncertainty exceeds 20%.
Figure 5.5 provided by NASA for the ocean near Vanua Levu indicates the difference in energy received on collectors with different tilts using one of those algorithms. The horizontal radiation varies greatly over the year and averages 5.4 kW/m2/day. Tilting at the latitude angle (in this case 17° and facing north) increases the average annual radiation (5.81 kW/m2/day) and reduces annual variation; tilting at latitude angle plus 15° (32° tilt facing north) provides the least variation over the year with a daily average of 5.85 kW/m2/day. The effect of tilt varies with latitude and the frequency of clouds.
Figure 5-5 –
Energy on Collector
0
1
2
3
4
5
6
7
Jan Feb Mar Apr May Jun Jul Aug Sep Oct Nov Dec Ave
Month
kW/s
qmt/d
ay Horizontal17 degrees32 degrees
Source: NASA (USA)

45
5.1.3 Wind resource
There are long-term wind data records available from the DoE and FIMS for seven sites shown in Table 5-8. FIMS measures wind speeds with anemometers at 10 metre heights at the following sites:
• NabouwaluGovt.Station (1978-2002)
• Nadi Airport (1993-2002) • Nausori Airport (1988-2002) • Rotuma Govt. Station (1998-
2002) • Suva at University of the
South Pacific (1998-2002) • Vunisea Govt. Station (1978-
2002) The FIMS anemometers are meant for monitoring weather conditions, not evaluating the wind energy resource, and are not generally positioned at locations or heights for accurately estimating the resource. For example, the annual average wind speed measured by a DoE anemometer at Vunisea specifically to assess wind energy is about 4.8 m/s whereas the value from the nearby government station anemometer studying weather conditions is closer to 3.7 m/s. Overall, Fiji’s wind speeds are marginal for energy production at a cost comparable to early 2004 FEA generation costs. However, they may be cost effective compared to diesel generation costs, which represent FEA marginal costs of generation for new investments.
5.1.4 Hydroelectric resource
Over twenty years ago, a national energy study (WB/UNDP, 1983) estimated the “promising” resource for large hydro systems (i.e. about 2 MW and above) to be about 300 MW with an average output of about 1,600 GWh (Table 5-9). Since then projects have been commissioned at Monasavu and Wainikasou and construction has begun at Vaturu. The remaining promising untapped potential may be on the order of 200 MW and 1,000 GWh. There is a considerably larger technical resource if sites are included which are more costly per kWh to develop.
Since the Monasavu hydro project was commissioned in
Table 5-8 – DoE Wind Resource Assessment
Location Height (mAGL)
Measurement Period
Ave. Speed
m/s Prevailing. Direction
Southern Viti Levu: Gamu 10 2/95 to 11/95 5.5 97°” Korotogo 10 9/94 to 7/95
1/96 to 9/97 5.3 5.5
114°”
Vunatovau 10 21
12/94 to 3/97 5.4 5.7
129° 126°
Waibogi 10 1/95 to 1/96 4.9 Western Viti Levu: Kavukavu 40 8/00 to 9/00
5/01 8/01 to 9/01
10/01 to 11/01 4/02 to 6/02
5.1 0.8 5.1 4.7 4.7
191°”
Northern Viti Levu: Tamuka 48 7/99 to 10/99
12/99 to 2/00 7/00 to 10/00 12/00 to 2/01 9/01 to 11/01 11/02 to 1/03
6.3 4.8 6.0 4.8 6.6 7.0
136°”
Kadavu: Vunisea 30 5/00 to 9/00 4.8 134°” Source: L Vega from DoE mAGL = metres above ground level
Table 5-9 – Approximate Hydroelectric Resource
Project MW GWh firm
GWh average
Comments (in 1983)
Monasau 80 61 396 Under construction Vaturu (water supply scheme) 15 24 36 Proven Wainisavulevu pondage - 18 20 Proven Wainikasou 6 16 20 Proven Vaturu trunk main 2 3-14 Proven Upper Sigatoka/Ba 46 62 144 Under investigation Navua 50 340 Estimated Others 100 600-700 Estimated Total 299 1,599-1,670 Source: Fiji: Issues and Options in the Energy Sector (World Bank / UNDP, 1983)

46
1983, there has been a series of disputes with landowners in the area. According to recent press reports, some landowners are unhappy with financial compensation for the new (2004) Wainikasou hydro project. Inability to resolve land access issues amicably could restrain development of large hydro projects – and land-based RE development in general.
The DoE has an ongoing programme monitoring the micro-hydro (under 100 kW) and mini-hydro (100-1,500 kW) potential near communities not served by the FEA grid. At least 2-3 year records of flow rate, water level and rainfall are used for prefeasibility analysis and preliminary design. With Japanese technical assistance, DoE has evaluated 108 potential sites. As Table 5-10 indicates, 38 sites with a total potential of about 3.2 MW appear to be technically and economically feasible. Twenty additional sites with a potential totalling roughly 0.4 MW require more monitoring of water flows. Many other sites have yet to be studied.
As Figure 5-6 illustrates, at least six of Fiji’s islands have micro-mini hydro potential that may be technically and financially feasible to develop.
Figure 5-6 – Feasible New Micro/Mini Hydro Sites
Source: P Johnston from information in DoE/JOCV, 2002
5.1.5 OTEC resource
Fiji’s oceans have thermal resources that can in principle be developed for ocean thermal energy conversion (OTEC) power plants. In 1991, a Japanese consortium measured temperature differences between the surface ocean water and the deep ocean waters (at least 800 metres deep) off the coral coast of southern Viti Levu. The team found a promising average thermal difference of 22ºC.
Table 5-10 – Summary of Micro/Mini Hydropower Investigations
Feasibly No. kW Feasible/probably feasible 38 3,245 Not feasible 50 170 Requires more monitoring 20 373 Total 108 3,788 Source: from data in DoE/JOCV, 2002

47
5.1.6 Wave energy resource
About 25 years ago, a technical evaluation suggested that Fiji had a substantial wave energy resource that could be developed at a cost “which compares favourably to diesel and hydro” (Crown Agents, 1980).
Oceanor of Norway monitored Fiji’s seawave potential in the early 1990s through a regional wave energy resource assessment funded by Norwegian aid (SOPAC, 1993; SOPAC, 1996). The aim was to map the resource (wave height, wave periods and wave energy), through data buoys moored off the shores of several islands. Figure 5-7 shows the results, an estimated annual average wave power of 22.9 kW per metre of wavefront from the buoy measurements (red data point south of Kadavu) and a range of 6-29 kW/m based on Geosat satellite altimeter calculations (black). The long-term Waverider buoy location to the southwest of Kadavu is far enough from the coast to be representative of offshore wave conditions. On the northern facing reefs and shores of Viti Levu and Vanua Levu, the resource is significantly less and is estimated from satellite data to be around 9 kW/m on average. Among the islands of the Lau Group and the Koro Sea to the east of Viti Levu, wave conditions vary considerably depending on directional exposure. However, high power coastlines can also be found here with levels similar to the southern coast of Kadavu. For areas producing 20 kW/m, assuming 25% conversion efficiency, it would require 0.2 km of wavefront for an average power generated of one megawatt. It is understood that new wave energy assessments may be underway or planned through SOPAC but no details were provided the PIREP team.
5.1.7 Tidal energy resource
The tidal range and coastal conditions of Fiji do not permit economic development of tidal energy in Fiji.
5.1.8 Geothermal resource
There is strong evidence of geothermal resources (hot rocks) in two Vanua Levu sites and in one Viti Levu site. Preliminary assessments by the GoF’s Mineral Resources Department and DoE indicate that there is potential for steam generation in Labasa with an estimated sub-surface temperature at 500 m below ground of 125ºC. Around Savusavu the estimate is 160ºC but deep drilling is necessary to verify the resource, which could be 5-15 MW each at a number of sites. FEA has requested Expressions of Interest (EOIs) from companies to identify and develop the resource in parts of Vanua Levu.
Figure 5-7 – Seawave Energy Measurements for Fiji
Source: SOPAC, 1993

48
5.2 Project Experience
Currently, the main renewable energy technologies in use in Fiji are hydropower (4 kW-80 MW capacity), biomass (household scale to 3 MW capacity industrial boilers), small wind (less than 100 kW), solar PV (less than 10 kW), biogas (individual farm demonstration units), and biofuel (small pilot projects.
5.2.1 Past experience
Biomass
In the mid 1980s, a series of high efficiency wood stoves were developed with the intention of improving cooking conditions for women and to reduce their work loads for gathering fuel wood. The stoves were designed for easy construction in rural areas at a cost affordable by rural households. Several hundred were built and used in a number of communities. However, acceptance was limited and the project did not result in the widespread change from cooking on open fires (Figure 5-8) to enclosed wood cook stoves that was hoped for. Nonetheless, the project did result in widespread acceptance of the concept for rural schools and the construction and use of institutional stoves (Figure 5-9) using the designs of the 1980s continues today.
Figure 5-8 – Institutional Cooking on Open Fire
Photo: John Vos, 2004
Figure 5-9 –
Institutional Wood-fuelled Oven / Stove
Photo: John Vos, 2004
In 1979 a small, and very robust, wood/coconut waste-fuelled steam power system was installed at the plantation of Adrian Tarte in southern Taveuni to provide heat for copra drying and electricity. After 25 years, it is still operating, though it has been modified over the years. Two steam engines operate on an alternating basis, switched every two weeks. The steam system saves 27 litres of diesel fuel per hour (relative to a diesel genset), equivalent at Taveuni fuel prices to annual fuel savings of up to $263,000. The cost of running the steam engine is about $20,000 per year.
In 1987 a similar system was commissioned at the nearby village of Navakawau (PEDP, 1988). Using 500 kg of wood and coconut husk/shell over eight hours, the boiler provided heat for copra drying and steam for the 10 kW steam engine that supplied electricity to 47 homes for 4-8 hours daily. The system was a DoE project supported by a US$42,000 grant from the US Agency for International Development (USAID). With considerable support from DoE and Tarte (DoE, 2000), including the provision of thousands of seedlings to improve fuel supply, the system operated on and off for about 10- years but the community was not seriously committed to the

49
project. In 1987, the U.S Ambassador promised funding for an additional 16 systems but the military coups of the same year ended U.S support for the project.
Biodiesel
Coconut oil (Figure 5-10) has been used as an alternative to diesel fuel to operate diesel generators at DoE pilot projects in two rural locations: i) an 80 kVA generator installed in May 2000 provides electricity for 198 households in three villages in Vanuabalavu, Lau; and ii) a 45 kVA generator installed in July 2001 electrifies 60 households in Welagi in Taveuni. Preliminary indications are that the technology is probably viable but there are difficulties with the local management required for operations as well as on site production of copra oil (as fuel).
Biogas
Trials of biogas digesters for pig farms and dairies have been carried out for nearly 30 years in Fiji with mixed success. Several dozen systems were built from the mid 1970s through the mid 1980s. Although they usually produced gas successfully, there were problems with maintenance and the high level of user skill and effort needed to keep them running successfully. In general, farmers did not perceive the value of the gas to be commensurate with the considerable amount of effort needed to produce it. New programmes with digester designs better suited to Fiji’s cultural and physical conditions (Figure 5-11), along with more emphasis on the value of digesters for waste control rather than on energy production, are expected to increase their rate of adoption.
Between 1997 and 2003, five biogas plants were constructed with DoE assistance at three cattle farms (Waidalice, Tailevu, 1997; Verai, Naitasiri, 1999 and Lutu, Naitasisri, 2002) and two piggeries (Natabua, Lautoka, 1997 and Delai Maravu Ltd., Savusavu, 2003). A sixth system was constructed in Labasa in 2004 but was not yet producing gas at the time of writing.
Figure 5-10 – Small Scale Coconut Oil Biodiesel Production, Taveuni
Photograph: Patrice Courty, 2000
Figure 5-11 – Construction of Biogas plant, Colo-I-Suva
Photo: Fiji DoE
50
Ethanol
There were several feasibility studies around 1980 to develop ethanol to blend with petrol (15-20% ethanol / 80-85% petrol) as a transport fuel. The FSC and British Petroleum proposed a 10-15 ML per year plant using molasses from the sugar mills as feedstock but viability was at best marginal. The GoF also seriously considered a similar sized ethanol facility based on Brazilian technology in Bua, Vanua Levu using sweet sorghum as a feedstock. It too was economically and financially marginal and plans were abandoned.
Gasifiers
Trials of a sawdust fuelled gasifier for power production were carried out by FEA in the 1980s. The trials were not successful and there has apparently been no further trial of gasification technologies in Fiji.
Pyrolysis
Although there is no practical experience in Fiji with pyrolysis, it is an option reportedly being considered for use as a diesel fuel (Vos discussions with Telesource, Feb. 2004). Telesource, the company managing FEA’s diesel systems, considers biomass pyrolysis to produce liquid fuels to be a real possibility due to an increase in research and development efforts in recent years and Fiji’s suitability for a pilot project:
• a large agricultural and forestry sector (sugar and timber), with two ‘mine-mouth’ operations generates considerable biomass residue (FSC. and Tropik Wood) that is largely unused;
• some FEA diesel gensets are obsolete and can be used and cannibalised for trials with pyrolysis oils; and
• Telesource’s sales agreement with FEA allows power that is generated from fuels other than diesel to be fed into the grid and generate revenues.
Micro Hydro
Small hydro systems have been used at rural religious missions and plantations for more than a hundred years. Since 1980, five village scale hydro installations have been commissioned mainly for home lighting and entertainment. To be economically viable, microhydro power must be very close to the load and this has greatly limited the number of developable sites. The main problems at existing installations have been technical in nature, primarily electrical, with problems of site access and limited technical skills available in the rural villages causing long power outages and high costs for repairs when breakdowns occur. For many of the installations, this has resulted in periods without power being longer than periods with power. Another issue has been secure access to land for the construction and operation of small hydro projects.
Solar PV
The first rural electrification project in Fiji using solar photovoltaics and a RESCO-type structure was carried out by the DoE in 1983. The project was developed after then Prime Minister, Ratu Sir Kamisese Mara, directed DoE to arrange a pilot project of 100 solar home systems (SHS) in outer islands. USAID agreed to finance three separate “small grant” projects developed through Peace Corps volunteers in rural villages.

51
The three sites selected were Namara (Kadavu), Totoya Island and Vatulele (Koro), each village receiving between thirty and forty systems for a total of 100 installations. Each community established a cooperative structure to manage the systems. Each co-op was required to send at least two people for training by the DoE and to agree to collect fees from users sufficient to pay the local technicians and to purchase replacement batteries on a three-year cycle. The fee structure decided upon by the cooperatives varied but was about US$ 3-4 per month. Additionally an installation fee of F$25 was charged for each user wanting a system. System ownership remained with the cooperative, not the users. The DoE agreed to provide periodic training to local technicians, to assist in obtaining replacement parts as needed, and to provide technical advice when required. No further subsidies were promised or provided. Installations were to be carried out by the trained local technician with support from the Peace Corps volunteers and DoE technicians.
The technical systems installed were purchased by competitive tender. A local dealer, South Pacific Solar, won the tender and provided the components from the USA. These included a 42 watt panel, an electronic charge controller, with the capability of charging “D” size rechargeable Ni-Cd batteries, and a gelled electrolyte battery of 45 Ah capacity. Two 13 watt tube-type fluorescent lights were included. A portable light and four rechargeable Ni-Cd "D" cell batteries were also provided each household. The component cost of each system was approximately US$550.
The Totoya systems were never installed, although components were shipped to the island, because the Peace Corps team left early without developing the project. The equipment was not recovered since the Totoya people promised to continue with the installations. However, there was no further progress and the difficulty and expense of access prevented direct intervention by DoE in the project.
The Koro project was completed and operated as designed during the term of the Peace Corps volunteers but upon their departure, about a year after installations were completed, the co-op spent the accumulated funds, stopped collecting fees and the systems fell into disrepair and were abandoned.
Only in Namara was there a continuing attempt to maintain the installed systems and retain a community structure for their maintenance. By 1993, approximately half of the installed systems were still operational, having gone through several battery replacement cycles, although not all continued to operate at design capacity. However, the co-op had not survived and maintenance was being handled by individual users rather than through a RESCO structure.
Since these were pilot projects intended to determine the problems and successful approaches to PV based rural electrification, they provided much useful information for later projects. They were not considered successful rural electrification projects, however.
In 1986-1987, over 100 SHS were installed in scattered homes in cane farming settlements of Viti Levu. Using a design similar to the 1983 installations, the systems were maintained by a DoE technician with a fee of F$4.50 per month charged for the services provided. The systems were undersized and did not perform up to the expectations of users. Additionally, the DoE technician embezzled over $400 of collected funds and was fired, leaving no experienced technician at DoE. The project was ultimately abandoned.

52
In the late 1980s solar electrification was trialed at approximately ten community centres. There was sufficient capacity for video operation and provision of services for meetings and community activities. These were primarily technical and social trials to determine the social acceptance of the installations and the performance of the equipment under field conditions. Results were mixed, neither very positive nor were they considered a failure. Rehabilitation and upgrading of these installations is currently being considered.
Solar Thermal
Solar water heaters have been manufactured in Fiji since the 1970s and thousands of locally made and imported systems have been installed in homes and hotels. The most common of the local designs (Figure 5-12) uses a separate collector and a copper storage tank in a highly efficient and very reliable thermosiphon design that has had wide acceptance over the years. The systems are well made, efficient, cost effective and have a long life but are relatively difficult to install and are not attractive. Australian designs typified by Solar Edwards and Solahart have been recently more successful in the urban Fiji market place. Their success is mainly due to their ease of installation and relatively attractive appearance.
Solar pumping
PWD has installed several solar powered pumps for village water supply. All have been borehole pumps and all have experienced technical problems, usually with the electronics associated with the pumps. Most are not currently in service. DoE is considering a project to install new pumps in various rural locations using updated technology more appropriate to the Fiji environment.
5.2.2 Some lessons learned
The experiences of 1970s to early 1990s provide some lessons for future rural renewable energy technology applications in Fiji:
• rural RET installations require high quality, reliable components that are capable of long life under Fiji conditions. The more remote the site, the more important long life and high reliability of service becomes, since the cost of access for technical support increases rapidly as access becomes more difficult;
• village management of energy projects has generally been poor with maintenance and repairs handled badly. Funds are often poorly managed; when money is needed for repairs, it is unavailable even though fees have been charged for such services to be provided. Technical competence at the village level is not good and training is essential both at the time of installation and on a continuing basis;
• recipients of energy projects need to be self-designated and place a high priority on the services provided by the renewable energy systems. Selection of a village or individual for an energy project without that village or person actually wanting the project leads to project failure in most cases. There must be a commitment on the part of the recipients to properly operate, pay the costs and care for the project;
Figure 5-12 – Beasley Solar Water Heater, Suva
Photograph: Peter Johnston, 2004

53
• undersizing of energy systems results in overloading and a high failure rate. It is more cost effective in the long run to oversize systems so users have adequate capacity to meet their energy requirements without stressing the systems;
• the Fiji environment with its high humidity, high ambient temperature and frequent heavy rains is very hard on energy equipment, particularly complex electronics. For reliable service, it is important to choose components proven to perform well in the Fiji environment. There is high risk associated with installing unproven components, particularly electronics, in the rural Fiji environment;
• an external authority for operation, maintenance and fee collection is needed if village energy systems are to be successful. Village-based institutional structures generally have neither the technical or management competence nor the internal discipline needed to enforce fee collection and proper maintenance procedures;
• it cannot be assumed that skills available when a project is implemented will be retained for the long term. A major problem for DoE projects has been the migration of experienced professional and technical personnel from villages and PWD’s reassignment of technicians with renewable energy experience to other jobs (or their resignation from PWD);
• pilot projects should be implemented in locations that are easily accessed by DoE for monitoring and maintenance;
• agreements regarding land use should be resolved during the early stages of any energy related project.
5.2.3 Current project experience
Micro/mini hydro
As shown in Table 5-11 the total installed capacity of micro/mini hydro in Fiji is about 1,000 kW, 80% of which is accounted for by the Wainikeu (or Waineqeu) system operated by FEA. Four additional sites, where DoE is monitoring the resource or planning to install monitoring equipment, have a combined potential of about 220 kW, with some estimates suggesting up to 500 kW.
Table 5-11 – Fiji Micro-Mini Hydro Installations
System Island Year Installed
Cost F$ ‘000 kW
Net Head (m)
Flow Rate
(m3/s) Completed: Nasoqo * Viti Levu 1984 40 4 30 0.020 Bukuya Viti Levu 1989 900 100 161 0.091 Wainikeu Vanua Levu 1992 4000 800 122 0.964 Vatukarasa Viti Levu 1993 150 3 10 0.044 KadavuKoro Kadavu 1994 80 20 40 0.074 Muana Vanua Levu 1999 500 30 140 0.032 Marist Tutu Taveuni 1975/1985 ? 20? 165 ? Wairiki Taveuni 1930 ** ? 8 50 ? Total 985 Under consideration: Abaca, Ba Viti Levu Pre-feasibility 10 67 0.022 Raviravi, Ba Viti Levu Pre-feasibility 7 41 0.025 Naikorokoro Kadavu Pre-feasibility 15 na na Buca Vanua Levu Monitoring 187 165 0.167 Total 219 Source: DoE Notes: * Understood to be not operating in 2004; ** refurbished in 1986

54
Figure 5-13 shows the various sites where small hydro systems have been installed in Fiji and several sites currently under consideration if feasibility is confirmed and funds are made available.
Biodiesel
As noted above, Vanuabalavu and Taveuni have trial projects using coconut oil to power diesel engines. Funded by SPC, they were intended to use locally produced oil for the engines. In the case of Vanuabalavu, the oil production system broke down and was not repaired requiring the import of coconut oil from commercial sources. In Taveuni, failure of a fuel valve has prevented coconut oil from being used. The engines are reportedly now using diesel fuel. Although no new projects are currently planned, biodiesel is still of considerable interest to replace diesel fuel used for village electrification and larger scale use.
Biogas
Several small-scale biogas digesters have been installed in the past several years on pig farms and dairies with DoE assistance. There have been varying levels of success. Although Fiji’s earlier experience was not favourable, the new systems are more suited to Fiji conditions and appear more successful. There is increased interest in biogas within the piggery and dairy industries with a number of new installations proposed.
In 2003, PWD began construction of a GoF-financed urban biogas plant, still incomplete, at the Kinoya sewage treatment works in Suva (Figure 5-14). Using domestic waste from 120,000 people, it should produce sufficient gas in 2004 to fuel a 250 kW engine, providing a significant portion of internal electricity. Under an ADB loan to extend coverage to 360,000 people, a second digester is planned which may include a 1 MW biogas-fuelled generator.
Figure 5-13 – Micro/Mini Hydro Systems Installed and Under Consideration
Note: ● = installed; ● = under consideration Source: Adapted from DoE/JOCV, 2002
Figure 5-14 – Kinoya Urban Biogas System: Digester andDome (top.) Gas Holder (below)
Photograph: P Johnston, August 2004

55
Telecom PV
Many outer island telephone exchanges and remote installations of Telecom Fiji on the main islands use solar power. Telecom maintains its own technical staff for maintenance and has had good results with the technology. Details of installations were requested from Telecom but no useable information was received.
Status of remote solar home systems
Fiji has extensive experience with solar PV for rural home electrification and there are a large number of communities where PV may be an attractive option. Accordingly, the current status of household PV system projects by DoE is summarised in Tables 5-12 through 5-18 and illustrated in Figures 5-15 through 5-19. Additional details are provided in Annexes D -G.
Figure 5-15 – Namara PV Installations
Photograph: Herb Wade, Namara, Kadavu
Table 5-12 – 1983 Namara Solar Project Summary
Characteristics Detailed comments about the project characteristic Location of the project Namara, Kadavu
Commissioning date 1983
Budget US$30,000 + village labour + DoE supervision and training investment
Components 42 Wp single crystal 30 cell panel; South Pacific Solar discharge regulator with audible alarm before LV disconnect and including a “D” cell NiCd charger; Fiji made open cell battery of about 65 Ah at C10 capacity 2-13W high efficiency REC 12V tube lights; 1-“D” cell portable light using NiCd batteries
2003 operational status Panels integrated into current systems upgraded in 1986 and 1994.
Primary objectives Pilot trials of PV SHS for technology and institutional designs
Population served Approximately 35 households
Funding arrangements USAID
Implementation arrangements DoE selected the village based on input from US Peace Corps volunteer on Kadavu. Systems were purchased on open tender with the supplier, South Pacific Solar providing the design
Source of maintenance and operation funds Village cooperative with expectation of collection from users
Input from recipients Battery maintenance and designated fees. F$25 installation fee and about F$4/month charged by the Cooperative for maintenance
Local involvement in project implementation, operation and maintenance
The cooperative had responsibility for maintenance through two local technicians trained under the project. DoE to provide technical support when requested and additional training if required.
Capacity building components User training at the time of installation and training of two local technicians at the time of installation.
Relative success at achieving project objectives
Fair. The cooperative did not collect sufficient money to replace batteries and after a few years all maintenance reverted to users. Some users maintained the systems well and replaced batteries as they failed, others abandoned the system. After 9 years, about half the systems were still in use though often with only one light and using a car battery for energy storage.

56
Figure 5-16 – Namara church PV Installation
Photograph: Herb Wade, Namra, Kadavu
Table 5-13 – 1985 Namara Solar Upgrade Summary
Characteristics Detailed comments about the project characteristic Location of the project Namara, Kadavu
Commissioning date 1985
Budget Estimated at FJ$30,000
Components 50 Wp poly-crystal 36 cell panel (Solarex); SEC controller from the USA; Fiji made open cell battery of about 65 Ah at C10 capacity; 2-13W high efficiency 12V tube lights
2003 operational status Panels integrated into current systems upgraded in 1994.
Primary objectives To increase the number of PV systems available to Namara households
Population served 20 households
Funding arrangements Kadavu local government budget allocation
Implementation arrangements Kadavu division officer made all arrangements for purchase from South Pacific Solar who did the system design using off-the-shelf components. DoE not involved.
Source of maintenance and operation funds Village cooperative with expectation of collection from users
Input from recipients Battery maintenance and cooperative designated fees
Local involvement in project implementation, operation and maintenance
The cooperative had responsibility for maintenance through two local technicians trained under the project. DoE to provide technical support when requested and additional training if required.
Capacity building components User training at the time of installation and training of two local technicians at the time of installation of the 1984 project.
Relative success at achieving project objectives
Fair. The cooperative did not collect sufficient money to replace batteries and after a few years all maintenance reverted to users. Some users maintained the systems well and replaced batteries as they failed, others abandoned the use of the system. After nine years, about half the systems from 1984 and 1986 were still in use though often with only one light and using a car battery for energy storage.

57
Table 5-14 – 1994 Namara Solar Project Upgrade
Characteristics Detailed comments about the project characteristic Location of the project Namara, Kadavu
Commissioning date 1994
Budget Not available
Components 55 Wp single crystal 30 cell panel (Siemens); S.P.I.R.E. charge/discharge controller made in Kiribati Oldham 12V tubular positive plate open cell 106 Ah @ C10 battery; 2-7 W PL lights from Independent Power (NZ); 1-11W PL light from Independent Power (NZ); 1-LED night light
2003 operational status Older panels used in parallel with the new panels making an average of 130 Wp per household.
Primary objectives Technical trials for high reliability solar home system
Population served 63 households, 1 church, 1 dispensary, 1 store and 1 school room
Funding arrangements EU Lomé II PV Follow-Up project
Implementation arrangements DoE provided supervision and frequent monitoring visits for at least fiveyears after installation. Three local technicians trained by the project at CATD and installations all made by local technicians and village labour. System designs by S.P.I.R.E. and components purchased under tender by FSED. Local project operation by a village committee.
Source of maintenance and operation funds
Repair parts provided by DoE as needed (no panels, controllers or batteries needed to be replaced until 2003). Local technician paid from $2 per month user fees and by DoE.
Input from recipients Designated fees of $20 for installation and $2per month for services. The committee later raised the fee to $4 voluntarily.
Local involvement in project implementation, operation and maintenance
The local committee has responsibility for maintenance through a local technician trained under the project by CATD. DoE to provide replacement parts for 10 years and technical support when requested and additional training if required. Systems to be turned over to the village in their entirety after 10 years of operation.
Capacity building components User training at the time of installation and training of three local technicians at CATD at the time of installation.
Relative success at achieving project objectives
Excellent technical performance. The only failed components between 1994 and 2003 were lights. During that time about 175 lights were replaced indicating an average light life of five years. The objective was not to test the institutional structure though that also worked very well with fee collection rate high and operations carried out properly for the 10-year project period.
Table 5-15 – Naroi Solar Project Summary
Characteristics Detailed comments about the project characteristic
Location of the project Naroi, Moala (Lau)
Commissioning date 1999
Budget F$1 million
Components 55 Wp single crystal 36 cell panel (Photowatt); Total Energie TR15 RMP controllers; Total Energie SunCash pre-payment meter; Oldham 6MLTS 106 Ah @ C10 tubular positive plate open cell battery; 3-Solagen (NZ) 11W lights
2003 operational status 90% operational except for SunCash meters less than 50% operational
Primary objectives Electrification of Naroi
Population served Approximately 177 households
Funding arrangements France
Implementation arrangements
Pacific Energie (New Caledonia) provided the equipment, the design and the installation supervision. DoE provided overall project liaison and post-installation technical support. Training by Pacific Energy and CATD. Local labour used for installation plus two PWD technical persons.
Source of maintenance and operation funds
Payment by users of F$4.50/month through the Naroi Post Office for pre-payment codes. Raised to $7.50 in January 2002.
Input from recipients Designated fees of F$100 for installation and $4.50 per month for service raised in 2002 to $7.50/month
Local involvement in project implementation, operation and maintenance
Supposed to be turned over to a local solar committee after three years but the DoE retained control through 2003.
Capacity building components
User training at the time of installation, the training of two local technicians at the time of installation and later training of additional technicians at CATD.
Relative success at achieving project objectives
Fair. Three years after installation fee payments were less than 50% of expected due to failure of many of the SunCash meters to shut off systems after time runs out. Maintenance has been mediocre with around five batteries damaged by sulphation within three years and several others found to be low on water though operational. Technicians not consistent about service and many lights found to be not operational in 2003.

58
Figure 5-17 – Naroi PV Installation
Photograph: Herb Wade, Naroi, Moala, 2003
Figure 5-18 – Naroi SunCash PV control system
Photograph: Herb Wade, 2003
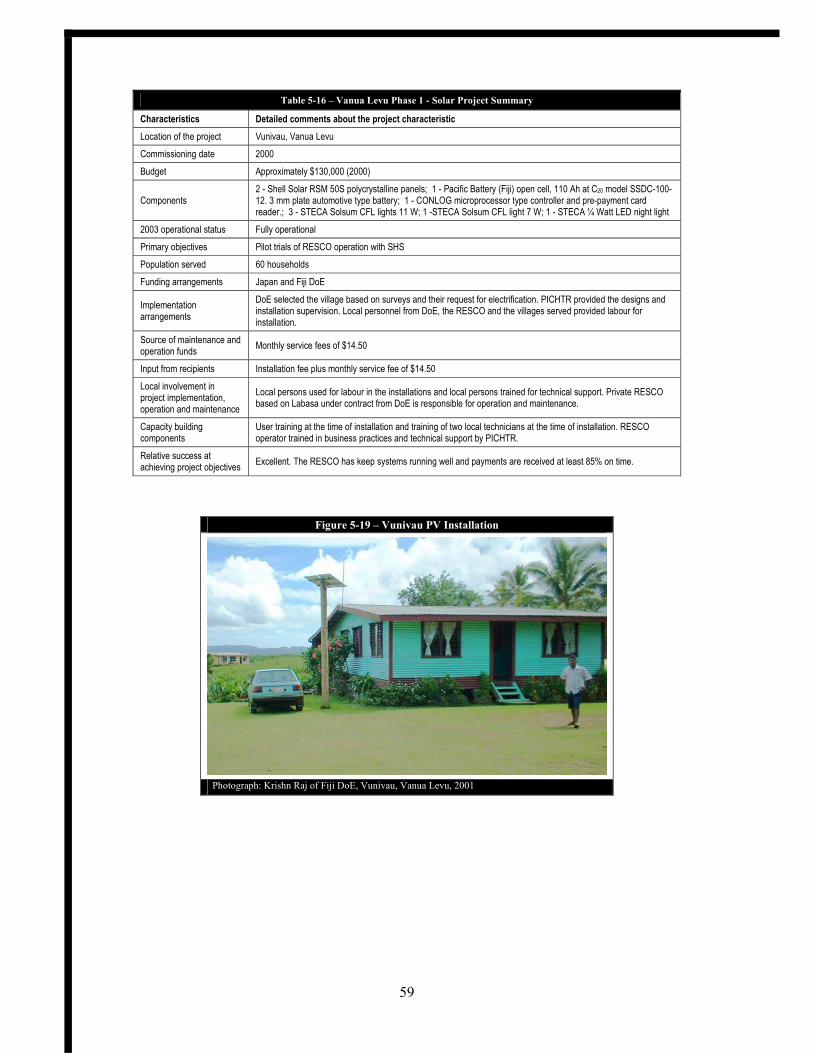
59
Table 5-16 – Vanua Levu Phase 1 - Solar Project Summary
Characteristics Detailed comments about the project characteristic Location of the project Vunivau, Vanua Levu
Commissioning date 2000
Budget Approximately $130,000 (2000)
Components 2 - Shell Solar RSM 50S polycrystalline panels; 1 - Pacific Battery (Fiji) open cell, 110 Ah at C20 model SSDC-100-12. 3 mm plate automotive type battery; 1 - CONLOG microprocessor type controller and pre-payment card reader.; 3 - STECA Solsum CFL lights 11 W; 1 -STECA Solsum CFL light 7 W; 1 - STECA ¼ Watt LED night light
2003 operational status Fully operational
Primary objectives Pilot trials of RESCO operation with SHS
Population served 60 households
Funding arrangements Japan and Fiji DoE
Implementation arrangements
DoE selected the village based on surveys and their request for electrification. PICHTR provided the designs and installation supervision. Local personnel from DoE, the RESCO and the villages served provided labour for installation.
Source of maintenance and operation funds Monthly service fees of $14.50
Input from recipients Installation fee plus monthly service fee of $14.50
Local involvement in project implementation, operation and maintenance
Local persons used for labour in the installations and local persons trained for technical support. Private RESCO based on Labasa under contract from DoE is responsible for operation and maintenance.
Capacity building components
User training at the time of installation and training of two local technicians at the time of installation. RESCO operator trained in business practices and technical support by PICHTR.
Relative success at achieving project objectives Excellent. The RESCO has keep systems running well and payments are received at least 85% on time.
Figure 5-19 – Vunivau PV Installation
Photograph: Krishn Raj of Fiji DoE, Vunivau, Vanua Levu, 2001

60
Fig 5-20. The Shell Powerhouse installed in a Vunivau house
Photograph: Krishn Raj of Fiji DoE, Vunivau, Vanua Levu, 2001
Table 5-17 – Vanua Levu Phase 2 - Solar Project Summary
Characteristics Detailed comments about the project characteristic Location of the project Nasuva (44) near Vunivau; Onelake (12) and Vusasivo (40), Vanua Levu (Cakaudrove)
Commissioning date 2002
Budget Approximately $200,000 total,
Components
2 - Shell Solar RSM 50S polycrystalline panels 1 - Pacific Battery (Fiji) open cell, 110 Ah at C20 model SSDC-100-12. 3 mm plate automotive type battery 1 - CONLOG microprocessor type controller and pre-payment card reader. 3 - STECA Solsum CFL lights 11 W 1 -STECA Solsum CFL light 7 W 1 - STECA ¼ Watt LED night light
2003 operational status Fully operational
Primary objectives Pilot trials of RESCO operation with SHS
Population served 96 households
Funding arrangements Japan and Fiji DoE
Implementation arrangements DoE selected the village based on surveys and their request for electrification. PICHTR provided the designs and installation supervision. Local personnel from DoE, the RESCO and the villages served provided labour for installation.
Source of maintenance and operation funds Monthly service fees of $14.50
Input from recipients Installation fee plus monthly service fee of $14.50
Local involvement in project implementation, operation and maintenance
Local persons used for labour in the installations and local persons trained for technical support. Private RESCO based on Labasa under contract from DoE is responsible for operation and maintenance.
Capacity building components User training at the time of installation and training of two local technicians at the time of installation. RESCO operator trained in business practices and technical support by PICHTR.
Relative success at achieving project objectives Excellent. The RESCO has keep systems running well and payments are received at least 85% on time.

61
Table 5-18 summarises the electricity production from the Namara, Naroi and Vanua Levu PV systems from 1984-2003.
Status of wind systems
DoE continues monitoring the wind resource at sites in several islands. FEA is carrying out studies for a number of wind projects with up to 25 MW of installed capacity on Viti Levu, Vanua Levu and Ovalau. Between 5 - 15 MW of wind systems may be commissioned by FEA between 2005 - 2007. Other than a hybrid system with a wind component – discussed in the next section – the only wind electric system recently installed (2004) and operating in Fiji is a 20 kW French Vergnet unit at SOPAC’s headquarters in Suva (Figure 5-21).
Nabouwalu diesel / wind / PV hybrid power system
Fiji Telecom installed a wind/diesel hybrid at a site on Viti Levu and has a wind/PV hybrid for charging backup batteries at several remote sites. They have been dismantled.
In 1997, DoE, PWD and the Pacific Islands Center for High Technology Research (PICHTR, a non-profit institute in Hawaii) integrated PV and wind-turbine generators with the existing diesel generators serving the Nabouwalu government station (Fig 5-22). PICHTR designed the system and the Government of Japan donated the renewable energy equipment. It includes eight 6.7 kW rated American Bergey wind turbines, 37.44 kW of solar PV and 200 kVa of diesel generation. The system includes battery storage for the PV to eliminate the rapid power fluctuation from the PV panel in partly cloudy conditions and to help serve the peak demand time, which is in the evening after sun set. In January 1998, DoE assumed responsibility and PWD began operating the system with technicians trained by PICHTR.
The design delivery is 720 kWh/day, with around 60% of total generation from renewable sources. The system worked well initially, providing more than 60% of energy from RE (Figure 5-21) but this continually fell to less than 15% in 2002. This
Table 5-18 – SHS Electricity Production 1984-2003 (MWh)
Year Namara Naroi Vanua Levu Total
1984 0.9 0.9 1985 0.9 0.9 1986 1.8 1.8 1987 1.6 1.6 1988 1.5 1.5 1989 1.2 1.2 1990 1.0 1.0 1991 1.0 1.0 1992 1.0 1.0 1993 1.0 1.0 1994 5.0 5.0 1995 7.3 7.3 1996 7.3 7.3 1997 7.3 7.3 1998 7.3 7.3 1999 7.3 8.3 15.6 2000 7.3 14.1 0.8 22.2 2001 7.3 14.1 5.4 26.8 2002 7.3 14.1 12.1 33.5 2003 7.3 14.1 20.8 42.2 Source: prepared by L Vega, updated by H. Wade, 2004 Assumptions: 100 Wp of solar PV produces 225 Wh/day for appliance use. Installations are assumed to be continuously 100% operational at full capacity.
Figure 5-21 – Small Wind Electric System, SOPAC, Suva
Photograph: Peter Johnston, 2004

62
was due partly to the loss of frequent technical support from PICHTR, partly to a lack of capacity in Fiji to train new operators and technicians (who tend to be very mobile and shift jobs frequently) and partly to component failures that have not been repaired by PWD. A serious problem has been the complexity of the automatic interface between the solar, wind and diesel generators. The current operators do not understand the functions and operation of the automatic controls, so the system must be operated in an inefficient manual mode. Apparently, it is now running as a diesel plant only.
Figure 5-22 – Percentage of Nabouwalu generation by solar, PV and wind, 1997 – 2002
Percentage of Nabouwalu energy from renewables
0%
10%
20%
30%
40%
50%
60%
70%
1997.5 1998 1998.5 1999 1999.5 2000 2000.5 2001 2001.5 2002 2002.5
Year
Per
cent
of t
otal
gen
erat
ed e
nerg
y
Source: Dr. Luis Vega
Because of GoF policy that electricity generated by government centres such as Nabouwalu must be charged at the national tariff, less than 30% of actual operating cost is covered even if all fees are received. The added costs of training and external support must come from an already strained PWD budget. It is easier to justify purchasing diesel fuel than to maintain the renewable energy equipment and as a result “diesel creep” (where the percentage of generation from diesel gradually increases over time) is common with hybrid systems, as has occurred at Nabouwalu (Figure 5-21).
Although there are private companies in Fiji that could manage the technical complex-ities of the installation after some training, as long as the tariff remains highly subsidised, the installation cannot be operated on a financially viable basis as a RESCO, only as a “cost plus” operating contract, an approach not acceptable to the
Figure 5-23 – The Nabouwalu Hybrid Energy System
Photograph: Jens Merten, Nabouwalu, Vanua Levu, 2002

63
GoF. A study funded by UNDP/GEF is underway in late 2004 to review the Nabouwalu hybrid experience and to make recommendations for its future operations.
5.2.4 Summary of pipeline RE projects
Figure 5-24 provides a visual summary of the non-hydro RE pilot projects, trials and proposed installations discussed thus far. This section summarises various RE pipeline projects currently planned or under consideration in Fiji:
• a proposal has been submitted to the ADB for finance of a proof-of-concept trial of RESCO operations using 3,200 SHS for about 75 remote communities in Viti Levu and Vanua Levu. Funding is expected from ADB with co-finance from France;
• the ADB’s Renewable Energy and Energy Efficiency Programme (REEP) is expected to develop at least one renewable energy project and one energy efficiency project for Fiji during 2005-2010;
• Japan continues to finance incremental increases in SHS for Fiji villages at a rate of about 100 households per year. These are part of the Vanua Levu RESCO trials that began in 2000 at Vunivau;
• Tropik Wood has plans to at least double its use of wood waste for energy production with much of the energy to be sold to FEA;
• FSC has established a power generation subsidiary that plans to build a 25 MW facility using surplus bagasse during the crushing season, and wood and low quality coal during the off season;
• FEA is developing a wind farm near Sigatoka on Viti Levu and is seriously investigating wind for the Labasa, Savusavu and Ovalau grids;
• companies have submitted expressions of interest to FEA for possible geothermal development for Vanua Levu. A private company has been given a license for geothermal drilling in Savusavu in southern Vanua Levu;
• FEA is assessing the economics of distributed grid-connected solar power in the Lautoka/Nadi area;
• FEA is currently developing the Vaturu hydro project on Viti Levu and hopes to develop a new hydro project of roughly 40 MW capacity on Viti Levu.
Figure 5-24 – Sites of RE Trials, Pilot Projects or Plans
Source: Mission interviews and various reports Note: Incomplete as it does not include hydropower sites

64
6 BARRIERS TO DEVELOPMENT AND COMMERC IAL ISAT ION OF RENEWABLE ENERGY
Fiji, alone among the PICs, has had financial support from the GEF for addressing barriers to the development of renewable energy through a national project, the objective of which was to “remove barriers to the implementation of renewable energy systems for rural electrification.” The 1999 project document27 identified the barriers listed in Box 6-1 in Fiji, with the status in 2004 shown in italic fonts.
Box 6–1 – Barriers to Renewable Energy for Rural Electrification Identified in Fiji in 1999
Barrier 1: Lack of sustainable institutional framework to operate rural electrification on a commercial basis and provide reliable service. PWD has a yearly government budget for operating rural electrifications schemes. Consumers connected to PWD rural power are charged a tariff that is less than true cost. PWD curtails services to stay within its budget. The institutional framework does not provide any incentive for PWD to operate systems on a commercial and sustainable basis and provides no role for private sector participation. Current status. Unchanged. 2004 costs unavailable but in 2002 (section 3.2.3), PWD consumers paid 14-36% of actual costs. Barrier 2: Lack of appropriate electricity tariffs reflecting full economic costs for rural electricity supply. The rural tariff is substantially lower than the full cost of electricity production. The FEA urban consumers on Viti Levu subsidise the rest. Current status. Unchanged. 2004 costs unavailable but in 2002 (Table 3-7), FEA rural supply costs were two-ten times Viti Levu urban cost but tariff was the same for all. Village system costs (Table 3-10) averaged three times the tariff paid. Barrier 3: Lack of financing for rural electrification. The government allocates about US$0.5 million for rural electrification, which is insignificant compared to applications for rural electricity service. Current status. The government is considering assistance from ADB that could substantially increase funds for rural electrification through renewable energy (and through FEA grid connections). Barrier 4: Institutional barriers to fee collection. It is usually difficult to collect service fees from villagers or to disconnect rural customers who do not pay their fees. Revenue collection from government offices and provincial hospitals is also a challenge. Current status. : Use of pre-payment metering is being used on new projects to ensure disconnection for non-payment. Barrier 5: Lack of expertise in business management and marketing strategies. PWD, the operator of government rural electrification schemes, does not function commercially. There is a lack of government financial and fiscal incentives for the private sector to play a role in rural electrification. Current status. Legislation has been drafted (and is currently being reviewed) for Renewable Energy Service Companies. Business and technical raining provided to three potential RESCOs. Barrier 6: Limited expertise in design, installation, operation, and maintenance of renewable energy systems. Because Fiji has limited experience with renewable energy, there is a lack of in-country design experience or familiarity with state-of-the-art equipment and their installation and maintenance. Current status. : This has improved to some extent within the private sector though increasing experience. Technical training for three potential RESCOs provided by DoE Barrier 7: Lack of information and awareness of the potential for renewable energy systems among decision-makers and villagers. Although the Rural Electrification Policy (1993) provides three choices for electrification, villagers are not well informed of the costs and benefits of each. Government decision-makers are not well informed regarding renewable energy-based rural electrification. The Rural Electrification Unit does not have the trained staff required to disseminate information and promote renewable energy. Current status. There have been awareness campaigns but it is difficult to judge their impact. Barrier 8: Incomplete assessment of renewable resources. The current assessment of indigenous renewable resources and the design-oriented analysis of the available data are inadequate, which pose serious constraints to implementation of renewable energy technologies in Fiji. Current status. There has been further assessment of the wind resource (ongoing) and proposed assessment of the geothermal resource. Barrier 9: Institutional constraints. The involvement of private contractors in rural electrification is restricted by the exclusive use of PWD for installation and operation of stand-alone schemes. Current status. Private contractors are now acting in effect as RESCOs for some government renewable energy projects. Note: Barriers are from the 1999 project document FIJ/99/G35/A/1G/99 with the explanations edited for clarity and brevity. The status in 2004 summarises the views of the international consultants.
27
The project was Promoting Sustainability of Renewable Energy Technologies and Rural Renewable Energy Service Companies in Fiji (project document FIJ/99/G35/A/1G/99), which began in 2000 and was completed in late 2003.

65
In late 2004, an independent team financed by UNDP/GEF is to review the extent to which the project has achieved its objectives and removed the barriers listed above.28 An additional overall barrier identified in the GEF project document is the lack of ‘an effective Rural Energy Policy’ (italics in the original). The GoF is currently reviewing its rural electrification policy and has arranged assistance through SOPAC for revising its overall national energy policy.
Fiji declined the opportunity for a workshop through PIREP to discuss “strengths, weaknesses, opportunities and threats (SWOT) regarding the development, use and commercialisation of renewable energy, an exercise which proved to be useful in some other PICs for considering barriers. Accordingly, this chapter relies on information available from the earlier GEF project, the team’s familiarity with Fiji’s energy sector and interviews during 2004.
For convenience, barriers have been categorised, although there is overlap among them. Categories include: 1) fiscal 2) financial 3) legislative, regulatory and policy 4) institutional 5) technical 6) market and business; 7) information, knowledge and public awareness and 8) other. The barriers of Box 6-1 are included but have been reworded or combined.
6.1 Fiscal
Fiscal barriers to RETs include those for which government fiscal policies (import duties, taxes, charges) raised for public finance are biased in favour of conventional energy or biased against renewable energy. Unlike some PICs, import duties (Table 6–1) do not constitute a significant barrier to RETs. Nonetheless:
Lack of incentives for RETs. There are no incentives to promote RET investments, (e.g. “green” interest rates, tax incentives for RET businesses, assistance in accessing foreign investment for RETs, etc.).
Import duties not preferential for RETs. There are no preferential import duties on energy efficient appliances or renewable energy technologies.
6.2 Financial
There do not appear to be serious barriers in Fiji that prevent access to finance for the development of public programmes for the development of renewable energy for rural and grid power. There are bilateral and multilateral opportunities available for the finance of well-developed, economically reasonable renewable energy programmes. As earlier sections have shown, FEA in particular is pursuing multilateral bank finance, using
28 This is lead by the French Agency for the Environment and Energy Management (ADEME) with Transenergie and IT
Power.
Table 6–1 - Duty on Fuel and RE Equipment Energy
Item Fiscal
Renewable Energy Equipment:
PV Generators 3% Solar PV Cells/Modules 3% Compact Fluorescent Lights 3% Wind/Hydro Powered Generating Sets 3% Charge/Discharge Controllers for Solar Wind and Hydro Applications 3% Solar Water Heaters 10% Lead Acid Batteries 27% Fuel & Other equipment:
Gensets (all sizes) 3% ADO; IDO (¢/litre) 18 ¢ RFO (¢/litre) 10 ¢ Gasoline (¢/litre) 44 ¢ Aviation gasoline (¢/litre) 44 ¢ Aviation Turbine Fuel 3% Kerosene 3% Coal 3%
All items also subject to VAT of 12.5% Source: Customs Tariff (Amendment) (No. 2) Act 2001
66
internal funds, entering into joint venture agreements and encouraging IPPs to identify and develop renewable energy resources. Some financial barriers do, however, remain:
DoE Budget is inadequate to meet rural electrification demands. Funds allocated annually to DoE are not adequate to meet the current demand for rural electrification in isolated rural communities or to address the huge backlog in demand.
Lack of rural finance mechanism to fit renewable energy technology purchases. There are inadequate financial mechanisms available in rural areas, and to rural people, for the private development of renewable energy technologies for household and productive use.
FEA tariff is not allowing needed RET investment. FEA is increasingly reliant on diesel for growth in generation and is actively seeking renewable options to replace diesel fuel. At current fuel costs, it appears that some investment in renewable energy may be attractive, development bank finance appears to be available and finance is not a key obstacle if FEA tariffs are increased. However, if the GoF refuses to allow FEA’s average tariff to rise sufficiently cover costs and finance loans, finance will be a serious barrier to FEA’s ambitious renewable energy programme.
National tariff policy makes private enterprised based rural electrification unprofitable. The policy of a single national tariff for grid-based electrification, and heavily subsidised PWD and village electrification, has made it impossible for private developers to profitably take over rural public grid systems (e.g. those at government provincial centres) or to develop new ones (e.g. Fiji’s third largest island of Taveuni).
6.3 Legislative, Regulatory and Policy
Fiji has a good legislative framework for energy and is developing RESCO legislation. There is nothing in FEA’s legislation to encourage renewable energy (or energy efficiency) but neither are there disincentives. This has not been a barrier in the past several years. However:
No national energy policy. There is no consistent national energy policy that provides for continuity of programmes through changes of government or changes of FEA management.
RESCO legislation needed. Legislation needs to be enacted to provide the legal basis for RESCO operations.
FEA legislation needs updating. Electricity legislation should be revised so that FEA’s objectives include cost-effective energy conservation (i.e. demand side management), and preference for renewable energy where cost-effective. FEA should have the legal basis and incentives to provide efficient energy services, not just sell electricity.
6.4 Institutional
No sustainable institutional framework to allow profitable private rural electrification development. There is no sustainable institutional framework to develop and operate rural electrification on a commercial basis, including fee collections, and provide reliable service. FEA grid extensions are a partial exception but the capital costs of some remote extensions are highly subsidised.

67
DoE budget inadequate for tasks assigned. The allocation of funds to the DoE is insufficient for the development of adequate internal capacity to prepare the complex project documents needed for accessing international finance, for resource assessment, the management of large-scale renewable energy development processes and for the day-to-day regulation of those processes.
Land access issues. Secure access to land over the long term can be a serious barrier for both community scale and large-scale grid-connected renewable energy. There have been conflicts regarding remuneration for land, ending in court, between FEA and the landowners at its Monasavu hydro site for over twenty years. Since 2000, there have been a number of cases of landowners refusing to renew leases for land on which water supply dams, health centres, schools or government installations are located.
Emigration of skilled personnel. The continuing high rate of migration from Fiji to other countries is a barrier that hinders sustainable institutional development for planning and operating renewable energy systems at both the village scale and the large scale.
6.5 Technical
Lack of RET standards and certification systems. As in other PICs, there are no national standards or certifications to assure that RETs imported into Fiji are suitable for local conditions. (A similar barrier exists for effective energy efficiency services.)
Further assessments of hydro, geothermal and wind resources needed. There is insufficient knowledge of Fiji’s large-scale (and mini) hydroelectric resource, with little long-term monitoring in recent years and relatively poor knowledge of the geothermal and wind energy resource.
No ocean energy equipment commercially available. Fiji appears to have substantial near-shore sea wave and ocean thermal resources. However, there is no proven, commercially available technology to allow Fiji to exploit these resources.
6.6 Market and Business
Past renewable energy project failures imply high risk of development. Past project failures suggest to potential investors that renewable energy development is risky, making private sector involvement difficult to obtain without the inclusion of risk abatement incentives.
Rural energy market not well understood. There is limited understanding of the rural market for energy, making it difficult to determine the appropriate technology for use in different areas.
Limited business experience. There is limited expertise in business management and marketing strategies for renewable energy and energy efficiency technologies.
Outer island access difficult and expensive. Travel to outer islands is expensive, often time-consuming and irregular. Along with small outer island populations, this makes it difficult to economically develop both public and private energy systems away from the main islands.

68
6.7 Information, Knowledge and Public Awareness
There is considerable evidence (Figure 6–1) of public awareness campaigns on energy issues in the press by DoE and FEA, and through the press and television by FEA in late 2003 continuing through 2004. Barriers remain however:
Training for private sector development is not readily available. Training is not readily available for private sector development that focuses on rural project management and RESCO business operation. Technical training is not readily available for local maintenance and operation for technologies used in rural areas.
6.8 Other
Natural disasters. Fiji is susceptible to natural disasters, particularly cyclones, which can destroy equipment such as wind turbines and solar panels and damage the resources needed to produce energy, e.g. hydro power systems, coconut trees and biomass crops.
Figure 6–1– Example of DoE Poster for RE
Source: DoE
69
7 IMPL ICAT IO NS OF LARGE SCALE RENEWABLE ENERGY USE
7.1 General Benefits of Renewable Energy
The large-scale development of SHS for rural electrification should have the positive effects of improved education, health, productivity and better integration of rural areas into the national economy. There would also be some increases in rural employment and training benefits for rural people. Negative impacts could include problems with management of spent batteries and other failed components, increased pressure on the rural economy for cash to pay for appliances and services and social friction arising from the development of a new ‘technical elite’ in the villages.
Large scale development of biofuels could have a very positive economic benefit for rural areas by improving demand for coconuts or other oil-bearing crops and increasing cash incomes in rural areas. However there could be land access problems and constraints due to transport and logistics. There could arguably be increased economic stability due less dependence on imported oil and the variations of world oil prices, and large-scale development of a biofuel processing industry. Large-scale development of alcohol-based biofuels could benefit the ailing sugar industry and help retain the economic base of the rural settlements of Viti Levu and Vanua Levu.
The use of wind, hydro, geothermal and solar energy for grid power would have the positive effects of reduced fuel imports that would increase national economic stability and security, broaden the base of energy inputs to the grid, mitigating the effect of drought that had a major effect on availability of power in 2003. These RETs could also increase the involvement of the private sector in energy delivery. Negative effects would include high initial costs and the need for FEA to greatly broaden its technical support capacity to include a wide range of generation technologies.
7.2 Environmental Implications of Widespread Use of Renewable
Energy
For GHG emissions and energy production from RETs, Table 4-14 suggests that the biggest impact in Fiji could come from investments in large hydropower, even if the resource is half of that estimated. Ethanol as a fuel, geothermal, biodiesel, small hydro, biomass and waste could all contribute significantly. Any of these, if poorly planned, could have significant environmental impacts, as discussed below.
7.2.1 Environmental issues and large hydro (over 10 MW)
The International Rivers Network (IRN), a Non Governmental Organisation (NGO) which lobbies strongly against hydro projects above 10 MW, alleges that major hydro expansion harms: i) efforts to move toward sustainable development, ii) people and ecosystems, and iii) energy security. Among other dangers, they list increased vulnerability to climate change (due to changes in rainfall patterns and quantities) and the emission of significant amounts of GHG from large reservoirs (due to rotting organic matter)29 (IRN, 2003). While some feel that IRN is alarmist, there has been a 29
IRN lists 12 reasons to avoid large hydro in three categories. A) A major expansion of large hydro will harm sustainable development: 1. Large hydro does not have the poverty reduction benefits of decentralized renewables; 2. Including large hydro in renewables; initiatives would crowd out funds for new renewables; 3. Promoters of large hydro regularly underestimate costs and exaggerate benefits; 4. Large hydro will increase vulnerability to climate change; and 5. There is no technology transfer benefit from large hydro. B) A major expansion of large hydro will harm people and ecosystems: 6. Large hydro projects have major negative;

70
history of poorly designed and implemented large hydropower developments throughout they world. There can be significant and irreversible effects on surface water, groundwater and other aspects of water transfer within the hydrological cycle during project construction, project operation and maintenance, and decommissioning. In some cases, there are impacts during the planning phase, probably indirect off-site effects as materials are mined or fabricated in preparation for plant construction. For hydropower, the area of influence is very wide, extending from the upper limits of the watershed catchment to the valley below the dam and as far downstream as the estuary and off-shore zones. The most severe direct hydrological impacts are likely to result from the impoundment of water, flooding of land to form a reservoir, and the reduction of water flow downstream. Potential indirect effects can be caused by construction and operation of work camps, access roads, and power transmission facilities, for example soil erosion affecting surface and ground water. The potential hydrological effects of the environment on the dam depend on land and water use in the watershed area upstream of the reservoir. Often relocations of population from the inundated reservoir area can increase pressures within the watershed resulting in changed land use patterns that increase erosion and subsequently sedimentation in the reservoir. The main hazard risk is a failure of the dam resulting in a sudden and massive flow of water downstream (Johnston, 1994).
The World Bank (1991) lists the following potential, and often real, hydrological impacts of large hydro dams:
• decomposition of trees in flooded land, causing nutrient enrichment in the reservoir and increased water loss through transpiration;
• creation of reservoir dramatically changing water flow (quantity and timing), water quality, and sedimentation within river basin;
• disrupted water flow to downstream communities, initially with greatly increased sedimentation and later reduced quantities of water;
• loss of wetlands downstream of reservoir; • sedimentation in reservoir reducing storage capacity and lifetime, reducing
nutrient-rich silt downstream, increasing riverbed scouring downstream; • Altered water table upstream and downstream plus resulting salinisation. • reduced flow of water at times to communities downstream; • reduction in fish production (and catches) downstream; • increased pressure on upstream land due to resettlement followed by poor
watershed control (agriculture in steep areas, grazing, deforestation,) causing erosion and increased sedimentation in the reservoir;
• deterioration of water quality in reservoir; • sedimentation at reservoir entrance causing waterlogging and flooding upstream; • decrease in water for floodplain agriculture. Floodplain salinisation;
social and ecological impacts 7. Efforts to mitigate the impacts of large hydro typically fail; 8. Most large hydro developers and funders oppose measures to prevent the construction of destructive projects and 9. Large reservoirs can emit significant amounts of greenhouse gases. C) A major expansion of large hydro will harm energy security: 10. Large hydro is slow, lumpy, inflexible and getting more expensive; 11. Many countries are already over dependent on hydropower; and 12. Large hydro reservoirs are often rendered non-renewable by sedimentation. The source is IRN (with Oxfam and other NGOs, 2003).

71
• chemical contamination of water during maintenance of transmission lines and towers;
• released water from lower portion of reservoir for power is high in pH, low in oxygen, high in hydrogen sulphide and is cold, all affecting animal and plant communities downstream;
• seismic events causing catastrophic dam collapse with sudden massive water flow downstream;
• conflicting demands for water uses; Some potential sites for large hydro development in Fiji could, and probably would, be developed as run-of-river systems, greatly reducing potential impacts. In general, any large hydro developments in Fiji should be planned, built and operated in accordance with the recommendations of the World Commission on Dams (WCD; available from www.dams.org, and explained in a Citizen’s Guide to the World Commission on Dams, available from www.irn.org).
7.2.2 Environmental issues and ethanol fuel
A considerable portion of Fiji’s land area is subject to strong erosion, inundation or regular flooding and substantial areas have been cleared for agriculture. Environmental issues regarding the production of ethanol as a fuel are essentially those of biomass energy use in general: conversion of forests to biomass plantations, encouraging clear cutting, nutrient draining, use of toxic chemicals, increased erosion, and possibly loss of wetlands. Ethanol or other fuels made from sugar cane would probably have no more environmental impact than sugar cane farming at present.
7.2.3 Environmental issues and geothermal
Although geothermal has not traditionally always been considered renewable (as reservoirs eventually deplete, at least temporarily) or benign (due to hydrogen sulphide – H2S – and other toxic emissions), it is now touted as an environmentally friendly RET. Typical emission levels of geothermal compared to other energy sources are shown in Figure 7–1.
According to the US Department of Energy, “geothermal power plants easily meet the most stringent clean air standards because they emit little carbon dioxide (fossil-fuel power plants produce roughly 1000 to 2000 times as much), no nitrogen oxides, and very low amounts of sulphur dioxide (SO2). Steam and flash plants emit mostly water vapour. Binary power plants run on a closed-loop system, so no gases are emitted.” For [plants containing H2S], the sulphur can be “separated, dewatered, and recycled as feedstock for sulphuric acid production. Future technology will use microbial processes to extract metals contained in the sulphur, allowing further reuse. At most geothermal hot-water power plants, H2S is present in
Figure 7–1 – Geothermal Power Emissions of SO2 & CO2
Source: www.eere.energy.gov/geothermal/environ_impacts.htm

72
such low concentrations that it requires no special controls to comply with environmental regulations.A typical geothermal plant requires several wells. Although drilling these wells has an impact on the land, using advanced directional or slant drilling minimizes that impact. Several wells can be drilled from one pad, so less land is needed for access roads and fluid piping” (USDoE website, 2004 but undated).
7.2.4 Environmental issues and biofuels
It has been assumed that less than 20% of coconut oil production in Fiji might be used for fuel so the impact should be no more severe than current practices. In terms of use, biodiesel fuels from coconut, oil palm or other vegetable oils are very low in emissions, as they contain almost no sulphur or hazardous materials. In case of spillage to the ground or marine environment, they biodegrade readily and do not cause contamination.
7.2.5 Environmental issues and small hydro (under 10 MW)
The International Association for Small Hydro, the European Small Hydro Association and the International Energy Agency’s Renewable Energy Working Party all define small hydro as less than 10 MW. The IRN says, “small hydro can, if responsibly implemented, be environmentally and socially low-impact. … To ensure that small hydro projects have low impacts and meet community priorities it is imperative that all small hydro schemes are planned, built and operated in line with the recommendations of the World Bank/IUCN-sponsored World Commission on Dams” (IRN, 2003).
7.2.6 Environmental issues and wind energy
The key issues regarding wind energy in countries where it has been adopted on a large scale are related to noise and damage to birds. Although most people apparently do not find the noise to be unpleasant, there have been complaints. Noise can be reduced by siting wind systems several hundred meters from habitations. Any systems likely to be installed in Fiji in the next decade are likely to be under 0.5 MW in rated capacity, and relatively quiet, whereas current installations in Europe, the US and elsewhere are typically several megawatts, and up to 5 MW, which can be far noisier. There have been reports of birds being killed as they fly into rotors. This is unlikely unless the installations are near breeding areas. This is a more serious problem in areas with large flocks of migrating birds.

73
8 CAPAC ITY DEVELOPMENT NEEDS
Chapter 6 discussed barriers to the development and commercialisation of renewable energy in Fiji. This chapter discusses some broad capacity development needs and training related to those barriers. Because of resource constraints, it was not possible to consider how to address these needs in detail. ESCAP, in cooperation with regional agencies, is preparing a training needs assessment for Fiji and other PICs that will consider these in more detail.
8.1 Fiscal
Rural finance development. Fiji has developed a rural banking scheme with UNDP assistance in cooperation with commercial banks. Incentives to promote RET investments through “green” interest rates should be considered. Both green interest schemes and micro-credit schemes for private development of renewable energy in rural areas will require training in rural credit management for companies entering the market.
8.2 Financial
As discussed, both government directly, and FEA through government, have access to substantial finance for developing renewable energy through the ADB and others. Some of the barriers identified in chapter 5 are matters of government priorities for financial allocations and do not require specific capacity development. The inadequate financial mechanisms available in rural areas have been addressed in section 8.1 above.
DoE project development training. Focused training for DoE is needed in developing renewable energy projects that are suitable for external funding.
DoE capacity development for regulation and documentation. DoE requires better internal capacity to prepare documentation for accessing international finance, resource assessment, and management of large-scale renewable energy development processes and day-to-day regulation of those processes.
Increased capacity for FEA tariff analysis. DoE, along with national planning staff within the MoF, may benefit from increased capacity to analyse the overall socio-economic benefits and costs to Fiji, particularly to the rural population and their prospects for electrification, of a single national FEA tariff. However, this barrier may be more political than analytical, the capacity probably already existing within the GoF. A study of the pros and cons of a national FEA tariff should be carried out.
8.3 Legislative, Regulatory and Policy
Assistance in the development of national energy policy. DoE has sought assistance from SOPAC’s PIEPSAP project on developing a new national energy policy. It is not known if this includes capacity building within DoE on policy development, although this is needed.
Capacity development for RESCO implementation. UNDP/GEF is providing a review of the draft RESCO legislation and advice on RESCO capacity development. The review is expected to further identify DoE capacity development needs for RESCO regulation and management..

74
Assistance for upgrading national electricity legislation. Capacity may be needed within DoE to revise and update national electricity legislation to incorporate the overall objective of efficient energy services, cost-effective energy conservation, and preference for cost-effective renewable energy.
8.4 Institutional
To accommodate the planned rapid deployment of thousands of solar home systems under RESCO management, an expansion of DoE staff and skills will be needed that includes solar system design, site assessment, financial auditing, data management, large-scale project management, component testing, writing tender specifications and tender evaluation. Most of this requirement will be repetitive and needs to be available within Fiji and on demand. It is understood that the November 2004 ADEME/IT Power/Transenergie team will address some of these issues.
Capacity development for DoE and the private sector to accommodate rapid rural electrification expansion. Capacity development for DoE and the private sector for rural electrification on a larger scale. DoE and the private sector will need extensive capacity development to handle the proposed rapid expansion of solar home systems for rural electrification.
Assistance in developing mechanisms for acceptable land compensation. DoE, FEA and NLTB may require improved capacity in developing mechanisms to involve landowners as partners in the development of community scale and large-scale grid-connected renewable energy.
Assistance in revising rural electrification institutions. DoE requires capacity development to revise its institutional framework to develop and operate reliable rural electrification on a sustainable commercial basis.
Development of local capacity for hybrid system training. For future hybrid biodiesel/solar/wind systems, training in project management, hybrid interface technology, systems maintenance, biofuel resource assessment, biofuel production technologies, operational logistics and local technician training will be necessary. As this also would involve a long-term expansion programme, this training will need to be in place locally and available on demand.
Capacity building at FEA to handle training needs for wind and solar generation. The aggressive programme planned by FEA to expand the use of grid-connected wind power will require several personnel trained in operation and maintenance of wind systems. As there is no experience in the English-speaking Pacific with wind farms or large scale grid-connected solar PV, an external based programme to assist FEA in developing the necessary training should be established.
8.5 Technical
Assistance for standards and certification development. Capacity development is needed for standards, inspection processes, and technical labour certification processes. Continuing training will be needed for field inspectors to ensure that RESCO and other regulations are being properly followed.
Assistance in creating training programmes for village scale hydro development. Hydro systems for villages require skills in operation, troubleshooting and maintenance quite different from other RETs. There needs to be capacity development

75
for rural personnel training and for the development of technical support through private or government organisations
8.6 Market and Business
Creation of management training for RESCO businesses that is continually available. Private sector training focused on RESCO business operations and technical training for field technicians will be a critical issue. Specialised training programmes for these areas will be needed on a continuing basis.
Assistance to financial institutions in developing renewable energy finance for rural areas. Capacity development would be appropriate for financial institutions for devising risk abatement incentives for renewable energy development.
8.7 Information, Knowledge and Public Awareness
Improve capacity at DoE and FEA for resource assessments. DoE and FEA require improved capacity to carry out wind and hydro resource assessments and evaluate results.

76
9 IMPLEMENTATION OF THE CAPACITY
DEVELOPMENT NEEDS AND CO-F INANC ING OPPORTUNIT IES
The proposed parallel expansion of renewable energy for rural electrification and grid-connected energy services provides an opportunity for a focused capacity building programme with the creation of long-term training and support systems for the technologies and processes used. Although clearly technical training relating to installation and maintenance of the renewable energy technologies will be required, management of the operational aspects of the programmes will also require specialist training as a continuing requirement for the decade (or more) duration of expansion of renewable energy systems for rural and grid electrification.
In particular there will need to be a strong base for private sector training in operating and maintaining RESCO operations for rural electrification. Since the RESCO concept is expected to be used with solar, biofuel, hybrid and wind technologies, a broad based training capability will need to be developed yet all having the common focus of quality service provision.
These capacity development needs will not be unique to Fiji as Tonga, Federated States of Micornesia and the Republic of the Marshall Islands, share similar, though differently implemented, programme concepts. So a regional capacity development effort for energy service company type development and training would be warranted.
There are several initiatives underway for financing the hardware costs for renewable energy development in Fiji. Each of these could be suitable for co-financing of the hardware and capacity building associated with it.
• The FEA (through the GoF) is discussing possible loan finance that could exceed US$100 million between 2006 - 2011 for large-scale grid-connected renewable energy development (and to a lesser extent energy efficient) through the ADB.
• The GoF is discussing with ADB possible ADB loan for about 3200 rural solar home systems between about 2005 - 2010.
• The GoF has had discussions with the French Government for possible co-financing of the proposed SHS expansion programme.
• The Japanese Government is financing about 100 new SHS per year in rural Fiji. • Private developers have proposed landowner-owned grid-connected hydroelectric
development (up to 15 MW) for southern Viti Levu and have identified specific projects requiring finance.
• Private developers have proposed small-scale geothermal development (several MW) near Savusavu on Vanua Levu.
• The Coconut Industry Development Authority is considering at least one remote copra mill, for which co-finance may be appropriate for developing coconut oil as a fuel.
• The Fiji Sugar Corporation has secured over F$70 million for sugar rehabilitation, including a new bagasse/wood fuelled/coal power plant. Co-finance may be appropriate to develop the wood option to avoid supplementation with coal.
• Using internal funds, the FEA plans to invest about F$30 million in 2005 in a wind farm near Sigatoka on Viti Levu.

77
10 ANNEXES
Annex A – People Interviewed in Fiji
Person Designation and contact
Makereta Sauturaga, Acting Director of Energy, Fiji Department of Energy (DoE), PO Box 2493, Government Buildings, Suva, Phone: (679) 338 6006; Fax: (679) 338 6301; [email protected] and [email protected]
Mr. Peceli Nakavulev Principal Scientific Officer, DoE (Rural Electrification and RE); [email protected]
Arieta Gonelevu Senior Scientific Officer, DoE (Renewable Energy Programme Coordinator); [email protected]
Taleshul Gani Acting Senior Scientific Officer DoE (photovoltaics / biogas); [email protected]
Intiyaz Khan Senior Scientific Officer, DoE (energy efficiency/biofuels/wind); [email protected]
Jyoti Vikash Librarian, DoE: [email protected]
Vularewa Ramaqa Secretary DoE
Paul Fairbairn Manager, Community Lifelines, SOPAC Secretariat, Suva, Fiji, tel: (679) 338 1377, fax (679) 337 0040; [email protected]
Anare Matakiviti Energy Adviser, SOPAC Secretariat; [email protected]
Rupeni Mario Energy Project Officer, SOPAC Secretariat; [email protected]
Wolf Forstreuter Forestry Officer, SOPAC Secretariat
Litia Drodrolagi National Accounts, Fiji Islands Bureau of Statistics
Jan Cloin Adviser – Renewable Energy, SOPAC Secretariat, [email protected]
Philip Langston Chief Executive Officer, Fiji Hardwood Corporation, 25 Gladstone Road, Private Mail Bag, Suva, Fiji, tel (679) 330 7685, fax 330 7660 mob 999 7498; [email protected]
Christoph Muziol Team Leader, SPC/GTZ Pacific German Regional Forestry Project, PO Box 14041, Suva, Fiji, tel (679) 3305 983 fax 3315 446; [email protected]
Rex Horoi Executive Director, Regional Secretariat, Foundation of the Peoples of the South Pacific International (FSPI), 6 Des Vouex Road, GPO Box 18006, Suva, Fiji, tel (679) 331 2250 fax 331 2298 email [email protected]
Ajay Prasad Gautam Principal Engineer Sewerage, Water and Sewerage Section, Public Works Department, Private Mail Bag, Samabula, Suva, Fiji, tel (679) 3384 111 fax 3387 083 mob 9979 255; [email protected]
Sai Tuisese Deputy Conservator of Forests (Services), Ministry of Fisheries & Forests (MAFF), Phone (679) 3301611
Ilaisa Tulele Deputy Conservator of Forests (Operations), MAFF
S. Tuilaucala Director of Business Development, MAFF
Maciu Lagibalavu Director (Fisheries), MAFF
Kord Chistianson Country Manager, Telesource (Fiji) Ltd. 25 Gorrie Street, GPO Box 17289, Suva, Fiji, tel: (679) 331 3750 fax 331 3003 mob 990 8664; [email protected]
Samisoni Ulitu Acting CEO, Ministry of Agriculture, Sugar and Land Resettlement, Robinson Complex / Private Mail Bag, Raiwaqa, tel (679) 338 4233, fax 338 5234
Seruwaia Hoyte Partners in Community Development, Fiji. (PCD, Fiji). 8 Denison Road, PO Box 14447, Suva, Fiji, tel (679) 3300 392; fax (679) 3304 315, [email protected]
Intomasi Verenakadevu
Town Clerk, Suva City Council, tel: 3313433
Nacanieu Koroiwasawasa
Director Health Services, Suva City Council, tel: 3313433 [email protected]
Eroni Ratukalou Director Engineers, Suva City Council, tel: 3313433
Patricia Ciszewska E.U. Delegation, Level 4, Development Bank Centre, 360 Victoria Parade / Private Mail Bag, GPO, Suva, Fiji, tel: (679) 331 3633 fax 330 0370, [email protected]
Horst Pilger E.U. Delegation; [email protected]
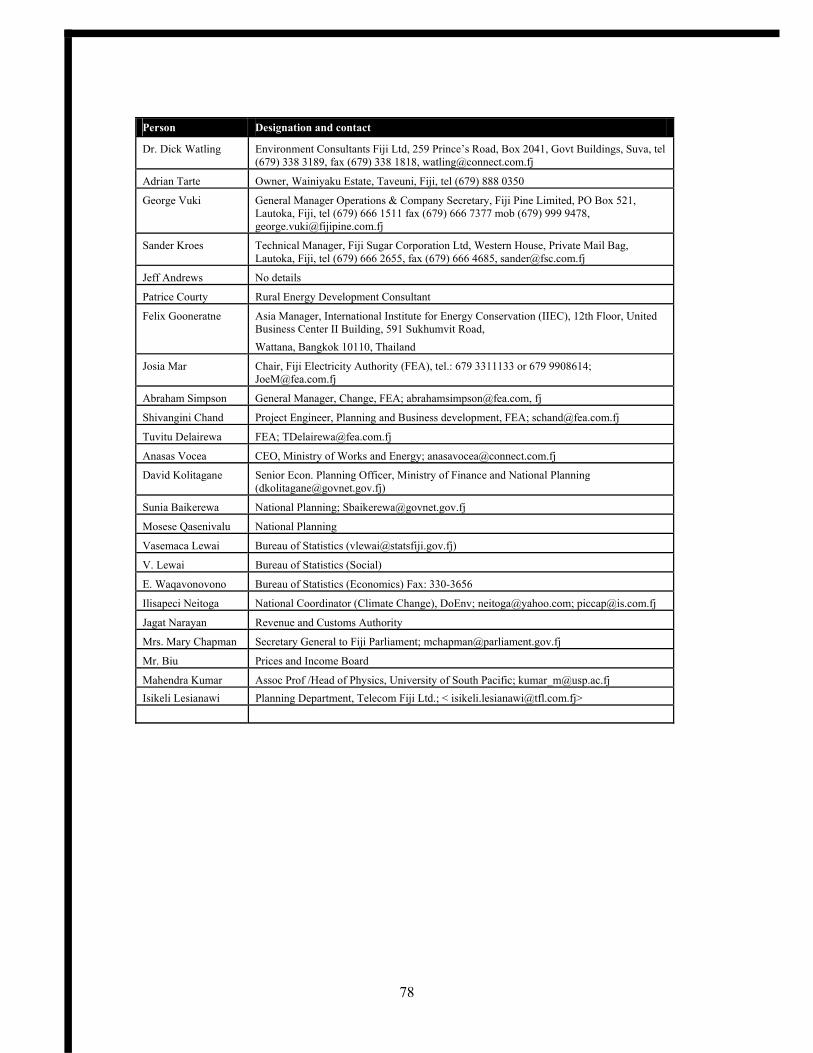
78
Person Designation and contact
Dr. Dick Watling Environment Consultants Fiji Ltd, 259 Prince’s Road, Box 2041, Govt Buildings, Suva, tel (679) 338 3189, fax (679) 338 1818, [email protected]
Adrian Tarte Owner, Wainiyaku Estate, Taveuni, Fiji, tel (679) 888 0350
George Vuki General Manager Operations & Company Secretary, Fiji Pine Limited, PO Box 521, Lautoka, Fiji, tel (679) 666 1511 fax (679) 666 7377 mob (679) 999 9478, [email protected]
Sander Kroes Technical Manager, Fiji Sugar Corporation Ltd, Western House, Private Mail Bag, Lautoka, Fiji, tel (679) 666 2655, fax (679) 666 4685, [email protected]
Jeff Andrews No details
Patrice Courty Rural Energy Development Consultant
Felix Gooneratne Asia Manager, International Institute for Energy Conservation (IIEC), 12th Floor, United Business Center II Building, 591 Sukhumvit Road, Wattana, Bangkok 10110, Thailand
Josia Mar Chair, Fiji Electricity Authority (FEA), tel.: 679 3311133 or 679 9908614; [email protected]
Abraham Simpson General Manager, Change, FEA; [email protected], fj
Shivangini Chand Project Engineer, Planning and Business development, FEA; [email protected]
Tuvitu Delairewa FEA; [email protected]
Anasas Vocea CEO, Ministry of Works and Energy; [email protected]
David Kolitagane Senior Econ. Planning Officer, Ministry of Finance and National Planning ([email protected])
Sunia Baikerewa National Planning; [email protected]
Mosese Qasenivalu National Planning
Vasemaca Lewai Bureau of Statistics ([email protected])
V. Lewai Bureau of Statistics (Social)
E. Waqavonovono Bureau of Statistics (Economics) Fax: 330-3656
Ilisapeci Neitoga National Coordinator (Climate Change), DoEnv; [email protected]; [email protected]
Jagat Narayan Revenue and Customs Authority
Mrs. Mary Chapman Secretary General to Fiji Parliament; [email protected]
Mr. Biu Prices and Income Board
Mahendra Kumar Assoc Prof /Head of Physics, University of South Pacific; [email protected] Isikeli Lesianawi Planning Department, Telecom Fiji Ltd.; < [email protected]>

79
Annex B - References for Fiji PIREP Report – 1994 Namara PV Upgrade Project 1994 (project description) – 2002 Renewable Energy Policy Development for the Charter for Renewable Energy Based Rural
Electrification with Participation of Private Enterprise (prepared for Office for the Promotion of Renewable Energy Technologies of DoE under UNDP/GEF Project FIJ/99/G35, November)
– 2003 Charter for Renewable Energy Based Rural Electrification with Participation of Private Enterprise (prepared for Office for the Promotion of Renewable Energy Technologies of DoE under UNDP/GEF Project FIJ/99/G35)
– 2003 Waste to Energy Project Brief Executive Summary (Waste-to-Energy, Fiji Ltd.) – undated Assessment of Potential Sites for Steam Cogeneration Plants in Fiji (prepared by Kingston
Morrison, New Zealand) ADB, 2002 Country Strategy and Program Update: 2003-2005, Republic of The Fiji Islands (Manila,
July) ADB, 2002b Technical Assistance to the Republic of the Fiji Islands for Preparing the Rural
Electrification Project (ADB TA FIJ 35478 ADB, 2003 Fiji Participatory Poverty Assessment. ADB, 2003b Key Indicators of Asian and Pacific Developing Countries: Fiji 1983-2000 (Manila) ADB, 2003c Fiji Country Data (downloaded from www.adb.org; January 2004) ADB, 2004 Asian Development Outlook 2004 (Manila; 28 April) ADB, 2004b Fiji Economic Growth Seen Moderate in 2004 and 2005 (ADB News Release; No. 035/04;
29 April) ADB, 2004c Report and Recommendation of the President to the Board of Directors On a Proposed Loan
to the Republic of Fiji Islands for Preparing the Rural Electrification Project (RRP:FIJI 3961; May)
ADB, 2004d ADB Pacific Strategy 2005-09: Responding to the Priorities of the Poor (draft discussion paper)
AES, 1999 Fiji Hybrid Energy Project Summary (Advanced Energy Systems Ltd, Australia; 5 May) Appana, S, 2003 New Public Management and Public Enterprise Restructuring in Fiji (in Fijian Studies Vol.
1 No. 1, Fiji Institute of Applied Studies, Suva) Chaudhari, A, 2004 Diesel Power: Telesource Set to Take Over Running of All FEA Diesel Power Plants (in
‘The Review’, Suva, 16 May) Chaudhari, A, 2004 Super Company: Suggestions for government’s Commercial Operations to be Put Under
One Umbrella (in ‘The Review’, Suva, 16 July) Cheatham, C, 2003 Promoting Sustainability of Renewable Energy Technologies and Renewable Energy Service
Companies in Fiji (Mid Term Review Final Report, UNDP/GEF Project FIJ/99/G35, Suva, June)
CIA, 2003 World Factbook: Fiji Islands chapter (updated August) Courty, P & Vaïtilingom, G, 2000 Copra Bio-fuel for a Sustainable Decentralised Rural Electrification
(prepared for PPA) Courty, P, 2002 Decentralised Rural Electrification for Pacific Island Countries: Project Evaluation, Fiji
Demonstration Project on Crude Copra Oil: Biofuel for Diesel Engine (prepared for SPC workshop)
CROP EWG, 2001 Pacific Islands Energy Policy and Plan (available from PIFS) Crown Agents, 1980 Power Lagoon Energy Scheme: Fiji, Tonga and Western Samoa (London) DoE, 1991 Energy Balances in Fiji 1979-1990 (only available at DoE library; prepared July 1991) DoE, 1994 Report on Training Workshop and Installation of Solar Lighting Systems in Namara Village,
Kadavu (Lomé II Regional PV Follow-up Project) DoE, 2000 Achievements of the last Decade: 1990-1999 DoE, 2001 Department of Energy and Rural Electrification 2001 Annual Report DoE, 2002 Department of Energy and Rural Electrification, 2002 Annual Report DoE, 2003 A Manual for the Construction of Biogas Plants (Suva, November) DoE, 2003 Energy Statistics Yearbook 1993-2000 (October) DoE, 2003 Wind Energy Assessment Programme of Fiji Department of Energy (prepared by N Seru & R
Singh for Wind Energy Utilisation Workshop; PIFS, 23-27 June)

80
DoE, 2004 Renewable Energy: The Energy for the Future (advertisement in Fiji Times, Office for the Promotion of Renewable Energy Technologies, UNDP/GEF Project FIJ/99/G35, various dates)
DoE, 2004 Department of Energy Strategic Development Plan: 2005 - 2007 DoE/JOCV, 2002 Report on Assessment of Mini / Micro Hydro Sites in Fiji: Viti Levu, Vanua Levu and Outer
Islands, Report No. 2 (prepared by Hirokazu Nakatsugawa of JOCV for DoE; Suva, July) Economist, 2004 Next Stop $50? (London; 7 August) EEC, 1999 Waste to Energy Gasification System (Environmental Engineering Corporation Inc., June) EWC, 2004 Economist Offers Grim Forecast for Fiji (in Pacific Islands Report, PIDP; Honolulu, 9
June) FEA, 1997 Ten Year Power development Programme: 1998-2007 (System Planning Department;
December) FEA, 2004 Annual Report for 2003 FEA, various Electricity Tariffs Foster, Sophie, 2004 FEA Wants Rise in Power Bills (Fiji Times, page 1 lead story, 7 September) FPL, 2001 Fiji Pine Limited Annual Report for 2001 FPL, 2002 Fiji Pine Limited Annual Report for 2002 FSP, 1997 A Manual on the Construction & Use of the Fiji Institutional Wood Burning Stove (updated
by Fiona MacGregor; Fiji) FTIB, 2004 Incentives for Investing in the Fiji Islands (revised January) GEF, 1999 Promoting Sustainability of Renewable Energy Technologies and Rural Renewable Energy
Service Companies in Fiji (project document for UNDP/GEF project FIJ/99/G35/A/1G/99) GoA, undated The Role of Wind Energy in Reducing Greenhouse Gas Emissions (Department of Arts,
Sports, Environment, Tourism and Territories, Canberra) GoF, 1985 Electricity Act (Chapter 180 of the Laws of Fiji; revised 1985) GoF, 1993 Rural Electrification Policy (approved by Cabinet 23 March) GoF, 1997 National Greenhouse Gas Inventory: Fiji Islands: Initial National Communication to the
United Nations Framework Convention on Climate Change (DoEnv, never submitted to UNFCCC; completed November)
GoF, 1997 Fiji Today (booklet from Ministry of Information) GoF, 1998 1996 Fiji Census of Population and Housing: General Tables (Bureau of Statistics;
Parliamentary Paper No 43 of 1998) GoF, 1998 Census of Population Summary 1881-1996 (Bureau of Statistics) GoF, 1998 Forestry Facts and Figures Fiji 1998 GoF, 1998 Reorganisation Charter for Fiji Electricity Authority: Creating a Competitive and Efficient
Power Sector (Ministry of Commerce, Industry, Cooperatives & Public Enterprises) GoF, 2002 Customs Tariff (Amendment) (No. 2) Act 2001 (Effective 1st January) GoF, 2002 Ministry of Fisheries & Forests, 2002 Annual Report GoF, 2002 Strategic Development Plan 2003-2005 (Parliamentary Paper 72 of 2002) GoF, 2003 National Assessment Report for the Ten Year Review of the Barbados Programme of Action
(BPOA + 10); DoEnv; 8 October). GoF, 2003 Urban Household Income and Expenditure Survey 2002-2003 Provisional Results (Fiji
Islands Bureau of Statistics, report 70, 18 December) GoF, 2003 Key Statistics September 2003 (Fiji Islands Bureau of Statistics) GoF, 2004 Naboro Landfill, Suva: Information for Potential Joint Venture Partners (Dept of
Environment; 17 May) GoF, 2004 Report of the Technical Evaluation Committee on the Incinerator Projects of Waste To
Energy Fiji Ltd. and the Brind International Group UK (prepared by Devendran Kumaran, Premila Kumar, Peter Johnston, and Dick Watling; May)
IAE, 1993 Technical and Commercial Proposal for Prefeasibility Funding for a Waste Biomass for Energy Project Located in the Suva, Fiji (International Applied Engineering Inc. September 30)
IIEC, 2003 Demand-Side Management Project South Pacific Island States: Report on Current DSM Activities and Utility Data, Fiji Electricity Authority (IIEC Bangkok, August)
IMF, 2003 Fiji 2002 Article IV Consultations: Staff Report (Country Report 03/08; January) IMF, 2003 Fiji: Selected Issues and Statistical Appendix (Country Report 03/09; January)

81
IMF, 2004 Fiji: Report on the Observance of Standards and Codes — Fiscal Transparency Module (Country Report No. 04/64; March)
IMF/WB, 2003 Fiji Statement to Board of Governors’ Annual Meeting (presented by Ratu Jone Y Kubuabola; September)
IRN, 2002 Citizen’s Guide to the World Commission on Dams IRN, 2003 Twelve Reasons to Exclude Large Hydro from Renewables Initiatives (International
Rivers Network & twelve other organization; Berkeley; November) Johnston, P & Esler E, 2000 A Framework for Sustainable Electricity Development in Fiji (prepared for
Greenpeace Pacific, Suva, April) Johnston, P 1994 An Evaluation of the European Community’s Lomé II Pacific Regional Energy
Programme: Final Report (prepared for South Pacific Forum Secretariat; Suva; August)
Keith-Reid, Rt, 2004 Catastrophe: How It Can Help Cushion the Financial Blow (in ‘Islands Business’ Suva, April)
Kikau, R, 2004 Dam Boosts Power Supply (in Fiji Times, 24 July) Kikau, R, 2004 FEA Studies Pre-pay Concept (in Fiji Times, 26 July) Kumar, M & Mario, R 2004 Renewable Energy Possibilities for Fiji (USP & SOPAC, Suva) Lohning Int’l, 1995 Proposed Fiji Waste to Energy Company. Submission to the FTIB (December) Macallan, 1991 Energy Audit of Tropik Wood Industries Ltd., Drasa, Lautoka (for DoE; October) MAFF, 1994 The Processing of Coconut Products in Fiji (prepared by G. de Taffin, A. Macedru,
and T. Kete) MAFF, 2004 Annual Log Volume (m3) Removal by Division, 1992-2003 (Forestry Department,
Suva, 2004 (information supplied in writing to Vega February 25) Matakiviti, A & Pham, T, 2003 Review of the 1993 Rural Electrification Policy (prepared for ESCAP &
DoE; ESCAP report W1755-01 Rev 4; 17 July) Naivalurua, R, 2003 Going Nuts Over Coconut Oil (in Fiji Times, CIDA, 27 November) Naivalurua, R, 2004 A Coconut Per Kilometre (in Sunday Times, CIDA, 25 July) Naivalurua, R, 2004 The Future for DME Oil (in Sunday Times, CIDA, Suva, 22 February) Namoumou, Sokoveti 2003 Energy Use Survey Report (Prepared for OPRET, DoE, December) OPRET, 2002 Renewable Energy Policy Development (Background to the Charter for Renewable
Energy Based Rural Electrification with Participation of Private Enterprise; OPRET Unit, DoE, November)
PEDP, 1988 Report on 10 kW Wood-Fuelled Village Cogeneration Plant, Nakawau Village, Taveuni (prepared by Chris Harwood for Pacific Energy Development Programme of UNDP/ESCAP; July)
PICHTR, undated Village Power Project: Hybrid Village Power System for Nabouwalu, Fiji PIFS, 2004 Pacific Fuel Price Monitor (Edition 7 v 2, 12 May 2004) Prasad, S, 2003 Energy Aspects of Fiji’s Sugar Industry: A Case for More Efficient Electricity
Generation from Bagasse (in Fijian Studies, vol. 1 no. 2, pp. 243-263) Radio Australia, 2004 Pacific Beat Report on Fiji Sugar Industry (10 August) Raghavan, K, 2003 100% Renewable Energy Islands in Tuvalu, Fiji and Tonga (Forum for Renewable
Energy Islands; University of the West Indies; October) RBF, 2004 Reserve Bank of Fiji Quarterly Review: March 2004 Reddy, N, 2003 Survival Strategies for the Fiji Sugar Industry (in Fijian Studies, vol. 1 no. 2, pp.
265-285) SEDEP, 1992 Urban Solid Waste Treatment by Methanisation Process for Greater Suva
(Feasibility Study Report, June) Sharma, S, 2004 EU Seeks Cut in Sugar Price (in ‘Fiji Times’, 10 August) Shell Fiji, 1998 Taveuni Electrification Project Proposal for Shell International Renewables (17
September) Siwatibau, S, 1978 A Survey of Domestic Rural Energy Use and Potential in Fiji (Centre for Applied
Studies in Development, USP, October) SOPAC, 1993 Wave Data Collection Fiji (from
http://www.oceanor.no/projects/wave_energy/index.htm; prepared by S.F Barstow. & E. Olsen of Oceanographic Company of Norway AS; OCEANOR Report OCN R-92089, November 1992 & SOPAC Technical Report 156 of 1993)
SOPAC, 1995 South Pacific Geothermal Review (GENZL; February

82
SOPAC, 1996 Ocean Wave Energy in the South Pacific: the Resource and its Utilisation (SOPAC Report 234 by Barstow & Falnes, November)
SOPAC, 1999 Grid-Connected Solar PV Project – Fiji Islands: Final Project Report (SOPAC Report; TR279/2; Prepared for Australian Greenhouse Office)
SOPAC, 2001 The Regional Institutional Wood Fired Stoves Project in the Fiji Islands, Kiribati, Tonga and Tuvalu. An Evaluation of Phase II / Stage One (prepared by Rupeni Mario; SOPAC Technical Report 327, June)
SOPAC, 2003 Individual Country Biomass Resource Assessment Profile for Fiji (from ‘Biomass Resource Assessment, Utilisation and Management for Six Pacific Island Countries’ prepared by Department of Environmental Science and Technology of Imperial College London; December)
SPC/GTZ, 2002 SPC/GTZ Pacific German Regional Forestry Project (presented at 33rd meeting of Committee of Representatives of Governments and Administrations, Suva, 5-11 November).
UNDP, 2003 Human Development Report 2003, Millennium Development Goals: A Compact Among Nations to End Human Poverty (New York)
USDoE, undated Environmental Impacts of Using Geothermal Energy (U.S. Department of Energy - Energy Efficiency and Renewable Energy; Geothermal Technologies Program; available from: www.eere.energy.gov/geothermal/environ_impacts.htm)
USP, 1997 Characterisation of the Solid Waste Entering the Lami Dump (Department of Chemistry, April)
USP, 2002 An Overview of Energy Related Activities at USP (presented at 2002 Pacific Regional Energy Meeting)
Vega, Luis 2004 Fiji Islands Renewable Energy Assessment National Consultant Report (12 March) Vega, Luis, 2003 Cost of Electricity Production (Annex 2 to Establishment of Economic Framework
and Incentive Policies for Renewable Energy Service Companies: Final Report; main report by Dr Marc G Saupin for UNDP/GEF OPRET; November)
Vula, T, 2004 New Hydro Station Opens (in Fiji Post, 24 July) Wade, H, 2003 Financing the RESCO Business in Fiji (prepared for Office for the Promotion of
Renewable Energy Technologies of DoE under UNDP/GEF Project FIJ/99/G35, August)
WB / UNDP, 1983 Fiji: Issues and Options in the Energy Sector (report 4462-FIJ; joint World Bank UNDP Energy Sector Management Assistance Programme)
WB, 1990 Pacific Household and Rural Energy Seminar (WB/UNDP Energy Sector Management Assistance Programme & PEDP; Port Vila, Vanuatu, November)
WB, 2000 Municipal Solid Waste Incineration: Requirement for a Successful Project (World Bank Technical Paper No. 462; Washington; June)
WB, 2002 Fiji At A Glance (23 September) WB, 2003 What International Investors Look for When Investing in Developing Countries:
Results from a Survey of International Investors in the Power Sector (prepared by Ranjit Lamech & Kazim Saeed; Energy & Mining Sector Board Discussion Paper No. 6; Washington, May)
WB, et. al. 1992 Fiji: Issues and Options in the Energy Sector (Volume 4 of Pacific Regional Energy Assessment or PREA; prepared jointly by World Bank with UNDP/ESCAP PEDP plus ADB and Forum Secretariat)
WR1, 2003 Climate Analysis Indicators Tool (CAIT spreadsheet)

83
Websites consulted
Organisation Address Information
Fiji Department of Energy www.DoE.gov.fj Miscellaneous energy data, esp. renewables
Fiji Islands Trade and Investment Bureau
www.ftib.org.fj Investment guidelines
Fiji Meteorological Service www.met.gov.fj Climate, wind, solar data
Fiji Mineral Resources Dept www.mrd.gov.fj Petroleum resources of Fiji
Flinders University www.ntf.flinders.edu.au/ Fiji ocean tides
Native Land Trust Board www.nltb.com.fj Land ownership and tenure
Reserve Bank of Fiji www.reservebank.gov.fj Financial andeconomic data
Pacific Islands Forum Secretariat
www.forumsec.org.fj Economic data; investment climate
Secretariat of the Pacific Community
www.spc.int Miscellaneous statistics on Fiji
Secretariat of the Pacific Regional Energy Programme
www.sprep.org.ws Miscellaneous environmental reports anddata
United Nations Framework Convention on Climate Change
www.unfccc.int Greenhouse gases
Food & Agriculture Organisation
www.fao.org/DOCREP/003/X6900E/x6900e0q.htm & www.fao.org/DOCREP/003/X1576E/X1576E05.htm
Asia and Pacific National Forestry Programme updates for RMI
Citizens United for Renewable Energy and Sustainability
www.ee-netz.de/cures Environmental impact of energy
Tinytech (India) www.tinytechindia.com Coconut Oil expelling technology
US Department of Energy www.eere.energy.gov/geothermal/environ_impacts.htm
Environmental impacts of geothermal energy
Asian Development Bank www.adb.org Economic and project data
World Bank www.worldbank.org Economic and energy data
World Commission on Dams www.dams.org Impacts of large dams
World Resources Institute www.wri.org Greenhouse gases
International Monetary Fund www.imf.org Financial data

84
Annex C – Fiji Department of Energy Staff Training (1994-2002) This annex indicating DoE staff training (and workshops, etc.) has been slightly amended in form from that prepared by PIRP National Consultant, Dr Luis Vega. The content has not been changed. 1994: Participant Course/Workshop Venue
15-18 Mar Rohit Autar Human Resource Management GTC 30 May V. Ram Energy Management Training Attachment IEMC 1-5 Aug D. Chand; R. Deo National Regional Energy Demand andSupply Database Forum Secretariat 2-12 Aug M. Sauturaga Study Meeting on Appropriate Energy Sources for Rural Areas Manila, Philippines 8-18 Sep Rochet Autar GTZ Energy Counselling Project Vanuatu 26-30 Sep R. Deo Regional Training Workshop on Energy Survey Bangkok, Thailand 1995: Participant Course/Workshop Venue 30 Jan-17 Feb R. Deo Use of Satellite Remote Sensing Data for Study of Wave Climate Oceanor, Norway 6-10 Feb R. Caginavanua Windows 3.1 Orientation ITC 20-24 Feb M. Vulavou & M. Khan Windows 3.1 Orientation 10 Mar D. Kumaran, R. Autar British Wind Energy Trade Mission Auckland, NZ 5-6 Apr A. Cakau Security Liaison Officer Course GTC 1-12 May A. Matakiviti, M. Sauturaga, P.
Nakavulevu, N. Seru & D. Chand Rural Electrification Planning Forum Secretariat
18-27 May R. Autar World Geothermal Congress Florence, Italy 4-21 Jul R. Autar, P. Nakavulevu &
R. Singh GTZ 3rd Mission Preparation of Hydro Prefeasibility Studies DoE
25-28 Jul M. Sauturaga, P. Narayan Development & Implementation of an Energy Conservation Programme Forum Secretariat 25 Jul-2 Aug R. Deo Asia Pacific Renewable Energy Symposium Sydney, Australia 8-10 Aug R. Autar, P. Narayan Petroleum Sector Development: Policies for Improving Efficiencies Forum Secretariat 27-28 Aug D. Chand, N. Seru Microsoft Access SPEC 29 Aug-1 Sep P. Narayan Written Communication and Strategic Planning Management and Leadership GTC 3-23 Sep P. Nakavulevu International Micro Hydro Training Course Cebu, Philippines 16-20 Sep R. Autar, P. Narayan Petroleum Storage and Handling Forum Secretariat 20-24 Nov R. Autar, P. Nakavulevu &
R. Singh Design of Civil & Hydraulic Structures for Micro Hydro Power Scheme Workshop
Forum Secretariat
21-24 Nov D. Chand Novell Netware 3.12 System Administrators' Course Computech 27 Nov-1 Dec M. Sauturaga Demand Side Management Marketing Training Forum Secretariat 4-7 Dec R. Deo, D. Chand Demand Side Surveys and Data Collection Forum Secretariat 4-15 Dec R.Singh Photovoltaics for Rural Electrification ATT, Thailand 1996 Participant Course/Workshop Venue
5-9 Feb R. Deo, D. Chand & P. Narayan Energy Policy and Planning - The Environmental Manual for Power Development
Forum Secretariat
20-24 Feb A. Matakiviti Use of Photovoltaic for Power Generation ADB-HQ, Philippines
11-15 Mar D. Kumaran New Approaches to Public Sector Management Tanoa Hotel, Nadi
16-19 Apr M. Sauturaga, R. Deo, A. Matakiviti & R. Autar
Project Planning / Project Cycle Management Forum Sec
30 Apr-3 May B. Florian Disciplinary Procedure, Counselling and Staff GTC
14-17 May A. Cakau Management of Executive Officers GTC
22 May-1 Jun N. Seru Environmental Audit Training Attachment Tonga & Solomons
17-21 Jun R. Autar Study Meeting on New Energy Sources Tokyo, Japan
19-21 Jun R. Deo Transfer of Environmentally Sound Technologies and Activities Implemented Jointly
Osaka, Japan
24-26 Jun N. Seru Regional Workshop for Environmental Guidelines for Power Stations FEA Training Centre
1st Semester D. Chand, P. Nakavulevu Microeconomics (EC 101) USP
1st Semester N. Seru Marine Biology USP
1-5 Jul B. Florian Industrial Relations GTC

85
30 Jul-2 Aug P. Narayan Government Procedures GTC
2-21 Sep P. Narayan Energy Efficiency and Conservation Seoul, Korea
11-18 Oct R. Deo Seminar on Energy Supply and Demand Outlook Tokyo, Japan
4-15 Nov P. Narayan PV/Diesel Hybrid Power Systems Lae, PNG
16-28 Nov R. Autar Energy Management Karachi, Pakistan
18-22 Nov '96 N. Seru, D. Chand, P. Nakavulevu & R. Singh
GTZ Hydro Training, Tendering and Contracting and Equipment for Small Hydro Power Application
Forum Secretariat
10-16 Dec M. Sauturaga Symposium on Energy Sources in Rural Areas Manila, Philippines
14-20 Dec A. Matakiviti, N. Seru Use of Solar and Wind Energy for Rural and Remote Power Supplies Noumea, NC
2nd Semester P. Nakavulevu Microeconomics (EC102) USP
2nd Semester M. Khan, R. Caginavanua Diploma in Business Studies FIT 1997 Participant Course/Workshop Venue 10 Feb-7 Mar R. Singh Electrical Wireman's Course (Stage 1) FNTC 26-28 Feb B. Florian Management Planning GTC 10-14 Mar N. Seru, P. Narayan Petroleum Product Pricing Pacsoft Training Ctre 19-20 Mar A. Cakau Effective Organization GTC 26-27 Mar A. Cakau Leadership GTC 27.Mar P. Nakavulevu, P. Narayan Access Level 1 Course Pacsoft Training Ctre 10-18 Apr R. Singh Project Planning and Management Pacsoft Training Ctre 6-8 May B. Florian Occupational Health and Safety Care GTC 12 May-5 Jun P. Narayan Hybrid Power Systems PICHTR, Hawaii 19 May-13 Jun R. Singh Electrical Wireman's Course - Stage 2 FNTC 12-13 Jun B. Florian Motivation Workshop GTC 16-18 Jun B. Florian Industrial Relations GTC 23-27 Jun R. Singh Sub-Regional Workshop Wind Energy Utilization FSED 6 Aug-4 Sep R. Singh International Training Workshop on Solar Energy Application GENRI Institute, China 7 Aug-18 Sep N. Seru Training Course on Biogas Technology BRTC, China 3-4 Sep A. Cakau Management Ethics GTC 15 Sep-10 Oct R. Singh Electrical Wireman's Course - Stage 3 FNTC 16 Sep-13 Oct A. Matakiviti Resource Conservation and Environment Protection Japan 22-24 Sep B. Florian Performance Management System: Trainer's Workshop GTC 22 Sep-11 Oct P. Nakavulevu Energy Efficiency and Conservation Korea 18-21 Nov D. Kumaran HOD Workshop GTC 9-10 Dec B.Florian Selection and Aptitude GTC 1998 Participant Course/Workshop Venue 13.Jan B. Floria, M. Khan & R.
Caginavanua Insurance Workshop on PSC Group Life Policy Southern Cross Hotel
20-24 Jul P. Nakavulevu SPC/SOPAC Regional Energy Program Design for 1999-2004 Nadi 20-25 Jul R. Prasad FNTC/Asian Productivity Organisation Seminar Nadi 31 Jul-1 Aug D. Kumaran Financial Management Information System Projects Warwick Hotel 18 Aug-18 Sep
M. Sauturaga SES Training - "Establishing the Workplace as an Effective Learning Environment"
GTC
28-29 Sep ?? Performance Management System Workshop (Refresher Course) 13-16 Oct M. Sauturaga Petroleum Seminar Tanoa Intl Hotel, Nadi 5.Nov D. Kumaran Understanding the Role and Responsibility of being a Company Director Centra Hotel 5-6 Nov P. Narayan National Workshop for Fiji's Biodiversity Strategy and Administration Plan
(BSAP) Marine Studies Complex
8 Nov K. Krishna, B. Florian Human Resource and Payroll System Workshop Noble House 16-18 Nov All DoE Staff Position Description Course DoE 23-27 Nov J. Vikash Archives Administration and Record Management GTC 1999: Participant Course/Workshop Venue 13 Jan-29 Feb A. Narayan Technology for GHG Emission Mitigation Japan 1-5 Mar A. Narayan Sustainable Development Japan 10-11 Mar A. Cakau Conflict Management CTD 14-27 Jun P. Narayan International Biogas Training China 19-21 Aug P. Narayan Windows NT Administration Pacsoft 31 Aug-3 Sep P. Narayan Supporting Windows NT Technologies Pacsoft 14-16 Sep P. Narayan Global Conference on Renewable Energy Denmark

86
2000 Participant Course/Workshop Venue 6-8 Mar R. Prasad Appliance Labeling Symposium New Zealand 6-17 Mar A. Narayan International Course on Planning of Small Hydro Power India 27-31 Mar A. Narayan, A. Gonelevu Energy Database Workshop SOPAC 12-18 Apr M. Sauturaga Conference on Environment Energy Japan 8-12 May A. Gonelevu IGPO Training and Development Course Australia 12 Jun-12 Jul I. Khan 9th International Solar Energy Application Technology Training Workshop China 20-26 Sep R. Prasad Joint SOPAC/SPC Regional Energy Meeting Kiribati 17 Sep-7 Oct N. Seru APO Course on Resource Recycle and Environmental Protection 2000 Japan 24-26 Oct J. Vikash, R. Prasad & I.
Nailawa Registry Procedure Course CTD
6-8 Dec A. Cakau PMS CTD 11-12 Dec A. Gonelevu, I. Khan Government Procedures CTD 2001: Participant Course/Workshop Venue 16-18 Jan M. Sauturaga Energy Subsidy Reform and Sustainable Dev. Challenges for Policy Makers Thailand 21-22 Mar I. Khan Finance for Non-Finance Managers CTD 10 Apr P. Khan Personal Development for Typists and Secretary CTD 26-30 Apr A. Gonelevu Leadership and Change CTD 14 Apr-9 Aug A. Gonelevu Solar Power Generation and Application Technology Japan 22 May-6 Jun A. Lal International Solar Energy Application Technology Training Workshop China 29-31 May I. Khan Regional Symposium on Energy Efficiency Standards and Labeling Thailand 11-13 Jun N. Seru People's Management Course Holiday Inn 12-14 Jun J. Vikash Records Management CTD 25-29 Jun P. Nakavulevu Energy Efficiency for Green Productivity Seminar and Workshop Singapore 18-20 Jun A. Narayan Strategic Planning for Natural Resources Dev and Management Thailand 26-27 Jun N. Seru Sustainable Energy Seminar for ACP Island States (Framework of EC
Development and Co-operation) Dominican Republic
5-6 Jul J. Vikash Stress Management CTD 12-13 Nov P. Nakavulevu Use of Log Frames as a Planning Tool CTD 23-25 Nov M. Vatuloka Team Building CTD 10-14 Dec A. Gonelevu Workshop on Environmental Economics; Cost and Effectiveness Philippines 2002: Participant Course/Workshop Venue 29 Jan A. Narayan Renewable Energy Thailand 19-20 Mar P. Nakavulevu Policy Planning and Management CTD-PSC 19-21 Mar D. Kumaran, P. Nakavulevu, M.
Sauturaga & S. Lata Workshop on Improving Fiscal Discipline and Financial Improvement in Government
Min of Finance
19-21 Mar S. Liwaiono Workshop on Improving Fiscal Discipline and Financial Improvement in Government
Min of Finance
19 Apr S. Liwaiono Basic Windows Training Min of Finance 6-10 May T. Manamana Theory Training on Installation and Maintenance of Renewable Energy System CATD Nadave 9-10 May I. Khan, A. Gonelevu Logframe Training Programme Report Tradewinds Hotel 13-17 May P.Nakavulevu Business Training (Opret Course) CATD Nadave 13 May-9 Aug T.Gani Solar Power Generation and Application Technology Japan 25-26 Jul P.Nakavulevu International Seminar on Energy for Sustainable Development China 6. Aug J. Vikash, S. Ali New Postal Mailing System for Government Min of Finance & 12 Aug-25 Sep
A. Narayan International Biogas Training Course China
5-8 Aug I. Khan, A. Gonelevu ESCAP/SOPAC Sub-Regional Workshop for Pacific on Application of Guidelines on Strategic Planning and Management of Energy and Water Resource Development
Outrigger Hotel
19-23 Aug T. Manamana; A. Lal
Practical Training on Installation and Maintenance of Renewable Energy Systems
Nabouwalu
2-6 Sep A. Gonelevu, T. Gani, I. Khan, A. Narayan, & T. Manamana
Renewable Energy Resource Assessment Training DoE
8 Oct-11 Nov A. Gonelevu International Small Hydropower Training Workshop China 11-15 Nov I. Khan Green Energy for Green Productivity India

87
Annex D – Namara, Kadavu Solar Home System Installations
Namara on Kadavu is a village of about 70 households that has been using solar energy for household electricity since 1984. Electrification has gone through three phases and the community is being considered for a fourth phase.
• Phase 1: Namara was one of the three villages chosen for solar electrification under 1983 DoE feasibility trials funded by the U.S Agency for International Development (USAID).
• Phase 2: About 1987, the Kadavu Divisional Officer arranged local funding for about 20 new batteries, controllers, lights and panels to support the Namara solar installations. This increased the capacity of some households and restored power to households with failed batteries.
• Phase 3: Because the households had successfully kept most of the 1984 installations operational, it was selected by DoE as the site of an EU-funded upgrade as part of the Lomé II PV Follow Up project in 1994. All households desiring a SHS were provided with 100 Wp of solar panel in addition to existing panels plus electrification of the church, community meeting house, dispensary and a school room.
This project was designed by DoE as a technical trial to determine the maintenance requirements and cost of operation of SHS in a remote site. The installation included: • 110 Wp of Seimens solar panels in parallel with existing 38 and 42 Watt panels
from Phase 1 and 2.
• 110 Ah C10 Oldham tubular positive plate open cell 12V battery.
• S.P.I.R.E. type solar controller made by the S.E.C. in Kiribati.
• One 7W PL light and two -11 Watt PL lights from Independent Power, New Zealand.
In the original installations the panels were directly attached to the metal roof of the houses. As a result of the incorrect manner of the installations, roof leaks were common at the mounting points. In the upgraded installations, panels were mounted on four metre poles. In cases where solar access was difficult six metre poles used). After the first year of operation, households desiring to use a radio were provided with DC/DC converters to match the voltage of the radio being used. A local technician was trained for preventive maintenance and a technician from DoE went several times per year to check on the technical performance of the equipment and to determine customer problems. The technician was supposed to be paid by the village but DoE has provided his payment. A fee of $2.00 per month per system is charged for incidental expenses but DoE agreed to provide all primary repairs for 10 years (1994-2004), since it was a technical trail. The trial was very successful since the equipment performed with few problems for the 10-year period. Two battery replacements were needed in 2003 and one controller was replaced due to damage by the technician through improper maintenance procedures, resulting in a short circuit without fuse protection. For the 10-year period the cost of maintenance was minimal and system reliability very high indicating that the components were well suited to the conditions of use in Namara.
Unfortunately, the DoE has chosen to ignore the experience gained from the 10 years of trials and new systems being installed in Namara use low cost, short life batteries

88
and untested controllers that have had poor operational experience in other parts of the Pacific.
Phase 4: Presently under consideration is solar powered street lighting, 10 more solar home installations and increased capacity for the community centre to allow video and/or refrigeration. One new system has been installed as a trial. Unfortunately equipment differs from that installed in the other households creating spare parts problems and increased maintenance cost due to lower quality components poorly suited for Namara. It is strongly recommended that future expansion/rehabilitation of the Namara project use the same high reliability components that have been well proven for their cost effectiveness in the Namara environment.
Lessons learned include:
• High quality PV system components specifically selected for the Fiji environment can survive over eight years with a low failure rate.
• When systems work reliably, provide the desired services and local technicians are readily available to ensure that systems remain operational, tampering is minimal even though all components of systems are accessible to users.
• Well trained, local technicians can adequately maintain systems when supported with spare parts and infrequent technical assistance from outside.

89
Annex E - Naroi, Lau Group, Solar Home System Installations
Approximately F$1m dollars of project funding was provided by the French Government through the French Embassy in 1998 to electrify the village of Naroi on the island of Moala. The cost per household was F$5469 including engineering, consultancy and support fees of international consultants. Actual system cost is estimated at about F$3000 per household, about F$900 more than the systems provided for Namara (including installation and support costs) with the extra cost mostly due to the complex controller and SunCash meter installed in Naroi.
In this project approximately 170 households were equipped with pre-payment metered, solar powered lighting systems. No power points were included for radio or other appliance operation. The project was completed in 1999.
All systems utilised the same components. No attempt was made to customise systems to meet user’s needs. The components for each installation were:
• 2 Photowatt PWX 500 50 Wp solar modules; • 1 TR 15 RMP payment mode charge-discharge regulator; • 1 “SUNCASH” prepayment credit code meter; 1 Oldham 6 MLTS 12V 141 Ah (C100) deep discharge with gas recombination caps; tubular plate, open cell, lead acid battery • 3-12V/11W Solagen 11 W PL compact fluorescent light fixtures; • 1 night light 12V/2.5W (incandescent); • no outlet for any external connection for radios or other appliances; • pole mounts with buried wiring;
The Naroi project was not intended to be a technical test like Namara but rather to determine the effectiveness of the institutional structure being used. In fact, however, the project tests both the technical systems, particularly the control and pre-payment meter components, and the concept of fee-for-service wherein recipients pay a fixed monthly fee for receiving a specified level of service.
The users were initially required to pay an installation fee of F$100 (approximately US$60) and a monthly payment of F$4.50 (selected because it was the lowest rate paid to the FEA by grid connected customers on Viti Levu for basic services and was set at that rate by the Fiji Department of Energy DoE’s Rural Electrification Unit under their policy). This is less than half the actual operation and maintenance (O&M) cost for the systems but the intent was to gradually increase the fees to full O&M cost recovery. The present (early 2004) fee is F$7.50 (of which F$0.50 goes to the collection agent) but because of devaluation of the Fiji dollar, O&M costs have risen so the fee is still subsidised substantially. Lighting is included in the service and light maintenance, including replacement of bulbs, is provided by project operators. Maintaining the lights has been a significant part of the maintenance effort. Failed lights have frequently been used by households as an excuse to avoid paying the fee.
Each household has a prepayment meter which operates using 16 digit computer generated credit codes. Credit codes are issued in bulk each month by the DoE in Suva and sold at the Post Office in Naroi village. The Postmaster issues a Fiji Post

90
receipt containing the monthly credit code specific to each meter. Customers enter the credit code in the meter using an integrated keypad which, when the number is correctly entered, extends the usage period of the system by one month. If the code is not entered before the end of the current service month, the SunCash meter disconnects the lights and the system does not provide service to the customer. Post Fiji deducts a F$0.50 commission for each payment. The balance is remitted to the DoE and deposited in a Treasury account. The money collected is intended to partially pay for maintenance and repair services for the project. The DoE is responsible for costs that exceed the amount collected.
All regulator and metering systems were initially sealed with steel wire and lead seals. Any tampering by customers is supposed to be considered to be a breach of contract. Repeated abuse of systems such as battery, regulator or meter tampering is supposed to result in the removal of photovoltaic equipment by DoE agents. However, this has not been consistently done. Installations that remain idle for six months are also supposed to be inspected to ensure that batteries are being charged properly. Prolonged non-use and non-payment of monthly fees is supposed to result in photovoltaic equipment being removed and assigned to a customer who is prepared to pay for the service. This also has not been done consistently.
Maintenance services are mainly provided by an on-island technician trained by DoE and the Centre for Appropriate Technology and Development (CATD). The technician is responsible for maintaining battery water, checking on system operations, and ensuring that customers who do not pay the monthly fee are contacted and arrangements made for payment or removal of the systems. Any technical faults are supposed to be reported to the Post Master or directly to DoE.
The technician is the only person in the village authorised to intervene on any solar installation. Adding demineralised water to batteries as needed (sourced from a filter at the PWD facility in Naroi) and reporting the status of regulator LED indicators to the DoE were the main maintenance tasks initially assigned to the local technician. The technicians are paid by DoE and do not receive payment until reports are submitted.
The project commenced operation in late April, 1999. Maintenance problems in the first year of operation included:
• five houses of the 170 with complete blackout (no power to loads); • six with faulty metering systems where systems provided power even though the
SunCash meters showed zero time available; • 11 with failed fluorescent lights (mostly ballast failures, not bulb failures); • 60% of the systems had their seals broken, clear evidence of tampering; • 90% of the night lights had failed; and • battery water filter was not useable any longer due to clogged filter. By September of 2000 when the New Caledonia supplier made a warranty maintenance visit they found:
• six badly sulfated batteries, four unrepairable and two repairable through equalisation;
• five systems without lights since mid 1999. Three were repaired and two could not be fixed until the SunCash master key codes from the vendor could be entered;

91
• Two SunCash meters had failed; • ninecontrollers had to be replaced (two had become unconfigured for use with the
SunCash meters and four had failed); • 28 cases of tampering were found, of which six were serious including cut cables
and clearly abused components; • all night lights had to be replaced; • one system had its controller stolen;
By late December 2000, an additional eight SunCash meters had failed and four controllers were not working. Battery tests indicated eight were fully discharged indicating that the maintenance technicians were not properly checking and repairing systems.
Upon examination of the year 2000 maintenance records, it was found that the local technicians generally listed all of the six cells in each battery as having the same specific gravity. This is technically impossible and indicates that the technicians were either just filling in the forms without visiting the sites or were measuring only one cell and then filling in the remaining cell readings as the same value.
By the end of 2000, no spare parts were available on island, so systems with faults remained out of service until replacements could be shipped from Suva. DoE stocks also dwindled and had not been replaced. In some cases, materials had to be ordered from overseas and this appears from the records to have taken several months for delivery to the island.
Between 1 January - 2 May, 2001, six SunCash meters had to be replaced, eight controllers were removed as not working properly, five houses had bad lights and two had bad switches.
By 13 June 2001, 36 households needed replacement lights and two had failed SunCash meters.
On 25 January, 2002 the village was given notice that the monthly rate was being raised to F$7.50 with $7 going into the government treasury and $0.50 to the Post Office. Unfortunately, when the SunCash meters were set with the new codes provided by the DoE computer, the use time was extended to more than one month so the effective rate remained at $4 per month. Pacific Energie in New Caledonia had to issue instructions to DoE on how to change the computer program so that the higher rate of $7 would only last one month on the SunCash meters.
By October 2002, the overall sales of codes to users was at about 50%, apparently mostly due to system problems leaving systems working poorly (mostly one or more failed lights) and people not being willing to pay $7.50 per month when all lights were not working or when systems only worked a couple of hours per day. Some other users appear to have stopped paying because they do not perceive that the service provided – even when working properly – is worth $7.50 per month, some stopped because they have moved elsewhere temporarily and some did not purchase codes because they were temporarily without sufficient cash.
According to the DoE project officer in 2002, the SunCash meters have been their biggest problem. This has been partly because of failures and partly because the skills

92
for their repair are not available locally. Therefore they have had to be shipped at considerable cost in both time and money to New Zealand for repair.
During the project period, the computer used to write the codes had to be upgraded. Bringing the software for creating and printing the codes up to date was quoted as NZ$ 7,000. The substantial rate of SunCash meter failures, the high cost of repairs of the SunCash meters and the associated computer costs indicate that there can be significant overheads associated with the use of pre-payment meters beyond the collection fees charged by the Post Office.
Several clear lessons have been learned:
• since panels and batteries are essentially the same in Namara and Naroi, it is clear that the increased technical complexity of the controller and associated prepayment meters installed in Naroi have substantially increased the maintenance cost, lowered system reliability and decreased customer acceptance and willingness to pay;
• prepayment meters do not prevent a low rate of collection. Collection rates appear to be determined mostly by quality of service and perceived value;
• there can be substantial direct and hidden overhead costs attributable to the use of pre-payment meters and there are indications that this added cost is not justified since the rate of collection of fees and system reliability has been worse than similar projects in other countries that do not use pre-payment meter schemes;
• spare parts must be readily available to keep systems operating, batteries charged and customers satisfied;
• seals, complex anti-fraud controls and pre-payment schemes do not prevent extensive tampering and abuse of systems when the service provided is not perceived to be good value. Users will attempt to get the services for which they have paid through whatever means may be available to them;
• if systems are not removed and offending customers disciplined for non-payment or tampering, the effectiveness of anti-tampering controls and pre-payment metering is compromised;and
• including the lights under the maintenance contract can substantially increase the cost of maintenance services and provides excuses to customers not to pay on time when a failed light is not immediately repaired, even though actual customer services may be diminished only slightly.

93
Annex F - Vunivau Solar Home System Installations
Vanua Levu: Vunivau (Bua Province)
In 1996 the residents of Vunivau settlement in Bua Vanua Levu expressed interest in an electrification project using solar (PV) systems for each household. Subsequently the DoE conducted a survey of the settlement to determine if it was a suitable candidate for PV based electrification. It was decided that PV electrification was reasonable and proposals were drafted and submitted to foreign agencies for funding.
The Pacific International Center for High Technology Research (PICHTR), a Hawaii based organisation, was one of those approached. PICHTR secured approximately FJ$ 100,000 from the Government of Japan for implementation of SHS on 60 households for Vunivau. PICHTER developed the technical concept and determined that the “Powerhouse” of Shell Solar South Africa was the best choice.
“Powerhouse” consists of a moulded plastic case containing a charge/discharge controller coupled with a magnetic card reader and associated controls to allow pre-payment metering. Also included is a security system to lock out power to the loads when the case has been opened without proper authority. This can be extended to allow matching of panels and batteries to a specific control unit so that specific panels, batteries and controls will only operate when connected together, not when connected to other units. Batteries were purchased from a Fiji company (Pacific Batteries Ltd) so the battery security system cannot be activated because a special component has to be included in the battery at the time of manufacture and these are not provided by Pacific Battery. The control unit can be programmed to allow only a specific number of ampere hours (Ah) per day to be delivered to the load from the battery. In the installed systems, the setting should be 20 Ah/day, although some units were apparently delivered with a 10 Ah/day setting. The DoE allocated approximately F$30,000 for locally sourced materials and local costs, including treated wood poles, materials transport and engagement of local technicians for installation. Another local company, SOLCOM Fiji Ltd was engaged to supervise the installations.
Components consist of:
2-Shell Solar panels model RSM-50S, 50 Wp 36 cell. Shell Renewables South Africa “Powerhouse” control unit including low amperage 12VDC and 9VDC power point for radio use. Pacific Battery (Fiji) open cell automotive battery modified with 3 mm plates rated at 110 Ah (C20) 3-11W and 1-7 W STECA (Germany) SOLSUM self contained CFL units 8A Control unit by CONLOG Mag stripe card reader (CONLOG) ¼ W LED night light a pole for panel mounting with underground cabling to the control unit.
This project does not build on any prior PV component experience in Fiji or the Pacific region. None of the components except the solar panel, pole and wiring had previously been used in Pacific Island Country PV installations so this project is a technical as well as institutional pilot for the RESCO and mag-stripe prepayment meter concept.

94
PICHTER instituted an excellent technical reporting process and detailed data is available regarding the technical performance of the systems.
Systems are owned by DoE with technical support from PICHTER. Payment is made in advance for 30 days of operation through the purchase of a magnetic striped card encoded by a computer. Each household purchases a pre-set 30 day card from the local postal agency at a cost of F$14.50 of which $14 is the user’s contribution towards the capital cost and maintenance of the systems. The F$0.50 per user per month is a fee charged by the collection agent, Fiji Post. Money collected is deposited in a DoE account.
There were serious technical problems during the initial year and a half of operation, but as more experience was gained by support personnel and users, overall project performance has become very good. Approximately 30% of the systems were not fully operational immediately after commissioning, mostly because the controller shut down the power prematurely. This relatively poor level of early performance was caused either by poor quality control by the manufacturer or inherent design problems in the control system since the installations were properly made under strict supervision. By 18 months into the project, almost all systems were fully functional after multiple replacements of circuit boards in ten of the “Powerhouse” control units and some other functional repairs were made.
Unfortunately, 100% of the STECA SOLSUM 11 watt CFL units and about 5% of the SOLSUM 7 watt units failed within the first 18 months and better quality lights were purchased. The pull-string light switches initially used also had a high failure rate and have been replaced with wall switches. Except for the lights, most problems have been traced to the complex control electronics and card readers, with one control unit catching fire and destroying the plastic case, card reader and controls — but not spreading to the user’s house.
Most units have had a water consumption in the 300-400 ml/month range indicating good panel sizing and charge control settings that are high enough to encourage vigorous gassing in the battery, a prerequisite for long battery life. However over 10% of the units either have significantly higher water loss, implying either panel oversizing for the actual load or incorrect control operation. About 20% have significantly lower water loss implying inadequate panel capacity for the user’s load or incorrect control operation.
Since the project is less than five years old and has benefited from heavy support both by DoE and PICHTER personnel, specific lessons that can be transferred to subsequent projects are not yet well defined other than the basic performance data for components. For example, it is clear that the STECA made SOLSUM brand 11 watt CFL lights from Germany are not well suited to Fiji conditions and inexpensive pull string type light switches do not appear to be a good choice for Fiji PV systems.
A serious problem for the future is the fact that CONLOG has ceased manufacture of both the “Powerhouse” system and the pre-payment meters used in the project, due to the failure of the concept in South Africa and the lack of interest in SHS pre-payment systems in other parts of the world. Any similar future installations will thus have to use different controls and pre-payment meters requiring another cycle of field testing of new components before reliable operation can be achieved and forcing the maintenance company to stock spare parts for two types of installations.

95
Annex G – Overview of Fiji Outer Island Solar Home System Installations
This annex is from the report Fiji Islands Renewable Energy Assessment National Consultant Report (12 March 2004; written by Dr. Luis Vega). The table has been reformatted, with some information updated.
Project Namara Naroi Vanua Levu 1.0 Description Equipment integrated by SPIRE (Tahiti) Integrated by Total Energie (France) Shell Solar PowerHouse w Fijian batteries Project location Namara Village, Kadavu Naroi Village, Moala Is., Lau Group Vunivau, Nasuva (Bua Province) and
Vusasivo (Cakaudrove Province) Project type Solar Individual Household (SIH) SIH SIH (252 installed, 7 spares) Installation/Commissioning April 1994 (R. Singh's report) April 1999 60 (12/00); 84 (7/02); 108 (12/02) Handover Date -planned (none yet handed over)
2004 (10-years after installation) December 2002 n/a; owned by DoE; maintained by RESCO contract
2.0 Costs Equipment Capital Cost $1,986 per system in Fiji (1993 costs) US$ 2,444 per system in Fiji (1998 costs) US$ 976 per system in Fiji Installation Cost $453 14 Technicians 3-months for 170 houses US$ 211 per system @ 0.45 US$/F$ Total Cost F$2,438 per installed system (US$1,573) US$ 2650 per installed system US$ 1187 per installed system Foreign Aid $184,786 Equipment 100% Equipment 100%; Installation 8% Village Contribution Labour Labor and $17,000 Labour Govt. Contribution $16,400 (not included above) $33,000 Installation 92% Funding Agency European Union through SPIRE and REU Govt. of France and REU Govt. of Japan through PICHTR & REU Technical Support SPIRE & management by Forum Secretariat Transenergie PICHTR Number of houses 60 (45 with additional "old" 3rd panel) 170 250 paying users plus 2 at RESCOs shop No. of communal bldgs Church (4 systems); CH (2 ); Coop (1);
Dispensary (1) 1 CH with 2-systems (no fee) None
Maintenance Villager trained by DoE PWD Technician (resides in village) RESCO Note on costs: Namara Naroi
Assumes 2 new PV panels per SHS. To compare to others in US$ guesstimate 0.7 US$/F$. Costs in F$ (from H Wade 1995) Exchange Rate June-Dec 1998: 5.78 ±0.4 Francs/US$, 2.03 ±0.1 F$/US$ & 2.87 ±0.2 Francs/F$. Equipment Cost in Francs FOB Suva converted to US$. Installation costs assumed ≈US$200/unit. Village plus REU contribution = US$145 / unit
3.0 PV Panel Polycrystalline silicon solar cells (36) Polycrystalline silicon solar cells (36) Semicrystalline silicon solar cells (36) Panel Brand Siemens Photowatt PWX 500 (France) Shell Solar RSM 50S (Holland) Panel Size (Wp) 50 Wp at xx V under STC 50 Wp at 16.5 V under STC 50 Wp at 17 V under STC Cost per panel $410 (US$ 5.29 / Wp) US$ 332 (6.64 US$/Wp) Shell Solar Package (4.9 US$/Wp) Panels per system 2 (some two new + one from previous
installations) 2 2
4.0 Battery 12 V, Flooded Pb acid deep cycle, tall case 12 V, flooded Pb acid deep cycle, tall case 12 V, flooded Pb acid deep cycle (3 mm plates) Battery Brand Oldham Oldham 6MLTS 100 Pacific Batteries Ltd., Suva, Fiji (SSDC 100-12) Battery Size 106 Ah @ 10-hour discharge rate 106 Ah @ 10-hour discharge rate 110 Ah @ 20-hour discharge rate Cost per battery $681 (US$ 439) US$ 440 US$ 79 in Fiji @ 0.45 US$/F$ Batteries per system 1 1 1 Watering Rain Water (?) Demineralised water (Oldham Demini 200) Rain water, average consumption 300
ml/month 5.0 Service / Load 12 Ah/day 15 Ah/day (estimated 10/02 Gani) 20 Ah/day Power Point None. None 9 and 12 VDC for small appliances (e.g., radio) Light Type Compact Fluorescent tubes plus night light Compact fluorescent tubes plus night light Compact fluorescent, Edison (screw-in) base Light Brand Solagen (New Zealand) PL11-PS-12 Solagen (New Zealand) Solsum/Steca Light Size 11 W & 7 W CFLs and 2 W night light 11 W CFLs and 2 W incandescent night light 7 W and 11 W CFLs and 1/4 W LED Cost per light CFLs $40.5 each; Night light $17.7 CFLs US$ 33* each; Night light US$ 20 Included in package (CFLs @US$ 13.3 each) No. of lights per house 1 x 11 W + 2 x 7 W + 2 W night light 3x 11 W plus 2 W night light 1 x 7 W plus 3x 11 W plus 1/4 W Note on lights and their costs
In 2002, 11 W Solagen fixture F$78.7, Tube (F$10.9) Ballast (F$49.5)
Actual 4 x 7 W plus 1/4 W night light. Steca 11 all failed & replaced with Megaman or Phocos
6.0 Controller One controller per house One controller per house One controller per house Controller Type 20 A: Charge/Discharge Relay Controller 15 A: Bulk charge to on/off regulation 8 A: Bulk-Absorb-Float (20 Ah/day) Controller Brand Kiribati Solar Energy Co. (SPIRE design) Total Energie RMP Conlog (Shell Solar Package) Cost $238 (US$ 153) US$ 372 US$98 for controller & pre-pay meter Prepayment meter cost Not part of system US$ 270 Included above
7.0 Fees / Tariffs (F$) Monthly Tariff / household $2.0 (installation fee was F$20) $4.5 (Oct. ‘02 increased to $7.5) $14.0 Post Office fee n/a 0.5 + VAT 0.5 + VAT F$/m to Village Account $124.0 $1,179.4 $3,359.4 Meter system/Brand Not Applicable Suncash Conlog ( for Shell Solar) Note on Fees: Namara: Naroi: V Levu
Tariff collected & kept by Village Committee. Until 2004 DoE pays maintenance. Fee does not cover expected battery & CFL replacement. Fee is unrealistic, e.g., l8-years life battery requires 10 F$/month. Fee covers maintenance, repairs and replacements. Full life-cost recovery would be > $21.