Embed Size (px)
Citation preview
1. Introduction
Automated microscopy has facilitated the largescale acquisition of live cell image data [Sig06, Gor07,Dav07, and Bah05]. In the case of low magnificationimaging in transmission mode, the migration, morph-ology, and lineage development of large numbers ofsingle cells in culture can be monitored. However,obtaining quantitative data related to single cell behav-ior requires image analysis methods that can accuratelysegment and track cells. When fluorescence proteingene reporters are used, the activity of specific genescan be related to phenotypic changes at a single celllevel. The analysis of living, single cells also providesinformation on the variability that exists withinhomogeneous cell populations [Ras05 and Si206].
Furthermore, multiple fluorescence protein reporterstransfected into single cells can be used to understandthe sequence of transcriptional changes that occurs inresponse to perturbations. In order to facilitate theextraction of quantitative data from live cell image sets,automated image analysis methods are needed.
The diversity of both cell imaging techniques andthe cell lines used in biological research is enormousmaking the task of developing reliable segmentationand cell tracking algorithms even harder. Many popularcell tracking techniques are based on complex proba-bilistic models. In [Bah05] Gaussian probabilitydensity functions are used to characterize the selectedtracking criteria. In [Mar06] cells are tracked by fittingtheir tracks to a persistent random walk model based onmean square displacement. In [Lia08] the final cell
Volume 115, Number 6, November-December 2010Journal of Research of the National Institute of Standards and Technology
477
[J. Res. Natl. Inst. Stand. Technol. 115, 477-486 (2010)]
Overlap-Based Cell Tracker
Volume 115 Number 6 November-December 2010
Joe Chalfoun, Antonio Cardone,Alden A. Dima, Daniel P. Allen,
Software and Systems Division,
and
Michael W. Halter,
Biochemical Science Division,National Institute of Standardsand Technology,Gaithersburg, MD 20899
[email protected]@[email protected]@[email protected]
In order to facilitate the extraction ofquantitative data from live cell imagesets, automated image analysis methodsare needed. This paper presents anintroduction to the general principle of anoverlap cell tracking software developedby the National Institute of Standards andTechnology (NIST). This cell tracker hasthe ability to track cells across a set oftime lapse images acquired at high ratesbased on the amount of overlap betweencellular regions in consecutive frames. It isdesigned to be highly flexible, requireslittle user parameterization, and has a fastexecution time.
Key words: cell motility; live-cellimaging; overlap-based cell tracking;time-lapse cell imaging.
Accepted: July 13, 2010
Available online: http://www.nist.gov/jres
Editor’s Note: This paper is based on NIST IR 7663, Overlap-Based Cell Tracker. Most of the content remains the same.
trajectories and lineages are established based on theentire tracking history by using the interacting multiplemodels (IMM) filter [Gen06]. In [Kha05], a MarkovChain Monte Carlo based particle filter is used toinitially detect the position of the targets and then aRao-Blackwellized particle filter is applied. An impor-tant class of tracking techniques consists of level setmethods [Bes00, Man02, and Shi05]. They producefairly accurate tracking results but are difficult toimplement and computationally expensive. The track-ing techniques proposed in [Dor02, Ray02, Zim02] arecommonly referred to as active contour or snake tech-niques. In general they do not consider all possibletracking candidates in the frame, but focus on the can-didates corresponding to a predefined model (e.g.,located around a reference initial position). Finally,tracking techniques based on mean-shift algorithms pro-vide a fast solution, but often do not provide accurateinformation about object contours [Col03, Com03,Deb05]. Many available techniques are computationallyexpensive and have a large number of parameters toadjust for every track. We propose a new technique thatcan produce accurate tracking with a small set ofadjustable parameters in situations where cell movementbetween consecutive frames is limited so that there istypically some cell pixel overlap between frames.
Our experience shows that when acquiring time-lapse images at intervals ranging from 5 min to 15 min,the movement of cultured mammalian cells betweentwo consecutive frames will be relatively small. Thismeans that between consecutive frames a typical cellwill occupy nearly the same position. In order to effec-tively analyze large volumes of data (> 10 000 images)an automated process requiring very little manual inter-vention and involving a simple and meaningful set of parameters is needed. The overlap-based cell trackingsoftware developed by NIST was designed with thisgoal in mind. It tracks cells across a set of time lapseimages based on the amount of overlap between
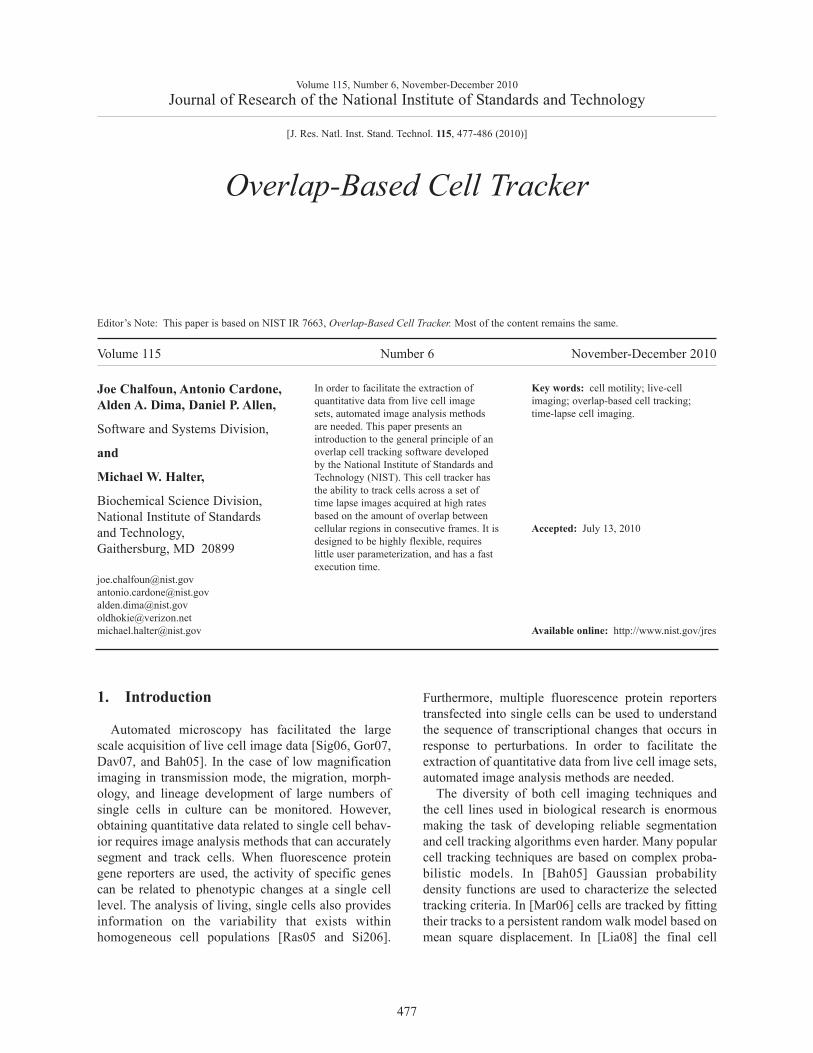
cellular regions in consecutive frames. It is designed tobe highly flexible and suitable for use in a wide range ofapplications, requires little user interaction during thetracking process, and has a fast execution time. Thoughit requires that the change in a cell’s location from oneframe to the next be relatively small to work reliably,acquiring images at 5 min to 15 min intervals is feasiblewith standard automated live cell imaging systems andprovides image data that is suitable for an overlap-basedalgorithm. The core tracking algorithm is shown inFig. 1.
In this paper, a general formulation of the motiontracking problem will be given, followed by a briefdescription of the input data and of the tracking criteriaemployed. Some instances of application of the track-ing software will be presented to further illustrate itscapabilities. We will conclude with a brief summary ofour results.
2. Problem Statement
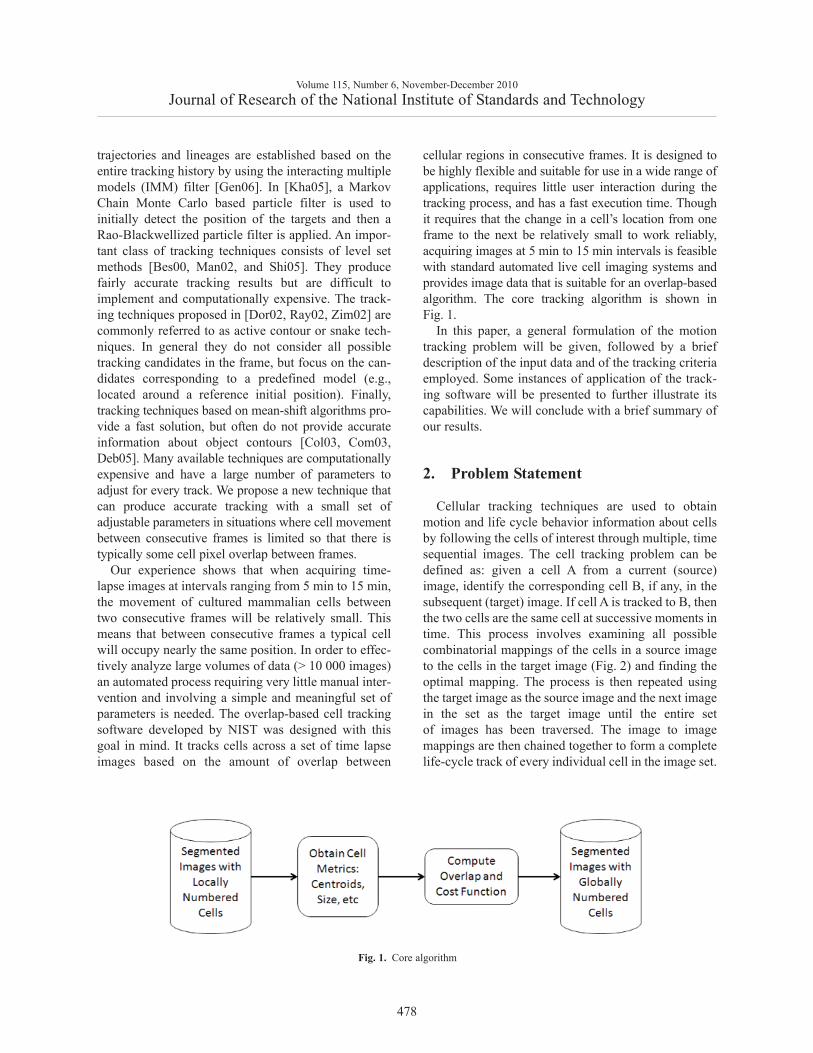
Cellular tracking techniques are used to obtainmotion and life cycle behavior information about cellsby following the cells of interest through multiple, timesequential images. The cell tracking problem can bedefined as: given a cell A from a current (source)image, identify the corresponding cell B, if any, in thesubsequent (target) image. If cell A is tracked to B, thenthe two cells are the same cell at successive moments intime. This process involves examining all possiblecombinatorial mappings of the cells in a source imageto the cells in the target image (Fig. 2) and finding theoptimal mapping. The process is then repeated usingthe target image as the source image and the next imagein the set as the target image until the entire set of images has been traversed. The image to imagemappings are then chained together to form a completelife-cycle track of every individual cell in the image set.
Volume 115, Number 6, November-December 2010Journal of Research of the National Institute of Standards and Technology
478
Fig. 1. Core algorithm
Many different types of imagery can be obtainedwith modern cellular microscopy instruments—in ourcase we will be working with phase contrast images ofNIH-3T3 fibroblasts, shown in Fig. 3 below.
3. Image Data and PreliminaryDefinitions
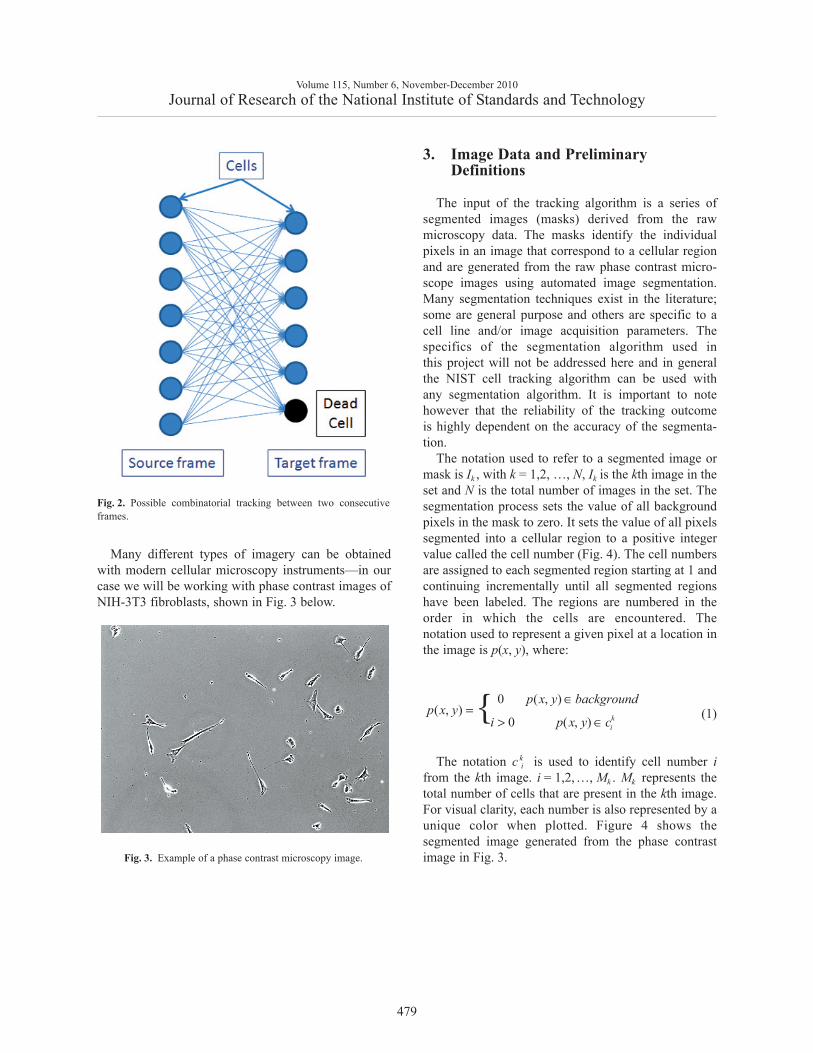
The input of the tracking algorithm is a series ofsegmented images (masks) derived from the rawmicroscopy data. The masks identify the individualpixels in an image that correspond to a cellular regionand are generated from the raw phase contrast micro-scope images using automated image segmentation.Many segmentation techniques exist in the literature;some are general purpose and others are specific to acell line and/or image acquisition parameters. Thespecifics of the segmentation algorithm used inthis project will not be addressed here and in generalthe NIST cell tracking algorithm can be used withany segmentation algorithm. It is important to notehowever that the reliability of the tracking outcomeis highly dependent on the accuracy of the segmenta-tion.
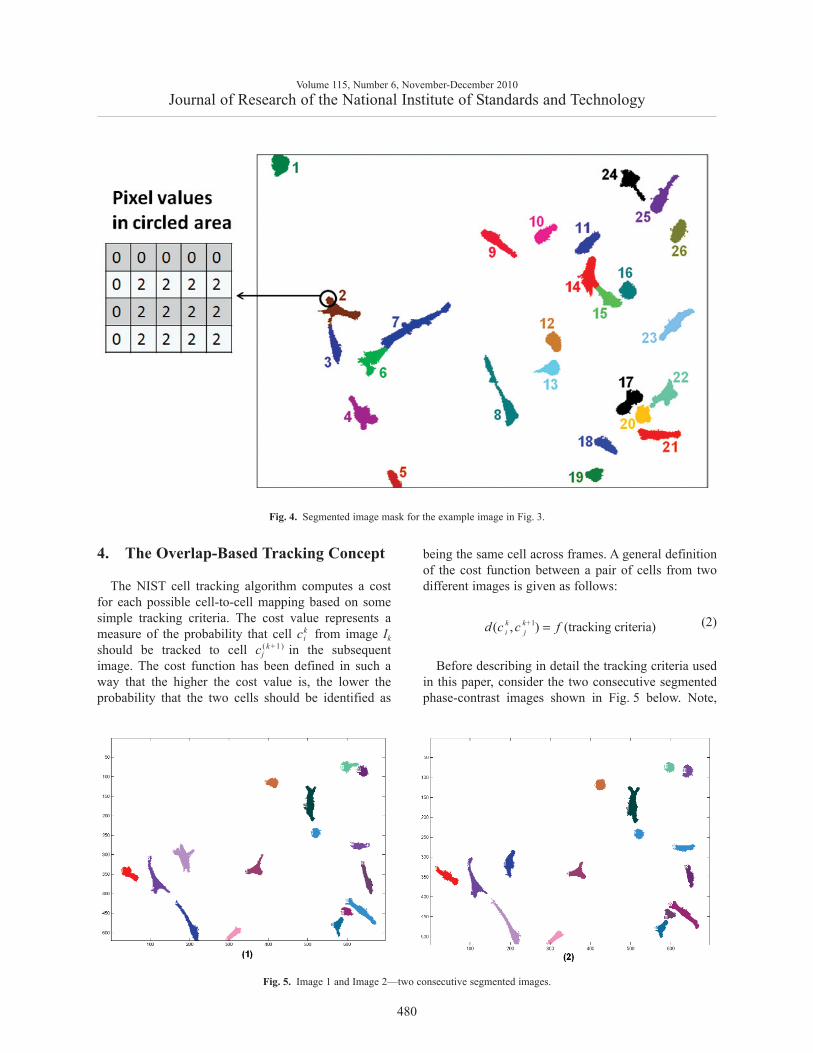
The notation used to refer to a segmented image ormask is Ik , with k = 1,2, …, N, Ik is the kth image in theset and N is the total number of images in the set. Thesegmentation process sets the value of all backgroundpixels in the mask to zero. It sets the value of all pixelssegmented into a cellular region to a positive integervalue called the cell number (Fig. 4). The cell numbersare assigned to each segmented region starting at 1 andcontinuing incrementally until all segmented regionshave been labeled. The regions are numbered in theorder in which the cells are encountered. Thenotation used to represent a given pixel at a location inthe image is p(x, y), where:
(1)
The notation c ki is used to identify cell number i
from the kth image. i = 1,2,…, Mk . Mk represents thetotal number of cells that are present in the kth image.For visual clarity, each number is also represented by aunique color when plotted. Figure 4 shows thesegmented image generated from the phase contrastimage in Fig. 3.
Volume 115, Number 6, November-December 2010Journal of Research of the National Institute of Standards and Technology
479
Fig. 2. Possible combinatorial tracking between two consecutiveframes.
Fig. 3. Example of a phase contrast microscopy image.
( , )p x y = { 0 ( , )p x y background∈
0 ( , ) kii p x y c> ∈
4. The Overlap-Based Tracking Concept
The NIST cell tracking algorithm computes a costfor each possible cell-to-cell mapping based on somesimple tracking criteria. The cost value represents ameasure of the probability that cell ck
i from image Ik
should be tracked to cell cj( k + 1 ) in the subsequent
image. The cost function has been defined in such away that the higher the cost value is, the lower theprobability that the two cells should be identified as
being the same cell across frames. A general definitionof the cost function between a pair of cells from twodifferent images is given as follows:
(2)
Before describing in detail the tracking criteria usedin this paper, consider the two consecutive segmentedphase-contrast images shown in Fig. 5 below. Note,
Volume 115, Number 6, November-December 2010Journal of Research of the National Institute of Standards and Technology
480
Fig. 4. Segmented image mask for the example image in Fig. 3.
1( , ) (tracking criteria)k k+i jd c c f=
Fig. 5. Image 1 and Image 2—two consecutive segmented images.
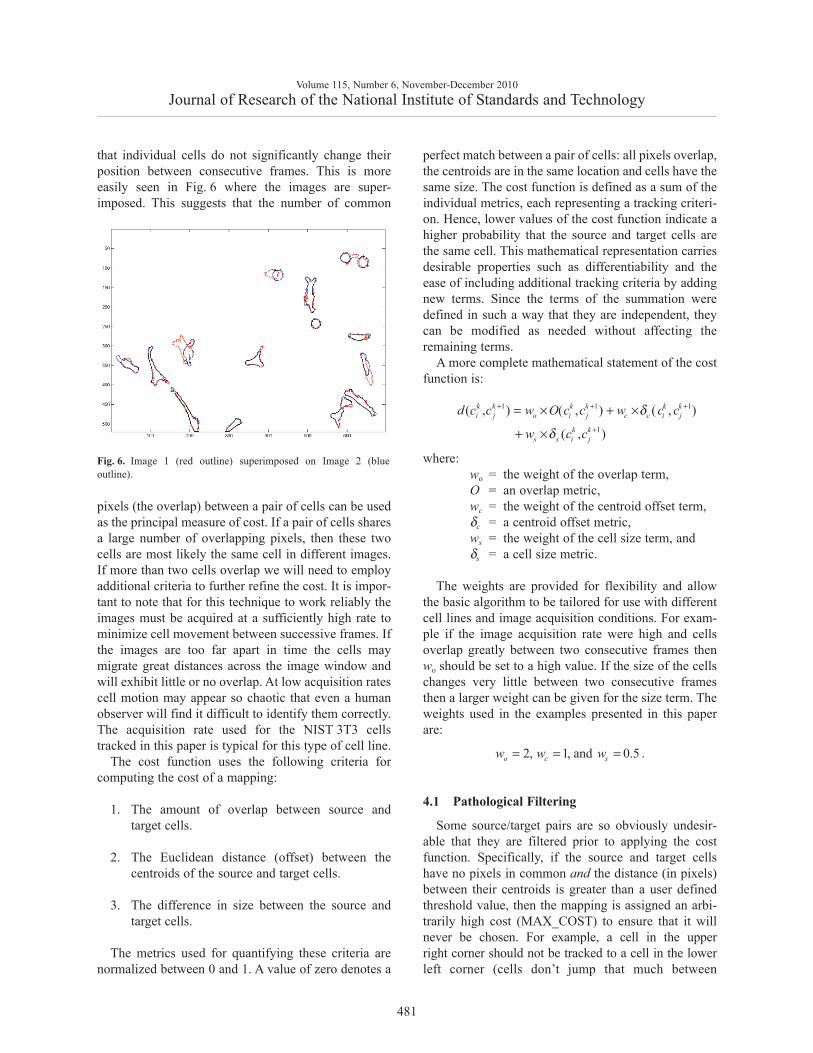
that individual cells do not significantly change theirposition between consecutive frames. This is moreeasily seen in Fig. 6 where the images are super-imposed. This suggests that the number of common
pixels (the overlap) between a pair of cells can be usedas the principal measure of cost. If a pair of cells sharesa large number of overlapping pixels, then these twocells are most likely the same cell in different images.If more than two cells overlap we will need to employadditional criteria to further refine the cost. It is impor-tant to note that for this technique to work reliably theimages must be acquired at a sufficiently high rate tominimize cell movement between successive frames. Ifthe images are too far apart in time the cells maymigrate great distances across the image window andwill exhibit little or no overlap. At low acquisition ratescell motion may appear so chaotic that even a humanobserver will find it difficult to identify them correctly. The acquisition rate used for the NIST 3T3 cellstracked in this paper is typical for this type of cell line.
The cost function uses the following criteria forcomputing the cost of a mapping:
1. The amount of overlap between source andtarget cells.
2. The Euclidean distance (offset) between thecentroids of the source and target cells.
3. The difference in size between the source andtarget cells.
The metrics used for quantifying these criteria arenormalized between 0 and 1. A value of zero denotes a
perfect match between a pair of cells: all pixels overlap,the centroids are in the same location and cells have thesame size. The cost function is defined as a sum of theindividual metrics, each representing a tracking criteri-on. Hence, lower values of the cost function indicate ahigher probability that the source and target cells arethe same cell. This mathematical representation carriesdesirable properties such as differentiability and theease of including additional tracking criteria by addingnew terms. Since the terms of the summation weredefined in such a way that they are independent, theycan be modified as needed without affecting theremaining terms.
A more complete mathematical statement of the costfunction is:
where:wo = the weight of the overlap term,O = an overlap metric,wc = the weight of the centroid offset term,δc = a centroid offset metric,ws = the weight of the cell size term, andδs = a cell size metric.
The weights are provided for flexibility and allowthe basic algorithm to be tailored for use with differentcell lines and image acquisition conditions. For exam-ple if the image acquisition rate were high and cellsoverlap greatly between two consecutive frames thenwo should be set to a high value. If the size of the cellschanges very little between two consecutive framesthen a larger weight can be given for the size term. Theweights used in the examples presented in this paperare:
4.1 Pathological Filtering
Some source/target pairs are so obviously undesir-able that they are filtered prior to applying the costfunction. Specifically, if the source and target cellshave no pixels in common and the distance (in pixels)between their centroids is greater than a user definedthreshold value, then the mapping is assigned an arbi-trarily high cost (MAX_COST) to ensure that it willnever be chosen. For example, a cell in the upperright corner should not be tracked to a cell in the lowerleft corner (cells don’t jump that much between
Volume 115, Number 6, November-December 2010Journal of Research of the National Institute of Standards and Technology
481
Fig. 6. Image 1 (red outline) superimposed on Image 2 (blueoutline).
1 1 1
1
( , ) ( , ) ( , )
( , )
k k k k k ki j o i j c c i j
k ks s i j
d c c w O c c w c c
w c c
δ
δ
+ + +
+
= × + ×
+ ×
2, 1, and 0.5 .o c sw w w= = =
consecutive frames). By definition mappings with acost of MAX_COST are invalid. This filtering isderived from common sense and experience with cellbiology and cell morphology.
4.2 The Overlap Metric
The overlap metric for a source/target pair is a meas-ure of the number of pixels the two cells have in com-mon between two consecutive frames. It is computedusing the formula:
where:
ski = the size in pixels of the source cell,
sj(k+1) = the size in pixels of the target cell, and
no(cki , cj
(k+1)) = the number of pixels the two cellshave in common.
4.3 The Centroid Metric
The centroid metric is a measure of the Euclideandistance between the centroids of the source and targetcells between two consecutive frames. Let the widthand height (in pixels) of a frame be represented by thesymbols Iwidth and Iheight and denote the centroid co-ordinates (in pixels) of cell i in frame k by the symbols
(Xki , Yk
i ). The centroid metric for a source/target pair iscomputed as:
4.4 The Size Metric
The size metric is a measure of the relative differ-ence in the sizes of the source and target cells in twoconsecutive frames. It is computed as:
4.5 Tracking Solution
Once the individual cell mappings between con-secutive frames have been computed, the frame-to-frame mappings are combined to produce a completelife cycle track of all the cells in the set of images. Thesequentially assigned cell numbers given by thesegmentation process for the cells in each frame arereplaced with uniquely numbered track numbers thatidentify the movement of each cell in time across theentire set of images. Therefore a unique track number tn
will be associated to each uniquely identified cell,n = 1,2, …, T where T represents the total number ofunique cells found in the image set. The pixels in theimages are relabeled to reflect the new track numbers
Volume 115, Number 6, November-December 2010Journal of Research of the National Institute of Standards and Technology
482
11
1
( , ) 1 1( , ) 12
k ko i jk k
i j k ki j
n c cO c c
s s
++
+
⎡ ⎤⎛ ⎞= − +⎢ ⎥⎜ ⎟⎜ ⎟⎢ ⎥⎝ ⎠⎣ ⎦
1 2 1 21
2 2height width
( ) ( )( , ) .
k k k ki j i jk k
c i j
X X Y Yc c
I Iδ
+ ++
− + −=
+
11
1
| |( , ) .
max( , )
k ki jk k
s i j k ki j
s sc c
s sδ
++
+
−=
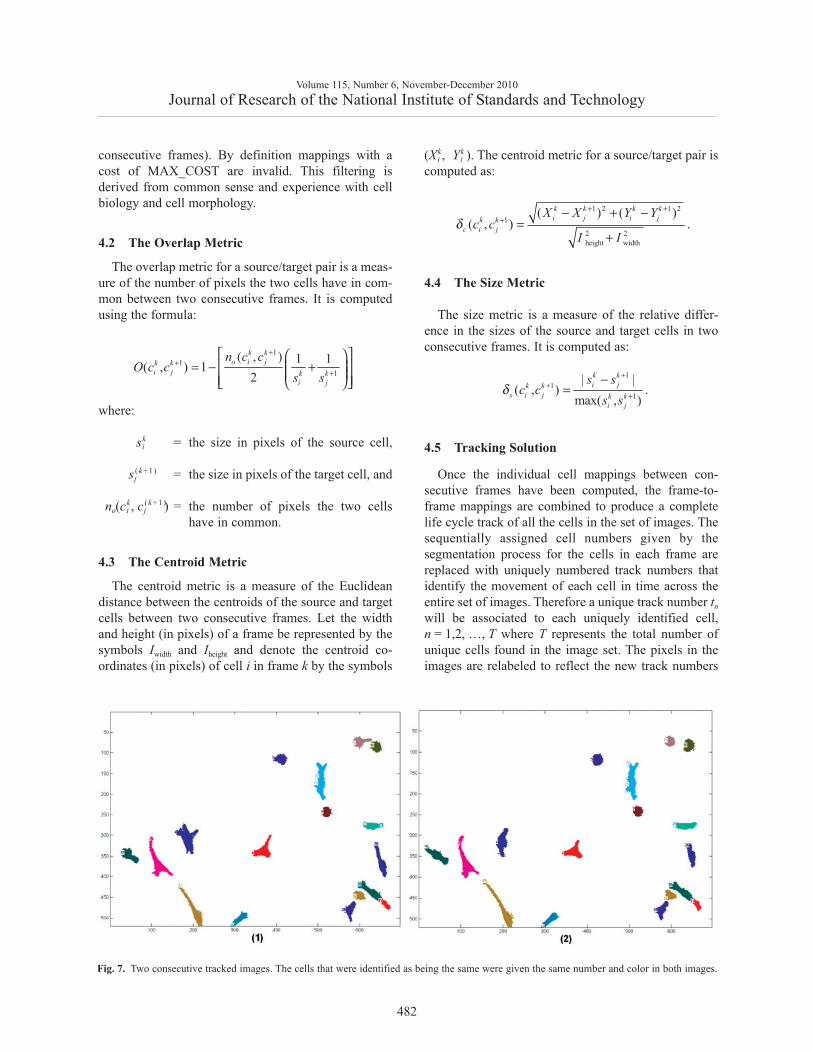
Fig. 7. Two consecutive tracked images. The cells that were identified as being the same were given the same number and color in both images.
such that when a pair of cells has been assigned with atracking number the pixels from all images that belongto a given cell will all have the same value.
In Fig. 5, in each segmented image, the cells werenumbered randomly from 1 to max. When these cellsare given a global number, they will carry the samenumber thru time. Figure 7 shows that this is also
reflected by the colors of the cells, the same cell willhave the same color throughout the images.
5. Results and Outputs
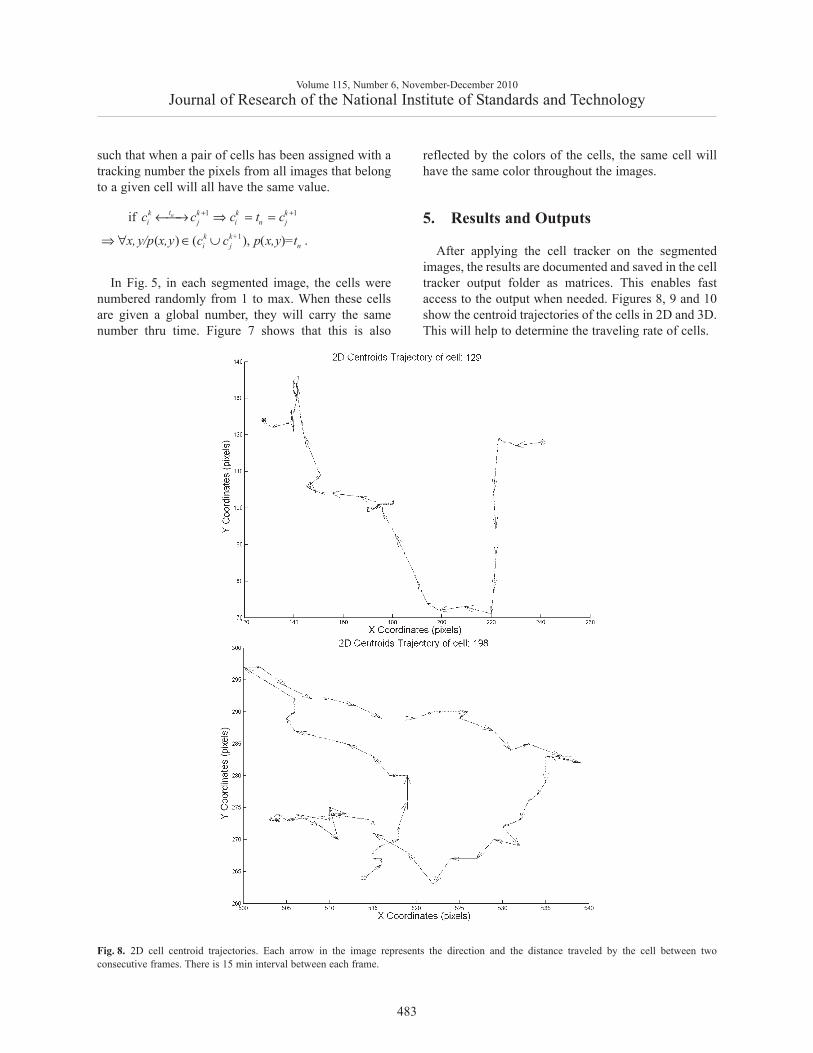
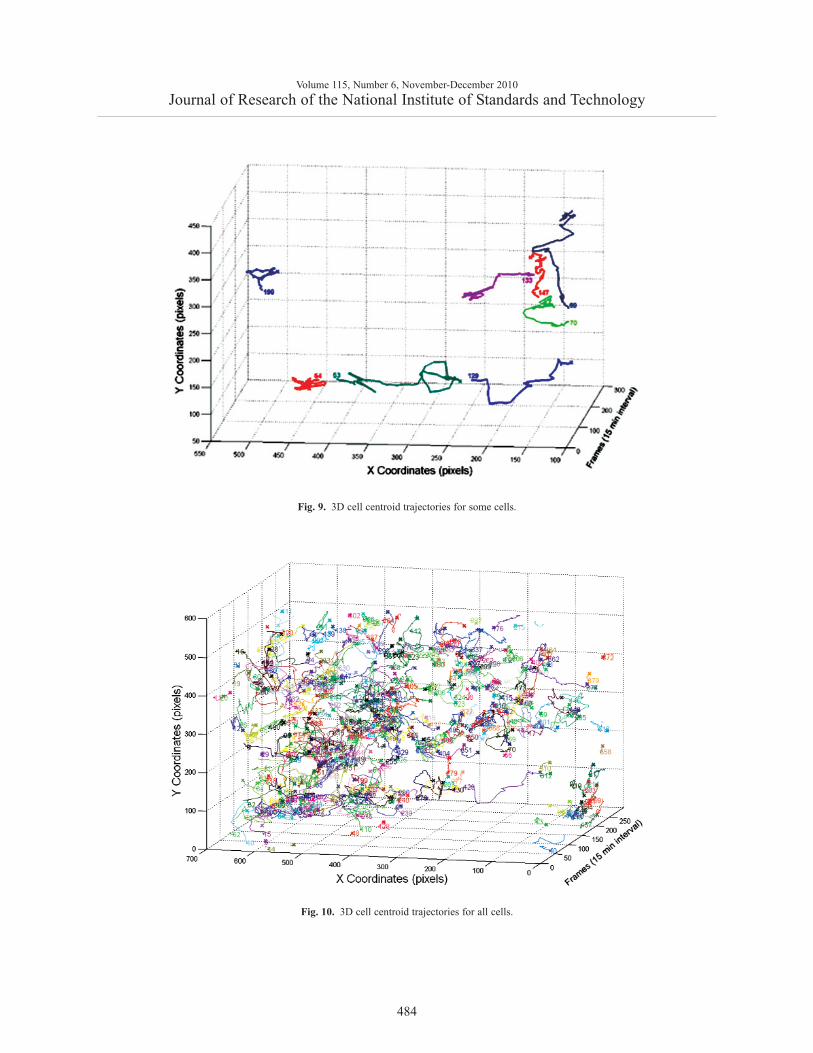
After applying the cell tracker on the segmentedimages, the results are documented and saved in the celltracker output folder as matrices. This enables fastaccess to the output when needed. Figures 8, 9 and 10show the centroid trajectories of the cells in 2D and 3D.This will help to determine the traveling rate of cells.
Volume 115, Number 6, November-December 2010Journal of Research of the National Institute of Standards and Technology
483
1 1
1
if
( ) ( ), ( )= .
ntk k k ki j i n j
k k+i j n
c c c t c
x, y/p x,y c c p x,y t
+ +←⎯→ ⇒ = =
⇒ ∀ ∈ ∪
Fig. 8. 2D cell centroid trajectories. Each arrow in the image represents the direction and the distance traveled by the cell between twoconsecutive frames. There is 15 min interval between each frame.
Volume 115, Number 6, November-December 2010Journal of Research of the National Institute of Standards and Technology
484
Fig. 9. 3D cell centroid trajectories for some cells.
Fig. 10. 3D cell centroid trajectories for all cells.
6. Conclusion
An overlap cell tracking software developed byNIST was described. This cell tracker has the ability totrack cells across a set of time lapse images acquired athigh rates based primarily on the amount of overlapbetween cellular regions in consecutive frames. It wasdesigned to be highly flexible, requires little user para-meterization, and has a fast execution time.
Future enhancements are planned for the cell tracker.The ability to detect mitosis (when a source cell dividesinto two new cells) will be added along with capabilityof detecting colliding cells and giving a feedback tosegmentation when such behavior occurs. A cell shapemetric will be used to add a shape weight to the costfunction. This metric was not needed for tracking the3T3 fibroblasts as they typically change shape rapidlybetween consecutive frames. However, a shape-basedmetric is in general needed to improve the tracking ofcell lines or other objects that are more morphological-ly stable and it should increase the cell tracker’ssuitability for use in a wider range of applications.
The average computation time for tracking 500 cellsin our set of 252 images (520 × 696 pixels) on a singlecore Pentium 3.4 GHz 3 GB RAM is 47 s. This trans-lates to an average speed of 5.36 frames/s.
7. References
[Bah05] A. Bahnson, C. Athanassiou, D. Koebler, L. Qian,T. Shun, D. Shields, H. Yu, H. Wang, J. Goff, T. Cheng,R. Houck, and L. Cowsert, Automated measurement ofcell motility and proliferation, BMC Cell Biology 6(1):19 (2005).
[Bes00] S. Besson, M. Barlaud, and G. Aubert, Detection andtracking of moving objects using a new level set basedmethod, In Proc. of the International Conference onPattern Recognition 3, 1100-1105 (2000).
[Col03] D. Comaniciu, V. Ramesh, and P. Meer, Kernel-basedobject tracking, IEEE Transactions on PatternAnalysis and Machine Intelligence 25(5), 564-575(2003).
[Com03] R. Collins, Mean-shift blob tracking through scalespace, In Proceedings of Computer Vision and PatternRecognition (CVPR’03), 234-241 (2003).
[Dav07] P. J. Davis, E. A. Kosmacek, Y. Sun, F. Ianzini,and M. A. Mackey, The large-scale digital cellanalysis system: an open system for nonperturbinglive cell imaging, J. Microsc. 228 (Pt. 3), 296-308(2007).
[Deb05] O. Debeir, P. Van Ham, R. Kiss, and C. Decaestecker,Tracking of migrating cells under phase-contrast videomicroscopy with combined mean-shift processes,IEEE Transactions on Medical Imaging 24(6), 697-711(2005).
[Dor02] D. Dormann, T. Libotte, C. J. Weijer, and T.Bretschneider, Simultaneous quantification of cellmotility and protein-membrane-association using activecontours, Cell Motility and the Cytoskeleton 52,221-230 (2002).
[Gen06] A. Genovesio, , T. Liedl, V. Emiliani, W. J. Parak,M. Coppey-Moisan, and J. C. Olivo-Marin, Multipleparticle tracking in 3-D+t microscopy: Method andapplication to the tracking of endocytosed quantum dots,IEEE Transactions of Medical Imaging 15, 1062-1070(2006).
[Gor07] A. Gordon, A. Colman-Lerner, T. E. Chin, K. R.Benjamin, R. C. Yu, and R. Brent, Single-cell quantifi-cation of molecules and rates using open-source micro-scope-based cytometry, Nat Methods 4,(2), 175-181(2007).
[Kha05] Z. Khan, T. R. Balch, and F. Dellaert, MultitargetTracking with Split and Merged Measurements, InProceedings of 2005 IEEE Computer SocietyConference on Computer Vision and PatternRecognition, (1), 605-610 (2005).
[Lia08] K. Lia, E. D. Millera, M. Chenb, T. Kanadea, L. E.Weissa, and P. G. Campbella, Cell population trackingand lineage construction with spatiotemporal context,Medical Image Analysis 12(5), 546-566 (2008).
[Man02] A. Mansouri, Region tracking via level set PDEs with-out motion computation, IEEE Transactions on PatternAnalysis and Machine Intelligence 24(7), 947-961(2002).
[Mar06] L. Martens, G. Monsieur, C. Ampe, K. Gevaert, andJ. Vandekerckhove, Cell-motility: a cross-platform,open source application for the study of cell motionpaths, BMC Bioinformatics 7, 289 (2006).
[Ras05] J. M. Raser, E. K. O’Shea, Noise in gene expression:origins, consequences, and control, Science 2005, 309(5743) (2010-2013).
[Ray02] N. Ray, S. T. Acton, and K. Ley, Tracking leukocytes invivo with shape and size constrained active contours,IEEE Transactions on Medical Imaging 21(10), 1222-1235 (2002).
[Set99] J. Sethian, Level Set Methods and Fast MarchingMethods, New York: Cambridge Univ. Press, (1999).
[Shi05] Y. Shi and W. C. Karl, Real-time tracking using levelsets, Proceedings of the IEEE Computer SocietyConference on Computer Vision and PatternRecognition 2, 34-41 (2005).
[Sig06] A. Sigal, R. Milo, A. Cohen, N. Geva-Zatorsky,Y. Klein, I. Alaluf, N. Swerdlin, N. Perzov, T. Danon,Y. Liron, T. Raveh, A. E. Carpenter, G. Lahav, andU. Alon, Dynamic proteomics in individual human cellsuncovers widespread cell-cycle dependence of nuclearproteins, Natl. Methods 3(7), 525-531 (2006).
Volume 115, Number 6, November-December 2010Journal of Research of the National Institute of Standards and Technology
485
[Si206] A. Sigal, R. Milo, A. Cohen, N. Geva-Zatorsky,Y. Klein, Y. Liron, N. Rosenfeld, T. Danon, N. Perzov,and U. Alon, Variability and memory of protein levels inhuman cells, Nature 444, (7119), 643-646 (2006).
[Zim02] C. Zimmer, E. Labruyere, V. Meas-Yedid, N. Guillen,and J. C. Olivo-Marin, Segmentation and tracking ofmigrating cells in video microscopy with parametricactive contours: A tool for cell-based drug testing,IEEE Transactions on Medical Imaging 21(10), 1212-1221 (2002).
About the authors: Joe Chalfoun and AntonioCardone are Research Associates, Alden Dima is aComputer Scientist, Daniel Allen was a ComputerSpecialist prior to his retirement. All are with theSoftware and Systems Division of the InformationTechnology Laboratory of NIST. Michael Halteris a Research Scientist with the Biochemical ScienceDivision of the Material Measurement Laboratoryof NIST. The National Insitute of Standards andTechnology is an agency of the U.S. Department ofCommerce.
Volume 115, Number 6, November-December 2010Journal of Research of the National Institute of Standards and Technology
486