Embed Size (px)
Citation preview
:COPY _
:11397 Type:LLINGNESS TO PAY FOR WATER ITAF, MIR ANJUM
Dept.: byS ANJUM J hYMir AnjiUm Altaf, ;HarOOn Jamal,-md Dale Whittington. ,
U~~~~~~~~~~Ž
,-- ~N X
(0
-~~,
caco -DID Q U.
| g os~~~~
0 1992 The Interntonal Bank forRecostrwucdon and Developmenhe World Bank1818 H Street, NWWashington, DC 20433 USA
Cover photo: Mir Anjum Altaf
Manufactwred in the United ates of Amedica
Mme UNDP-Word Bank Water and Sanitation Pogrm was oaized as a joint endeavor of te UnitedNations Development P_gramme and the World Bank and bas been one of the primary playes inwoddwide efforts to meet the challenge of providing basic water supply and sanitation services to thosemost in need in the developlne wodd. Pawem in this venture a the developing countres themselvesand the muldlakral and bitera agencies that fund the Progam's actvies.
Me UNDP-Wodd Bank Wster and Sanition Progfam produces its own publications and also reeaswoks nder the auspices of the Wotid Bank. lhe Prgas publicatos ane divided into two seris,a Water and Sanitation Prgram Repast seies and a Wat and Saniatn Dicsion Paper series.Ihe Pogmam Report sedes pets formal discussions of the Program's opeations and research activitiesas well as exminations of relevat projects and tds withi the water and saniaton setor. ProgramReports are subject to dgorous extenal review by independet authorties from apprprate fields. TheDiscussion Paper series is a less foml meas of communic timely and topical o De,vation,findings, and opinions concening Progam activities and sector issues.
nhe docunout ha bas pnpd and pied by do UNDPWadd Bank W S o Pg Water and SanitatoeDivhon, Iaftrauim aUd Uaa Dswlopmea puaumn, th WoWdd BEL Copies may be obined t Wser adantda DM Mathe may be quotd with pre atlubutlm s findelp, interpedon% and c_du,o expaed In
tb paper a tdWy toe of th anto and shoud n be atibuted any wa to he UNDP-Wodd B Waer andSan Prgm, the United Natos D opa Progrmme, t Wodd ank or any afiad oMy mps thaampany th. text havbeen piepa solely for the onvenienceof the medete designaton presetati of marl inthem do not Imply the ep on of any opinionaoe n the pat of the UNDP-Wodd Bak Wat and Santtion Progm,the United ionsd De roann the Wodd Bnk, or any alaed onlo
Table of Contents
Table of Contents .... ii
A.clwledgnients .... via
Exeutiw Summa ry.x
1. Introducion ........... . 1Objectives . . .1...... Policy Ove.ew... Ilstitutional Responsibilities. . . 2Levels of Service and System Costs. . . 2Tariffs ... 3ut Plas ..................................... 4
2. Study Design Methodology, and SiteSelection ............................. ,Study Depsi S..5Methodology .. 5Site Selection.. 6Sampling WiJ Vg.es 7...7General Description of the Study Areas .. 7Sheikhmupra, Fasaabad and Rawalpid Ditrcs 8. .8
3. Analytical Overview .11Principal Unes.of nquiry .. 11A.ctalChoice Behavior ...................-.-.-.-.--. 11HypotheticalChoice Behavior .. ............................ 11Economic Viability of LInvestment ln Rual Water Supplies .. .......... 12Description of Vadables Used in the Analysi ......... ........... 12Explanationnd Rationale of ndependent Varabks ....... ......... 14Estimation Techniques ............. . 18
4. Sweet Water Zone: Overview and Field Procedur. .21Policy Issues .. 21Water in the Sweet Water Zone .. 21Selecion of theStudy Viages .. 22The Questic,aire and Bidding Games. 23Conducting the Survey .. 25
5. Fmdings in the Sweet Water Zone: Analysis of Actual Choice Behavlir .27Upgraing Service Levels. . . 27Who Instas Electic Mbotoa?.. 27Who CDnnects to Piped WaterSystem? . . . 28Electric Motor and Household Connection as Alteatdve Choices. 29
Program Reo Series iiJ
6. Findings in the Sweet Water Zone: Analysis of Willingpess-to-Pay Bids ............ 31Hypothetical Choice Behavior ............................... 31Service Options Offered .................................. 31Response of Households in Villages without an Operationa! Water
System ........................................... 32Response of Households in Villages with an Operational Piped Water
System ........................................... 33
7. Estimated Revenues and Cost Recovery Potential .. ........................ 37Provision of a Standard Piped Water System in Villages Familiar with
Such Systems ........ . ........................ 37Provision of a Standard Piped Water System in Vllages Unfamiliar
with Su Systems ...................... 39Provision of an Improved System in Villages with an Existing Piped
Water System ....................................... 40Experiments with Altemative Financing for Household Connections .... ... 41
& Bracldsh Water Zone: Overview and Field Pcedures ......................... 43Selection of Study Villages ................................ 44Description of the Questionnaire and Bidding Games ................ 44Conducting the Survey ............... ................ 45
9. imdings in the Braclsh Water Zone: Analysis of Actual Choice Behavior .... ....... 47Who Installs Electric Motors? .............................. 47WhoCo nnus to Piped Water Systems? ........................ 48Electric Motors and Household Connectios ..................... 49
10. Fndings in the Brackish Water Zone: Analysis of Willingn, )-Pay Bids .... ...... 51Wfillingness to Pay for Connection to a Stands._- _ystem .... ......... 51Willingness to Pay for Connection to an Improved System .... ........ 52Response of Households in Villages with and without Operational
Piped Water Systems .................................. 53Response of Unconnected Households in Type A Villages ..... ........ 54
11. Estimated Revenues and Cost Recovery Potential .......... 55. .......... SSCosts of Piped Water Systems ................. .. . ......... 55Pwvision of a Standa Piped Water System ..................... 55Provision of an mptoved Piped WaterSystem .... 5................ 55Comparison of Standard and Improved Piped Water Systems .... ....... 58
12. Arid Zon: Overvew and Field Procedures .............................. 61Selection of Study Villages ................................ 62Description of the Questionnaire and Bidding Games ................ 63Conducting the Survey ................................... 64
13. Fmdings in the Arid Zone: Analysis of Willingoess-toW-Pay Bids ................. 65ServiceOptions Evaluated ................................. 65Response of Households in Vi-llges without Plans for Istaation of
Public WaterSystems .................................. 65
iv UNDP-World Bank Water and Saiation Ptogran
Willingness to Pay for Connection to a Standard PHED System withHouse Connections .................................... 66
Wlingness to Pay for an Improved Piped Water System with HouseConnCtios ................. 66
Multivarate Analysis of Willingwess-to-Pay Bids for Piped WaterSystems ............ 67
14. Esimated Revenues and Cost Recovery Potential ............ 71Costs of Piped Water Systems ........... 71Provision of a Standard Piped Water System ...... ...... . 71Provision of an Impoved Piped Water System ..... ........ 73Provision of a Piped Water System Based on Public Taps .74
15. Concusions and Policy Suggesions .79The Nature of Demand for Water in Rural Areas .79Private Upgrnding af Service in Central Punjab .79Ihe Ecnomics of VMage Water Supply Options .................. 81The Arid Zone .82Discussion .83
References .......... 87
Appenidi8es.
Appendix A .. 91A1 Village Pofiles ............................ ........... 91A.2 Rage Pofiles ......... 92A3 Profiles by Vilage and Household Type ......... 93A.4 Patem of Household Choice over Available Service Options and Approximate
Private Costs ......... 94A.5 Reasons Mentioned by Households for Obtaining a Domestic Connection to
Piped Water System ......... 95A.6 Reasons Mentioned by Households for not Obtning an Domestic
Connection-Type A Village ......... 95A.7 Relationship between Economic Standing and Choice of Service Level-Type
A Village ......... 96A 8 Level of Satsfaction with Piped Water Supply System-Type A Village .... 97A.9 Major Shortomings of Piped Supply System Mentioned by Households-Type
A Vi-lage ............................................ 97A.10 Most Important Improvement in Piped Supply System Desired by
Households-Type AVillage ................................ 97A1ll Household's Infonmation/Beliefs Regarding Characteristics of Piped Water and
Altendve Supply Systems .98A12 Number of Years Households Would Keep Handpumps Operational If a Piped
Water Supply System Eisted in Their Viad ge.99A13 Household Preference Regrding Responsibility for Operation and Management
of Piped Water Supply Systems .99
Program Report Seria v
Appedi B ... ................................................. 100B.1 Decision to Install an Electric Motor. Results of a Logit M o del .......... 101B.2 Decision to Connect to a Piped Water Supply System: Results of a Logit
M%odel .............................................. 102B3 StatiscAnalysis of Willingness to Pay for a Standard Piped Water Supply
System: Resuts of Oibm Last Squas Regr-asion Model .... ....... 103B.4 Statistical Analysis of Willingess t Pay for an Improved Piped Water Supply
System by Households in Villages with an Existing Piped Water Supply System:Results of an Ordiny Lest Squares ReL,:ession Model .... .......... 104
Appendix C ...... 1............... l0Sel Distributon of Wilingnss-to-wPay Bids for a Standard Piped Water System in
ViDages without an Operationd Piped Water Supply ................. 105C.2 Distribution of WTP Bids for a Standard Piped Water System with a Flexible
Financing Arrangement in Villages without an Operational Piped WaterSupply .106
C3 Distibution of W7? Bids for an Improved Piped Water Supply in Villages withan Operational Piped Water System ........................... 107
CA4 Conection Fequcies and Esimated Revenues: Provision of a Standard PipedWater System in a Type B Village ........................... 108
C5 e Frequencies and Esimated Revenues: Provision of a Standard PipedWater Supply System in a Type B2 Village ...................... 108
C6 Frequencies and Estimated Revenaes: Prvision of an ImprovedPiped Water Systom in aTypeA Village ........................ 109
C:7 on Frequenies and Estimated Revenues: Responses to Different Optionsby Unconneted Households in a Viuage with an Operational Piped WaterSupply ............................................... 109
Appeadix D ........................ ............................ 110D.1 Vilage Pioffies ........................................ 110D2 Vfbg Prfles ........................................ 111D3 Profies by V age and HouseholdType ........................ 112I.A Patern of Household Choe over Available Service Options and Approximate
Private Costs . ......................................... 113D.5 Reasons Menticaed by Households for Obtaining a Domestic Connection-Type
A Vage . ........................................... 114D.6 Reaso Mentioned by Households for Not Obtaining a Domestic
Connection-Type A Villge ................................ 114D.7 Relationship betwen Economic Standing and Choice of Service Level-Type
A Vma e. ........................................... 115D.8 Level of Satisfacion with Piped Water Supply System-Type A Village .... 115D.9 Major Sorcomis of Piped Water Supply System Mentioned by
Houshods-Type A Village ................................ 116D.10 Extent of Informion Regrding Parameters of Piped Water Systems .117D.11 CoSt of Piped Water Systes ............................... 118D.12 PaRceptionsRegading Ouaityof Water ......................... 118D.13 Housebold Pefence Regardi Responsibility for Operations and Maintenance
of Piped Water Sysems ............................... 119
w UNDP-Warld Bank Water and Saton Pnun
Appedix E .. ........... .......... * 120E.1 Deson to lns ll and Blectic Mor Results of a lsogt M iodel . 120E.2 Decision to Connc to a Piped Water Supply System: Resuts of a Logit
Mlodel .................................... 121E3 Statisical Analysis of Wilingle to Pay for a Standard Piped Water System:
ResultsofOrda Ir astSquaresRegressioModel.... 122EA Satitcal Anays of W1nges to Pay for an Ipoved Piped Water System:
Resulth )rdinarye Lat SquasRegression Mo .. 123E5 Statisti Analysb of Wilingnes to Pay fot a Stad Piped Water
System-4ype A Vilage: Results of Ordnay LAst Squares Regressionkodl ....... ...... 124
EA S"tisdc Analysi of WMilige to Pay for an Impwved Piped WaterSystem-Type A VWage: Results of OWiny Last Squas RegresionMiodel .. 125
E7 Statsticad Analyss of Wihlgns to Pay for a Sandad Piped WaterSystem-Type B Vilag: Resuls of Ordinay Last Squams RegssdonModel .126
Appdi F .127
F.1 Distrbutionof WTP BisforaSSmndadPiped W. System .127P.2 Distributl ofWBi dsforanImprvWd Pped WatrSystm .128F3 Disribuo of WTP Bib for a Sandad Piped Water System with Altenive
1naclngArngsanaitn:A2 Househds. .129F.4 Distribution of WIP Bids for Sandud and Impred Piped Wat Systems in
Vilags with Opetatin,Piped WaterSysm. .130F5 Connecton Frequewcs and Estmated Revenues: Pomiion of a Sandard Piped
WaterSystm .131P.6 Cnntion Frequencies and Esmated Reenws: Prvision of an Improved
Piped Water Sysm .. 131F.7 CFrequednces and Esnaed Revenues: Provision of Opis to A2
Households..132
Appdi 0 ........ 1330.1 ViasgeProfles .. .1330.2 VflUgePoi. ...s. . . 13403 Profiks by Vdilage Type . . .1350.4 Lev of Satisfaction with Piped Watr Supply System-Type A Villpag 136G5 Major Shortcoming of Piped Supply Systm Mentioned by Conneed
Housekolds-.Type A Vilg.s,.. . . 1360.6 Cost ofPiped Water SystemsintheArdZone . . .1370.7 Reasons Mentond by Househbol for Obmining a Domesic Connecion-Type
A VIag ........................... 1370. Extent of Infomadon Regading Pametem of Piped Water System.1380.9 Hueold Pefence Rprding Reqpnblt for Opetion sad Mainte
of Piped WatwSyftm .... . .139
Appeai H......... 140
Progm Repot Series *i'
H.2 Statistical Anl8ysis of Willingness to Pay for a Standard Piped WaterSystem-Type B2 Villages: Results of Ordinary Least Squas RegressionMIOdel ... 141
H.3 Statistical Analysis of Willingpess to Pay for a Standard Piped WaterSystem-Type Bl Villages: Results of Ordinary Least Squares RegressionMIodel .142
HA Statistia Analysis of Willingmss to Pay for an Improved Piped WaterSystem-Typo B1 Villages: Results of Ordinary Least Squares RegressionModel ... 143
H.5 Statistical Analysis of Willingness to Pay for a Standard Piped WaterSystem-Type A Villages: Results of Ordinary Least Squares RegressionModel .. 144
H.6 Statistcal Analysis of Wingess to Pay for an Improved Piped WaterSystem-Type A Villages: Results of Ordnary Least Squares RegressionModel .. 145
Appendix I .. 146I1 Distribution of WTP Bids for a Public Tap System and a Standard System with
House Connections in Viliages without Plans for Instaliation of Public WaterSupplies ... 146
I2 Distribution of WTP Bids for a Standard Piped Water System with HouseConnections in Types A, BI, and B2 Vilages .147
13 Distribution of WTP Bids for an Improved Piped Water System with HouseConnections in Types A and B1 Viflages .147
14 Comection Frequencies and Estimated Revenues: Provision of StandaWd PipedWater System with House Conections in Types A, Bi, and B2 Villages 148
I5 Conmection Frequencies and Estimated Revenues: Provision of Improved PipedWater Systms with House Connections in Types A and B1 ViUlages .148
1.6 Connection Frequencies and Estimated Revenues: Provikon of Public Taps andStandard House Connections in Type B2 Villages ....... ............ 149
Anppdix J ............................................ 15OJ.1 Comparative Size of Rural Localities in the Three Environmental Zones by
Pooulaten Size (1981) .15O3.2 Sources of Water and Light in the Tbree Environmental Zones (Percentage of
Housing Unitswith Access,1981) ............ ................ 151J3 Occupational Profile of the Three Environmental Zones ..... .......... 15134 Financial Cost (Rs) to an Average Household for Different Serice Options
(Brekish Water Zone) .152J5 Households' Choice of Sevice Level by Soieconoric Characterstics (Villages
with PipedWata Supply) .1531.6 Mean WTP Bids for House Connections as a Percent of Household Income . . 154J.7 Costs of Village-Level Water Supply Options (Rs) .................. 1553.8 Cbsts of Vlllage-Lvel Water Supply Options (Rs) ....... ........... 156J.9 Compamtiver Features of the ThreeEnvironmental Zones .... .......... 1573.10 Comparative Water-Related Characteristics in the hree Environmental Zones . 1583.11 Mean Willingness-to-Pay Bids for Monthly Tariff of Piped Water Systems with
HouseCoCDecdons in the Three Zones ...... ................... 159
vli UINP-Worid Bw* Water and Sati Progrm
J.12 Actual and Hypothetical Frequency of Connection to Piped Water Syswms withHouse Connections in dhe Three Zones .................... . .. 160
J.13 Households' Willingness to Pay for connecion to Piped Water System bySocioeconomic Chacmtetistics (Villages without Piped Water Supply) .... .. 161
Maps ................................ 163Sheikahupa District .. 163F5saiabad District . ......... 16.RawalpindiDistrct .................. 1
Progrm Report Seris ix
Acknowledgments
We Wold like to thank a the officials of the Public Health Engineeting Dqprlmentgovernment of the Punab for their cooperation in the execution of this study.
Our fieldwork was made possible by a number of village facilitaos who ovexendWthemselves in familiarizing us with both the isues and the people in the varous field sites. We wouldlike to record our appreciation for the enthusiasm and courtesy of the following Individuals: Mr. ShaflShad, Haji Sarda Mohamimad, Mr. Mohammad Asghar, Mr. Nazir Ahmed Wattoo, ChaudhryMohammad Afial, Master Mohammad Aishad, Mr. Mohamme Nawaz, Chaudhry Mansab Dad, Mr.Abdul Rahim, Chaudhry Selman, and Dr. Mobammad Raza.
We wish to express our thanha lo the following supervisorsenumerators for the haul work andthe many ideas they contnbuted: Mr. Shafi Ahmed, Mr. Amjad Ali, Mr. Asif Hashm i, Mr. MohammadRamzan, Mr. Mohnmad Akbar, Mr. Moquet Ahsan, Mr. Obaid Ullah, Mr. Shaukat Alh, Mr. KashifHaya4 Mr. Shujaat Yaqoob, Mr. Aqeel tirmir , Mr. Sheraz Zafar Butt, and Mr. Amjad Tikm.
Mr. Arif Hasan fmiliaized us with the issues in the rual water supply sector and advised Inthe site selection; data entry was perforned by Shafi Ahmad; research assistance was provided byObaid UBah and Mohammad Akbar, the report was written by Anjum Altaf and typed by MohammadShafique and S. Qaisar AR AnjuaL
Fmally, we would lile to acknowledge the help, encouragement, and ideas offered by ourresearch counters in the United States, in paticular, John Briscoe, Xlnming Mu, and Kerry Smith
Praon Report Series xd
Executive Summary
Durig 1988 and 1989 a team frm the Applied Economics Research Centre (AERC),Umiversity of Karac cied out a sty of households' wilfnpuss to pay for imprved waterservices in rural Punjab. Uhe study was caried out In the groundwater zones: the sweet water zonewhero& good quality water is easily accessible and where the official policy is not to provide publicfacilities; the brackish water zone where groundwater is freely available but of pooe quality and wherepiped supply systems with household connections are sanctioned for villages with populatonsexceeding 5000, and the arid zrne where the groundwater is of good quality but is difficult to access.
The objectives of the study were to determine:
* The wilingness of households to pay for imprved service levels;* The determinants of the willingness to pay for improved service levels;* The preferences of households regarding the management of water delivery systems;
and* The appropriateness of existing govemment policy on the provision of water in rural
areas.
To deternine whether households were actually prepared to pay for the costs of runmngimproved systems, the ABRC team used a willingness-to-piy (WIM c 6'contingent valuattoanmethodology. WTP studies are simply household surveys in which a member of the household isasked a series of structured qutions designed to determine the maximum amount of money thehousehold is willng to pay for a good or service.
The three groundwater zones differed from each other economically. With rence to theaverage nural household income in Punjab, the sweet water area (Sheikhupura District) was moreaffluent, the brackish water area (Faisalabad District) represented the average level, and the arid area(Rawalpindi Distict) was less affluent. The villages selected were close to the district headquartersbecause it was felt that such locadons would pesent immediate policy challenges as they evolved intoperiuban areas. Because of the official policy of providing improved services (piped systems withhouse connections) only in vilages with populations exceedig 5000, the vilages selected in the sweetand brackish groundwater areas were lage in size. In the arid zone, where the policy is not beingenfored, smaller sized villages were selected. The AERC team caied out 261 household inteiewsin five vilages in the sweet water zone, 495 interviews in six villages in the brwackish water zone, and401 interviews in nine villages in the arid zone.
As expected, the percentage of households connected to piped systems at the current tariff washighest in the arid zone (96 percent), lower in the brackish water zone (75 percent), and lowest in thesweet water zone (55 percent). The mean monthly tariffs that households in villages without pipedwater were willing to pay for piped systems were Rs S0, Rs 40, and Rs 20 in the three zonesrespectively.
The principal finding of the study is that in Ceral Punjab (sweet and brackish water zones)there has been a quaitative change in the nature of household demand, from one for water to onefor water-based amenities like indoor plumbing, showers, and flush tolets. In the abseoce of pipedsystems, households (all of which already have private handpumps) are providing the higher sevice
PNogram Report Sews xdii
levei on an indivdual basis, using lectic pumps an. overhoad tank. Sixq percent of households inthe brackish water zone and 30 pecent of those in the sweet water zone have installed such systemsIt wa estimated that in the brackish water zone in a typical village of 5000 people without pipedwater, houshds had already invested one million rupees In capital and were spending approximstelyRs 10,000 per mouth in opeation and maintenance costs.
Ibis level of actual expenditure is of the same magnitud as the total cost of a public pipedwater system seving one hundred percent of the households. 'he aggregate willingness to pay forpiped systems is also of the same magnitude The survey indicates that cost recovey of piped systemsi8 possibie in C.ntml Punjsb.
Piped systems are conidered a substitute for electric pumps. In villages without such systemsin the brackish and sweet water zones, the pecentage of households with electric pumps drops to 33percent and 11 percent respecvely. However, a considerable number of households (29 percent and7 percent in the two zones respectively) continue to invest in multiple systems because of the poorreliability of piped systems. As expected, it is the Ticher and more educated households that demandand are willig to pay for reliability. However, the demonstration effect of the choices of the elite isa clear indicator of the trend for the future.
In tho arid zone, demand is still lagely for water for personal use, and households are satisfiedwith a lower rliability of service, which is stiUl qualitatively superior to the alternatives of public wellsand surface water. However, although the wilinges to pay is high, the small village sizes mean thattie capital costs cannot be recovered because of the absence of economies of scale.
The transiton to higher service on an individual basis calls for a review of the policy of notpovdig piped systems in the sweet water zone. ITis is necessary because the former option issocially inefficient, the monthly operation and maintenance costs being almost two-and-a-half timesthose for piped sysms.
The level of actual expenditure also indicates that piped systems need not be subsidzed inCentral Pu4iab. A collective system is futher necessitated by the dainge Problem that results direculyfrom incrsed water comumption fllowng upgrded service. This poblem is not amenable toindividual soluto It is suggested that instituional mechams be explored to facilitate the prvateconstrution and management of collective water supply systems.
Piped systems wil not become economically viable or be able to compete effectively withprvate opdons unless their .liability is improved. This is not possible without metering because thedemand for water at zero margi cost (namely, unmeteved connecions) in a dry agricultural areasuch as the Punjab is immense. Without metering, water must be rationed by reducing reliability;people secure other sources; their whllingness to pay for piped systems decreases; and the utility cannotcollect sufficient resources to run the system efficiently. A majority of the sampled households werein favor of metering ra were willing to pay higher tariff that those who favored flat rates.
IIn the small villages of the arid zone, more acceptable and manageablc viants of systemswith public standpipes need to be explored. Contrauy to general opinion, ho-'seholds were willing topay a reasonable amount of money for such systems. The mean williness-to-pay bid was Rs 35 permonth, and 84 percent of the households indicated that they would subscnbe to such a semice at atariff of Rs 15 per month
xiv UNDP-World Bank Water and Sntaion Program

V% A
to~:
11111t
{ ~~~~~~~~~~~~~iLii}A
1. Introduction
1.1 Ihe World Bank has been placing increasing emphasis on rual areas in its lendingin the water sector. Consideing all Woid Bank expentes on water supply, the proportion of fundallocated to uroal projects has ineased from an average of 8 prcent between 1974 and 1980 to anaverage of 14 percent frm 1981 to 1985. However, a Bank review of projects in this sector concludedthat oveall perfomce was disaonting. Te review suggested that technology per se did not appearto be a major problem. It was concluded that the desig of rual water supply projects had been ovedysupply orlated and that crucial demand aspects had been neglected. In particular, it recommended anemphais on undeding (a) what people want and (b) what they are willing to pay for.1
12 In light of the above conclusions a research study was approved to find ways toimprove the financial and economic performance of water sector projects by developing improwdinformation on households' wiliness to pay for upgraded services in rual areas. Ihis reseahproject, titled 'Willingness to Pay for Water in Rural Areas," involved field studies in six countries:Brazil, Nigera, Tanzania, Zimbabwe, India, and Palkstan Tis document reports on the results obtainedfrom the field study carried out in Palistan.
Objecvs
13 The objectives of the study were to determine the following:
e The willingness of households to pay for improved service levels;* The deteminants of the willingmess to pay for improved service levels;* The preferences of households regading the magement of water delivery systems;
ande The apprpriateness of the existing government policy on the provision of water
in rural areas.
1.4 An additional objective was to test and validate a rapid appaisal method (thecontingent valuation method to be descnrbed later) as a potential tool for planners in designing ruawater supply systems. It was hoped that the use of this method and the information derived from itwould help the water authonties improve their decion-making on appropriate levels of service, cost-recovery polices, and water pricing in rural areas.
Pory Oveviw
1.5 Coverage, Targets, and Alocons. At the start of the Sixth Five Year Plan (1983)22 pecent of the rural population of Paldstan was considered to have access to water of acceptable
1Wodd Bank: Water for Rural Cmmunitks: He4dng People to Hel ThaehePI S Policy andResearch Division, Water and Urban Development Department4 25 pages, May 1987.
Program Report Series I
quality. Identfig rurl water supply as a neglected sector, th pl announced a doubling of ualcover to 44 pret by the end of 1988& By the mid-poit of the Sixth Plan, however, pgress waswel below btrg with only 28 pecent deemed to be coverd.
1.6 Und the 5-Point Prgrmme announcd on December 31, 1985 rural water supplywas agin identif as a pdioity sector, and a ta was set of incrasing coverage frm 28 peretto 66 percent by 1989. While the mtron asated with the 5-Point Prgamme is no logerin office, receot poy po emts have indicated an even greater commitment to rua watersupply. Th tentatie tat being set for the end of the Seventh Plan in 1993 is 75 pcent.
1.7 Virtually all resources for the nura water supply sector flow from the deral to thepovinci govenments. Accoigy, the fedea govrnment is the critical policy-making level ofgovernmt, with the prvincl agencies having responsibility for Implementing the policies set at thefedel level.
18 At the federal level the Minty for Phang and Development (Plning andDevelopment Dision, Physical Planning and Housing Section) is the key policy-making body withmajor rponsiity for icorporating rurl water supply into oveall deveopment plans.
1.9 The Minsty of Housing and Worf (Envnent and Urban AffiiBm Division) hasthe major responsbility fo the technical aspects of rual water supply. TMe technical agencies at theproinciallevel must rport to this ministry.
1.10 At the pmvcil level the Public Health Engineering Deparment PED) is thetebnica agency which has responsibility for the consuction and itnia opertion of maot rur pipedwater supply systems Te local authoities (Dtistct and Unio Cowuni), under the Depatment oflocal Govenment and Rurl Deveopment, ane supposed to be responsible for the operation and
_ainwe of public water suy systems In fact, because neithr of these bodies dischges thisresponsiy i, in most instces, it is assumed by the PHED.
1.11 Ihe major consquence of the dominance of the rral water supply sector by thePHED is the over-emphasis of the engineering aspects and the relative neglect of te socia andeconomic aspects of sectoal issues.
Leek of Sevice and Syskem Cots
1.12 DecisIons on the lvel of sevice to be prvided by government ral water supplyprogams ave made entiely on techncalladmnistrative grounds. Ihe efficiency of these policies froma stricty economic pempecive has yet to be established. In Puaab, for ince, the curent policyregading sevice evel i as iolows:
2 UNDP-World 1 Wafer and Sadon Pogrm
Sweet water areas:* Public supplies are no longer bilt.
Brackish areas (with canal irrigation and add arm):e Standpipes for villages with populaton below 5000.* House connections for villages with population above 5000.
1.13 With re exceptions, the govment bews 100 percent of te capital costs of publicwater supply poets. In Punjab and Sind typical capital costs for piped sstems providing houeconecdons are as follows:
Areas wih swee water (supplied by tubewell): Rs 450 per capita in Punjab and Rs620 in Sind.
Imgaied areas with brackish water (supplied with filtered canal water): Rs 600 percapita in Punjab and in Sind Rs 900 (where perena canal water is available) toRs 1300 (where canal supply is nonpenial).
Arid areas Rs 120041800 per capita in Punjab.
1.14 Based on experience in Punjab, standpipe systems genaly cost the PHED only 10pert to 20 perent less per capita. In parts of Sird, where settlements are more scattered, the unitcost differences between house connections and standpipes are greater. The costs to the household fora domestic connection are typically Rs 80 to the PHED as fee and about Rs 500 for the matedis asdhbor to effiect the connection from the distribution line.
1.15 Ihe cost to the PHED of operating and manning piped water systems (based onan aveaage houehold size of 6.5) is estimated to be between Rs 20 to Rs 30 per household per montIn Puniab and about Rs 35 per household per month in Sind.'
1.16 In principle, after a two-year delmonstraton period," District or Union COcIlsshould tkel over the running of piped systems. In fact this does not happen, and the PIlED codnuesto bear the resynnsibility and the expenses.
1.17 Public tap useds are supposed to pay Rs 5 per fimily per month. However, plalybecause the users are dissatisfied with such systems (they dsire house conncrtions) and parily
'These cost figures of Rs 450 and Rs 600 for Punjab are reported by Briscoe (1987). The figuesreported to us were Rs 300 and Rs 50, respecdvely. These are also the figures used by the PliEDin preparig cost estimates(US$1 * apprximately Rs 20 dwing 1987-1989.)
'Again, the figures for Punjab reported by Briscoe seem to be on the high side. Ihe PHED usesa figure of between 3% and 5% of capital costs as the annual operation and manenance (O&estimatm. These generally work out to be lower than the figure mentioned above.
P hogra Rot Sries 3
because of the difficulides inhe_ t in collectig for standpipe systems, essealy no attemp. is madeto collect the user fee.
1.18 For systems poviding house connectos, the monbly taiff is between Rs 10 andRs 25 per conneton. This s a flat talftf, since household water pplies in Pakistan are not metered.Collection is unevaen in some areas most who are connected pay, in other ares compliane is less.In Punjab te PHIED bas no data on ovll compliance but bimeves that about 60 peret of thoseconnecd pay. Ihose who do not pay ane threatened with disconncon, but in fact the threat is relycarried out.
Future Plan
1.19 Cost recovey is beginning to emerge as an important isue in the financing of ruralwater supply projects One proposed solution is the proposal for the establishment of villagedevelopment committees. ITis is seen by planneis as a necessary step in the assumption of localresponsibility for the efficient operation and maintenance of vilage water supplies.
4 UNDP-World Bank Waoer arsd Saato Praun
2. Study Design, Methodology,and Site Selection
SWdy Dealg
2.1 To acieve the objectv of the study, the proposed reseah design underlookfieldwork in three different regins chosen to cover a uge of economic and enonmental conditions.In each goon two types of sites (Ipe WA' and Type 'B*) wae to be chosn Type A site wereto be located in an area wheoe a fmctoning impoved wat supply systm was bing used by between30 percet and 70 pert of the populton. Type B sites wee similar ones neatby at which animpoved wer sopply systm was not yet avilable. It was hoped to conduct 200 houehold inteviwsat each she yielding an overall sample size of 1200 households.4
2.2 Since Type A sites would include both types of housholds (connected and volunwtalyunconnected to an available improved wate source) It would be possble to use an indiect apprah(on based on obsevation of actl cboies) to unesm household behavior. Thus, it would bepossle to ess the effeas of differt dcharacteristis of impwved and altnatie soures (pre,dstnce to source, quality, level of servce, elbt, time sie Itallation, etc.) and users (economic,sca and demogmaphic acois) on the liklihlood of a household's using an imprwed source.
2.3 Since no observations on actual choice would be available in type B sites, a directapproach (the wilingness to pay [WTP), or contigent valuation method) would be used to eicitho Dsehold pefrence for impoved service.
2.4 WV studies are simply household sweys in which a member of the household isasked a stuctured series of questiows that are desiged 1o deterin the maximum amount of moeyte homsehold is wlling to pay for a good or service. Whea WIP stdies an coonductd to assist withwater sector policy or planning, the specified good or service could be a house connection to a pipeddistibution system, accoss to a handpump or standpostK or prvision of household sanitation facilities.WI? studies are also termed 'contingent valuation' studies because the spondet is ased about whathe or she would do in a hypothetical (or contingent) situation.S
4Wodd Bank, "Willigness to Pay for Water in Rual Areas,' Research Prposal, Water andUrbn Delopment Deprtment, March 1987.
SFor details of the methodology, see Ronald 0. Cummings, David S. Brookshire, and WilliamD. Schulze (editofs), Valking Envwmenta Good: An Assemn of the Contingent Vabaonl MewdTotowa, New Jersey: Rowman and Allanbeld, 1986.
Program Report Series 5
2.5 Comparsns betweean the results obtained from Type A and B sites (e.g, coinecdonfreqency at given taff sates) shoud help to validate the reliilit of the WTP method as a tool forrpid appisal of paning cboices and allematives.
Silo Selecaon
2.6 The overall research framework proposed for the mulu-country study was tailored tothe needs of the specific conditons in Pakistan Deliberaions by the Pakistan team foflowed byconsultatio with the counterpt staff at the World Bank led to the following decisions:
a. Restction of the study area to Punjab. Since the WI? surveys involved techniquesthat were unfailia to the enumerators and that invol%ed exusive interviewinit would be adviable for team leades and interview supervisors to be familiar withthe languag of the respondents. IThs effecdvely restricted the sample area toPunjab. In em of poplaton, Punjab is the largest province in Palistan with S7percent of the rual population.
b Within Punjab, three eviromental zones were identfied based on groundwaterchaactristics: the sweet water zone where good quality water is easily accessible;the brackish water zone where water is easily accessible but of poor quality; andthe arid zone where water is not easily accessble though of good quality.
cv Restriclion of impwved source to piped distribution systems with householdconnrions. The researh desig deemed it important that households be paying amoney price for the improved water supply. Tis limited the choice to pipeddistribution systems with household connections since tariff collection for handpumpsor public standposts was virtually nonexistent
d. Selectdon of lre villages. Partly as a result of the restriction ntdoned inparagraph 1.12 Ci Punjab household connections are supposed to be prvided onlyto villges with populations exceeding 5000) the sample villages had to be largein size. It was also felt that fom a planning perspective the many lare villagesclose to major tities would present challenging and immediate policy problems asthey would evolve into peduban tDwns within the next five to ten years. Anaysisof such locations would be pudculary useful for the planning authorities. However,where possible, as in the arid zone, smaller vilages were included -n the sample.
e. Disaggregation of Type B villages It was decided to include two kinds of TypeB villages - BI where an improved supply was scheduled to be installed in the nearfuue, and B2 where no such supply was scheduled. Tbis was consiered to behelpful in testing whether any strategic bias vas incorporated in the WI? bids. Sucha bias would occur if households in Bi villages, already assured of a water supply,systematicaUy ude-eported their bids in order to convey the impreion that theywould not cect if the tariff were raised. Households in B2 vlages, with noprospects of ccess toa piped supply in the foreseeable future, on the other hand,
6 [DP-Wrd Bank Wter and Saitato PrWo
might systematically over4ate their bids in the hope of influencing policy-makersto include their viae in thase mare for the stlation of piped water supplies.
2.7 Based on tie above considetions v s were selected and surveyed in the foRowingarem:
Sweet water zone - Shelkhupura DistdctBrackish water zone - Faisabad DistictArid zDne - Rwalpind District
2.8 Ihe loation are depicted in maps at the back of the book. Accoding to informationobained from the PIE (1986 a nately half the rual population of Punjab resides in the sweetwat zone ad a quarter each in the brudksh and arid zones.
Samping whin V es
2.9 Since no household lists were available, the following prdure was adopted forampling within the selected villages. Rough maps of the selected vllages were available fomm visitspior to the main survey. Villages wer divided into our a xately equal quadrants, each quadrantcmprsing a knwn number of lan Two eaumeaors wre assigned to each quadrant, onersposie for houses on the left side of a lane ad the other for houe on the right Mhe totaln_mber of hous i the village could be estimated from cemus recods Since the sample size hadbeen broadly specified in the resh design for any pardcular village the number of houes to besampled was known. Me first house on each side of a lane, for every hne, was chosen rndomly andte every nth house was sampled based on the sampling ratio. Households where the appropdateesponde was absent were not roplaced by nearby households. Lre villages, which rquired morethan one vit, were sureyed both in the monngs and in the evengs. Smaller villages, vhich wevisited only once, were surveyed in the evenings. Iis was meant to ensure that no occupeaonacategory (e.., fmers or wage employees) were symatically missed in the survey.
Genrl Dusrpiln of tm StU Areas
2.10 Pnjab. Pujab, the lagest pvice in PaIistan, contais 57 pct of the tota ruapopuaton and 56 pent of the total anmber of rml localities in the couny according to the 1981census. The size distribution of ra locities in Puzjab virtually identical to that c uIIthe country as a whole (see Table J-1). In 1981, about 3 percent of the vigs exoeoded a popuiationsize of mo, 22 pemrnt exceeded a size of 2000, and 46 percnt exceeded a size of 1000.' However,iu terms of the prporton of total nural population, 17 peroent resided in viages exceedn a size of5000, 57 percent resided in village exceedig a size of 2000, and 83 peet resided in vilagesexceeding a size of 1000 inhabitt
'At the 3% population grwth rate per annum used by the PHIED, the prpotin of larger vMageswould bave _ad. considerably since 1981.
PosaM Repot Series 7
2.11 The level of economic affluence in rural Punjab is ako very similar to that of ruralPakdstan. In 198441985 the monthly rul household income per capita7 was Rs 243 in Punjab andRs 234 in Palitan as a whole.
2.12 In Punjab Province, 21 percent of ral locaities (15 percet of rual houswholds) hadaccs to electricity in 1981. By 19861987 the percentage of rural locaities with access to electictyhad ineased to 49 percet Ts is impotnt since conetion to the electric grid faciitates theeconomic provWion of piped water.
2.13 According to the 1980 Housing Census, 45 perct of rmal households had acces towater inside their homes. Of these, 3 percent reLied on piped water, 37 percent oo handpumps, andS percet on wells. The emaig 55 pent of households obtained water fom owide their bomesOf these, 3 pert telied on piped sources, 15 percent on handpumps, 16 percent on wells, 4 percton ponds, and 17 pert on springs, rivers, strams, etc. (see Table 1-2). Thus by 1980 6 perctof rual houseolds had access to piped water, 3 pecent to domestic connecions, and 3 percent topublic taps. Access to piped water is stated to have doubled by 1986.
Fababbpua Fmad Rawalidl Diticts
2.14 Within Punjab, Sheikhupura Distict (sweet water area) and Faisalabad District(-ckish water area) lie i the entral canal-irrigated plain whils Rawalpindi District (arid area) liesin the norther ain-irigated region.
2.15 The size distribudon of nu caitdes is shown in Table J-1. It can be seen that theproporton of larger-sized villages is much higher in Sheikhupura and FisabaWd Districts than inIawalpindi Distict Thus 26 percent of the ural localities of Sheikhupura District and 60 percent ofFaisalabad Disrict exceed a population size of 2000 inhabitants. The compartive figure forRawalpindi District is 11 percnt l-is is probably due to the fact that the available water resourcesin the arid zone cannot support lrge-sized setlements.
2.16 Data for Sheikhupura, Faisalabad, and Rawalpindl Sub4istricts are also provided inTable J-1, since the sample vges are located mostly wihia the sub-ditricts. ITe data show thatthe first two sub-districts have a higher popwdon of larger sized villages than the districts as a wholea
2.17 The monthly rual household incomes per capita for Pakistan and Punjab in 1984-1985 were Rs 234 and Rs 243, respectively. The cemparative incomes for Sheikhupmua, Fas _abad,and Rawalpindi Disteits are Rs 307, Rs 247 and Rs 217, respectively. The age in Punjab is fomRs 175 to Rs 320. 'Ihus Sheikhupura is among the more affluent districts, Faisalsbad represents theaverage level of affluence, and Rawalpindi is among the less affluent disticts in Punjab.
7'Te montddy rua household income is obtaed from the Household Income and ExpenditureS-waey, 19841985. The average rura household size Is obtined frm the Popuation Census, 1981.
Pab Development Statistics, Bureau of Statistis, Govemment of the Punjab, LahI;e 1988.
8 UNDP-World Bank Water and Sanito Pogam
2.18 Ihe occupatonl stctu in the three districts is shown in Table J-3. Sheikhupuraand Faisalabad Distrcts have vey similar pefils wbile Rawalpindi District has a much lowerproporton of the working population enged in industry and a higher proportion engaged in services.The proportion of the woring population engaged in agriculture is virtually the same in all threedistricts and accounts for just over half of the totl working populatio
2.19 Ihe comparative situation with respect to acces to water is shown in Table J-2. InSheikhupur and Faisalabad Districts, handpumps inside the house are the prmary source of water: 72percent and 64 percent of total households, respectively, rely on such sources. The second main sourceIs handpumps outside the house. In Rawalpin Distict, on the other hand, 62 percent of householdsrely on wells outside the house and another 25 percent on springs, rivets, and streams. Ihe modelingof houv"flds' wate source ies thus much more complex in the arid zone especially becausemany sources dry up during th summr months and are not accessible.
2.20 Zones with accessble groundwater have a lower proportion of households suppliedwith piped water than the average for the prvince as a whole. his situadon is the result of currentgoverment policy, which is based on need and not on demand.
Pro.n Report Series 9
3. Analytical Overview
3.1 mhe analysis hall be dietd wwa te investato of the foowing broad issin each evironme zone:
* Actual choice behvior,* Hypothetical cic bear, and* The ecanmic viability of investments in rad water supplies
Ibe details of to Issues to be stigted and the techniques to be used fr tat ppe are discussedIA te folowig sections.
AMsa Chaim Baw
3.2 In each evonmental zone households bave a number of bhoces ia deciig uponthe type of water soure to use. The study would identify fte set of choies and infer fkm theobevadtions the effect of dift riables ao te liiood of a houOls makn a panricul
chice. chbBehH atetica Choic Behavi
3.3 In mny villages aticu servic opon, e.g, hous to a pl ped system,may aot exisL Such an option is not pa of the choie set of households e valution of sch ahice is obtined by offeing te oeholds a well-descred hypothedtcal dio in a big gme
forma the respones, in tm of wllingpes-to-pay bids, are e so d t9 estime the value placoeon the pulr opt offered.
3.4 The desaipion of the hyWhe choice Inludes peentat of all the welevantchrctists of a spedfic piped senice opton. hse iclude hours of py, quality of water,eped p ue and eiaty, and te prices under which service would bo avable. In ?Pmbthe price stcue for piped sevice includes a on-time churge (an ofl co o fee patyble tothe pls the cost of nectg the house to the dui_o le, wic is bone by thehousold ) and a fiat onty taf In this study, the amout of the otime MosM are included aspa of the dscripto C ilages where the d buiones have not yet bee Id, the bodare give an a e cost figue based oan the s In villages wih pipd wer systems). Thehols ae then asked whether they would con to the system described at a given monthlyti Dqpndi upon the response, the tadff is maised or lowered add the hoolfd is asked torespond agai. hs pat is folowed consetly in fte study: the o m cos are alwaysIndicated to the hou ld and the bidding is on the levd of the monhly ta
?Serm 11edl
3.5 'Me willingness-pay bids are used for thu dift pupos:
* To detemie th popoin of households that would accept a partcular seviceoption at any given tulZ whbich allows caculation of the possible revenue yield;
* To study the detma of t willingess-t-py bids and therby to identifyposible teds as soil and ecoomic condto chan in the futu; and
* To compare, wher possible, the pattn indcated by the hypothcal choices (eg.,comecdon atio at a givea tadff level) with the patter refectng actal choicebehavior. Such a eoLpaison would serve as one test of the validity of thecontigent valuatio methodology.
Ecomomic Viab_ty o s In Rua Wate Stuppu
3.6 Ike wiingstopay bids for any pardcular opdon would yield an estimte of thenumber of households that would choose the opdan at a given pdre. In the case of water souchese responses would be intpreted in term of the choice to onnect given a paricular conectioncst and tauiff leveL
3.7 Ibe above infomadon on the pecentage of households connecting to a service levelat varin taff rstes is sufficient to esdmate the monthly reveues that could be genated if thatservice wer actuay offered. This estimate could dte be compar with actual data on maintenanceand capita casts to Jetmnine the degree to which cost recovey is possible in any specific situation.
Dsiptn .o Vales Used In the Antals
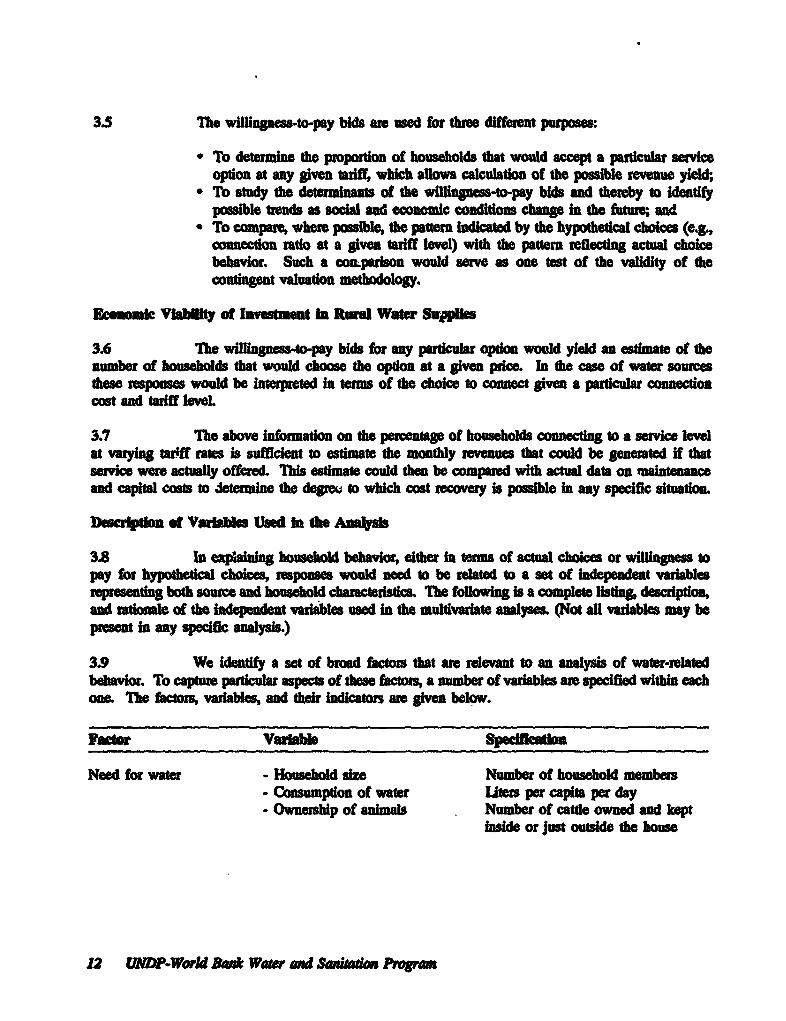
3.8 In expainig household behav, either in tms of actual choies or willingness topay for hypothtcal choices, spones would need to be relatd to a set of indpendent variablesrpeseng both soce and bousehold c tuics. The following Is a complt lstn, descriptiand rationae of the idepdent variables used in the nultvrate analyses (Not all vaables may bepresent in any specifc analysis.)
3.9 We Ident a set of broad factos that are relevat to an analysis of water-relatedbehavior. To captue pacular aspec of these factors, a number of vadables ane speced withi each
e Te factrs, vaiables, and their indcaton are gi below.
Factor Vale S _eclflcatias
Need for water - Household size Number of household members- Cnsumpdoin of water liters per capita per day- Ownership of animls Number of cattle owned and kept
inside or just outside the house
12 UNDP-Wl BAv* Water and Saadan PmVa
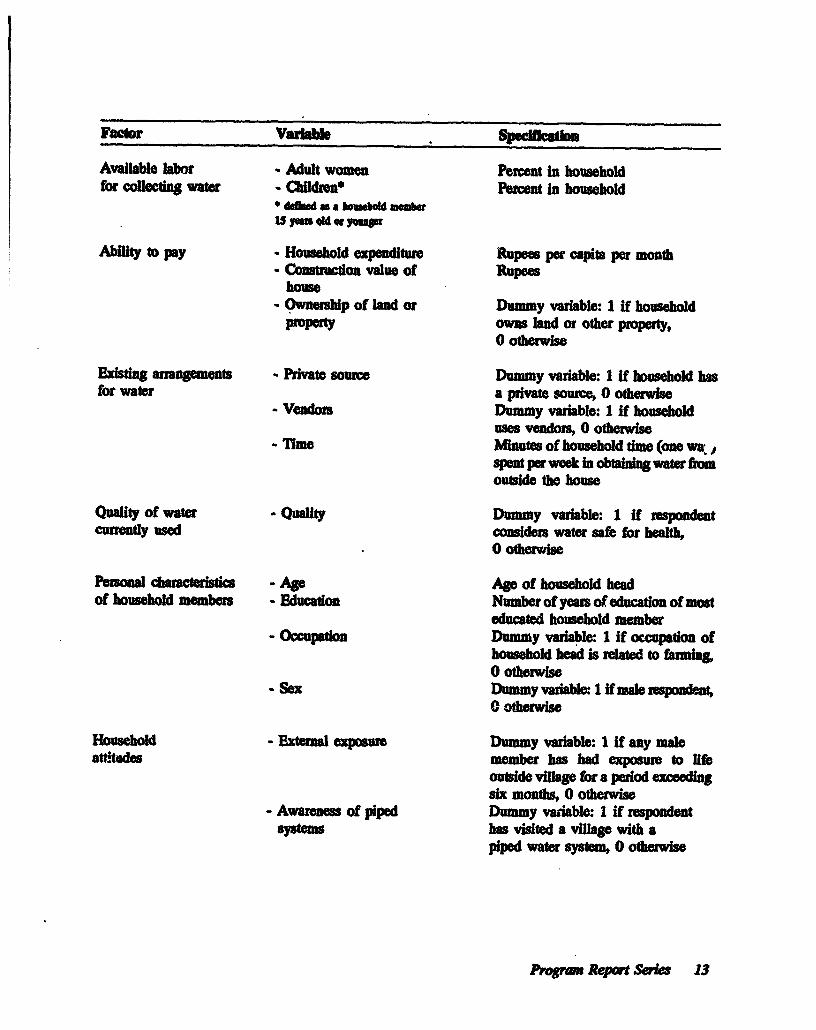
Factor Varbe SIMfe,
Availble r - Adult women Porcent In householdfor odlecng water - Chldroe Peroen in household
* dd lad as a b_oubd semba
Abiity to pay * Household expenditure Rupees pr capita per month- COnrstnction volue of Rupee
house- Ownership of land or Dummy variable: 1 If household
property owns lnd or other prperty,0 otrwise
Exting arrgem - Private source Dummy variable: 1 if household hasfor water a private source, 0 otherwse
- Vendoms Dummy variable: 1 if householduses vendors, 0 othewise
- Time Minute of bousehold ime (one wa sspent per week in obaing water frmoutide the house
Quality of water - Quality Dummy vaiable: 1 if respondentcuntly used conside water safe for health,
o otewIse
Pesonal I - Age AV of household headof household members - Education Number of yew of education of mast
educated housebold member- Occupatol Dummy varble: 1 if occupaion of
household head is reated to farmigo othewise
Sex Dummy variable: 1 if male, sponden,O othewise
Household - External exposure Dummy vaiable: 1 if any maleattitudes member has had expue to RUb
outside villge ftr a period exceigsix months, 0 otherwie
- Aware_s of piped Dummy variable: 1 if respondentsystems has visited a village with a
piped water System, 0 othewise
PF08ram Report SWei 13
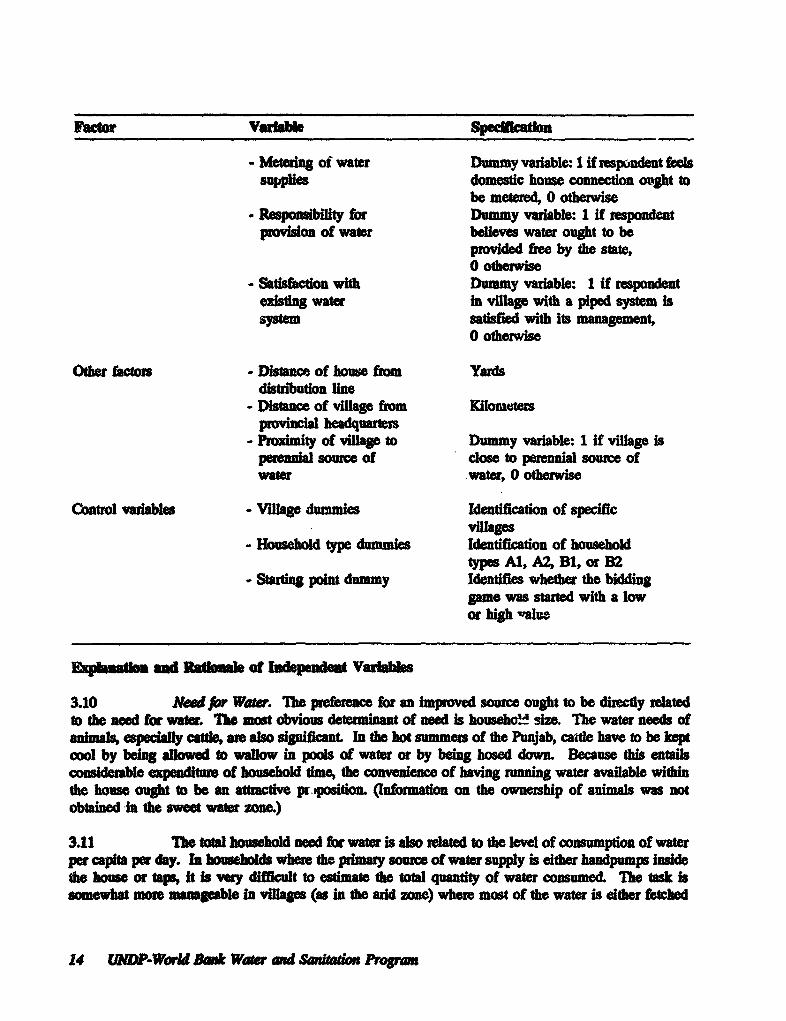
Facow Vrhe S
- Meteing of water Dummy variable: I if respondent eelsSuppies domestic house connection ought to
be metered, 0 otherwise. Respons_lty for Dummy variable: 1 if respondent
prson of water believes water ought to bepwvided free by the state,0 otewise
- Satisfaction with Dummy varable: I if respndentexaisg water In vilage with a piped system isSystem satisfied with its management,
O otherwise
Ote fcors - Dace of house from Yardsdistribution sle
- nce of iae from KomeAesproical headquarters
- Prximity of viae to Dummy variable: 1 if village isperenal source of close to perennial soure ofwater water, 0 otherwise
Control variables - Village dummies Identication of specficvillagles
- Houebold type dummies Identfication of householdtpes Al, A2, B1, or B2
- Strtg point dmmy Identifies whether the biddinggame was srted with a lowor high valu.
awd Ratkookof luspelndat Varies
3.10 Need for Water. Ibe pref for an impwved soure ought to be directiy relatedto the need for water. Ihe most obvious determinant of need Is househo! size. The water needs ofanfims, espeally cate, an also slgificant. In the hot summers of the Punjab, catte have to be keptcool by being allowed to wallow in pools of water or by being hosed down. Because this entailscomidembl expenditu of household time, the comnenence of having running water avaflable widtinthe house ought to be an attuactWe pr ipositn. (Infmation on the ownership of anim was notobtained in the sweet wate zon.)
3.11 TMe total bouehold need for water is also rlated to the level of consumption of waterper capta per day. n households where the prmary source of water supply is idther handpomps insidethe ouse or tp it is very diffcult to esdmate he totl quantity of water consumed. The task issomewhat moe mangeable In vllages (as in the arid zne) where most of the watr is eidther fetewhd
14 UNP-Woradl*k Water and Satation NW=
fbm oide the home or delivered by vendo. We have expeemted with esimating the minimumamount of wats a oumbold would normally need ftr its elsential use. M&s esmate is detminedby psingd the t with a hypothtcal situation in which the household's primy sowrce wasout of adr or uder por (a situation with which all households were familia). lhe respondent wasakd to ndlo tthev eel wh1h water would be fetched fhom outside th house in such a situadonand ID give tho number of vess that wooM be refuired to meet the ssntial needs of the houe (its resoable to assum hat households would cuti nonestal usage in such situations). Ilecapecity of e vssel was estmated by asking t respondents how much milk it could hold, ajudgmet whih rpoadnads made with great ease. In the arid zone, where households arehmilisr with the vwedg of water, rsponden wer simply asked to state how much water they wouldacqu fm a vndor for meetig essenal household needs on a representative day.
3.12 Of comae, the vaiadon in essential coumption would be much less than thevariton in toal consumpto However, under the cirumstances this was the only quantitativemeasue of wate comption that it was posible to estimate with any degree of accuracy.
3.13 In households with access to impoved water sources, the consumption of water percapt per day, ev fr essntd usage, might be higher than that of comparable households withoutimproved sources. Suh etdogeity would make It difficult to interpret the vaiable.
3.14 Awalabi Labor Swpply. Whorever water is primarily fetched from outside tho house,as in the aid zone, e avilabble labor supply (which, in the context of fetching water in the Punjab,
y omen and chiden) assumes cddcal significac Households with scarce hborought to be man desro of imprved water soures.
3.15 mhm choice of the proportion of women and children as idependent vaiables meanstht tho xcluded caegy i the proportion of men. If an increase in the pportion of women at theexpne of men makes oly a marginal difference to the need for water, the pteference for an improvedsource would be lesend bmse of the increase in the available labor supply. However, if a womanneeds mor wat than a man (iuability to bathe at naturd soucs could be one reason), the overallmpact could be ambigou An incre in hildren at the expense of men, on the other hand, couldbe expeced to both deee e need for water and increase the avaiable labor supply. Therefore,an incre the prpoion of children should have an unambiguous negative impact on thepreference for expeniv impoved sourCeS of water.
3.16 AbNi to Pay. A greater ability to pay could nomally be epected to be direcdynrlated to a greate pernce for an impwved source of water. However, if more affluent housetoldsbave already made significat investments in expensive private water supply argements (eg,Installaton of an dectric motor on a handpump), the impact could be ambiguous.
3.17 Mm eation of rral hoasehold income is genealy very difficult because ofseasonal varao and noncash component (eg, own production). Te effort requred for accurateestmation is not feasie in suveys where the prmay objectiv is not the estmation of income, as,for example, in willingness-to-pay studies. W6 have used monthly cash household expenditure percapita as a proy for bouseld inwome per capita. M variable is subject to limitaos sice it is
Prqga Report Series 15
unable to corWect for the possible lower cash epedit of faing houselwds. (Infomation on thisvariable was not obtained in the sweet water zone.)
3.18 Te estimation of household weath is also a dMcult proposidon. We have used twoproxy variables The ownerhp of land or other popet is faly stragtfo The construcdonvalue of the house in which the fmily rendes could be more controversial. It has been hfequenlydocumented that the highest ptiority In the use of discretionary funds is given to housing. This isespecay true for rual households i Pakistan where housing is a very visible Indicator of socidalstatus and achievement The pattem of utilization of remittuces fom the Middle East by rurdrecipients has established tbis beyond doubt. Thus, housing quality could be a reasonable indicatorof household wealtL We have measured t by asking the amount of money that would be requiredto consuct a house similar to the one occupied by the hosehd if the constrction were to becared out at the time of the survey. Ihe latter condition takes care of the problems inherent in thepossible valuation at diffetent points in ime.
3.19 One frequently used alternative is to enquire about the ownership of household assets(usually durable goods like TVs, motorcycles, etc.) and to couct an index of asset value. We felthat the valuation problems associated with this procedure (when wer the goods purchased? at whatprice? new or used? are they in working order? do they really exidst? etc.) result in an estimate whosereliability is not likely to be any better than that of the indicator we used. This is especially true sincee residece can be considered to be the pmry and most valuable asset of the household, dominating
assets like TVs, radios, etc, and is also visible to the enmerator. The benefits of relying on a singleindicator are savings in terms of time and less apprehension on the part of respondents who aregenely suspicious of enquiries into ownevihip of assets (MVs, radios, and motorcycles requirelicenses) and reluctant to admit to social deptivation
3.20 4sidng Arrang _nen fir Water. The impact of the ownership of a private sourceof uvster on the preference for a piped supply can be quite compl If the souce involved high recentcapital expenditure and is an acceptable substitute for piped water the impact cwld be negative.Hfowevr, if it is not considered a substitute (e.&, does not provide the same quality of water, as isthe case in the brckish zoe) the impact could wel be positie, being an india of the desire forimprved sevice. At the same time, if the running costs ae hlger tan the tariff for piped waterand the capital costs are recoverable (e.g, by the sale of used equipment) the impact could again bepositive.
321 Households using vendors could be expected to expess a clear preference for pipedwater, since vended water is uwuch more expensiwe than the flat montly rates at which piped wateris supplied in the Punjab. However, since existing piped water systems are genally unrelable andrequire initial eco costs, the choice between uSing vendors and obaining a private connectionmay be less clear cut thnm it woud first apper. Also, puschang water fiom vendors allowshoueholds to have gsater control over their casb flow.
3.22 Ibe excluded households, sccording to the dummy variable, are those whichexclusively use their own labor supply to fetch water from otside the house Such households existonly in the arid zone, since in the other two ones virtually every household has at least a private
16 (NDP-World Ban* Water and Sanitat PmV
handpump inide the house. ITe important implication is that in the arid zone the amount of timespent fetching water is highly corelated with the ownership of a private source of water or the useof water vendors.
3.23 In the sweet and braclksh water zones, households can be distinguished fiom eachother by whether or not they own an impoved private source of water which consists of an electricmotor installed on the handpump. However, since the quality of the groundwater in the brackish zoeis genally poor most households spend some time in fetching water for drinkng and cooking fromoutside the house. I: can be hypothesized tdat households having to expend more time would expressa greater prerence for a connection to a piped water supply.
3.24 Qualy of Water Being UsedA Households that consider the water currently being usedto be unsafe for health could be expected to demonstrate a greater preference for a piped water supply.This is not an objecdve assessment of water quality, rather it depends on a certain degree of healthconsciousness and a judgment about the quality of the available water source.
3.25 Peonad Characis. It is generay believed that younger and more educatedhouseholds would express a greater pence for modem conveniences like piped water supplies.
3.26 Households involved in farming landlords, tenants, and owner-cum-tenants) are libelyto expess less interest in piped water supplies for a number of possible reasons: flexible workschedules, the location of work close to water sources, and the ability to combine water-reatefdactivides with work (e.g., bathing and watering of animals). The generally presumed conservatism offaiming households could be a contributing factor.
3.27 It is generally assumed that women would express a greater preference for piped watersources tman men since the former are primarily responsible for the arduous task of fetching water.Respv-ses from both sexes are available in the arid zone to enable this assumption to be tested.
328 Atitdes of Respondents. Households which include members who have had exposureto life outside the village might express a lower or higher preference for the service being offereddepending upon how it compares with what they have seen elsewhere. Thus, the reaction to publictaps or limited serice hours could well be negative.
3.29 Respondents who have seen operational piped water systems themselves could beexpected to have a positive attitude towards the provision of a similar facility in their own village.The attitude of spondent in villages with piped water could be affected by their level of satisfactionwith the management of the system.
3.30 Respondents in favor of the metering of waier supplies could be taken to representose who are comfortable with the notion that a commodity like water should be charged for. They
are, therefore, ikely to be willing to pay more for piped water than those who consider the prvisionof water to be an obligation of the stat
Program Report Seri 17
331 Ower Factors. Houholds have to bear the costs of conetn g their houes to theditribuion line It I. thus reasonable to expect that bouseholds further away from the lae would beless likly to conect to a piped system. Probably the cost would be higher and becau beyondsome caitical distance the altemnative of installing a private improved soure might become economicallymore attaive.
332 Vaglevel cha i could be expected to have some impact on tho level ofprefece expressed for piped systems. For example, te distace of a vfllage fom the distictheadqugrim could be a proy for tho general level of affluence and awareness in the village.
3.33 Simiarly, in the arid zone, the proxmity of a vflbl to a perennial souce of waercould be epeted to lower tho felt need for improved sources compared to other vilages. Suchvilage-level influences are tested for in the arid zone.
3.34 Con ol mariables. Wherever it is felt that specific village characteristics could beaffectng the results, the suppositon is tested by using a village identification dummy. Similarly,diffrenes in the responses of vaious types of households (Al, AZ BI, B2) ane tested by the use ofhousehold identification dummies.
3.35 Some bidding ames are used to test for the prsence of a satig point bias. Sucha bias wil be mifested if there are systematic differences between the wlingess-to-pay bids ofrespodents who were randomly assigned a high ar a low sarti g point. A stg point dummy isused to test for the presece of such a bias.
Estlua Teebuijue
3.36 Ana(ysi of Actl Choice Behaio. The analysis of actual choice behavior is basedon the esmation of a logit model. The dependent variable is binary, indicadnag the choice orothe of *.parlcua servic level. The model is used to assess the impact of different ficos onthe lkeHhood of a household's maig the paicular choice.
3.37 Anapsl of Jypodhecal Choice Behaior. The analysis of hypothetical cdoicebehavior is based on the estimation of an Ordinary Least Squares regression model. Since a biddinggame is used to obtain the wilinges-to-pay estimates, the observed depden varable is not themaximum amount the household would be wlling to pay, but rather an interval within which the "tueWwilums to pay falls. iear gresion is actally not an apprpriate technique for dealing withsuch an ordinal dependent vaiable; in this situation the coect appmrch is to use an odered probitmodel' However, the use of the mid-points of the intemls as a dependent variable in an ornary
9Whitingto, Dale, John Bdsooe, XUming Mu, and Wim Bamo. Ssimatng the Willingnessto Pay for Water Services in Developing Countres: A Case Study of the Use of Contingent ValuationSurveys in Southemn Haiti" Eonoi De loWt and CQwl Change 38:2 (January 1990): 293-312.
18 UNDP-Woarld Bnk W and hSaiao PmV=
least squares model seems to yield esult which awe cosiste withk those obtained from an orderedprobit model, and the paameters are much asier to interpet
338 In this study the intrvas are quite small (eg, Rs 10-20, 20-30, 3040, 40-50, 50-60, 60-70, 70-100 in the arid zone). In addition, zero bids are cleady identified, and bids beyond theend-points of the range (Rs 10 and Rs 100) are elicited and recorded as actual values (the sweet watezne is an excepton. See Appendix B-1). he use of actual values b d the end-points and mid-ponts wid the range should yield close enough approximations to th true" Wbids to make ordinaryloast squar esimatd an acceptable fEist level of analysis.
339 P Ma tatiof the Reudts of dte Mitaiate Asraysa. The results are presented bywportg two models Ihe fist model includes all the relevant viables from the list presented inSection 3.9. In the analysis of hypothetical choice behavior step-wise deltion of variabls is used toidetify the estimation with the highest adjusted Rsquawed. This the second model reported. Sucha prsentation helps to ascetain the stability of the estimated puameters as insignificant variables aredeleted from the model.
3.40 Mean values of all the variables used in individual rgressis are reported. Variableswhich are statistcally siflc.t at the 90 pement and 95 percent levels are identified by one and two
respectively.
fWhittington, Dale, Mark Mujwahuzi, Geard McMshon, and Kyeone ho Willin toPay for Water in Newala DimtVw Tanaa Strategies jbr CoSt Reowy. USAID Water andSaition for Health Poect, Field Report No. 246, Washigto DC Jue 1989, pp. 205.
Prograw Rot Series 19

4. Sweet Water Zone:Overview and Field Procedures
4.1 Supura Distict is locaed in the cet canal-irrigated pt of the Punjab. Thedistrict capital is Shelkhupura City with a population of 141,168 according to the 1981 census. It issituated 35 kilometets from Lahore, the provincial capital, and 105 kilometers from Faisalabad, thecenter of the textile industry and the third largest city in Paldst Agriculture is mechanized, andindustry is located along both the principal axes, the Labore-Sheilhupura road and the Sheikhupum-Faisalabad road.
4.2 Three fourths of the area in Sheikhupura District lies in the swoet groundwater zone,and water can be tapped at an average depth of 25 to 30 feet. Water quality is almost unaivsallyperceived to be good.
Porqy iues
43 The current policy of the I unjab Public Health Engineering Department is that publicpiped distnbution systems are not to be built in the sweet water areas. hs policy is the result notof a demandbased but of a need-tased rauionale. The PHED has been entrusted withe responsbilityof poviding acceptable quality water to the lagest umber of people possible. Given that there aremany areas without such access, the scarce resources of the PHED are deployed accordingly. Withinsuch a framework the low priority accorded to the sweet water areas is understandable.
4.4 The above policy has also been supponed because the private sector is rightlyconsidered to be more efficient than the public sector. In his recommendations to the World BnkBrie (1987) states that w(I]n those areas whe government-fuded water supply prgams are notundertaken (such as the large areas of the Punjab in which good quality groundwater is available), theprivate secor has a major role. Individual families contract private drillers for sinking a well, andpurchase a handpump on the open manke ... While there are probably some imprvements whichcould be made in handpump design, govemment policy in tis area - namely to leave it to familiesand the private sector to resolve - is appropiate.3
4.5 Thus, one of the major objectives in including a sweet wer zon was to i_VIStiptete extent to which the above policy was justified. The other objectves included those tha. form thecore of the research effoutr i.e., to ddemine thoe willingness of people to pay for impwved services.
Waer In the Swee Water Zone
4.6 Historically, wells were the prmay source of dnking water in the vrillages fllidgin the sweet water zone. Indeed, the center point of a village was identified by a well, and more werlocated at other convenient points, especialy as the village grew in size.
Pwran Report Seies 21
4.7 Howeaer, as househlds became more affluent, wells were replaced by bandpumpsinside the house. Now vitully evey household has installed a private handpump. Almost all thewells, except thoso in some mosqus, have been bdcked over. ITis process of improvement in thelevel of service took place between 15 and 20 years ago. Ihe excess of the privately bome costs ofopation ane -9itenance of the handpumps over whatever contrbution mast have been requird tokeep the wells operationd prowvides a baseline esimate of the value placed on the convenience ofhaving a water source inside the house. Ms conveniece was almost entiely in the form of time andeffort saved in fetching water from an outside soure Given the high summer temperatumes on thePunjab plains, the value of the convenience is easily understood.
4.8 Our survey rvealed that a process of fiuther improvement in the level of sevice wasunder way. Perhaps as a result of incrased affluence, almost 20 percent of the households in thevilages surveyed had installed small electric motors ono the handpumps. These motors could pumpwater Into an elevated tank for distribution to various parts of the house through indoor plumbing andalso could help to operate a flush toileL Thus the complete system associated with a piped supply wasbeing replicated pivately at the indvidual level. This was an important finding because it revealedthat households were willing to spend on improved service levels. Numerous economic implicationsresulted fiom the spread of this process The shal be discussed later.
Selecton of e Stud VMiaes
4.9 Since it is govenment policy not to insta piped supplies in sweet water areas, thereare very few villages with public supplies. The choice of Type A villages (villages with operationalpiped water systems) was thus vey tricted. We selected the only two vilages that lay within themaximum distance from the distict headquarter that we wanted to consider. Public supplies hadbeen insalled in ese vilages as an exceptio to the geneal policy, most probably due to theinfluence of local politics.
4.10 Similarly it was not possible to locate a Type B1 village (village where a pubLicsystem was due to be inaled in te near future). We selected a village in which a piped houseboldsupply had been operational, but which, for various reasons, had fallen into disuse over fiv years sgoCurendy an effort was under way to restore the sstem. The selection of such a village offered theopportunity to see how poor performance in the past had affected the willingess to pay in the fureof those households which had been comected to the system.
4.11 The location of Type B2 villages (villages with no plan to install a public watersystem) posed no problem, and we selected two convenient villages close to the distrct headquarte.
4.12 he following are te partieul of the five selected villages.
* Jandiala Sher Khan: Type AMiza Vrka
* Kharianwala, Type Bi* Ghazi Minua : Type B2
Bhadd tro Miar
22 UND-WordBn WatradSntto ga
While the populatons of the types A and B1 villages exceeded 5000 by necessity, the two B2 villageswere selected from the size categoy 2000 to 4000. The poplations of Glazi Min and BhaddrooMinara were 4514 and 2173, respecively, in 1981. A more detailed profile of the selected vilagesis povided In Table A-1 in Appedix A."
The and Bidibig Gams
4.13 The core quesdonnaire consisted of five broad modules. The filst dealt with the socio-demographie nature of the household. ITe second dealt with the household's water use practices. ITethird consisted of bidding gmes designed to eLcit the household's willness to pay for improvedservice levels. The fourth obtained infrmation on the household's attitude towards Issues conectedwith the provisio of ddinkg water. Th fifth module aimed to obtain information on householdassets
4.14 To captre infonmation specific to different types of households, five quesdonireshedules were used. AU the schedules contned the core questionaire in addition to thesupplementay questions required. The key details of the various schedules are as follows:
Schedule Al * For households connected to an operationalType A water swpply system;-vilage
Schedule A2 * For households voluntarily not connected toan operational water supply system;
Schedule Bll * For households pviously connected to anoperation system (system currdy in-
Type BI operatonal; resttion under conid-vilage eration);
Schedule B12 * For households not connected to the abovesystem when it was operational;
Type B2 Schedule B2 * For households in a vilge without a pipedvillage water systm and not expecing onw to be
insled in the near future.
4.15 Some biddg games included a built-in test to determine whether the srting pointof the bidding game affected the wfllngs-to-pay bids Ihis was achived by varying the startinpoint. For selected bidding games, half the questes contaned high stang pos while the atherhalf contained low starting points.
Stadstical tables and analyses generated by the suvey, grouped by subject, appear in theAppendixes.
P?qviga Rqxwt Seria 23
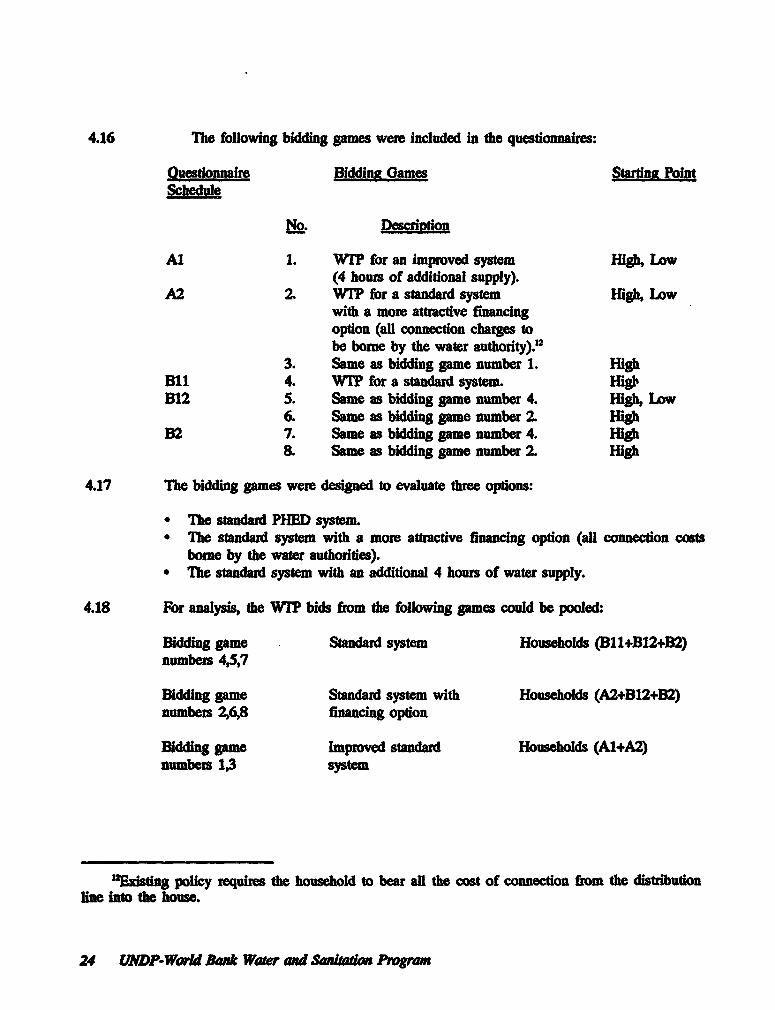
4.16 The following bidding games were included in the questionnaires:
Ouestionnaire Biddiuf Games Startinn PointSchedule
No. Descrition
Al 1. WTP for an improved system High, Low(4 hours of additional supply).
A2 2. WTP for a standard system High, Lowwith a more attrctive financngoption (all connection charges tobe bome by the water authority).'2
3. Same as bidding game number 1. HighBil 4. WTP for a standard system. Higi'B12 5. Same as bidding game number 4. Higb, Low
6. Same as bidding game number 2. HighB2 7. Same as bidding game number 4. High
& Same as bidding game number 2. High
4.17 The bidding games were desigaed to evaluate hree options:
• Mhe standard PHED system.* The standard system with a more atactive financing option (all connection costs
bone by the water authorities).* The standard system with an additional 4 hous of water supply.
4.18 For analysis, the WI? bids from the following games could be pooled.
Bidding game Standard system Households (B11+B12+B2)numbers 4,5,7
Bidding game Standard system with Households (A2+B12+B2)numbers 26,8 financn option
Bidding game Improved standard Households (Al+A2)numbers 1,3 system
nExistng policy requires the household to bear ali the cost of connection from the distributionhle into the house.
24 UNDP-World Ban Water and Sankdn Pogram
4.19 In addition to the above bidding games, evevy respondent was asked to descnibe thecharacteistics of his preferred water supply system. He was then asked via a direct question to indicatethe maximum montbly tariff he would be wg to pay for such a system.
Cor luciag the Surey
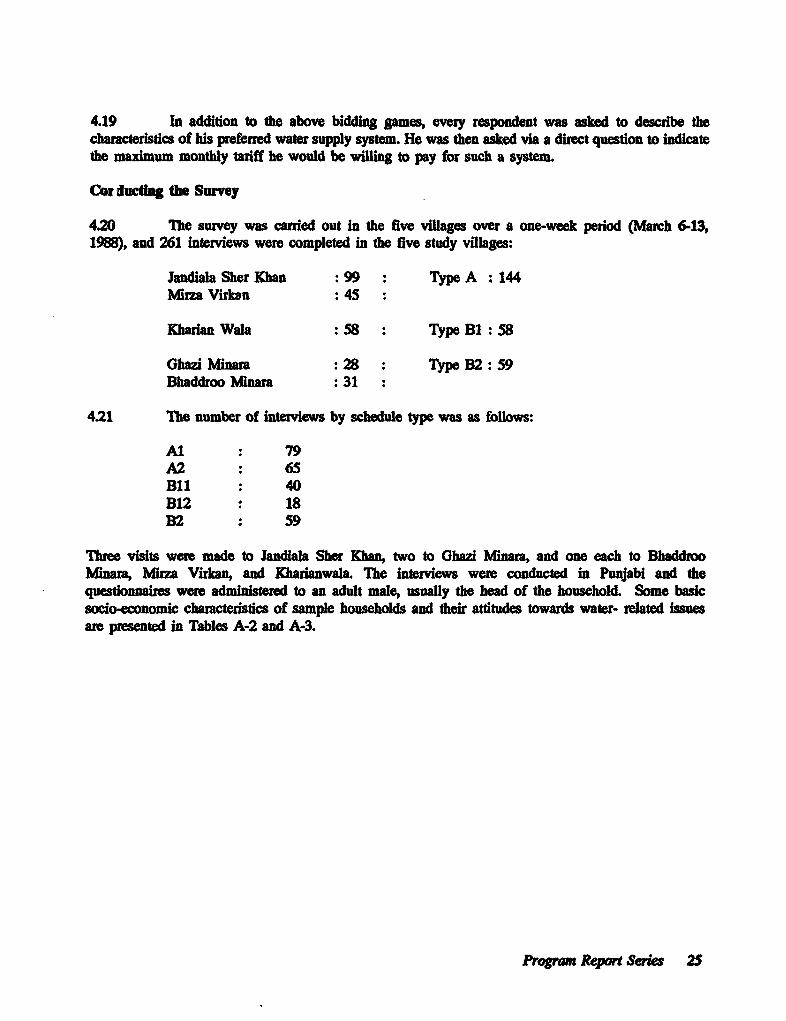
4.20 The survey was carried out In the five villages over a one-week period (Mlah 6-13,1988), and 261 interviews were completed in the five study villages:
Jandiala Sher Khan : 99 : TypeA :144Miza Virkan : 45
Kharan Wala : 58 : Type B: 58
obazi Minara : 28 : Type B2: 59Bhaddroo Minaa : 31
421 Ihe number of interviews by schedule type was as folows:
Al : 79A2 65Bil 40B12 : 18B2 : 59
Tree visits were made to Jandiala Sher Khan, two to (hazi Minara, and one each to BhaddrooMinara, Mm Virkan, and Kharianwala The interviews were conducted in Punjabi and thequestionaires were administered to an adult mae, usually the head of the household. Some basicsocio-economic chad cteristics of sample households and their attitudes towards water- related issuesare presented in Tables A-2 and A-3.
Program Repor Seria 25
5. Findings in the Sweet Water Zone:Analysis of Actual Choice Behavior
5.1 Water is fieely available In the sweet water zone. The quality of water from tradidonalsources (wells, handpumps) is considered to be satisactory and as good as water from piped watersystems. These two acts are important: water is not a scarce good and there is litde quality diffetiabetween water obtained from taditional sources and that obtained from improved sources lTerefore,if houseolds are spending money on higher seice levels it is either for considerations of convenience,status, or some indiret benfits not reated to needs of water for human cnumption.
Upgra&dg Sevie LevelI
52 ThU transition from wels as the pimary source of waser to handpumps inside the househas long been complete. Households have inured the capital cst of between Rs 60 and Rs 1,000in curret value for the couvence of not having to go outside the house to fetch water. This i8 soeven thouh in the sweet water zone public wells were comn ently located and never very far fhomany household. Indeed, the village center was mated by a well in a majoity of vilages.
53 A second transition is now in progess. Our survey shows that 20 prcent of thehouseholds in the study area have isaed electric motors onto the handpumps. T1h capital expenditureof between Rs 1,000 and Rs ,000 in curent pries, depending on the quality of the motor, obviatesthe need for manual pumpin. This s being followed by the i3stallation of ovhead tans (cast Rs400 to Rs 500m, Idoor plumbing (cost: apaximately Rs 400 for a 20 foot network usully enougbto operate a bathroom with shower), and flush toiles in some cases.
5.4 At considerable expense, households are putting in place modem indoor plumbing systemswith their own private source of water. ITe monfthly maintenance cost alone according to the surveyis Rs 6 for the handpump and Rs 16 for the motor. To this one must add the electricity chargesincured to operate the motor. Ihe tol monthly epenses are far in excess of the flat monthly tadffof Rs 10 for a house connecion to a public piped water supply system where it is available. However,even in villages where the latter option is available, 11 percent of the households have instald electricmotom. This could signl a demand for more reliable service. (Table A-4 shows the pattern ofhousehold choice over available sevic opto along with their approximate costs.)
Who Installs Ebctie Motsiu?
55 The statisical analysis (for deti see Table B-1) shows that the better educated, hieprpertied, and the more economicly affluent households have a significantly higher probability ofIsaing electric motors. These results accord well with the theoretical exectation that bett offhouseholds would be more wiling to invest in improved and/or more reliable levels of servie.
Progm Report Serks 27
5.6 Since handpumps quire manual effort for drawing water it could be hypothesized thatovercoming this inconveniewe might be a consideration in installing an electric motor. However, thestatistical analysis shows that neither the variables related to the need for water (household size andper capita consumption) nor those related to avaiable tabor supply (proportion of women and childrenin the household) are significant. iLs suggests that upgraded service levels ax the main motivadonfor the illation of electic motors (ioor plumbing and flush toilet are possible with motor-operated handpumps but not with manual handpumps).
5.7 Tis conclusion is important because village elites have historically exerted a vey strongdemonstration effect on the rest of the rral population. Their choices can therefore be taken as apointer to the potential demand for reliable, modem piped water systems in rural areas.
5.8 In this context the analysis highlights another important fact: in t*e subset of villageswhere a public piped water scheme exists, households are significantly less likely to install an electricmotor. Indeed, in such vilages only 11 percent of the households have electric motors, whereas invillages without piped water systems the corresponding figure is 30 percent. Ihis indicates that houseconnectios to a piped water system are conidered to be, and have the potential of being, an attracivealtemative for consumers.
5.9 However, it was also a fact that 7 pecent of households that had domestc connectionsalso had electic motowm Tis is a strong signal that public piped water systems have to be ofcomparble reliability to compete effectively with private altematives.
Wo Cowucts to Piped Water Systems?
5.10 In two of the sample villages, Jandiala Sher Kban and Micza Viran, hcoseholds havehad the altemative of connecing to a public piped water supply system with household connections.In the sample 55 peroent of the households had availed themselves of this alternative.
5.11 The statistical analysis (Table B-2) indicates that households that need more water (largerhousehold size and higher daily per capita consumption1 ) are more likely to connect to a piped system.At the household level there is no real limit to the amount of water that can be drawn up with ahandpump. However, the physical effort required increases in poportion. Iherefore, one couldconclude that for households with a need for substantial amounts of water the conveence of accessassociated with a piped connecion is a factor in opting for that choice.
5.12 It is also quite probable that in areas with good quality groundwater households withhandpumps have not invested in storage devices. Everyone draws up water for his or her own useand without water storage it is not possible for women and children to substitute their labor for thatof the adult males in the house. Perhaps this is the reason that households with a higher proportionof women and chldren are not less likely to connect to piped water systems (note that the respondents
I' he data suggest that essential daily per capita consumption of water is not an endogenousvariable, i.e., it is not higher for households because they have connected to piped systems. TableA-3 indicates that the value of the varable is actully higher in villages without piped water supplies.
28 UNDP-World Bapk Watr and Swhaiion Pmran
weoe all adult males). On t cony, households witb a higher proportion of children in thehowehold ane more likely to connect to a piped system.
5.13 The othae important condusion suggested by the statistica anysi is that wedth is notquite as sigdflcant ademlnt of fthe decisio to onmet to a plped system as it is for theInstallation of electric motors. is , perhap, becaue the fonner is a much less expensive choice(the capital and monthly operation and maintenance costs are Rs SO and Rs 10 as against Rs 3,S00and Rs 22 for an electric motor - see Table A-4) and therefore generally affordable in an area wherethe monthly household income was of the order of Rs ZOOO in 1964-1985.
5.14 However, cost considerations do enter into the deciSion to connect. 'Me variablerepresenting distance of the house from the distribution line is negative a64 significaLt . The costs ofconnection that have to be borne by the household are directly related to this distance (approximatelyRs 10 per running foot). The increase in cost with distance is likely to act as a detert to connecionnot only because of the expense but also, perhaps, because beyond a certain point the cost becomescomparable to that of an electric motor. The latter is lIkeLy to be a preferred alternative in suchsituadtons because of its gmeater reliability. The issue of reliability is important and shall be discusedagin later.
5.15 The analysis also shows that households engaged in farming are less likely to connectto piped systems while households with better education are more likely to do so. Households whichhave electric motors are not significantly less likely to connect to the piped supply system.
5.16 TMe reasons mentioned by the respondents for either connecting or not connecting to thepiped water supply system are listed i Tables A-S and A-6. TIese were obtned as responsew toopen-ended questions.
Electri Motor and UEhodmM Cwnwctou AlternatIe Cboices
5.17 Ithe ft that househods are significantly less likely to have electric motors in villageswhere a piped water supply is available cleady suggests that the two are considered to be alternativeimprovements in service level.
5.18 At the exdstig, subsidized, rates, a domestic connection to a piped supply system is amuch cheaper option. Both the average privately bome capital costs and the monthly operation andmaintenance costs are less than half for a domestic connection compared to a motor-operated pump.As a result; many more households can afford to upgrade to a higher service level in villages wherepiped water suppiles are available (59 percent as aginst 30 percent in villages without piped supplies- see Table A-4).
5.19 It is also of interest to note the relationship between the choice of service level and theeconomic status of the household in vilages where a piped supply option is avadable (Table A-7)Motors are installed by households at the upper end of the economic scale. On the other hand,domestic connecions are affordable to households only slightly above ite average value of theeconomic indicator used. The mast afiluent households have both electric motors and piped
Program Report Seies 29
connections. Given the poor performance of pubHc water supply systems, this probably reflects thewllgns to pay for reliable back-up service by hoseholds that can afford the expense.
5.20 If the exsting subsidy on the capital costs of piped sysems (approximately Rs 300 percapita with a household size betwe 7 and 10) is removed, the capital Costs of the two optionsbecome compuarble wbile the opetation and maintenance cost of the pipd syst remain lower.However, in such a situation the much greater reliablty of the private option would make it adominant choice, and connecton rates to public piped systems would be likely to fall very steeply.
30 UNDP-World Bank Water and Sanian Pngru
6. Findings in the Sweet Water Zone:Analysis of Willingness-to-Pay Bids
alytU BehvW
6.1 In te prios capter the _aysis was based on the acual, obsevable choices madeby Isn tis chapter th aalysis b based on the spoases proffered to hypothetical optionspreseated to the respondents. _ T sponse yield the maximum monhy taiff that a household iswiling to pay for the putcular opdon described.
6.2 To the extn tat hohold utand al the changes that will sut fom theacquition of the opo presentd, te amount they say they will pay, their bid, can sere as amesur of its benefit to thm WIP bids my nclude valuation of aesthetic, healb, and oter difcult--meau benefits of wate. If WTP bids e an accurate measure of iiduals' preres, the
summatio of the WIP bids for all households served by a project could semve as an estimate of thetota beefits of the prjecL It can be compaed with the cost of th project to decide whether theInvestmet is jused.
Servic Opt Offeted
6.3 I11 folowing sere pons were p ntd to different groups of respondets
3 A hoseold concto to a sadad piped water system of the type existing in typeA ville;
* -e same, with a mom affdble financing arngement and- A hoold concio to an improved piped water system.
6.4 I the Punjab the sandad system is designe to provide a maximum of 15 aOns ofwater per capita per day with the senice available for eight hous a day at the most However, actualperform is very uv (40 peret of the connected households exprsse dissatisacdon with thesystem) with problems of reliability, suficient pessue, sad srice for less than the specified period(See Tables A8, A-9, A-1) For this reasn, all households bmiliar with existing systems do notperceive h same pwduct when evaluating te 'stadad' system, espe y because prssure vaaotinsoocr almost fiom ae to bla
6.5 Mmb opt with an alteratie financig arrangement was offered to detemine if the lowconncton rate (5 peet of boueoldb) to piped water system was related to the stuctre of thecosts involved. Obtag a connecton requires two types of payments: a one-time payment madeup of an offici coanecon fee and the costs of connectg the bose to the distributo Hle, whichhave to be bomre by the houseold; and a flat monthly tri Mm dominant componet is the castof connecting the boe to the dbua le The co_nnectio fae is of the oraer of Rs 100, theconnection costs are of the order of Rs 500, and the mothly tuiff is Rs 10.
prt,5TU Repor Series 31
6.6 Cshb flow problems (i.e., the inability to bear the one-time costs) may be acting as adeteret to conmection for some households. To test this hypothesis, an option was offered in whichthe water authorities would betr the connecdon costs in exchage for a higher montldy tarf Theobjective was to test if comnection ratios would go up with the avaUabilty of such a fcingarnement and the extent to which tariffs could be raised.
6.7 The impmved system was offered to households In villagea where a system was alreadyoperadonal. The improvement offered was an increase of four hous in the daily supply period andthe willingness to pay for the imprved system was elicited.
Response of Househokd In Vbges wthout an Operatin Water System
6.8 Wilngness to Pay for Connetion to a Stndard syste At present no household ineither T¶ype B1 or B2 viUage has the option of connecting to a standard piped water system. Ihedifference between B1 and B2 viUages is that there are no pls to instll a system in the lattercategory. The BE village had a system in the past which has been out of operation for over five yewasand for whose restoration efforts are now under way. Within the Bl village we can distinguish thosehouseholds that had obtained a connection when the system was operational (Bl1) and those that hadchosen to remain unconnected (B12). When the standard system option was offered in the Bi villageshe WTP bids were conditional on the desgned performance level being guaranteed. This was madenecessary by the extent of dissatisfaction with the performance of the standard piped system when itwas operational.
6.9 The distnrbution of the WIP bids is shown in Table C-1. In calculating the connectionratio we can assume that all households whose WTP bids are less than Rs 10 would not connect sincethe existing tariff rate of Rs 10 per month is not likely to be reduced. We also treat the NoResponsee as prtest bids and add them to the group of households not likely to connect to the serviceoffered.
6.10 At the existdng tadff of Rs 10 per month, the percentage of connection frequencies forthe BlI, B12, and E2 households would be 70,833, and 74.6, respectively. The mean bids (computedover the valid responses) for the same groups are Rs 17, Rs 17, and Rs 21, respecively. The meanbids of the subset of households likely to connect are Rs 21, Rs 19, and Rs 25, respectively.
6.11 A number of observations can be made based on the above esimates:
* Thirty percent of the Bl1 households (all of which were connected when the pipedsystem was operational) would not reconnect even if the performance of the systemwere guaranteed. This reflects a loss of cdbility in the system.
* Connection ratios resulting at the existing tadff rate are quite high (74 percent in Dland 75 percent in 32). These compare favorably with the actual connection ftequencyof 69 pecent;, which obied in the BE vMage when its piped system was operationaLThis corespondence supports the walidity of the WIP methodology.
32 UNDP-World Bant Water and Santation Program
* The mean bid of the households likely to connect in the Bl vitlage is approximatelyRs 20 per month. Only 4 out of the 57 rsponses were for bids over Rs 25 permonth. Tbis i reassuring. The monthly maintenance cost of a motor-operated pumpis Rs 25, and because of its greater reliability, it should provide an upper bound onthe monthly tariff of a piped water supply. (The one-time costs of the motor-drivenpump are, however, higher. See Table A-4.)
* The mean bids are appoximately Rs 4 per month higher in the B2 village. This couldbe due to overbidding in B2, underbidding in Bl, or both. However, overbiddingseems the more likely expanation since nearly 19 percent of respondents bid Rs 50or more in B2 compsted to 5 pecent in Bl. Such high bids could be intepretedas evidence of stategic behavior.
6.12 Type of Houseold LAely to Connect to a Standd System. A multvaiate analysis ofthe WTP bids presented in Table B-3 indicates that youngr, more educated and properied householdsare more likely to connect. Farming households are less likely to connect compared with nonfarminghouseholds. Households that have a motor-operted handpump system are willing to pay Rs 7 morethan othes Tiis could be because, compard to their expenses on the motor system, a pipedonnecion would be a cheaper alternative even at the higher end of the feasible tariff range.Households that favor the metering of domestic conections are also willing to pay more, perhaps arlecftin of their appreciation of water as a valuable resource. (The complete results of the multivariateansalysis are presented in Table B-3.)
6.13 Wiingness to Pay for a Connecdon to a Stndard System with a More AffordableFinaning Arrangement. Types B12 and B2 households that had never previously connected to a pipedsystem were offeed a more attactive financing option (one-time connection costs to be borne by thewater authorities) to test if affrdaility was a factor in the decision to remain unconnected. Thedistibution of the WTP bids is shown in Table C-2. Tese can be compared to the WTP bids for thestandard option presented in Table C-1.
6.14 Table C-1 indicates that 17 out of 76 households (B12+B2) would not connect whenoffered the standard option (WIP bids less than Rs 10 per month). The comparable numbers fromTable C-2 are 17 out of 74. It is clear that the more affordable financial arrangement does not resultin inceasing the connection ratio. However, the mean bid over the B12 and B2 households increasesby approximately Rs 3 per month. is suggests some preference for the more affordable anangementamong even the households that would otherwise connect to the standard system.
Response of Households In Viaps with an Operatial Piped Water Sysem
6.15 Wdlingness to Pay for Connecon to an Imprvd System Type A villages arecharacterI by the existence of an opeationd piped water supply system which is working belowits design specfications. Type A viges include two types of households: Al, which have domesticcomections; and A2, which have voluntarily remained unconected to the system.
6.16 All households in the Type A villages were offerd the choice of connectig to animproved system, the improvement being an additional daily supply of 4 hours of watr from the
Program Report Series 33
existing sysem The distribution of the Wr? bids is shown in Table C>3. A number of obertioncan be made based on the figus
* The number of "No Reponse or protet bids is much highe han Types B1 andB2 villages (over 10 prct as compared to a maximum of 2.5 pecent). 1s maybe a reflection of the lack of credibility that houeholds famii with the peforanceof piped systems plc in any prmim of impovemet in the exitg systm.
* Ihe proporion of houseiolds bidding more than the existng ariff of Rs 10 permonth is about 50 prcent (51 percent for Al and 45 pert for A2 households)Thus, only half the households that ae curently connected to the system ae wingto pay more for an improved system, while half the households that am curntlyunconnected would connect to an improved system
* The mean WVW bids are low, Rs 14 for Al households and Rs 12 for A2 households.If it is assumed that none of the Al households connected to the standad systemwould disconnect if the service Is imprved x.e., the potest bids are ignored) and wilcontine paying the asing taiff of Rs 10 per month, thei mean WIP bid woulddse to Rs 15 per month.
* The mean Wi? bids computed over the subset of houshold iHely to connect areRs 20 and Rs 19 for the Al and A2 households, respectvely.
6.17 Type of HousehoWs LAe to Connect to an Improved System. The multivauate satisicdanalysis of the WTP bids (for deils see Table B-4) indicates that wealdtier households are wlling topay more for an improved system. Households that favor metered connecons ae willing to pay Rs6 more tha othets. Households with motors again bid Rs 5 per month more than those withoutmotom.
6.18 Households with a higher proportion of women and children are wlling to pay more foran ineased supply of water. This suggs that labor supply conside an not relevat in aeaswhere water does not have to be fetched from outside the house.
6.19 A vey interestig aspect revealed by the multivaiate analysis is the comparave bdeaviorof fauming and nonfarming housebolds. In vilages without piped water the former bid Rs 4 per monthess for a comnection to a piped water system. However, in villages where a piped sptem has beenin operation, farming households bid Rs 4 per month more than nonfarming households for anineased supply of water. Ths could be attributed to leaned bdeavior whereby fuming householdshave come to recognie some previously (prior to the instlation of a piped system) unforeseenadvantas of domestic conecdons. Our field obserations rvealed that households with aimas wervey keen on a domesti connecto because it made the task of washing them much more convient.Buffalo which need to be kept cool, cold be hosed down at home, aher han be ta to tho cnor the vila pond, tu saving on tim and squvio coss FPer, water for dnkig by analscoud also be povided tOugh the domestic connection. Although this hypotis w not tesedsttstcaly, as we did n collect infrmatio on animal ownershlp, if faring houehols own moreanimls than nonrming houseods the expcna would be quite plausible
34 UNDP-World Bak Water ad Sani'_n Progra
6.20 If the explanation is true, it would also have sgificant impication for the dedsg ofrural wat supply system Me PHED design cuiteir at prsent take into account human needs onlyand use a consumption fu of 15 gallons per capita per day. However, if households are actulysin the water to caer to animal needs also, including water-Intesive ones likm was the desig
estiate coud be easily exceeded. Perap this sug_sts one explanation for the ubiquitous pobleof low prsu which plgues ual wate supply systm In PMt
621 Wilhgm to Pay for a Coecdon to a Stdvrd Syte vAh a More AordableFinwwhsg Optin To expe he weasons for the nouconnection of A2 housolds to the existngsystem, ty were offered the same financig option mentioned elier in the case of type B villages.Tbe dibton of WIP bids is included in Table C-3. The data suggest that the aiabilty of theflexible financing option in tie type A villages would rwaise th, onnection ratio from 55 petrent(79/144) to 79 peet (113114A) if the existig tariff continues to be chawed. Appximtdy half thepreviouly unonnctd A2 househlds would connect Their mean bid for the monthly tarf is ls21.
622 Howeve, Table C-3 asbo shows that if the stadd system is improved (an extra 4 houmwer supply per day ovet te existing supply period) She same resulls could be obtained. Sligtlyless than half the A2 houeolds would conect at the existn ta Ther mean bid for the monthy
iff is Rs 19.
623 While it is possible that there may be very litde overap betwe the households thtdecide to connect in the two cases (poorer households might be the ones that connect under theflxble financing aptn while households dissatisfied with system pefom e migt be the oe tocoinn to the imprved system) the net result fiom the point of view of connecton rates is quitesimilar. Therfre, if the objecdve was solely to achieve high connection rates at minimum cost anychoic betw the two option woud need to be based on comparive costs.
PW RepoAt Swim 35
7. Estimated Revenues andCost Recovery Potential
7.1 The wllWess-topay bids can be usedto estimate the likelihood of connecdon to ndthe m ues geated fom the pvsion of various upgraded services. Such a computation helpsdetermine whether the provision of such services would be economically sustainable.
Pa1ision of a Stkdard Piped Water Systm In Villages Falr with Such Systems
72 The Type BI village is particularly attracive frm the analytical point of view. Type B1households have had first-hand experience with a piped water system but do not have access to thesame at present. Therefore, their willingness-to-pay bids are for a commodity with which they awequite familiar and for that reason could be expected to be more reliable than if the commodity hadbeen a hypothetical one.
73 Canwecdon Frequces. The connection frequencies and revenue estimates are shown inTable C-4 and are plotted in Figure 7.1. At the existing monthly tadiff of Rs 10 the connectionfrequency would be 84 permet, if the sevice level wv juaranteed. This is to be compared with theactual connection frequency of 69 percent (at Rs 10 per month), which prevafled when the piped watersystem was opeatnl over five yeaws a. There are numerous indications that the system was poorlymanged and it eventually fell into disuse. The impact of that history is demonstrted by the fact tbat,even with a performance guatee, only 83 perceat of the households that had previously beenconnected indicated a willingness to restore tbeir connections at the previous tariff rate of Rs 10 permonth.
7.4 The plot of connection frquency against monthly tariff rates lends credibility to the bidselicited thrugh the willingness-to-pay method. Tree reference marers could be used to interet theplot. Below Rs 7.5 per month the connecton frequency is very high (95 percent and above). This isas it should be since Rs 7.5 is the approximate monthly expenditore at the minimum acceptable servicelevel, the manually operated prnvate handpump. At Rs 10 per month the connection frequency isapproximately 84 percent which compares favorably with the actual frequency (69 percent) whichpevied at that rate. As mentioned earlier, the increase in comecdon frequency could be attributedto the fact that a performance guarantee was part of the package offered to respondents. Increasedeconomic grwth during the past five years could also be a contributing factor. At Rs 22.5 per monththe connection frequency drops to 21 percent. Thi corresponds well with the response of the 26percent households that have installed electric motors in the Type BI village; monthly expenditure onelectric motor-operated systems is around Rs 25 per month. At Rs 27.5 the connection frequencybecomes negligible at 7 percent, indicating that the ectric motor is the preferred option at this tariffrate.
7.5 Monty Rewue. The plot of revenue against montbly tariff (Figure 7.1) indicates thatrevenues would be mximazed at a tariff rate of Rs 17.5 per month Revenue yield would be Rs 1026
Program Report Series 37
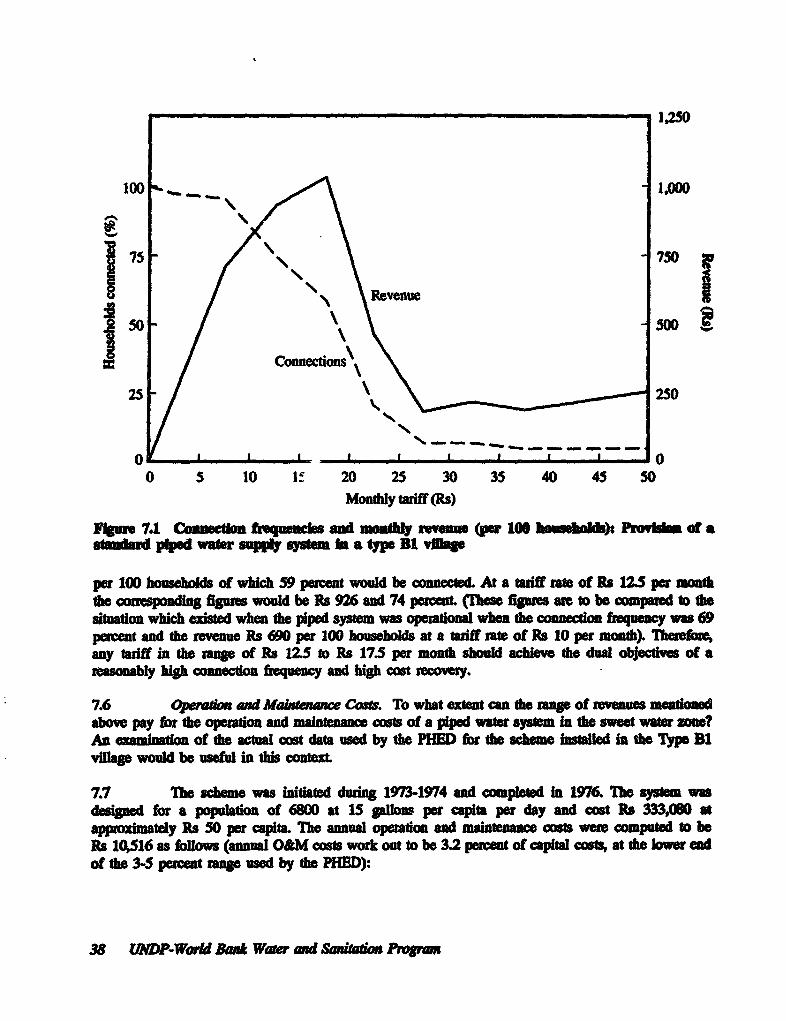
1,250
da0 Revesonutehla e 81
25 2r0
0 0 5 10 if 20 25 3 5 40 45 50
F~~~~uws ads d andyrvem (pe h0 eusslioli): PtiwMaa of astmmiu PW wa sr pply systm In a type Bt age
per 100hmchd of wih59 percent b cnnctd At ariff rate of Rs 125S per monthdie figus would be Rs 926 and 74 percn (fhes fiues are to be compared I situation wbich existed when the piped system was opetona when the connection fequency 69peret an the reenue Rs 690 per 100 households at a taiff rate of Rs 10 per month) T)eSfore,any tarff in the tinge of Rs 12.5 to Rs 175 per month shud achieve the dua objectves of areasonably high cnnetio frequency aud high cost recoveq.
7.6 Op_wdon amd Mai ane Cost. To what extet can tho nge of revenues mentiondabove pay for the opeton and maintenance coss of a piped water systm in the sweet war ZOn?An examinaon of the a cost data used by the PHED for the scme isalled in the Type Blvlg would be usf in ths coteL
7.7 ITe scheme was iidated dung 1973-1974 and competed In 1976. Ihe system wasdediged for a popdation of 6800 at 1S gallons per capita per day and cost Rs 333,080 atadprximately Rs 50 per capita The annual operadon and maintenan costs were ompted to beRs 10,S16 as fows (anmnal O&M costs wok out to be 3.2 pent of capital costs, at the low endof the 3-5 peroet rag uosed by the PHED):
38 WWDP-Wol Bak Water and Saio Pmora
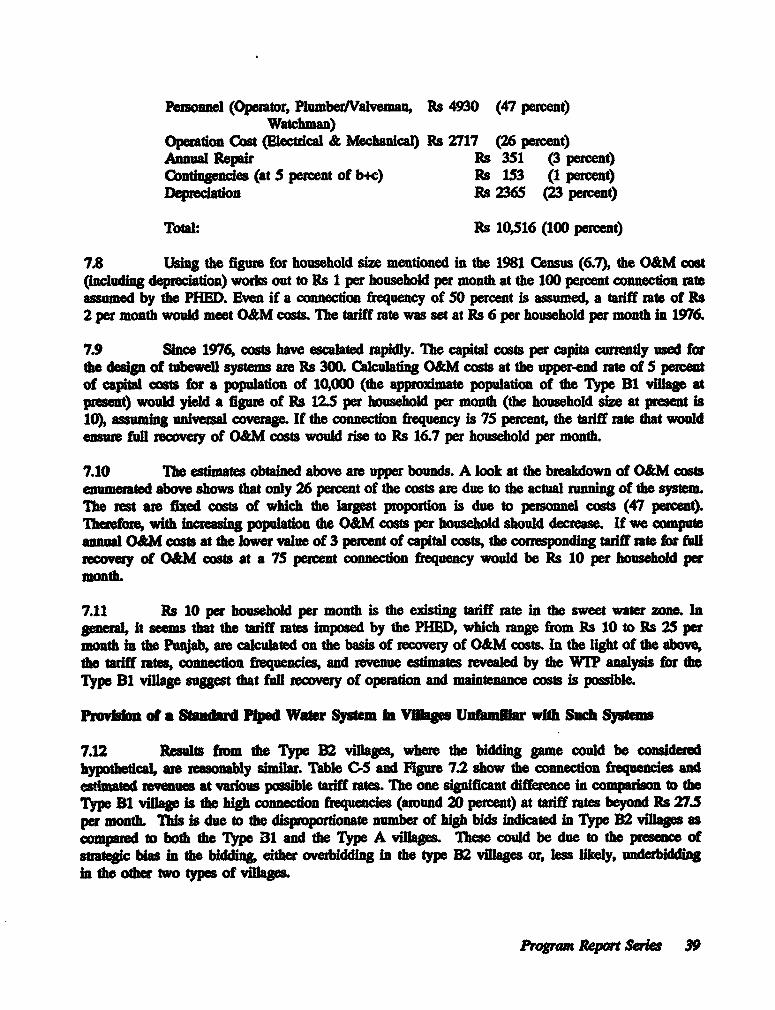
Personnel (Operator, PlumberValveman, Rs 4930 (47 perent)Watchman)
Operation Cost (Elecical & Mechanical) Rs 2717 (26 peret)Annual Repair Rs 351 (3 percent)Contingenies (at 5 percent of b+c) Rs 153 (1 percent)Dwercation Rs 2365 (23 percet)
Total: Rs 10,516 (100 percent)
7.8 Using the figre for household size mentioned in the 1981 Census (6.7), the O&M oost(Includig deprecaon) works out to Rs 1 per household per month at the 100 percent connection rateassomed by the PHED. Even if a connection frequency of 50 peret is assumed, a tariff rate of Rs2 per month wud meet O&M costs The tariff rate was set at Rs 6 per household per month in 1976.
7.9 Suice 1976, costs have escalated rapidly. The capital costs per capita currently used forlhe desg of tubewell systems are Rs 300. Caculating O&M costs at the upper-end rate of 5 perentof capia costs fr a populatina of 10,000 (the appmate population of the Type B1 illage atpresent) would yield a figure of Rs 125 per household per mouth (the household size at present is1), mumng uivm coverage. If the connection frequecy is 75 perwe the tadff rate that woldenmue full recover of O&M costs would rise to Rs 16.7 per household per month.
7.10 Ihe esdmates obtained above are upper bounds. A look at the brakdown of O&M castsenumerated above shows that only 26 percent of the costs are due to the actual running of the system.he t are fixed costs of which the largest proporton is due to peromel costs (47 percent).
Theefoe, with increasng population te O&M costs per household should decrease. If we computeanual O&M costs at the lower vWalue of 3 pewcent of capital costs, the corr dng tariff rate for fulnreovey of O&M costs at a 75 perent connection frequency would be Rs 10 per household permonth.
7.11 Rs 10 per household per month is the exisng tariff rate in the sweet water zone. Ingera, it seems the tariff rates imposed by the PHED, which range from Re 10 to Rs 25 permonth in the Punjab, are calculated on the basis of recovemy of O&M costs. In the light of the above,th tarff rates, connecdon frequenes, and revenue estmates revealed by the WT? analysis for theType Bi vilage suggest that full recovery of operadon and maintenance costs is possible.
Psiwkb of a S_dad !pkd Water System In Vilges Unfaia with Such Sysems
7.12 Results from the Type B2 villages, where the bidding game could be cosideredhypoteical ae easonably similar. Table C-S and Fure 7.2 show the connection frequies andestimd rves at vaious possible taiff rtes. one significant difference in compaion to theType Bi vMage is the high connecdon frequeies (around 20 percent) at tariff rates beyond Rs 27.5per montdL is is due to the disprpotonate number of high bids indicated in Type B2 villages ascompad to both the Type 31 and the Type A villages. These could be due to the pence ofstaeic bias in the bidding either overidding in the type B2 vilages or, less likely, uerbdgin the other two types of viages.
Program Repor Sria 39
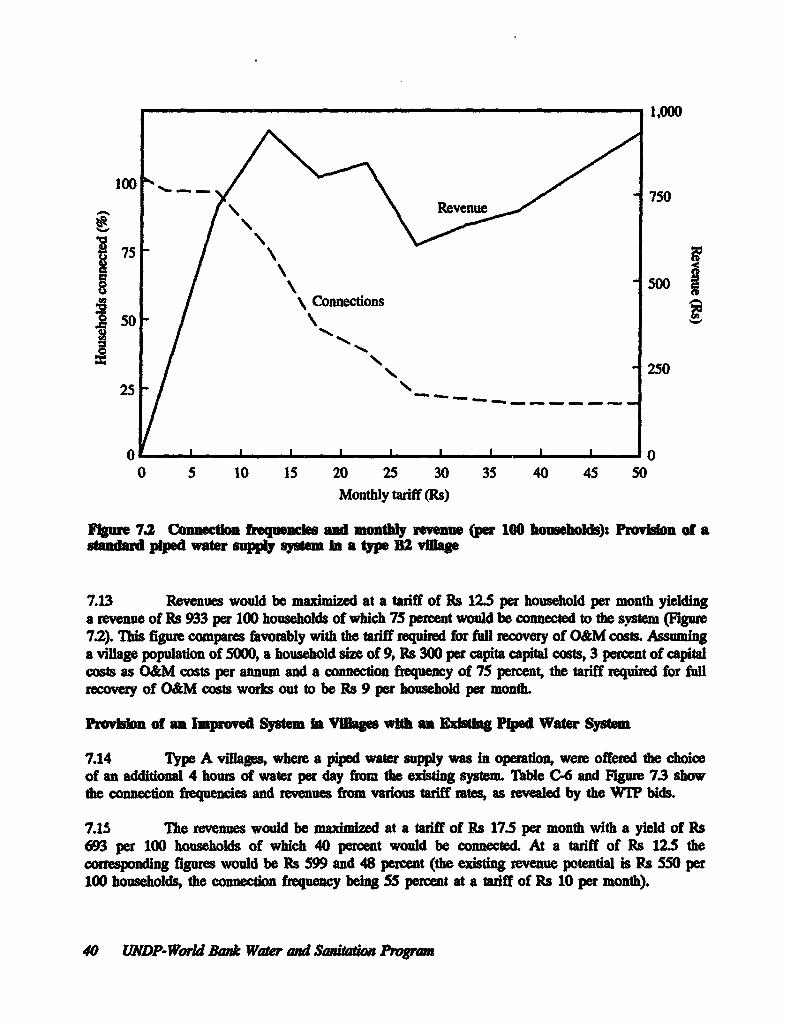
1,000
I 00:_ 750
]75 _- /\\\\ \ 7
\ Connections 500
25025--
0 5 10 15 20 25 30 35 40 45 50Monthly tariff (Rs)
FIge 7.2 Conuetlan frequsucles and mont revene (per 100 householks): Provisn of astadard piped water supply systm In a type B2 wiage
7.13 Revenues would be maximized at a tariff of Rs 12.5 per houehold per month yieldinga rvenue of Rs 933 per 100 houeholds of which 75 percent would be connected to the svstem (Figure7.2). ITis figure compares favorably with the taiff required for full recovery of O&M costs. Assuminga village population of 5000, a household size of 9, Rs 300 per capita capital costs, 3 percent of capitalcosts as O&M costs per annum and a connection frequency of 75 petcent, the tariff required for fullrecovery of O&M costs works out to be Rs 9 per household per month.
Provi !n of an Impmoved System In VMlags wih an Exdsng Piped Water System
7.14 Type A vilages, where a piped water supply was in operation, were offered the choiceof an additional 4 hours of water per day from the existing system. Table C-6 and Figue 73 showthe connection frequencies and revenues from various tariff rates, as revealed by the WTP bids.
7.15 The reenues would be maximized at a tariff of Rs 17.5 per month with a yield of Rs693 per 100 households of which 40 percent would be connected. At a tariff of Rs 12.5 thecorresponding figures would be Rs 599 and 48 perct (the existing revenue potential is Rs 550 per100 households, the connection frequency being 55 percent at a taiff of Rs 10 per month).
40 CJNP-World Ba* Water ad Saiatio Poram
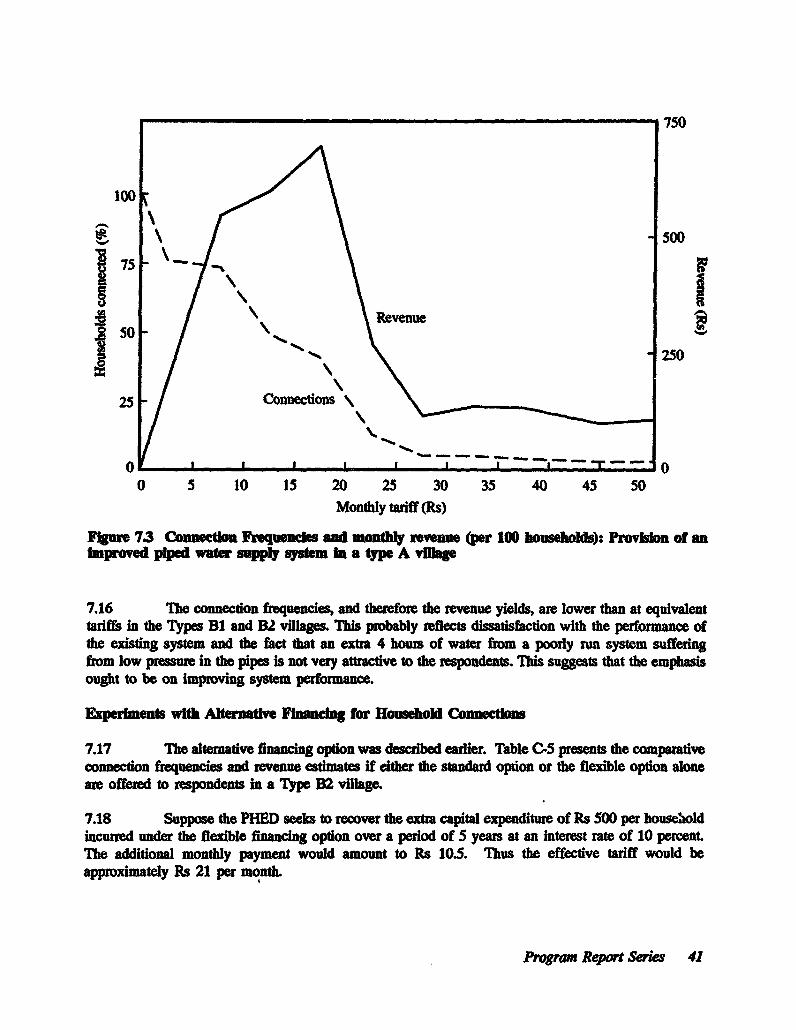
750
100
500
£50250
25 Connections \
0 5 10 is 20 25 30 35 40 4S 50Monthly tariff (Rs)
Fue 73 Cectiou, Freqnces and mot revenu (per 100 households): PIrovison of aSImprved piped water su*ppl sysem in a type A viue
7.16 Ihe connection frequencies, and therefore the rvue yields, are lower than at equivalenttariffs in the Types Bl and B2 vllages& This pObably reflecs dissatisfaction with the performance ofthe existing system and the fact that an extra 4 houws of water from a poorly rA system sufferingfrom low pressure in the pipes is not very atrave to the respondents. This suggests that the emphasisought to be on improving system performanCe.
EpeIments with Atwnative Finnig for Household ConnCto
7.17 The alternaive finacing option was descibed eadier. Table C-5 presents the comparativeconnecdon frequencies and reveaue esimates if either the stadard opion or the flexNble option aloneare offered to respondents in a Type B2 vilage.
7.18 Suppose the PHED seeks to recover the extra capital expenditure of Rs 500 per householdincufred under the flexible financing option over a period of 5 years at an interest rate of 10 percentThe additional monthly payment would amount to Rs 10.5. Ihus the effective tariff would beapproximately Rs 21 per month.
Program Repo Series 41
7.19 he two optioucan now be compared. A the oaxltg tff of Rs 10, 85 p ofthe households would connect to the stan6rd system yielding a montlyf r Bue of Rs 850 per 1000households. At a taiff of Rs 21 per month under the flexible opdon, 54 perceut of the housldswould conect yielding a monthly revenue of RS 1134 por 100 households Ilus, the rmue yieldwould impove but the con1ection frequency would decine. Te objecdve of the poicy would notbe served.
7.20 A varant of the policy would be to offer the fexgible financing optio only to thhouseholds that have not connaected to the system at the existng iff rate. The contion &quencand revenue estimates resulting fom such an offer to A2 hosehold in a Type A ve are shownIn Table C-7. At a taiff of Rs 21 per montb, 24 peent of th oushlds would coaect to tesystem aiing the overl connection rate to 66 pert (55 peet huehol coanected at theexistng tariff plus 24 percent of unconnected households conneing uder e fleaibe financinganrangement). Thus, under the cost recovey conditions stipulated, the poicy of oeng both thestandad and the flexible optio in the same village would succeed in aising the connecdon ate tosome extent.
7.21 The monty revenue yield per 100 households under the above scenado woud amountto Rs 781 (ts 10 x SS + Rs 21 x 11). I can be compe to the evenue yild f the exlstgsystem is impoved in the Type A village. Table C-6 shows the connection frequencies and thervenue estimates While the exact costs of prviding an additional 4 hour of water per day ar notknown, suppose that the tariff would have to be raised to Rs 17.5 per mor b. At this tadff theconeton frequency would be 40 percent and the monffly revenue yield per 100 eholds wouldbe Rs 700. Thus, the connection rate would be considembly lowe and the mothly eue wouldbe only margnly less compaed to the flexible financing option.
42 UNDP-World Boe Water and Satatim Pgr.p
8. Brackish Water Zone:Overview and Field Procedures
8.1 Faisalabad Distrct is alo loct in te co l cnIrrigUed par of the Punjab. Ihedistrict capital* Faiabad Mty, had a population of 1,104,209 accoilng to the 1981 cenus. It issituated 145 kIlometess from Iahor, the capital of tho PUmjab, and is the third largest city in Pakistan.Fslabad is an Intenationally recognized center of the teffile industry.
8.2 Almt half the area in Fasalsbd Disutict lies in the brackish groundwater zone. Wateris available at accssble deptbs but its quality is generally perceived to be poor, although there arevations, often witin vllages
83 Villages in what is now the bckish water zone formerly relied on wells as their primarysoue of water. In keeping with he tansition in the sweet water zone almost evey household hasnow replacod that source with a pdvate handpump inside the house.
4 However, because of deelopments attributed to water-logging and salinity, the qualityof ounmdwat has deteiorated overtdme so that by now dissatision with its taste and its impacton health is fairly widespread. Of the households without accs to piped conntions, 54 peroent relyon sources other than thei pive handpumps for water used for ddarnkg and cooking Among thesealterative souce an canals and public handpmps alongside water-courses channeling water frmcna to agrcultural lands where the seepage water is of better quality. Water from such sources iseither fethed by hosehold members who devote appoximately 35 minutes per day to this task ordeliered for a charWe by water caiers.
85 In such a situation piped supply systems provide the only conenient source of goodquality water. Neither privato handpumps nor motoized pumps can provide water of similar quality.Terefore, it is not surprising that connection frequeciwes to piped water supply systems are on thehigh side, awund 75 percent
8.6 What is surpising is the high percentage of sample households (50 percnt) that haventheless inted motorized hanbpmps. Tis is patly attibutable to the fact tbat the motorizedpump can yield somwbat better quaity water than the handpump by going deeper into the subsoiLIt alo unde_ores the demand for water-laed conveniences like indoor plumbing, ush toilets, andshowess, which are not acoessible with handpumps.
8.7 Te above fac suggest that omestic connections to a reliable piped water supply systemshoud be prefered to motoized pumps because they can prvwide a better quality of water fit fordindng and cooking in addition to the water-related conveniences mentioned eulier. Besides, domestcconecdons ae a less expensive choice for the consumer.
Poram Report Series 43
S8b0km of Sft* VW""
88 The selction of Type A vlag was randerd difficult by the need to ensure a rasotlepoportion of households that d remined unconnected to a piped suWly system by choice; theconmtecion frequencies wero generally on the bigh side. Two vfge Manawala and Sudhar, wereselected wher the conctdon frequencies weae aund 75 pcnt. Manawala, a large village nowincopo withi he limits of the Faisalabad municipaty, has a piped supply system more than10 yeas old. Sudha, on the othe had, has a piped supply systm which was only commissionedin Januar 1988.
8.9 Selection of Types B1 and B2 villages was slghtf ¢ There ar many vilt wherepiped suppies an scbeduled to be installed. The selected illaes of the type, Bbaiwala andAkhlga, are at the sae where the disiution malu have been laid but domestic comnctons haveyet to be sanioned. The system in Bbaiwala b based on a tubewell, while that in Akalgarh is basedon filered canal water. The two Typ B2 vile are both lcated close to the disrict headquarters.
810 The owing are the paicula of the six selected vilgs:
• bfiaewala :TypeBA
* Bhalwala Type. El
Santpuwm Type B2Gatwala
All the scted villages exceeded a popu size of 5000. A more detailed profie of the selectvla is provided in Table D-I."
eso te Qos_,r and B8ding Gam
811 The quionnaires are the same as used in the sweet water zone with only minormodificatons due to siwseci ndens and the exeenw gained in the is ound ofinteriewing. Mm one majdr d is that there is only a singlo schedule pertining to the TypeBi viae since, nie the weet wate zone, there was no need to ditnguih among households inthe Bl vmage
"4ta6tic tables and analyses generated by the survey, grouped by subject, appear in AppendixesD, A and F.
44 UNDP-Wold B* Watgr ad Sa&iaion Prgram
&12 The biddig games wern desied to evsluate the following opidons:
The sandard PHED piped water supply system of th kind exiting in Tye Avillages. i option was offered to all households. T WTI of already connectedhuseholds (Al) w icited by bidding up fram th exisng tarff. Ihe WI? of thevluitaly unconnetd bouseholds (A2) was elcitod by bidding up from a tawiff rateof Rs 0 per montL
* An impved piped water supply system which would supply clean and safe watercontinuously with adequate pressure and rliability. Tis opon was offered to eveayhousehold.
* The standard PhD system with altemradve fa arngm Only A2households wore offered the folowing two alternatives:(a) 50 poe t of the conanon costs to be bore by the water authorities; and(b) 100 peroent of te connecton costs to be bone by the water authoriies.
8.13 Ihe design of the bidding games ensured tht potest bids and genuine zaro bids wouldbe clearly identified. When a respondent indicated that he would not be willing to connect to thepiped water sytem at the lowest monthly tarff included in the bidding game, he was asked whetherhe would connect if the manthly tariff was zero (Le., the water was free). If th respondent indicatedthat he would stll choose not to connec, the eumator asked him to explain the reason(s) why.The lowk ad hh stng pointswed weres 20 and Rs 40 pe moth as compued to Rs 15 (orRs S in some cases) and Rs 50 in the sweet water zome. In the a a of the startin pointshouseholds eitbhr had low stag point or high st poits for both the games offred to them(for existing and impoved systems).
Condctg the Smrvey
814 Ihe survey was caried out in the 6 vilages over a 1O.day pedod (August 18-28, 1988).Some basic socioeconomic chatist of sample households and their attitdes towards water-rdated issues are prseted in Tables D-2 and D-3. A total of 495 interviews were compileted, asfollows:
Manawala : 106 : Type A: 202Sudha : 96 :
Akalgh : 106 Tpe B1: 200Bhaiwala : 94 :
Sanwtpum : 52 : Type B2: 93Gatwala : 41
Pogrma Report Ser 45
The number of interviews by schedule type was as folows:
Al: 151A2: 51BD: 200B2: 93
Two visits each were made to Manawal, Sudbar, Ak blh and Bhaiwaa and one each to Santpuand Gatwaa.
46 UNDP-World BW* r and Santat Prqram
9. Findings in ihe Brackish Water Zone:Analysis of Actual Choice Behavior
9.1 WaW is fiely availble in the bdackish water zone. The quality of water from traditionalsources (well hmndpmps) Is generally considered to be poor for drinkng and cooking except fromhandpmps slond water chanels which pick up seepage water from canals.
92 The tUnsito fm well to handpumps as the pmay source of water is complete.Most households have privte haodpumps inside the house to cat to their water needs. However,for dinkin ad cooking many households fetch water from ouside (public handpumps along watclanels at the villge periphey or canals) or have water delivered to their homes.
93 About 50 pet of the households in the sampled area have installed electric motorson thei pnvse handpump. Te motodred pump, because it can Lft water from a greater depth thanthe manual pmp, yields somewhat beter quaity water that households not wiling to expend the timeor efbot quired to c watoe fom ouide use for dnkng and cooking as well. The electic motorsalso provd th m upgaded sevices tat were mentioned in the case of the sweet water zone.Hower, th quity of pipe water is clealy considd supeeior, and, wherever the option ofconnetg to such a system is avaiable, the conction fequencies are high. Table D-4 shows thepatte of houseld choice ovr vailale service optons along with their apprximate costs
Who lDab EZsetric Metw.?
9.4 Onoe spin, the saisdcal analysis (for details see Table EB1) confirms expectations basedon econc theory. Beer educated, economically affluent and propertied households are more likelyto inall electric motrs Houseol wth more animals kept inside or just outside the house are lesslHey to install motors Nhi sugget that animal needs are not a factor in the decision to installelectric motor Perhaps water obtined from this source is considered too expensive for such a
95 One impota differen from the pattem in the sweet water zone is that vadables relatedto household sie sad tme spet in feng water are quite unambiguously positive. This wouldmake sene in the brackish zoe wbere motors are also used to imprve upon the quality of wateravailabl fom handpump. lius, motors would serve both the objective of making water-relatedsetvices avaib and of prwviding better quality water for drinking and cooldng inside the house.This is one reason for tho greater inidence of motor-operated pumps in the bracish zone (62 percentof in Type B villgs ainst 30 percent in the sweet water zone).
9.6 As in the sweet waer zone, households with access to piped water systems aresignfty less likely to isa elctric motors (33 percent of households in Type A villages against62 prcent in Type B villages). Th Is because, ideally, piped coxnnions provide better quality wateras wRlL
Prqgram Reou Series 47
9.7 However, 33 pert of households In Type A vilges continue to have motor-opeatedpumps (29 percent have a piped conection as well as a motor). Ihe corresponding numbers in thesweet water zone are 1 peroet an7 peret. Part of the explanation cod lie n the fact that oneof the sample vfllages, Sudbar, has had a water supply for less thaD six months. Households that hadinstalled motors prior to the provision of piped water might continue to retain them till such time asmajor repairs are required (44 permet of hoseholds in Sudbar have motots against 23 pemrent inManawala). Ite other reason could be the greate relability of electric motos in povidig water forgeteral household needs besides drinking and cooldg.
9.8 Households that consider water from their prmary source (handpumps) to be satisfictoryfor health are less likely to install motors, but the vadable is not statsticaly significant. This wouldsuggest that the quality of water is not the primary motivation in installing electric motors.
Wbo Connects to Pipd Water Systems?
9.9 In two of the sample villages, Manawala and Sudhart, households have had the aleativeof connecting to a public piped supy system with domesdic connection Of the sampled households75 percent had availed themselves of this altetive.
9.10 Ihe statistical analys (able B-2) shows tbat better educated and economically affluenthouseholds are more likely to connect to piped water systems Households located further away fromthe distributio line are less likely to connect because of the increase in connection costs
9.11 Households that consider water from their handpumps to be unsafe for health are moreliky to connect to piped systems. The coefficient is statstica1ly significant sggesting that theimprovement in water quality is an imporant factor in the decision to connect
9.12 Farming households and those with a higher propordon of children are less likely toconnecL Tims could be, as argued earlier, both because of reduced needs ad the availability of laborto fetch water for drinking and cooking fom outside the house. Tis rinforces the conclusion thatpiped water serves much more as a substitute for water fetched frm outside the house than moor-operated pumps.
9.13 Coury to the pattn in the sweet water zone, households with motors are more likelyto connect to piped systems (the coefficient is positive but not significant). This suggests that the twooptions are not considered to be complete substitutes in the bmckish water zone.
9.14 Houeholds that favor the metering of wat supies have a greater likelihood ofconnecing to piped water systems.
9.15 One variable which needs explaion is per capita household expenditue Both thelinear and quadrtic terms are dose to significance with the fomer having a negative and the lattera positive coefficient One explanation could be the poor conelation betw iome and expenditureat low values; an increae in expenditure und to incomes (e.g., increase in family size) would
48 UNDP-World B Water and SaniatiPron ram
stain the budget which might be adjusted by giving up items for which cheaper alternatives aneavailabie Water, which can be fetched at zero out-of-pocket costs, Is one such item. nn the otherhand, at higher leve, Iraes in per capita expenditure could be expected to reflec. ucaeases inincome.
9.16 The reasons mentioned by the respondents for either connectig or not connectng to thepiped water supply system are lsted in Tables 5 and D-6. 'Mes we obtaied as rspon toopen-eded questions.
Ebetric Motors ad Household Connections
9.17 Ideally, household connections to piped sytems should be a dominant choice becausethey are not only less expive than electic mons but also prvide better quality water. Howver,in reality, piped systems have not proved to be weliable enough to be acoeptable as a dependablesource for water-related sevices like idoor plumbing, showers and flush toilets. Therefore, even ina village lile Manawala where the piped supply is over 10 years old, 21 pernt of householdscontinue to have electic motors along with domestic connections
9.18 hs lack of rliability has restricted the utility of piped systems to providing limitedwater of good quality for drinking and cooking, In villages without piped supplies 38 pecent ofhouseholds rely on the base service level of handpumps in villages with a piped supply the percentagealis to 21 percet. Hov, households that desire a reliable upgraded service level cannot do so
without investng in a pdvate electric motr.
9.19 For compron with the sweet water zone, Table D-7 shows the rlationship betweencoice of sevice level and the economic status of the household in villages where a piped supplyoption is available. Once again, it is the most affluent households that have both a domesticconnection and an electric motor.
Pogmm Report Series 49
10. Findings in the Brackish Water Zone:Analysis of Willingness-to-Pay Bids
10.1 The following opdt were evaluatd through biddig games:
* A hounehold connection to a sandad piped water system of the tpe existing iType A villages;
* Tie same, with more affordable financing an . This option was offeredonly to the unconnected households in Type A villages; and
* A household connection to an improvod piped water system.
10.2 he perceptions of households wnih experience of piped waer sysems am presentedin Tables D-8 and D-9. It can be noted that 66 permet of the connectd households eprseddissatisfcod with the operation of the system, with tie prmaty complait reating to its reliiity.
10.3 To detemnine the acceptance of a well-functioning system, willingness-to-pay bids werelicited for an improved system. ITe improved system was sipulated to provide clean and safe water
on a continuous basis with an acceptable level of reliability and presure.
10.4 Howeholds that had _mained uncmnected to available piped watr supply systemwere offered two alternative finang packages to detemine if the one-time connecton costs were afctor in their remaining unonnected. In the packages offered the water authorities were to bear 50perent or 100 percent of the connection costs in return for a higher monthly tariff
W _o to Pay for Con(ecton to a Standard System
105 The distribution of WIP bids for connecion to a standaird piped water system isprsented in Table F-1. In the brackish water zone bids for such a system were . jtained from TypeA households as well as from Types BI and B2 houeholds.
10.6 A number of observaions can be made based on the data presented in the table:
* Ihere is little difference between the bids obtined frm Type B1 and Type B2household. The mean bids are Rs 41 and Rs 37, respecdvely; the percentages ofhouseholds bidding more than Rs 12 per month (and therefore likely to connectat the pevailing tarif) are 97 petcent and 90 perent, respectively; and the meanbids of the latter households are Rs 43 and Rs 40, respectively.
* he bds and conction ratios are slightly higher in the Type B1llage incomparison to the Type B2 vfllage. Given that distibutn Hnes have aleady beenlaid in the former and there are no plans for the installtion of a system in thelatter, one would have expected strategic bias to lead to a convene pattern. Oneobvious explanadon would emerge i£ despite the advanced stage of installation,Type B1 households have no more information about system parameters (conectionfee, monthly tarif) than Type B2 households. This would also consitute conceteeviden of the lack of community paticipation in the pepaation andimplementaton of village-level project The relevant data are presented in Table
Prgm Reot Seie 51
D-1o, which rvewas a very high level of nonawareness regarding basic informationabout the pamneters of the piped water syslem. This nonawareness is just asprevalent in Type BI villages as in Type B2 villages.The pattem in the Type A villaSe is quite different. The mean bid (Rs 16) andthe connection atio (75 pent) are much lower than in either of the villageswithout operational systems. Even the mean bid of the connected households (Rs21) is about half the mean bid of similar households in the other villages.
Ihere can be two possible reasons for the above patter Fist, the experence of Type A householdswith the piped supply in their village could be negatively affecting their bids; Types B1 and B2households, not aware of the ctual performance of such systems, are not only bidding higher but morehouseholds are indicating an intention to connect than in the Type A village. Second, there could bean anchoring or strategic bias effect because the existing tariff is known to the respondents. In this,the design of the bidding game for already connected households, which involves bidding up from theexiSting tariff to a value at which they would disconnect, could be a contbuting factor.
10.7 2ypes of Households ith Higher Widlingness to Pay for a Standard System. Amultivariate analysis (see Table E-3) shows that the WI? bids are systematically related to a numberof explanatory variables. Households that require more water (geater household size and per capitaconsumption of water) and those that need to spend more time fetching it from outside the house bidhigher than others.
10.8 The bids are positively and significantly related to household expenditure per capita;an increase of Rs 100 in the variable would raise the bid by approximately Rs 2. Younger households,those which include members who have lived outside the ilage, and those favorag the meterng ofwater connections bid more than others.
10.9 Households that consider the water from existing sources to be satisfactory for healthbid Rs 3.5 per month less than others but the variable is not statistically significant. Theonsigificance of the existence of electic motors (50 percent of sampled households ponessed motors)
indicates that they are not considered as substitutes for piped water.
10.10 As mentioned earlier, households in Type A villages bid significantly less comparedto Type Bi households. There was no significant differ between the bids of Types Bi and B2households.
Wilnss to Pay for Conecdon to an Imprved System
10.11 The distribution of WIP bids for connection to an improved piped water system ispreented in Table F-2. It should be kept in mind that Types AZ B and B2 households were askedto assume that, for the improved system, connection costs were zeto. This was to maintaincompatibility with Type Al households that already had a domestic connection and would not haveto incur connecton expenses again for access to an improved system.
10.12 The following obsevations can be made based on the data presented in the table:
The connection ratios are very high and similar for al three types of villages: 95percent, 99 percent and 97 percent for village Types A, B1, and B2, respectively.
52 UNDP-World Bank Water and Sanitat Progratm
* The mean bids are again similar for the Types Bl snd B2 vilages (Rs 58 and 51respectively), which, in tum, are higher than the mean bid in the Type A village(Rs 33).
* The fact that Types B1 and B2 households were offered connections to improvedsystems at zero connecon cost (compared to connections to the standard systemfor which they had to bear the connection costs) does not seem tc have affectedtheir bidding to any significant extent. Thus, the icrses in the mean WI? bidsover the standard system for the Types A, B1, and B2 households are 98.5 percent;40.9 percent, and 37.6 percent, respectively. The corresponding figures computedonly over those households likely to connect (those bidding more than Rs 12) are64.9 pement; 37.7 perent, and 29.5 percent, respectively. In both cases the increaseis much more for the Type A households. This could be due to the fact that havinghad expeience with the standard system, the Type A households could appreciatethe improvements much better than the Types BE and B2 households for whom thestandard system itself would be a great imprvement.
10.13 a pes of Households with Higher Wngnss to Pay for an Improved ysteL Themultviate analysis (see Table E-4) shows vitally the same patters as for the standard system;households that are willing to pay more for the standud system are also willing to pay more for theimproved system. Wealth, education and health considerations emerge as additional significant variablesin the case of the improved system.
Response of Hosehods In Viages wth and whout Opera_Ion Piped Water Systems
10.14 To develop an understanding of the factors that affect the willingness-to-pay bids forvarious senvice levels it is useful to focus on the Type A and Type B villages separately. Since TypeA households have had actwal experience of existing piped water systems, their eWaluation of such asystem would reflct concrete considerations. It would be of interest to see the overlap with theconserations that affect the evaluation of an hypothetical improved system. A similar analysis couldbe performed by comparing the evaluation of the standard system by Type A and Type B householdssince for the latter the standard system represents a hypothetical choice.
10.15 Respome of Type A Householk. The results of the multivariate analyses of WTPbids offered by Type A households for existing and improved systems are presented in Tables E-5 andEA6 It can be noted that the only significant considerations in the case of the existng system areincome (expenditure) and ownership of livestock which is kept inside or just outside the house.Households with such animals are willing to pay Rs 2 per animal per month more than others. hetypical livestock owning household possesses two animals. The premium of Rs 4 per month constitutes25 perent of the mean value of the dependent variable.
10.16 Ths last consideration is important and it confirms the hypothesis that was developeddunng the analysis of the sweet water zone. Piped water from the existing system is used for washinglivestock and this suggests that the consumption figures used by the PHED in the design crtera oughtto take this factor into account.
10.17 In the case of the improved system the significant considerations are income, wealth,household size, age, concems about health, and attitudes towards meteing of domestic connections.While ability to pay and animal needs dominated in the case of the existing system, modern attitudesand quality of life considerations emerge as sigificant in the evaluation of the improved system.
Progrwn Report Seris 53
Younger more affluent and more di ting households bid higher for a 'modern systemregardless of whether they owned analor not.
10.18 Response of Type B Households. Me response of Type B households to the existigsystem (Table E7) shows that household size and per capita consumption of water ate significantdeteminants of WTP bids indicating that the need for drinking water plays a pan in the evaluatinIn addition, age and preferene for the merg of domestic onmections are other signficantdeterminans indicating the influence of atfitudes.
10.19 The vadables for wealth or income ae not significant, suggesting either that the bidsare not anchored by the ability to pay or that the aiff rates are a very low proporion of monthlyincomes and so consdered genraly affrdable by most households bidding in an hypotial madreIke latter hypothesis is supported by the fact that wealth does emerge as a sigificant vaal in thebidding for the impwoed system.
10.20 Moreover, the coefficient for the owneiship of animals is negative and not significanTIs is a strong suggeson that learnig has taken place in the Type A villages sultiag in thesignificantly higher bids by the owne=s of livtock.
Reponse of Ilc nete Househods k Type A Vlages
10.21 To explore the reasons for nonconnection, Type A2 households they were offered twoalternative finacing affangements for sharing the costs of connecdon to the existig system. Under thefist anangement the water authorities would contribute 50 percent of the costs while under the secondthey would contribute 100 percent of the costs; in exchane the tadff would be raised.
1022 Table P-3 shows the distrbudon of the WIP bids. It can be seen that while nohouseholds ate at present cnnected at the prevailing tariff (Rs 12 per month) the connecto ras(at the same tarif) under the two a ts would be 47 percent and 63 percet, dspec y. Themean WI? bids of the ecting households are Rs 16 and Rs 21 per month, respecively.
10.23 Table F-4 shows the distrution of the WI? bids offered by A2 housolds for animproved sysm At he existing tiff 82 percent of A2 housholds would connect to the Imvdsystem. Teir mean WTP bid is Rs 27 per month as tarff.
54 UNDP-World Bak Water and Saitaon Poga
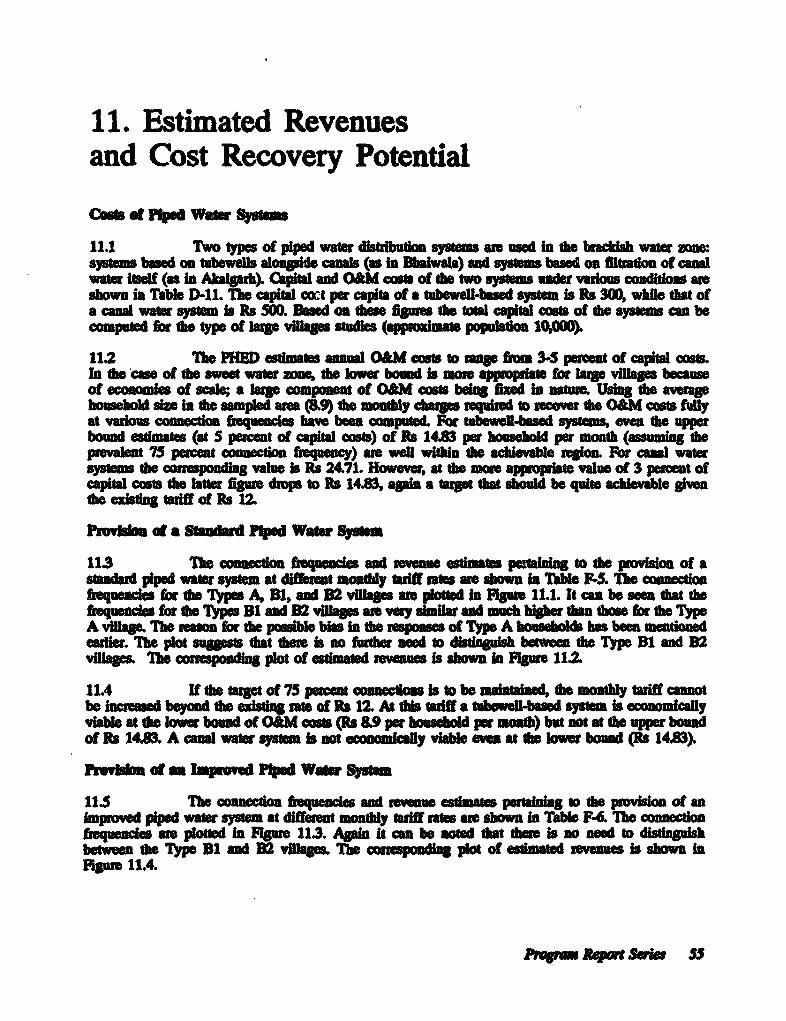
11. Estimated Revenuesand Cost Recovery Potential
cw os rs Id Water Sestm
11.1 Two yp of piped wat distiat systems a used In th backish wat zwsystm boed oa tbwlls i canas (as in Bbahvaw) ad sym basd on filtraionof calwaw itself (as in Akga). C and O&M cass of toe two systm suder vario condWos amshown in Th. D-11. The ait cos per capita of a tubowellb4ed syste b Rs 300, whle tha ofa cau walwar sytem b Rs 500. Bsed n s f e toWl cdita cos of to system can beompued fr dth type of larg vMas studie (ppopulation 1o_ 00).
112 TIe PHED esimas anua O&M cos to rang fo 35 peat of capitbl cos.IQ t cas of te sweet watr zons, the boe bond Is more for lr villae s bocumof econmies of scale a ag co_mp t of OJM costs beig fiSed in nature. Usingdte averah_oud size in the samped am (89) *t monty charges rquid to rcv t O&M cosls fyat varios connco fequenci hv ben computed. For tubwll-basd sysatms, en th uebound estmate (at 5 pec of capital cos) of Rs 14.83 per houseold per mraoth (assumg thepale 75 percent _c c freqency) are wel witi the acivabl rebgion For can watersystems the rresponding vau s Rs 24.71. Howeve, at th more appopiae valu of 3 percn ofcpital cos the blt gue drops to Rs 14.83, agi atet that should be qut adhevable givete existng udff of Rs 12.
hrow o a Sla ud Pipd Water Sytm
113 The co_nneon fr nies and evu estima peaining to te povison of asandad piped water system at lt mo y tariff uses bhn In Table F-S. Mh conneciobeq_ado fo Types A, B1, and 22 vlg a plottd in FI 11.1. It can be seen that thefrequenie for th Types Bl and B2 vigs are very simila and much hWi ta te for the TypA vIlage. Th reason for the posib bias in h espw mes of Typ A house_olds has been mentondeaier. The plot susges that ere is no furdher ed to ditnus betwe te Type Bl and B2vllages. hemm pbt of etmated reue i shown in Figure 112
11.4 If the taet of 75 prcnt conn s b to be maintined, the mothy if cannotbe Iresd beyond th exiting of Is 12 At tl tdff a tbew ed system is eonomillyviab at te low bound of OhM costs (s 8.9 per ousehold per mont) but not at the upper boudof Rs 14.83. A and wate systmm b not economlclly viable en at th lowe bod (s 1483).
pa d of - Improved P4pd Wa_r Systm
11.5 Tb e conneci fiqu_cles and vmue estae peoig o the pwviso of animproved piped watr system at diffeet monty taff es ae shown in Tabe F-6 h connecifrequenci we ploted in RPr 113. Againt can be soted tht ere is no need to ditngushbetweenm te Typo B1 ad D vaes e corsndig plot of estme revene is shown inFigr 11.4.
?ira ReotS u 5
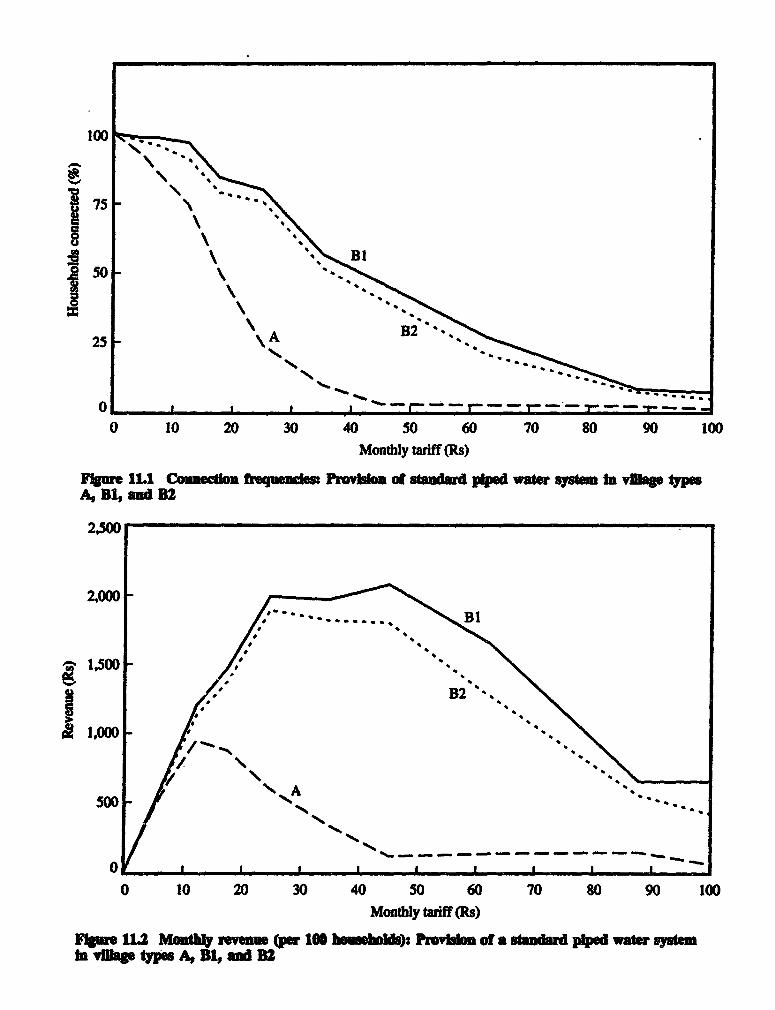
100
|75 t
8504
25 \A |
o~~~
0 10 20 30 40 50 60 70 80 90 100
Mondhly tariff (Rs)
,Igure 11.1 ConnectIon encts P_ovid ot _anud p"d water systm in 4age typesA, B1, and B2
2,500
2000
1,500 X
/10 -- ---
O 10 20 30 40 so 60 70 80 90 100Monthy tariff(Rs)
Ffge 1L2 Mef vom (er 10 lellDMlb)-. 1!oMo of a sbdd fpe wow eytit As 1
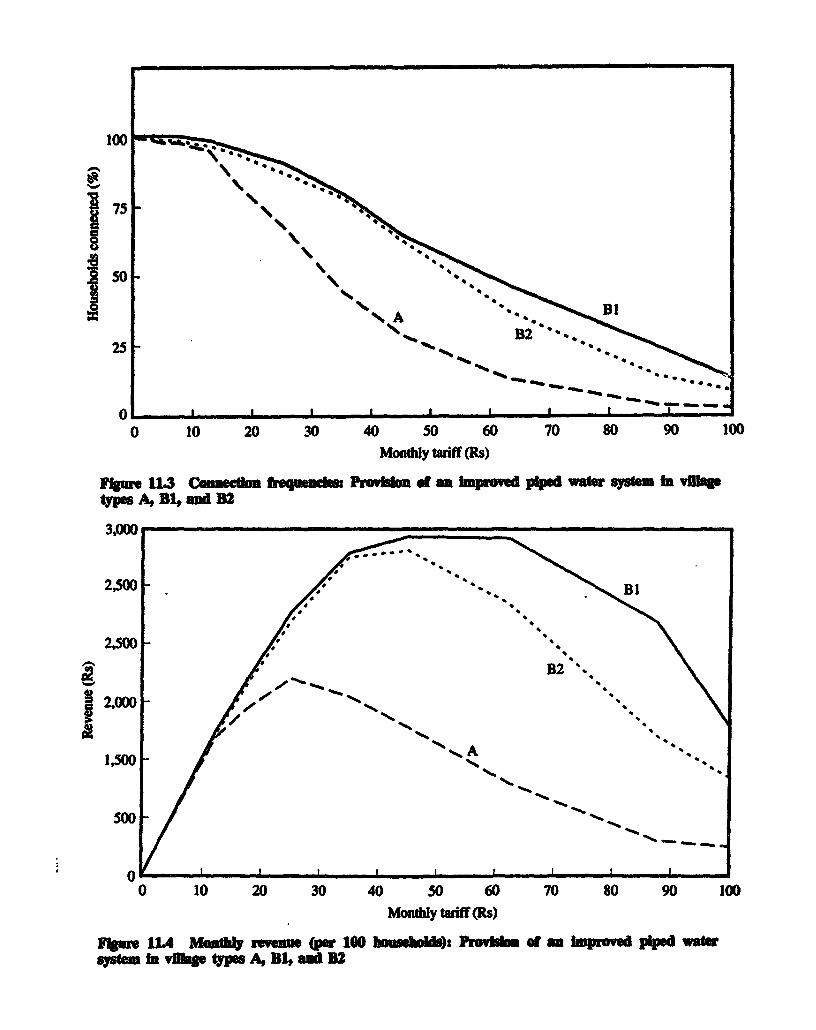
100
150
25
0 10 20 30 40 50 60 70 80 90 100Moutly tariff (Rs)
F%we 113 Comio feqms. Pri*h of a Iupnwd piped waft sysre hi f vi vltypesAtB B t e 1 B,2
3,000
2,500-
2,500
2,000
1,500
500
0 I I
0 10 20 30 40 50 60 70 80 90 100Monthly tarff (Rs)
Fuigr. 11 MoaftIy riemie (e 1*0 bom ): Pmvidsa ofn lm proved piped waftesystem In vIllag types A, Blt aind B2
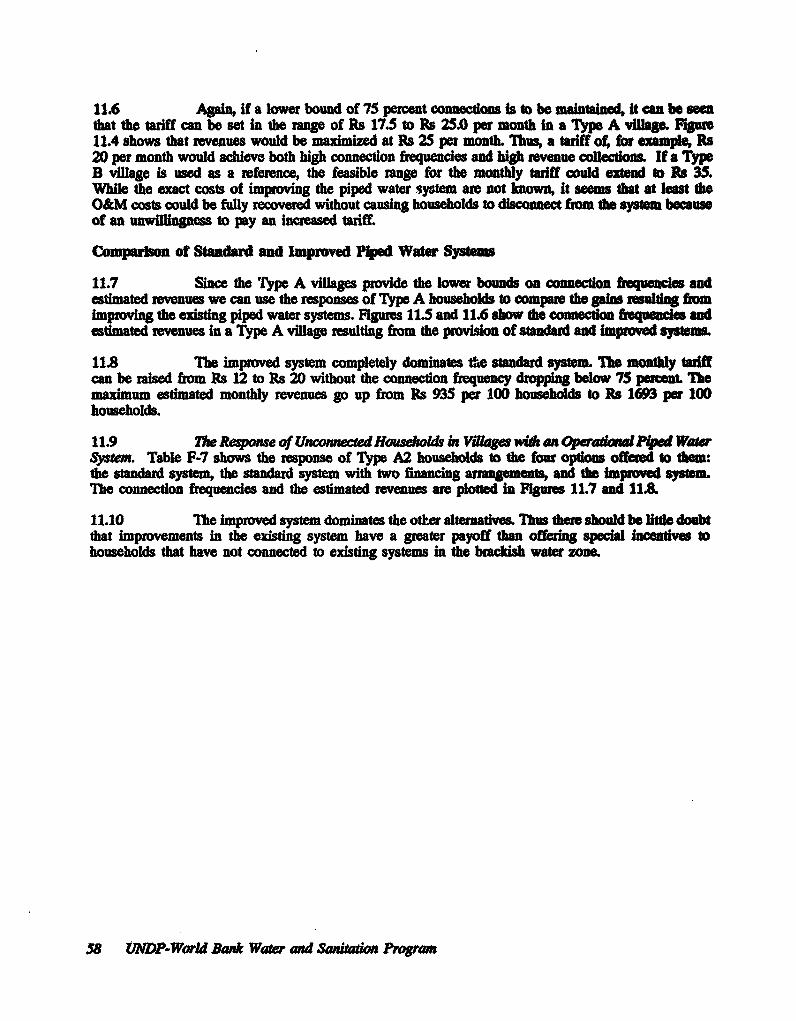
11.6 Agan, if a lower bound of 75 percnt connecions I to be maintained, tt can be enthat the taffcnbeserange of Rs 17.5 to s 25.0 per month in a Type A vlagF }*mIIA shows that revw ues wold be matx ed at Rs 25 pon motL Ihlus, a tdff of fo eample Rs20 per month would achieve both high connection frequencies and high rnveue colections. If a TypeB village is used as a reference, the feasible range for the monthly tadff coud exend to R 35.Whiae the exact costs of impvng the piped water system ane not known, it seems that at least theO&M costs could be fully recovered without causing households to discomect om thi systm becauof an utnwllgns to pay an increaod taiff.
Co,parbon of Stadrd and Impoved Plped Watr Systems
11.7 Since the 'fype A villages provide the lower bounds on connection fquen andestimated rves we can use the responses of Type A households to compare the gmis rultig impoving the existng piped water systems. Figures 115 and 11.6 show the connection &quecies andestimated revenues in a Type A ve resultig from the pwvision of standrd and impwvd systm
11.8 The imprved system completely dominates the standard systm Ih moly tariffcan be raised from Rs 12 to Rs 20 without the onnecidon hequency drpping below 7S prcent. Themaximum estimated monthly revenues go up from Rs 935 per 100 bouseholds to Rs 1693 per 100households.
11.9 The Response of Unconnected Housdsold in Vidlages wids an Opetadetm Piped WarSystem. Table F-7 shows the response of Type A2 households to the four opions offerd to them:the standamd system, the standad system with two financing a emes, ad the imprve systmMhe connection feques and the estimated revues ae plotted in Figures 11.7 and 11A
11.10 The impowved system dominates the other altnatves Thus there should be litte doutthat impovements in the existing system have a greater payoff than offeg special inentives tohouseholds that have not connected to exsting systems in the badcsh water zon
58 lNDP-World Bank Water and Santa Pogram
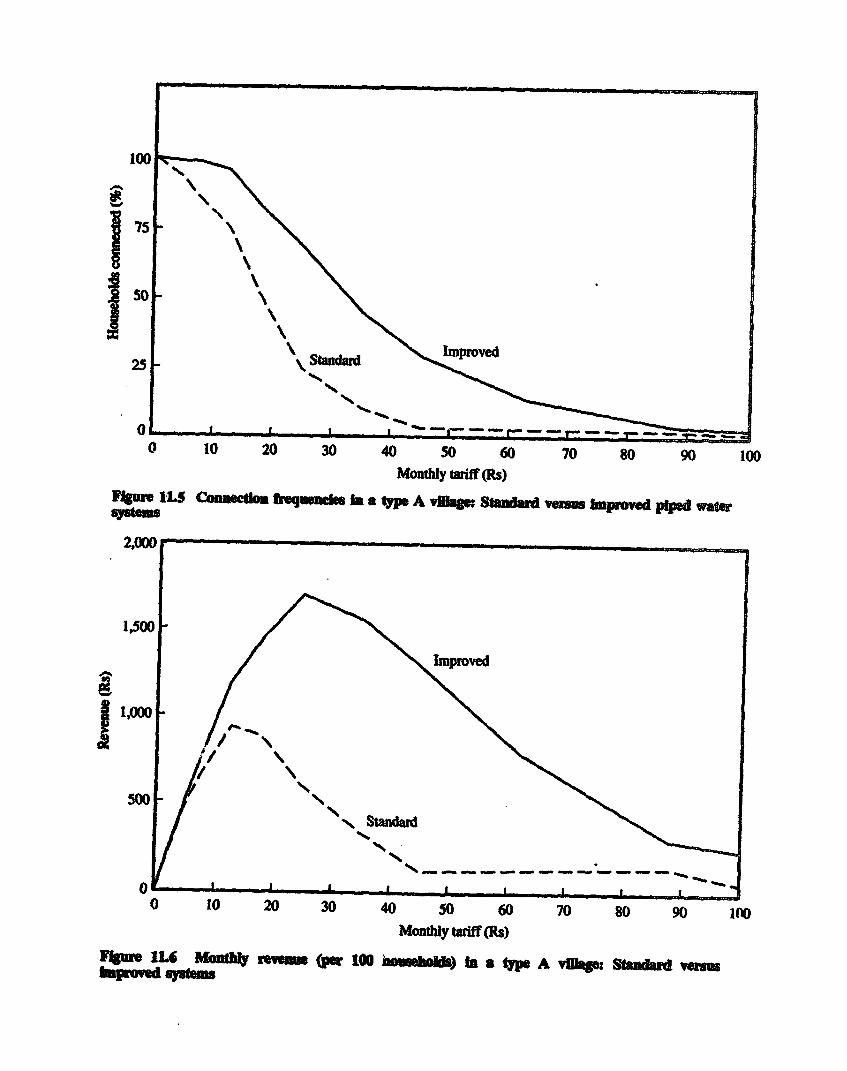
100
50
25
0 _ J - - ~- - - .13* -
0 10 20 30 40 50 60 70 80 90 100Monithly tariff (Rs)
uwi COnP lS fiequsmeeq In a type A v3.s: St _dad vwi Impovd plped VWe
2,000
1,00ISOO / \~~~~~~bnroe
1,000
500 NStandard
0 10 20 30 40 50 60 70 80 90 10O
Monthly taiff (Rs)
F1g UA6 Month "mm (Per 100 l_ ) In a t A ADie S dXr_d s
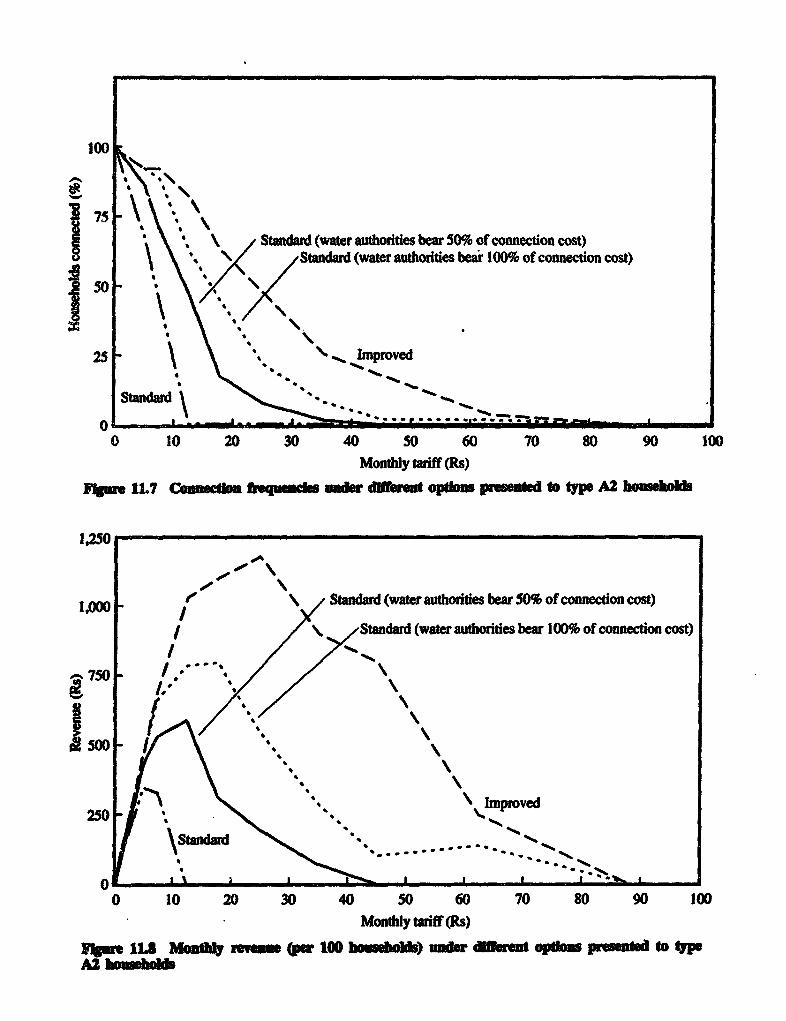
100
75 \ \'\, Standard (water authoties bear 50% of connection cost)
StanddStandard (water authorities bear 100% of connection cost)j50
o to 20 30 40 so 0 70 0 90 10
Montly tariff (Rs)1|2SO~~~~~~ .mp,-e
F%pm 11. Cemelma frequencies under dlffentd opdkuw presened to type A2 h.mhdbo
1250~~~~~~~~~01
1,000 i \ Standard (water authoriies bear 50% of connection cost)Standard (water authorites bear 100% of connection cost)
/q / g' a \ '''''4>
O -
2500
20 4
0 10 20 30 40 50 60 70 80 90 100Monthly tariff (Rs)
men 1L.8 MatM rev am 100-ne pr S) m_dir dffren opihu presetd to peA_ hb
12. Arid Zone: Overviewand Field Procedures
12.1 Rawalpindi Disnict is locatd in the nrtffemn, ai-Iigated part of Punjab. Thedistrict capital, Rawalpindi, has a population of 794,843 accordn to the 1981 census. It is situated16 kilomets from the federal capital, slabad, and 272 kiome m LahorI , the capita ofPunjab. Rawalpindi Is the ft largt city in w coouy ad is the headquartes of the armedforces. Not much lndustry is located in the distdct, .which has traditionilly been an amea of highrecruitment in the army.
12.2 Almost the enti area in Rawalpindi Distrct lien the ar zone oundwater iaviable at much greaX.r depths than i the ohr district sted sadve this ddes up dri thepeak summer period from April to July. Peraps because of the lack of water, the vies in the aridzone are much smaller, the tp village popultion lying between 1000 to 2000 ihabitants
123 VIllages in the arid wne rely on wells as their pdmary source of drinking water.However, unIe the other two zones studied, these welb are generally not within easy reach of thehouseholds. Becaue of the scarcity of agdcutual land most villages ae located on tocky formations,usually at an eleation above that of the agricultural lad. he undwater Is often at a moreaccessible depth near such and because of seepage from some water source (the Soan Rive i threeof the study villages) or the lower levadon. Thus, many wells, pivate as wel as public, are locatedat a dse frm the vllagev. In addition, the natual sources of water (river, rvne, ec) are alsoat a distance and often inlve a steep climb on the way bak
12.4 Because of the distance and the elevaion, water i8 fetched oldy for the most essenaluses. Many water-related activities take pace at the sources, eg., betbing, laundy, and watering ofanimals. Durin the summer, households spe a mely 6.5 peronhous per day in trvellingto and from water sources (cropared to 4 hours per week in te braksh water zoe). Most of thistime i8 spent by women and childn except for that rInved in the watering of animas, which isgenerally a task handled by men.
125 TMe summer months from Aprl to July are particularly difficult becaue of thebwerng of the water table. Water in wels becomes almost inacnessible and waiting time becomesexceedigy long. Ie need for water becomes an overwhelming concern durng this period before thegrundwater is recharged by the monsoon rains.
12.6 Vendors are present in vllges without piped water but only a minority of houeholds(5.7 perment) use them on any srt of guar basis. ds is perhaps due to the cost which can reachbetween Rs 100 to Rs l50 per month if a vendor is used to delivr 30 litem of water daily. However,
ndors are routinely used on social occasions like mariages and deaths. On such occasions a vendormay be paid between Rs 300 to Rs 500 to fetch as much water as may be needed over two or threedays.
fIhe oomputadons exclude queuing because infmation nly avaiable for mamximum queng uim
hProgaM Report S,er 61
12.7 Because of tho desperate need for watew, quite a few households have developed aprivate source (24.4 percent) or have attempted (5.4 perceat) to do so. While some have expmentedwith wells, otheas have tried a simple bore down which a tiuwe inch diameter metal sleea can belowered and dtawn up filled with water. Mhe costs are quite hig Digging a well costs RB 200 peryard through soft arth and Rs 400 to Rs 500 per yard thugh bard, stony, or mcky fboations. Abore cos Rs 75 peryard and oftn has to be bestwe 20 to 2S yads deep. Even so, it yields Uttewater and inv riably dries up duimg the summer monts.b. Co,msequeatly, efforts have icreased,begnning with the 5-Point Prgamme, to provide public water suppls to vilages in this rgionMany villages have received, or are in the prcess of receiving, public water supplies. Vilae smallerthan 50&0 Inhabit have baen selcted to recve piped watr sym with house connections,contay to th stated polcy of the Punab PHED. No schemes based on public taps ar underoonsideraton.
12.8 Connection tates were vezy high, and even in vilages supplied for less tau sixmonths, almost all the households had conected. This was so despite the fact that the monthly taiffof Rs 20 was much bigher ta in ithe other two zones studied. is underscores the great need forwater in the arid zone.
Seacton of Study Viages
129 Vlages with public watr supplies in Rawalpindi District showed two importfeatues. Most of tee supplies were relatively new (two years old or less) and the comecdon rateswere very high (close to 100 percent). These cha are reflected in the Type A villagesselected.
12.10 Because of te high connection rates there is no meangful disdtct between housesWith (Al) and without (A2) connections. heefore, a compaable analysis of actual choice behavorbased on connecton to the water sytem is not possible in the add zone. Ihe selection of B1 and B2vas was staightd. All the sdected B1 villages had public water systems at an advancedstage of constuc
12.11 The smal populat of the viages in te arid zone made it nocessy to selecttree villages of each type. The following are the partca of the nine seleced villages:
JawaBands : TypeADhalla
PapinPayal : TypeBiGorakpur
Dhuddia:Mohra : Type B2Bodhial
MThe avrage capital cost of a successful private source i Rs 7960 and the monthly mantenanceexpene are appxmatey Rs 40. TI uahl attempts have cost Rs 5730 on the avege.
62 ENDP-World Bak Water and Saiti Prgram
12.12 Tbree villages, on of each ty (Dhalla, Gomkhpur, and Bodhiul) were located bythe Soan River, ho main peenna iver in the area. The others were located by noupeal ravines.Th fllowing villages were located at a consideaable height above ground level: Dhala, Gorakhpur,Bodbial, Papin, ad Banda. A detiled profile of the selected villages is provided in Table G-1L
Dmxt*a of d I and BM Games
12.13 The questionires are essentially the same as those used in the brackish water zone.The oe 4mjor addition peains to secdon added to obtain more detailed informaton an al the waersourC0S avaiabl and on the pattem of water usage. ITis addition was made because, unlike the othertwo zo (whre handpmps inside the house were the prmary source of water), many more sources
e uosed and diffent soucs were used for different purposes. It was felt that more infmationought to be collected if a source choice model was to be constructed at a later stage and also to obtainestimte of te qutity of water fetched and time spent on water-reblted activities.
12.14 The specification of a soure dhoice model requies the precise identfication ofsources. I the sitation where multiple facities of a gie type existed (e.g, more than one publichadpump in the vilg) the failities were tecorded in the questionnais by their local nmes (e.g,moique handpump ot viUage center handpump, etc.). At the time of data entry each facility wasgiven a uique two digit code. Thus source 43 would indicate a public handpump (source type = 4)bcatd by the mosque dpump number = 3). Each code would denote the same facilty for allhouseholds. es Idecation codes would also be used to cross-reference the data on sourcecharcteristic and water usag.
12.15 Iormation on water usage patters dunng summer were obtained from allhouseholds.Howee, Infomation for the winter months was collected only from a sub-sample of households. Thisvas prmaiy to reduce Intview time and also because the limited objective was to obtain an averagescalg factor to estimate the cosumpion of water during the winter months.
12.16 Ther was one additional bidding game In the arid zone. Ihe details of the biddingames and the opdons they wera dedgned to evaluate are as follows:
A schme basod on public taps in which a public tap would be located at most20 yards fom any house, Water of satis&ctoiy quality would be available forapprximately 4 hours per day. Ibs option was offered to households in B2villages
* The standard PHED piped water scheme with house connections of the klnd existingin Type A vilages. This option was offered to all households in the sample. TheWIP of already connected households (Type Al) was elicited by bidding up fromtho existing waM The WIT of unconnected households (Type A2) was elicited bybidding up from a taiff ate of Rs O per month.
* An Improved piped water supply system with house connectons which wouldsupply clean and safe water continuously with adequate pssure and reliability.T option was offered to every household in Types A and B1 villages.
t i tl ad aalyses generated by the survey, grouped by subjec$ appear in Appendixes G,H and L
PgrWn Repo" Serie 63
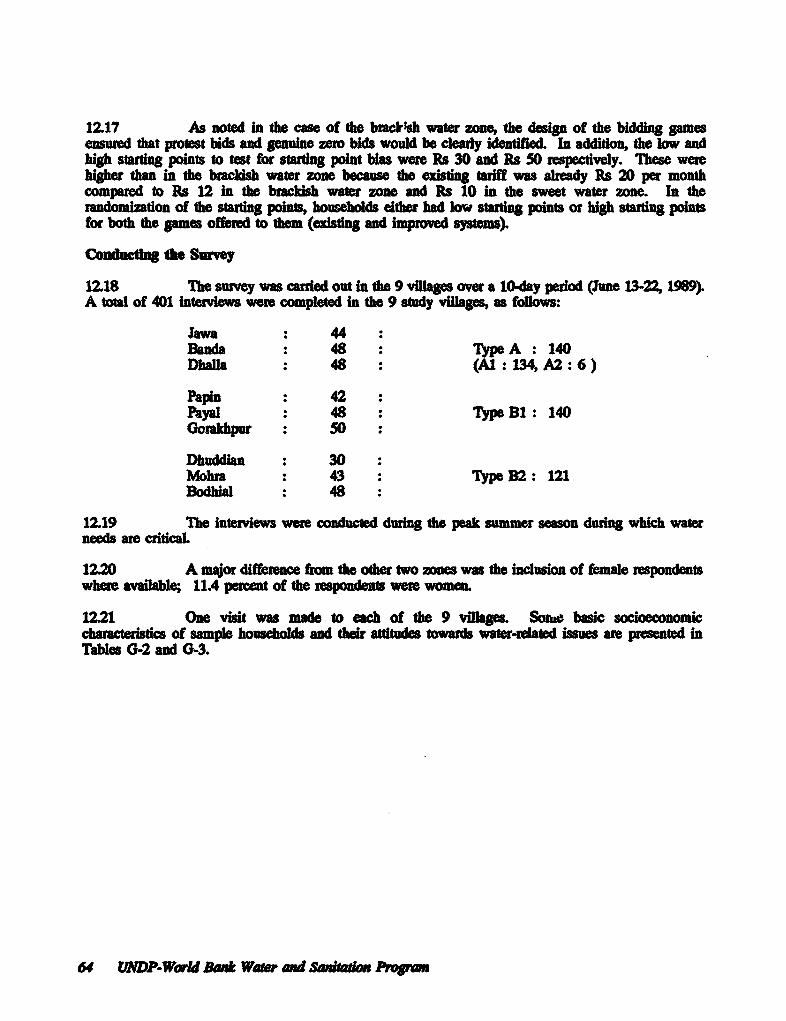
1.17 As noted in the caso of the backrlsh water zooe, the desig of the bidding gamesensured that protest bids and gene zero bids would be cleary identified. In addition, the low andhigh swtg points to test for stang point bia wee Rs 30 and Es 50 respecly. 'ese werehigher than in the brackis water zone becaue d exitng tadff was already Rs 20 per monthcompared to Rs 12 in the braksh water zone and Es 10 in the sweet water zone In themndomlntion of the sating poits, howueolds eiter had low suarg points or high starting pointsfor both the games offered to them (exist and imprved sysm).
C _nadcug th Suvy
12.18 The suvey was caded out in the 9 villages over a 10-day pedod (June 13-22, 1989).A tota of 401 interiews were completed in the 9 study vMages, as follows:
Jawa : 44Banda 48 : Type A : 140Dhalla 48 : (A1: 134, A2: 6)
pin : 42Payal : 48 : Type BI: 140Goakhpur 50
Dhuddian : 30Mohra 43 : Type B2: 121Bodial : 48
12.19 The interviews woer condued durn the peak summer season duing which waterneeds are criticaL
12.20 A major diflfrence fam the other two zones was the inclusion of female respondentswhe available; 11.4 peroent of the resodet were wome
1221 One visit was made to each of the 9 villages Sone basic socioeconomiccharacetics of sample housebols and their attitudes towar water-related issues ane presented inTables 0-2 and 0-3.
64 UNDP-World Boo* Wu.a and Satao PApw
13. Findings in the Arid. Zone: Analysis ofWillingness-to-Pay Bids
S Op Evaatd
13.1 he folowing options were evaluated thrugh bidding games:
* A scheme based on public taps (this option was offered to households in Type B2vilges);
* A household connection to a standard piped water system of the kdnd exisng inType A villages (this option was offered to all households in the sample); and
* A household connection to an improved piped water system (this opdon was offeredto households in Types A and DI villages).
132 The public tap option was offered since, under PHED guidelnes, this is the servicelevel that ought to be provided In the arid zone where the majority of villages a¢e below the criticalpopulation sze of 5000, which makes a vilage eligible fsr house connections. The bidding gameswould enable an asssment of the willin to pay for public taps as wel as yield an estimate ofthe premium that households place on domestic connecios.
13.3 The perceptions of households with experience of piped water systems are presentedin Tables G04 and 0-5. It can be seen that households ae reasonably satisfied with the serviceprimariy because the systems are relatively recent and, despite their shortcomings, are a majorimprovement over the past situationL Nevertheless, wilingeto-pay bids were elicited for animprve system. The imprved system was stipulated to prvide clean and safe water on a continuousbasis with an acceptable level of reliability and pres
Reponse of HeO bM IJ Villages wstout Pln for s of Publc Water Systems
13.4 Households in viages which are not under consideraion for the installation of publicwater systeMs were offered two supply options: A system based on public taps and an alternadve basedon house connections to a standard PHED system (the details of these systems were descrbed ealier).
13.5 The distributions of WIP bids for the two sevce options are presented in Table I-1. A number of obserations can be made based on the data presented in the table:
* The mean WTP bid for a system based on public taps was quite high (Rs 35 permonth).
* However, a sizeable minority (13 percent) of the households were not wiling topay anything for a system based on public taps. The stated tariff for such a systemis Rs 5 per month, but ff a more reasonable rate of Rs 10 per month is consideredfor the arid zone, appimatey 16 percent of tie households would not be willingto join the system.
* The mean WI? bid for the standard PHED system wnth house connectons wasRs 55 per month, a premium of Rs 20 over the public tap system. It should be
Pro8ram Repon Series 6S
kept in mind that the former also involves additional fixed costs due to coanetonand installation.Only 2.5 percent of the households were not willing to pay anything for thestandard PHED system. If the existing tariff in the aid zone (Rt 20 per month)Is used as a cutoff, the data indicate that 9 percent of the households would notconnect If such an opion were offered.
W to Pay for Conection to a Standard PlIED System with House Connections
13.6 he distributions of WIP bids for a connctio to a standard piped water system withhouse conmections in the three types of vs ate prasented in Table 1-2.
13.7 Ihe following obseations can be made based on the data prented in the table:
* There is very little differece between the mean bids obtained from Type A andB1 vfllages. 'e mean bids are Rs 39 and Rs 4Z respectively. Ihe mean bidin Type B2 villages, however, is sgnificantly higher at Rs 55.
* There appears to be a significant difference between the connection rates in TypesA and Bi villages, 95.7 perent and 78.6 percet, espectvely. How , theconnection ratio in Type A village is based on actual observation while that in Blvillages is derived from the WI? bids. Households biding below Rs 20 per monthare assumed not to connect if the system were installed. The comarable rate inType B2 villages is 90.9 percent
* The above information suggests the following interpretations:(a) The piped water supplies in Type A villages are of very recent origin(less than 1 year in Jawa and Dhalla and less than 2 yearm in Banda at thetime of the suvey). Type B1 villages have piped water sstems underconstruction. Thus the two types of vilages are quite simlar in one respectUnlike the sweet and backish water zones, Type A households have not hadsufficient negative eeience with the systems to lead to lower bids incomparison with vilages without suh expeiene.(b) If a strategic bias exist, both Type A and Type B1 households arelky to manifest the bias in the same directon, i.e. by bidding(c) In the light of the above two arpmens, the oseness of the mean bidsis undestandable. However, the underbiddhg in Type Bl villages 1smanifested in a low coneton ratio (bids less than Rs 20 per month beingconsideted as not likely to connect to the stanrda system) Such amanifestation is not possible in Type A villages where the connection choicehas already been made.(d) An upad sttategic bias might be expected in Type B2 villages wherethere are no plans for the installation of piped systems but where the felt needfor such systems is equally acute. Both the mean bid (lb 55) and theconnection rae (90.9 pert) ar higher than in Type BI villages
Wlnnss to Pay for an Iaproved Piped Wat System with Home Conneadons
13.8 The distributions of WI? bids for a conewtion to an impoved piped water systemwith house connections in Types A and B1 villages are presented in Table 1-3.
66 LWDP-Wrd Bank Water mad Saitaio Prgram
13.9 The folowing obsations can be made based on the data prsen_td an the table:
Omc again the man bids in Types A and Bi ves ane faiy close, being Rs51 and Rs 59, respecIvely. Also the connction raes fairly similar, beng 95.0percent and 999 percent, respectivdy. Of the 6 households unonnced to thestandard system in Type A villages, 2 indicated that they would conec to theImproved system, bidding Rs 35 and Rs 45, respcvely. Incidentally, they hadndicated the unreliability of the standard system as their primary rason fo notcnnecting. Of the other 4, 2 were sigle pero households and 1 was occupyinga rented premise. The foth hosehold indiated no need for piped water becauseof access to a private handpump ilsidO the house.
* The mean bids are sgnficanty higher compard to the sandard system Thepremium is 31 percent in Type A vlages and 40 percet in Type B1 villges
Mt Amly of Wilgess-to-Pay Bid for Piped Wate Sysem
13.10 Rela& is Type R2 ViUaes. Cm in of Sytenm wh Public Taps and HouseConnectios. The rsults of a mulivarte analysis of WTP bids for a piped water system based onpublictaps I Type B2 villages are presented in Table H-1.
13.11 Lager households are wiling to pay more (it 3 per month for each additionalmember) as are households with higher monthly expenditure per capita. Households disatisfied withdte quality of alteutive sources of water bid much higher tha houseods that wee satisfied.Hoeholds that hvored meteing of water supples also bid higler.
13.12 Most other bvaiables had the expected sig but wre not signifcanmt. The varablesrpresentig household labor supply are interesting. Households in which labor is scarce did bid morethan households with more labor available to fetch water, but the difference was not staicallysigificant. Ti suggests that public taps he a limited attction for households with few labor
plies, possibly becae public taps do not obviae the need for fetcing water from outside lhehouse. Oe would ect the difference between the two types of houeholds to be much more markedIn the case of piped connections inside the houe. Only 3 percent of the sample espondents indicatedthat they are dsasfied with e quality of water avaiable from her souces, and, as one wouldexpect, these rsondent bid significantly more fot public taps.
13.13 The negative sipg of the coefficient for extenal exposure rnorc the inrpreadionthat a system based on public taps is consderd an &frior good by thase with expeience of systemsbased on house connections.
13.14 The results of the multvariate analysis of WrP bids for a standad system basd onhoue connections for the same households ae presented in Table H-2. Once agin household size andmonhy per capita expenditue am a significant positive determia of WIP bids. In addition, forthis opdon, water consumption per capita is positively related to WI? bids although it is notstatisdcally significant.
13.15 As expected, both labor supply vaables are significant and negatively related to WT?bids. This negative lationship and the positive associadon with water consumption per capit clearlycaptures the differces between systems based on public taps and house connections
Prm Rprt Series 67
13.16 Households disatsfied with the quality of alternative sources of water ane stll willingto pay more for piped water but the coefficient is not sgnificant. Ihis indicates that other advantagesare assocated with house comections. This is in contrast to the attitude towards public taps wherehealth considerations had more weight.
13.17 None of the variables reflecting pemonal charactewistics or attitudes is significant,perhaps indicating the fact that piped water Is not considered a discretionay or luxury good but a basicnecessity in the arid zone.
13.18 In both options the village-level variables are significant. WTP bids decreasesystematically with distance from the district headquartm and with proximity to a perennial watersource (vilage dummy = 1 for the one village with acces to the Soan River).
13.19 Ritsu in l)pe Bl ViUlages. The results of a multivariate analysis of WIP bids fora stadard piped water systm in Type BI villages are presented in Table H-3. uese result8 presenteda pwle. The most obvious maifestation is the behavior of households that could be eopcted tovalue piped water. hus households with more animals bid significantly less than households withfewer animals. Similady, households satisfied with the quality of alterative sources of water bidhigher (Rs 17 per mouth more) than households that consider the sources unsafe for health.
13.20 Further, households with more labor supply did not bid lower than households withless labor supply. The signs of the coefficients of the proportion of women and childrt are theopposite of what one would expect and are insignificant as well.
1321 However, the bids are positively correlated with household size, value of house andthe owneiship of land or property (and significandy for the first two). The value of the coefficientfor household size (Rs 1.5) is much smaller than in Type B2 vfllages (Rs 4).
1322 One explanation for these results is that nrspondents bid stategically. The watersupplies in Type BI villages had already been sanctioned and it could be possible that the respondentsconsidered the bidding gomes to be an attempt to set the monthly tarift This would explain tbesystematic underbidding by households that could be expectd to bid (and that do so, based onevidence from B2 villages in the arid zone and most other experiments in the other zones).higher forpiped water.1
13.23 The general affluence of the households seems to have detemined a base for the WTPbids with the more affluent staiting from a higher level. However, beyond that, bids seem to havebeen quite systematically suppressed by the respondents
1324 If this interpration is conect, it would suggest that the mean bid received for astandard piped system with house connections (Rs 41 per month) is an undeestimate. However, evenwith this possible downward bias, the WTP bids are quite high. Perhaps the mean bid in Type B2villages (Rs 56 per month) can be considered an upper bound yielding a range of Rs 40 to Rs 55per month as the one within which the 'true" average would lie.
8UnJike the sureys in the sweet water and brackish water zones, the surveys in the arid zone werecaried out after the 1988 general elections in Paistan During the election campaign, many promiseswere made that water schemes would be provided as a 'gift to the people. This could explain theapparent strategic responses of households in the arid zone.
68 UWDP-World Bank Water and Santato Progm
13.25 The results of the multivariate analWysis petining to an improved system with houseconections are presented in Table HA4. No major modirtcation needs to be made to the conclusionsderived fhom the response to the standard system. However, as in the other environmental zonesstudied, for an hypothetical improved system, affitudinal variables become somewhat more significant.Thus, households aware of piped systms bid sgnificantly higher while households that consider thepwvision of water to be a government obligation bid significantly lower (Rs 15 per month).
13.26 Ressda in 2)pe A Vidlages. The results of multivadate analyses of WTP bids forstandard and improved piped water systems with house connections in Type A villages are ptesentedin Tables H-S and H-6.
13.27 The explanatory power of the models is poor in compadson with the models for theother types of villages. However, there is no distortion of responses as witnessed in Type Bl villages,most of the coefficients having the corect sign without being significant. Tis is probably becausethe system is already in operdon in Type A villages so that the respondents might not have intepretedthe bidding games as an attempt to set the tariff.
13.28 The labor supply variables are both highly significant as expected, and in contrast toType BI villages. The only other variable which is significant is monthly household expenditure percapita. The vfllage-level variable, distance fom district headquartes, is insignificant, perhaps becausetwo of the villages are at the same distance although along different directions. The village dummyfor Jawa, a village with a new water supply having operational problems, is insignificant.
1329 Ihe WTP estimations were based on the responses of connected households (Type Al)only because of the very small number of unconnected households in the sample (6 out of 140). Whenthe latter are added to the regression, the variable representing connection to the system emerges ashighly significant. Not much change results in the coefficients or significace of the other variablesbut the overal significance of the regression improves considerably. As expected, the bids of theunconnected households are sigificantly less than those of the connected households.
Pmror Report Series 69
14. Estimated Revenuesand Cost Recovery Potential
CA et of bed War Syste
14.1 The estimation of capital cost; of piped water systems in the adid zone based on aotional value of capitl cost per capita did nOt prowve very useful. This was so beu the parameter
is vey seasitive to popuation size; thus, whether the population is 1000 or 2000 (the tpcal nge inthe arid zone) make a tremendous difference to the capital cost per capita.
14.2 To overcome this limitation, the actual proect costs for the six villages included inthe sumple (three each of Type A and Type BE) were obtained from the PHED. Actual O&Mallocations for the three Type A villages were also obtained. Using these figures, averages werecomputed for a typical viUage in the arid zone. The average capital cost was Rs 1,440,000 for TypeA villages and Rs 1,309,000 for the six villages. The average annual O&M costs were Rs 68,937for Type A vMages. Thus annual O&M costs as a perentage of capital costs work out to 4.8 pertin Type A villages and 53 peret in the s villages& Thisis in conformity with the 5 percentbenchmar used by the PHED.
143 To obtain per capita costs and the tariff required for full recovery of O&M costs,the populations of the six villages were avenged to obtain an estimate for a typical village. ITe 1981ensmu yields an estimate of 1230. The 1989 population was obtained by assuming a 3 percent annualgwth rate. A simlar averagng procedure yielded a typcal household size of 63 in 1981 (this islwer than the estimate (7.5) obtained from the sample data). The above two estmates together yieldthe number of houses in a typical village of the arnd zone. For the three Type A villages this estimateis 222 while for the entire six villages the number is 208.
14.4 The connection rate in Type A villages determined from the survey information is95.7 percent (only 6 out of 140 houses sureyed were not connected by choice). Thus, one couldexpc. 212 or 200 houses to be connected in a typical arid zone village, depending on whether theaveraging is based on Type A villags or Types A and BI villages.
14.5 Using the above data, the aveage capital cost per capita in the aid zone wo outto be Rs 83& The monthly O&M costs total Rs 5745. Thus, the monthly tariff required for fullrecovery of O&M costs vares between Rs 7 (Type A villages) to Rs 29 C(ypes A and Bl villages).All the above data and computations are presented in Table 0-6.
14.6 The existg monthly tariff for a standard PHED system with house connections inthe adid zone is Rs 20.
Provison of a Standard Piped Water Sstem
14.7 The connection frequencies and revenue estimates pertaining to the provision of astandd piped water system at difrent mouthly tariff rates are shown in Table 1-4. ITe plots ofconnections freqcies and estimafte rvues against monthly tariff are shown separately for TypesA, Bl, and B2 villages in Figures 14.1
Program Report Seri 71
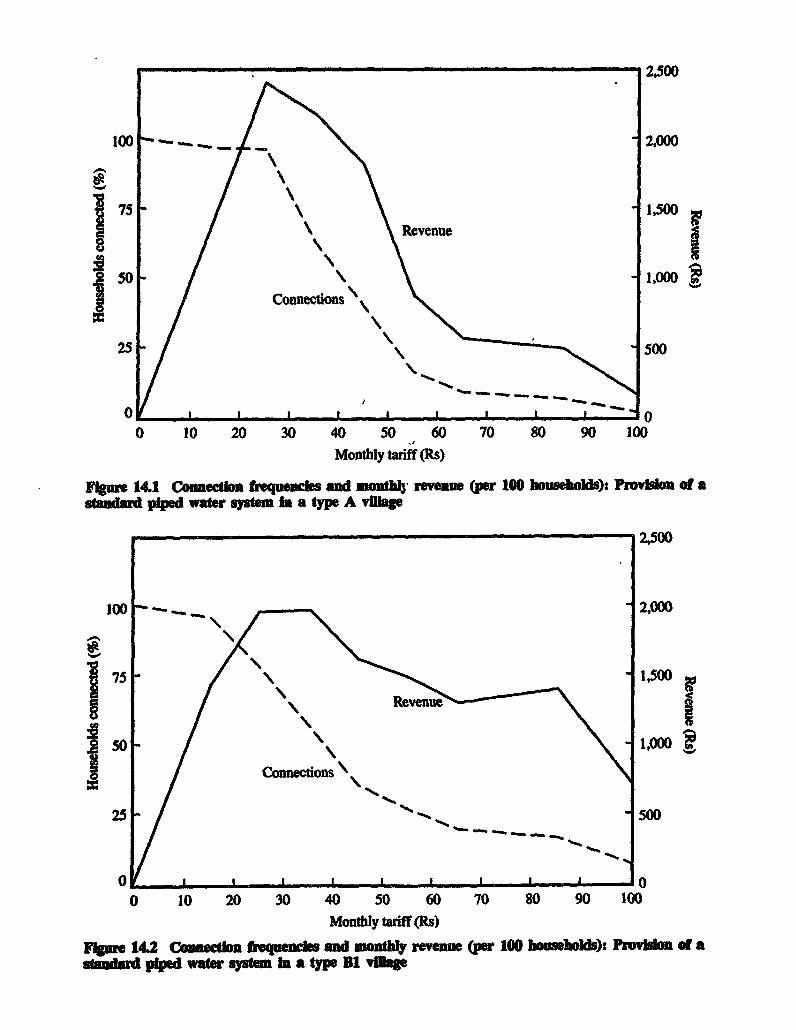
2.500
100 - 2000
J75 1,500w
350- I ,ooConnections
25 500
0 00 10 20 30 40 50 60 70 80 90 100
Monthly tariff (Rts)
FIgr 14.1 C_nsloan fequeacks ad monthly revem (per 100 bousehods): Pmvn of asltadad pipd water systema Io a type A vlge
2,500
100 -.. 2,000
50 -1,000
Connections -
/ _ 0
0 10 20 30 40 50 60 70 80 90 100Mtnyp y tarff(Rs)
elp 14.2 _ _uede alld DLf r0es (Per 100 bo eik): PmVIdo of a8_dia P d 8 tom a type B1 Vi_v
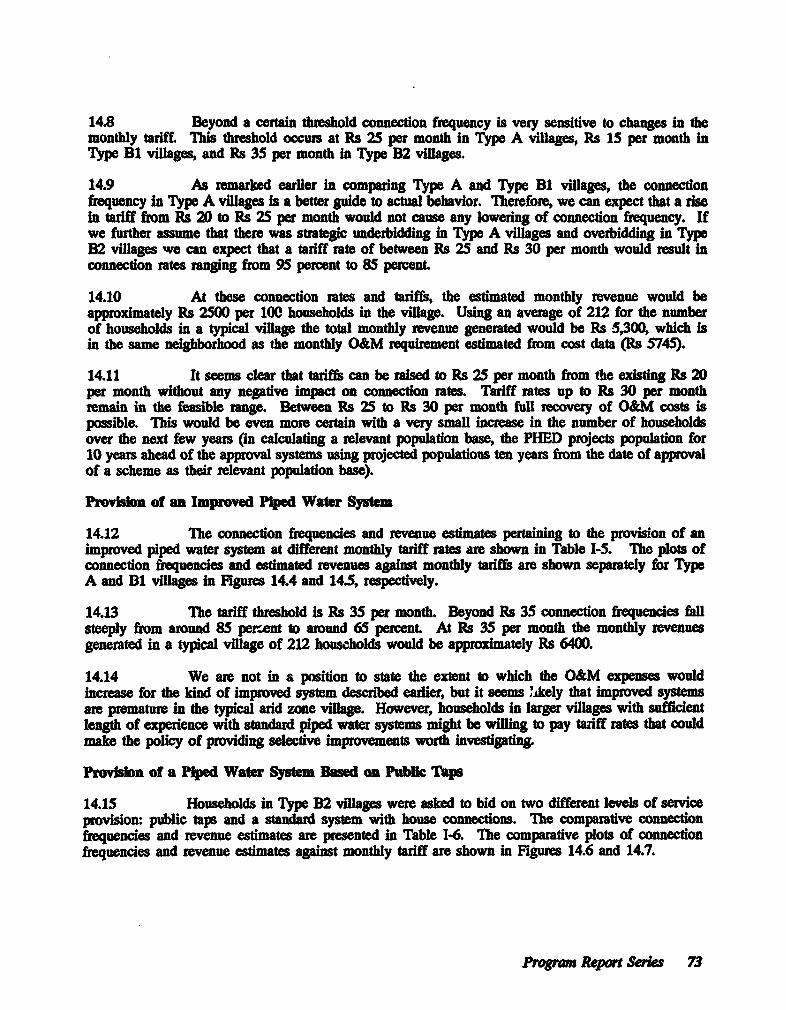
14.8 Beyond a certain tueshold connection frequency is very sensitive to changes in themonthly tariff This threshold occums at Rs 25 per month in Type A villages, Rs 15 per month InType B1 villages, and Rs 35 per month in Type B2 villages.
14.9 As remarked earlier in compating Type A and Type BI villages, the connectionfrequency in Type A villages is a better guide to actual behavior. Therefore, we can expect that a risein tariff from Rs 20 to Rs 25 per month would not cause any lowering of connection frequency. Ifwe futher assume that there was strategic underbidding in Type A vilages and overbidding in TypeB2 villages we can expect that atariff rate of between Rs 25 and Rs 30 per month would result inconnection rates ranging from 95 percent to 85 perent.
14.10 At these connection rates and tariffs, the estimated monthly revenue would beapproximately Rs 2500 per 100 households in the village. Using an average of 212 for the numberof households in a typical vilage the total monthly revenue generated would be Rs 5,300, which isin the same neighborhood as the monthly O&M requirement esimated from cost data (Rs 5745).
14.11 It seems clear that tariffs can be raised to Rs 25 per month from the existing Rs 20per month without any negative impact on connection rates. Tariff rates up to Rs 30 per monthrmain in the feasible range. Between Rs 25 to Rs 30 per month full recovery of O&M costs ispossible. This would be even more certain with a very small increase in the number of householdsover the next few years (in calculating a relevant population base, the PHED projects population for10 years ahead of the approval systems using projected populations ten years from the date of apprvof a scheme as their relevant population base).
Provision of an Improved Piped Water System
14.12 The connection frequencies and revenue estimates pertaining to the provision of animproved piped water system at different monthly taiff rates are shown in Table 1-5. The plots ofconnection frequencies and estimated revenues against monthly tariffs are shown separately for TypeA and BD villages in Figures 14.4 and 14.5, respectivly.
14.13 The tariff threshold is Rs 35 per month. Beyond Rs 35 connection frequencies fallsteeply from around 85 percent to around 65 percent. At Rs 35 per month the monthly revenuesgenerated in a typical vilage of 212 households would be approximately Rs 6400.
14.14 We are not in a position to state the extent to which the O&M expenses wouldincrease for the kind of improved system descriled earier, but it seems likely that imprved systemsare prematue in the typical arid zone vilage. However, households in larger villages with sufficientlength of experience with standard piped water systems might be willing to pay tariff rates that couldmake the policy of providing selective improvements worth investiting.
Provisio of a Piped Water System Based n Public Taps
14.15 Households in Type B2 villages were asked to bid on two different levels of serviceprovision: public taps and a standd system with house connections. The comparative connectionfrequencies and revenue estimates are presented in Table 1-6. The compartive plots of conectionfrequencies and revenue estimates against monthly tariff are shown in Figures 14.6 and 14.7.
Program Report Seies 73
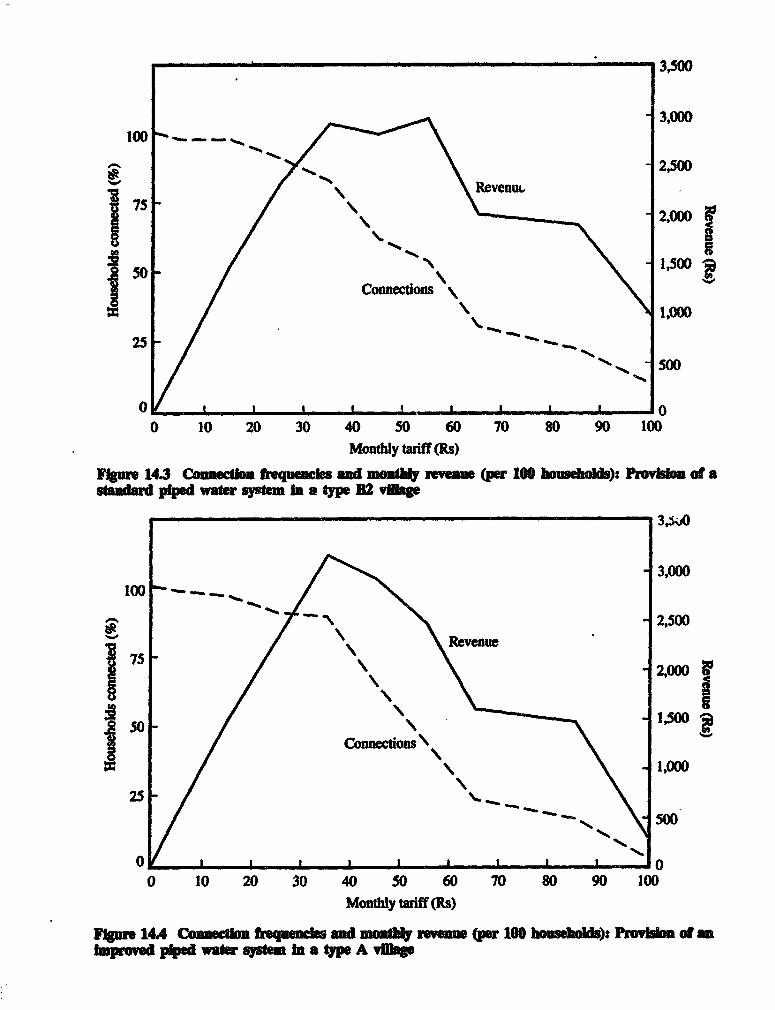
3,500
- 3,0001 00 --
-~~~~~~~~~~~~~~~ ~~~~~-2,500
75 - ~~~~~~~~~~~~~~2,000
jso -1500
I ~~~~~~Connectons
25 ~~~~~~~~~~~~~~~~~~~~1,000
0 10 20 30 40 50 60 70 80 90 100Monthly tarff (Rs)
FIgur 143 Cumnnhc freqenese sd mont revenu (per 100 bousubdus): ProVidon Of a
standard pipe water system in a type B2 vilag
. 3,000
100
N ~~~~~~~~~~~~2,500
75 - \ 2,000
s o1,500i0
25
0~~~~~~~~~~~~~~~~~~0
0 10 20 30 40 50 60 70 80 90 100Monthly tariff (Rs)
FIg 14A Connln _ fequenes ad monat Mev e (per 100 houebhos): Pr Qoo ot enIuwped ppe water systm In a type A vMle
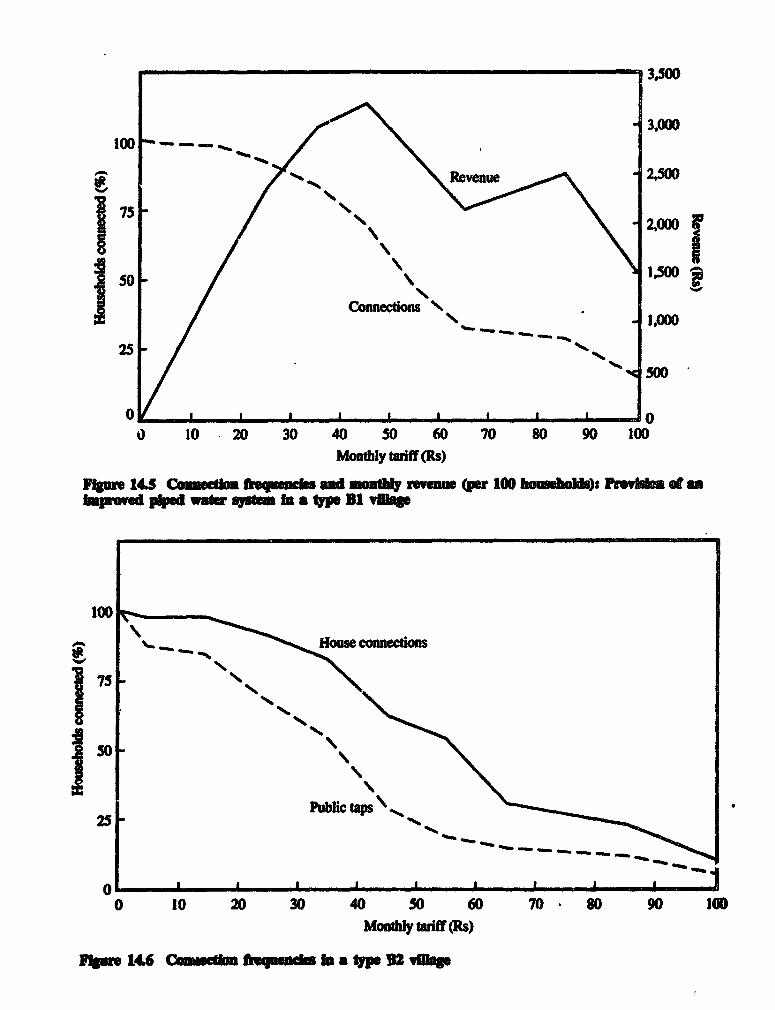
3400
3,000
100 -s > - 2 2,500
N ~~~~~~~~2,0O0
J7521,000
25 -/
500
0 0o0 10 20 30 40 50 60 70 80 90 100
Monthly twaiff(Rs)
F.e 14S Coettm frsquaks mad moaty revu (per 100 bo..e,M): eflaapedva ped waft sytem 1 8 type U1 viEtp
100
75 -
25L>--0~~
jo
0 10 20 30 40 S0 60 70* 80 90 1tMont tariff (Rs)
FIgure 146 Cmcihm hiquuadm bf tp 12 vilte
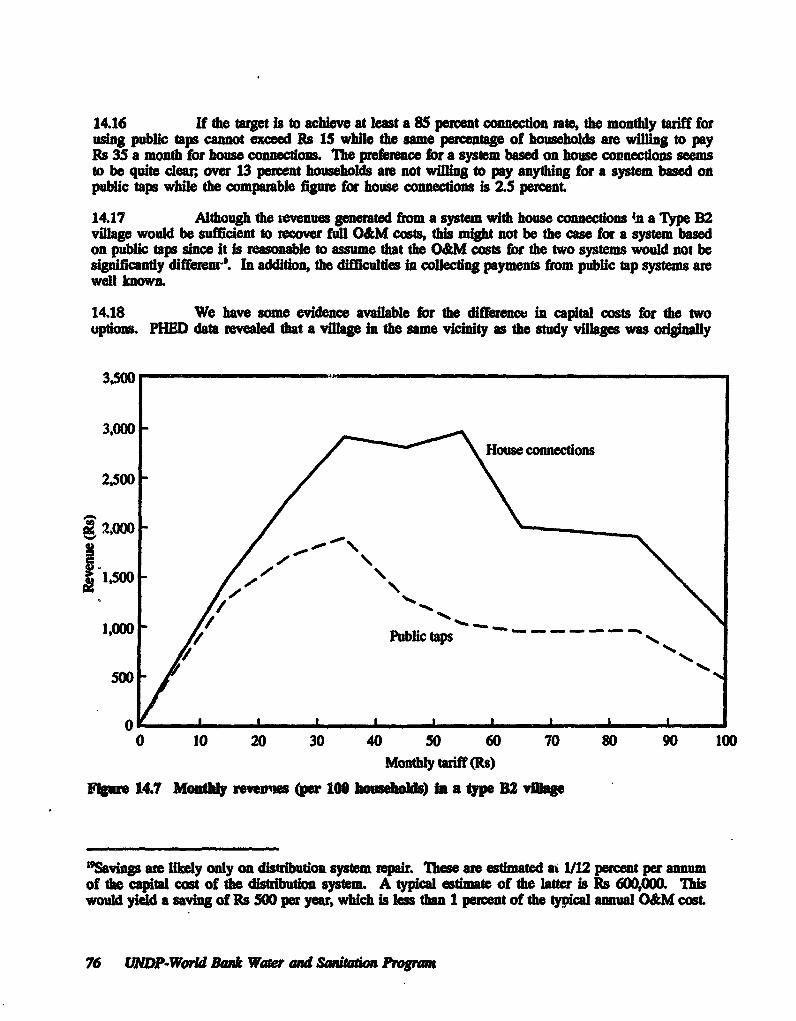
14.16 If the t is to achiew at let a 85 peront codo n rate, the montly tariff forusig public taps cannot exceed Rs 15 while the same percentag of households are wiling to payRs 35 a month for house connections. 'he preference for a system based on houe connectos seemsto be quite clear, over 13 perent households ae not wfiing to pay anyting for a system based onpublic taps while the comparable figure for house connections is 2.5 percent
14.17 Although the £owenues generated firom a system with house connectons .n a Type B2vilage would be sufficient to reover full O&M costs, this might not be the case for a system basedon public taps sne It is reasonable to assume that the O&M osts for the two systems would not besignificanty differenr9. In addition, tho difficulties in collecting payments from public tap systems arewell known.
14.18 We have some evidence available for the differen in capital costs for the twooptoDn PHED data rveaed that a vilage in the same vicnty as the study villages was oiginally
3,500
2,000/~~~~\:lou~Hose connctions
21.500 -
1,000
Public taps
0 p p
0 10 20 30 40 50 60 70 80 90 100Monthly taiff(Rs)
FIgr 14.7 Mont rerves (per 100 hmushW ) In a type B2 villge
1'9Savin are likely only an disizibution system repair. ee ae estimated at 1/12 percent per annumof tie capital cost of the distrut system. A tical estimate of the latter is Rs 600,000. Thbiswould yield a savig of Rs 500 per yea, which is less than 1 peent of the typical annual O&M cost.
76 EWDP-World Bank Watar and saa Pmgrm
scheduled to teceve a system based on publc taps?' Mm deed cot eamate prpard in 1986 wasfor a sum of Rs 1,600,000. Hower, on te stion of villa notables, suppod by eletdrepresentatives from the ara, it was decied to piwle house cM co insead The reviwedesmate was for the sum of Rs 2280,200. The mvidon rflected a capita cost ation of 42.5percent In per capita terms the capital cost rose from Rs S76 to Rs 821. (Ilie per capita costs arebasod on an estmated 1987 populadon size of 2776).
bThe scheme provided for four 2000 gallon capcity RCC gond stog tn each wit a batteyof taps.21Scheme based on one overead 4000 pflon capacity tank.
Program Repwt Swim 77
15. Conclusions and Policy Suggestions
h Natu of Dead fw Wte In Rural Arma
lS.1 Th most Important findg of this study peran to the natmue of the demand forwatea in rua Pjab. Te actual water suly sitatio in lmy of the ample vilages wasconsiderably more complex thian commonly assumed. It seems clear that the perspecdve withn whichpolicy-maers viewe rur watr supy i8 in the pp ss of being renere out of date by the ypeof development.
15.2 Within Pakistan, the policy reging u rral water supply has been motivated by theobjectives of health improvemens via the provison of beter quality wate and ime savings via thelocatio of more acceible sourcs. Implicit in this perpte is a catoizton of water as ar endproduct4 a commodity required for such direct uses as drinking, cooking, bathing, etc Within the studyare, this pspecve was found to be valid only in the ard zone.
153 In thte centtal canal-irrigated part of Punjab, there was a grwing demand, not forater as an end product but for water-based amenities like indoor plumbing, showers, and flush toilets.
Hewever, this demand camot be serviced by hantpumps or even public standplpes. It requires ahigher levd of service. What rdul households are doing to fulfill their aspirations has both important~nomic consequences and far-reaching policy implications.
15.4 The Swet Wj rArea a an Xllusradv Ca. TI sweet gundwater area of CentrlPunjab provides the best illustration of the abovementioned issues. The quality of the groundwateris good and it is available at easily accessible depth. Households have already upgraded their servicefrom the taditional source of supply, public wels, to private handpump inside t house. Thesehandpmps provide convenient access to good quality water fit for all usages. Ihe service is reliable,bing efficiently installed and mantale by the local private sector, and inexpensive to maintaEvery household in the sample had a private handpump inside the house. Households have made thisexpenditure (Rs 1000 capital costs, in curnt value, for the pump and the shallow well; Rs 6 permonth for maintenan ce) to avoid the inconvenience of having to fetch water from outside the house.
155 The official policy in the sweet water zone is not to provide public piped water.applies. This policy is based on the reasoning that pivate initiative has succeeded in providingconvenient access to good quality water. However, the survey results indicate that a second upgrdingof service is well under way. Many households are willing and able to pay for a higher level ofservice and in the absence of reliable piped water supplies they have installed electric motors on theirwells at considerable expen The electic pumps lift water to prvate overhead tanks from whichwater can be used for showers, issh toilets and other indoor plumbing services. Thus, the serviceswhich could be provided by public piped water supply systems are being replicated at the individualhousehold leveL Does the official policy retai its validity in these changed circumstances?
Prvate Upgading of Service In Central Punjab
15.6 In villages without piped water a the sweet water zone, 30 pement of the samplehouseholds had installd an electric motor. In the brackish water zone the comparable figure was 62percent. The percentage is higher, perhaps, because, in addition to the other benefts, electic pumps
Progm Report Series 79
also provide somewhat better quality water than handpumps in the bracldsh zone by lifting water fromgreater deps This is a very high percantage and cleady indicates the trend in the Central Punjabvillages.
15.7 In viliages with piped water, the percentage of bouseholds with electric motors fallsto 11 peret in the sweet water zone and to 33 pnt in the brackish water zoe. T1is suggests thatpiped supply systems with house connections are cleady perceived as substitutes for electric motors.However, in such villages, 7 percent of the households in the sweet water zone and 29 percent in thebrackish water zone continue to maintai both opio This bngs to the fore the critical issue of thereliability of the various serice options.
15.8 A household's decision on how to satisfy its water needs is heavily influenced by thereiability of the differnt service options. A private handpump is almost completely reliable becauseit can be repaired locally and is entirely under the control of the household. In the Jweet water zonethe water from the handpump is adequate for all usages, but the handpump cannot provide theamenities of indoor plumbing, showers and flush toilets, If the household wants and can afford suchamenities, it has three choices in villages with public piped supplies: (1) to connect to the publicsystem, (2) to install an electric motor, or (3) both.
15.9 In the brackish water zone, the first choice ought to be the dominant one. The pipedsupply not only provides better quality water but its private costs to the household are much less. Thefact that 29 percent of households maintain both options is only due to the limited hours of supplyhom the public system and its poor reliability. his poor reliability Imposes a high cost on householdsand, at the same time, undermines the economic viability of public piped water systems.
15.10 Financial Cost to an Average Houswold of Different Sevice Options. The
approximate costs to an average household in the brackish water zone of vaious water supply optionsare shown in Table J-4. The handpump provides a base of serice at a totd monthly cost of aboutRs 18 per month A household with both a handpump and a connection to a piped water supplywould pay Rs 12 per month to the PHED for the water taiff and Rs 5 per month for operation andmantenance of its handpump. The monthly capital costs for both the handpump and the connectionto the distrbution supply would be Rs 19 per month for a totl monthly cost of Rs 36. A householdwith an electrdc motor on its handpump would spend much more - about Rs 58 per monthHouseholds witlh both an electric motor and a domestic connection are estimated to pay Rs 76 permonth.
15.11 A reliable piped water service ought to cost a household appro;imately Rs 18 permonth at existing tariff rates. Instead, households waning upg4& services are paying about Rs 76per month for the same level of service. The piped water system is not fulfilling its potential. It isftioning as a supplement to the handpump in the sweet water zone and as a substitute (betterquality water) for the handpump in the bracish water zone. Reliable upgaded services can only besecured at present through investment in a private motor-operated system.
nFor private connections the costs in the swewater zone are essentially the same as in the brackishwat"r zone, except that the monthly tariff is Rs.10 instead of Rs112. For the water supply optionswhich require a private well, the costs are basially the same in the two zones for a well of a givendepto
80 MU P-World Bak Water and San o Pgrwun
15.12 Who Demaund H0er and More Refiable Sevce? 'The survey results Idicate (seeTable J-5) that, as expected, it is the wealthier, more educated households that are demanding higherservice. The avegW construction value of houses of houeholds with only a pivate handpump in thebnackish water zoe (in villages with piped water supplies) was Rs 62,000. For households with botha private handpump and an electric motor it was Rs 115,000. For households with a handpump,electric motor and a domestc connection, it was Rs 145,000. In villages with a piped water systemin the sweet water zone, in households with only a private handpump, the most educated member ofthe household had an average of 6 years of education. For households with a hamdpump and anelectric motor, the average was 12 years of educadon.
15.13 Viflage elites have always exerted a powerful demonstration effect an the rest of thepopulation. At one time the elite used to be coized by the possession of a brick house or anelectricity connection. Now the distinguiin characteristic i indoor plumbing and flush toilet. Ifhistorical experience is any guide, the choice of the elite is a clear pointer to the trend of the futu
15.14 Wdlingness to Pay as a Percestage of Household Inome. The survey results indicatethat the amount of money households are willing to pay for improved water supplies as a percent ofhousehold income (or expenditures) is bwer than often assumed In the sweet water zone the meanWTP bid was only 1.1 percent of average household income (see Table J-. The percent of incomerespondents were wiling to pay for improved water was higher in both the bracldsh zone (2.4 peroent)and arid zone (3.5 percent), but both esimas ae still well below the 5 pement rule of thumb oftenused to estimate how much households wil pay for improved water supplies.
The Emnom_ of Viage Water SupW* Op_os
15.15 Ih efforts by households to povide themselves individually with Impoved watersevices entail substantial expenditures in the aggegate. Table 3-6 presents an estimate of the actudamount of money curnly being spent on private water provision in a typical village with a populationof 5000 people without a piped water supply in the brackish water zne Assuming 62 percent of thehoseholds have a handpump with an electric motor and 38 percent have only a handpump, householdsin such a vilge have already invested over Rs 1 million (in cunent value) for pivate handpumps andelectrc motors. The operation and maintenance costs of thae privately provided water systems isesdmated to be Rs 9800 per uonth The total monthly costs of these systems are about Rs 23,9V'b.
15.16 Based on cost data from the PHEID in Punjab, a new piped water system for a viagewith a population of 5000 would cost about Rs 1,800,000- including the cost of 100 percent of thehouseholds connecting to the distibution system. The monthly operatton and maintenance costs of apiped waftr system are estmated to be about Rs 3800 for a total monthly cost of Rs 19,800. Giventhe approximate nature of these esimates, the total costs of a piped distribution system are essentiallythe same as the amount households re alhdy spending for handpumps and electric motos
15.17 ITe esdtmates of the oss of th. piped system assume that 100 percent of tehouseholds in the viUage ae connected, the estimates of actut, expenditures assume that 38 percentof the households only bave a bandpump. In this sense the cost estimates are not comparble becausethe piped water system proie a higher level of service for a greater number of people.
15.18 W gnesto Pay for Piped Watr S&#pL. It is in the above context that thewilinge to pay for piped water ought to be evaluated. Once asain we tae a village of 5000 people(562 households) in the brackish zone as an example. In such a village without piped wate, the meanwillngas-to-pay bid for monthly taiff for a standard piped water system with house connecions was
Program Report Series 81
Rs 40 (tldI. was in addition to the one-time costs of a iaty Rs 600 equired for conetig toth system) summaon of the househo wiligness-to-pay bids ylds a monthly total of Rs22,500. This figure is essatially the same as the amout houdds are already spending on water(Rs 23,900). This oqnceases the confidence in the cedibility of the willingness-o-pay bid.
15.19 In practce, it is not poible tecover the entire wllingness-to-pay amount becauseof the unfeasibility of enforcig dieifential trin the same vill. Mh swvey results dicate thatin a vMage of the type bdag discussed, 78 pecent of the households would connect to a sandadpiped wat system with hoe connections if the monty taff wer set at Rs 25. In addio, thywold bear the coss of conectig to h distuon line (Rs 500, appximately) and pay acoction fee to the PIHED (is 80). The estimated reveue based on te numbes is Rs 11,300per month (see Tible 1-7). If a piped water system is designed for 78 peen of the popuation, thototat montily cost to dte PHED would amount to Rs 13,400 (Ris 10,00 capItl, Rs 2900 0MlTe estimates suggest that a vey substantil proporion (85 pect) of th total coss of a publicpiped water system can be rcovered under the conditions desmbed above.
15.20 The comparable computations for the sweet water zone ae shown in Table I-& Only44 percet of the total costs of a piped water sysm are potnly reovable compued to 85 perentin the brackish water zone. This Is the rest of much lower WTP bids in the sweet water zone, notof diffeens in tho cost the sysm in the two zones. Me WIP bids ae lower in the sweet wazone because unlable public water sysms ae much less at_active when good quaity water i easlyavailable from pivate andpmps. However households are wli to pay a substntial prmimum frimproved labflit, which tgges dhat a higher peenage of the costs cau be recovered in thesweet water zone if rehbility is impoved.
1521 WPlhinge to Pay in Villags wih P4xd WUIr. Ime willn to pay for pipedwater in aes with exstng supply syst Is smuch lower compred to villages without piped warsystems. TI is, perhaps, bause the tta ar not aware of how the servie woud operate whie thefaomer have sufficient cause to be dissatisfied. IThe mean WI? bid In a village with piped water inthe backish zone was only Rs 16 per month compard to Rs 40 per month in the village withoutpped water. However, when the opton of an iprved, more reiable senice was offed to thehouseholds in the vilage with piped water, te mean bid insed to Rs 33 per month while thepercentg of houeholds willng to connect went up to 95 percent from 75 percet. Tis agaiundercoe s the premium which households place on sIxtem reliaty.
The Arid Zone
15.22 The situaon in the add zone of Nohen Pnjab is quite dffrent from the sweetwater and bracksh water zones of Cetral Punjab. In the arid ze at th pre tme the demondis for water itself and not for water-based amenities. Ihis is because of the scarcity of water and thelow base of service available to villages (public wells and surfa water). Houeholds spend anaverage of 5 hour per day to fulill their water needs duig the peak summer months compared to4 hours per week in the brackish zm' and ev less in the sweet water mon
'OA contutoy teason could be the anchoring efft of the existg tff (12 pr month) which iskown to the respondents in the vlg with piped water.
82 UlDP-World Bank Water and Sania* Pmpw
1523 The demand for private sources s, however, quite srong; 24 percent of the householdshave installed pivate sources (e.g., wells or boreholes) whUle another 5 percent have made anunsuccessful attempt. This is despite the fact that the costs of installng private sources in the ardzone are much higher (approximately Rs 8000 with a monthly maintenance cost of Rs 40). However,these private sources, wells or boreholes, cannot, i general, provide acce to higher service levels.The installation of private sources is not systematically related to socioenomic charcteistics ofhouseholds since the very possibility is based on the fortuitous cicumstance of an appropriate locationof the house such that the groundwater is accessibleY
1524 For the above reasons, connection rates to piped systems are almost 100 percent, muchhigher than in the sweet water and bracldsh water zones. This is so despite the fact that the arid zoneis economicaly less developed than the other two zones, the average village size is much smaller andthe monthly tariff is much higher (compsaative information for the three zones is provided in TablesJ-9 and J-10).
1525 The official poicy of the PHED, of not providing house connections to villages withless than 5000 inhabitants, is not being followed in the arid zone. This has resulted in much highercapital costs per capita (approimately Rs 840) because of the small vilage sizes. The survey resultsindicate that while O&M costs can be fully recovered, it is not possible to recover the ca.tal coststo any significant extent.
Dbeusdsn
15.26 Collectiuve Water Supplies. As long as the highest service demanded was the privatehandpump, the policy of leaving the sweet water area to be served by the private sector was justifiable.However, with a significant proportion of the population replicating a piped water system at theindividual level, the policy is in need of fresh evaluation. As mentioned earlier, while the capitalcosts of a piped water system and private upgrading through the installation of electric pumps arecomparable, the O&M costs of the latter are almost two and a half times the costs of the former.Pivate upgading is not likely to be the socially opdmal option.
15.27 Tlhe alternative to individual upgrading is not necessarily stte run piped water suppliesbut other collective anrangements. Privately built and managed water systems should not only increasecommunity participation but should also prve to be less expensive to build, thus enhankcig thepospects of ful cost recovery. In this context the obse4vations of Briscoe (1987) need to reiterated:
In government-built water supply prjecs the role of the private sector is much moreproblematic. In the Punjab and Sind the private sector has a major role - ddlling andcivil and mechanical works are all contracted out to the private sector. In principlethis should make for an efficient sector. In practice, however, the situation appearsto be quite different. It is widely acknowledged -- by government officials and othersknowledgeable about the sector - that there is exteisive collusion between thecontractors and the government agencies, a relationship based on kickbacks to thegovernment officials, and resulting in construcion costs which are much higher thanneed be the case. In such a system there is an incentive for both officials andcontactors to build over-designed, expensive systems. As an illustration of the
M'There is very little residential mobility in these vilages. Better-off households probably do notlocate their houses in areas with easier access to ground water.
Program Report Seriss 83
inefficiencies in this sysem, the Oangi Pilot Seweage PMect in Karaci, it whichthe community, not the goment, finces the works, the costs of sewering houseshas been tordued by over 80 percentY Proct officials attrbute the cost reducionsto two factors - attention to reducing coss wherever possible, and elimination of thecontractor-offici corpd
15.28 Mor , it has been faily wel established that the tsition to higher service levels(piped connections and electric pumps) leads to an increase in the use of water. Ihis was confirmedin the sample villages wbere drainage has emerged as a serious problem. Although it is possible toupgrade the water supply at an dividual level (even if socily inefficient) it is not possible to resolvethe rewlting drainage problem on an individual basis. Thus, a collective solution becomes unavoidable.
15.29 Reliabiili. Became of the poor quality of the groundwater, public piped watersupplies are being built i the brackish water zone. In principle, because the amount being spenit onprivate upgading of services is so substantial, the dscssion regading private, collective water systemsshould be equally applicable to the brackish zone. However, as mentioned earlier, piped supplies,irrespective of whether they are public or pnvate, have to be much more reliable to be able to competeeffectively with the individual upgrading of service.
1530 The srey suggests that the reliability of piped systems is a cnrcial element inachieving cost recovery. It is quite clear that people are willing to pay significandy more for a reliablesystem. This is demonstrated by household investment in multiple water systems: handpumps, pipedconnections and electric motos It was mentioned earier that in villages with piped water in thebrackish water zone, almost 30 percent of the households maintained both electric motors and pipedconnectaons, spending Rs 76 per month as against the Rs 18 for the piped connection alone. It isquite clear that for public utlities to compete effctively against pmrate providers of handpumps andelectric motois, their reliability must be improved.
1531 In a hot and dry ag 4 ultLral area such as Puonab it does not seem possible forreliability to be effectively increased W..out the metering of household connections. TIis is becausethe demand for wate at zero margn cost (Le, unmetered connections) is immense. One finding ofthe survey illustrtes this point welL In villages with piped water supplies households with animalswere willing to pay m for connectons. Investigtions indicated that the reason was the conveniencein washing animal. Buffaloes, which need to be kept cool in the summer, could be hosed down athome, tather than be taken to the canal or the village pond, thus saving on time and supersion costs.Water for dgnkiag by animals could also be provided through the domestic connection.
1532 This findng highlights an oversight which has sitgificant implications for the designof ruml water supply systems in Pakisu. The PHEID desigp criteria at present take into accounthuman needs only and ue a consumption benchmark of 10 to 15 gallons per capita per day. However,if households use the water to cater to animal needs also, including water-intensive ones like washing,the design estimate could be easily exceeded. It was estimated in the survey that while the minimumquantity of water required for essenta human consumption vawied between 20 to 30 liters per capitaper day, the minimum quantty equired for animal needs varied between 40 and 60 liters per animalper day (estimate based on the amount of water which, in situations of emerency, would have to befetched from outside the house in the sweet and brackish zone and purchased fom vendors in the arid
5TIs figure may be too high Ihe orginal costs of sewering a house were about Rs 2,500. TheOnangi Project's cost was about Rs 800.
84 UNDP-World Bwn Water ad Sana n Prorm
zone). Ihis means tnat a household with 8 members and 2 cattle (the avenage in the arid zone) wouldneed approximately 200 liters for human consumpdon and 100 litets for animal needs. Tis 50 pecenticrease, which should hold for notmal, nonemergency consumpdon patrs also, is much more thanthe 5 percent to 10 perent margin added on by the PHED to total esimated human consumption forall other usages (public buildings, schools, mosques, animal etc.) Perhaps, this is one explanationfor the ubiquitous problem of low pressure which charateriz ru water supply systems in Paistan
15.33 In such an enviroment, if connections are not metered, then water must inevitablybe rationed by reducing the reliability of the system. If reliability is reduced, people must secure odtersources, and their domestic connection becomes a back-up supply. Table A-12 povides eAidence fromthe sweet water zone. The majority of households stated that they would keep their handpumpsoperatonal either pemnanently or at least until such time as the piped water system could supply waterwith reguarity. In a vilage in whih the piped supply system had fallen into disuse, 12.5 percent ofthe households had dismantled their handpumps at the time of obtaining the connection. Ihey wereforced to reinstall them because of the poor performance of the system. It is not surprising, therefore,that 94 percent of the households in this villaga indicated a resolve to keep their handpumps operationalpermanently even if the piped supply was restord.
1534 In such situations the willinness to pay for piped water is much reduced. The PHEDthen cannot collect te resources it needs to run the system efficienly. A vicious circle of systemdetioration and lowered willingness to pay ensues.
1535 The concept of metering household water connections is quite acceptable in the ruriareas of Punjab. Tne percentage of households ftat favored metering vaied from 54 percent in thesweet water zone to 81 percent in the brackish water zone. The statisticl rsults also reveaed thatsuch households were consistendy willing to pay more in tariff for piped water systems.
1536 The economic viability of public piped water systems requires enhanced tariffs.Households are willing to pay significanty higher rates (see Table J-11) but only if they areaccompanied by the imprved performance of existing systems. A packlge of tariff inreases tied toselective improvements would be quite acceptable to the households sureyed. This seems the onlyfeasible way to move towards economic viability and to break the vicious circle mentioned earlier.
1537 Pubfic Stodpip Systems. Households prefer piped systms with domestic connectionsand are willing to pay much higher rates than thought possible earlier (see Tables J-11, J-12, and J-13). Even so, if such service is to be extended to small villages of 1000 to 500 people, as is beingdone in the arid zone, it would bhve to be subsidized to a considerable extent.
1538 It seems unlikely that the higher per capita capital expenditure can be recovered. Insuch situations it would be worthwhile to experiment with less expensv standpipe systems.
1539 Standpipe systems should be adequate in the smal villages of the arid zone since theoverwhelming demand is for conveniet access to water and not for water-based amenities Contrayto the prevailing view about the acceptability of staadpipe systems, households in villages without pipedwater were willing to pay reasonably high ra for such systems. The mean bid was Rs 35 per monthand 68 percent of households would subsnbe to theses ice at a tuiff as high as Rs 25 per month(this tarff exceeds the present monthly tariff for piped systems with domestic connections (Rs 20) inthe arid zone).
PrWon Report Serios 85
15.40 Ihe main drawback of standpipe systems as they have been organized thus far relatesto the problems of revenue collection owing to difficulties in monitoring actual usage. Someexperimentation on a pilot basis with alternative structires is certainy warranted. For instance, asystem based on manned kiosks should overcome the problem and require no more manpower than thepresent structure. Since piped systems operate for four hours a day at most, the existing full-time staffis under-utilized. The option of gving the kiosks on private contract could also be explored. Evenif households purdase only 100 liters of water per day (about the average essential daily consumptionfor family needs in the winter) at Rs 0.10 per can of 16 liters (one tenth the existing price of vendeuwater), the revenues realied per household would be of the order of Rs 20 per month. These wouldbe sufficient to recover O&M costs and some part of the capital costs as well.
1SA4 Organztonal Issues. Any serious attempt to encourage communities privately toconsttuct and manage water supply systems would involve difficult orgaaional issues. Experiencehas proved that collective resposes to such needs do not arse by themselves but need patientgroundwork. the availability of external technical expertise and accessible credit facilities.
15.42 The experience of the successful Otangi Pilot Sewerage Prect in Karachi bears outthe above point, even though the project required only an intermediate level of collective effort betweenthe completely individual and the completely collective. In a sewerage proect, the lane could functionas the organizational unit, and a successful demonstration could induce other lanes to participate. Thisis not possible in a water supply project where a much larger proportion of the population has to reachan understanding before the project can be initiated.
15.43 The orgaizational problem is made more difficult by the fact that, contrary to thepopular presumption in development circles, the villages were not willing to assume responsibilit-the provision of water. Over 65 percent of households in all three environmental zones believed tuata water supply system would be best managed by a government agency in preference to local politcalbodies, village water committees, or pnvate entrepreneurs. Tis is perhaps a reflection of the sharpclan and political divisions that charactize villages (especally those with sizeable populations) inPfjab. These divsions affected the peweived effectiveness or fairness of elected political bodies orM'lage committees to mnage collective systems. It was considered a lesser evil to leave the system
to a neutral agency, external to local vibage politics, even though it was inefficient Perhaps a publiclyprovided but privately managed water utility would be just as acceptable and more efficient, althoughthis alternative has not been experimented with hi Pakdstan. The concept was not familiar torespondents who remain wary of the lack of accountability of the private sector and the general failureof government attempts at its regulation in many other spheres of activity.
15.44 At the same time, it is clear that the solution does not lie in raising more revenuesand giving them to the PHED as it is structured at present. ITe PHED is primarily an engineeringagency and is not equipped to involve the community in decision-making or even to carry out the tasksof revenue accounting and collecton in a satisfactory manner. In this, it is handicapped by the factthat in principle the PHED is supposed to hand over the management of the systems to local councilsafter an initial period of two yeats. However, the latter have neither access to the technical experdserequired for maintenance and operations nor the political unity to impose effective revenue collectionin the factional villages. As a result, the systems are inevitably handed back to the PHED after aperiod of mismanagement. The consequence of the lack of a clear policy in this regard has been thatneither body has been equipped to the degree necessary to manage rural water supply systems in aneffective manner. A resolution of this situation should be the first step in the reform of the rumlwater supply sector.
86 UNDP-World Bozk Water and Saoniation Program
References
8dscoe, J. astn: Secor Waok and Willkng to Pay for Water Stdy." 'World Bak Water andUrban Development Deprment, Apil 26, 1987. Mem nm.
Brbooe, J. and D. De FerrantL Water for Rra Cwawte: He!ping People Help hemselves.WashingIon, DC: Mm Wodd Bank, 1988.
Cummings, R G., D. S. Boolbite, and W. D. Schulze, (edits). Valuing En,wimetata Goods.An Asss_m of the Contigen Vabladon Medsoi Totowa, New Jersey: Rowman andAlanheld, 1986.
Govnment of Pakist Popublaton Census, Distict Census Reports for Sheiupra, Faisdabad, andRawalpindi Distr 1981.
Whington, Dalo, Mar Muiwahuz, Gad McMahon, and Ky_on Ch Widlingness to Pay forWater bi Newala DisFC T _.nia Sawtegies fbr Cost Recoy. Hedd Report No. 246Washington, DO USAID Water and Sanitation for Health Pruiect, June 1989, pp. 205.
Whitington, D., et aL 'Estimating the Wlingness to Pay for Water Serices in Developing Counties:A Case Study of the Use of Valuation Surveys in Southem Haiti.' EconaikDevwopment and Cuwl Cange 38, no. 2 (January 1990): 293-312.
Wodd Bank. -WMins to Pay for Water in Rural Areas. Research proposa, Water and UrbanDevelopment Depatment, March 1987.
Prgr= Rpot Seies 87

Appendixes
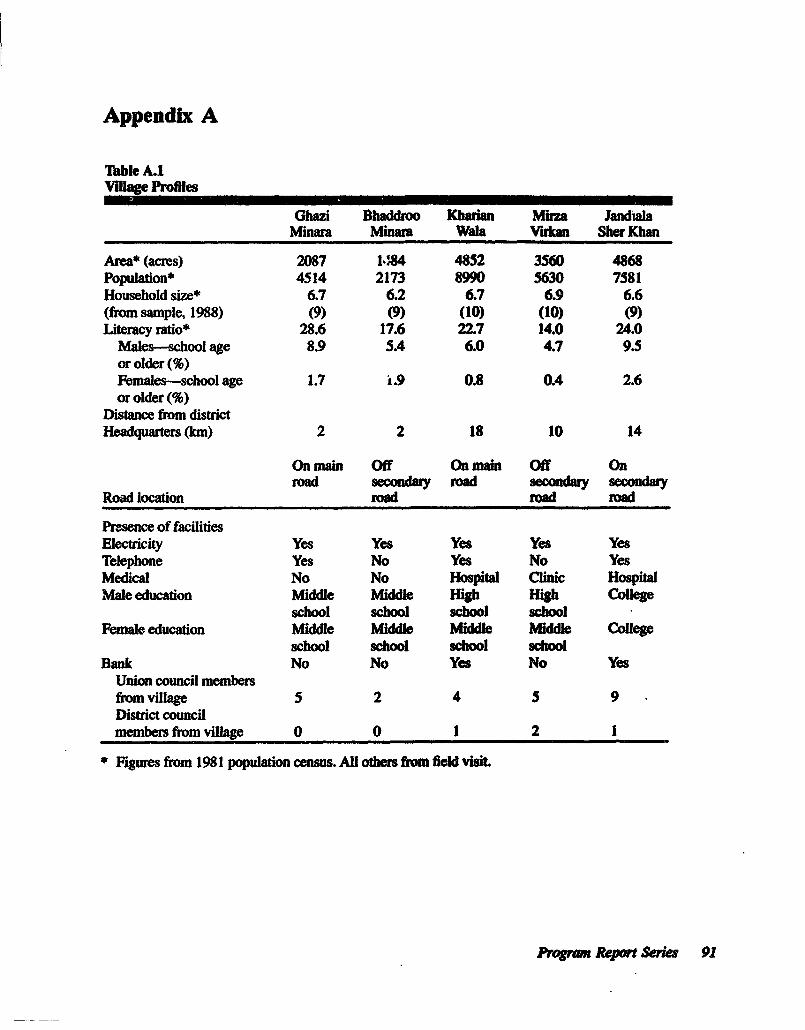
Appendix A
Thble A.1Vilage Profiles
Ghazi Bhaddroo Kharian Mirza JandialaMinara Minva Wala Vikan Sher Khan
Area* (acres) 2087 1-44 4852 3S60 4868Population* 4514 2173 89g0 5630 7581Household size* 6.7 6.2 6.7 6.9 6.6(from sample, 1988) (9) (9) (10) (10) (9)Literacy ratio* 28.6 17.6 22.7 14.0 24.0
Males-school age 8.9 5.4 6.0 4.7 9.5or older (%)Females-school age 1.7 i.9 0.8 0.4 2.6or older (%)
Distance from districtHeadquarters (km) 2 2 18 10 14
On main Off On mn Off Onroad seny road secondoy secondary
Road locaion road road road
Prwsence of facilitiesElectricity Yes Yes Yes Yes YesTelephone Yes No Yes No YesMedical No No Hospital Clinic HospitalMale education Middle Middle High High College
school school school schoolFmale education Middle Middle Mididdl e ddle College
school school school schoolBank No No Yes No Yes
Union council membersfrom village 5 2 4 5 9District councilmembersfrom village 0 0 1 2 1
* Figures from 1981 population census. AHl others fom field visit
Prorm Report Series 91
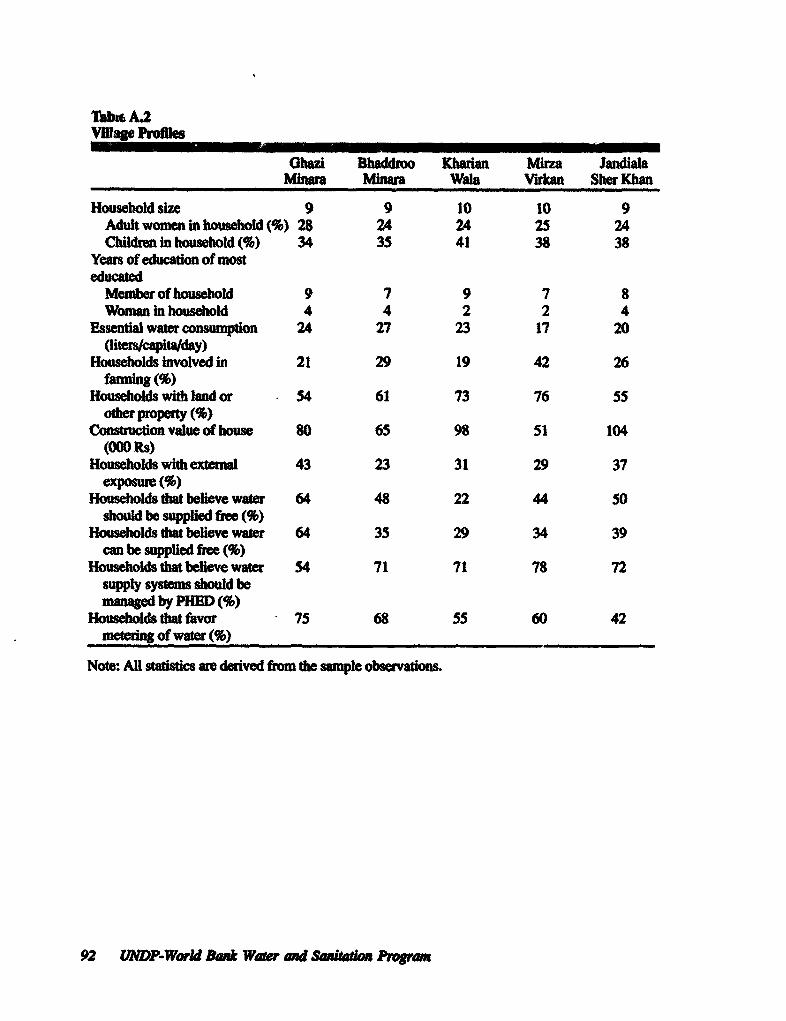
Tabi A.2VMage Pofes
Ohazi Bhaddroo Kharan Mrza adalaMinara Minara Wala Virm Sher Khan
Household size 9 9 10 10 9Adult women in household (%) 28 24 24 25 24Children in household (%) 34 35 41 38 38
Years of educadon of mosteducated
Member of household 9 7 9 7 8Wom in lhousehold 4 4 2 2 4
Essential water consumion 24 27 23 17 20(litescapita/day)
Households involved in 21 29 19 42 26faing (%)
Households with land or 54 61 73 76 55other property (%)
Construction value of house 80 65 98 51 104(000 Rs)
Households widh external 43 23 31 29 37exposure (%)
Households that believe wat 64 48 22 44 50should be supplied free (%)
Households that believe wate 64 35 29 34 39can be supplied free (%)
Housholdsthatbelievewater 54 71 71 78 72supply systems should bemanagd by PliED (%)
Households that favor 75 68 55 60 42meting of water (%)
Note: All staistics are derived fom the sample observaos.
92 UNDP-Warld Bank Water ad Sanition P,i=
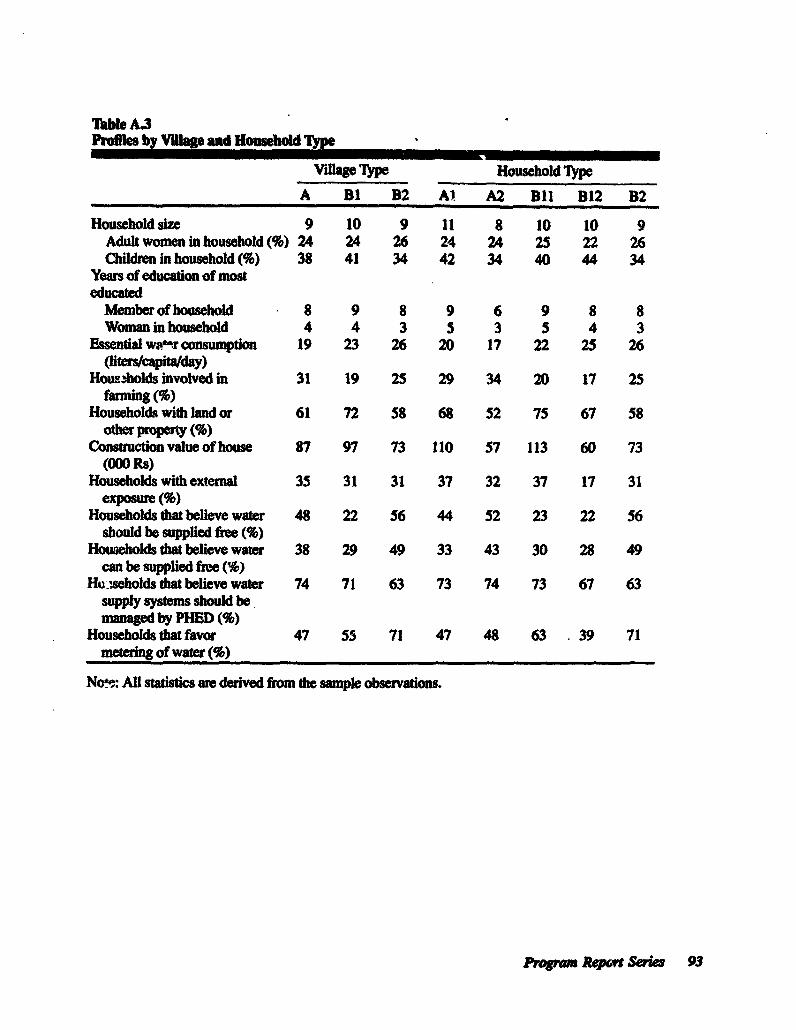
Table A.3Prfles by Villge and HousehoId Type
Village Type Household Type
A BI B2 Al A2 Bll B12 B2
Household size 9 10 9 11 8 10 10 9Adult women in household (%) 24 24 26 24 24 25 22 26Children in household (%) 38 41 34 42 34 40 44 34
Years of education of mosteducated
Member of household 8 9 8 9 6 9 8 8Woman in household 4 4 3 5 3 5 4 3
Essential w'e-r consumption 19 23 26 20 17 22 25 26(liters/capita/day)
Houswholds involved in 31 19 25 29 34 20 17 25faning (%)
Households with land or 61 72 58 68 52 75 67 58other prperty (%)
Constuction value of house 87 97 73 110 57 113 60 73(000 Rs)
Households with external 35 31 31 37 32 37 17 31expose ()
Households dat believe water 48 22 56 44 52 23 22 56should be supplied free (%)
Households that beLHeve water 38 29 49 33 43 30 28 49can be supplied froe (%)
Hu seholds that believe water 74 71 63 73 74 73 67 63supply systems should bemaed by PHED (%)
Households that favor 47 55 71 47 48 63 39 71meting of water (%)
Not: All staistcs are denved from the sample observations.
Prohram Rpt Series 93
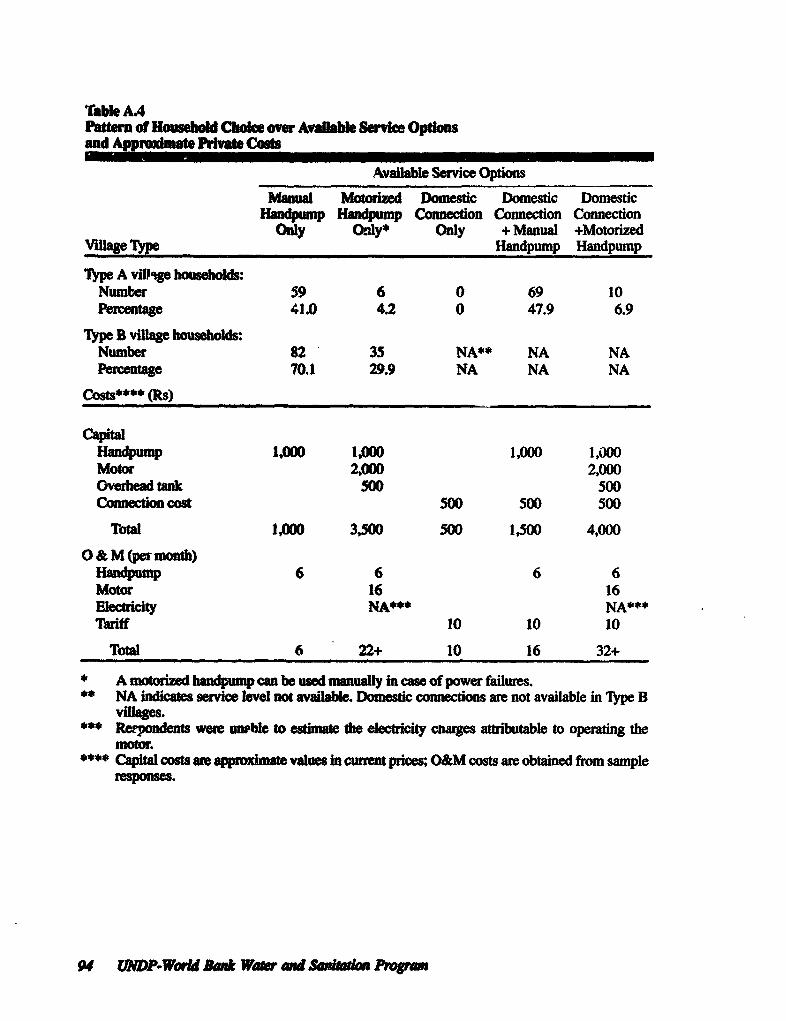
Table AAPatter of Housebhd Choice over Available Servie Optlonsand Approimdnate Privat costs
Available Service Options
Manual Motodized Domestic Domestic DomesticHandpunp Hanpump Connecion Connecion Connection
Only Only* Only + Manual +MotorizedVillage Type Handpump Handpump
Type A vlhpge households:Number 59 6 0 69 10Percentage 41.0 42 0 47.9 6.9
Type B village households:Number 82 35 NA** NA NAPercentage 70.1 29.9 NA NA NA
Costs**** (Rs)
CapitalHandpmp 1,00 100 1,000 1,000Motor 2,000 2,000Overhead tank 500 500Comnecion cost 500 500 SOO
Total 1,000 3,500 500 1,500 4,000
O & M (per month)HEndpump 6 6 6 6motor 16 16Elcticity NA*** NA***Tariff 10 10 10
Total 6 22+ 10 16 32+
* A motorized handpump can be used manually in case of power failures.** NA indicates sevice level not avaible. Domestic connections are not available in Type B
villages.** Rerpondents were uwbke to estimae the electricity cnares attibutable to opeting the
motur.**** Capital costs wie approximate values in current pices; O&M costs are obtained from sample
respoe.
94 aNDP-Wrd 20k Water ed Swuttc Imgrm
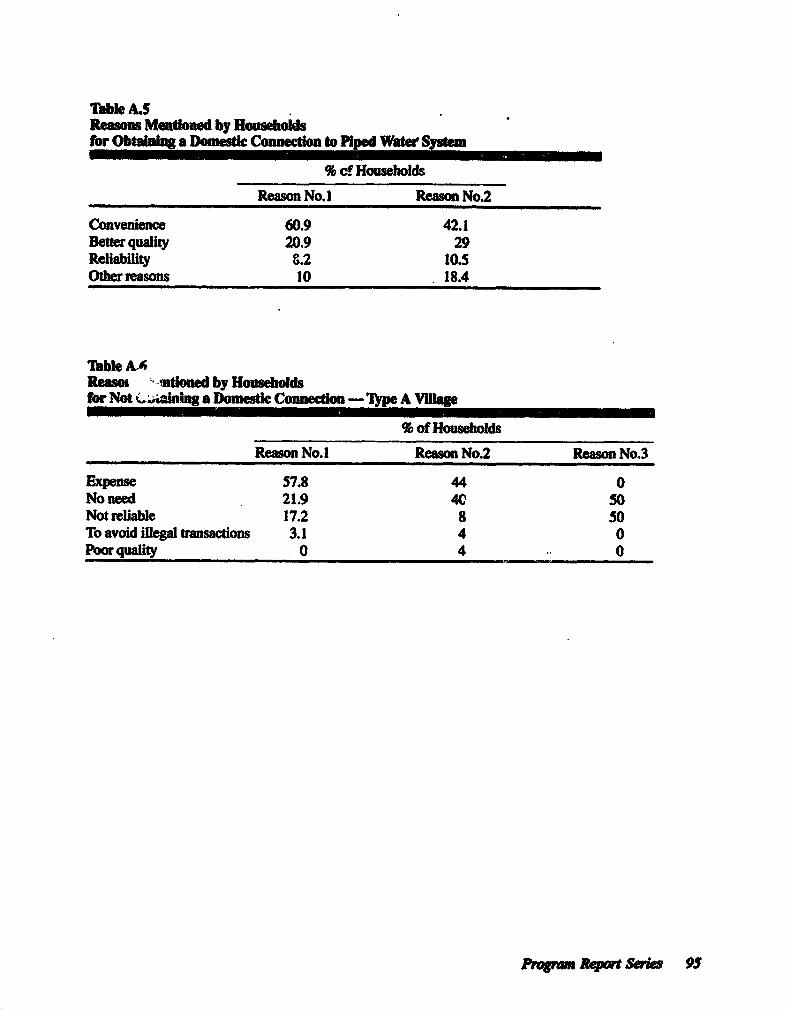
Table A.SReasons Mentoned by Householdsfor Obtaining a Domestic Connecton to Piped Watee System
% cf Households
Reason No.1 Reason No2
Convenice 60.9 42.1Better quality 20.9 29Reliability C.2 10.5Othe reasons 10 18A
Table A&fReasoa `--stioned by Householdsfor Not i-elnl~ng a DoetcConnection - Type A Villag
% of Househols
Reason No.1 Reason No.2 Reason No.3
Expense 57.8 44 0No need 21.9 44 50Not reliable 17.2 8 50To avoid iLlegal transactions 3.1 4 0Poorquality 0 4 0
P~~ogiwa RpaR t Swai 95
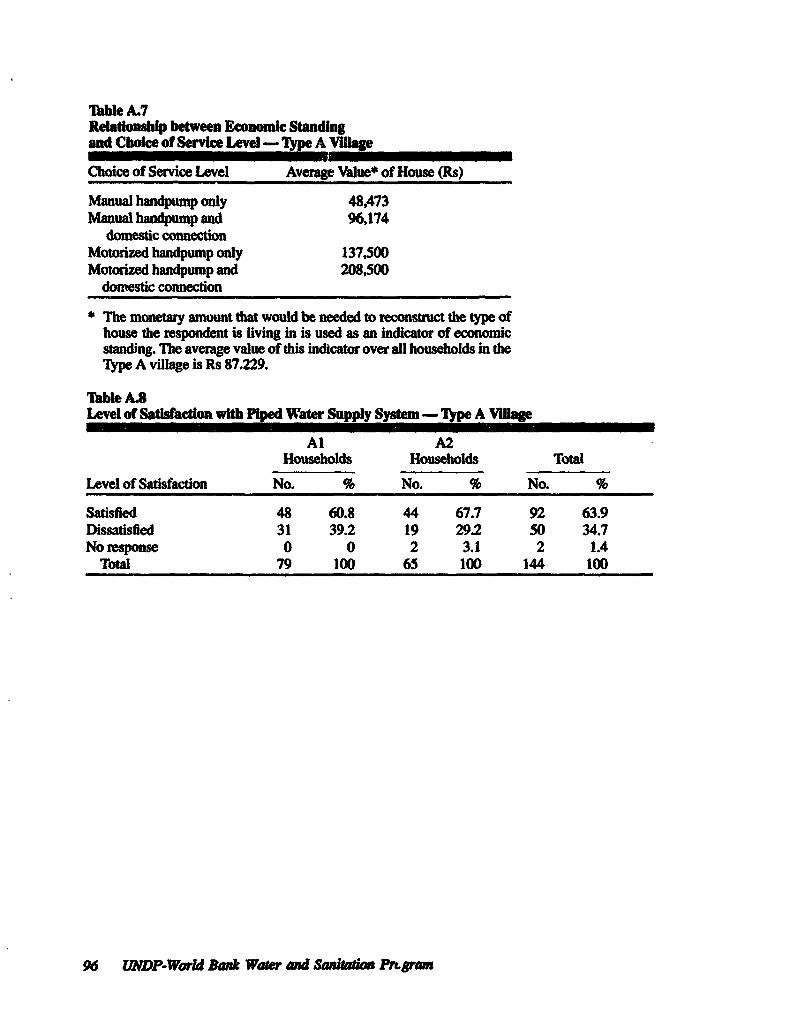
Table A.7Relatlouslp between Economic Standingand Choice of Service Level - Type A Vilage
Choice of Service Level Average Value* of House (Rs)
Manual handpump only 48,473Manual handpump and 96,174
domestic connectionMotorized handpump only 137,500Motorized handpump and 208,500
domestic connection
* The monetary amount that would be needed to reconstruct the type ofhouse the respondent is living in is used as an indicator of economicstanding. The average value of this indicator over all households in theType A village is Rs 87.229.
Table A.8Level of Satisfaction with Piped Water Supply System - Type AVile
Al A2Households Households Total
Level of Satisfaction No. % No. % No. %
Satisfied 48 60.8 44 67.7 92 63.9Dissatisfied 31 39.2 19 29.2 50 34.7No response 0 0 2 3.1 2 1.4
Total 79 100 65 100 144 100
96 UNDP-World Bank Water and Sanian Pn sm
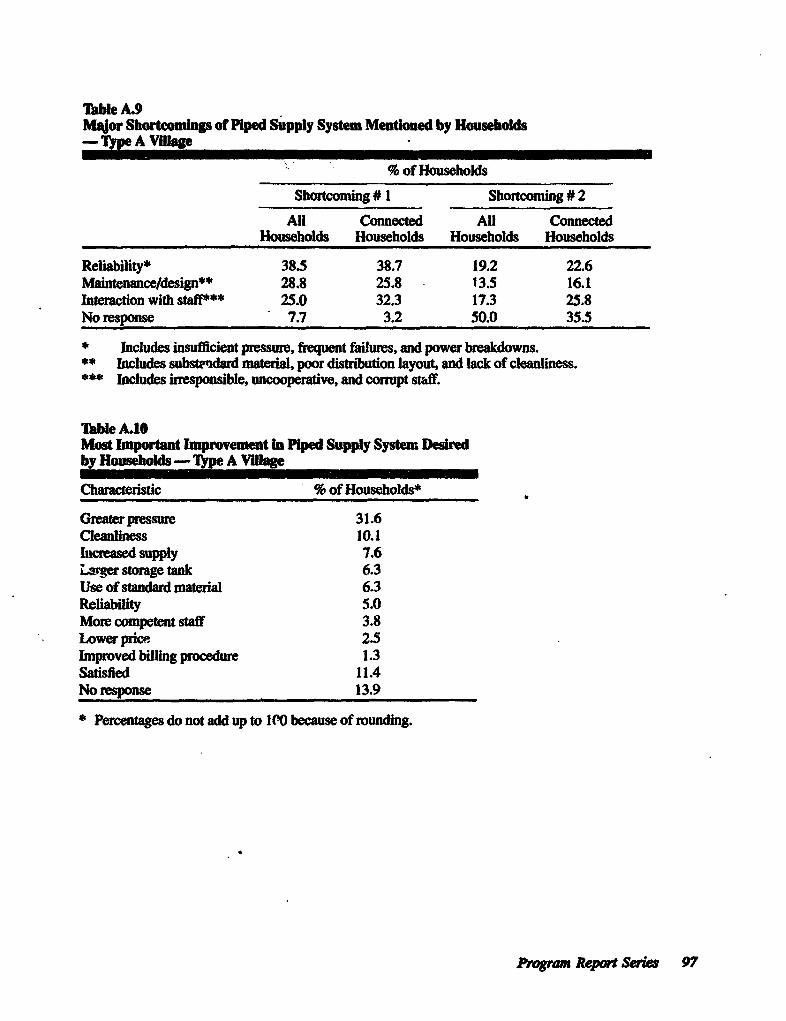
Table A.9Major Shorteomngs of Piped Supply System Mentioned by Households- Tpe A Vil,a_e
% of Households
Shorcoming # 1 Shortcoming # 2
All Connected AR ConnectedHouseholds Households Households Households
Reliability* 38.5 38.7 19.2 22.6Maintenance/design** 28.8 25.8 13.5 16.1Interaction with staff** 25.0 32.3 17.3 25.8No response 7.7 3.2 50.0 35.5
* Includes insufficient pressure, frequent failures, and power breakdowns.** Includes substendard matrial, poor distribution layout, and lack of cleanliness.***' Includes irresponsible, uncooperative, and corupt staff.
Table A.1OMost Important Improvement in Piped Supply System Desiredby Households - Type A Village
Characteristic % of Households*
Greater pressure 31.6Cleanliness 10.1Increased supply 7.6Laer storage tank 6.3Use of standard material 6.3Reliability 5.0More competent staff 3.8Lower price 2.5Improved billing procedure 1.3Satisfied 11.4No response 13.9
* Permentages do not add up to ICO because of rounding.
Progran Report SrM, 97
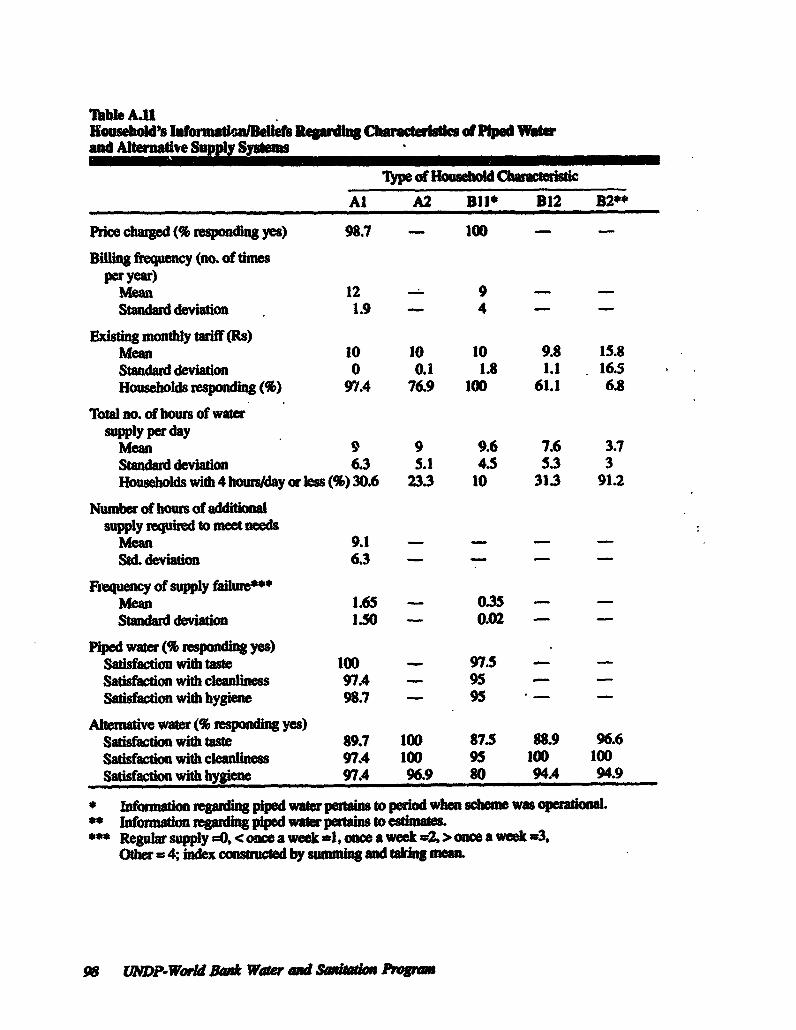
able A11Household's InforWalndilelks Regarding C Pp Wand Alternative Supply SystUMS
Tyeof HwsidCh I-
Al A2 B11* B12 B2**
Priccharged(%respondingyes) 98.7 - 100 - -
Billing frequency (no. of dmesper yea)
Mea 12 - 9 - -Standarddeviatin 1.9 - 4 - -
Exisg montly iff R)Mean 10 10 10 9.8 15.8Stndard deviation 0 0.1 1.8 1.1 16.5Households pding (%) 97.4 76.9 100 61.1 6.8
Total no. of hours of watersupply per day
Mean 9 9 9.6 7.6 3.7Standard deviation 6.3 5.1 4.5 53 3Households wit4ho4bunuayorless (%)30.6 23.3 10 313 912
Number of hous of additionalsupply required to meet needs
Mew 9.1 - - - -
SUd deviatior 6.3 - - - -
Frequency of supply hf{llUa***mean 1.65 - 0.35 - -Stndard ddeviaton 1.50 - 0.02 - -
Piped water (% respong yes)Satisfactionwith taste 100 - 975 - -Sasaction with clean s 97.4 - 9S - -Satisfactio with bygiene 98.7 - 95 - -
Altonatve water (% respond yes)Satdsfation with tae 89.7 100 87.S 88.9 96.6Satisfaton with clanliness 97.4 100 95 100 100Satisfacton with hygiene 97.4 96.9 80 94.4 94.9
* Infodmto regardin piped water petisto period when sceme was opeationaLWamnonaton regading piped wate pertains to estMWaes.
** Reguar supply =0, < once a week .1, once a week 2. > once a week w3.Other = 4; index cntucd by smmin and taing men
98 UNDp-Wor Bmk Water and Saai P _qwu
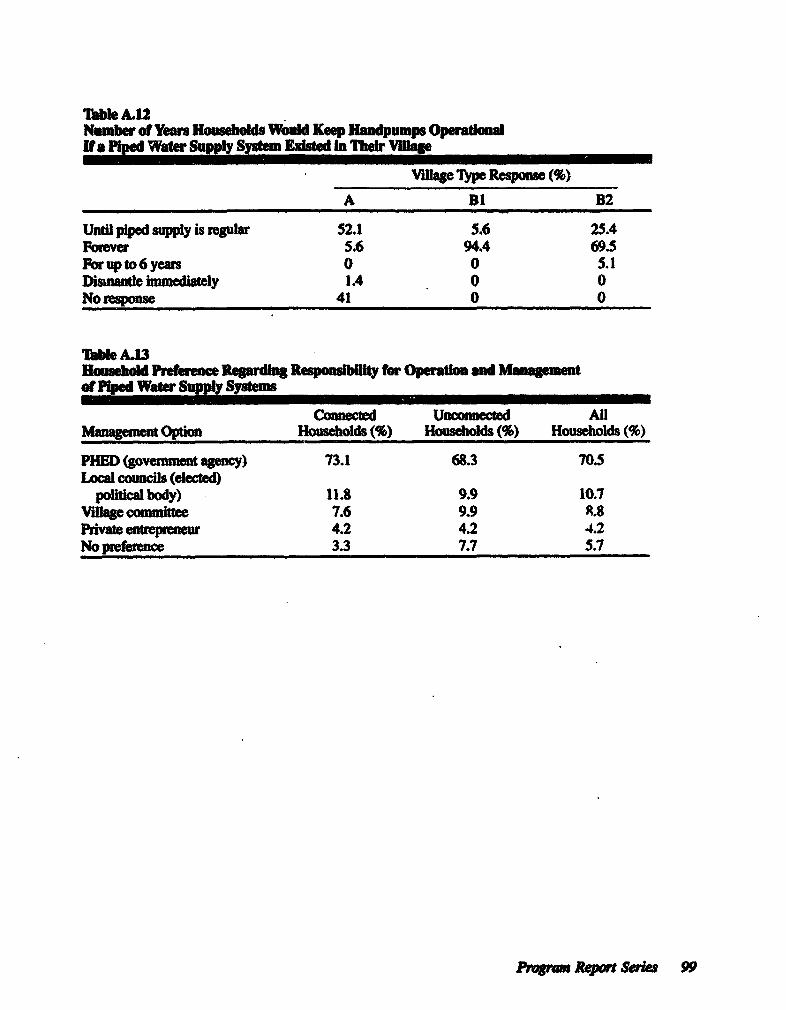
ThblA.12Number of Yea Househods Would Keep mandpumps OperaiondNo Piped Water Supply Syem Fxisted In Thir Vla
Vi ype Respon(%)
A Bl B2
Until piped supply is regular 52.1 S.6 25.4Foreve 5.6 94.4 69.5Forupto6yeans 0 0 5.1Dismantle immediately 1.4 0 0Noresponse 41 0 0
bide AM3Housebold Preferene Regding Respnst for Operatic and M _entof Piped Water Supply Sysms
Comected Unconnected AllManagme Option Households(%) Households(%) Households(%)
PHED (goveam agenc) 73.1 68.3 70.5Local councils (elected)
political body) 11.8 9.9 10.7Vllage commI 7.6 9.9 9.8Private enteprn 4.2 4.2 4.2No prerence, 3.3 7.7 5.7
PAVra Reo Series 99
Appendix B
Adusted W _lgm-sto.Pay Bads
1. In the statistical analysis of the factom affecdng the williHgness to pay for improvedserviams the dependent variable is the wdllHgn-to-pay bidc Bocause of some incompleteness andinconsistency in the desig of the bidding games cerain adjustents have had to be made to a fewof the bids elicited fom the respondents. These adjustments are explained below.
2. When a respondent said 'no" to the lowest bid value in a bidding game withouthaving said 'yes' at any stage it remained unclear whether his bid should be treated as a protest bidor a genuine zero bid or whether it ought to be assigped a value between zero and the lowest bidvalue. nuis issue was of some significance bemause in some games the lowest bid value was Rs 15which is higher than the existing tariff of Rs 10 per month for a domestic conection.
3. TI problem was resolved by relying on the respnnse received to another questionThe respondents had been asked to indicate the characteristics of what they considered to be an idealpiped water system and to Indicate w-at monthly tariff they would be wiling to pay if such a systemwere made available. The following rule was adopted for adjusting the bid teceived in the biddinggame (only for those who did not say 'yes" at any stage in the bidding game but said "no" at Rs 15in the bidding game).
Bid Offered for Ideal Sysiem Adjusted Bid Value for SystemOffred in Bidding Game
No Response Protest Bid
Zero Genuine Zero Bid
Rs 1- 5 Response laced in interval Rs 0-5
Rs 6-10 Response placed in interval Rs 5-10
Greater than or Response paced in interval Rs 10-15equal to Rs 11
Simiar adjustments were made for those bidding games where the lowest value in the bidding gamewas Rs 5 per month.
4. In one bidding game (Standard System Village B2) there was an inconsistency betweenthe high and low starting point versions. Ihe low starting point version did not contain a bid value ofRs 15 per month so that the bid inteval was Rs 10-20, whereas the high sarting point versioncontaied both intervals Rs 10-15 and Rs 15-20. The two versions were made consistent by allocatinga bid received in Rs 10-20 interval in the low startng point version to either the Rs 10-15 interval oithe Rs 15-20 interval based on the value offered for the ideal system. If the latter was greater than Rs15, the bid was placed in the Rs 15-20 interval. Othewise it was placed in the Rs 10-15 interval.
100 UNDP-World Bank Waer and Sankadon Progr
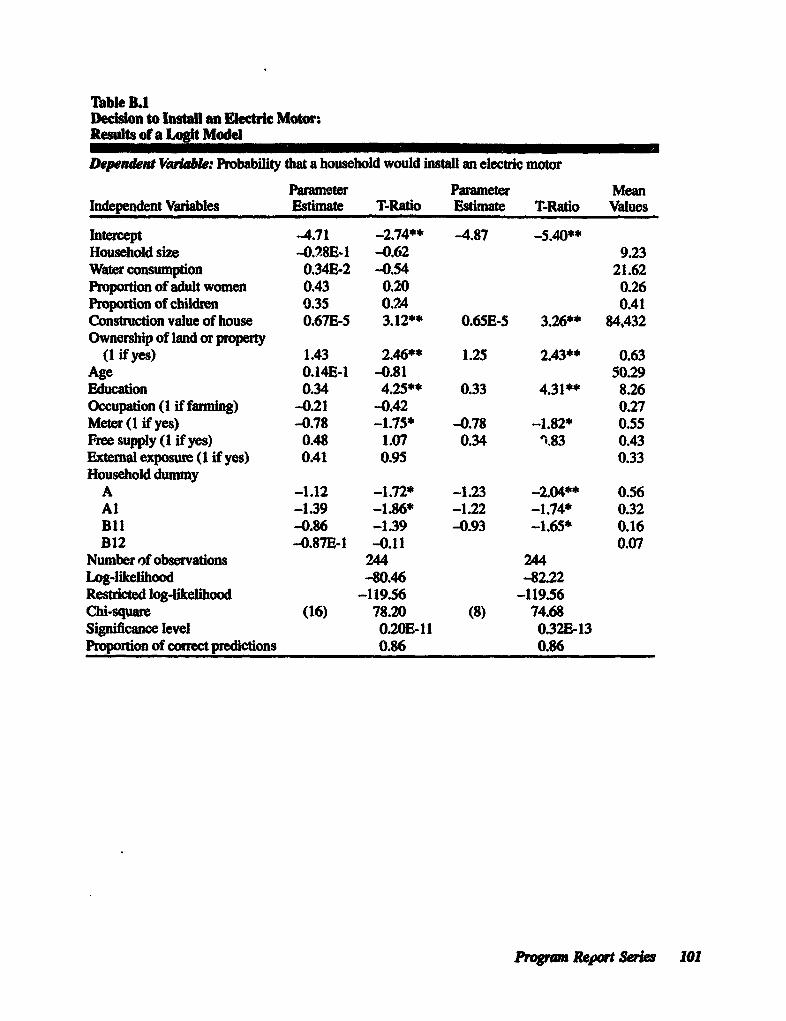
Table B.1Decsion to Install an lectric Motor.Results of a Logit Model
Dependent V kble: Probability that a household would install an electric motor
Pramet Parameter MeanIndependent Vaiiables Estmat T-Ratio Estimate T-Ratio Values
Intercept -4.71 -2.74** -4.87 -5.40**Household size -4.28E-l -0.62 9.23Water consumption 0.34E-2 -0.54 21.62Proportion of adult women 0.43 0.20 0.26Proportion of children 0.35 0.24 0.41Constuton value of house 0.67E-5 3.12** 0.65E-5 3.26** 84,432Ownership of land or property
(1 if yes) 1.43 2.46** 1.25 2.43** 0.63Age 0.14E-1 -0.81 50.29Education 0.34 4.25** 0.33 4.31** 8.26Occupation (I if faming) -0.21 -0.42 0.27Meter (1 if yes) -0.78 -1.75* -0.78 -1.82* 0.55Free supply (1 if yes) 0.48 1.07 0.34 1.83 0.43External exposure (1 if yes) 0.41 0.95 0.33Household dummy
A -1.12 -1.72* -1.23 -2.04** 0.56Al -1.39 -1.86* -1.22 -1.74* 0.32sli -0.86 -1.39 -0.93 -1.65* 0.16B12 -0.87E-1 -0.11 0.07
Number of observations 244 244Log-likelihood -80.46 -82.22Restricted log-likelihood -119.56 -119.56Chi-squa (16) 78.20 (8) 74.68Significance level 0.201E111 0.32E-13Proportion of orrect predictions 0.86 0.86
Prwn Rep Series 101
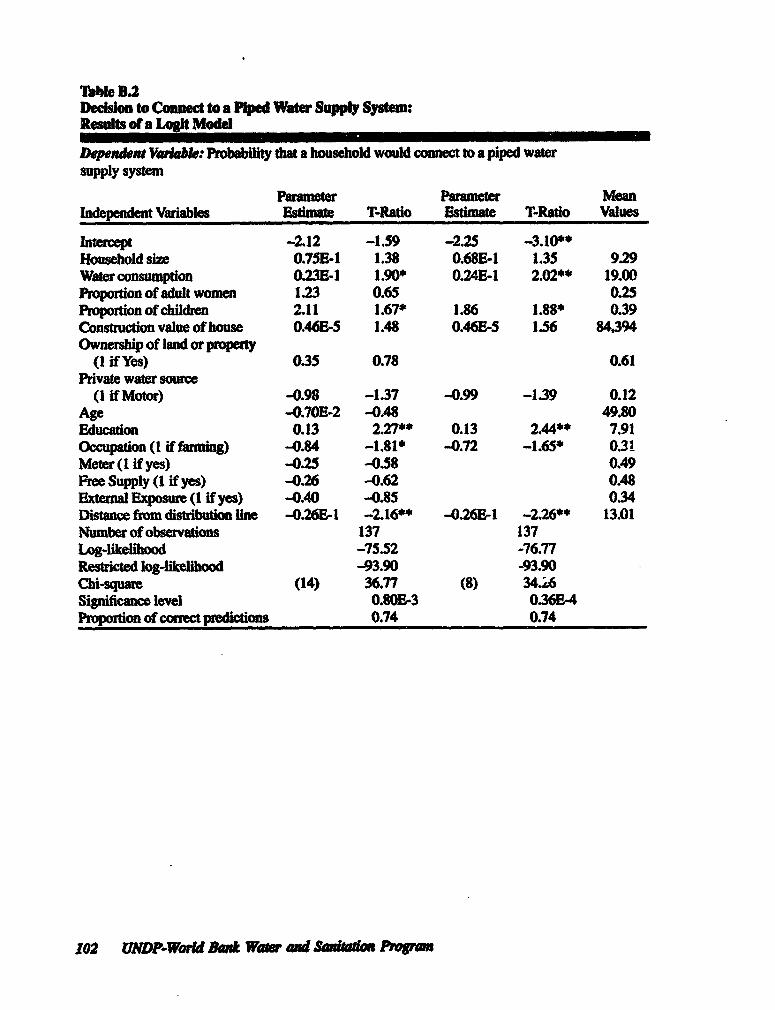
Table D2Deeision to Conect to a Piped Watw Supply System:Result ofta Logit Model
Depen&dat Variabk.: Probablity that a household would onnect to a piped watersupply systm
Pa_ameter Parameter MeanIndependSet Variables Estimate T-Ratio Estimate T-Ratio Values
Intercept -2.12 -1.59 -2.25 -3.10**Household size 0.75E-1 1.38 0.68E-1 1.35 9.29Water consunption 0.23E-1 1.90* 0.24E-1 2.02"* 19.00Proportion of adult women 1.23 0.65 0.25Proportion of chldren 2.11 1.67* 1.86 1.88* 0.39Constuction value of hse 0.46B-S 1.48 0.46E-5 1.56 84,394Ownershp of land or property
(I if Yes) 0.35 0.78 0.61Private water source
(1 ff Motor) -0.98 -1.37 -0.99 -1.39 0.12Age -0.70E-2 -0.48 49.80Education 0.13 2.27** 0.13 2.44** 7.91Occupation (I if fiaring) -0.84 -1.81* -0.72 -1.65* 0.31Meter (1 if yes) -0.25 -0.58 0.49Free Supply (1 if yes) -0.26 -0.62 0.48ExtenadExposwe(lIf yes) -0.40 -0.85 0.34Distace fiom distibuton ine -0.26E-1 -2.16** -0.2S6I -2.26** 13.01Number of observations 137 137Log-likelihood -75.52 -76.77Resetred log-ikelihood -93.90 -93.90Chi-sque (14) 36.77 (8) 34Xi6Significance level 0.80E-3 0361E4Proportion of corect predictions 0.74 0.74
102 uNDP-Warld Bank Waw ae Sanaidaion P)igrasn
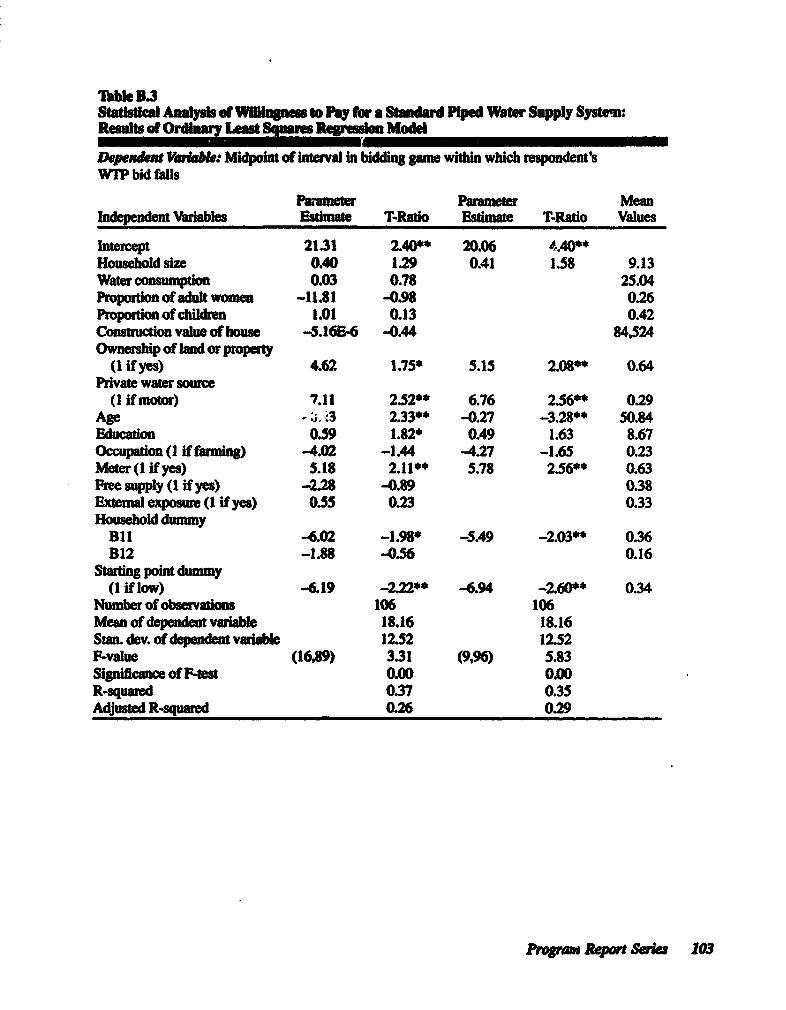
TbleB1.3Stadt Wa Anaysis of WMlngnm to Pay for a Standard iped Water Supy Systm:Reslts of Ordaylus Squares 1reu Mode
Dependent Voiabke: Mdpoint of interval in biddhn game withn which respondent'sWTP bid falls
Pa;M-ster Parmeter MeanIndependent Variables Estmate T-Ratio Estimate T-Ratio Values
Itercept 2131 2.40** 20.06 ,.40**Household size 0.40 1.29 0.41 1.58 9.13Water consumption 0.03 0.78 25.04Propordonofadultwomen -11.81 -0.98 0.26Profptoof chidien 1.01 0.13 0.42Constuction value of house -3.162-6 -0.44 84,524Ownersip of lnd or proety
(1 if yes) 4.62 1.75* 5.15 2.0841* 0.64Private water soure
(1 if motor) 7.11 2.52** 6.76 2.56** 0.29A5ge . 3. 2.33I* -0.27 -3.28'* 50.84Education 059 1.82* 0.49 1.63 8.67Occupaon (I f farmning) -4.02 -1.44 -4.27 -1.65 0.23Meer (1 if yes) 5.18 2.11** 5.78 2.56** 0.63Free supply (I if yes) -2.8 -0.89 0.38Extexna exposure (I if yes) 0.55 0.23 033Household dummy
Bli -6.02 -1.98* -5.49 -2.03** 0.36B12 -1.88 -0.56 0.16
Staing point dummy(1 if low) -6.19 -2.22** -6.94 -2.60** 0.34
Number of observadons 106 106Mkanofdependentvaribbe 18.16 18.16Sta. dev. of dependent variale 12.52 12.52F-vaIue (16,89) 3.31 (9,96) 5.83Significance of F-st 0.00 0.00R-squared 037 0.35Adjustd R-squed 0.26 0.29
P1r_m Rpot Seri 103
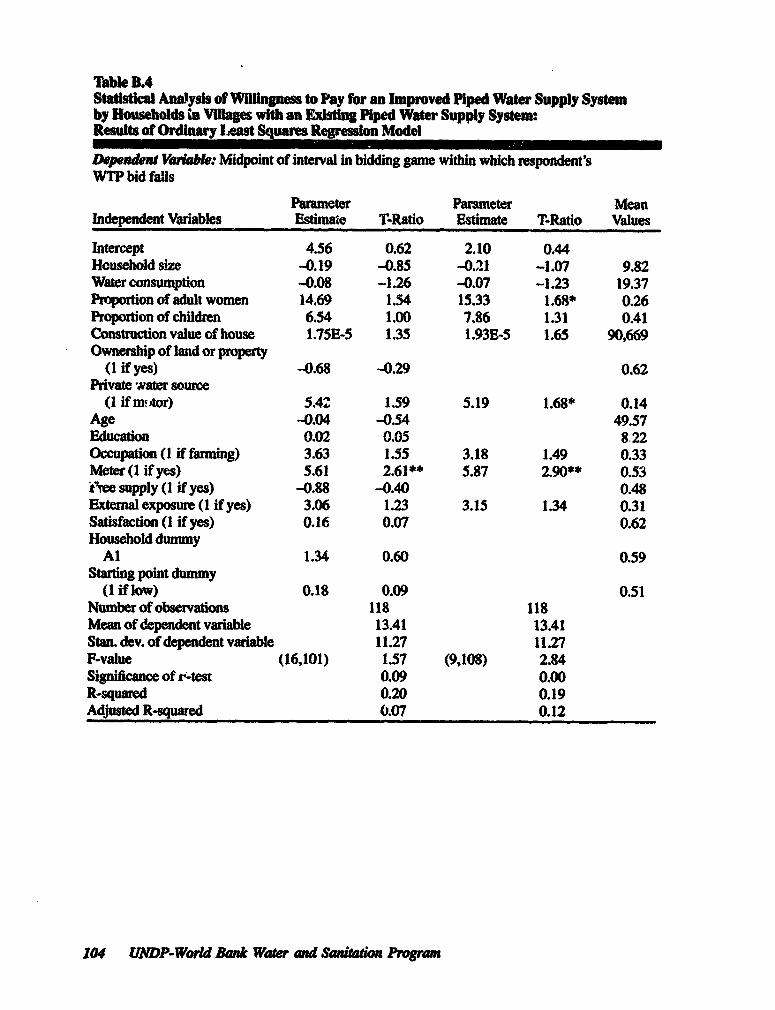
abble BAStatisical Anaysis of Willgness to Pay for an Improved Piped Water Supply Systemby Households tn Villages with an xisting Piped Water Supply System:Result of Ordinary Least Squares Regression Modd
Dependent Vwab: Midpoint of interval in bidding game within which respondent'sWTP bid falls
Patameter Parametr Meanlndependent Variables Estitnaie T-Ratio Estimate T-Ralio Values
Intercept 4.56 0.62 2.10 0.44Household size -0.19 -0.85 -0.21 -1.07 9.82Water consumption -0.08 -1.26 -0.07 -1.23 19.37Proportion of adult women 14.69 1.54 15.33 1.68* 0.26Proportion of children 6.54 1.00 7.86 1.31 0.41Construction value of house 1.75E-5 135 1.93E-5 1.65 90,669Ownerhip of land or property
(1 if yes) -0.68 -0.29 0.62Private water source
(1 if nrtor) 5.4Z 1.59 5.19 1.68* 0.14Age -0.04 -0.54 49.57Education 0.02 0.05 8.22Occupation (I if fanming) 3.63 1.55 3.18 1.49 0.33Meter (I if yes) 5.61 2.61** 5.87 2.90** 0.53t'iee supply (1 if yes) -0.88 -0.40 0.48External exposue (I if yes) 3.06 1.23 3.15 1.34 0.31Satisfaction (1 if yes) 0.16 0.07 0.62Household dwmny
Al 1.34 0.60 0.59Strting point dummy
(1 if law) 0.18 0.09 0.51Numberof observations 118 118Mean of dependent variable 13A1 13.41StaL dev. of dependent vaiable 11.27 11.27P-value (16,101) 1.57 (9,108) 2.84Significance of r-tes 0.09 0.00R-squared 0.20 0.19Adjused R-squaed 0.07 0.12
104 UNDP-World Bank Water and Sanitatin Prgrain
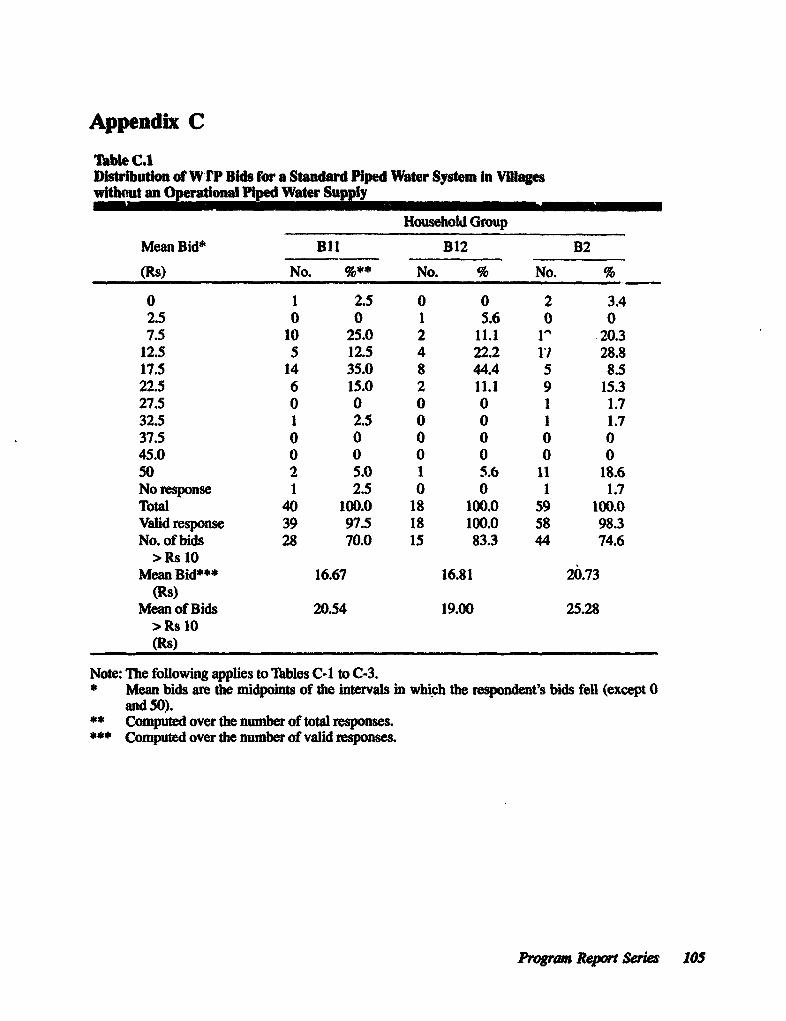
Appendix C
Table C.ADistibution of W lP Bids for a Standard Piped Water System In Villageswitheut an Operational Piped Water Supply
Household Group
Mean Bid* Bil B12 B2
(Rs) No. % No. % No. %
0 1 2.5 0 0 2 3.42.5 0 0 1 5.6 0 07.5 10 25.0 2 11.1 1^ 20.3
12.5 5 12.5 4 22.2 1I 28.817.5 14 35.0 8 44.4 5 8.522.5 6 15.0 2 11.1 9 15.327.5 0 0 0 0 1 1.732.5 1 2.5 0 0 1 1.737.5 0 0 0 0 0 045.0 0 0 0 0 0 050 2 5.0 1 5.6 11 18.6No response 1 2.5 0 0 1 1.7Total 40 100.0 18 100.0 59 100.0Valid response 39 97.5 18 100.0 58 98.3No. of bids 28 70.0 15 83.3 44 74.6
>Rs 10Mean Bid*** 16.67 16.81 20.73
(Rs)Mean of Bids 20.54 19.00 25.28
>Rs 10(Rs)
Note: The following applies to Tables C-I to C-3.* Mean bids are the midpoints of the intervals in which the respondent's bids fell (except 0
and 50).** Computed over the number of total responses.*4w' Computed over the number of valid responses.
Program Report Series 105
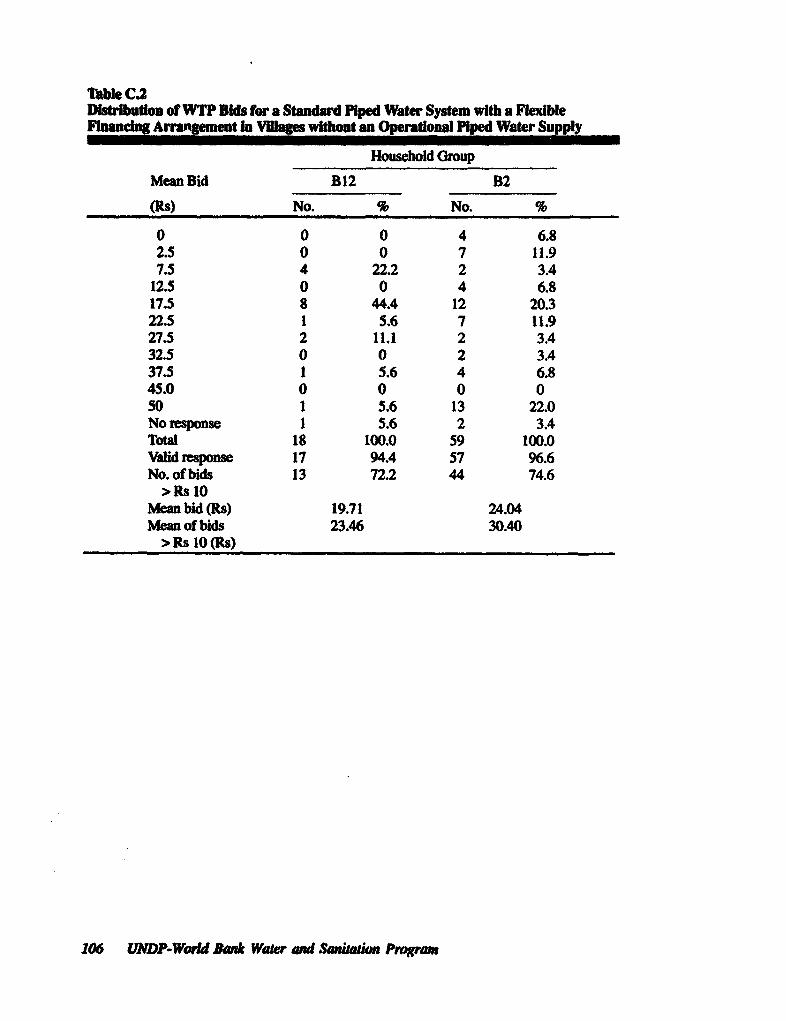
Tlble CaDisibutdon of WTP Bids for a Standard Piped Water System with a FlexibleFiancing Arrngem t In Villages without an Operational Piped Water Supply
Household Group
Mean Bid B12 B2
(Rs) No. % No. %
0 0 0 4 6.82.5 0 0 7 11.97.5 4 22.2 2 3.4
12.5 0 0 4 6.817.5 8 44.4 12 20.322.5 1 5.6 7 11.927.5 2 11.1 2 3.432.5 0 0 2 3.437.5 1 5.6 4 6.845.0 0 0 0 050 1 5.6 13 22.0No response 1 5.6 2 3.4Total 18 100.0 59 100.0Valid response 17 94.4 57 96.6No. of bids 13 72.2 44 74.6
>Rs 10Mean bid (Rs) 19.71 24.04Mean of bids 23.46 30.40
>Rs 10(Rs)
106 UNDP-World Ba* Wat ad and.Sat Program
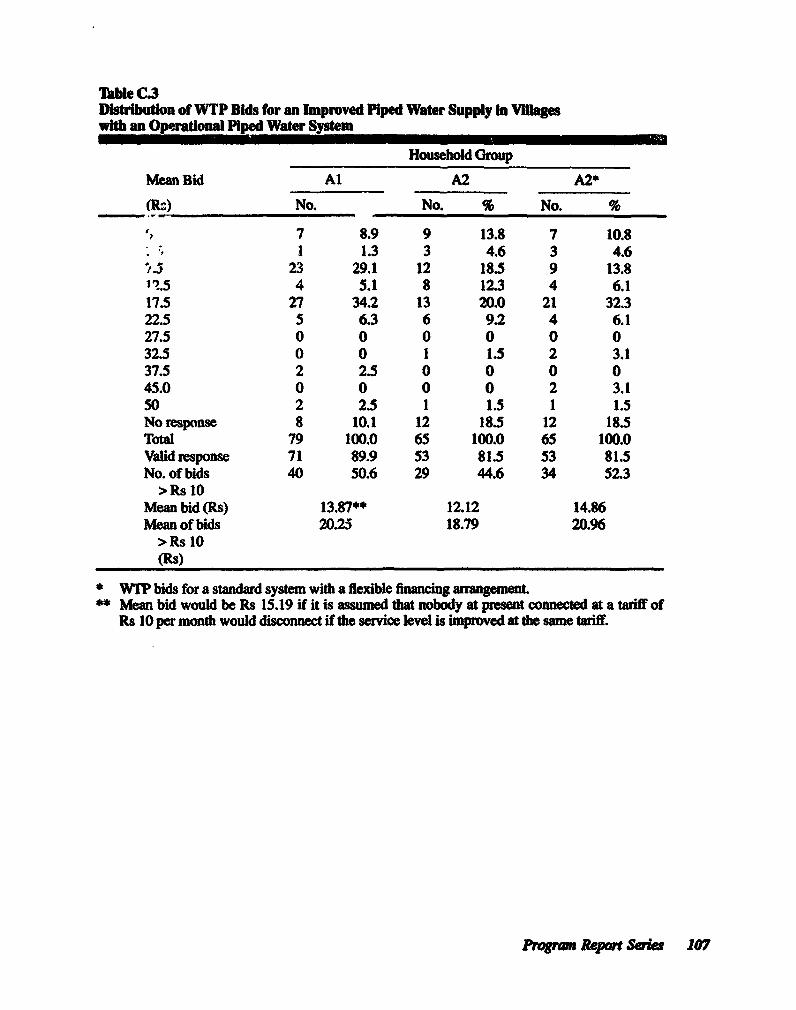
Tlhe C.3Distribution of WTP Bids for an Improved Piped Water Supply In ViUageswith an Operational Piped Water Sysem
Household Croup
Mean Bid Al A2 A2*
(Rz) No. No. No. %
7 8.9 9 13.8 7 10.81 1.3 3 4.6 3 4.6
,.5 23 29.1 12 18.5 9 13.8,1.5 4 5.1 8 12.3 4 6.1
17.5 27 34.2 13 20.0 21 32.322.5 5 6.3 6 9.2 4 6.127.5 0 0 0 0 0 032.5 0 0 1 1.5 2 3.137.5 2 2.5 0 0 0 045.0 0 0 0 0 2 3.150 2 2.5 1 1.5 1 1.5No response 8 10.1 12 18.5 12 18.5Total 79 100.0 65 100.0 65 100.0Valid response 71 89.9 53 81.5 53 81.5No. of bids 40 50.6 29 44.6 34 52.3
> Rs 10Mean bid (Rs) 13.87** 12.12 14.86Mean of bids 20.25 18.79 20.96
>Rs 10MRs)
* WTP bids for a standard system with a flexible financing arrangement** Mean bid would be Rs 15.19 if it is assumed that nobody at present connected at a tariff of
Rs 10 per month would disconnect if the service level is improved at the same tariff.
PraM Report Series 107
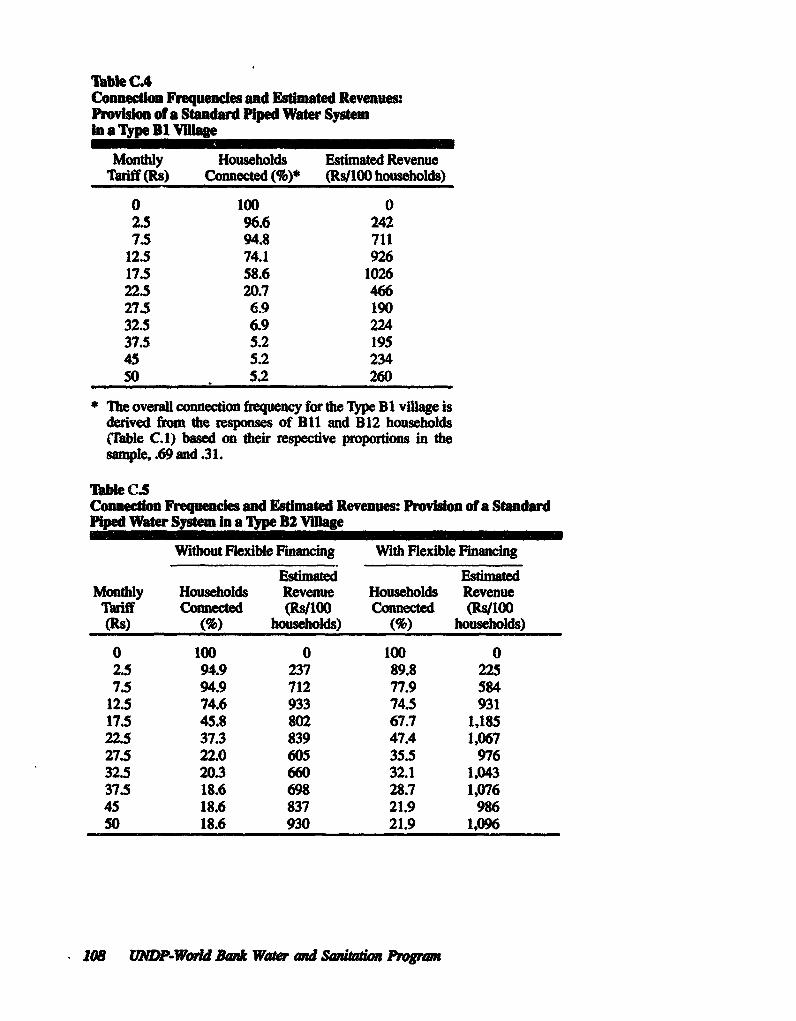
Table CAConnecti Frequencles and Esmated Revenues:Provison of a Standard Piped Water Systemin a Type B1 Viae
Monthly Households Estimated RevenueTariff (Rs) Conmcted(%)* (Rs100 households)
0 100 02.5 96.6 2427.5 94.8 711
12.5 74.1 92617.5 58.6 102622.5 20.7 46627.5 6.9 190325 6.9 22437.5 5.2 19545 5.2 23450 5.2 260
- The overal connection frequency for the Type BI vilUage isderived frm the responses of Bil and B12 households(Table C.1) based on their respective proportions in thesample, .69 and .31.
Table C5Connectio Frequencies and Estimed Revenues: Provison of a StandardPiped Water System in a Type B? Vilage
Wlthout Flexible Financing With Flexible Financing
Estimated EstimatedMoently Households Revenue Households RevenueTaiff Connected (Rs/100 Connected (Es/lOG(Ms) (%) households) (%) households)
0 100 0 100 02.5 94.9 237 89.8 2257.5 94.9 712 77.9 584
12.5 74.6 933 74.5 93117.5 45.8 802 67.7 1,18522.5 37.3 839 47.4 1,06727.5 22.0 605 35.5 97632.5 20.3 660 32.1 1,04337.5 18.6 698 28.7 1,07645 18.6 837 21.9 986SO 18.6 930 21.9 1,096
Jo e UNDP-Wodd Bank Water and San n Proram
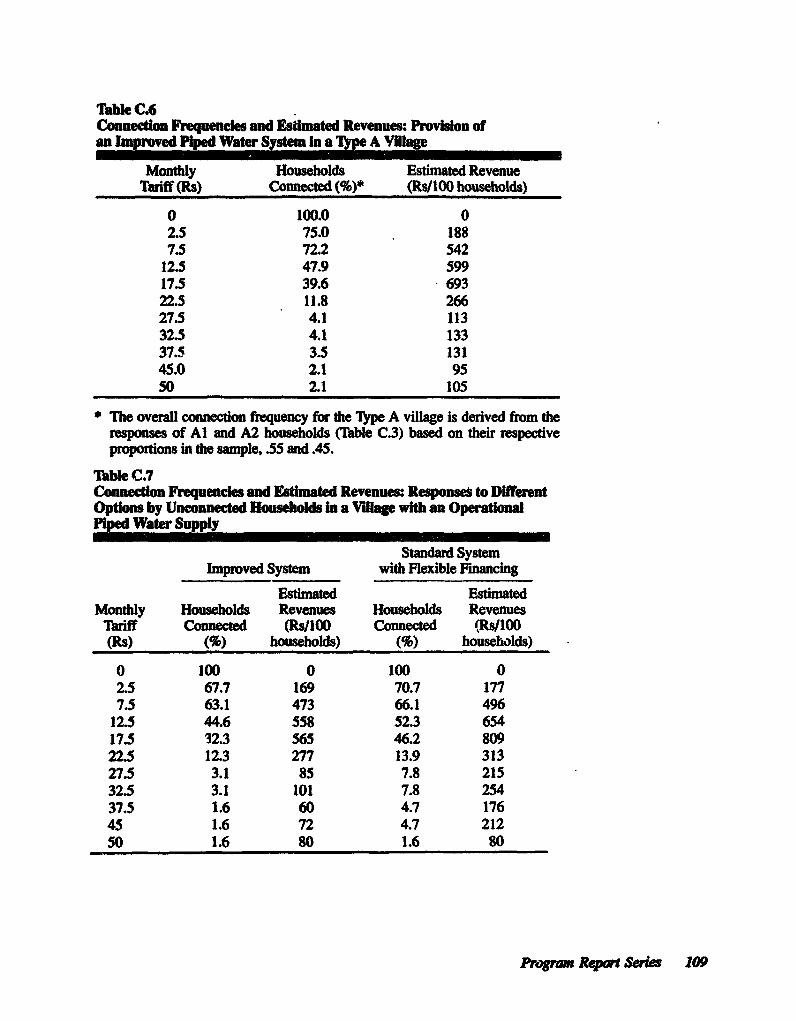
Tabk C6Connection Frequencies and Estimated Revenues: Providon ofan Improved Piped Water System In a Type A Vlglage
Monthly Households Estmated RevenueTariff (Rs) Connected(%)* (Rs/lOO households)
0 100.0 02.5 75.0 1887.5 72.2 542
12.5 47.9 59917.5 39.6 69322.5 11.8 26627.5 4.1 11332.5 4.1 13337.5 3.5 13145.0 2.1 9550 2.1 105
3 The overall connection frequency for the Type A village is derived fron theresponses of Al and A2 households (Table C.3) based on their respectiveproportions in the sample, .55 and .45.
Table C.7Connectio Frequencies and Esdimated Revenues: Responses to DifferentOptons by Unconnected Households in a Village with an OperatilPiped Water Supply
Standard SystemImproved System with Flexible Financing
Estimated EstimatedMonthly Households Revenues Households Revenues
Tariff connected (Rs/100 Connected (RswlOO(Rs) (%) households) (*) households)
0 100 0 100 02.5 67.7 169 70.7 1777.5 63.1 473 66.1 496
12.5 44.6 558 52.3 65417.5 32.3 565 46.2 80922.5 12.3 277 13.9 31327.5 3.1 85 7.8 21532.5 3.1 101 7.8 25437.5 1.6 60 4.7 17645 1.6 72 4.7 21250 1.6 80 1.6 80
Prgrm Rewt Series 109
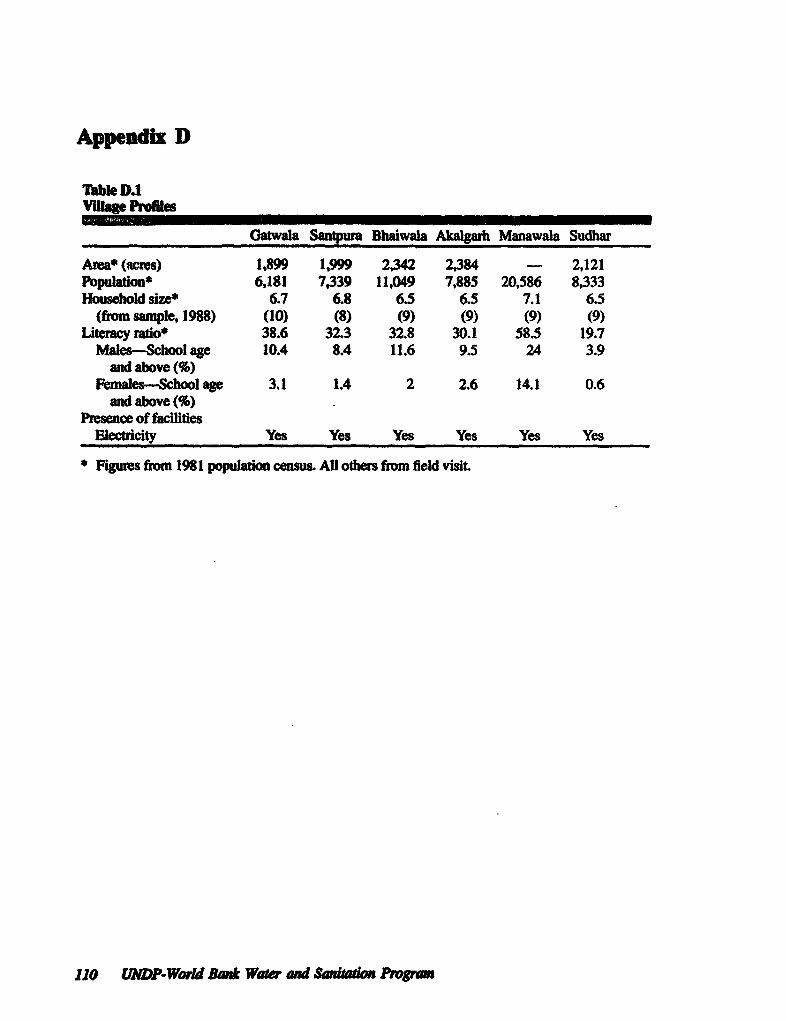
Appendix D
Tabb D.1vuhp ProM..
Gatwala Santpura Bhaiwala Aklgarfh Manawala Sudhar
Are (acrw) 1,899 1,999 2,342 2,384 - 2,121Populaton* 6,181 7,339 11,049 7,885 20,586 8,333Household size 6.7 6.8 6.5 6.5 7.1 6.5
(from sample, 1988) (10) (8) (9) (9) (9) (9)Literay ratio 38.6 32.3 32.8 30.1 58.5 19.7
Males-School age 10.4 8.4 11.6 9.5 24 3.9and above (%)
Females-School age 3.1 1.4 2 2.6 14.1 0.6and above (%)
Presence of facilitiesElectdcity Yes Yes Yes Yes Yes Yes
* Figs from 1981 populaton census. All ots from field visit.
110 UNDP-Worl Rank WaWer and Sniao Pp
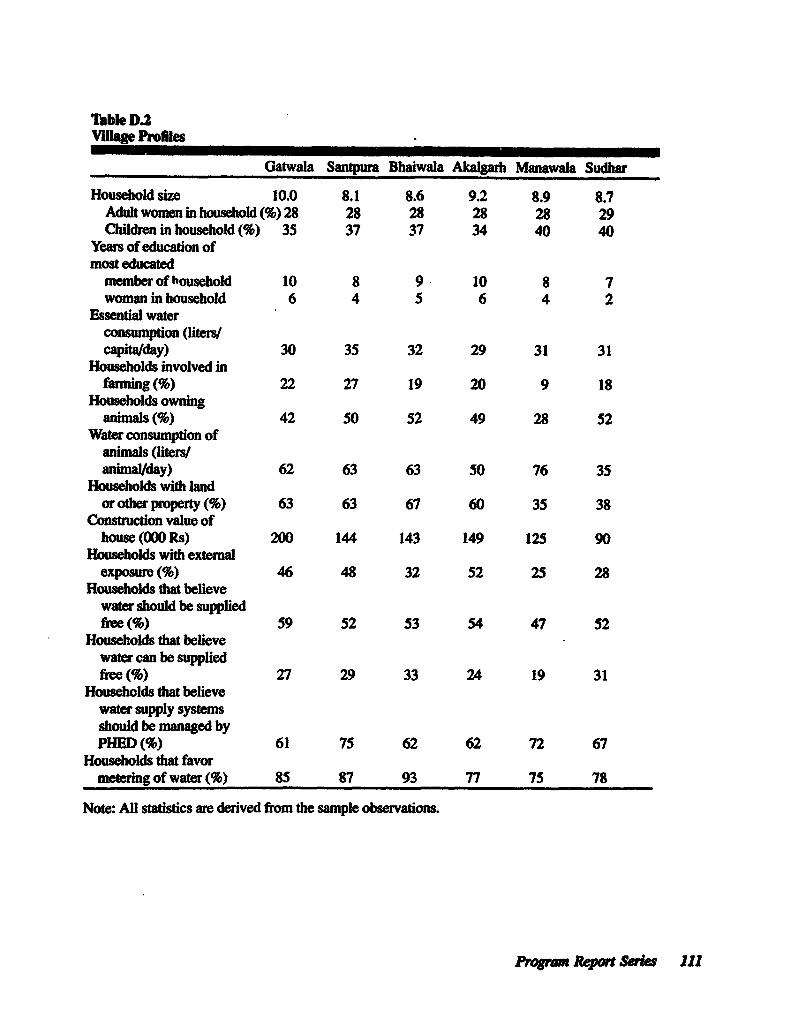
Tble D2Village Profiles
Gatwala Santpura Bhaiwala Akalgarh Manawala Sudhar
Household size 10.0 8.1 8.6 9.2 8.9 8.7Adult women in housold (%)28 28 28 28 28 29Children in household (%) 35 37 37 34 40 40
Years of education ofmost educated
member of household 10 8 9 10 8 7woman in household 6 4 5 6 4 2
Essential waterconsumption (Liters/capita/day) 30 35 32 29 31 31
Households involved infarming (%) 22 27 19 20 9 18
Households owningninals (%) 42 50 52 49 28 52
Water consumption ofanimas (liters/animalJday) 62 63 63 50 76 35
Households with landor oier property (%) 63 63 67 60 35 38
Construction value ofhouse (000 Rs) 200 144 143 149 125 90
Households with externalexposure(%) 46 48 32 52 25 28
Households that believewater should be suppliedfree (%) 59 52 53 54 47 52
Households that believewater can be suppliedfre (%) 27 29 33 24 19 31
Households that believewater supply systemsshould be managed byPHED (%) 61 75 62 62 72 67
Households that favormetering of water (%) 85 87 93 77 75 78
Note: All statistics are derived from the sample observations.
Pror Report Seri 111
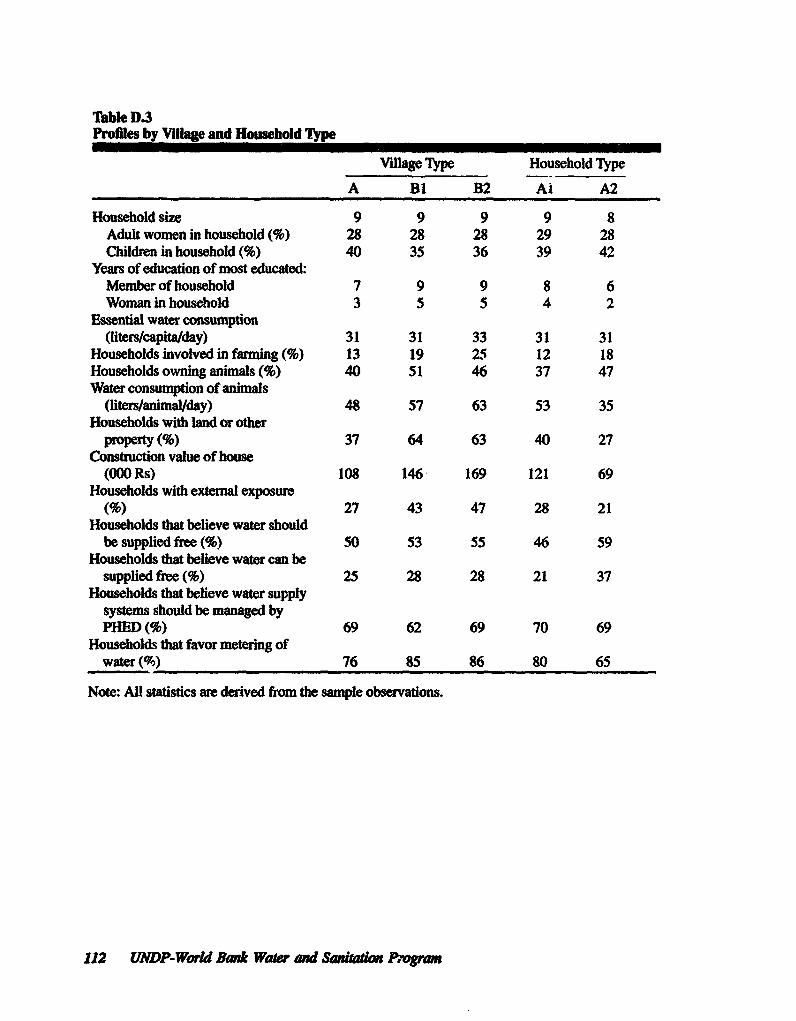
Table D3ProflHes by Vllage and Household Type
Village Type Household Type
A BI B2 Al A2
Household size 9 9 9 9 8Adult women in household (%) 28 28 28 29 28Children in household (%) 40 35 36 39 42
Years of education of most educated:Member of household 7 9 9 8 6Woman in household 3 5 5 4 2
Essential water consumption(liters/capita/day) 31 31 33 31 31
Households involved in fanming (%) 13 19 25 12 18Households owning animals (%) 40 51 46 37 47Water consumpton of animals
(liters/animal/day) 48 57 63 53 35Households with land or other
property (%) 37 64 63 40 27Construction value of house
(O0 Rs) 108 146 169 121 69Households with external exposure
(%) 27 43 47 28 21Households that believe water should
be supplied free (%) 50 53 55 46 59Households that believe water can be
supplied free (%) 25 28 28 21 37Households that believe water supply
systems should be managed byPHED (%) 69 62 69 70 69
Households that favor metering ofwater (%) 76 85 86 80 65
Note: All statistics are derived from the sample observations.
112 UNDP-World Bak Water and Sanitation Pogram
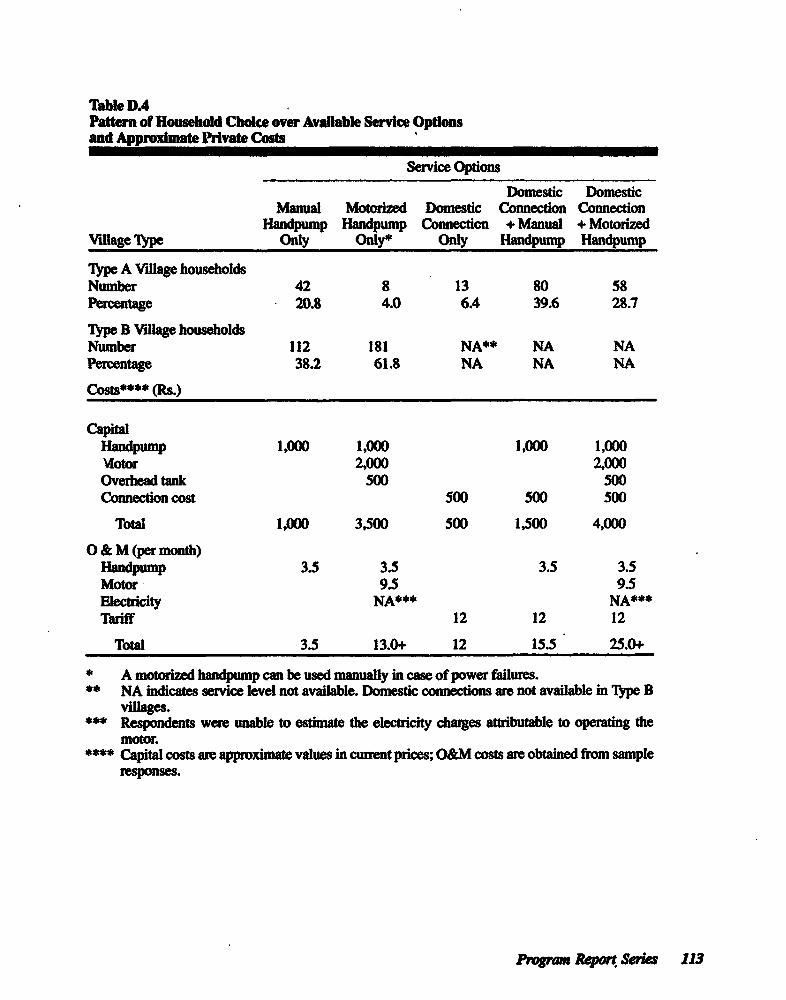
Table D4Pattern of Household Choke over Available Service Opdonsand Approximate Private Costs
Service Options
Domestic DomesticManual MotDrized Domestic Connection Connection
Handpump Handpump Connecticn + Manual + MotorizedVillage lype Only Only* Only Handpump Handpump
Type A Village householdsNumber 42 8 13 80 58Pecentage 20.8 4.0 6.4 39.6 28.7
Type B Village householdsNumber 112 181 NA** NA NAPercentage 38.2 61.8 NA NA NA
Costs**** (Rs.)
Cti.andpump 1,000 1,000 1,000 1,000Vtotor 2,000 2,000Overhead tank 500 500Connection cost 500 500 500
Total 1.000 3,500 500 1,500 4,000
3 & M (per month)landpump 3.5 3.5 3.5 3.5
Motor 9.5 9.5Electricity NA*** NA***Tariff 12 12 12
Total 3.5 13.0+ 12 15.5 25.0+
* A motorized handpump can be used manually in case of power failures.** NA indicates service level not available. Domestic connections are not available in Type B
villages.*** Respondents were unable to estimate the electricity charges attributable to operating the
motor.**** Capital costs are approximate values in curent prices; O&M costs are obtained from sample
responses.
Progam Rot Sriat 113
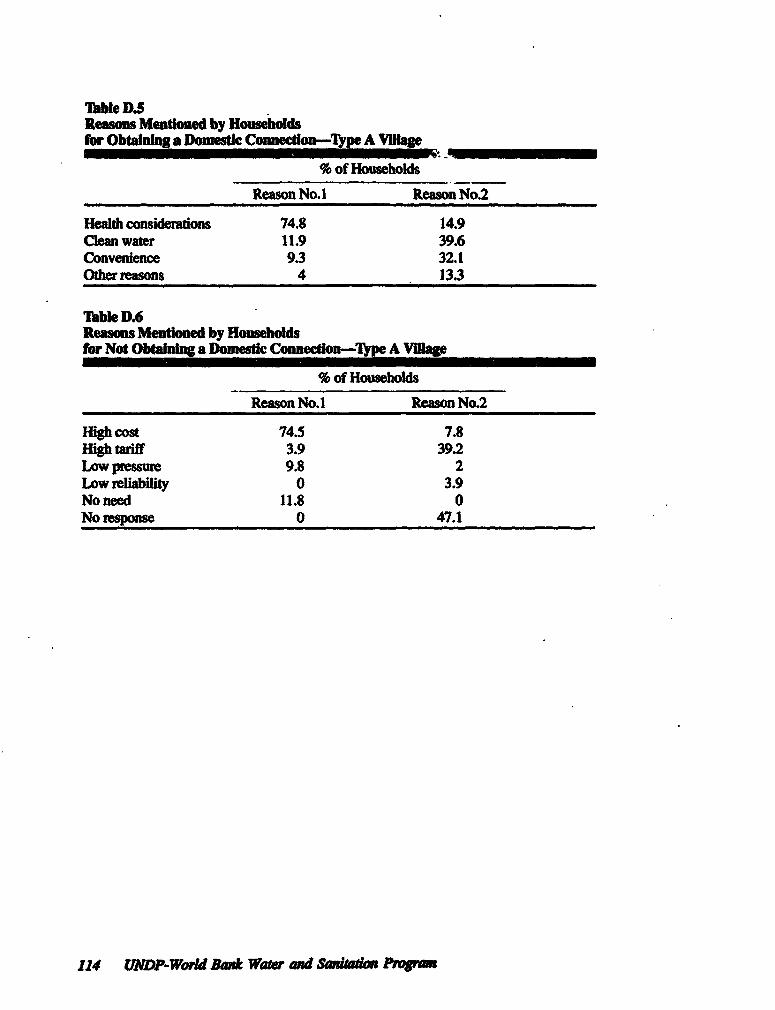
ThbIe D.5Reasons Mentioned by Householdsfor Obtaining a Domestc Connecion-Type A Vilae
% of Households
Reason No.1 Reason No2
Health considerations 74.8 14.9Cleanwater 11.9 39.6Convenience 9.3 32.1Otherreasons 4 13.3
TIble D.6Reasons Mentioned by Householdsfor Not Obtainlg a Domestic ConnecUlok-Tpe A Village
% of Households
Reason No.1 Reason No.2
High cost 74.5 7.8High tariff 3.9 39.2Low pressure 9.8 2Low reliability 0 3.9Noneed 11.8 0No response 0 47.1
114 UNDP-World Rank Watff and SantatiPronP r
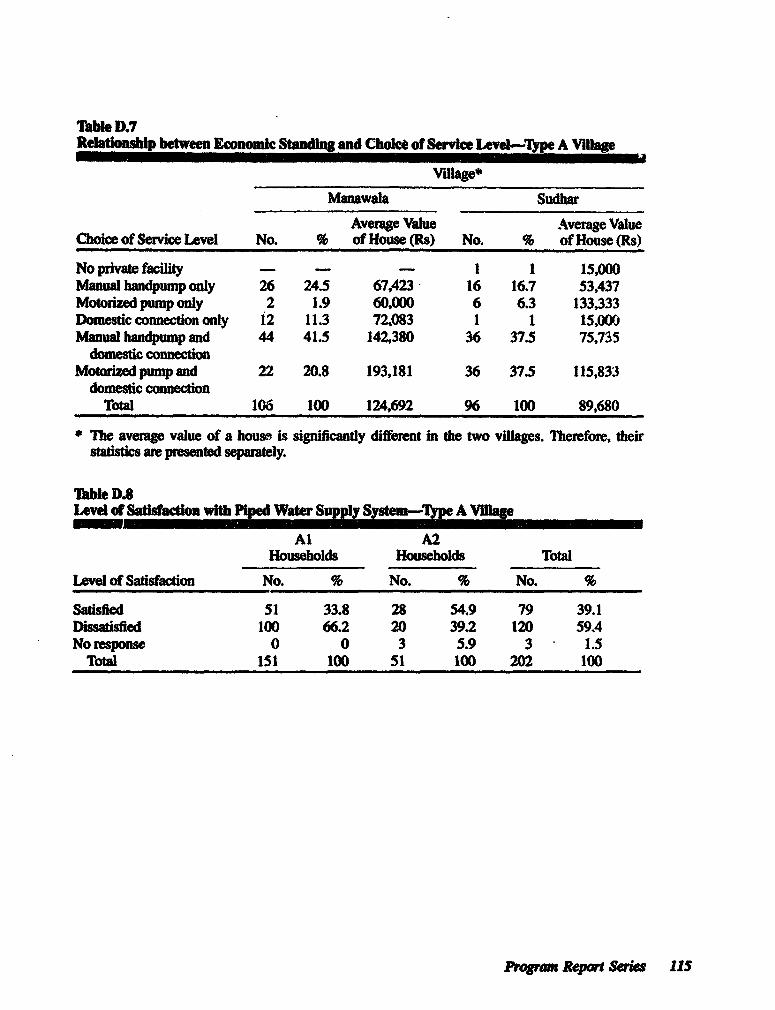
Table D.7Relationship between Economic Staudig and Choce of Service Level-Type A Village
Village*
Manawala Sudhar
Average Value Average ValueChoice of Service Level No. % of House (Rs) No. % of House (Rs)
No private facility - - - 1 1 15,000Manual handpump only 26 24.5 67,423 16 16.7 53,437Mowoized pump only 2 1.9 60,000 6 6.3 133,333Domestic connection only i2 11.3 72,083 1 1 15,00JManual handpump and 44 41.5 142,380 36 37.5 75,735
domesic connectionMotoized pump and 22 20.8 193,181 36 37.5 115,833
domestc connectionTotal 106 100 124,692 96 100 89,680
* Tlhe average value of a house is significantly different in the two villages. Therefore, theirstatisdcs are presented separately.
Table D8Leel Of Satisfacion wuh Piped Water Supply Sysem-Type A Vlage
Al A2Households Households Total
Level of Satisfaction No. % No. % No. %
Satsfied 51 33.8 28 54.9 79 39.1Dissatisfied 100 66.2 20 39.2 120 59.4No response 0 0 3 5.9 3 1.5
Total 151 100 51 100 202 100
Program Repot Srie 115
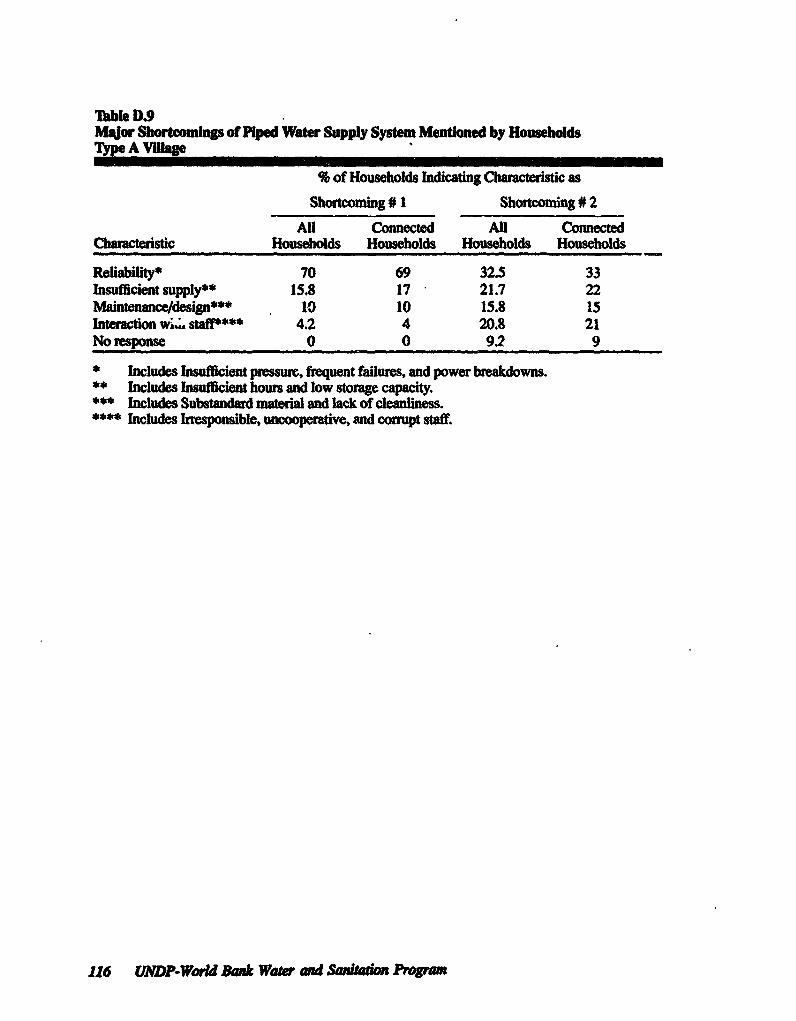
Table D.9MaJor Shert_omig of Piped Water Supply System Mentined by HouweboldsTyvpe A Villag
% of Households Indicating Chamcteiistic as
Shorcoming # 1 Shrtcoming # 2
AR Connected AD ConmectedCharactersc Households Households Households Households
Reliability* 70 69 32.5 33Insufficient supply** 15.8 17 21.7 22Maintenance/design*** 10 10 15.8 15Interaction wa". staff**** 4.2 4 20.8 21Noresponse 0 0 9.2 9
* Includes Insufficient pressure, frequent failures, and power breakdowns.* bIncludes Insufficient hours and low storage capacity."'" nlcludes Substandard material and lack of cleanlness.-*** Includes Irresponsible, uncooperaive, and comrupt staff.
116 uNDP-Workl &rak Water ad Saniion Progrn
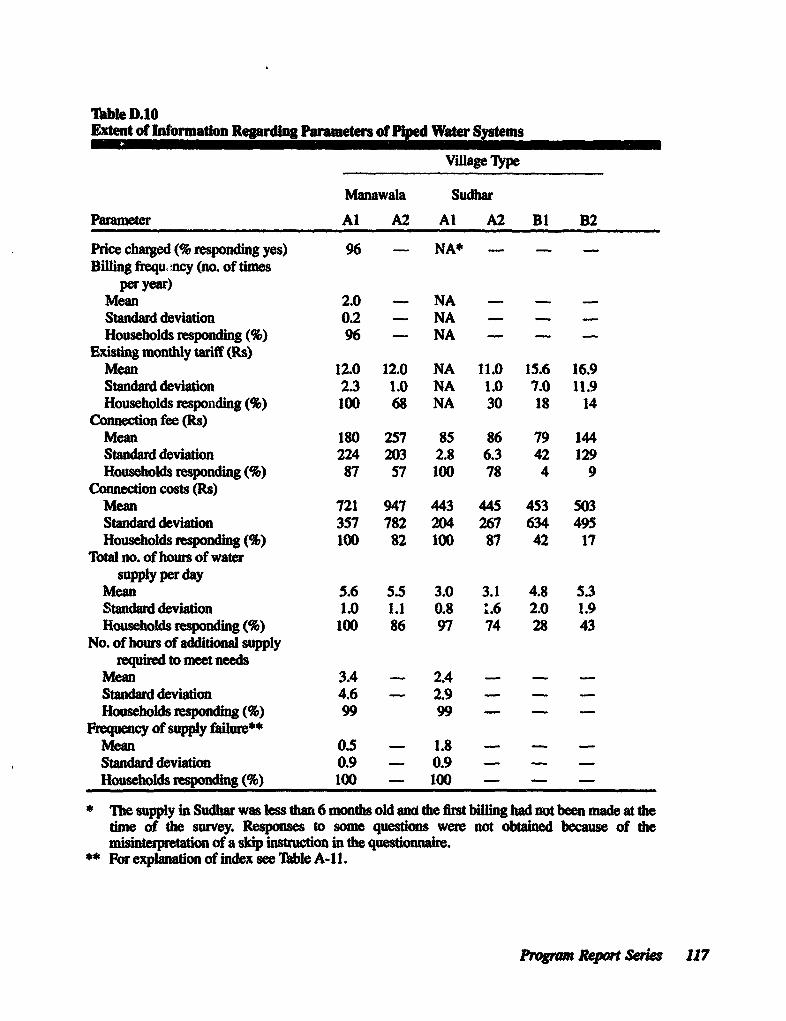
Table D.10Extent of Informaton Rerding Parameters of Piped Water Systems
Viliage lype
Manawala Sudha
Parameter Al A2 Al A2 BI B2
Price charged (% responding yes) 96 - NA* - - -Billing fiequ. ncy (no. of tmes
per year)Mean 2.0 - NA - - -Standard deviation 0.2 - NA - - -Households responding (%) 96 - NA - - -
Existing monthly tariff (Rs)Mean 12.0 12.0 NA 11.0 15.6 16.9Standarddeviation 23 1.0 NA 1.0 7.0 11.9Households responding (%) 100 68 NA 30 18 14
Connection fee (Rs)Mean 180 257 85 86 79 144Suandard deviation 224 203 2.8 6.3 42 129Households responding (%) 87 57 100 78 4 9
Connection costs (Rs)Mean 721 947 443 445 453 503Standard deviadon 357 782 204 267 634 495Households re ding () 100 82 100 87 42 17
Total no. of hours of watersupply per day
Mean 5.6 5.5 3.0 3.1 4.8 5.3Standard deviadon 1.0 1.1 0.8 1.6 2.0 1.9Households responding (%) 100 86 97 74 28 43
No. of hours of additional supplyrequired to meet needs
Mean 3.4 - 2.4 - - -Standard deviaton 4.6 - 2.9 - - -Households rsonding (%) 99 99 - - -
Frequency of supply failure**Mean 0.5 - 1.8 - - -Standard deviation 0.9 - 0.9 - - -Households esponding (%) - 100 - - -
* The supply in Sudhar was kss than 6 months old and the fist billing had no been made at thetme of the survey. Responses to some questions were not obtained because of themisinterpretation of a skip instrucdon in the questionnaire.
** For explanation of index see Table A-11.
Proam Repart Seies 117
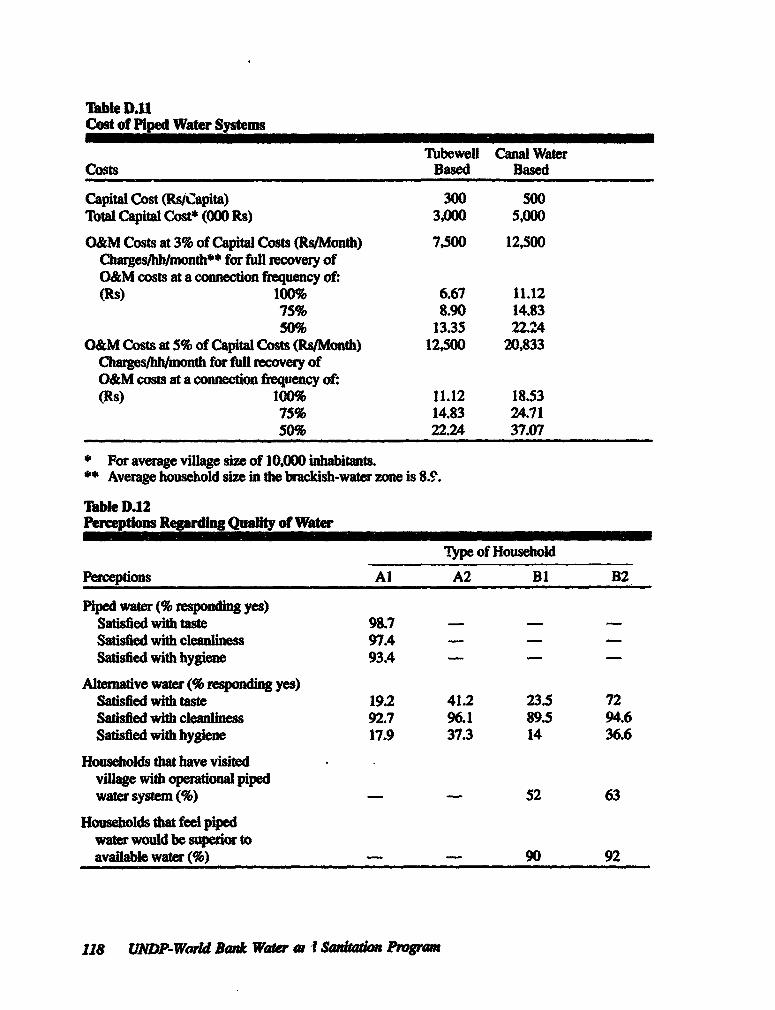
Table D.iCost of Piped Water Systems
Tubeweli Canal WaterConts Based Based
Capital Cost (RsA/apita) 300 S0Total Capit Cost* (000 Rs) 3,000 5,000
O&M Costs at 3% of Capital Costs (Rs/Month) 7,500 12,500Chargeshh/month** for full recovety ofO&M costs at a connection frequency of:(Rs) 100% 6.67 11.12
75% 8.90 14.8350% 13.35 22.24
O&M Costs at 5% of Capital Costs (Rs/Month) 12,500 20,833Charges/hh/Anonth for full recovery ofO&M costs at a connection frequency of:(Rs) 100% 11.12 18.53
75% 14.83 24.7150% 22.24 37.07
*For average village size of 10,000 inhabitts.** Average household size in the brackish-water zone is 8.9.
Table D.12Perceptions Reprding Qualt of Water
Ty_pe of Houshold
Perceptions Al A2 B1 B2
Piped water (% responding yes)Satisfied with taste 98.7 - - -
Satisfied with cleanliness 97.4Satisfied with hygiene 93A - - -
Alternative water (% respoi yes)Satisfied with taste 19.2 41.2 23.5 72Satisfied with cleanliness 92.7 96.1 89.5 94.6Satisfied with hygiene 17.9 37.3 14 36.6
Households that have visitedvillage with opeational pipedwater system (%) - 52 63
Households that feel pipedwater would be superior toavailable water (%) - 90 92
118 UNDP-Wmid Ban Water a, I Saao Progaan
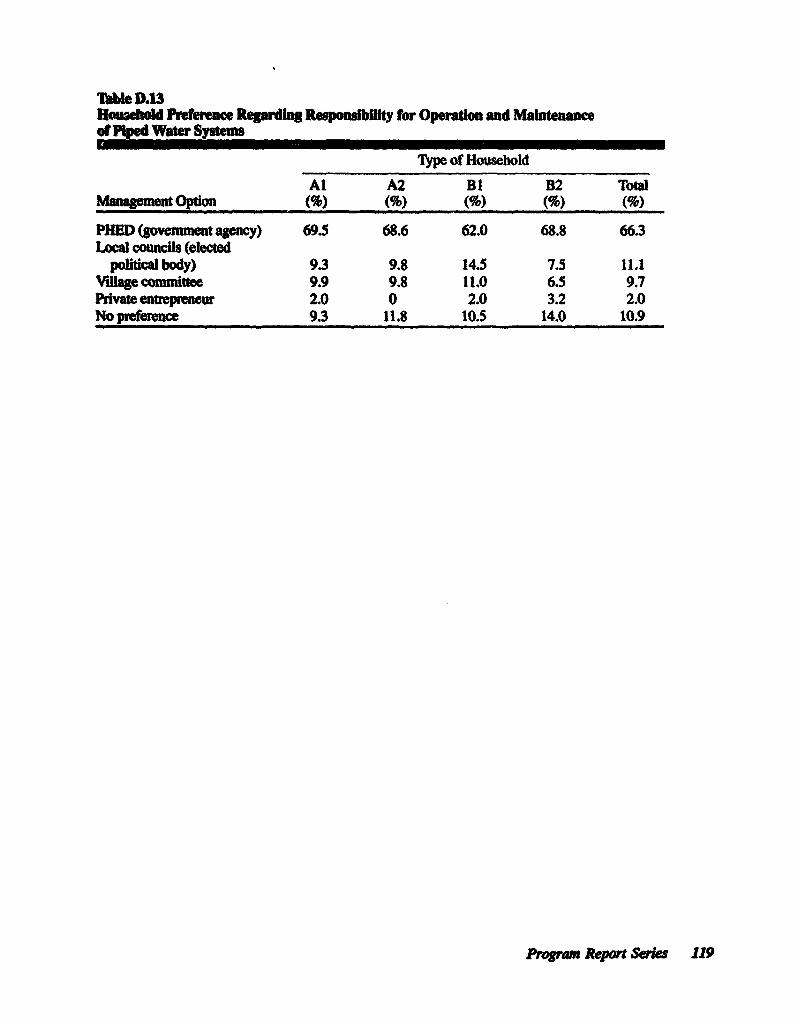
Tble D.13Household P erene Regading ResponibUily for Operation and Maintenanceof P Water System
Type of Household
Al A2 BI B2 TbtalMag.e Opt.on (%) (%)( (%) (%)
PHED (govenment agency) 69.5 68.6 62.0 68.8 66.3Lca councils (elected
political body) 9.3 9.8 14.5 7.5 11.1Vilagemnuttee 9.9 9.8 11.0 6.5 9.7Private entreneur 2.0 0 2.0 3.2 2.0No pefce 9.3 11.8 10.5 14.0 10.9
Program Report Serla 119
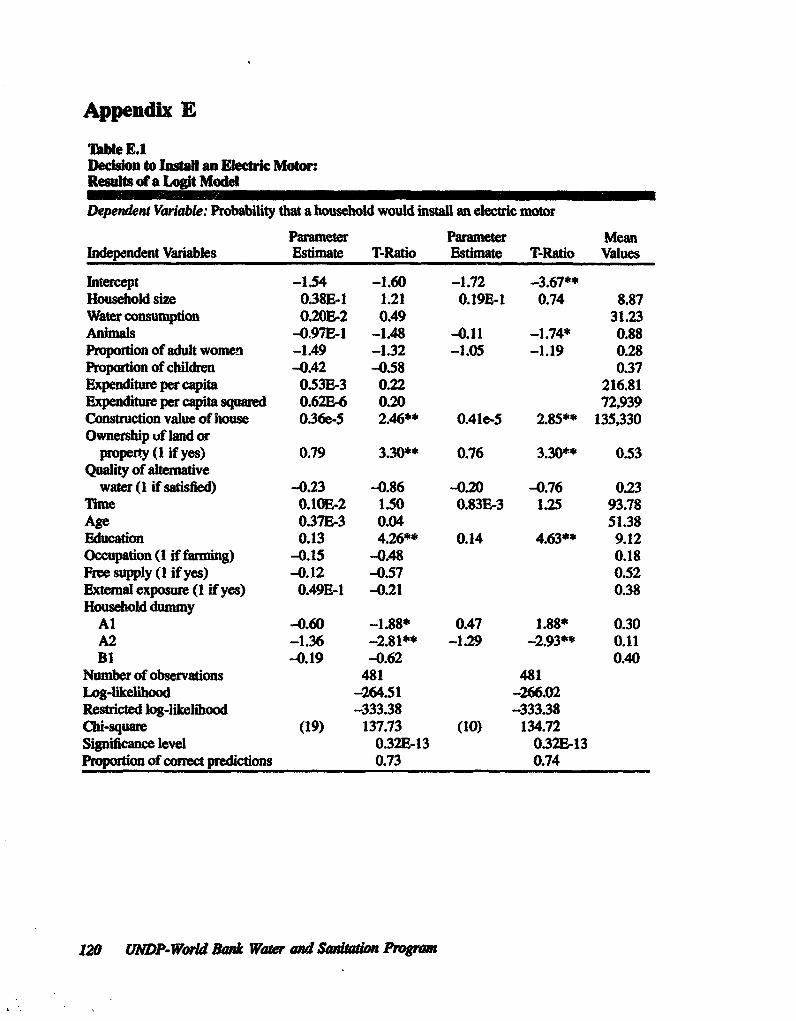
Appendix E
Table LlDecsion to Install an Electric Motor:Results of a Lgit Model
Dependent Variable: Probabiity that a household would instai an electic motor
Paramete Parameter MeanIndependent Vaiables Estimate T-Ratio Estimate T-Ratio Values
Intercept -1.54 -1.60 -1.72 -3.67**Household size 0.38E-1 1.21 0.19E-1 0.74 8.87Water consumption 0.20E2 0.49 31.23Animals -0.97E-1 -1.48 -0.11 -1.74* 0.88Proportion of adult women -1.49 -1.32 -1.05 -1.19 0.28Proportion of children -0.42 -0.58 0.37Expenditure per capita 0.53E-3 0.22 216.81Expenditure per capita squared 0.62E6 0.20 72,939Construction vaue of house 0.36e-5 2.46** 0.41e-S 2.85** 135,330Ownenhip uf land or
property (1 if yes) 0.79 3.30** 0.76 3.30** 0.53Quaity of altenative
water (1 if satisfied) -0.23 -0.86 -0.20 -0.76 0.23Time 0.10E-2 1.50 0.83E-3 1.25 93.78Age 0.37E-3 0.04 51.38Education 0.13 4.26** 0.14 4.63** 9.12Occupation (1 if farming) -0.15 -0.48 0.18Free supply (I if yes) -0.12 -0.57 0.52Extemal expose (1 if yes) 0.49E-1 -0.21 0.38Household dummy
Al -0.60 -1.88* 0.47 1.88* 0.30A2 -1.36 -2.81** -1.29 -2.93** 0.11B1 -0.19 -0.62 0.40
Number of observaions 481 481Log-lielihood -264.51 -266.02Restricted log-likelihood -333.38 -333.38Chi-square (19) 137.73 (10) 134.72Significance level 0.32E-13 0.32E-13Proportion of correct predictions 0.73 0.74
120 UNDP-World ank Water and Santadon Program
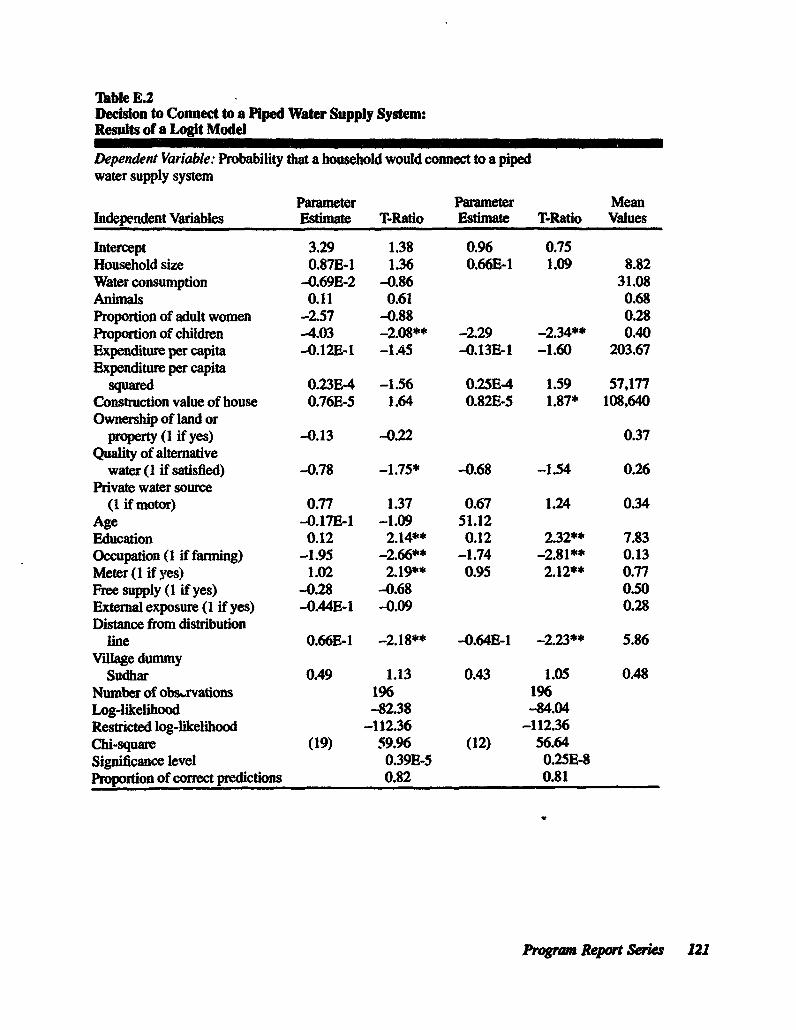
Table E.2Decsion to Connect to a Piped Water Supply System:Results of a Logit Model
Dependent Variable: Probability that a household would connect to a pipedwater supply system
Parameter Parameter MeanIndependent Variables Estimte T-Ratio Estimate T-Ratio Values
Intercept 3.29 1.38 0.96 0.75Household size 0.87E-1 1.36 0.66E-1 1.09 8.82Water consumption -0.69E-2 -0.86 31.08Animals 0.11 0.61 0.68Proportion of adult women -2.57 -0.88 0.28Proportion of children -4.03 -2.08** -2.29 -2.34** 0.40Expenditure per capita -0.12E-1 -1.45 -0.13E-1 -1.60 203.67Expenditure per capita
squared 0.23E4 -1.56 0.25E-4 1.59 57,177Construction value of house 0.76E-5 1.64 0.82E-5 1.87* 108,640Ownership of land or
property (I if yes) -0.13 -0.22 0.37Quality of altrative
water (1 if satisfied) -0.78 -1.75* -0.68 -1.54 0.26P.rivate water source
(1 if motor) 0.77 1.37 0.67 1.24 0.34Age -0.17E-1 -1.09 51.12Education 0.12 2.14** 0.12 2.32** 7.83Occupation (1 if farming) -1.95 -2.66** -1.74 -2.81** 0.13Meter (1 if yes) 1.02 2.19** 0.95 2.12** 0.77Free supply (I if yes) -0.28 -0.68 0.50Extenal exposure (1 if yes) -0.44E&1 -0.09 0.28Distance from distribution
line 0.66E-1 -2.18** -0.64E-1 -2.23** 5.86Village dummy
Sudhar 0.49 1.13 0.43 1.05 0.48Number of obs.rvations 196 196Log-likelihood -82.38 -84.04Restricted log-likelihood -112.36 -112.36Chi-square (19) 59.96 (12) 56.64Significance level 0.39E-5 0.25E-8Proportion of correct predictions 0.82 0.81
Program Repo"t Sei 121
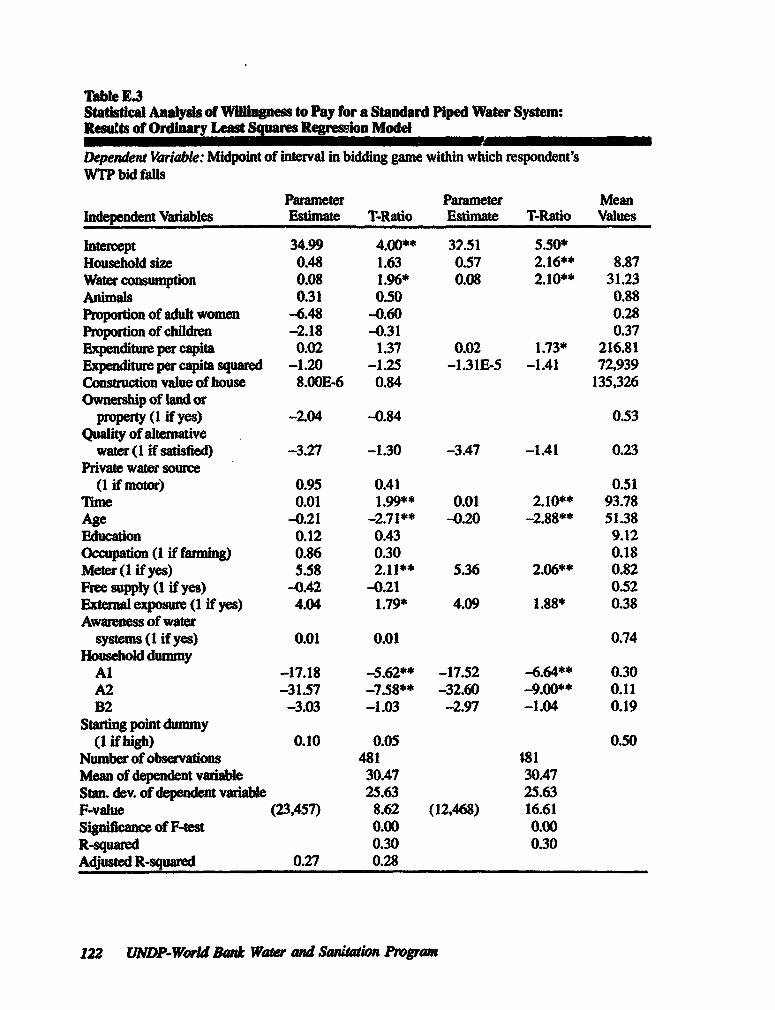
Table E3Satistcal Analysis of Willi to Pay for a Standard Piped Water System:Results of Ordinary Least Squares Reression Model
Dependent Variable: Midpoint of interval in bidding game within which respondent'sWTP bid falls
Parameter Paraneter MeanIndependent Variables Estimate T-Ratio Estimate T-Ratio Values
Intrcept 34.99 4.00** 32.51 5.50*Household size 0.48 1.63 0.57 2.16** 8.87Water consmption 0.08 1.96* 0.08 2.10** 31.23Animals 0.31 0.50 0.88Proportion of adult women -6.48 -0.60 0.28Proportion of children -2.18 -0.31 0.37Expendture per capita 0.02 1.37 0.02 1.73* 216.81Expentue per capita squared -1.20 -1.25 -1.31E-5 -1.41 72,939Construction value of house 8.00E-6 0.84 135,326Owneship of land or
property ( if yes) -2.04 -0.84 0.53Quality of alteatve
water (1 if satisfied) -3.27 -1.30 -3.47 -1.41 0.23Private water source
(1 if motor) 0.95 0.41 0.51Tie 0.01 1.99** 0.01 2.10** 93.78Age -0.21 -2.71** -0.20 -2.88** 51.38Education 0.12 0.43 9.12Occupation (1 if faming) 0.86 0.30 0.18Meter (1 if yes) 5.58 2.11** 5.36 2.06** 0.82Free supply (1 if yes) -0.42 -0.21 0.52Extrnal exposue (1 if yes) 4.04 1.79* 4.09 1.88* 0.38Awareness of water
systems (1 if yes) 0.01 0.01 0.74Household dununy
Al -17.18 -5.62** -17.52 -6.64** 0.30A2 -31.57 -7.58** -32.60 -9.00** 0.11B2 -3.03 -1.03 -2.97 -1.04 0.19
Staring point dummy(1 if high) 0.10 0.05 0.50
Number of observations 481 181Mean of dependent variable 30.47 30.47Stan. dev. of dependen variable 25.63 25.63F-value (23,457) 8.62 (12,468) 16.61Significance of F-test 0.00 0.00R-squared 0.30 0.30Adjusted R-squared 0.27 0.28
122 UNDP-World BRan Water and Sntatimn Progrom
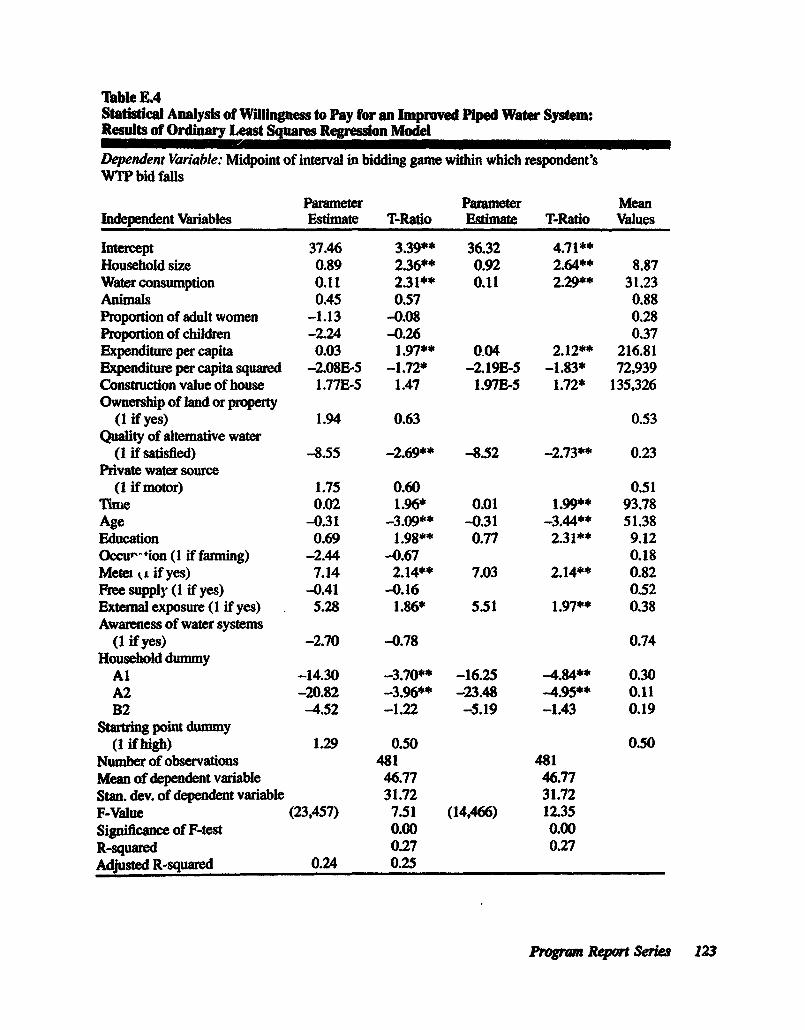
Table L4Statistical Analysis of WliUngpess to Pay for an Improved Piped Water System:Results of Ordinr Least Squares Regrsson Model
Dependent Variable: Midpoint of interval in bidding game within which respondent'sWTP bid fals
Paameter Parameter MeanIndependent Variables Estdmate T-Ratio Estimate T-Ratio Values
Intercept 37.46 3.39** 36.32 4.71**Household size 0.89 2.36** 0.92 2.64** 8.87Water consumption 0.11 2.31** 0.11 2.29** 31.23Animas 0.45 0.57 0.88Proportion of adult women -1.13 -0.08 0.28Proportion of children -2.24 -0.26 0.37Expenditure per capita 0.03 1.97** 004 2.12** 216.81Expenditure per capita squared -2.08E-5 -1.72* -2.19B-5 -1.83* 72,939Construction value of house 1.77E-5 1.47 1.97E-5 1.72* 135,326Ownership of land or property
(1 if yes) 1.94 0.63 0.53Quality of altemative water
(1 if satisfied) -8.55 -2.69** -8.52 -2.73** 0.23Private water source
(1 if motor) 1.75 0.60 0.51Tmie 0.02 1.96* 0.01 1.99** 93.78Age -0.31 -3.09** -0.31 -3.44** 51.38Education 0.69 1.98** 0.77 2.31** 9.12Occu- -ion (I if farming) -2.44 -0.67 0.18Metei kt if yes) 7.14 2.14** 7.03 2.14** 0.82Free supply (1 if yes) -0.41 -0.16 0.52External exposure (1 if yes) 5.28 1.86* 5.51 1.97** 0.38Awareness of water systems
(1 if yes) -2.70 -0.78 0.74Household dummy
Al -14.30 -3.70** -16.25 -4.84** 0.30A2 -20.82 -3.96** -23.48 4.95** 0.11B2 -4.52 -1.22 -5.19 -1.43 0.19
Staruring point dumy(1 if high) 1.29 0.50 0.50
Number of observations 481 481Mean of dependent variable 46.77 46.77Stan. dev. of dependent variable 31.72 31.72F-Value (23,457) 7.51 (14,466) 12.35Significance of F-test 0.00 0.00R-squared 0.27 0.27Adjused R-squared 0.24 0.25
Prgram Report er:es 123
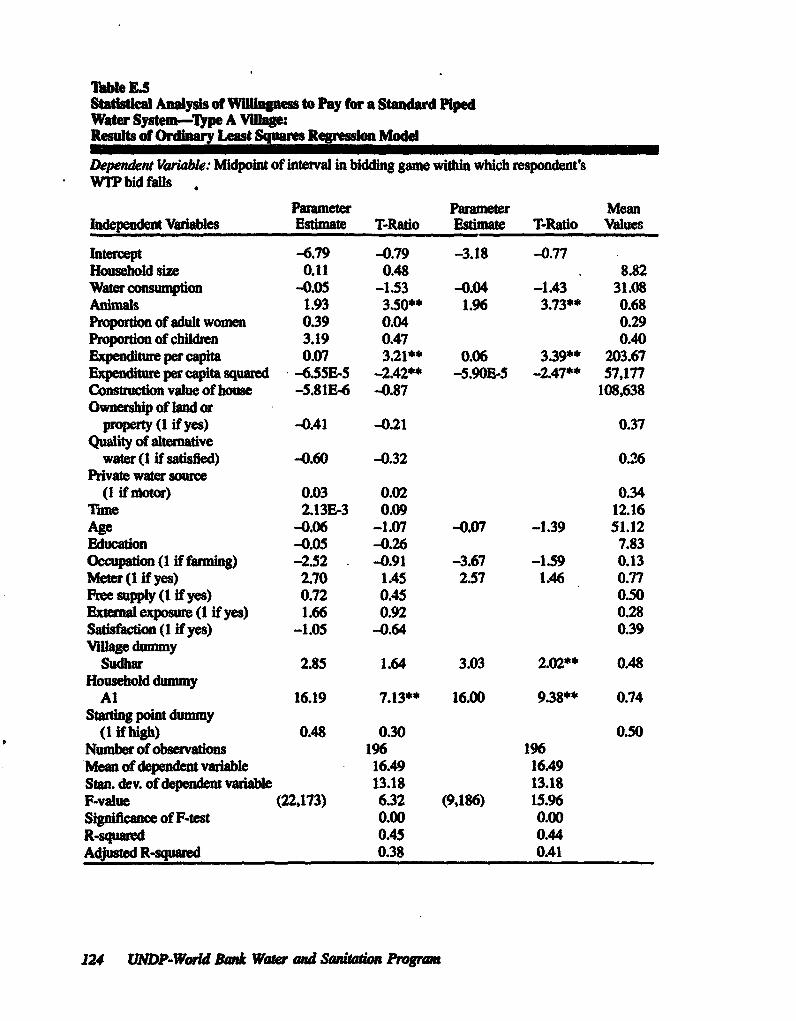
Tlble E.5Stadstial Analysis of Willnness to Pay for a Standard PipedWater System-Type A Vilage:Resultsof Ordinary Least Squares n Modd
Dependent Variable: Midpoint of interval in bidding game within which respondent'sWTP bid falls .
Parameter Paameter MeanIndpendet Variables Estimate T-Ratlio Estimate T-Ratio Values
Intercept -6.79 -0.79 -3.18 -0.77Household size 0.11 0.48 . 8.82Water consumption -0.05 -1.53 -0.04 -1.43 31.08Animals 1.93 3.50** 1.96 3*73** 0.68Proporion of adult women 0.39 0.04 0.29Propordon of children 3.19 0.47 0.40Expenditure per capita 0.07 3.21** 0.06 3.39** 203.67Expenditure per cata squared -6.55E,5 -2.42** -5.90E-5 -2.47** 57,177Consuvion value of house -5.811E-6 -0.87 108,638Ownership of land or
property (I if yes) -0.41 -0.21 0.37Quality of alernadve
water (I if satisfied) -0.60 -0.32 0.26Private water source
(1 if iflot) 0.03 0.02 0.34Time 2.13E-3 0.09 12.16Age -0.06 -1.07 -0.07 -1.39 51.12Education -0.05 -0.26 7.83Occupation (1 if fanring) -2.52 -0.91 -3.67 -1.59 0.13Meter (1 f yes) 2.70 1.45 2.57 1.46 0.77Free supply (I if yes) 0.72 0.45 0.50Fxtenld exposwue (1 if yes) 1.66 0.92 0.28Sabtsfaction (1 if yes) -1.05 -0.64 0.39Village dummy
Sudhar 2.85 1.64 3.03 2.02** 0.48Household dummy
Al 16.19 7.13** 16.00 9.38** 0.74Stating poi dummy
(1 i high) 0.48 0.30 0.50Number of observations 196 196Mean of dependent varilde 16.49 16.49Stan. dev. of dependent variable 13.18 13.18F-vaIue (22,173) 6.32 (9,186) 15.96Significance of F-test 0.00 0.00R-squared 0.45 0.44Adjused R-squared 0.38 0.41
124 UNDP-Wrd Bank Water and Sanua Program
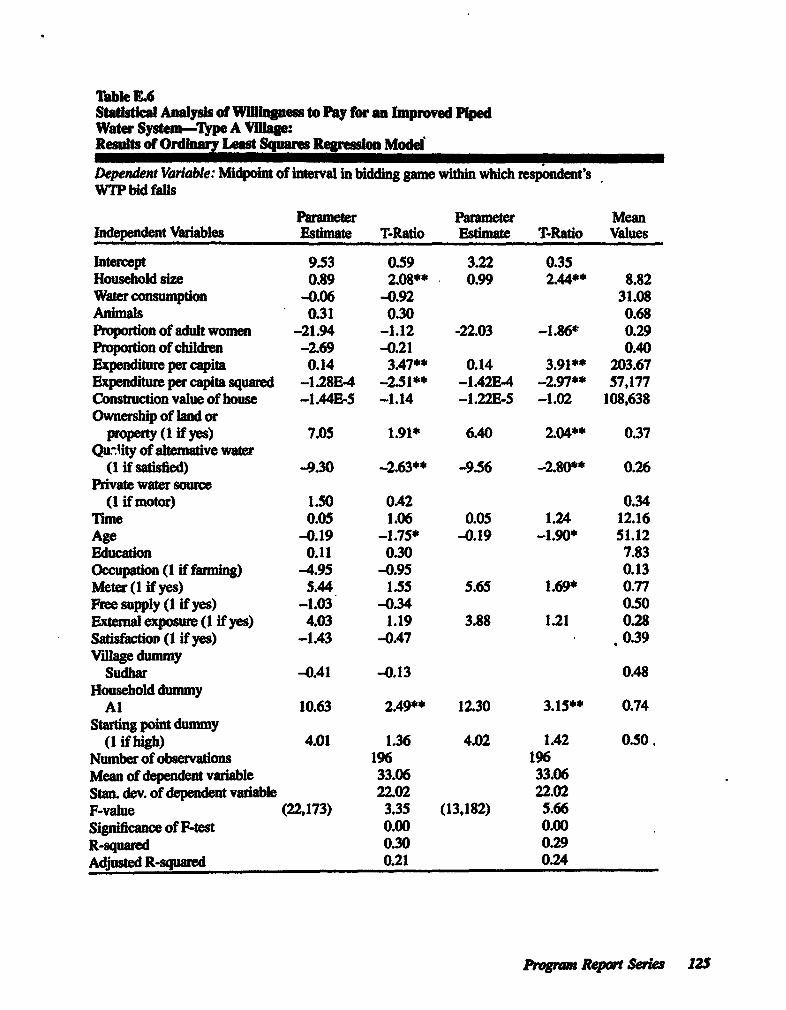
lTbl EA6Stastical Analysis of WilHUe to Pay for an Improved PipedWater Systen-Tlype A Viae:Reslts of Ordhinary Least Squame Regresio Modd
Dependent Variable: Midpoint of interval in bidding game within which respondent'sWTP bid fals
Parameter Parameter MeanIndependent Vaiables Estimate T-Ratio Estimate T-Ratio Values
ntrcept 9.53 0.59 3.22 0.35Household size 0.89 2.08** 0.99 2.44** 8.82Water consumption -0.06 -0.92 31.08Aninals 0.31 0.30 0.68Proporion of adult women -21.94 -1.12 -22.03 -1.86* 0.29Proportion of children -2.69 -0.21 0.40Expenditure per capita 0.14 3.47** 0.14 3.91** 203.67Expenditure per capita squared -1.28E-4 -2.51** -1.42E-4 -2.97** 57,177Construction value of house -1.44E-S -1.14 -1.22E-5 -1.02 108,638Ownership of land or
property (I if yes) 7.05 1.91* 6.40 2.04** 0.37Qt-.ty of alteiative water
(1 if satisfied) -9.30 -2.63** -9.56 -2.80** 0.26Private water source
(1 if motor) 1.50 0.42 0.34Thue 0.05 1.06 0.05 1.24 12.16Age -0.19 -1.75* -0.19 -1.90* 51.12Educaion 0.11 0.30 7.83Occupation (1 if farnning) -4.95 -0.95 0.13Meter (1 if yes) 5.44 1.55 5.65 1.69* 0.77Free supply (1 if yes) -1.03 -0.34 0.50Extmemal exposure (1 if yes) 4.03 1.19 3.88 1.21 0.28Satisfaction (1 if yes) -1.43 -0.47 0.39VRllage dummy
Sudhar -0.41 -0.13 0.48Household dummy
Al 10.63 2.49** 12.30 3.1S** 0.74Starting point dummy
(1 if high) 4.01 1.36 4.02 1.42 0.50.Number of observations 196 196Mean of dependent variable 33.06 33.06Stan. dev. of dpedent variable 22.02 22.02F-value (22,173) 3.35 (13,182) 5.66Significance of F-test 0.00 0.00R-squared 0.30 0.29Adjustd R-squared 0.21 0.24
Progn Repont Sries 125
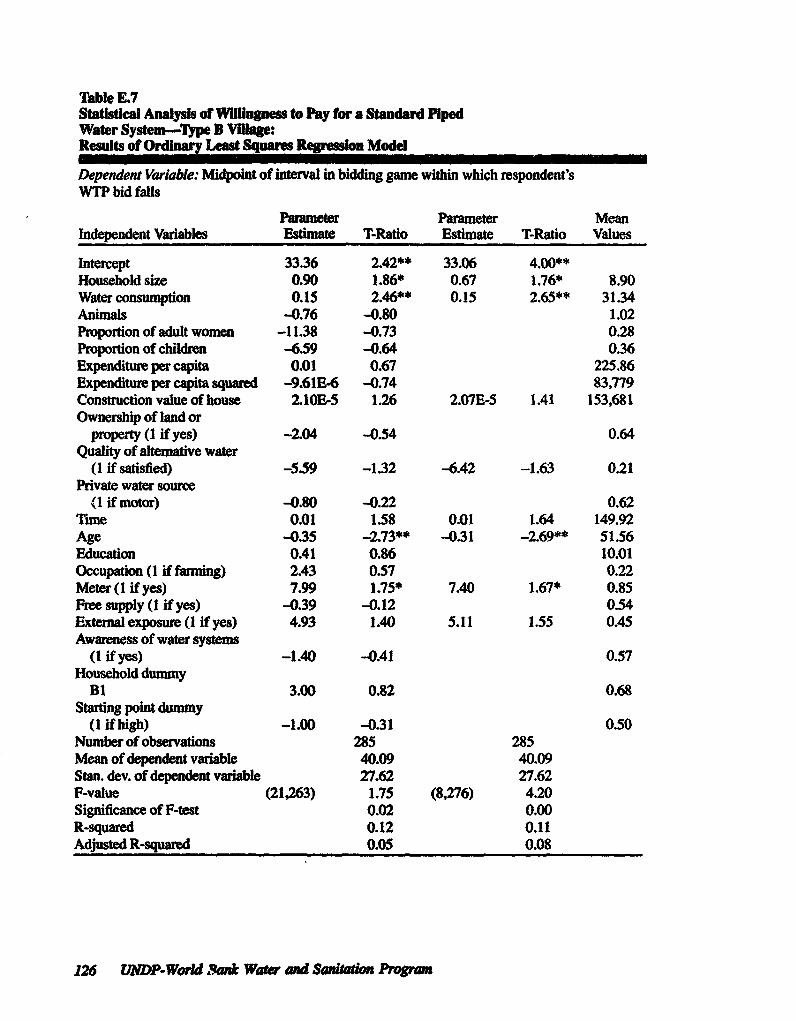
Table E7Statistical Analysp of Wilinpess to Pay for a Standard PipedWater System-Type B Village:Resilts of Ordary Lest Squares R Model
Dependent Variable: Midpoint of intrval in bidding game within which respondent'sWTP bid falls
Parameter Parameter MeanIndependent Vaiables Esdtmaf T-Ratio Estinate T-Ratio Values
Intercept 33.36 2.42** 33.06 4.00**Household size 0.90 1.86* 0.67 1.76* 8.90Water consumption 0.1S 2.46** 0.15 2.65** 31.34Animals -0.76 -0.80 1.02Proportion of adult women -11.38 -0.73 0.28Proportion of children -6.59 -0.64 0.36Expenditure per capita 0.01 0.67 225.86Expenditure per capita squared -9.61E-6 -0.74 83,779Construction value of house 2.10E-5 1.26 2.07E-5 1.41 153,681Ownership of land or
property (1 if yes) -2.04 -0.54 0.64Quality of alternative water
(1 if satisfied) -5.59 -1.32 -6.42 -1.63 0.21Private water source
(1 if motor) -0.80 -0.22 0.62Tume 0.01 1.58 0.01 1.64 149.92Age -0.35 -2.73** -0.31 -2.69** 51.56Education 0.41 0.86 10.01Occupation (1 if farming) 2.43 0.57 0.22meter (1 if yes) 7.99 1.75* 7.40 1.67* 0.85Free supply (1 if yes) -0.39 -0.12 0.54Extenal exposue (1 if yes) 4.93 1.40 5.11 1.55 0.45Awareness of water systems
(I ff yes) -1.40 -0.41 0.57Household dummy
BI 3.00 0.82 0.68Starting point dummy
(1 if high) -1.00 -0.31 0.50Number of observations 285 285Mean of dependent variable 40.09 40.09Stan. dev. of dependent variable 27.62 27.62F-value (21,263) 1.75 (8,276) 4.20Significance of F-test 0.02 0.00R-squared 0.12 0.11Adjusted R-squared 0.05 0.08
126 UNDP-Wordank Water and Santaton Program
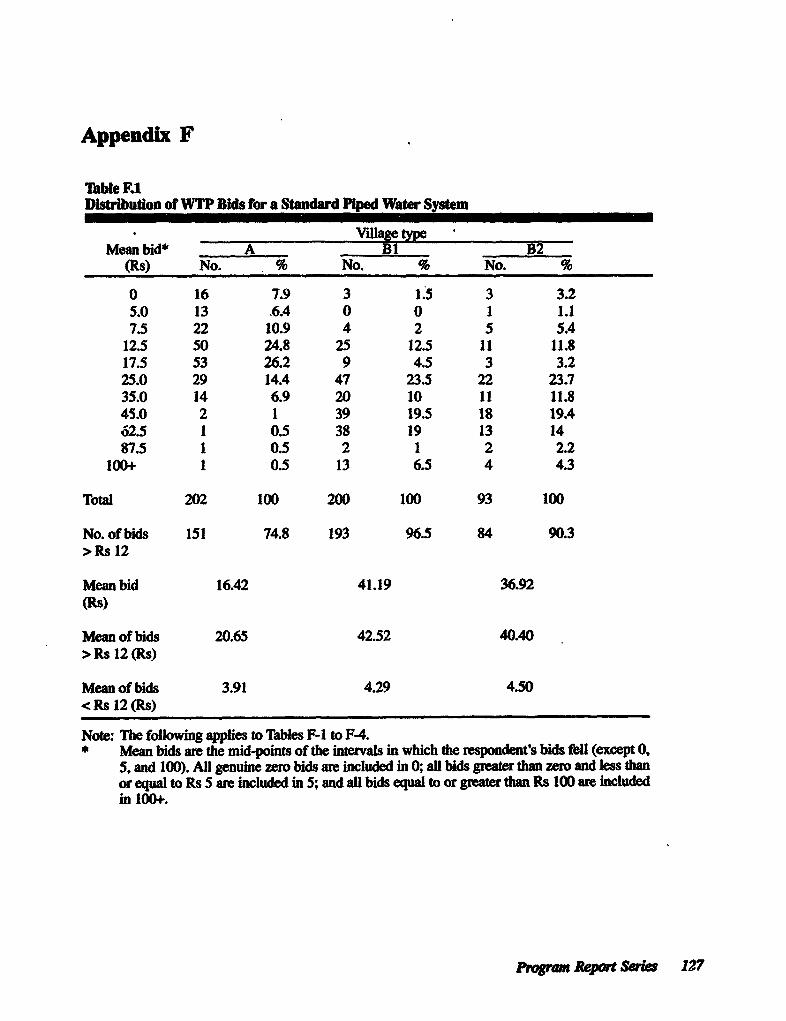
Appendix F
Ibble F.1Distibution of WTP Bids for a Standard Piped Water System
e Village ypeMean bid* A BI B2
(Rs) No. No. % No. %
0 16 7.9 3 1.5 3 3.25.0 13 .6.4 0 0 1 1.17.5 22 10.9 4 2 5 5.4
12.5 50 24.8 25 12.5 11 11.817.5 53 26.2 9 4.5 3 3.225.0 29 14.4 47 23.5 22 23.735.0 14 6.9 20 10 11 11.845.0 2 1 39 19.5 18 19.462.5 1 0.5 38 19 13 1487.5 1 0.5 2 1 2 2.2
100+ 1 0.5 13 6.5 4 4.3
Total 202 100 200 100 93 100
No. of bids 151 74.8 193 96.5 84 90.3> Rs 12
Mean bid 16.42 41.19 36.92(R)
Mean of bids 20.65 42.52 40.40> Rs 12 (Rs)
Mean of bids 3.91 4.29 4.50< Rs 12 (Rs)
Note: The following applies to Tables F-I to F-4.* Mean bids are the mid-points of the intervals in which the respondents bids fell (except 0,
5, and 100). All genuine zero bids are included in 0; all bids greater than zero and less thanor equal to Rs S are included in S; and all bids equal to or greater than Rs 100 are includedin 100+.
Program Report Scries 127
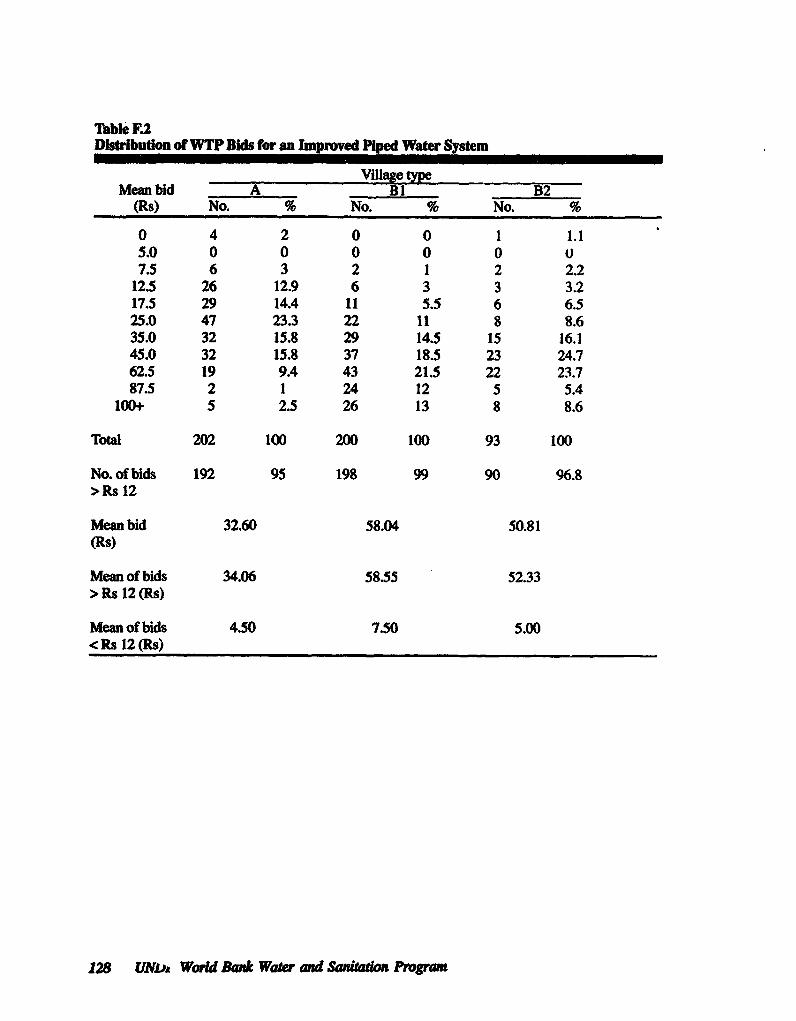
Tible F2Distibution of WTP Bids for an Inproved Piped Water System
Meanbid A Y Bl B2(Rs) No. % No. % No. 9
0 4 2 0 0 1 1.15.0 0 0 0 0 0 )7.5 6 3 2 1 2 2.2
12.5 26 12.9 6 3 3 3.217.5 29 14.4 11 5.5 6 6.525.0 47 23.3 22 11 8 8.635.0 32 15.8 29 14.5 15 16.145.0 32 15.8 37 18.5 23 24.762.5 19 9.4 43 21.5 22 23.787.5 2 1 24 12 5 5.4
100+ 5 2.5 26 13 8 8.6
Total 202 100 200 100 93 100
No. of bids 192 95 198 99 90 96.8>Rs 12
Mean bid 32.60 58.04 50.81(Rs)
Mean of bids 34.06 58.55 52.33> Rs 12 (Rs)
Mean of bids 4.50 7.50 5.00< Rs 12 (Rs)
128 LWDA Warld Bank Water and Sant Program
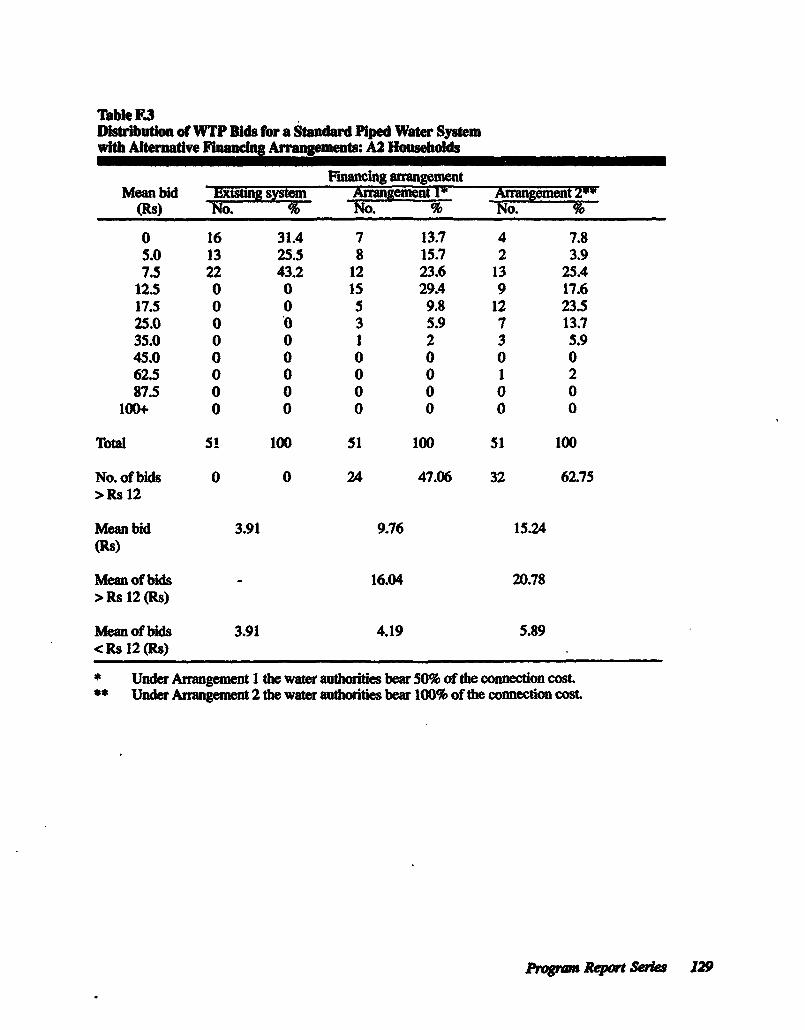
Table F3Dishibution of WTP Bids for a S ard Piped Water Systemwith Alternative Fnaning Arrang nts: A2 Households
Financing arangementMean bid ExlrraSnem a gement Nn= eingeent 2**
(Rs) No. % No. % No. %
0 16 31A 7 13.7 4 7.85.0 13 25.5 8 15.7 2 3.97.5 22 43.2 12 23.6 13 25A
12.5 0 0 15 29.4 9 17.617.5 0 0 5 9.8 12 23.525.0 0 0 3 5.9 7 13.735.0 0 0 1 2 3 5.945.0 0 0 0 0 0 062.5 0 0 0 0 1 287.5 0 0 0 0 0 0
100+ 0 0 0 0 0 0
Total 51 100 51 100 51 100
No. of bids 0 0 24 47.06 32 62.75> Rs 12
Mean bid 3.91 9.76 15.24(Ps)
Mean of bids - 16.04 20.78> Rs 12 (Rs)
Mean of bids 3.91 4.19 5.89< Rs 12 (Rs)
* Under Amgement 1 the water authorities bear 50% of the connection cost.F* Under Anangement 2 the wat authorities bear 100% of the connweion cost
program Report Sries 129
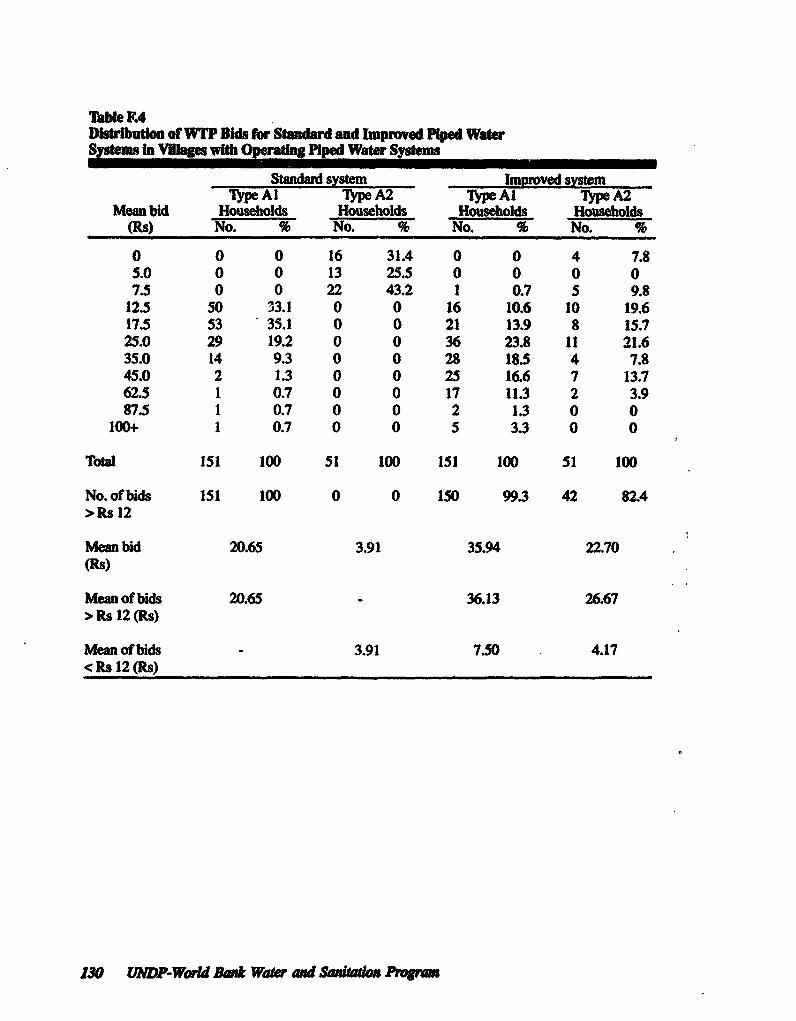
Table F4DIstrIbutlon of WTP Bids for Standard and Improved Piped WaterSystems Vig with Operatng Piped Water Systems
Standard system Improved systemlTpe A1 Tpe A2 lype Al lype A2
Mean bid Households Households Households Households(RS) No. % No. 9 -wNo. % No. %
0 0 0 16 31.4 0 0 4 7.85.0 0 0 13 255 0 0 0 07.5 0 0 22 43.2 1 0.7 5 9.8
12.5 50 33.1 0 0 16 10.6 10 19.617.5 53 35.1 0 0 21 13.9 8 15.725.0 29 19.2 0 0 36 23.8 11 21.635.0 14 9.3 0 0 28 18.5 4 7.845.0 2 1.3 0 0 25 16.6 7 13.762.5 1 0.7 0 0 17 11.3 2 3.987.5 1 0.7 0 0 2 1.3 0 0
100+ 1 0.7 0 0 5 3.3 0 0
Total 151 100 51 100 151 100 51 100
No. of bids 151 100 0 0 150 99.3 42 82.4>Rs 12
Mean bid 20.65 3.91 35.94 22.70R8i)
Mean of bids 20.65 - 36.13 26.67> Rs 12 (Ri)
Mean of bids - 3.91 7.50 4.17< Rs 12 (Rs)
130 UNDP-Word Ban Watr and Sad. NW=
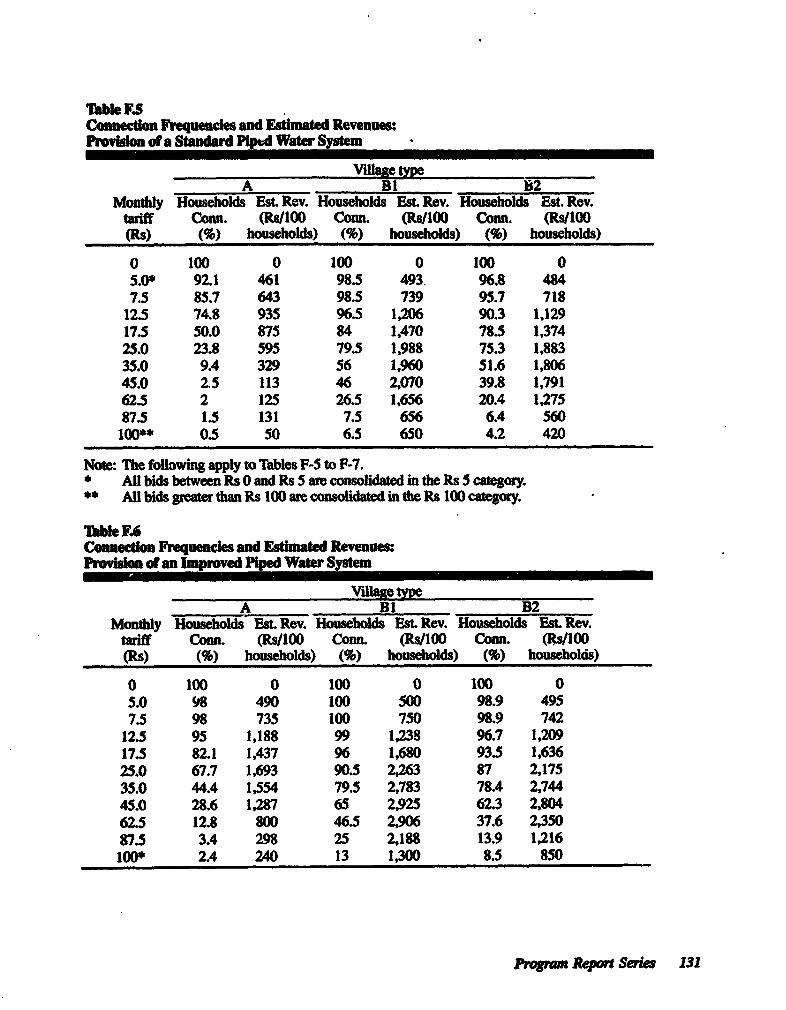
Tbble FSConnectio Frequenies and fEtimated Revenues:Proviion of a Standard Piped Water System
Yillame MyEA Bi b2
Monthly Households Est. Rev. Households Est. Rev. Households Est. Rev.tariff Corn. (Rs/lo Conn. (Rs/l1O CoM. (RsIlOO(Rs) (%) households) (%) households) (%) households)
0 100 0 100 0 100 05.0* 92.1 461 98.5 493. 96.8 4847.5 85.7 643 98.5 739 95.7 718
12.5 74.8 935 96.5 1,206 90.3 1,12917.5 50.0 875 84 1,470 78.5 1,37425.0 23.8 595 79.5 1,988 75.3 1,88335.0 9.4 329 56 1,960 51.6 1,80645.0 2.5 113 46 2,070 39.8 1,79162.5 2 125 26.5 1,656 20.4 1,27587.5 1.5 131 7.5 656 6.4 560100** 05 50 6.5 650 4.2 420
Note: The following awly to Tables F-S to F-7.* All bids between Rs 0 and Rs 5 are onsolidated in e Rs 5 category.** All bids greater than Rs 100 are conSlidated in the Rs 100 category.
be F6Connecto Frquendes and Estmated Revenues:provio of an Improved Pipe Wae system
Yiae typeA B1 B2
Monthly Households Est Rev. Houshols ESt. Rev. Households Es. Rev.tariff CoMn. (Rs/100 Conn. (Rs/l00 Con (RsI00(RS) (%) households) (%) households) (%) households)
0 100 0 100 0 100 05.0 98 490 100 500 98.9 4957.5 98 735 100 750 98.9 742
12.5 95 1,188 99 1,238 96.7 1,20917.5 82.1 1,437 96 1,680 93.5 1,63625.0 67.7 1,693 90.5 2,263 87 2,17535.0 44.4 1,554 79.5 2,783 78.4 2,74445.0 28.6 1,287 65 2,925 62.3 2,80462.5 12.8 800 46.5 2,906 37.6 2,35087.5 3.4 298 25 2,188 13.9 1,216lOD" 2.4 240 13 1,300 8.5 850
Proram Report Series 131
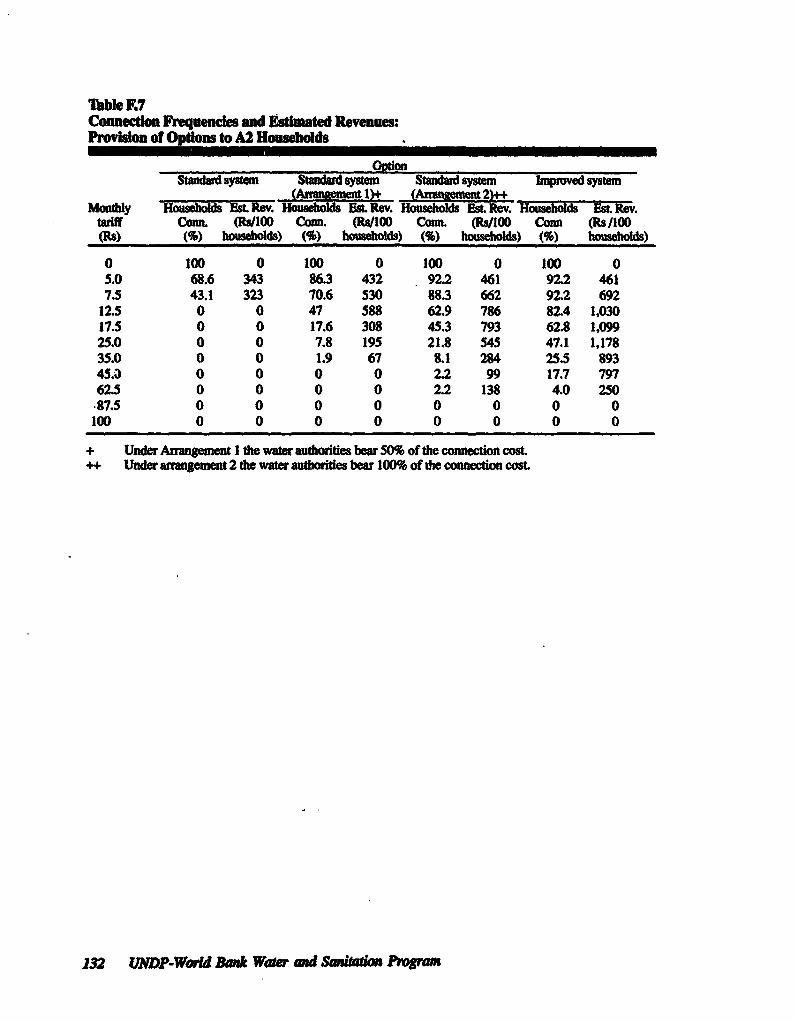
Table F.7Connecton Frequenies and Em d Revenues:Provson of Optons to A2 Housebolds
Standardssn Std sstem Sndardsystem bIproved system(^_Amet1) (ArrAnMen 2)4-
Monthly Households ESLRov. Households EsLtRev. Houselds BEstlRev. Househlds EtRev.tarff Coo (Rs/100 Cam (R/OO Coim. OR100 COMn (Rs/100(Rs) (%) househds) (%) housods) (%) household) (%) households)
0 100 0 100 0 100 0 100 05.0 68.6 343 86.3 432 92.2 461 92.2 4617.5 43.1 323 70.6 530 88.3 662 922 692
12.5 0 0 47 588 62.9 786 82.4 1,03017.5 0 0 17.6 308 45.3 793 62.8 1,09925.0 0 0 7.8 195 21.8 545 47.1 1,17835.0 0 0 1.9 67 8.1 284 25.5 8934S.3 0 0 0 0 2.2 99 17.7 79762.5 0 0 0 0 2.2 138 4.0 250.87.5 0 0 0 0 0 0 0 0100 0 0 0 0 0 0 0 0
+ Under Angeinent I the water autdoies bear 50% of the connection cost++ Under an=nWeent 2 the water asuthoities bear 100% of the connection cosL
132 UNDP-Wmd Ba* Water and S_wio P nram
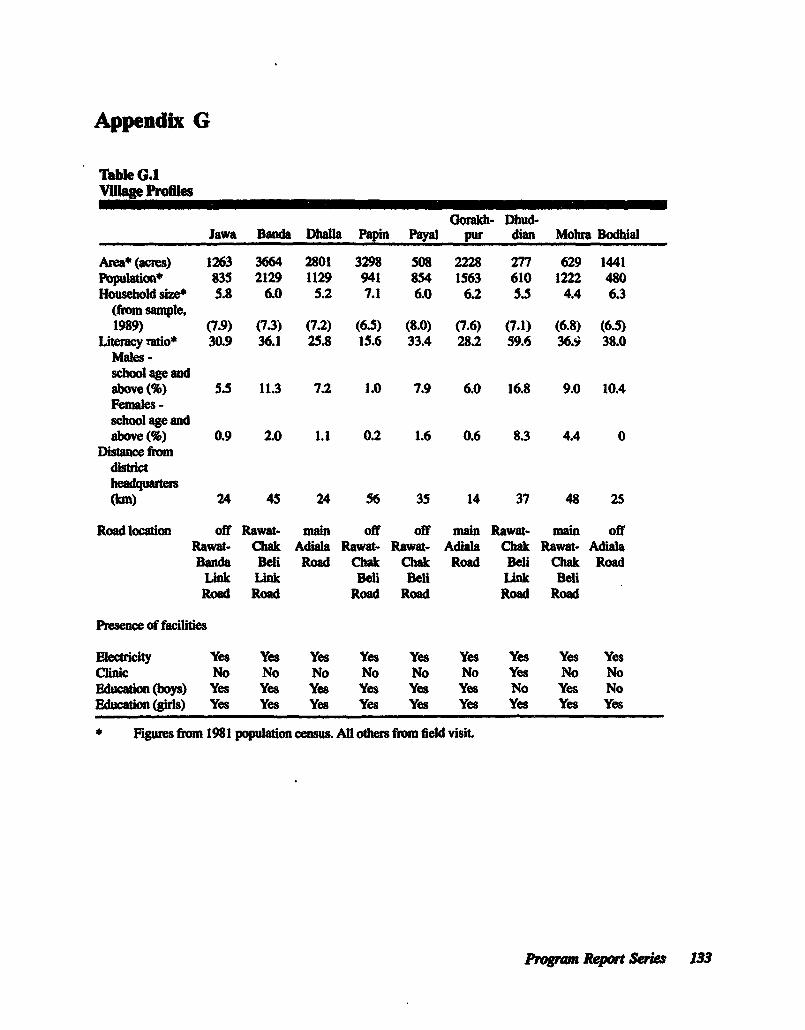
Appendx G
Table GA1lage Proles
Gorakh- Dlud-Jawa Banda Dhalla Papin Payal pur dian Moha Bodhial
Area* (acres) 1263 3664 2801 3298 508 2228 277 629 1441Population* 835 2129 1129 941 854 1563 610 1222 480Housdeold size 5.8 6.0 5.2 7.1 6.0 6.2 5.5 4.4 6.3
(from sample,1989) (7.9) (7.3) (7.2) (6.5) (8.0) (7.6) (7.1) (6.8) (6.5)
Litacy mtio 30.9 36.1 25.8 15.6 33.4 28.2 59.6 36.9 38.0Males -school age andabove (%) 5.5 11.3 7.2 1.0 7.9 6.0 16.8 9.0 10.4Females -school age andabove (%) 0.9 2.0 1.1 0.2 1.6 0.6 8.3 4.4 0
DisUac fromdistrict
(kcm) 24 45 24 56 35 14 37 48 25
Road locaior. off Rawat- main off off main Rawat- main offRawat- Chak Adiala Rawat- Rawat- Adiala Chak Rawat- AdialaBanda Beli Road Chak Chak Road Beli Chak RoadULnk Link Beli Bell Link BeliRoad Road Road Road Road Road
Presence of facilites
Electricity Yes Yes Yes Yes Yes Yes Yes Yes YesCJinic No No No No No No Yes No NoEducaion (boys) Yes Yes Yes Yes Yes Yes No Yes NoEducation (gids) Yes Yes Yes Yes Yes Yes Yes Yes Yes
* Figures from 1981 populaton census. Al others from field visit
Progrwn Repot eries 133
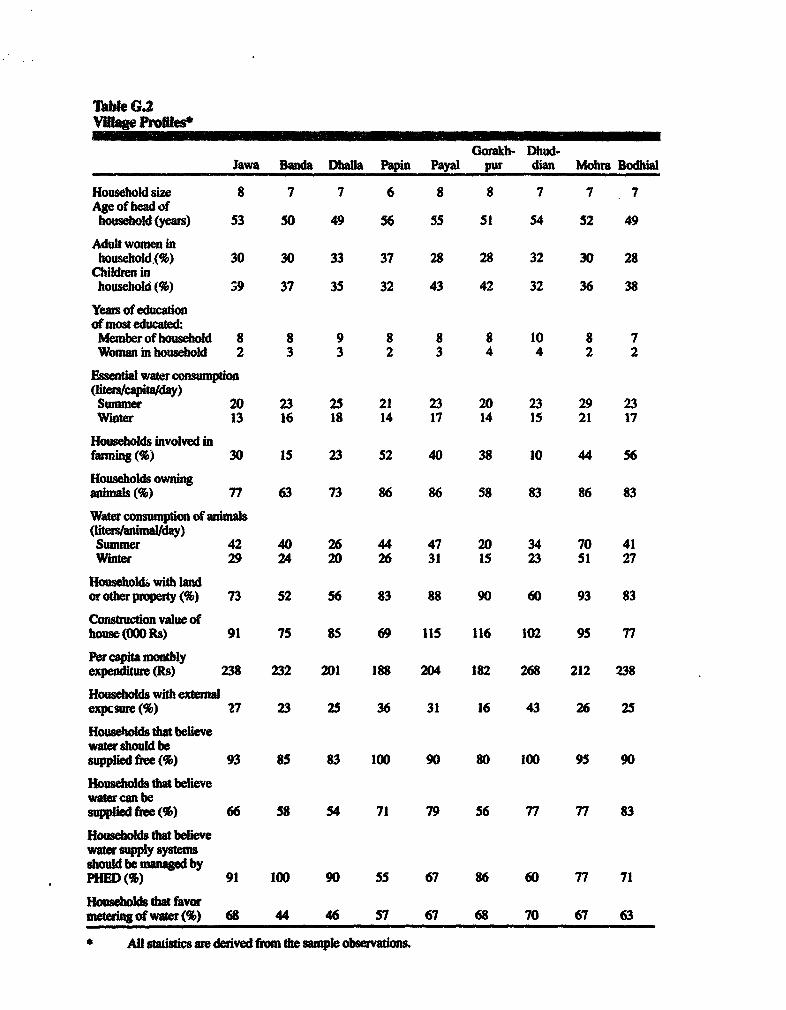
Thble G.2Village Profiles*
Gorakh- Dhud-Jaw Banda Dhaia Papin Paya pur dim Mohra Bodhia
Household size 8 7 7 6 8 8 7 7 7Age of head ofhousehOId(years) 53 50 49 56 55 51 54 52 49
Adldt womn inhousehold.(%) 30 30 33 37 28 28 32 30 28
Chldken inhousehold (%) 39 37 35 32 43 42 32 36 38
Years of educationof moSt educated:Memiberof houseold 8 8 9 8 8 8 10 8 7Womnan in household 2 3 3 2 3 4 4 2 2
Essential water consumionllitescapits/dar)
Sunmer 20 23 25 21 23 20 23 29 23Winter 13 16 18 14 17 14 15 21 17
Households involved infamiung (% 30 15 23 52 40 38 10 44 56
Households owninganinas (%) 77 63 73 86 86 58 83 86 83
Wate cosumption of animals(literslanimal/day)Summer 42 40 26 44 47 20 34 70 41winter 29 24 20 26 31 IS 23 51 27
Household. with landorotherpmperty (%) 73 52 56 83 88 90 60 93 83
Consotnction value Ofhouse(OOORs) 91 75 85 69 115 116 102 95 77
Per capita monthlyexpendi tre(Rs) 238 232 201 188 204 182 268 212 238
Househokls with extenalexpcswe (%) 27 23 25 36 31 16 43 26 25
Households that believewat should besupplied fiee (%) 93 85 83 100 90 80 100 95 90
Households that believewater can besupplied fie(%) 66 58 54 71 79 56 77 77 83
Houhobds tha believewater supply systemsdhould be managed byPHED (*) 91 100 90 55 67 86 60 77 71
Househols that favornumetingof waer(%) 68 44 46 57 67 68 70 67 63
* Al msm are derved from the sample- observaions
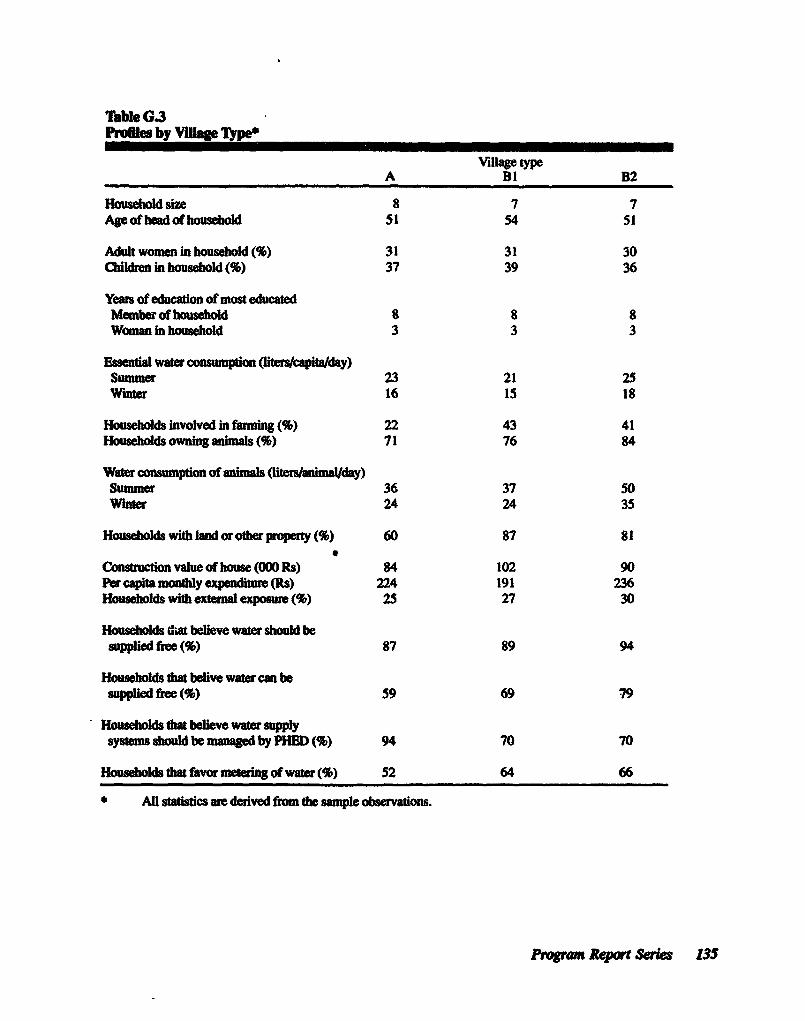
Table G3Profie by Villge lType
Village typeA BI B2
Houseold size 8 7 7Ageofheadofausehofd 51 54 51
Adult women in household (%) 31 31 30Cldldn in household (%) 37 39 36
Years of education of most educatedMember of household 8 8 8Woman in household 3 3 3
Essential water consumption (liters/apita/day)Summer 23 21 25WVter 16 15 18
Households involved i fing (%) 22 43 41Householdsowninganimals(%) 71 76 84
Water conumptin of snmals (literslanimal/day)Summer 36 37 50Witer 24 24 35
Households with land or other property (%) 60 87 81.
Contuctionvalueofhouse(OOORs) 84 102 90Per capita monthly expendie (Rs) 224 191 236Households with ext aexposure (%) 25 27 30
Households dia believe wae shuld besupplied free (%) 87 89 94
Households that belive waer can beapplied free (%) 59 69 79
Househods tat beleve water supplysyste shod be mangd by PHED) (V) 94 70 70
Householdstdatfavormeteringofwater(%) 52 64 66
* MA statstcs are derived from the sanmle observations.
Pwgram Report Series 135
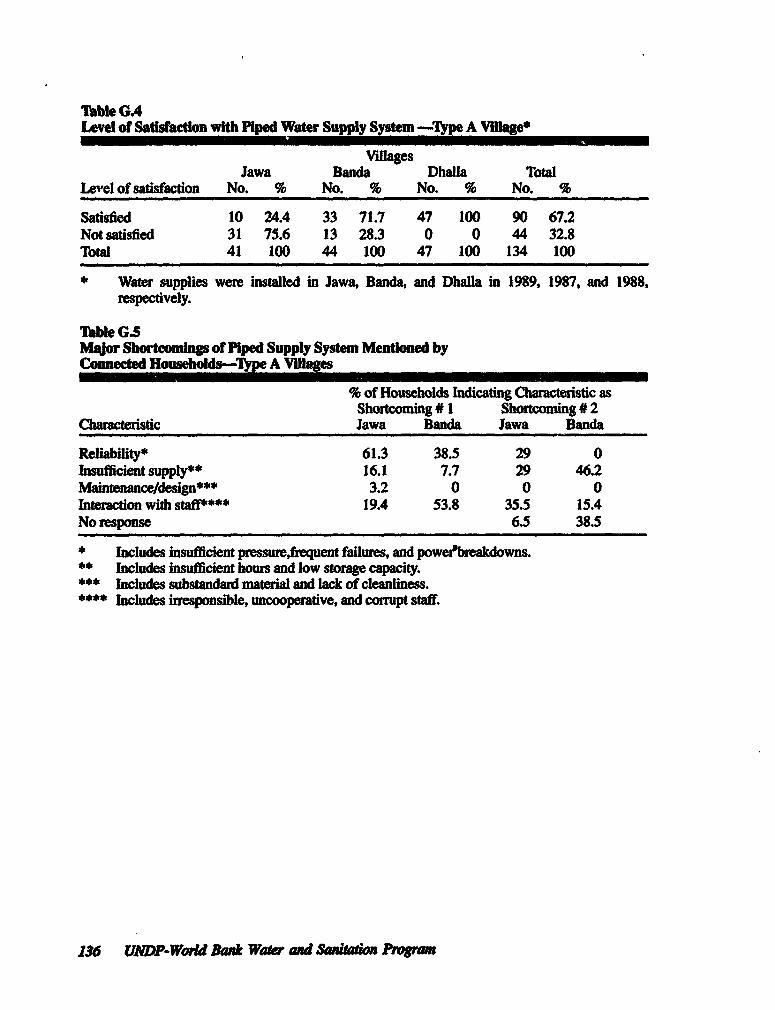
Table GALevel of Satisfaction with Piped Water Supply System -Tlpe A Village
VillagesJawa Banda Dhalla Total
Level of satisfaction No. % No. % No. % No. %
Satisfied 10 24.4 33 71.7 47 100 90 67.2Not satisfied 31 75.6 13 28.3 0 0 44 32.8Total 41 100 44 100 47 100 134 100
* Water supplies were installed in Jawa, Banda, and Dhalla in 1989, 1987, and 1988,respectively.
TIble G.5Major Shortcomis of Piped Supply System Mentioned byConnected Households-Type A VMflages
% of Households Indicating Chaateristic asShortcoming # 1 Shortcoming # 2
Characteristic Jawa Banda Jawa Banda
Rcliability* 61.3 38.5 29 0insufficient supply** 16.1 7.7 29 46.2M4aintenance/design*** 3.2 0 0 0Interaction with staff**** 19.4 53.8 35.5 15.4No response 6.5 38.5
* Includes insufficient pressure,frequent failures, and powet'breacdowns.** Includes insufficient hours and low storage capacity.
** Includes substandard material and lack of cleanliness.***' Includes hiesponsible, uncooperadve, and coffupt staff.
136 UNDP-World Bank Watr and Sanaton Pogmw
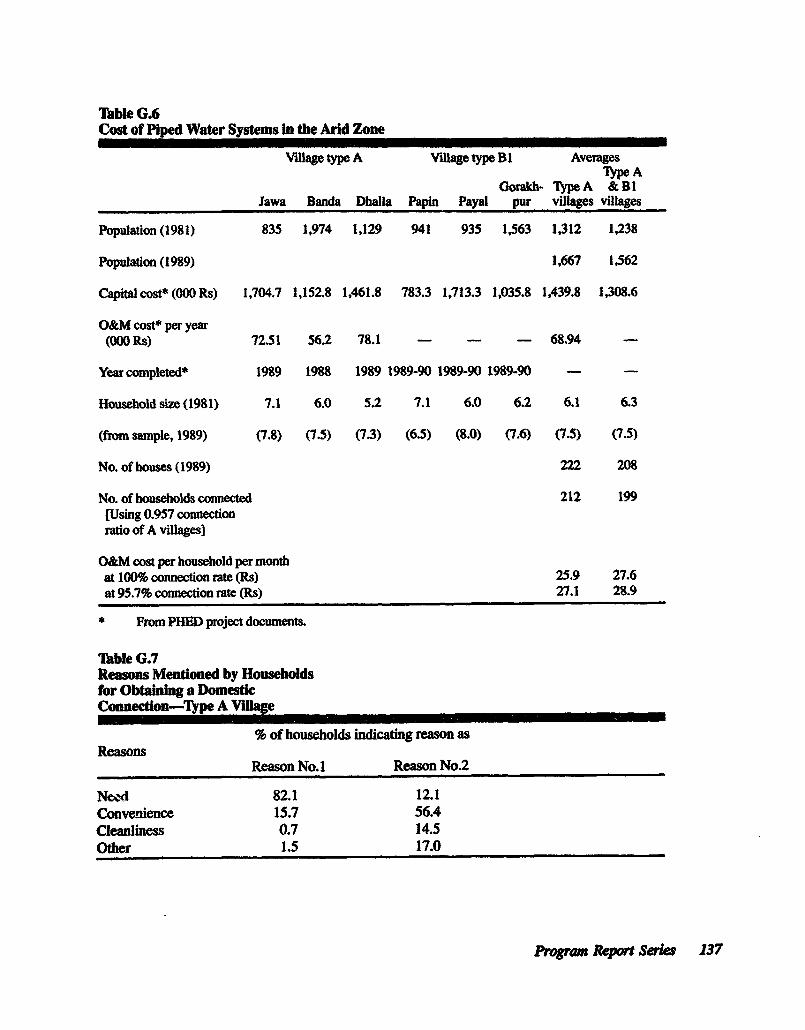
Table G.6Cost of Piped Water Systems In the Arid Zone
Village type A Village type BI Averagesrype A
Gorakh- TypeA &BIJawa Banda Dhalla Papin Payal pur villages villages
Population (1981) 835 1,974 1,129 941 935 1,563 1,312 1,238
Population (1989) 1,667 1,562
Capital cost* (000 Rs) 1,704.7 1,152.8 1,461.8 783.3 1,713.3 1,035.8 1,439.8 1,308.6
O&M cost* per year(000 Rs) 72.51 56.2 78.1 - - - 68.94 -
Year completed* 1989 1988 1989 1989-90 1989-90 1989-90 - -
Household size (1981) 7.1 6.0 5.2 7.1 6.0 6.2 6.1 6.3
(ftom sanple, 1989) (7.8) (7.5) (7.3) (6.5) (8.0) (7.6) (7.5) (7.5)
No. of houses (1989) 222 208
No. of households connected 212 199[Using 0.957 connectionraio of A villagesl
O&M cost per household per monthat 100% connection rate (Rs) 25.9 27.6at 95.7% connection rate (Rs) 27.1 28.9
* Frm PHED project documents.
TIble G.7Reasons Mentioned by Householdsfor Obtahning a DomesticConunecton-Type A Vilae
% of households indicating reason asReasons
Reason No.1 Reason No.2
Need 82.1 12.1Convenience 15.7 56.4Cleanliness 0.7 14.5Other 1.5 17.0
Program Report Series 137
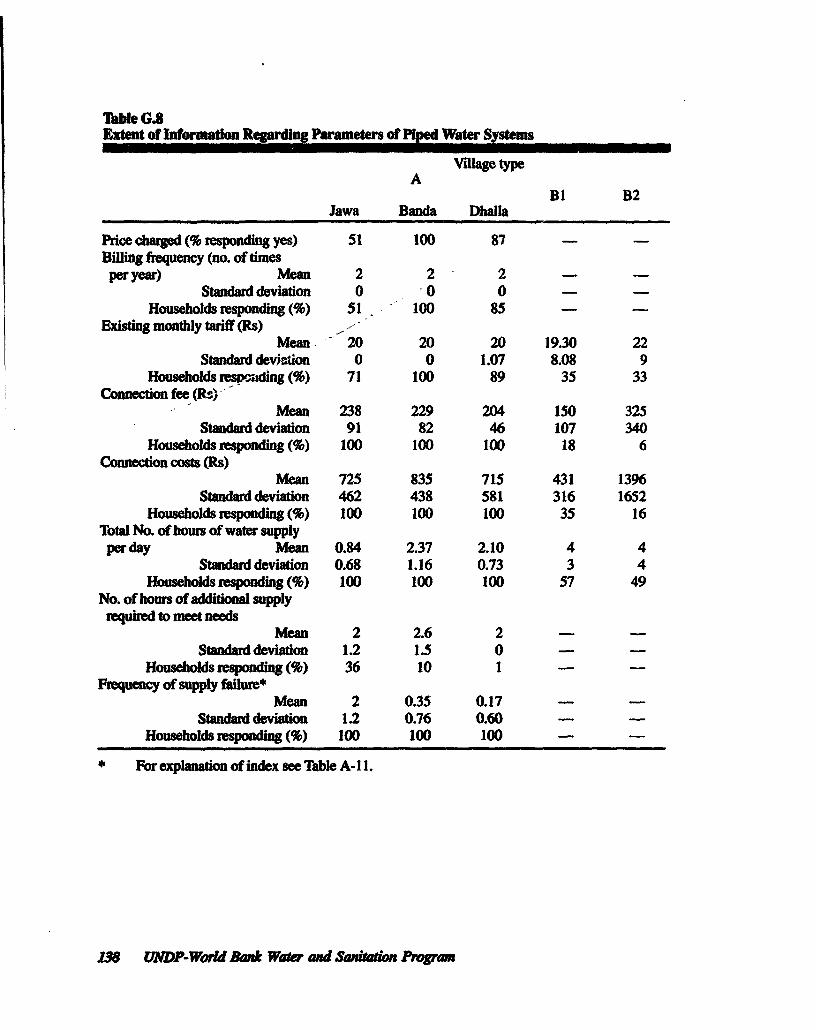
Table G.8Extent of Information Regarding Parameters of Piped Water Systems
Village typeA
Bi B2Jawa Banda Dhalla
Price chared (% responding yes) 51 100 87 - -Billing fequency (no. of timesper yar) Mean 2 2 2 - -
Standard deviation 0 0 0 - _Households responding(%) 51 100 85 - -
Pxisfing monthy tatiff (R.s) >Mean 20 20 20 19.30 22
Standard deviation 0 0 1.07 8.08 9Households respzding (%) 71 100 89 35 33
Connection fee (Rs)Mean 238 229 204 150 325
Standard deviation 91 82 46 107 340Households rsoding(%) 100 100 100 18 6
Connection costs Ots)Mean 725 835 715 431 1396
Standard deviation 462 438 581 316 1652Househols sponding (%) 100 100 100 35 16
Total No. of hous of water supplyperday Mean 0.84 2.37 2.10 4 4
Standard deviation 0.68 1.16 0.73 3 4Households responding (%) 100 100 100 57 49
No. of hours of addition supplyrequired to meet needs
Mean 2 2.6 2 - -Standard deviaion 1.2 1.5 0 - -
Househols responding(%) 36 10 1 - -Frequency of supply failwue*
M1ean 2 0.35 0.17 - -Standard deviaton 1.2 0.76 0.60 - -
Householdsespmpding(%) 100 100 100 - -
* For explanain of index see Table A-Il.
138 UNDP-World Ba* Water and Santatn Pmgr.n
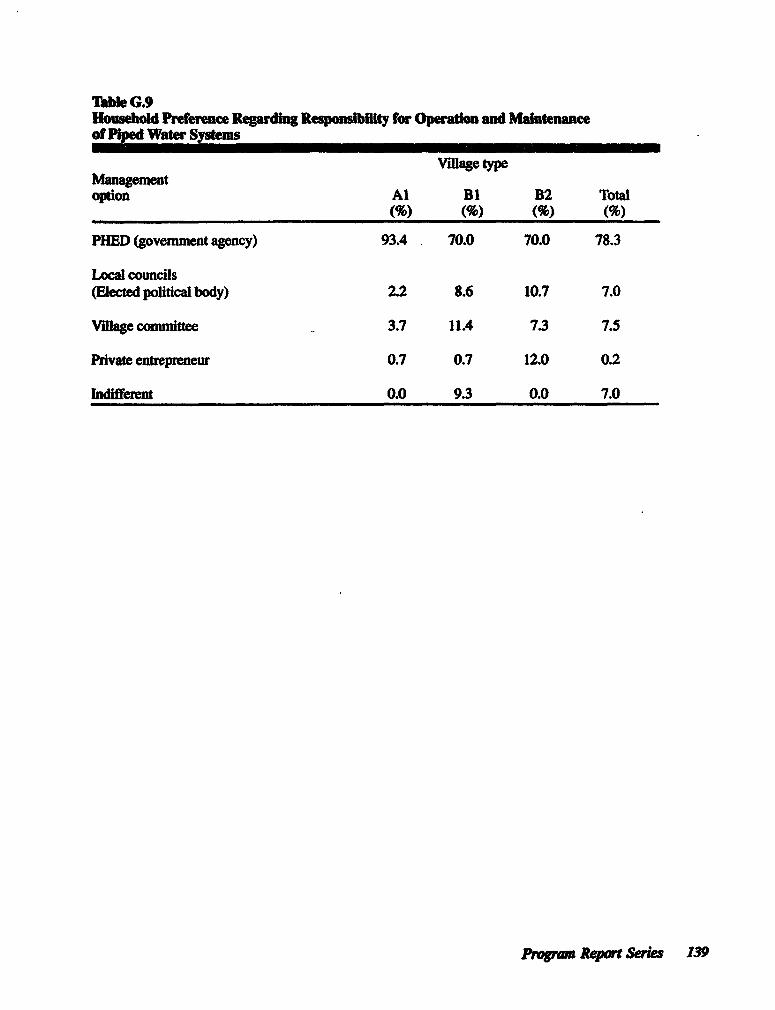
T3able G.Household Preference Rerdn Responsbility for Operation and Maintenanceof Piped Water Systms
Village typeManagementoption Al BI B2 Total
(%) (%) (%) (%)
PHED (govenment agency) 93.4 70.0 70.0 78.3
Local councils(Elected political body) 2.2 8.6 10.7 7.0
Village committee 3.7 11.4 7.3 7.5
Private entrepreneur 0.7 0.7 12.0 0.2
Indifferent 0.0 9.3 0.0 7.0
Proram Report Seres 139
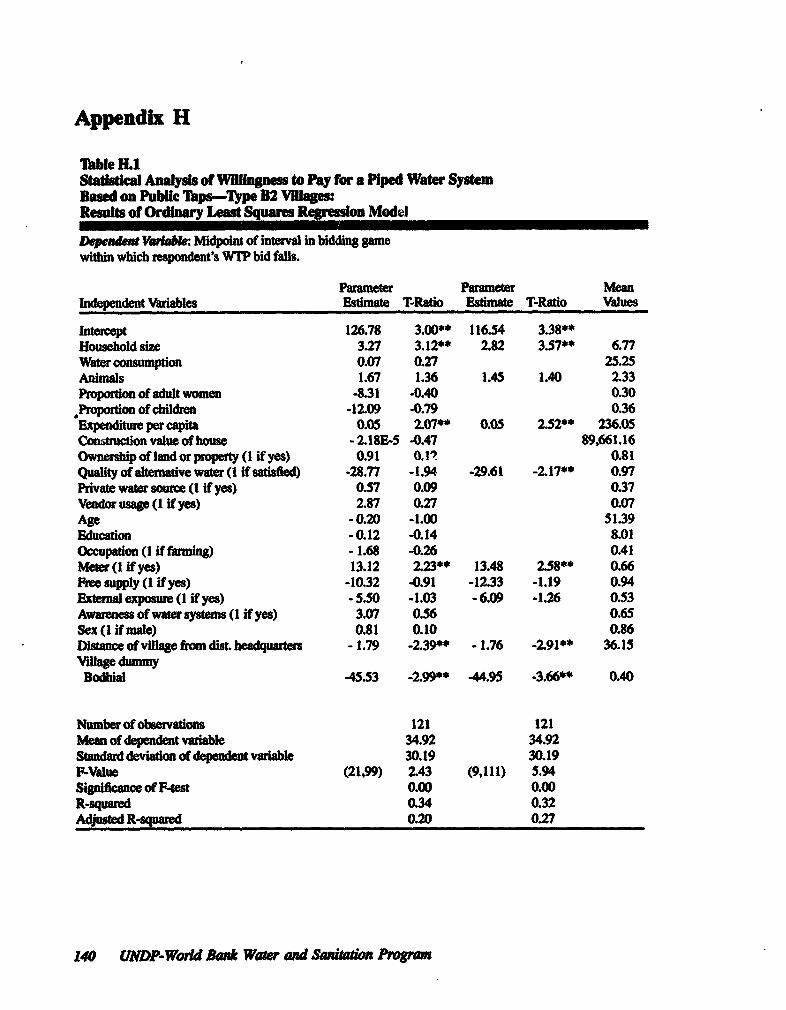
Appendix H
Tabe H.1Stadtstal Analyis of W hness to Pay for a Piped Water SystemBased on Publi Taps-Type B2 Vilges:Results of Ordinary Leas Squares Regresdon Model
Dendeet Veda: Mipont of inval in bidding gamewithin which respondent's W1P bid ls.
Parameter Parameter MeanIndepdent Varibles Estimate T-Ratio Estimate T-Ratio Values
Intercept 126.78 3.00** 116.54 3.38**Household size 3.27 3.12** 2.82 3.57** 6.77Water consumption 0.07 0.27 25.25Animals 1.67 1.36 1.45 1.40 2.33Proportion of adult women -8.31 -0.40 0.30Prpoztlon of children -12.09 -0.79 0.36Expenditre per capita 0.05 2.07** 0.05 2.52** 236.05Constuction value of house -2.18E-5 -0.47 89,661.16Ownership of land or propety (I f yes) 0.91 0.1? 0.81Quality of alterative water (1 if satisfied) -28.77 -1.94 -29.61 -2.17** 0.97Private water source (I if yes) 0.57 0.09 0.37Vendor usage (I if yes) 2.87 0.27 0.07Age -0.20 -1.00 51.39Educaion -0.12 -0.14 8.01Occupation (I if farming) - 1.68 -0.26 0.41Meter (1 if yes) 13.12 2.23** 13.48 2.58** 0.66Free supply (1 if yes) -10.32 -0.91 -12.33 -1.19 0.94Eternal exposue (I if yes) -5.50 -1.03 -6.09 -1.26 0.53Awareness of waersystems (1 if yes) 3.07 0.56 0.65Sex(I if male) 0.81 0.10 0.86Ditance of vilage from disL hedquats - 1.79 -2.39** -1.76 -2.91** 36.15Vlllage dummyBodhial 45.53 -2.99** -44.95 -3.66** 0.40
Number of observations 121 121Mean of dependent variable 34.92 34.92Standard deviation of depedent vaiable 30.19 30.19P-Value (21,99) 2.43 (9,111) 5.94Significance of F-test 0.00 0.00R-squared 0.34 0.32Adjused R-squared 0.20 0.27
140 UNDP-World Bank Water and SWatado PmV=
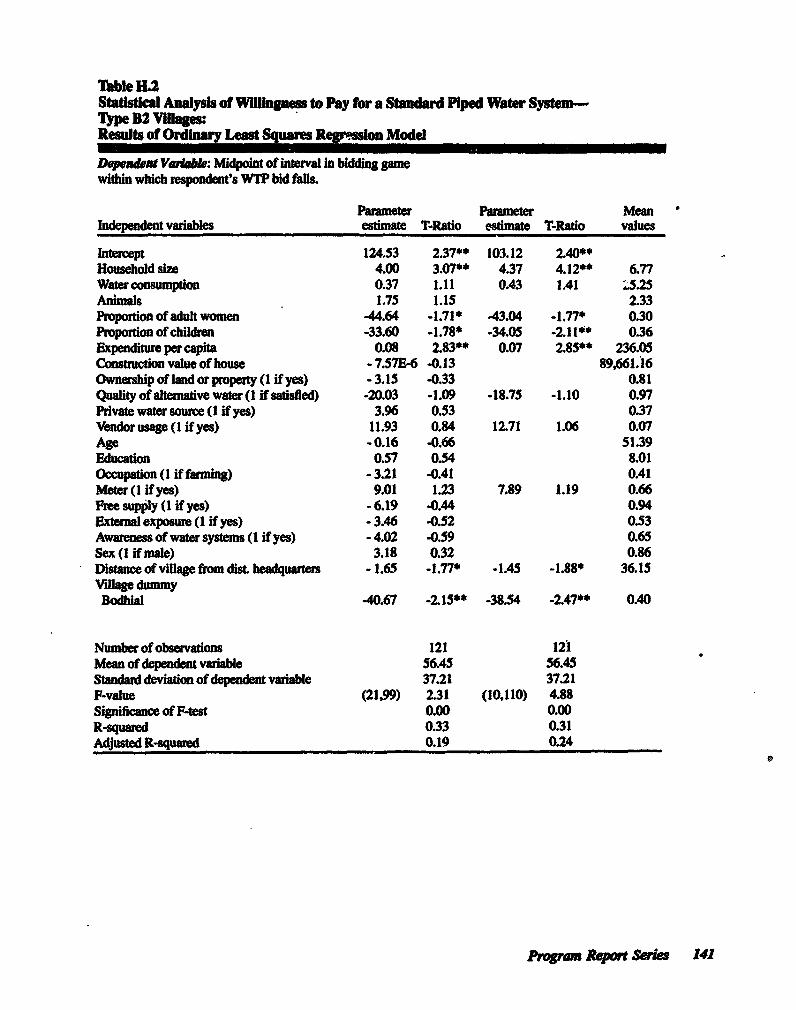
Table H.2SbtastIcal alyds of Wil_ngs to Pay for a Standar Piped Water System-Type B2 Villages:Results of Ordinry Least Squas Rression Model
Depeewn Vaabl: Midpoint of interval in biding gamewithin which respondent's W1P bid falls.
Parameter Prameter MeanIndependent variables esdmate T-Raio estmate T-Ratio values
Intercept 124.53 2.37** 103.12 2.40**Household size 4.00 3.07** 4.37 4.12** 6.77Waterconsumption 0.37 1.11 0.43 141 !3.25Animals 1.75 1.15 2.33Proportion of adult women -44.64 -1.71* 43.04 -1.77* 0.30Propotion of children -33.60 -1.78* -34.05 -2.11*J 0.36Expenditure per capita 0.08 2.83** 0.07 2.85** 236.05Construction value of house - 7.57E-6 -0.13 89,661.16Ownershipoflandorproperty(1 if yes) -3.15 433 0.81Quality of altemaive water(1 if satisaied) -20.03 -1.09 -18.75 -1.10 0.97Private water source (I if yes) 3.96 0.53 0.37Vendor usage (1 if yes) 11.93 0.84 12.71 1.06 0.07Age -0.16 -0.66 51.39Education 0.57 0.54 8.01Occupation (I if farming) - 3.21 -0.41 0.41Met(erI( if yes) 9.01 1.23 7.89 1.19 0.66Free supply (1 if yes) -6.19 -0.44 0.94Extenal exposure (I if yes) - 3.46 -0.52 0.53Awateness of water ysems (1 if yes) -4.02 -0.59 0.65Sex (I if nmle) 3.18 0.32 0.86Distanceof vUlagefrom dist headquate - 1.65 -1.77 -1.45 -1.88* 36.15Village dumnyBodhial -40.67 -2.15** -38.54 .2.47** 0.40
Number of observations 121 121Mean of dependet variable 56.45 56.45Standard deviation of dependent variable 37.21 37.21P-value (21,99) 2.31 (10,110) 4.88Significance of F-test 0.00 0.00R-quared 0.33 0.31Adjusted R-squared 0.19 0.24
Program Report Series 141
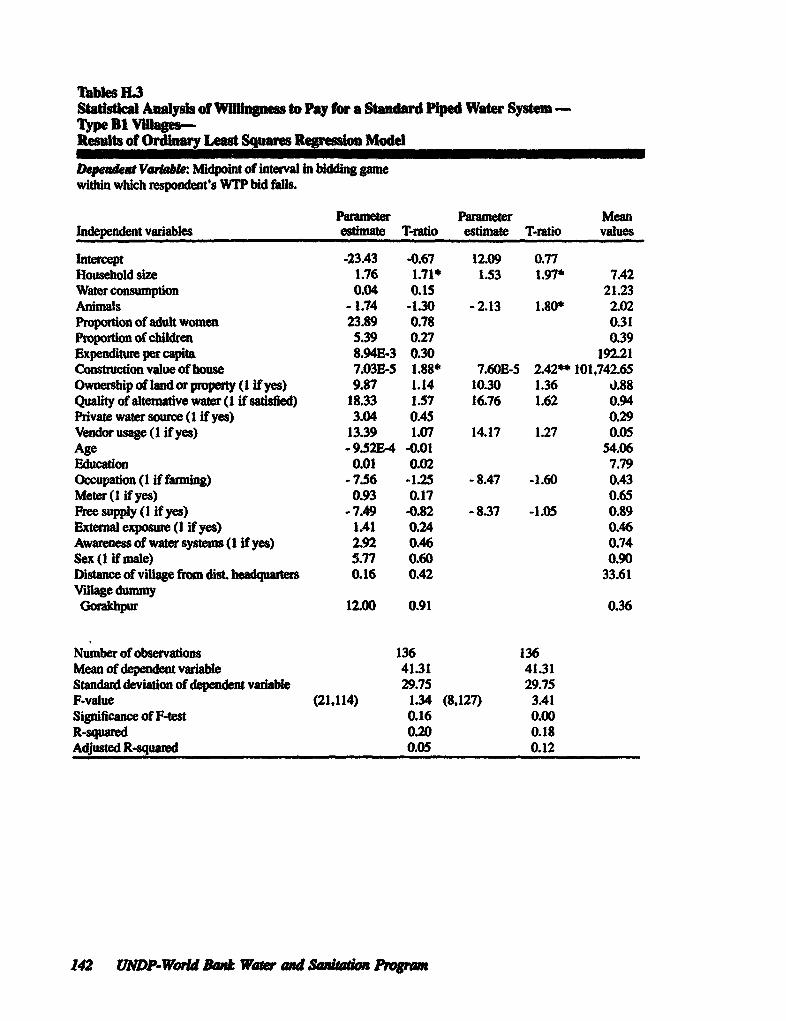
Tables H3Statistc Analyis of WIllingness to Pay for a Standard Piped Water Sy8tem -Type Di Vlages-Results of Ordinr Least Squrs Repsson Model
Depeadut Va*rk: Midpoint of interval in bidding gamewithin which respondet's WTP bid falls.
Paramew Paraneter MeanIndependent variables estimate T-ratio estimate T-ratio values
Intercept -23.43 -0.67 12.09 0.77Household size 1.76 1.71* 1.53 1.97* 7.42Waterconsumption 0.04 0.15 21.23Aniials -1.74 -1.30 -2.13 1.80* 2.02Proportion of adult women 23.89 0.78 0.31Proportion of childrm 5.39 0.27 0.39
penditure per capita 8.94E-3 0.30 192.21Constuction value of house 7.03B,5 1.88* 7.60E-5 2.42** 101,742.65Ownership of land or prperty (1 if yes) 9.87 1.14 10.30 1.36 tJ.88Quality of altemative water (1 if sased) 18.33 1.57 16.76 1.62 0.94Private water source (I if yes) 3.04 0.45 0.29Vendor usage (I if yes) 13.39 1.07 14.17 1.27 0.05Age -9.52E4 -0.01 54.06Education 0.01 0.02 7.79Occupation (1 if farming) -7.56 -1.25 -8.47 -1.60 0.43Meter (1 if yes) 0.93 0.17 0.65Free supply (1 if yes) -7.49 -0.82 -8.37 -1.05 0.89Extenal exposure (I if yes) 1.41 0.24 0.46Awareness of water systems (I if yes) 2.92 0.46 0.74Sex (1 if male) 5.77 0.60 0.90Distce of village from dis headquarters 0.16 0.42 33.61Vllage dummyGorakhp 12.00 0.91 0.36
Number of observations 136 136Mean of dependent vaiable 41.31 41.31Sndard deviation of dependent variable 29.75 29.75F-value (21,114) 1.34 (8,127) 3.41Significance of F-test 0.16 0.00R-squared 0.20 0.18Adjusted R-squared 0.05 0.12
142 UNDP-WorId Ba Waer and Saio2 Progum
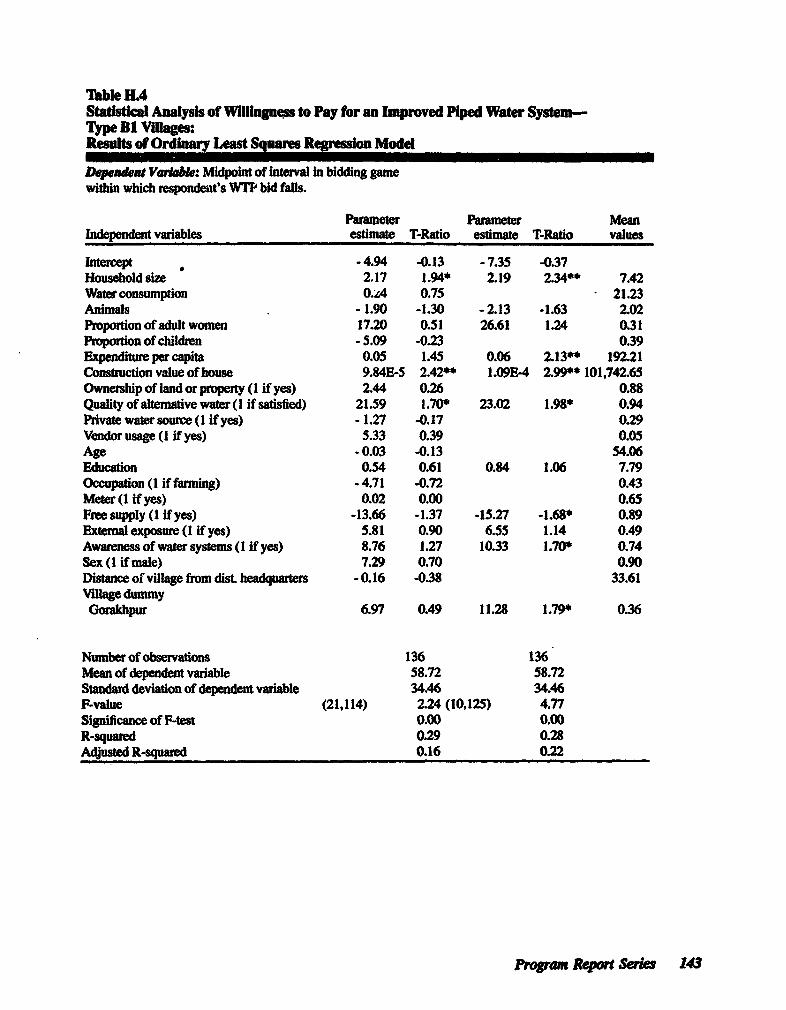
Table HAStatistical Analysis of Wilinness to Pay for an Improved Piped Water System-Type Bl Villages:Results of Ordny Least Squares Regression Modd
DEpeldeni Vaabke: Midpoint of interval in bidding gamewithin which respondeint's WTP bid falls.
Parameter Parameter ManIndnt variables esfimate T-Ratio estimate T-Ratio values
hercept , -4.94 -0.13 -7.35 -0.37Household size 2.17 1.94* 2.19 2.34** 7.42Waer consumption A4 0.75 21.23Animals - 1.90 -1.30 -2.13 -1.63 2.02Proportion of adult women 17.20 0.51 26.61 1.24 0.31Prportion of chilren - 5.09 -0.23 0.39Expenditure percapita 0.05 1.45 0.06 2.13** 192.21Construction value of house 9.84E-5 2.42** 1.09B-4 2.99** 101,742.65Ownemip of land or property (I if yes) 2.44 0.26 0.88Quality of altrative water ( if sadsfied) 21.59 1.70* 23.02 1.98* 0.94Private water source (I if yes) - 1.27 -0.17 0.29Vendor usage (I if yes) 5.33 0.39 0.05Age -0.03 -0.13 54.06Education 0.54 0.61 0.84 1.06 7.79Occupation (I if farming) -4.71 -0.72 0.43Meter (I if yes) 0.02 0.00 0.65Free supply (I if yes) -13.66 -1.37 -15.27 -1.68* 0.89Externalexposure(I if yes) 5.81 0.90 6.55 1.14 0.49Awareness of water systems (I if yes) 8.76 1.27 10.33 1.70* 0.74Sex (1 if male) 7.29 0.70 0.90Distce of village from dist headquarters -0.16 -0.38 33.61Village dummyGorakhpur 6.97 0.49 11.28 1.79* 0.36
Number of observations 136 136Mean of dependent variable 58.72 58.72Standard deviation of dependent variable 34.46 34.46F-value (21,114) 2.24 (10,125) 4.77Significance of P-test 0.00 0.00R-squared 0.29 0.28Adjustd R-squaed 0.16 0.22
Progran Report Se5 143
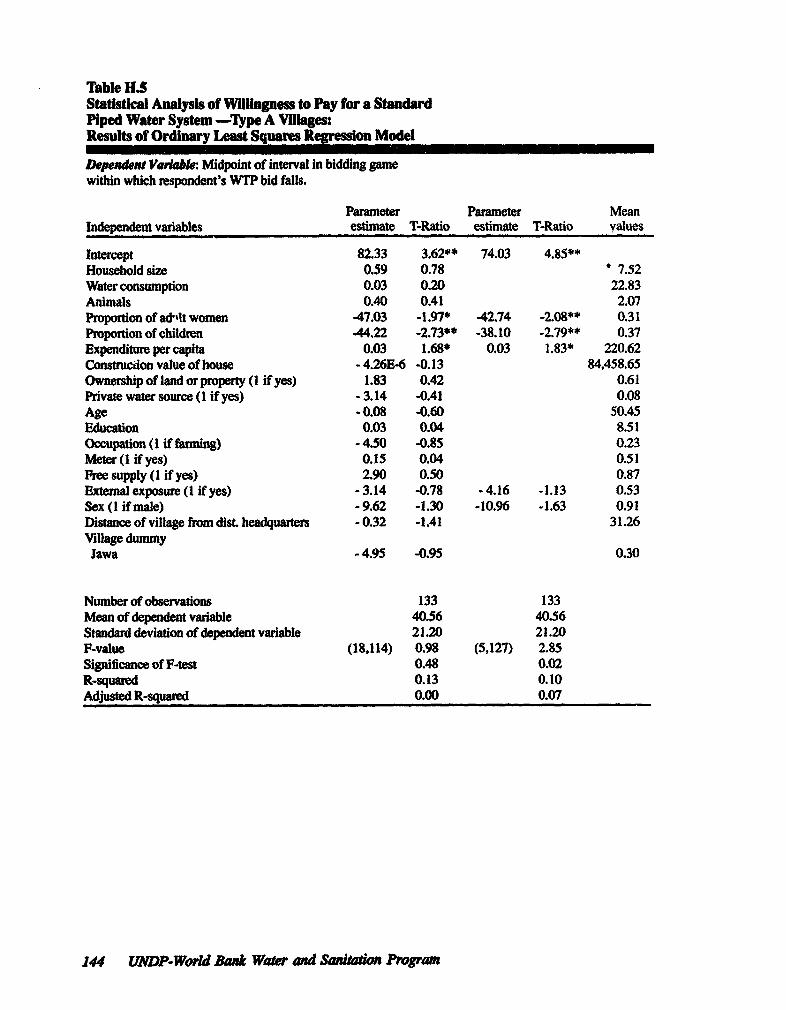
TIable H.SStatitcal Analysis of WHliges to Pay for a StandardPiped Water System -Type A VlUlages:Results of Ordhiary Least Squares Regression Model
Dependen VaB:eg Midpoint of interval in bidding gamewithin which respondent's WTP bid falls.
Parameter Parameter MeanIndependent variables estimate T-Ratio estimate T-Ratio values
Intercept 82.33 3.62** 74.03 4.85**Household size 0.59 0.78 * 7.52Water consumption 0.03 0.20 22.83Animals 0.40 0.41 2.07Poportion of ad-It women 47.03 -1.97* 42.74 -2.08** 0.31Proportion of children .44.22 -2.73** -38.10 -2.79** 0.37Expenditure per capita 0.03 1.68* 0.03 1.83* 220.62ConstuCicon value of house -4.26E-6 -0.13 84,458.65Ownershipoflandorproperty(l if yes) 1.83 0.42 0.61Private water source (1 if yes) -3.14 -0.41 0.08Age -0.08 -0.60 50.45Education 0.03 0.04 8.51Occupation (I if fauming) -4.50 -0.85 0.23Meter ( if yes) 0.15 0.04 0.51Free supply (I if yes) 2.90 0.50 0.87Extemal exposure (I if yes) -3.14 -0.78 -4.16 -1.13 0.53Sex (I if male) -9.62 -1.30 -10.96 -1.63 0.91Distance of village from dist. headquartes -0.32 -1.41 31.26VilUage dummyJawa -4.95 -0.95 0.30
Number of observations 133 133Mean of dependent variable 40.56 40.56Standard deviation of dependent variable 21.20 21.20F-value (18,114) 0.98 (5,127) 2.85Significance of F-test 0.48 0.02R-squated 0.13 0.10Adjusted R-squared 0.00 0.07
144 UNDP-World Bank Water and Sanitati m Pngrm
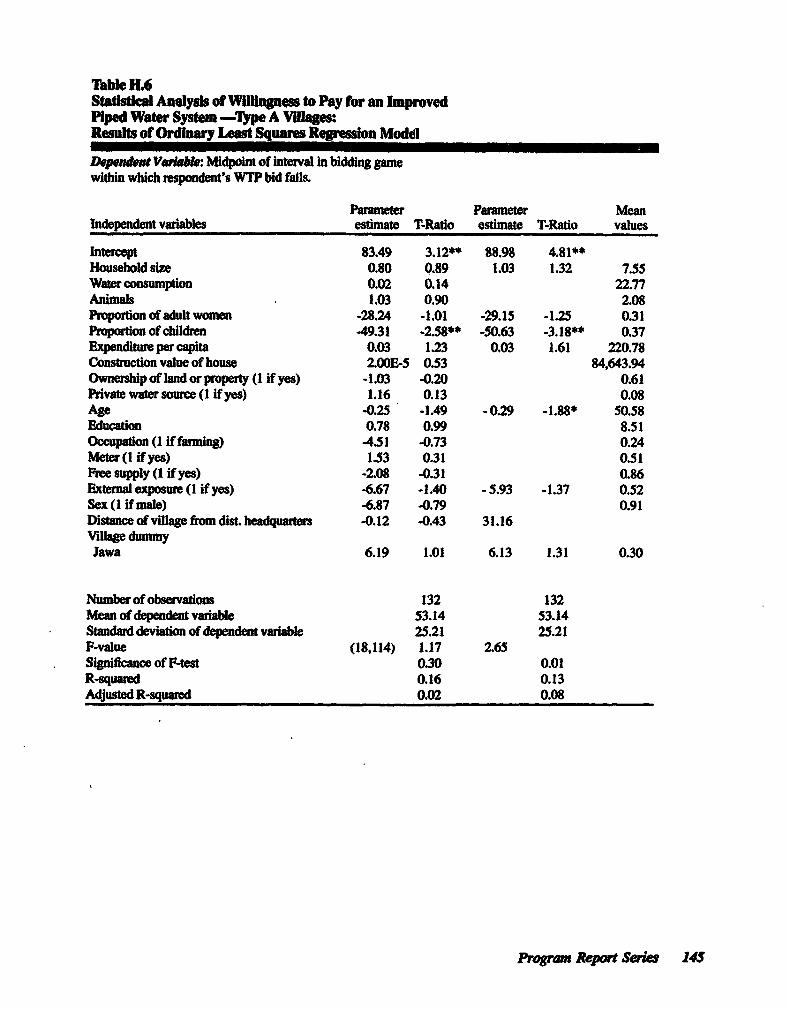
TIble 1L6Statistical Analysis of Wifipess to Pay for an ImprvedPiped Water System -Tlpe A Vlllages:Results of Ordiary Least Squares Rerssn Model
Dependnt Vibe: Midpoint of interval In bidding gamewithin which respondent's WTP bid falls.
Parameter Parameter MeanIndependent vatiables estimate T-Ratio estimate T-Ratio values
Intercept 83.49 3.12** 88.98 4.81**Household size 0.80 0.89 1.03 1.32 7.55Water consumption 0.02 0.14 22.77Animals 1.03 0.90 2.08Proportion of adult women -28.24 -1.01 -29.15 -1.25 0.31Prportion of children -49.31 -2.58** -50.63 -3.18** 0.37Expenditure per capita 0.03 1.23 0.03 1.61 220.78Constuction value of house 2.OOE-5 0.53 84,643.94Ownashipoflandorproperty(I if yes) -1.03 -0.20 0.61Private water source (I if yes) 1.16 0.13 0.08Age -0.25 -1.49 -0.29 -1.88* 50.58Education 0.78 0.99 8.51Occupation (1 if farming) -4.51 -0.73 0.24Metr ( if yes) 1.53 0.31 0.51Frme supply (1 if yes) -2.08 -0.31 0.86Extnal exposure (I if yes) -6.67 -1.40 -5.93 -1.37 0.52Sex (I if male) -6.87 -0.79 0.91Distance of vllage from disL leaquwters -0.12 -0.43 31.16Vrllage dummyJawa 6.19 1.01 6.13 1.31 0.30
Number of observations 132 132Mean of dependent vaiable 53.14 53.14Standard deviation of dependent variable 25.21 25.21F-value (18,114) 1.17 2.65Significance of F-test 0.30 0.01R-squared 0.16 0.13Adjusted R-squared 0.02 0.08
Proam Report Series 145
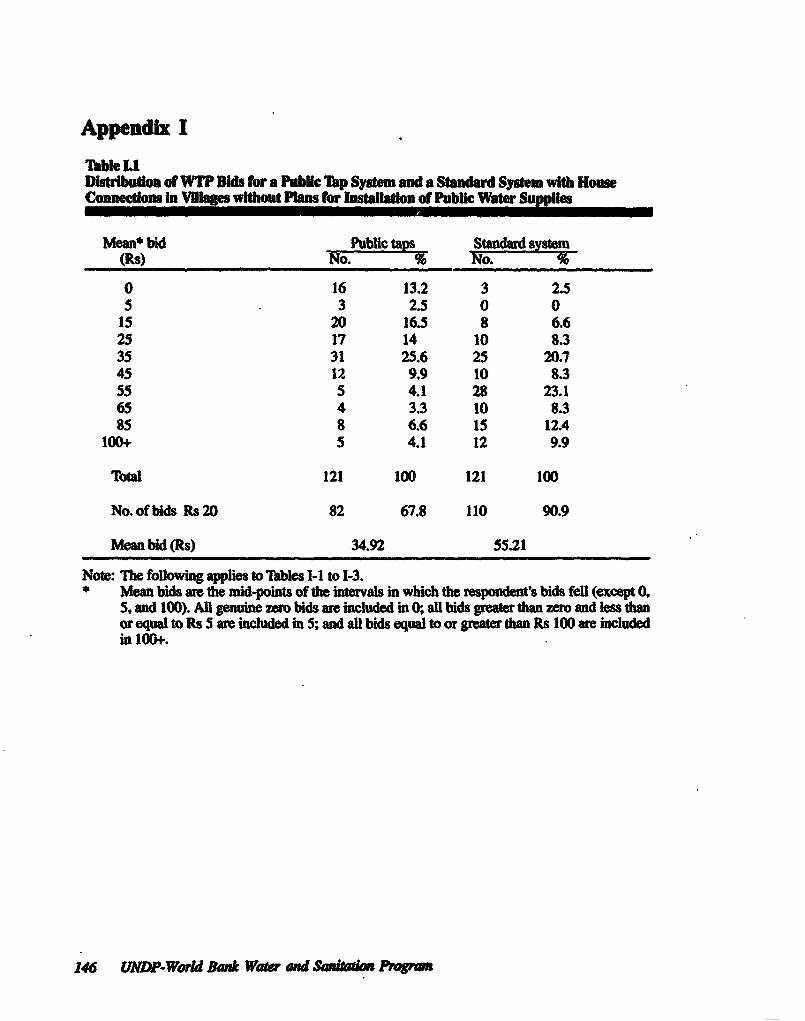
Appendix I
Tlbk LIDiribution d WTP Bids for a PubUc Tap System and a Stadard System with HouseConnecto in Vies wihout Plas for stallaon of Pubic Water Supplies
Mean* bid Public ta_s St____ard _sw
(Rs) No. -,O- No. %
0 16 13.2 3 2.5S . 3 2.5 0 0
15 20 16.5 8 6.625 17 14 10 8.335 31 25.6 25 20.745 12 9,9 10 8.355 5 4.1 28 23.165 4 3.3 10 8.385 8 6.6 15 12A
100+ 5 4.1 12 9.9
Tota 121 100 121 100
No. of bids Rs 20 82 67.8 110 90.9
Mean bid (Rs) 34.92 55.21
Note: Te following applies to ibles 1-1 to 1-3.* Mean bids are te mid-points of the intvals in which the rsponde's bids feil (except 0,
5, and 100). All genuine zero bids are included in 0, all bids greater than zero and less dtanorequal to Rs S are included in 5; and al bids equal to rgreatertban Rs 100 are includedin 100*.
146 UNDP-World Bank Water and Sw*om Progrw
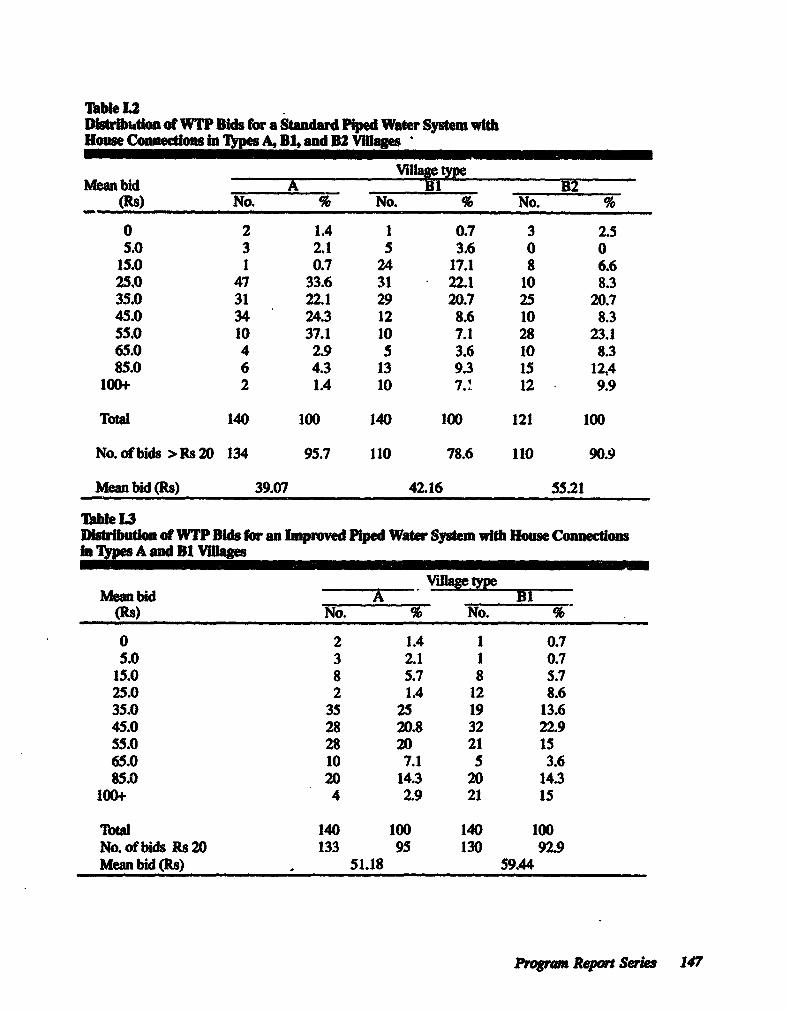
Table L2Distion of WTP Bids for a Stadad Piped Water System withHouse Connecto in lbp A, B51 and 82 VillageI
Mean bid A Bi B2(RS) No. % No. % No. %
0 2 1.4 1 0.7 3 2.55.0 3 2.1 5 3.6 0 0
15.0 1 0.7 24 17.1 8 6.62S.0 47 33.6 31 22.1 10 8.335.0 31 22.1 29 20.7 25 20.745.0 34 24.3 12 8.6 10 8.355.0 10 37.1 10 7.1 28 23.165.0 4 2.9 5 3.6 10 8.385.0 6 4.3 13 9.3 15 12,4
100+ 2 1.4 10 7.' 12 - 9.9
Total 140 100 140 100 121 100
No.of bids >Rs20 134 95.7 110 78.6 110 90.9
Mean bid (Rs) 39.07 42.16 55.21
Table UDitibuton of WTP Bids for an Improved Piped Water System witb House ConectionsIn Tyvpes A and Di Vlage
Mean bid M_Agetp_ e(Ra) No. % No. %
0 2 1.4 1 0.73.0 3 2.1 1 0.7
13.0 8 5.7 8 5.725.0 2 1.4 12 8.635.0 35 25 19 13.643.0 28 20.8 32 22.953.0 28 20 21 1563.0 10 7.1 S 3.685.0 20 14.3 20 14.3
100+ 4 2.9 21 15
Total 140 100 140 100No.of bids Rs20 133 95 130 92.9Mean bid (Rs) 51.18 59.44
PW8ram Report Sewim 147
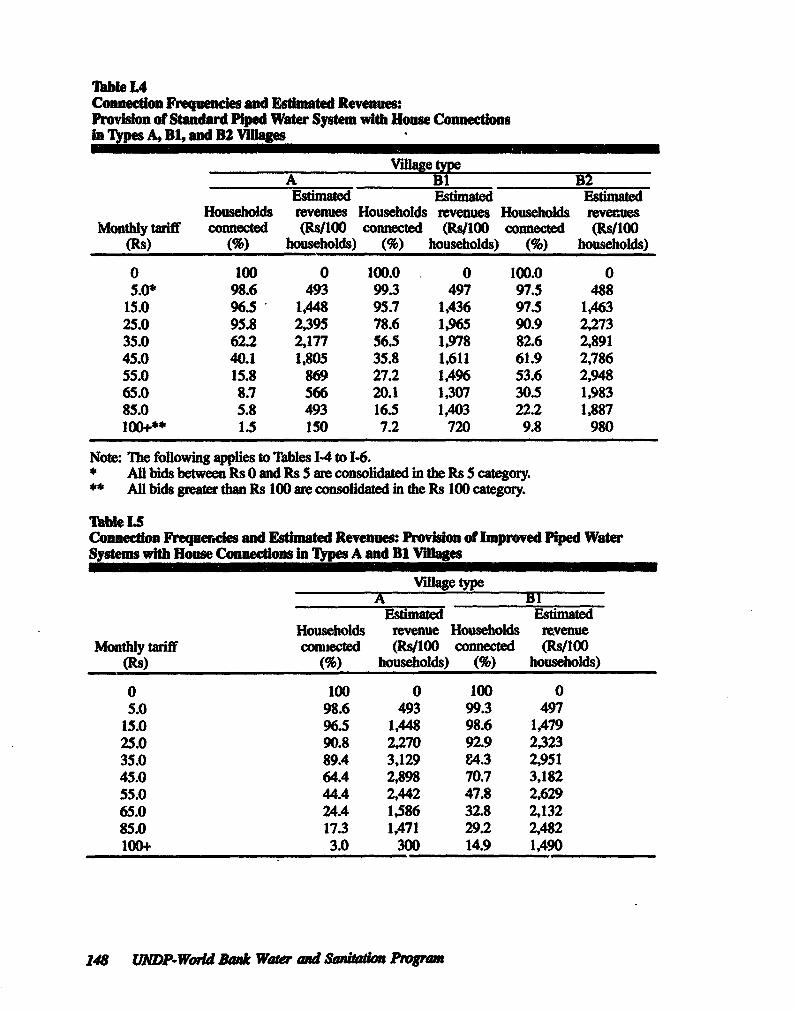
lIable I4Connecton Frequences and Esimated Revenues:Provision of Standard Plped Water System with House ConnectionsIn Types A, B1 and B2 Vllages
Vlllage typeA Bi B2Estimated Esimated Esfimated
Households revenues Households revenues Households revenuesMonthly tariff comected (Rs/100 connected (Rs/100 connected (Rs/100
(Rs) (%) households) (%) households) (%) households)
0 100 0 100.0 0 100.0 05.0* 98.6 493 99.3 497 97.5 488
15.0 96.5 1,448 95.7 1,436 97.5 1,46325.0 95.8 2,395 78.6 1,965 90.9 2,27335.0 62.2 2,177 56.5 1,978 82.6 2,89145.0 40.1 1,805 35.8 1,611 61.9 2,78655.0 15.8 869 27.2 1,496 53.6 2,94865.0 8.7 566 20.1 1,307 30.5 1,98385.0 5.8 493 16.5 1,403 22.2 1,887100+** 1.5 I50 7.2 720 9.8 980
Note: The following applies to Tables 1-4 to 1-6.* All bids between Rs 0 and Rs 5 are consolidated in the Rs 5 catego .** All bids greater than Rs 100 are consolidated in the Rs 100 category.
Table LSConnection Frequenides and Estimded Revenues: Provision of Improved Piped Watersystems witHouse Connecios n Types A and B1 Vilages
,iliae type
Estimated EstimatedHouseholds revenue Households revenue
Monthly tariff con d (Rs/100 comected (RsJ100_ (Rs) (%) households) (%) households)
0 100 0 100 05.0 98.6 493 99.3 497
15.0 96.5 1.448 98.6 1,47925.0 90.8 2,270 92.9 2,32335.0 89.4 3,129 84.3 2,95145.0 64.4 2,898 70.7 3,18255.0 44.4 2,442 47.8 2,62965.0 24.4 1,586 32.8 2,13285.0 17.3 1,471 29.2 2,482100+ 3.0 300 14.9 1,490
148 UNDP-Word Bank Water d Santation Pyrm

Table L6Coectio Frequencies and Estimated Revenues: Provion of Public Taps and StandardHouse Connections In Type B2 Vilages
Public taps Standard systemEstimated Estimated
Households revenue Households revenueMonthly tariff connected (Rs/100 connected (Rs/100
(Rs) (%) households) (%) households)
0 100 0 100 05.0 86.8 434 97.5 488
15.0 84.3 1265 97.5 146325.0 67.8 1695 90.9 227335.0 53.8 1883 82.6 289145.0 28.2 1269 61.9 278655.0 18.3 1007 53.6 294865.0 14.2 923 30.5 198385.0 10.9 927 22.2 .1887100+ 4.3 430 9.8 980
P m Report Series 149
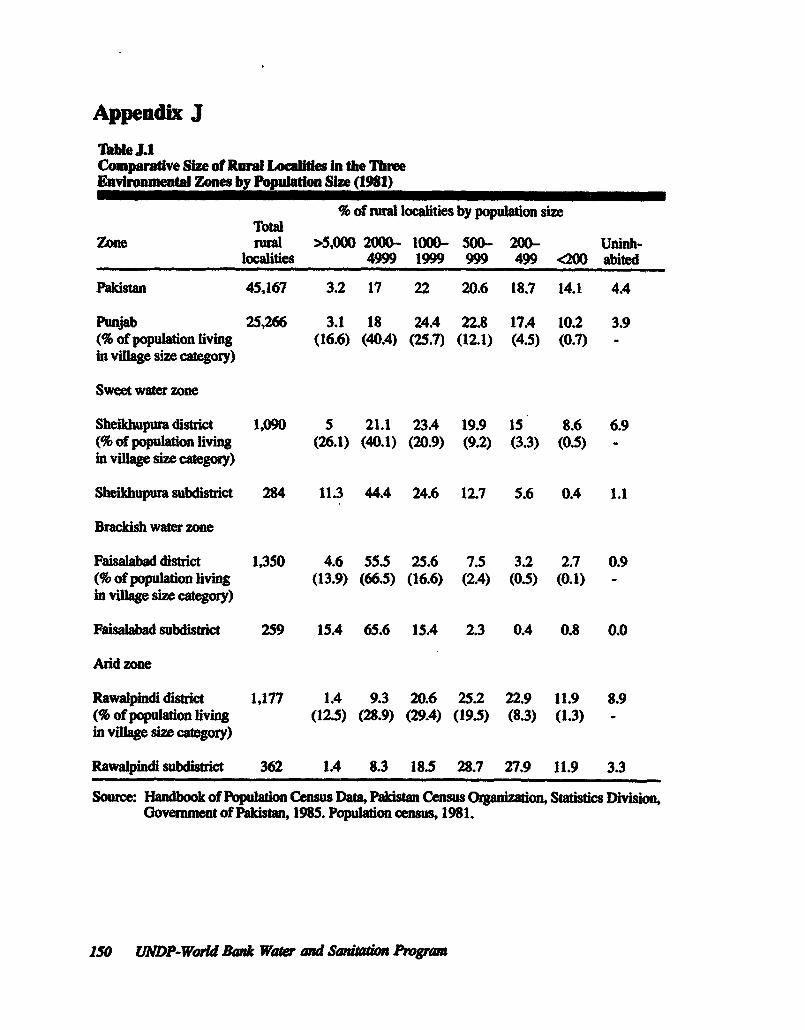
Appendix J
Table J.1Compartve Size of Rual Localides in the ThreeEvironental Zones by Populao Size (1961)
% of rural localities by population sizeTotal
Zone rural >5,000 2000- 1000- 500- 200- Uninh.localities 4999 1999 999 499 <200 abited
Pakistan 45,167 3.2 17 22 20.6 18.7 14.1 4.4
Punjab 25,266 3.1 18 24A 22.8 17A 10.2 3.9(% of populaton living (16.6) (40.4) (25.7) (12.1) (4.5) (0.7) -in viage sze category)
Sweet water zone
Sheikhupura disict 1,090 5 21.1 23.4 19.9 15 8.6 6.9(% of populaion living (26.1) (40.1) (20.9) (9.2) (3.3) (0.5) -
in village size category)
Sheikhupura subdistrict 284 11.3 44.4 24.6 12.7 5.6 0.4 1.1
Brackish wat zone
Faisalabad distict 1,350 4.6 55.5 25.6 7.5 3.2 2.7 0.9(% of population living (13.9) (66.5) (16.6) (2.4) (0.5) (0.1) -
in village size category)
Faisalabad subdistrict 259 15.4 65.6 15.4 2.3 0.4 0.8 0.0
Arid zone
Rawalpindi district 1,177 1.4 9.3 20.6 25.2 22.9 11.9 8.9(% of populadon living (12.5) (28.9) (29.4) (195) (8.3) (1.3) -
in village size category)
Rawalpindi subdistrict 362 1A 8.3 185 28.7 27.9 11.9 3.3
Source: Handbook of Popuation Census Da, Paklstm Census Organization, Statstics Division,Government of Pakistan, 1985. Population census, 1981.
150 UNDP-Waoid Bank Water and Saai Phgrogi
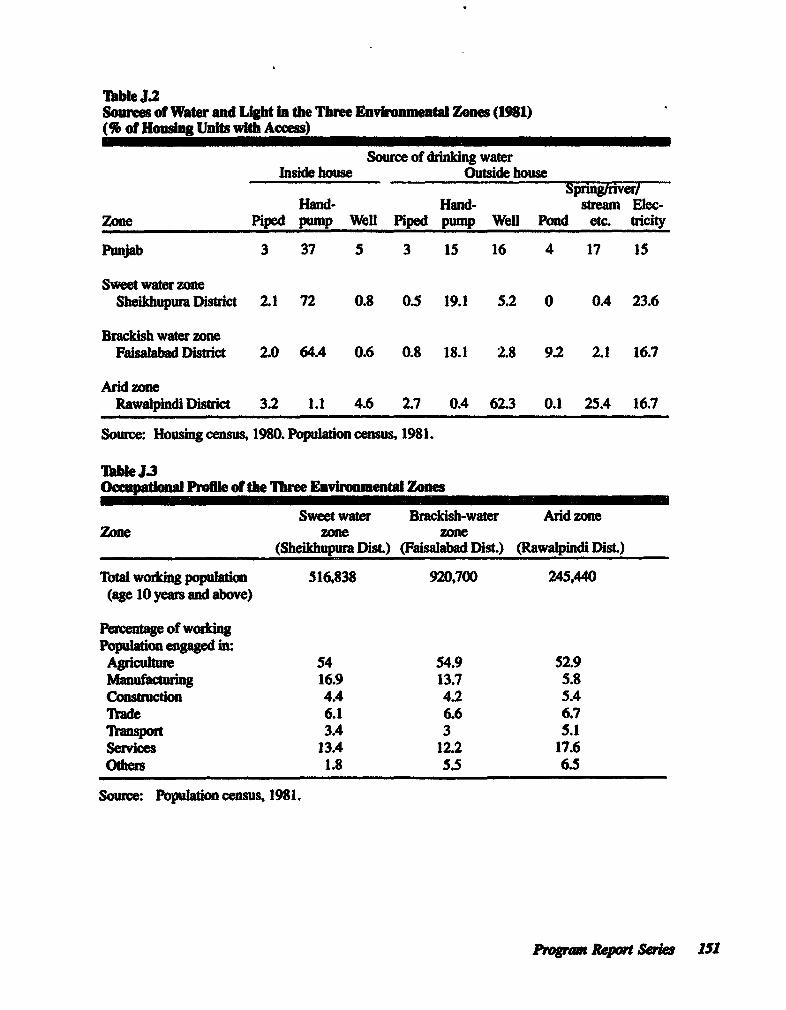
Table J.2Sourees of Water and Light In the Three Environmental Zones (1981)(% of Housing Units with Acces)
Source of drinking waterInside house Outside house
Spring/river/Hand- Hand- sntm Elec-
Zone Piped pump Well Piped pump Well Pond etc. tricity
Punjab 3 37 5 3 15 16 4 17 15
Sweet water zoneSheihupura District 2.1 72 0.8 0.5 19.1 5.2 0 0.4 23.6
Brackish water zoneFaisalabad District 2.0 64.4 0.6 0.8 18.1 2.8 9.2 2.1 16.7
Ard zoneRawalpindi District 3.2 1.1 4.6 2.7 0.4 62.3 0.1 25A 16.7
Source: Housing census, 1980. Population census, 1981.
Table J.3Occupaonal Proile of the Three Envonmental Zone
Sweet water Brackdsh-water Arid zoneZone zone zone
(She-upur Dix) (Faisalabad Dix) (Rwalpindi Dis.)
Total woring populadon 516,838 920,700 245,440(age 10 years and above)
Pecentae of woringPopulation egaged in:Agriculture 54 54.9 52.9Manufacturing 16.9 13.7 5.8Constrction 4.4 4.2 5ATrade 6.1 6.6 6.7Tran t 3.4 3 5.1Services 13.4 12.2 17.6Olhers 1.8 5.5 6.5
Source: Population census, 1981.
Pram RepSees 15
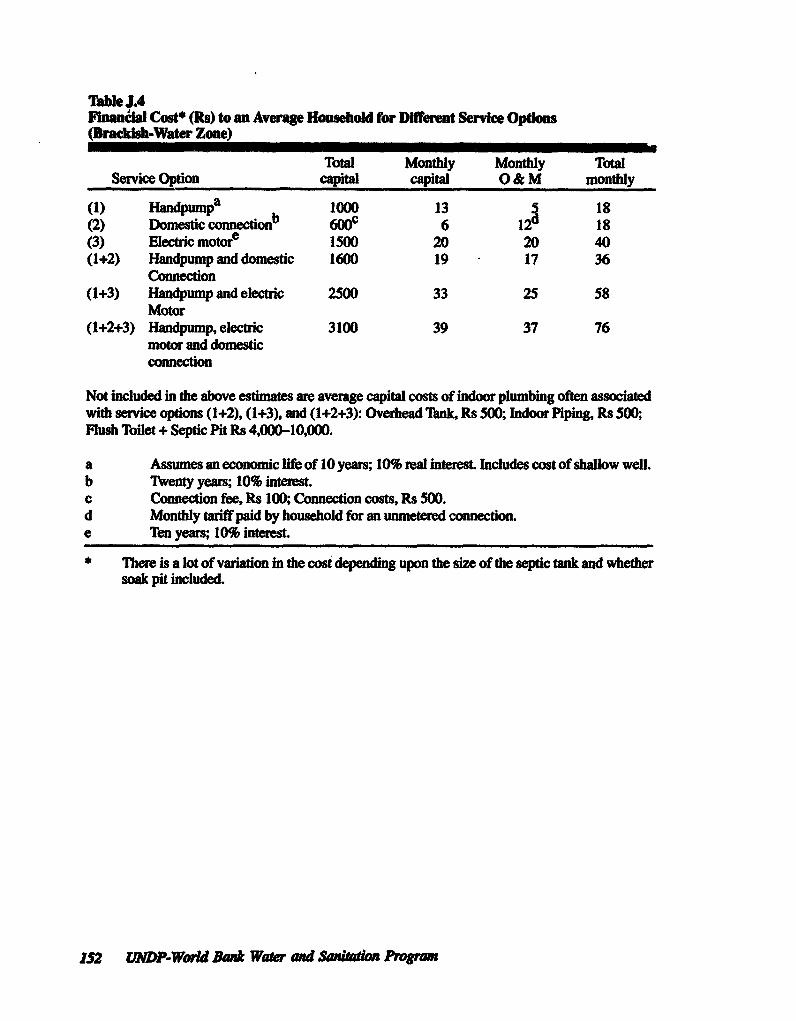
Tbae J4Fianl Cost* (its) to an Average Household for Different Service Options(Bracish-Water Zone)
Total Monthly Monthly TotalService Option capital capital O & M monthly
(1) ba 1000 13 5 18
(2) Domstic connection 60(F 6 12 d 18(3) Electric motore 1500 20 20 40(1+2) Handpump and domestic 1600 19 17 36
Connection(1+3) Handpump and electric 2500 33 25 58
Moor(1+2+3) Handpump, electric 3100 39 37 76
motor and domesticconnection
Not included in the above esuimates are average capital costs of indoor plumbing often associatedwith service options (1+2), (1+3), and (1+2+3): Overhead Tank, Rs 500; Indoor Piping, Rs 500;Flush Toilet + Septic Pit Rs 4,000-10,000.
a Assumes an economic life of 10 years; 10% real interest. Includes cost of shallow well.b Twenty years; 10% interest.c Connection fee, Rs 100; Connection costs, Rs 500.d Monthly tariff paid by household for an unmetered connection.e Ten yeas; 10% interes_
* There is a lot of variation in the cost depending upon the size of the septic tank and whethersoak pit included.
152 UNDP-Waod Bank Water and S5ntation Pgran
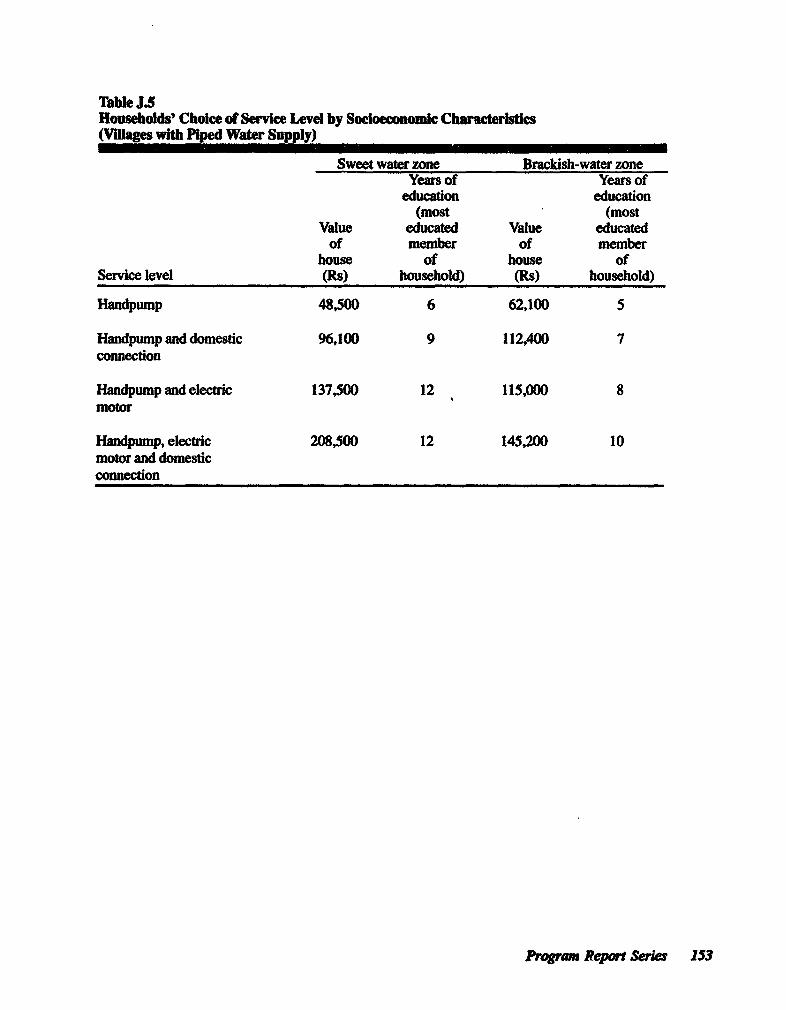
Table J5Households' Choice of Service Level by Socioeconomic Charaeterbtics(Vilages with Piped Water Supply)
Sweet water zone Brackish-water zoneYears of Years of
education education(most (most
Value educated Value educatedof member of member
house of house ofService level (Rs) household) (Rs) household)
Handpump 48,500 6 62,100 5
Handpump and domestic 96,100 9 112,400 7connection
Handpump and electic 137,500 12 115,000 8motor
Handpump, electric 208,500 12 145,200 10motor and domesticconnection
Progn Report Series 153
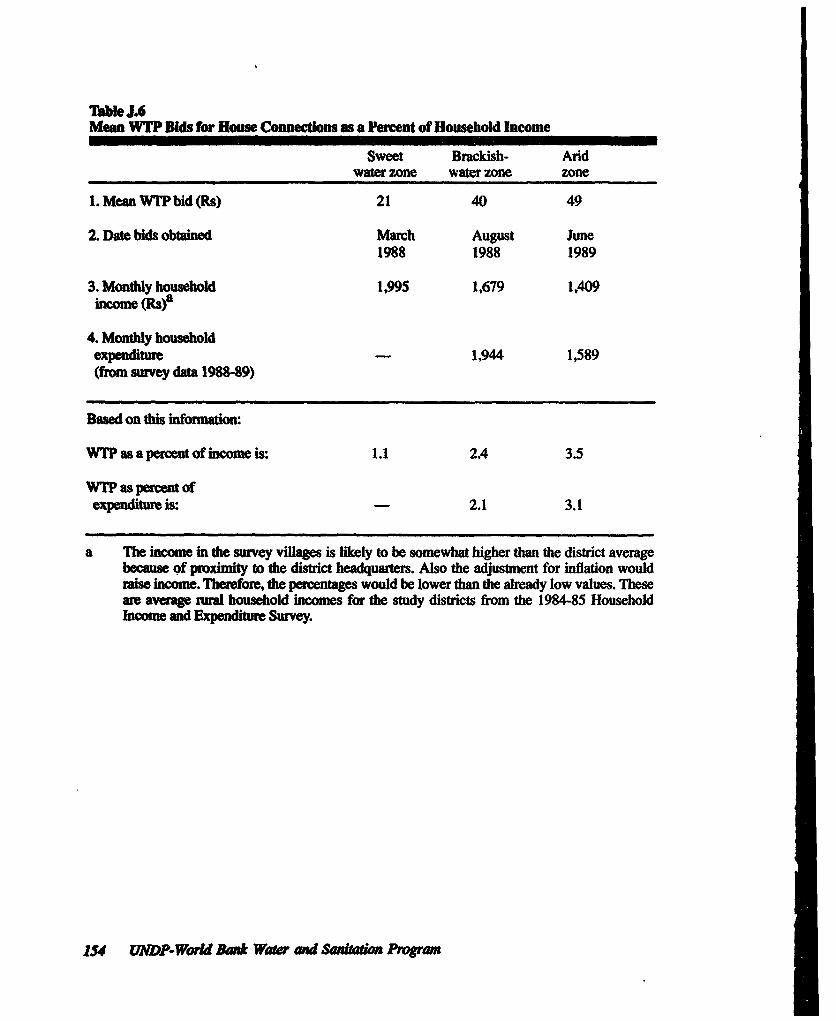
Thble J.6Man WTP Blds for House Conn_econs as a Percent of Household Income
Sweet Brackish- Aridwaler zone water zone zone
1. Mean WTP bid (Rs) 21 40 49
2. Date bids obtained March August June1988 1988 1989
3. Monthly household 1,995 1,679 1,409income (Rs)a
4. Monthly householdexpendiu - 1,944 1,589(f*om survey dat 1988-89)
Based on this information:
WIPasapercentofincomeis: 1.1 2.4 3.5
WTP as percent ofexpenditre is: - 2.1 3.1
a Tme income in the survey villages is likely to be somewhat higher than the district averagebecamue of proximity to the district headquarters. Also the adjustment for inflation wouldise income. Therefore, the percentages would be lower than the already low values. These
are aveae rual household incomes for the study districts from the 1984-85 HouseholdIncome and Expendtu Survey.
154 UNDP-W Id aN* Water and Saitio Prgram
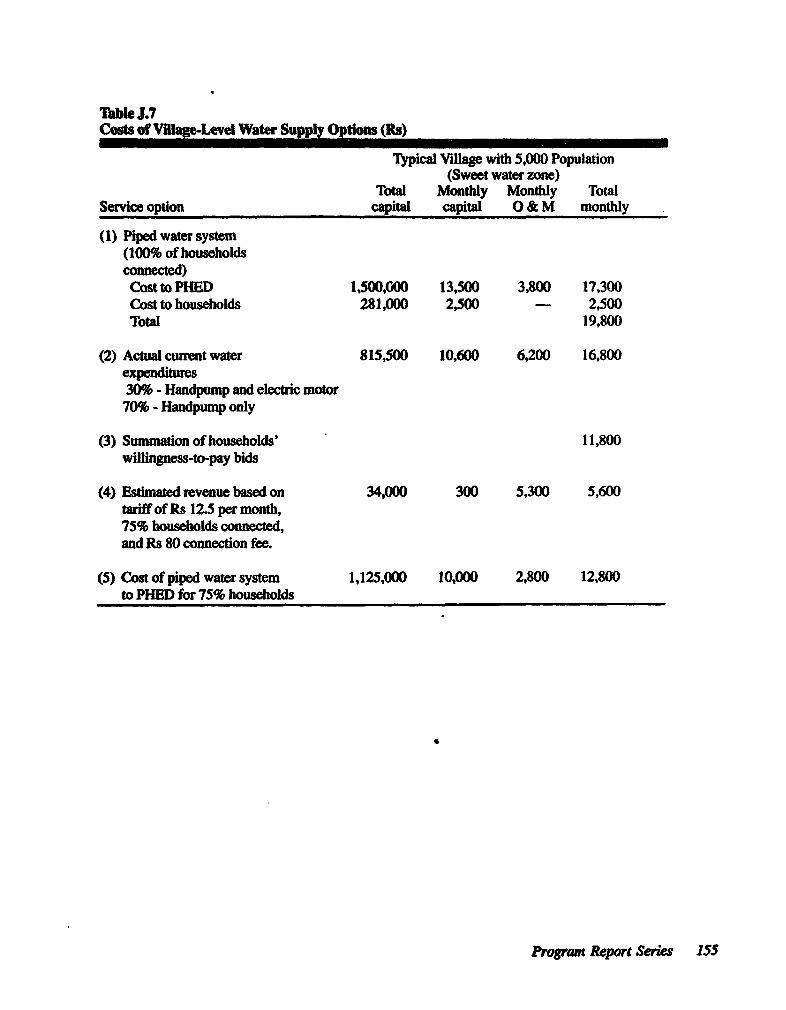
Table J.7Costs of Village-Level Water Supply Options (Rs)
Typical Village with 5,000 Population(Sweet water zone)
Total Montly Monthly TotalService option capital capital O & M monthly
(1) Piped water sysem(100% of householdsconnected)Cost to PHED 1,500,000 13,500 3,800 17,300Cost to households 281,000 2,500 - 2,500Total 19,800
(2) Actual current water 815,500 10,600 6,200 16,800expenditues30% - Handwump and electric motor
70% - Handpump only
(3) Summation of households' 11,800willingness-to-pay bids
(4) Estimated revenue based on 34,000 300 5,300 5,600tariff of Rs 12.5 per month,75% households connected,and Rs 80 connection fee.
(5) Cost of piped water system 1,125,000 10,000 2,800 12,800to PHED for 75% households
Program Report Series 155
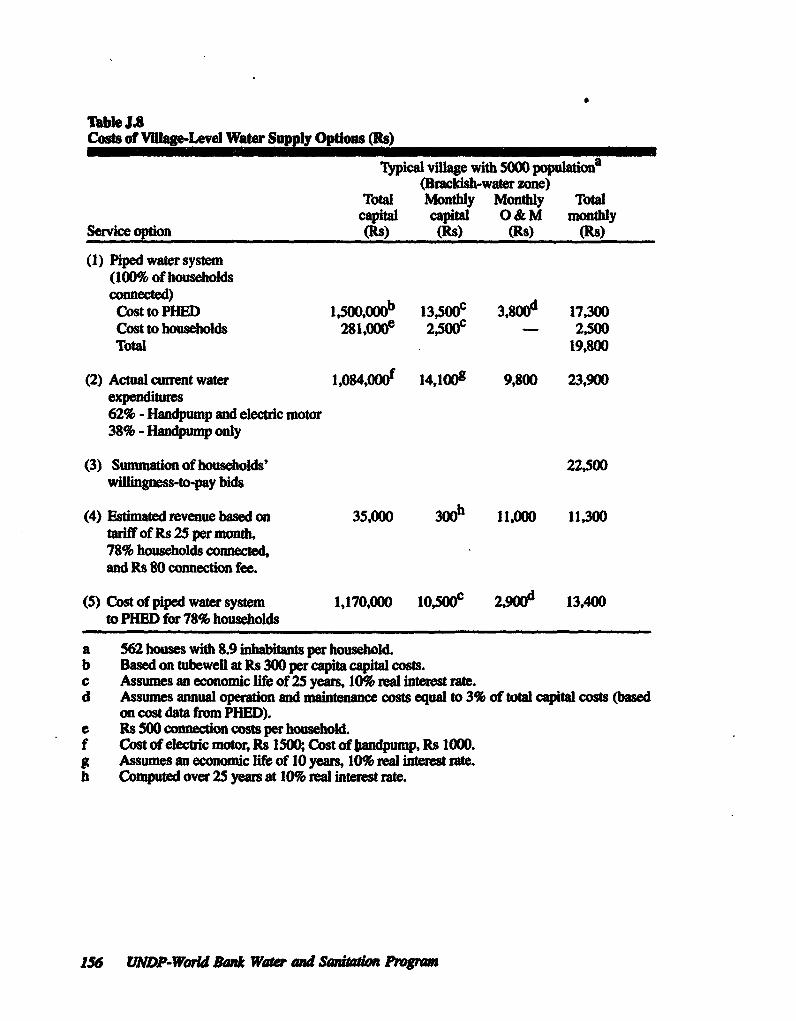
Table J8Cods of Vilge-Level Water Supply Options (Rs)
Typical village with 5000 populationa(Brackish-water zone)
Total Monthly Monthly Totalcapital capital O & M monthly
Service opton (R) (Rs) (Rs) (Ra)
(1) Piped water system(100% of householdsconected)Cost to PHED 1,5WOOOP 13 ,5 00C 3,800w 17,300Cost to households 281,000( 2,5 0O - 2,500Total 19,800
(2) Actual cunrent water 1,084,00 14,100 g 9,800 23,900expenditures62% - Handpmnp and electric motor38% - Handpump only
(3) Sumnation of households' 22,500wilingness-to-pay bids
(4) Estimated revenue based on 35,000 300h' 11,000 11,300tariff of Rs 25 per month,78% households connected,and Rs 80 connection fee.
(5) Cost of piped water system 1,170,000 10S00F 2 ,900d 13,400to PHE!D for 78% households
a 562 houses with 89 inhabitants per household.b Based on tubeweil at Rs 300 per capita capital costs.c Assumes an economic life of 25 years, 10% real inteKst rate.d Assmes annual operon and maintenace costs equa to 3% of total capital costs (based
on cost data from PHED).e Rs 500 connection cost per householdf Cost of eleclric motor, Rs 1500; Cost of bandpump, Rs 1000.g Assumes an economic life of 10 years, 10% real interest rate.h Computed over 25 years at 10% real interest rate.
156 UNDP-Wrd Ba* Wakr ad Sankado Fwgn
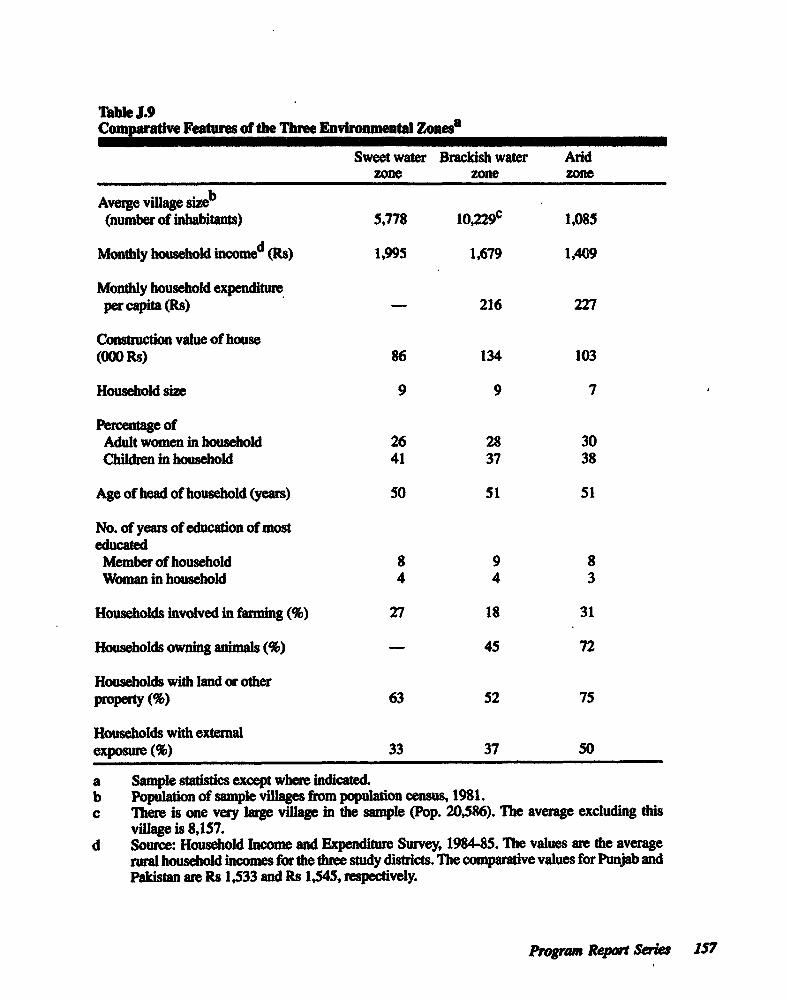
Table J.9Comparative Features of the Tbree Enrvironmental Zones?
Sweet water Brackish water Aridzone zone zone
Aver8e vilage sizeb(number of inhabitants) 5,778 10,229F 1,085
Monthly household incomed (Rs) 1,995 1,679 1,409
Monthly household expenditueper capita (Rs) - 216 227
Constucion value of house(000 Rs) 86 134 103
Household size 9 9 7
Percentage ofAdult women in household 26 28 30Children in household 41 37 38
Age of head of household (years) 50 51 51
No. of years of education of mosteducatedMember of household 8 9 8Woman in household 4 4 3
Households involved in faming (%) 27 18 31
Households owning animals (%) - 45 72
Households with land or otherproperty (%) 63 52 75
Households with extemalexposure (%) 33 37 50
a Sample statistics except where indicated.b Population of sample villages from population census, 1981.c There is one very large village in the sample (Pop. 20,586). The average excluding this
village is 8,157.d Source: Household Income and Expenditure Survey, 1984-85. The values are the average
rurgal household icomes for the three study districts. The comparative values for Punjab andPakistan are Rs 1,533 and Rs 1,545, respectively.
Proram Repot Se,a 157
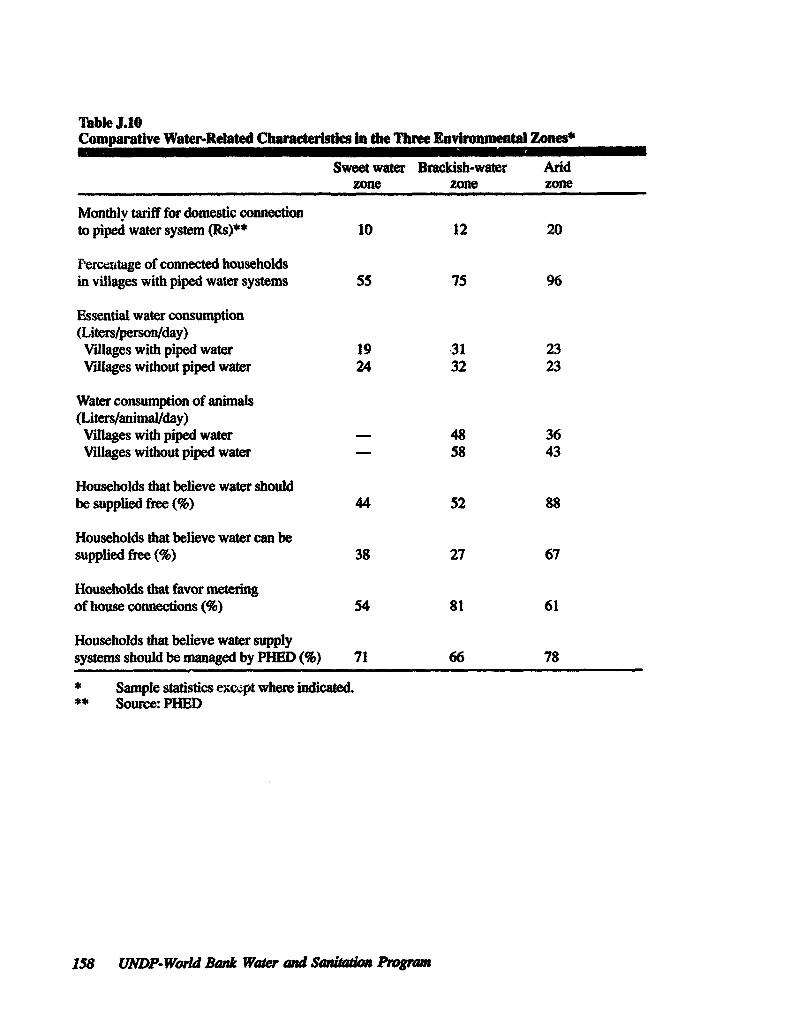
Table J.10Comparative Water-Related CharacterisfIs In the Thre Environmental Zones"
Sweet water Brackish-water Aridzone zone zone
Monthlv tariff for domestic connectionto piped water system (Rs)** 10 12 20
Percentage of connected householdsin villages with piped water systems 55 75 96
Essential water consumption(Liters/person/day)Villages with piped water 19 31 23Vllages without piped water 24 32 23
Water consumption of animals(Liters/animal/day)Villages with piped water - 48 36Vlllages without piped water - 58 43
Households that believe water shouldbe supplied free (%) 44 52 88
Households that believe water can besupplied free (%) 38 27 67
Households that favor meteringof house connections (%) 54 81 61
Households that believe water supplysystems should be managed by PHED (%) 71 66 78
* Sample statistics excpt where indicated.** Source: PHED
158 UNDP- World Bank Water and Santato Prora
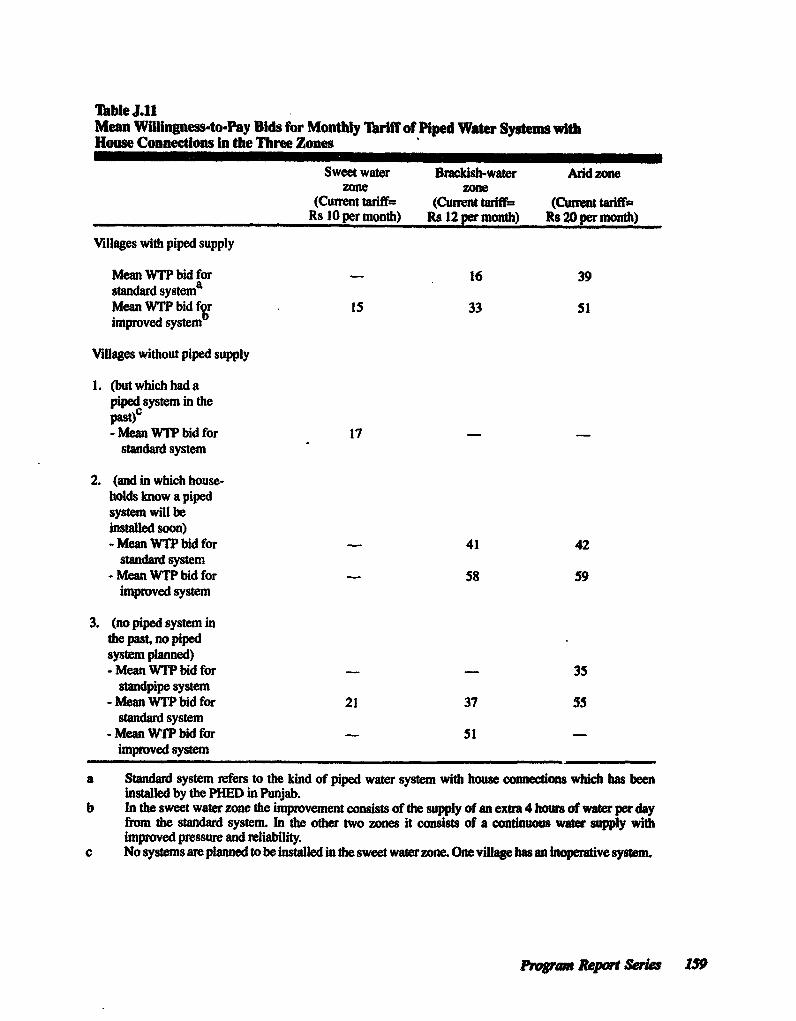
Table J11Mean Wilhingness-to-Pay Bids for Monthly Tariff of Piped Water Sytems witHouse Connections in the Three Zones
Sweet water Bmcish-water Arid zonezone zone
(Current tariff= (Current tariff= (Ciunet tariff=Rs IO per month) Rs 12 per month) Rs 20 per month)
Villages with piped supply
Mean WTP bid for - 16 39standard systemnMean WTP bid f8r 15 33 51improved system
Villages without piped supply
1. (but which had apiped systen in thepast)o= Mean WTP bid for 17
stanard system
2. (and in which house-holds know a pipedsystem will beinstalled soon)- Mean WTP bid for 41 42
sandard system- Mean WTP bid for 58 59
im^proved system
3. (no piped system inthe past, no pipedsystem planned)- Mean WTP bid for - - 35
standpipe system-Mean WTP bid for 21 37 55
standard system- Mean WfP bid for 51
improved system
a Standard system refers to the kind of piped water system with house connections which has beeninstalled by the PHED in Punjab.
b In the sweet water zone the improvement consists of the supply of an extra 4 hows of water per dayfrmm the standrd system. In the other two zones it consists of a continuous water supply withimproved pressure and reliability.
c No systemns are planned to be installed in the sweet water zone. One village has an inoperative systm
Prram hRepot Seia
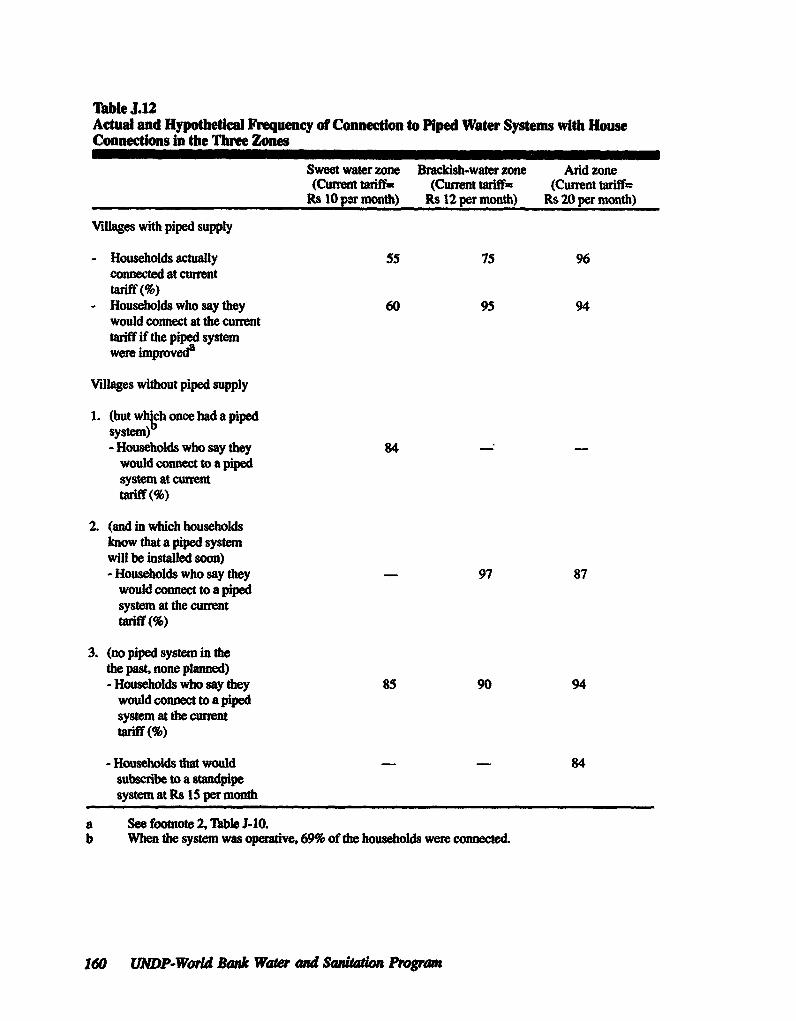
Table J.12Actual and Hypothetical Frequency of Connection to Piped Water Systems with HouseConnections in the Thee Zones
Sweet water zone Brackish-water zone Arid zone(Current toriff= (CuTrnt taiff= (Current tariff=
Rs IOparmonth) Rs 12permonth) Rs 20 permonth)
Villages with piped supply
- Households actually 55 75 96connected at cumenttariff (%)
- Households who say they 60 95 94would connect at the cunenttariff if the piped systemwere improveda
Villages without piped supply
1. (but which once had a pipedsystem)- Households who say they 84 -
would connect to a pipedsystem at currenttriff (%)
2. (and in which householdsknow that a piped systemwill be installed soon)- Households who say they - 97 87
would connect to a pipedsystem at the currenttariff (M)
3. (no piped system in thethe past, none planned)- Households who say they 85 90 94
would connect to a pipedsystem at the cunrenttariff (%)
- Households that wolld - - 84subscribe to a standpipesystem at Rs 15 per month
a See footnote 2, Table l-I.b When the system was operative, 69% of the households were connected.
160 UNDP-Wod Ban War and Sation Progran
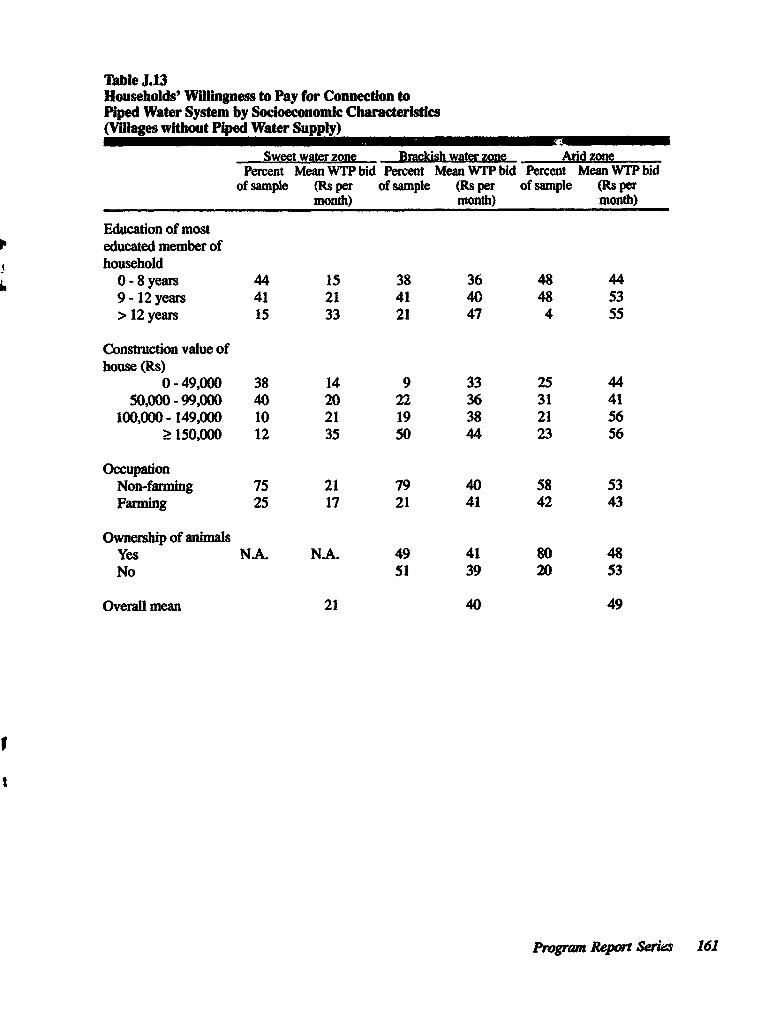
Table J.13Households' Willingness to Pay for Connection toPiped Water System by Socioeconomic Characteristics(Vilages without Piped Water Supply)
Sweet water zone Brackish water zone Arid zonePercent Mean WTP bid Percent Mean WT? bid Percent Mean WTP bid
of sample (Rs per of sample (Rs per of sample (Rs permonth) month) month)
Education of mosteducated member ofhousehold
0 - 8 years 44 15 38 36 48 449 - 12 years 41 21 41 40 48 53> 12 years 15 33 21 47 4 55
Construction value ofhouse (Rs)
0-49,000 38 14 9 33 25 4450,000 -99,000 40 20 22 36 31 41
100,000- 149,000 10 21 19 38 21 56:> 150,000 12 35 50 44 23 56
OccupationNon-faniing 75 21 79 40 58 53Farming 25 17 21 41 42 43
Ownership of animalsyes NA. N.A. 49 41 80 48No 51 39 20 53
Overall mean 21 40 49
I
Prograun Report Serw*e 161
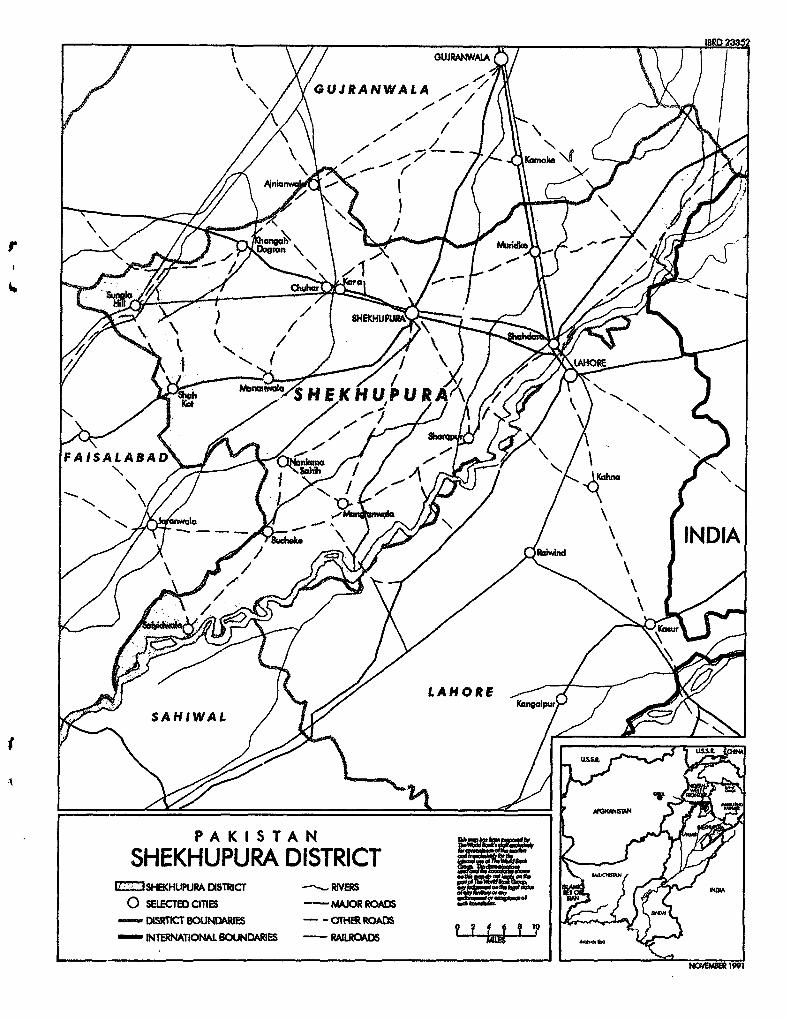
OWRANWAIA ~~~~~~~~~~IBM 233S
JRANWALA / /r~~~~~~~~~~~
SHEKHUPURA DISTRICT
o S EALECTE AD, C,ES - MAO RO \ S
| 3e_ _ ^t ~~ eA)/ / \ [ ~INDIA
,= - X v X ~~~LAH O REE
1~~~~~~ A K IS TA N
SHEKHUPURA DISTRICT a=5A.0 SEtECrDMES - MAJORRODS ;f
- DISRTICT BOUNDAES -O-TER ROADS a
INTNATIONAL BOUNDARIES -RAILROADS
NOEWIJIB 99
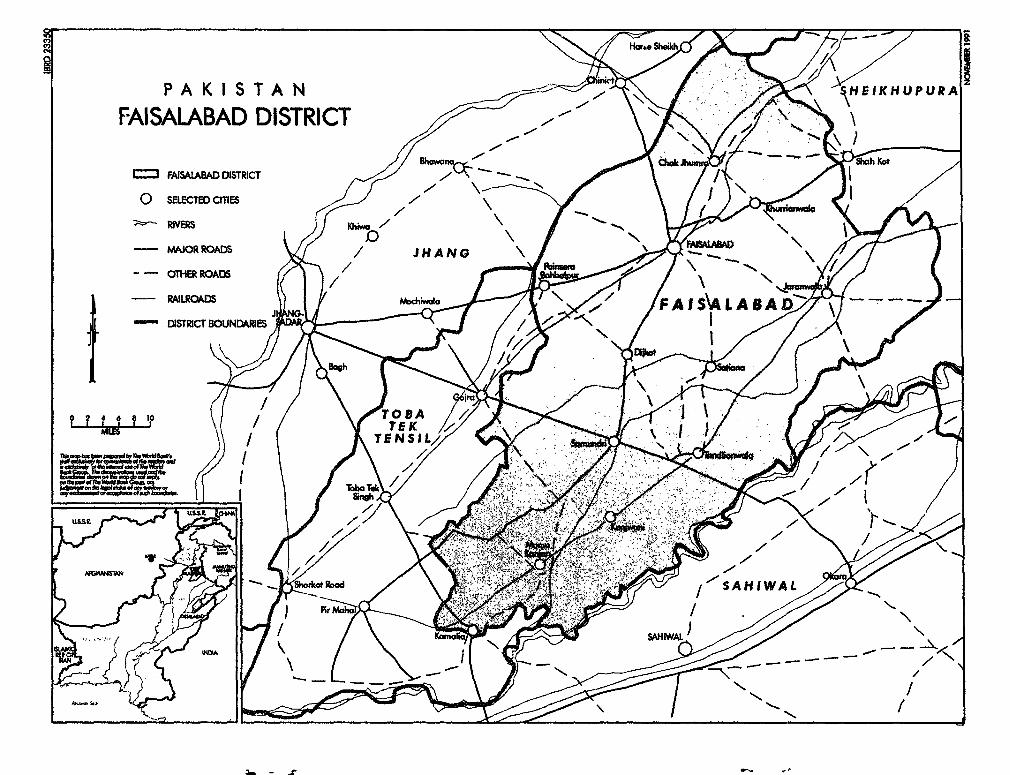
t ~~~~P A K I S T A N H iKUPUR
FAISALABAD DISTRICT
= FAJSALABAD DISTrICT 7\ //
SELECTM CITIEs
RNMS
MAJOR ROADS JHANG
- - OTHER ROADS
- RMLROADS SA B A -
DISTRICT BOUNDARIES0 B
u~~~~~1 Stw
4~~~~~~~~~~~~~~~~~~~~~~~
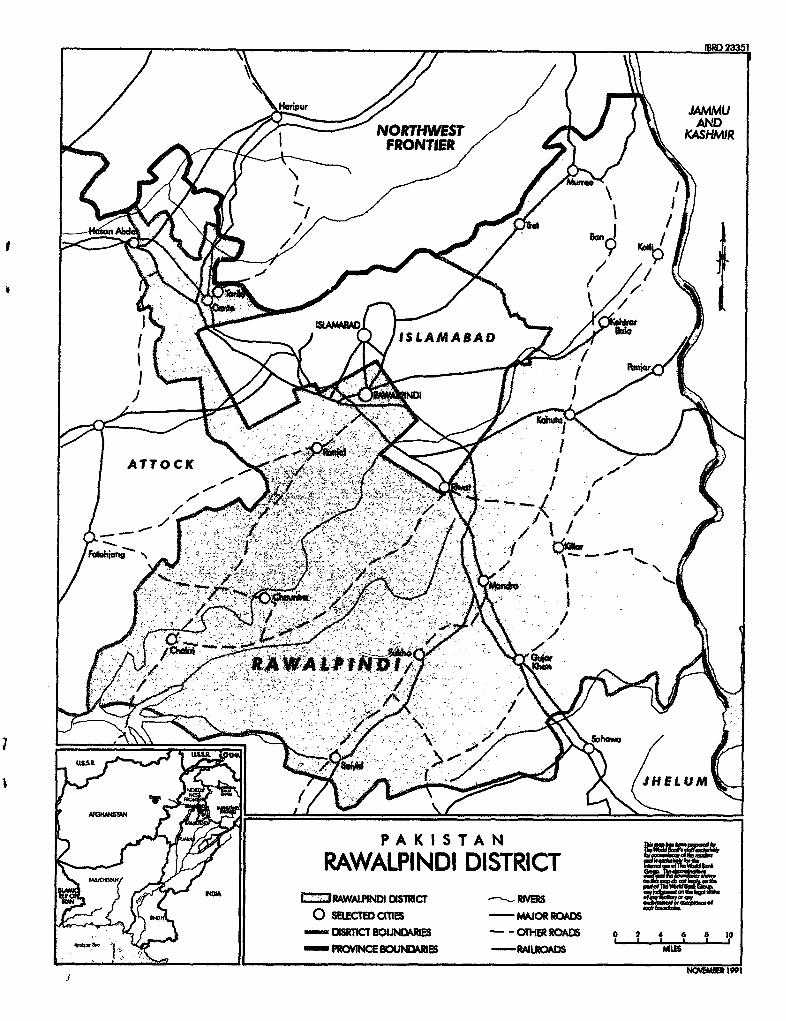
I 2335
Havipw .~~~~~~~~~JMMUNORTHWEST AND
FRONTIERKAHR
9~~~~~
{ { . \ s~~ISLAMABA D
JHLUM
P A KI S TA NRAWALPINDI DISTRICT ~ X
I=RAwAI.PD axsTmcr --- RiVERsmo EcT- MAJOR ROADS
rSIMCr BOUNDARIES OTH ROADS 0 2 4 - PROVINCE BOJNnAIes -RAI.ROADS __
NOMER 1991
/ M
UNDP-WrldSBn a.iter ndSntioPrga
The World Bank-181.8 H Street, NW,WAashington. DC 20433USA
United Nations Development ProgrammeOne U'nited Nations PlazaNew York. NY J100 17L'SA
Regional Water and Sanitation Groups Regional Water and Sanitation NetworkEastern and Southern Africa Cerntral Amirica c/o The World Bank c/o UNICEFP.0. Box 301577 P.O. Box 525-0190 1Nairobi, Kenva Ciudad de GuatemalaWest Africac/o The World Bank01 B.P. 1850Abidjan 01-, C6te dflvoire
East Asia and the PacificC/o The World BankP.O. Box 324/JKTJikarta, IndonesiaSouth AsiaCIO The World BankP.O. Box'416New Delhi 1 10003-.lndia
- k/I~~~~~~~~~~~~~~~~~~~~~~~~~~~~~~~~~~~~~~~~-