Embed Size (px)
Citation preview
Solid Waste Strategy 2024
TOM TATE Mayor
ForewordCity of Gold Coast (City) has a proud history of working with the community, business and other levels of government to create a more sustainable future. We are the second largest local government in Australia, home to over 540,000 residents and host to around 12 million visitors annually.
One of the by-products of the city’s growth and prosperity is the increased generation of solid waste. In 2014–15, the City managed 556,000 tonnes of waste. About half of this waste came from households, just over a quarter was commercial and industrial waste, and the remainder was construction and demolition waste.
The city’s permanent population is expected to increase by a further 130,000 people over the next eight years. Many of these new residents will choose to live in medium to high density housing, close to facilities and services. This style of living has become increasingly common in our city. Population growth, the trend towards higher density living, and our huge visitor numbers present challenges for the City in the way we manage the Gold Coast’s solid waste.
As a priority, we aim to minimise the amount of waste entering the City’s landfills and improve recycling and resource recovery. To achieve our goals, we believe there is value in focusing on:
• achieving better recovery of priority wastes, especially organic waste materials such as food waste and green waste; and
• improving recycling in public places, high-density housing complexes, business premises and at events in the city.
Other challenges we face include creating a more environmentally friendly waste management system that not only provides a high level of service to the community, but is affordable to everyone. Balancing these concerns goes to the heart of the sustainability challenge.
The Gold Coast 2018 Commonwealth Games™ will provide great opportunities for the city. It will be our chance to demonstrate to the world just what we can achieve as a city and a community when we work together. How we manage the high volumes of waste that will be generated by the Games and its staging will not only have implications for our solid waste system, but our reputation as well.
This Solid Waste Strategy 2024 has been developed to ensure the city’s solid waste is managed effectively into the future. The strategy provides clear objectives and targets, and outlines our preferred approach to sustainably managing the city’s waste until 2024.
Under the guidance of the Solid Waste Strategy 2024, we aim to achieve the following outcomes:
• the City and the community actively practise waste avoidance and other positive waste behaviours
• waste re-use, recycling and recovery opportunities are maximised prior to landfill disposal
• our capacity to manage future waste is secured
• solid waste management has minimal negative impact on our environment and public health
I encourage everyone to become involved and be part of the solution. Together, we can change the way we think about waste and find the best waste management options for our city.
ContentsIntroduction .........................................2
Why a solid waste strategy? .............. 2
Corporate strategies .......................... 3
Strategic alignment ............................ 4
Strategy scope ................................... 4
Developing this strategy .................... 4
Background .........................................5Waste management activities ............ 6
Trends and issues .............................. 7
Strategy vision ....................................8Our objectives .................................... 8
Strategic outcomes ............................ 9
1: The City and the community
actively practise waste
avoidance and other positive
waste behaviours ........................ 11
2: Waste re-use, recycling
and recovery opportunities
are maximised prior to
landfill disposal ........................... 15
3: Our capacity to manage future
waste is secured ......................... 21
4: Solid waste management
has minimal negative impact
on our environment and
public health ................................ 25
Overview of key actions ................... 28
Implementing the strategy ................29Implementation costs ...................... 29
Review .............................................. 29
Appendix 1 ........................................30Waste management activities
in 2014-15......................................... 30
2
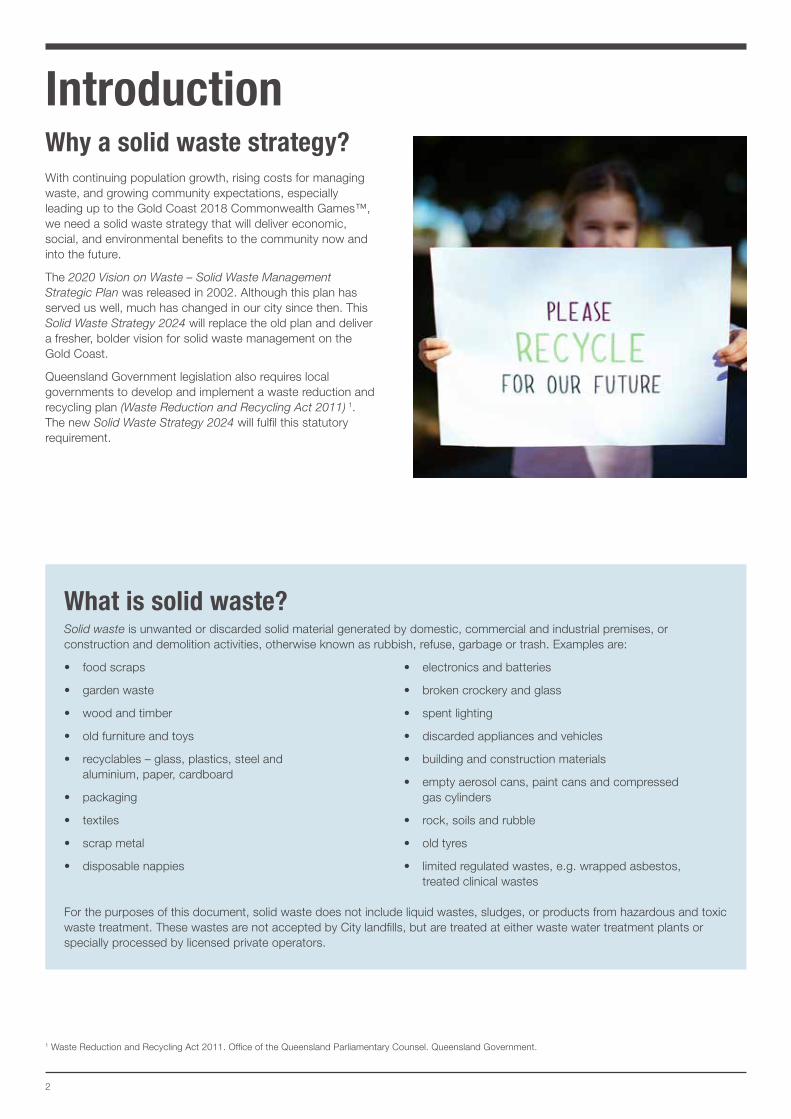
IntroductionWhy a solid waste strategy?With continuing population growth, rising costs for managing waste, and growing community expectations, especially leading up to the Gold Coast 2018 Commonwealth Games™, we need a solid waste strategy that will deliver economic, social, and environmental benefits to the community now and into the future.
The 2020 Vision on Waste – Solid Waste Management Strategic Plan was released in 2002. Although this plan has served us well, much has changed in our city since then. This Solid Waste Strategy 2024 will replace the old plan and deliver a fresher, bolder vision for solid waste management on the Gold Coast.
Queensland Government legislation also requires local governments to develop and implement a waste reduction and recycling plan (Waste Reduction and Recycling Act 2011) 1. The new Solid Waste Strategy 2024 will fulfil this statutory requirement.
1 Waste Reduction and Recycling Act 2011. Office of the Queensland Parliamentary Counsel. Queensland Government.
What is solid waste?Solid waste is unwanted or discarded solid material generated by domestic, commercial and industrial premises, or construction and demolition activities, otherwise known as rubbish, refuse, garbage or trash. Examples are:
• food scraps
• garden waste
• wood and timber
• old furniture and toys
• recyclables – glass, plastics, steel and aluminium, paper, cardboard
• packaging
• textiles
• scrap metal
• disposable nappies
• electronics and batteries
• broken crockery and glass
• spent lighting
• discarded appliances and vehicles
• building and construction materials
• empty aerosol cans, paint cans and compressed gas cylinders
• rock, soils and rubble
• old tyres
• limited regulated wastes, e.g. wrapped asbestos, treated clinical wastes
For the purposes of this document, solid waste does not include liquid wastes, sludges, or products from hazardous and toxic waste treatment. These wastes are not accepted by City landfills, but are treated at either waste water treatment plants or specially processed by licensed private operators.
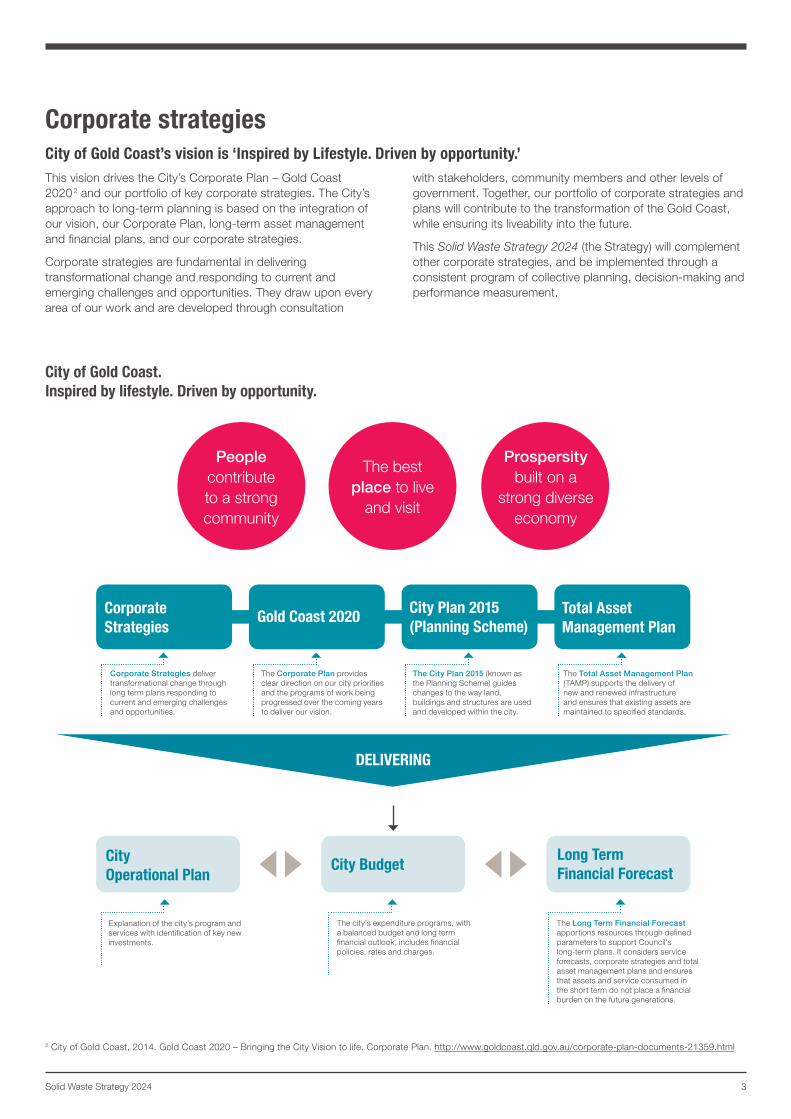
Corporate Strategies deliver transformational change through long term plans responding to current and emerging challenges and opportunities.
The Corporate Plan provides clear direction on our city priorities and the programs of work being progressed over the coming years to deliver our vision.
The City Plan 2015 (known as the Planning Scheme) guides changes to the way land, buildings and structures are used and developed within the city.
The Total Asset Management Plan (TAMP) supports the delivery of new and renewed infrastructure and ensures that existing assets are maintained to specified standards.
The city’s expenditure programs, with a balanced budget and long term financial outlook, includes financial policies, rates and charges.
Explanation of the city’s program and services with identification of key new investments.
City of Gold Coast. Inspired by lifestyle. Driven by opportunity.
City BudgetLong Term Financial Forecast
City Operational Plan
The Long Term Financial Forecast apportions resources through defined parameters to support Council's long-term plans. It considers service forecasts, corporate strategies and total asset management plans and ensures that assets and service consumed in the short term do not place a financial burden on the future generations.
Total Asset Management Plan
City Plan 2015 (Planning Scheme)
Gold Coast 2020Corporate Strategies
Peoplecontributeto a strong community
The best place to live
and visit
Prospersity built on a
strong diverse economy
DELIVERING
3Solid Waste Strategy 2024
Corporate strategiesCity of Gold Coast’s vision is ‘Inspired by Lifestyle. Driven by opportunity.’This vision drives the City’s Corporate Plan – Gold Coast 20202 and our portfolio of key corporate strategies. The City’s approach to long-term planning is based on the integration of our vision, our Corporate Plan, long-term asset management and financial plans, and our corporate strategies.
Corporate strategies are fundamental in delivering transformational change and responding to current and emerging challenges and opportunities. They draw upon every area of our work and are developed through consultation
with stakeholders, community members and other levels of government. Together, our portfolio of corporate strategies and plans will contribute to the transformation of the Gold Coast, while ensuring its liveability into the future.
This Solid Waste Strategy 2024 (the Strategy) will complement other corporate strategies, and be implemented through a consistent program of collective planning, decision-making and performance measurement.
2 City of Gold Coast, 2014. Gold Coast 2020 – Bringing the City Vision to life. Corporate Plan. http://www.goldcoast.qld.gov.au/corporate-plan-documents-21359.html
4
Strategic alignmentThe Queensland Government released an industry-led state waste strategy in December 2014. The Waste – Everyone’s Responsibility, Queensland Waste Avoidance and Resource Productivity Strategy 2014-2024 3 (the state waste strategy) provides guiding principles and targets for improving waste management in Queensland. It proposes the introduction of mechanisms, such as voluntary industry action plans and regulation, to assist waste managers to meet the state’s waste reduction targets.
The Solid Waste Strategy 2024 outcomes align well with the objectives of the state waste strategy. Achieving the outcomes and targets outlined in the Solid Waste Strategy 2024 will contribute towards the Queensland Government reaching its state goals and targets for landfill diversion and recycling. Our strategy will also focus on a number of the same priority wastes, such as organic waste, plastics and building materials including concrete, as targeted by the state waste strategy.
Strategy scope This Strategy summarises the proposed strategic direction for solid waste management for the City from 2015 to 2024. It only considers current and future solid waste managed by City of Gold Coast, and not the solid waste and other wastes managed by private waste and recycling contractors on the Gold Coast.
The scale and success of the Strategy programs outlined are influenced and driven by the following:
• State and Federal Government waste policy and legislation
• funding availability
• cost and reliability of new technologies
• commodity prices
• available recovery markets
• community acceptance.
Unlike other Australian mainland states, there are no major funding programs at State Government level supporting the expansion of waste recovery projects (at time of publication). As new drivers emerge or change during the life of the strategy, the Strategy programs will be adapted accordingly.
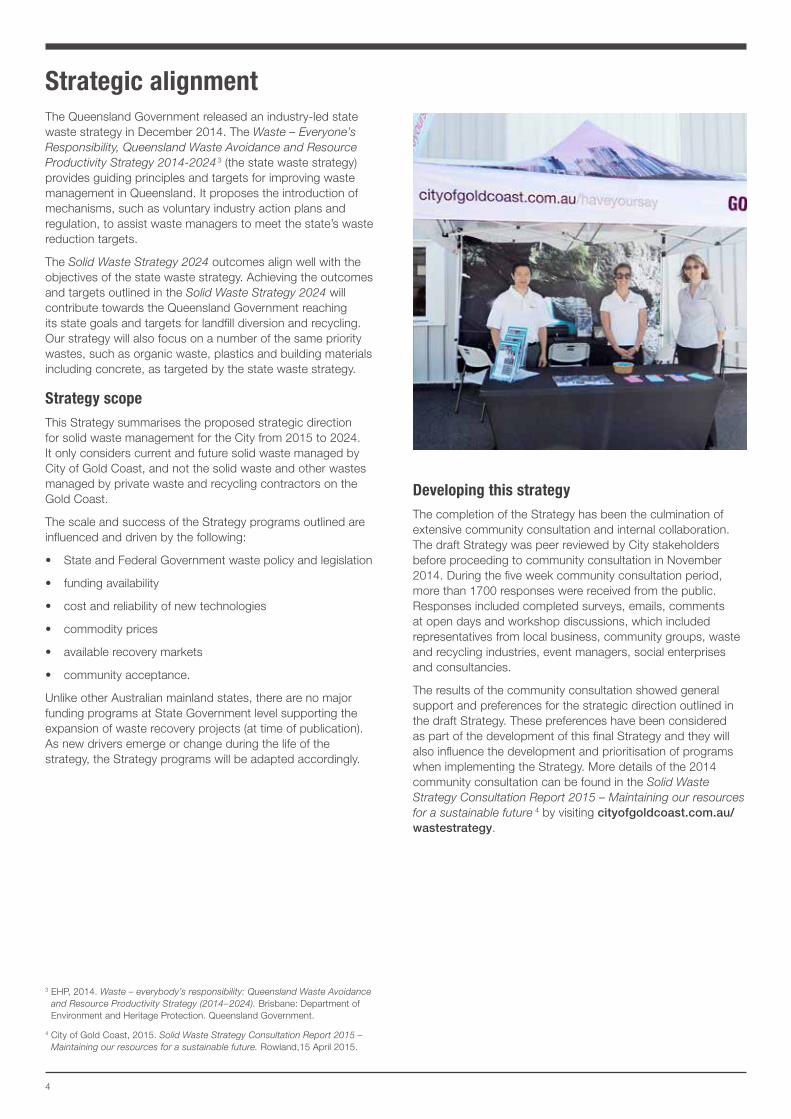
Developing this strategyThe completion of the Strategy has been the culmination of extensive community consultation and internal collaboration. The draft Strategy was peer reviewed by City stakeholders before proceeding to community consultation in November 2014. During the five week community consultation period, more than 1700 responses were received from the public. Responses included completed surveys, emails, comments at open days and workshop discussions, which included representatives from local business, community groups, waste and recycling industries, event managers, social enterprises and consultancies.
The results of the community consultation showed general support and preferences for the strategic direction outlined in the draft Strategy. These preferences have been considered as part of the development of this final Strategy and they will also influence the development and prioritisation of programs when implementing the Strategy. More details of the 2014 community consultation can be found in the Solid Waste Strategy Consultation Report 2015 – Maintaining our resources for a sustainable future 4 by visiting cityofgoldcoast.com.au/wastestrategy.
3 EHP, 2014. Waste – everybody’s responsibility: Queensland Waste Avoidance and Resource Productivity Strategy (2014–2024). Brisbane: Department of Environment and Heritage Protection. Queensland Government.
4 City of Gold Coast, 2015. Solid Waste Strategy Consultation Report 2015 – Maintaining our resources for a sustainable future. Rowland,15 April 2015.
5Solid Waste Strategy 2024
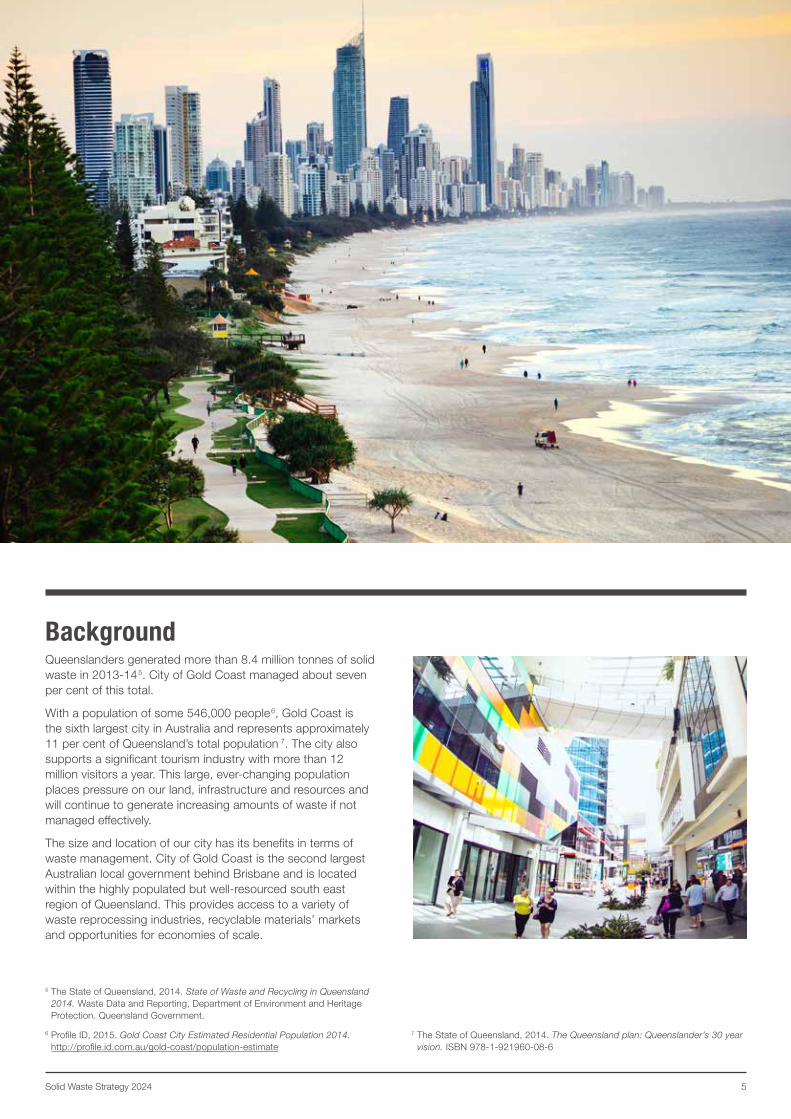
BackgroundQueenslanders generated more than 8.4 million tonnes of solid waste in 2013-145. City of Gold Coast managed about seven per cent of this total.
With a population of some 546,000 people6, Gold Coast is the sixth largest city in Australia and represents approximately 11 per cent of Queensland’s total population 7. The city also supports a significant tourism industry with more than 12 million visitors a year. This large, ever-changing population places pressure on our land, infrastructure and resources and will continue to generate increasing amounts of waste if not managed effectively.
The size and location of our city has its benefits in terms of waste management. City of Gold Coast is the second largest Australian local government behind Brisbane and is located within the highly populated but well-resourced south east region of Queensland. This provides access to a variety of waste reprocessing industries, recyclable materials’ markets and opportunities for economies of scale.
5 The State of Queensland, 2014. State of Waste and Recycling in Queensland 2014. Waste Data and Reporting, Department of Environment and Heritage Protection. Queensland Government.
6 Profile ID, 2015. Gold Coast City Estimated Residential Population 2014. http://profile.id.com.au/gold-coast/population-estimate
7 The State of Queensland, 2014. The Queensland plan: Queenslander’s 30 year vision. ISBN 978-1-921960-08-6
6
8 The State of Queensland (Queensland Department of Infrastructure and Planning), 2009. South East Queensland Regional Plan 2009-2023. Section 10.7. ISBN 978-0-9805449-1-6
9 Council of Mayors, 2010. SEQ Waste Infrastructure Review Stage 1 Report. Aurecon Australia 25 August 2010.
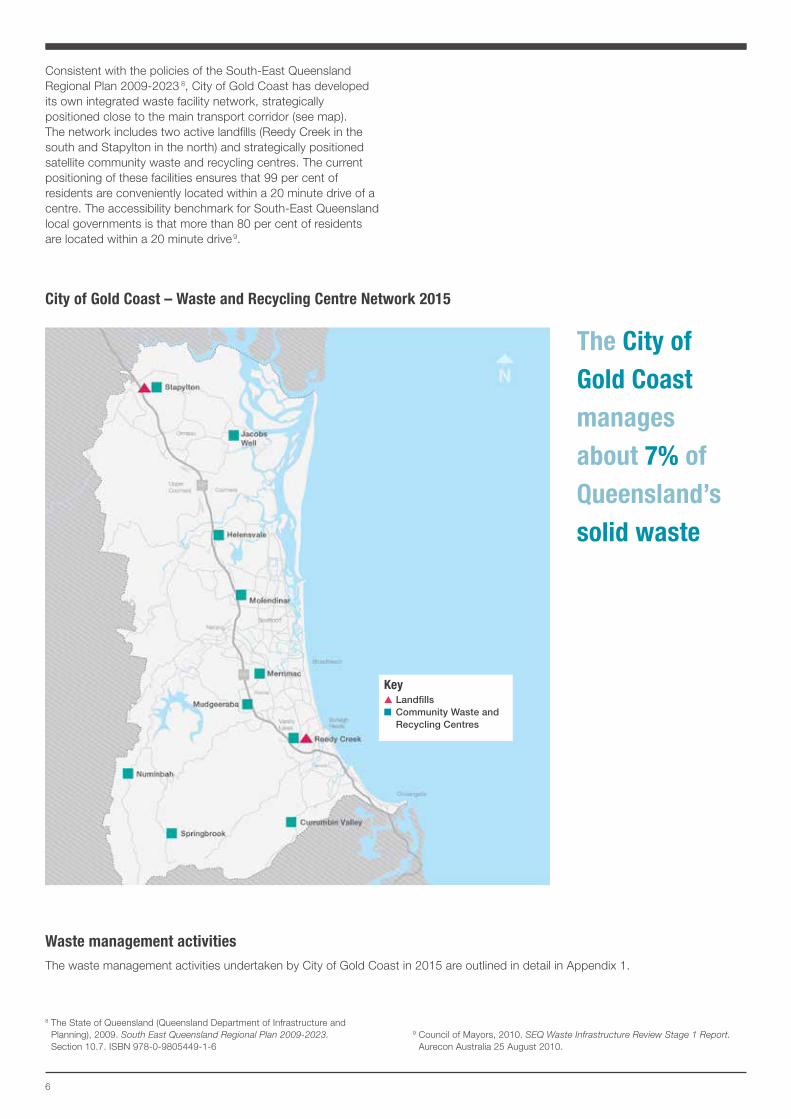
City of Gold Coast – Waste and Recycling Centre Network 2015
The City of Gold Coast manages about 7% of Queensland’s solid waste
Key▲Landfills■ Community Waste and
Recycling Centres
Consistent with the policies of the South-East Queensland Regional Plan 2009-2023 8, City of Gold Coast has developed its own integrated waste facility network, strategically positioned close to the main transport corridor (see map). The network includes two active landfills (Reedy Creek in the south and Stapylton in the north) and strategically positioned satellite community waste and recycling centres. The current positioning of these facilities ensures that 99 per cent of residents are conveniently located within a 20 minute drive of a centre. The accessibility benchmark for South-East Queensland local governments is that more than 80 per cent of residents are located within a 20 minute drive9.
Waste management activitiesThe waste management activities undertaken by City of Gold Coast in 2015 are outlined in detail in Appendix 1.
7Solid Waste Strategy 2024
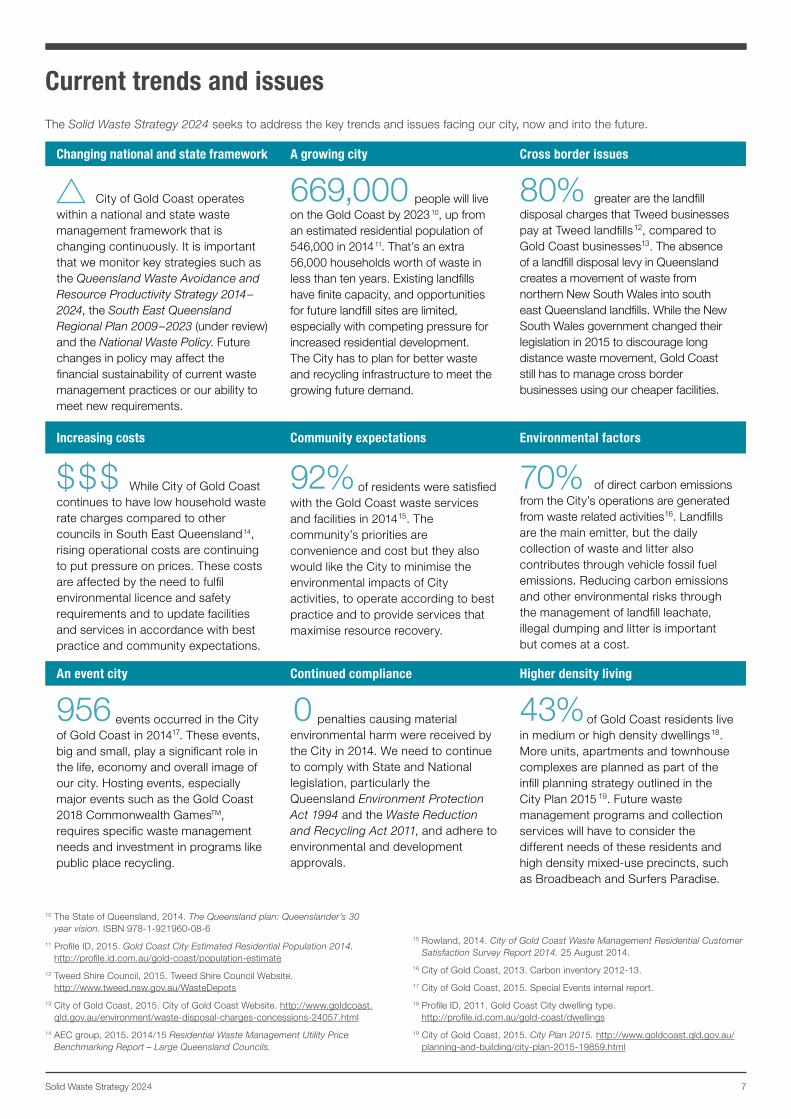
Current trends and issuesThe Solid Waste Strategy 2024 seeks to address the key trends and issues facing our city, now and into the future.
Changing national and state framework A growing city Cross border issues
City of Gold Coast operates within a national and state waste management framework that is changing continuously. It is important that we monitor key strategies such as the Queensland Waste Avoidance and Resource Productivity Strategy 2014–2024, the South East Queensland Regional Plan 2009–2023 (under review) and the National Waste Policy. Future changes in policy may affect the financial sustainability of current waste management practices or our ability to meet new requirements.
669,000 people will live on the Gold Coast by 202310, up from an estimated residential population of 546,000 in 201411. That’s an extra 56,000 households worth of waste in less than ten years. Existing landfills have finite capacity, and opportunities for future landfill sites are limited, especially with competing pressure for increased residential development. The City has to plan for better waste and recycling infrastructure to meet the growing future demand.
80% greater are the landfill disposal charges that Tweed businesses pay at Tweed landfills12, compared to Gold Coast businesses13. The absence of a landfill disposal levy in Queensland creates a movement of waste from northern New South Wales into south east Queensland landfills. While the New South Wales government changed their legislation in 2015 to discourage long distance waste movement, Gold Coast still has to manage cross border businesses using our cheaper facilities.
Increasing costs Community expectations Environmental factors
$$$ While City of Gold Coast continues to have low household waste rate charges compared to other councils in South East Queensland14, rising operational costs are continuing to put pressure on prices. These costs are affected by the need to fulfil environmental licence and safety requirements and to update facilities and services in accordance with best practice and community expectations.
92% of residents were satisfied with the Gold Coast waste services and facilities in 201415. The community’s priorities are convenience and cost but they also would like the City to minimise the environmental impacts of City activities, to operate according to best practice and to provide services that maximise resource recovery.
70% of direct carbon emissions from the City’s operations are generated from waste related activities16. Landfills are the main emitter, but the daily collection of waste and litter also contributes through vehicle fossil fuel emissions. Reducing carbon emissions and other environmental risks through the management of landfill leachate, illegal dumping and litter is important but comes at a cost.
An event city Continued compliance Higher density living
956 events occurred in the City of Gold Coast in 201417. These events, big and small, play a significant role in the life, economy and overall image of our city. Hosting events, especially major events such as the Gold Coast 2018 Commonwealth GamesTM, requires specific waste management needs and investment in programs like public place recycling.
0 penalties causing material environmental harm were received by the City in 2014. We need to continue to comply with State and National legislation, particularly the Queensland Environment Protection Act 1994 and the Waste Reduction and Recycling Act 2011, and adhere to environmental and development approvals.
43%of Gold Coast residents live in medium or high density dwellings18. More units, apartments and townhouse complexes are planned as part of the infill planning strategy outlined in the City Plan 2015 19. Future waste management programs and collection services will have to consider the different needs of these residents and high density mixed-use precincts, such as Broadbeach and Surfers Paradise.
10 The State of Queensland, 2014. The Queensland plan: Queenslander’s 30 year vision. ISBN 978-1-921960-08-6
11 Profile ID, 2015. Gold Coast City Estimated Residential Population 2014. http://profile.id.com.au/gold-coast/population-estimate
12 Tweed Shire Council, 2015. Tweed Shire Council Website. http://www.tweed.nsw.gov.au/WasteDepots
13 City of Gold Coast, 2015. City of Gold Coast Website. http://www.goldcoast.qld.gov.au/environment/waste-disposal-charges-concessions-24057.html
14 AEC group, 2015. 2014/15 Residential Waste Management Utility Price Benchmarking Report – Large Queensland Councils.
15 Rowland, 2014. City of Gold Coast Waste Management Residential Customer Satisfaction Survey Report 2014. 25 August 2014.
16 City of Gold Coast, 2013. Carbon inventory 2012-13.
17 City of Gold Coast, 2015. Special Events internal report.
18 Profile ID, 2011. Gold Coast City dwelling type. http://profile.id.com.au/gold-coast/dwellings
19 City of Gold Coast, 2015. City Plan 2015. http://www.goldcoast.qld.gov.au/planning-and-building/city-plan-2015-19859.html
8
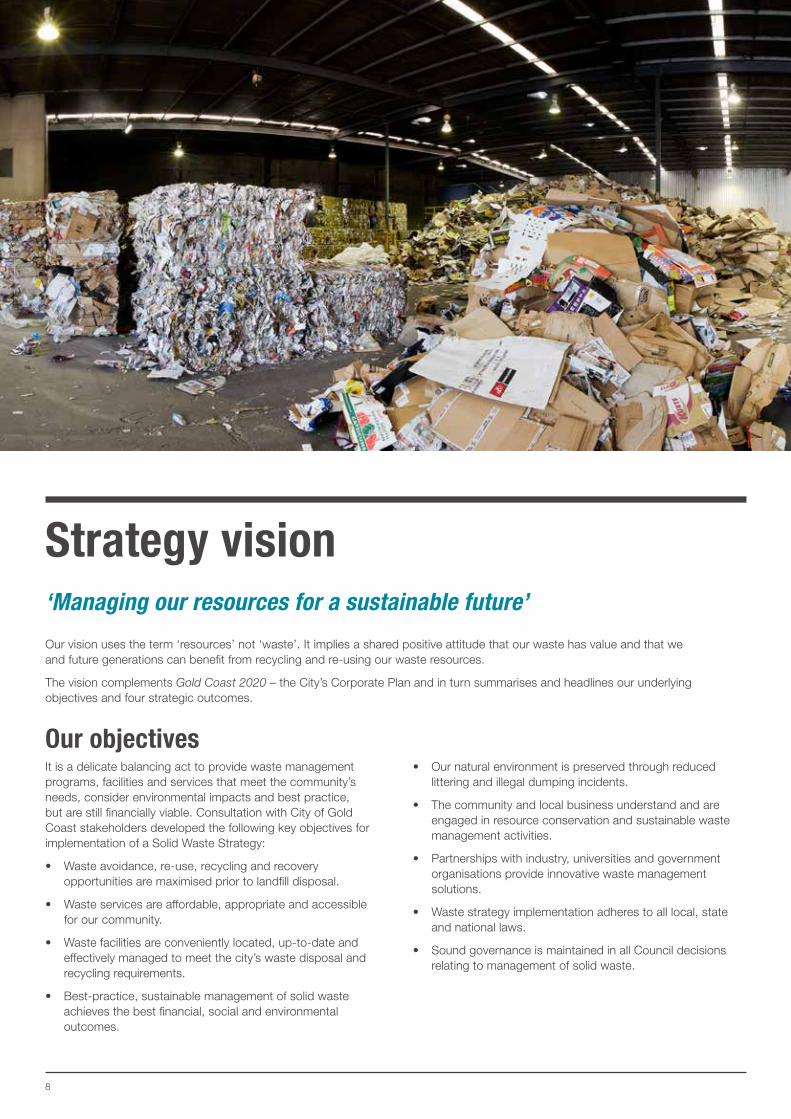
Strategy vision‘Managing our resources for a sustainable future’
Our vision uses the term ‘resources’ not ‘waste’. It implies a shared positive attitude that our waste has value and that we and future generations can benefit from recycling and re-using our waste resources.
The vision complements Gold Coast 2020 – the City’s Corporate Plan and in turn summarises and headlines our underlying objectives and four strategic outcomes.
Our objectivesIt is a delicate balancing act to provide waste management programs, facilities and services that meet the community’s needs, consider environmental impacts and best practice, but are still financially viable. Consultation with City of Gold Coast stakeholders developed the following key objectives for implementation of a Solid Waste Strategy:
• Waste avoidance, re-use, recycling and recovery opportunities are maximised prior to landfill disposal.
• Waste services are affordable, appropriate and accessible for our community.
• Waste facilities are conveniently located, up-to-date and effectively managed to meet the city’s waste disposal and recycling requirements.
• Best-practice, sustainable management of solid waste achieves the best financial, social and environmental outcomes.
• Our natural environment is preserved through reduced littering and illegal dumping incidents.
• The community and local business understand and are engaged in resource conservation and sustainable waste management activities.
• Partnerships with industry, universities and government organisations provide innovative waste management solutions.
• Waste strategy implementation adheres to all local, state and national laws.
• Sound governance is maintained in all Council decisions relating to management of solid waste.
9Solid Waste Strategy 2024
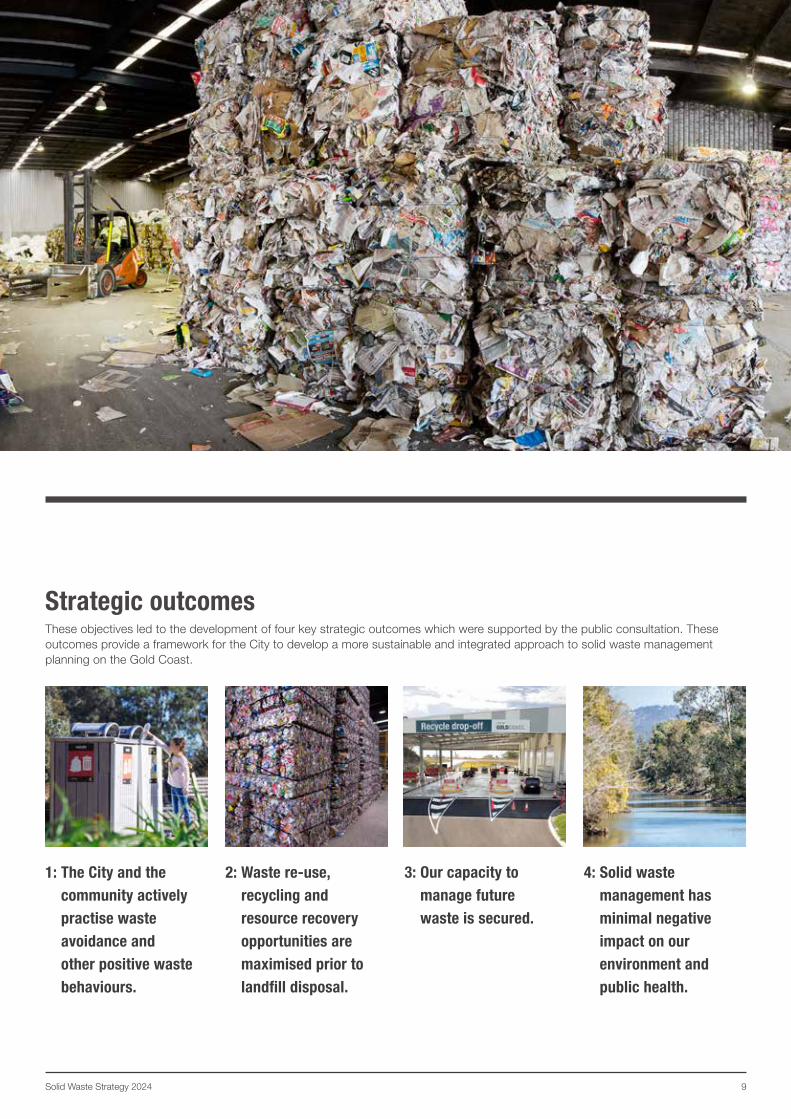
Strategic outcomesThese objectives led to the development of four key strategic outcomes which were supported by the public consultation. These outcomes provide a framework for the City to develop a more sustainable and integrated approach to solid waste management planning on the Gold Coast.
1: The City and the community actively practise waste avoidance and other positive waste behaviours.
2: Waste re-use, recycling and resource recovery opportunities are maximised prior to landfill disposal.
3: Our capacity to manage future waste is secured.
4: Solid waste management has minimal negative impact on our environment and public health.
10
11Solid Waste Strategy 2024
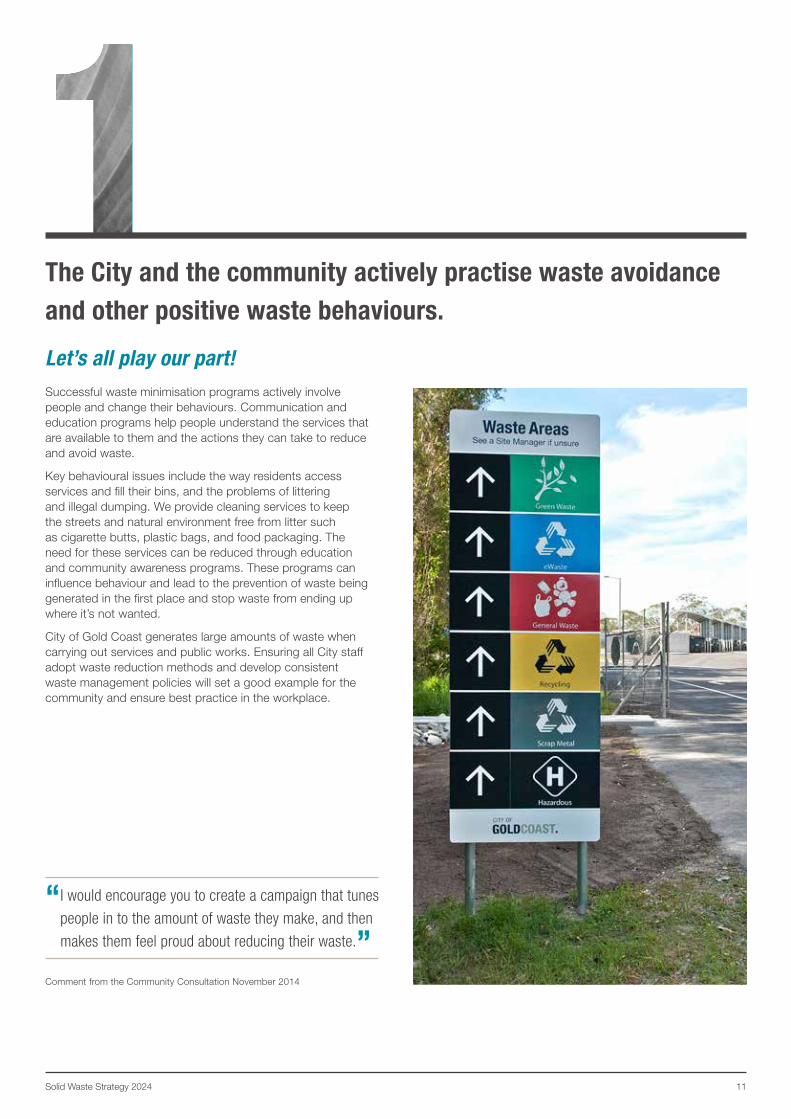
The City and the community actively practise waste avoidance and other positive waste behaviours.
Let’s all play our part!Successful waste minimisation programs actively involve people and change their behaviours. Communication and education programs help people understand the services that are available to them and the actions they can take to reduce and avoid waste.
Key behavioural issues include the way residents access services and fill their bins, and the problems of littering and illegal dumping. We provide cleaning services to keep the streets and natural environment free from litter such as cigarette butts, plastic bags, and food packaging. The need for these services can be reduced through education and community awareness programs. These programs can influence behaviour and lead to the prevention of waste being generated in the first place and stop waste from ending up where it’s not wanted.
City of Gold Coast generates large amounts of waste when carrying out services and public works. Ensuring all City staff adopt waste reduction methods and develop consistent waste management policies will set a good example for the community and ensure best practice in the workplace.
“ I would encourage you to create a campaign that tunes
people in to the amount of waste they make, and then
makes them feel proud about reducing their waste.”
Comment from the Community Consultation November 2014
12
What are our key actions?
Action Detail
1.1 Develop and deliver a communication action plan to engage the community, business and schools in recycling and waste avoidance.
The aim of this action is to provide a communication plan with incentives and other tools for individuals that assist and encourage them to make real changes in their waste behaviours.
The plan will focus on improving people’s ability to recycle properly and use the available services and facilities, as well as encouraging waste avoidance and discouraging anti-social waste behaviours like littering.
Specific communication programs will include:
• schools and early learning centres
• City staff recycling and waste reduction (Action 1.2)
• changing littering behaviour (Action 1.3)
• home composting for the community (Action 2.2)
• changing community recycling behaviour (Action 2.2, 2.4, 2.5, 2.6, 2.7, 4.1)
• organics recycling and waste reduction techniques for businesses (Action 2.8)
• hazardous waste disposal (Action 4.1).
1.2 Expand waste reduction and diversion programs for City of Gold Coast activities.
It is important that City of Gold Coast sets a good example and adopts best practice for reducing and recycling waste. The majority of the City’s operational solid waste is produced from the construction and maintenance of roads, facilities, waterways and other assets. It mostly consists of asphalt, concrete, masonry, steel, timber off-cuts, soil and other fill, but can also include green waste, dredge spoil, sand and biosolids. General waste is also produced at our administration centres and depots. This can include food waste, office consumables, packaging, obsolete equipment and plant, broken furniture and fittings, spent lighting and personal items.
The focus of this action is to divert re-usable and recyclable wastes away from landfill. We will:
• develop an operational waste diversion program that will consider waste types and available re-use options, project coordination and purchasing practices
• develop an office waste efficiency program, including improving staff knowledge and behaviours through targeted training (Action 1.1).
1.3 Develop and deliver a litter and illegal dumping reduction plan.
Cleaning up litter and illegal dumping is a significant cost burden on the ratepayer each year. While the City and State Government have penalties for littering and illegal dumping, these alone will not change the situation, as finding the offenders is often difficult. The two main tools available to the City to try to change these antisocial behaviours are community engagement and enforcement.
We intend to :
• develop a litter and illegal dumping reduction plan that will provide a coordinated communication campaign aimed at bringing this issue to the community’s attention
• educate locals and visitors on the correct waste disposal behaviour (Action 1.1)
• reduce litter and illegal dumping at identified hotspots
13Solid Waste Strategy 2024
Targets
Performance measured by: 2015 Baseline 2019 2024
Domestic collected waste disposed per household (kg per household per year)*
737 710 680
Domestic self-hauled waste disposed per household (kg per household per year)*
277 240 220
Domestic resource recovery rate for collected recyclables (%)
65 70 75
Illegally dumped waste collected by the City (tonnes)
557 510 470
City of Gold Coast waste recycled/ recovered (% of total City waste)
86 More than 90 More than 90
*does not include recyclables
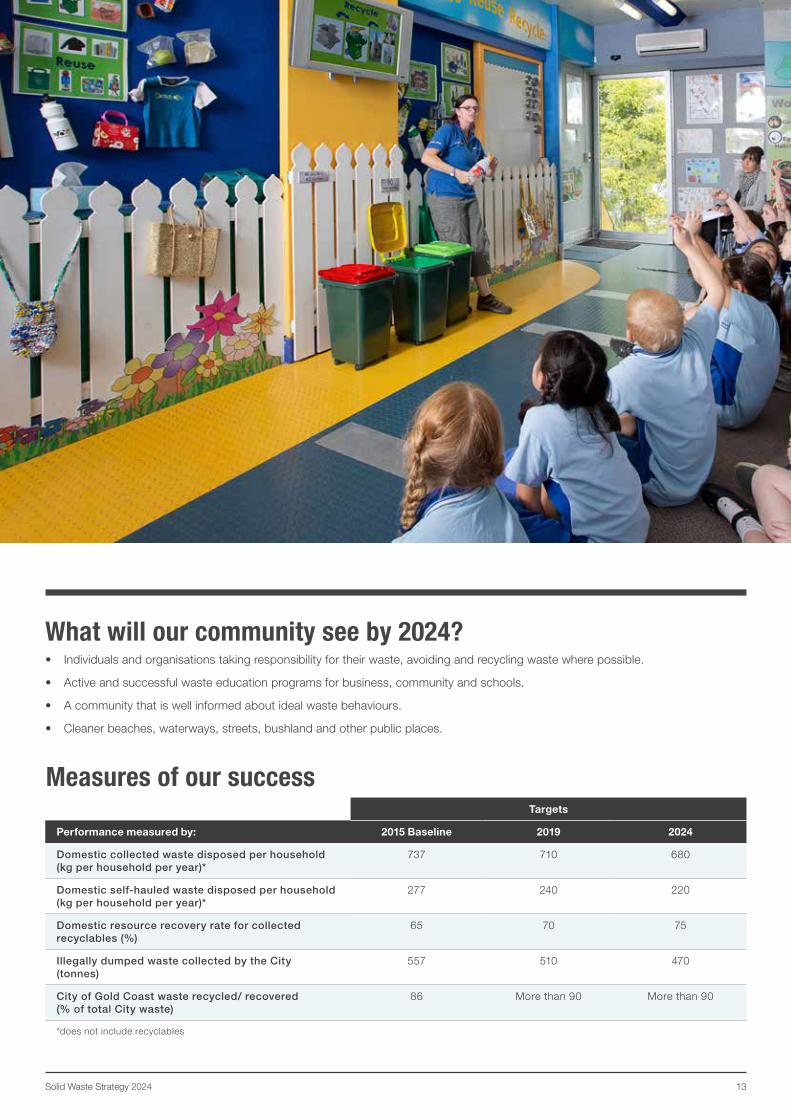
What will our community see by 2024?• Individuals and organisations taking responsibility for their waste, avoiding and recycling waste where possible.
• Active and successful waste education programs for business, community and schools.
• A community that is well informed about ideal waste behaviours.
• Cleaner beaches, waterways, streets, bushland and other public places.
Measures of our success
14
Waste hierarchy
15Solid Waste Strategy 2024
Waste re-use, recycling and recovery opportunities are maximised prior to landfill disposal
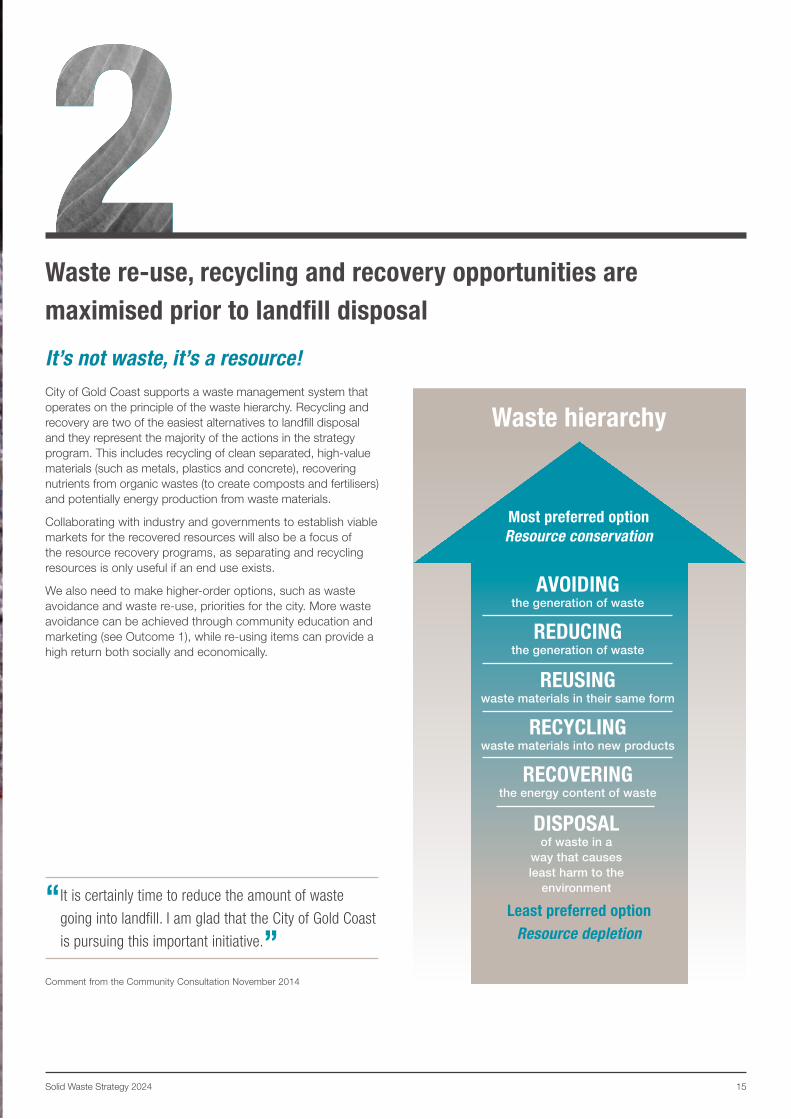
It’s not waste, it’s a resource!City of Gold Coast supports a waste management system that operates on the principle of the waste hierarchy. Recycling and recovery are two of the easiest alternatives to landfill disposal and they represent the majority of the actions in the strategy program. This includes recycling of clean separated, high-value materials (such as metals, plastics and concrete), recovering nutrients from organic wastes (to create composts and fertilisers) and potentially energy production from waste materials.
Collaborating with industry and governments to establish viable markets for the recovered resources will also be a focus of the resource recovery programs, as separating and recycling resources is only useful if an end use exists.
We also need to make higher-order options, such as waste avoidance and waste re-use, priorities for the city. More waste avoidance can be achieved through community education and marketing (see Outcome 1), while re-using items can provide a high return both socially and economically.
“ It is certainly time to reduce the amount of waste
going into landfill. I am glad that the City of Gold Coast
is pursuing this important initiative.”
Comment from the Community Consultation November 2014
Least preferred option Resource depletion
Most preferred option Resource conservation
AVOIDING the generation of waste
REDUCING the generation of waste
REUSINGwaste materials in their same form
RECYCLING waste materials into new products
RECOVERING the energy content of waste
DISPOSALof waste in a
way that causes least harm to the
environment
Waste hierarchy
16
What are our key actions?
Action Detail
2.1 Expand the collection of organic waste
Food and other compostable waste (organic waste) represent more than half of the weight in our residential waste bin. By providing convenient collection services for organic waste, we can save this nutrient-rich resource from being wasted in landfill.
We propose to:
• expand the green waste collection service to be accessible to more suburban homes (including rental properties), businesses and schools
• trial food waste collection systems within selected suburbs and food waste producing businesses. This project will be complemented by the testing of different organic waste processing techniques to recycle the collected organics (see Action 3.1)
• if trialling is successful, the option of a city wide organics collection (green waste and food waste) service may be feasible during the strategy term.
2.2 Establish waste diversion programs for priority wastes.
Our priority wastes are green waste, timber and wood waste, food waste, paper and cardboard, plastics, metals, building materials and construction soils and fill. By weight, these waste types represent two thirds of all waste going to our landfills. Preventing these resources being lost to landfill will be the action that will contribute most to achieving the Strategy resource recovery targets.
This action includes an organic waste program, comingled recycling program and construction waste program.
As organic wastes represent the majority of priority wastes, we will develop:
• a specific organic waste action plan in consultation with business and the community
• processing options for the extra collected organic waste in conjunction with the organic waste collection trials (Action 2.1 and 2.9)
• additional programs for reducing food waste, such as wide-reaching educational programs to help residents compost successfully at home (Action 1.1).
The comingled recycling program aims to improve the recovery of paper, cardboard, metals and plastic containers. These recyclables account for about one quarter of the materials in the residential waste bin. We intend to:
• collect more comingled resources mainly through promotion of the larger 360 litre recycling bin and increased recycling education (Action 1.1)
• conduct neighbourhood/suburb trials and/or incentive programs (Action 2.3).
The construction waste program will focus on separating and processing recyclable building and demolition materials. We will undertake projects to increase recovery of concrete, untreated timber and wood waste, steel, aluminium, asphalt, soils and fill (Action 1.2 and 2.8).
2.3 Investigate pricing and other incentives to encourage better resource recovery.
Pricing can be used to promote positive individual action on recycling. Also the use of incentives is a popular request from the public and businesses.
We propose to:
• investigate pricing options for individual bins and bin sets that encourage recycling
• use incentives such as competitions, prizes and vouchers to encourage residents to take up optional bin services like the green waste bin or the larger recycling bin
• investigate the use of regulation, subsidies and grants as incentives.
17Solid Waste Strategy 2024
Action Detail
2.4 Increase resource recovery at waste management facilities.
Nearly 60 percent of the total waste managed by the City is delivered to waste and recycling centres. Through better sorting and separation, a significant amount of recyclables delivered to centres could be diverted from landfill.
We intend to improve resource recovery by:
• promoting available recycling options
• undertaking cost benefit analysis and audits to identify progress and any opportunities for developing new or expanding recovery programs at facilities.
2.5 Improve capacity for recycling in units and high rise apartments.
Nearly half (43 per cent in 2015) of residents on the Gold Coast live in units or apartments. This figure is expected to rise as available land for residential development becomes scarce. Recycling for multi-unit dwellings is optional, so there is an opportunity to increase recycling by encouraging this sector to increase recycling collection services.
We plan to:
• increase active participation in the high-rise recycling program to improve on-site recycling with residents and visitors
• expand the high-rise recycling program to office buildings and smaller unit blocks through targeted marketing
• trial food waste collections specifically designed for multi-unit dwellings (Action 2.1)
• investigate the inclusion of recycling chutes in new developments.
2.6 Establish recycling in public places.
Recycling bins in high use public places and at events was the most requested new recycling initiative during the community consultation (95 per cent of respondents). While public place recycling collects a relatively small amount of recyclables compared to kerbside collections, it gives residents and visitors the ability to continue their good recycling habit away from home.
We intend to develop a staged city-wide public place recycling program. We will see:
• new recycling bins and enclosures installed in high use public locations in 2016-17
• further assessment of additional sites to install more public place bins prior to the Gold Coast 2018 Commonwealth GamesTM (Action 2.7).
18
What are our key actions?
Action Detail
2.7 Establish recycling and waste reduction programs for the Gold Coast 2018 Commonwealth GamesTM and other local events.
Recycling programs that reduce waste from major events held in the city was the second most requested new recycling initiative in the community consultation (93 per cent). Recyclable wastes produced at our local events are commonly not recycled. This is due to the absence of recycling bins at events, or if provided, the improper use of the recycling bins by the public.
We propose to:
• develop a waste-wise events program to make it easier for event managers to include recycling at their events and help the community recycle correctly
• conduct recycling trials with City-managed events.
The Gold Coast 2018 Commonwealth GamesTM will require additional commitments to reduce waste and increase recycling before and after the event. Trialling of new waste collection systems, processing techniques and technologies will ensure the success of waste management operations during the event.
To further reduce waste and litter for the Commonwealth Games, we will:
• install public place recycling bins in high-use public spaces (Action 2.6)
• develop a food waste collection system for City venues and selected visitor accommodation precincts (Action 2.1)
• develop education campaigns to increase knowledge for residents and visitors about public place recycling and food waste recycling.
The new waste management systems developed for the Games will be a lasting legacy for the city.
2.8 Establish services and resources to assist businesses to minimise waste to landfill.
The community consultation business survey showed that reliable waste collection (70 per cent) and cost effective recycling services (64 per cent) are most important to businesses. It also showed that businesses are most interested in initiatives such as shared food waste programs (64 per cent), waste and recycling education (63 per cent) and waste management guidelines and policies for events (63 per cent). Businesses want assistance from the City through more education, incentives, rewards and additional recycling services.
We will:
• develop a general services information pack and action program for business (Action 1.1)
• develop awareness campaigns for residential and commercial visitors to waste and recycling centres to assist better sorting of waste loads (Action 1.1);
• collaborate with selected food business districts, trialling food waste collection systems and engaging with them about organic waste reduction options (Action 2.1, 2.2 and 2.7)
• investigate the introduction of incentives such as business grants to improve waste minimisation through innovative process changes (Action 2.3).
2.9 Support potential markets for recovered resources through collaboration with industry and business.
Increasing the amounts of green waste, food waste and other recyclables collected will not be effective unless there is a suitable market to receive these resources. Some recyclables like metals and plastic containers have strong existing markets. Other materials, such as green waste or glass, have lower value or only developing markets and may need initial investment until a market can mature. The City will be the provider of a large reliable supply of different recovered resources, and therefore has the potential to support the establishment and growth of local recycling industries.
We intend to :
• seek out viable market options for new recovery programs, especially organic wastes (Action 2.1, 2.2 and 3.1)
• support market creation through purchasing, contracts and investment in industry and certain technologies.
19Solid Waste Strategy 2024
Targets
Performance measured by: 2015 Baseline 2019 2024
Total waste recycled or recovered (%) 40 45 60
Total domestic waste recycled or recovered (%) 29 35 55
Total commercial & industrial (C&I) waste recycled or recovered (%)
20 25 40
Total construction & demolition (C&D) waste recycled or recovered (%)
95 more than 95 more than 95
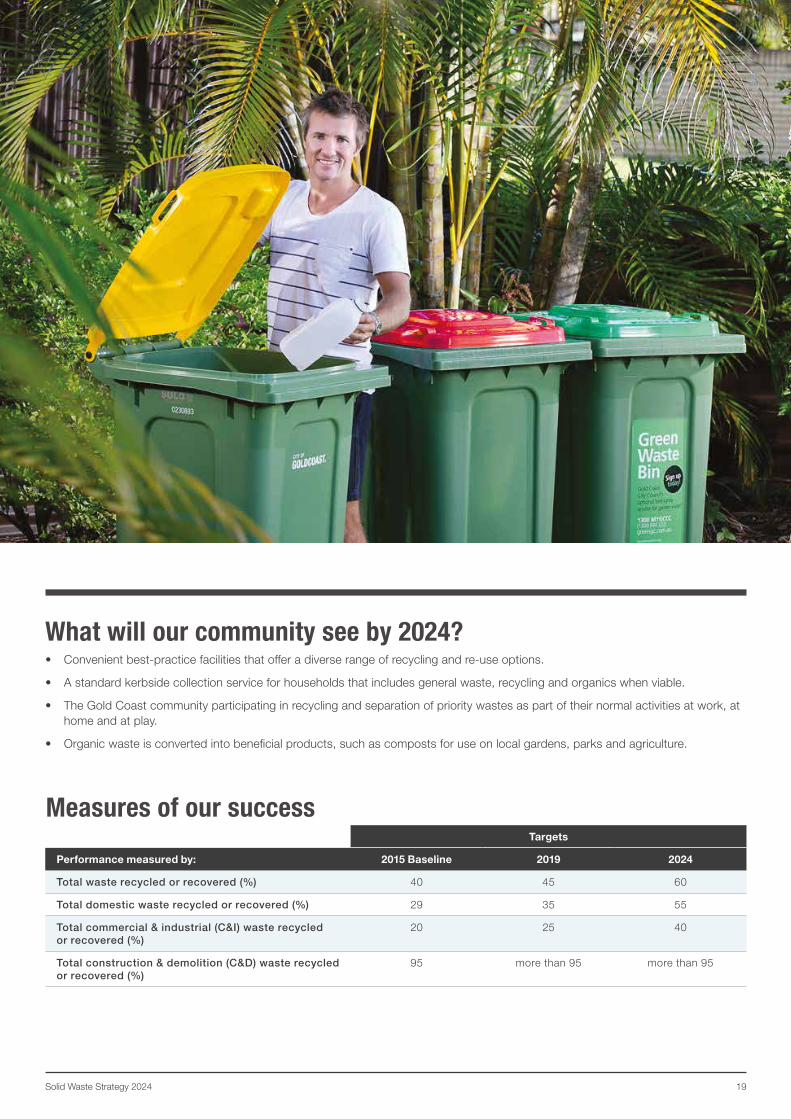
What will our community see by 2024?• Convenient best-practice facilities that offer a diverse range of recycling and re-use options.
• A standard kerbside collection service for households that includes general waste, recycling and organics when viable.
• The Gold Coast community participating in recycling and separation of priority wastes as part of their normal activities at work, at home and at play.
• Organic waste is converted into beneficial products, such as composts for use on local gardens, parks and agriculture.
Measures of our success
20
21Solid Waste Strategy 2024
Our capacity to manage future waste is secured
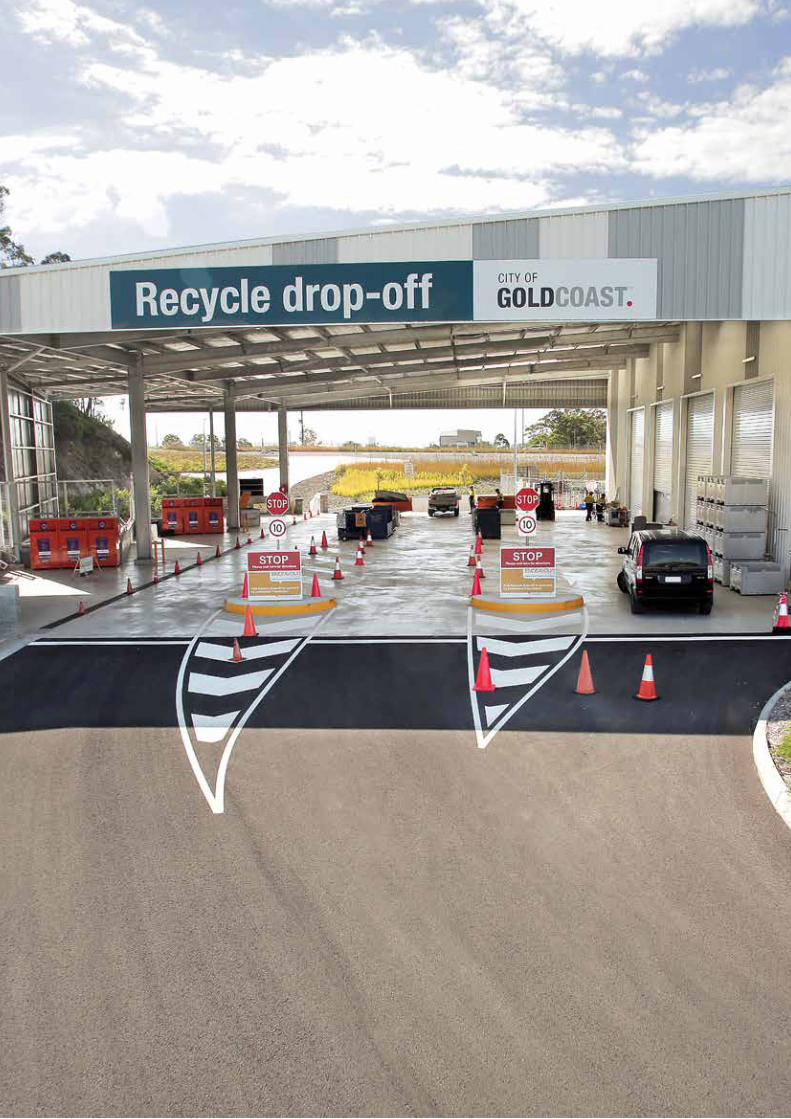
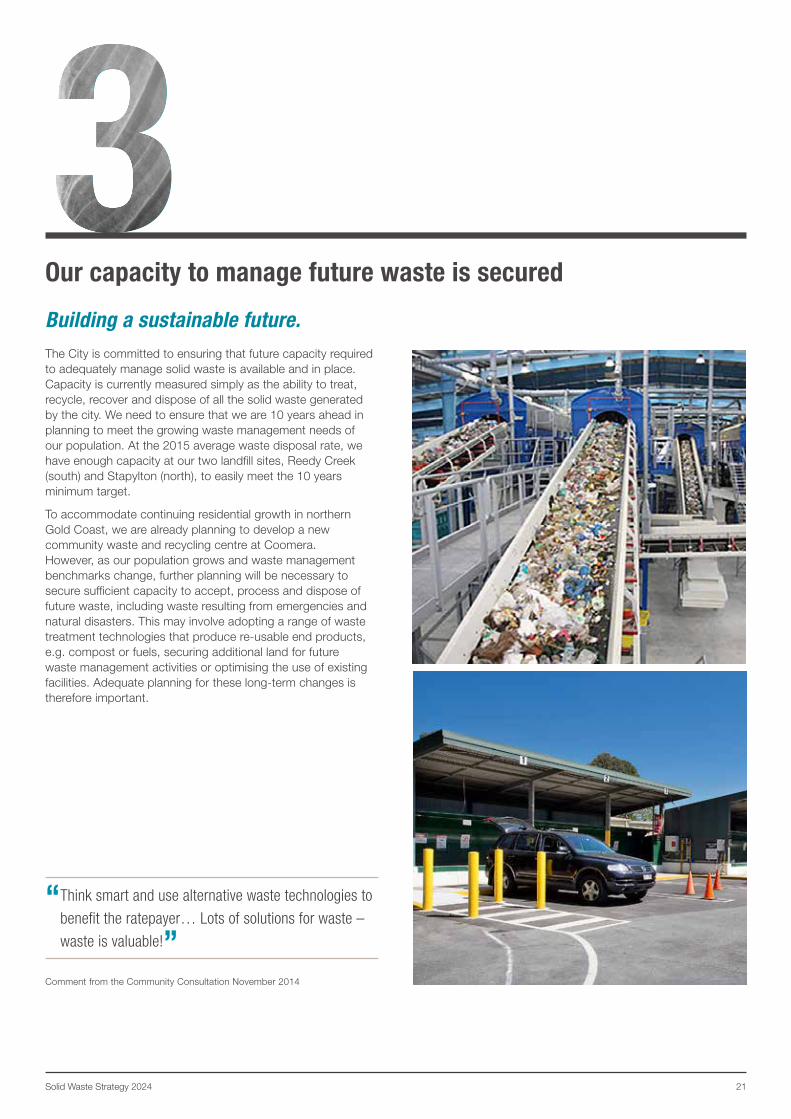
Building a sustainable future.The City is committed to ensuring that future capacity required to adequately manage solid waste is available and in place. Capacity is currently measured simply as the ability to treat, recycle, recover and dispose of all the solid waste generated by the city. We need to ensure that we are 10 years ahead in planning to meet the growing waste management needs of our population. At the 2015 average waste disposal rate, we have enough capacity at our two landfill sites, Reedy Creek (south) and Stapylton (north), to easily meet the 10 years minimum target.
To accommodate continuing residential growth in northern Gold Coast, we are already planning to develop a new community waste and recycling centre at Coomera. However, as our population grows and waste management benchmarks change, further planning will be necessary to secure sufficient capacity to accept, process and dispose of future waste, including waste resulting from emergencies and natural disasters. This may involve adopting a range of waste treatment technologies that produce re-usable end products, e.g. compost or fuels, securing additional land for future waste management activities or optimising the use of existing facilities. Adequate planning for these long-term changes is therefore important.
“ Think smart and use alternative waste technologies to
benefit the ratepayer… Lots of solutions for waste –
waste is valuable!”
Comment from the Community Consultation November 2014
22
What are our key actions?
Action Detail
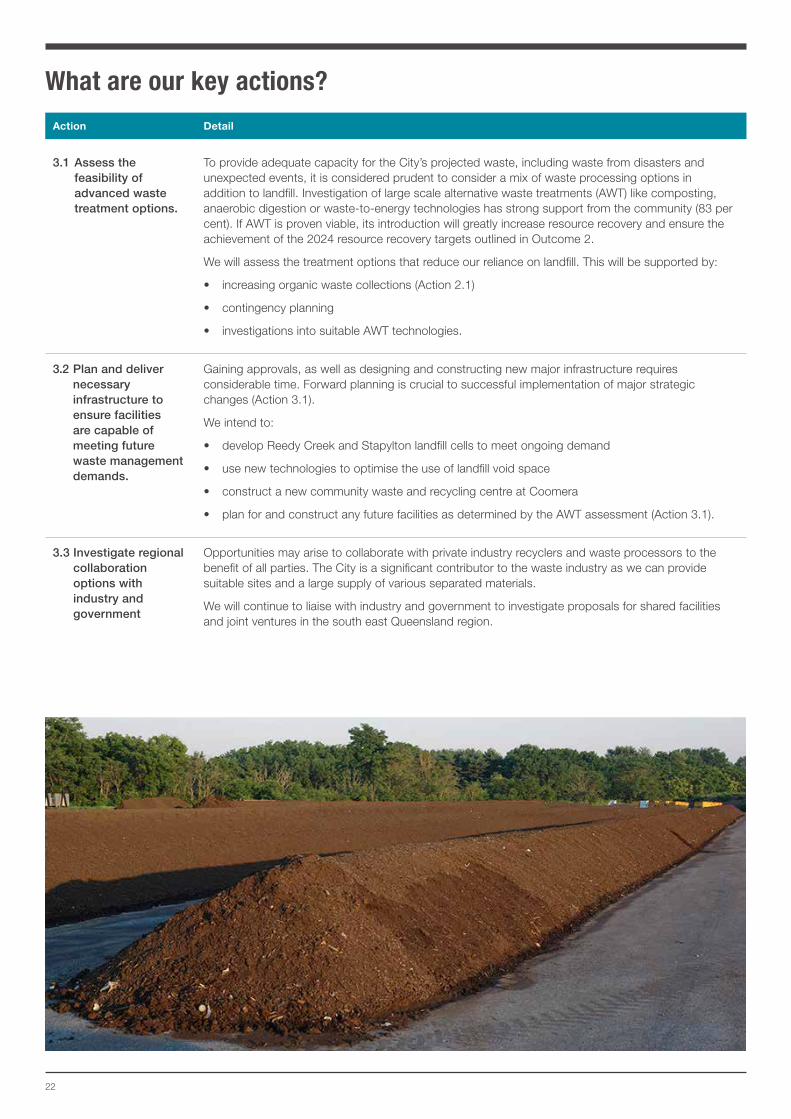
3.1 Assess the feasibility of advanced waste treatment options.
To provide adequate capacity for the City’s projected waste, including waste from disasters and unexpected events, it is considered prudent to consider a mix of waste processing options in addition to landfill. Investigation of large scale alternative waste treatments (AWT) like composting, anaerobic digestion or waste-to-energy technologies has strong support from the community (83 per cent). If AWT is proven viable, its introduction will greatly increase resource recovery and ensure the achievement of the 2024 resource recovery targets outlined in Outcome 2.
We will assess the treatment options that reduce our reliance on landfill. This will be supported by:
• increasing organic waste collections (Action 2.1)
• contingency planning
• investigations into suitable AWT technologies.
3.2 Plan and deliver necessary infrastructure to ensure facilities are capable of meeting future waste management demands.
Gaining approvals, as well as designing and constructing new major infrastructure requires considerable time. Forward planning is crucial to successful implementation of major strategic changes (Action 3.1).
We intend to:
• develop Reedy Creek and Stapylton landfill cells to meet ongoing demand
• use new technologies to optimise the use of landfill void space
• construct a new community waste and recycling centre at Coomera
• plan for and construct any future facilities as determined by the AWT assessment (Action 3.1).
3.3 Investigate regional collaboration options with industry and government
Opportunities may arise to collaborate with private industry recyclers and waste processors to the benefit of all parties. The City is a significant contributor to the waste industry as we can provide suitable sites and a large supply of various separated materials.
We will continue to liaise with industry and government to investigate proposals for shared facilities and joint ventures in the south east Queensland region.
23Solid Waste Strategy 2024
Targets
Performance measured by: 2015 Baseline 2019 2024
Waste infrastructure capacity (years) more than 10 years more than 10 years more than 10 years
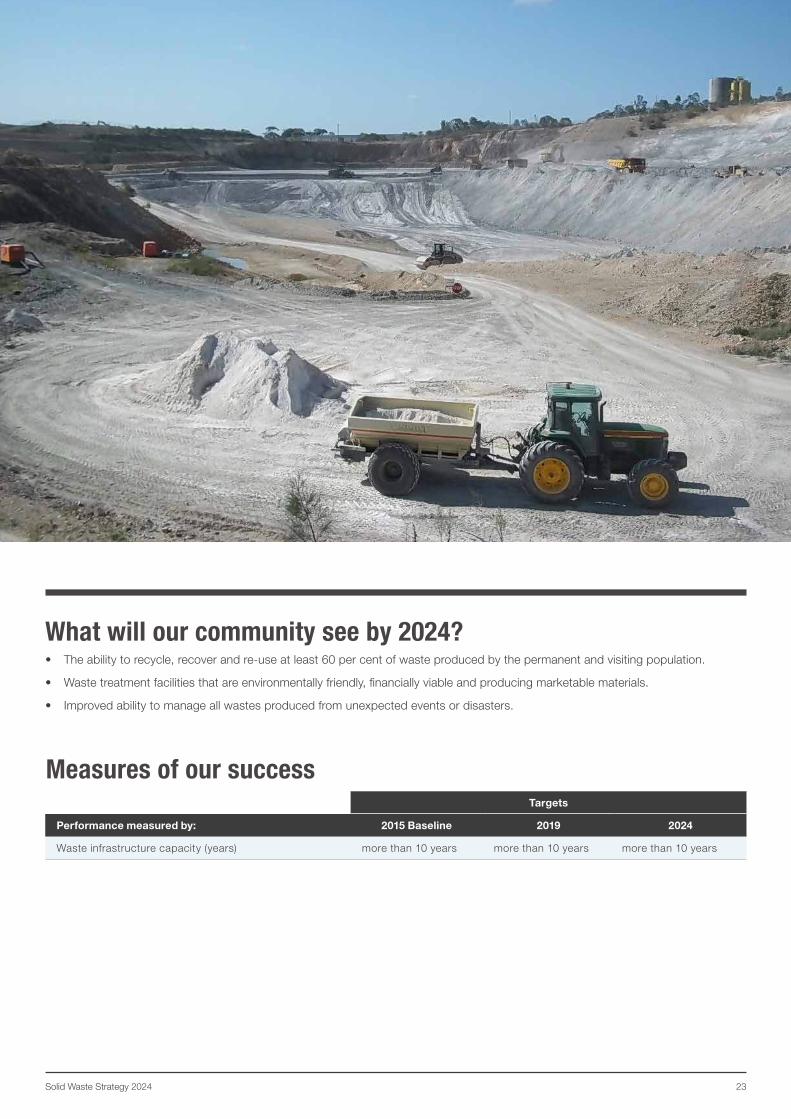
What will our community see by 2024?• The ability to recycle, recover and re-use at least 60 per cent of waste produced by the permanent and visiting population.
• Waste treatment facilities that are environmentally friendly, financially viable and producing marketable materials.
• Improved ability to manage all wastes produced from unexpected events or disasters.
Measures of our success
24
25Solid Waste Strategy 2024
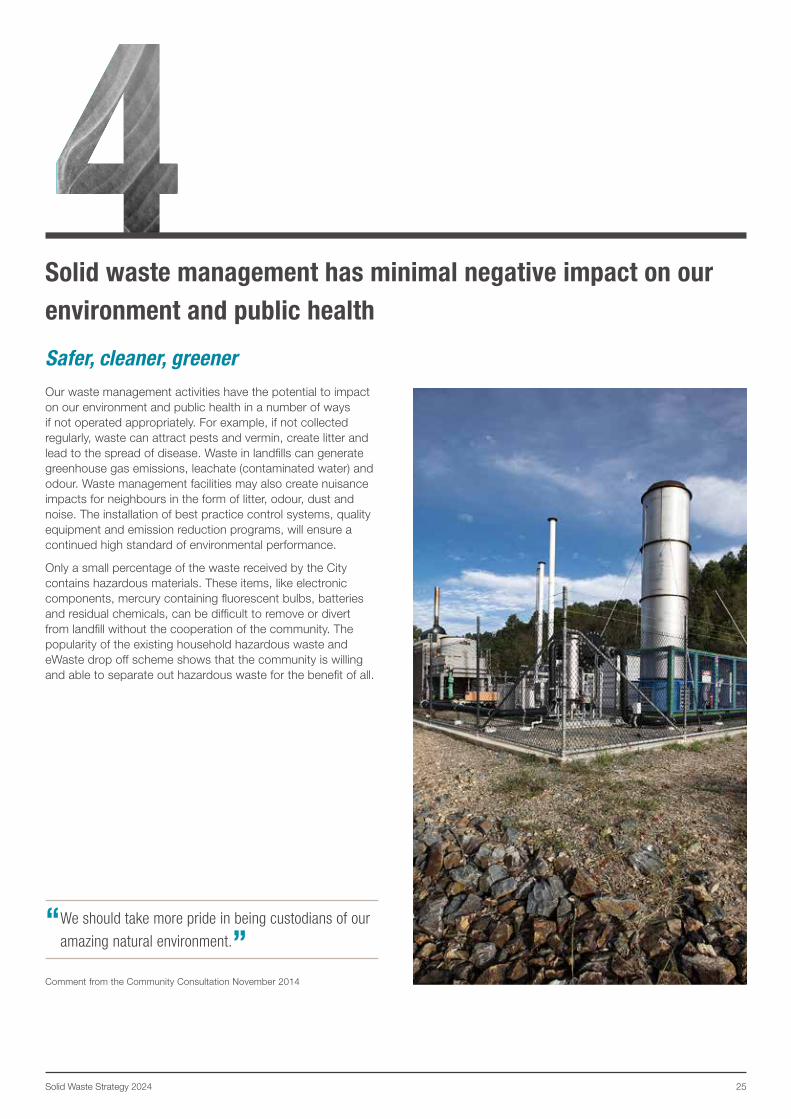
Solid waste management has minimal negative impact on our environment and public health
Safer, cleaner, greenerOur waste management activities have the potential to impact on our environment and public health in a number of ways if not operated appropriately. For example, if not collected regularly, waste can attract pests and vermin, create litter and lead to the spread of disease. Waste in landfills can generate greenhouse gas emissions, leachate (contaminated water) and odour. Waste management facilities may also create nuisance impacts for neighbours in the form of litter, odour, dust and noise. The installation of best practice control systems, quality equipment and emission reduction programs, will ensure a continued high standard of environmental performance.
Only a small percentage of the waste received by the City contains hazardous materials. These items, like electronic components, mercury containing fluorescent bulbs, batteries and residual chemicals, can be difficult to remove or divert from landfill without the cooperation of the community. The popularity of the existing household hazardous waste and eWaste drop off scheme shows that the community is willing and able to separate out hazardous waste for the benefit of all.
“ We should take more pride in being custodians of our
amazing natural environment.”
Comment from the Community Consultation November 2014
26
What are our key actions?
Action Detail
4.1 Develop hazardous waste diversion programs for electronic waste, batteries, chemicals, mercury containing lamps and other hazardous waste.
Reducing hazardous waste is a priority for our community. Some hazardous wastes are easy and safe to recycle, such as electronic waste (eWaste). Other hazards, such as used sharps and other medical wastes, containers of unwanted chemicals, spent handheld batteries and fluorescent tubes are frequently placed in waste bins and are difficult to detect or remove before they are landfilled.
We propose to:
• further develop current hazardous waste diversion programs for eWaste, household hazardous waste, car batteries and sharps
• develop a communications campaign about the available options to safely dispose of hazardous materials (Action 1.1).
4.2 Implement best practice landfill gas capture systems at landfill sites.
The greenhouse gas emissions from landfills represent the majority of carbon emissions from the City of Gold Coast. By reducing the amount of organic materials in landfill (Action 2.1 and 2.2), the production of landfill gases is reduced but not eliminated. To further reduce carbon emissions, we propose to extract the landfill gas and convert it to electricity for an increasing number of homes on the local power grid.
4.3 Implement best practice leachate management at landfill sites.
The way a landfill is designed, constructed and managed contributes to the amount of leachate (contaminated water) that is generated and how well it is contained. Modern engineered liners and walls, as well as good stormwater diversion systems, can protect groundwater and local surface waters from leachate contamination.
We intend to:
• change the character of our operating landfills by reducing the organic material that is received (Action 2.1 and 2.2)
• improve our leachate management systems.
4.4 Implement best practice collection services to protect public health and amenity.
Collecting and disposing of waste is traditionally a primary function of local government to ensure our streets are clean and the spread of disease is limited. This is still the aim for modern waste management, but as the majority of residents (more than 92 per cent) are already satisfied with the various collection services20, the modern focus is more on local amenity and environmental improvements.
We propose to:
• investigate the introduction of quieter, low emission collection vehicles for the next collection contract
• establish and maintain defined waste precincts in higher density areas. This has the effect of reducing the number of waste collection contractors servicing these areas hence reducing issues related to traffic, noise and fossil fuel emissions
• investigate other ways to reduce noise and traffic, such as underground waste storage capacity or shared recycling facilities in built-up areas.
20 Rowland, 2014. City of Gold Coast Waste Management Residential Customer Satisfaction Survey Report 2014. 25 August 2014.
27Solid Waste Strategy 2024
Targets
Performance measured by: 2015 Baseline 2019 2024
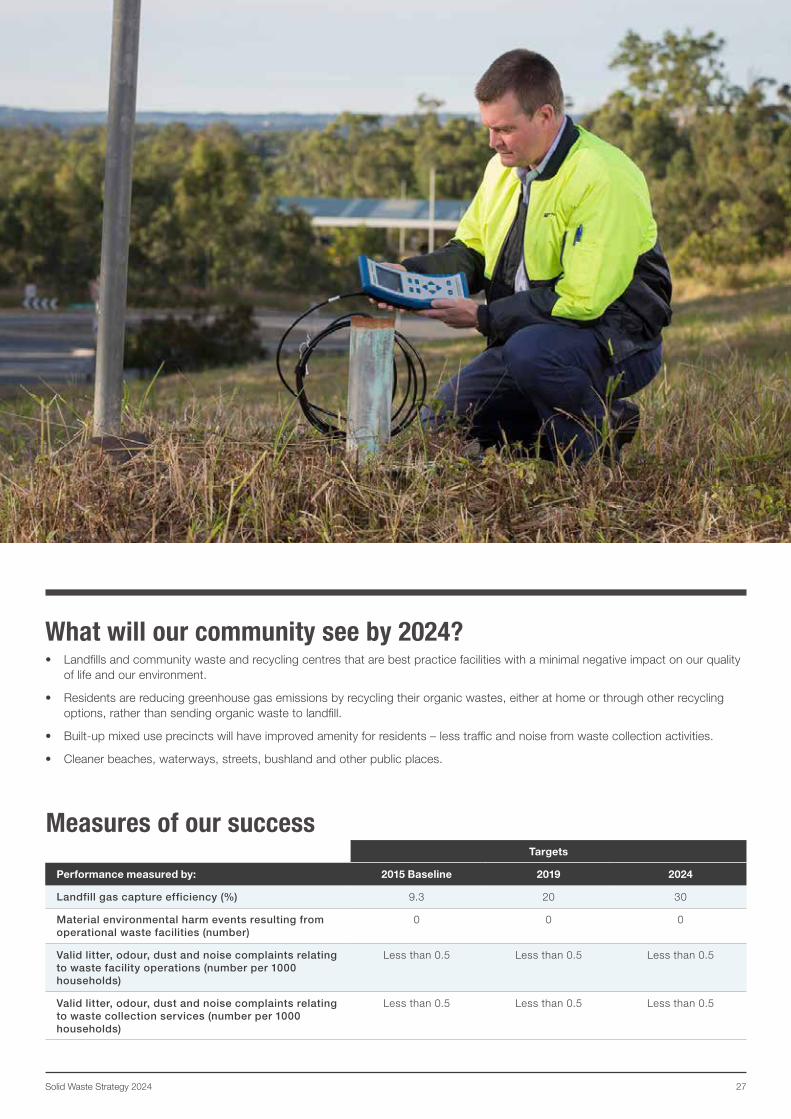
Landfill gas capture efficiency (%) 9.3 20 30
Material environmental harm events resulting from operational waste facilities (number)
0 0 0
Valid litter, odour, dust and noise complaints relating to waste facility operations (number per 1000 households)
Less than 0.5 Less than 0.5 Less than 0.5
Valid litter, odour, dust and noise complaints relating to waste collection services (number per 1000 households)
Less than 0.5 Less than 0.5 Less than 0.5
What will our community see by 2024?• Landfills and community waste and recycling centres that are best practice facilities with a minimal negative impact on our quality
of life and our environment.
• Residents are reducing greenhouse gas emissions by recycling their organic wastes, either at home or through other recycling options, rather than sending organic waste to landfill.
• Built-up mixed use precincts will have improved amenity for residents – less traffic and noise from waste collection activities.
• Cleaner beaches, waterways, streets, bushland and other public places.
Measures of our success
28
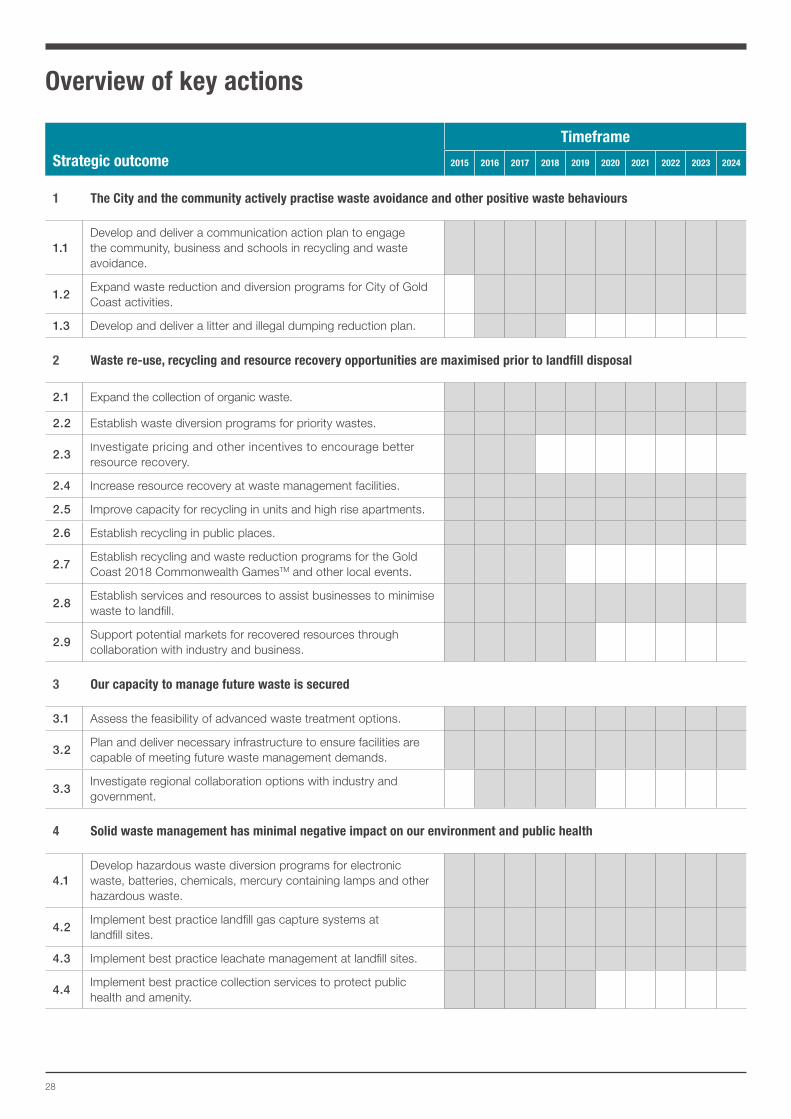
Overview of key actions
Strategic outcome
Timeframe
2015 2016 2017 2018 2019 2020 2021 2022 2023 2024
1 The City and the community actively practise waste avoidance and other positive waste behaviours
1.1Develop and deliver a communication action plan to engage the community, business and schools in recycling and waste avoidance.
1.2Expand waste reduction and diversion programs for City of Gold Coast activities.
1.3 Develop and deliver a litter and illegal dumping reduction plan.
2 Waste re-use, recycling and resource recovery opportunities are maximised prior to landfill disposal
2.1 Expand the collection of organic waste.
2.2 Establish waste diversion programs for priority wastes.
2.3Investigate pricing and other incentives to encourage better resource recovery.
2.4 Increase resource recovery at waste management facilities.
2.5 Improve capacity for recycling in units and high rise apartments.
2.6 Establish recycling in public places.
2.7Establish recycling and waste reduction programs for the Gold Coast 2018 Commonwealth GamesTM and other local events.
2.8Establish services and resources to assist businesses to minimise waste to landfill.
2.9Support potential markets for recovered resources through collaboration with industry and business.
3 Our capacity to manage future waste is secured
3.1 Assess the feasibility of advanced waste treatment options.
3.2Plan and deliver necessary infrastructure to ensure facilities are capable of meeting future waste management demands.
3.3Investigate regional collaboration options with industry and government.
4 Solid waste management has minimal negative impact on our environment and public health
4.1Develop hazardous waste diversion programs for electronic waste, batteries, chemicals, mercury containing lamps and other hazardous waste.
4.2Implement best practice landfill gas capture systems at landfill sites.
4.3 Implement best practice leachate management at landfill sites.
4.4Implement best practice collection services to protect public health and amenity.
29Solid Waste Strategy 2024
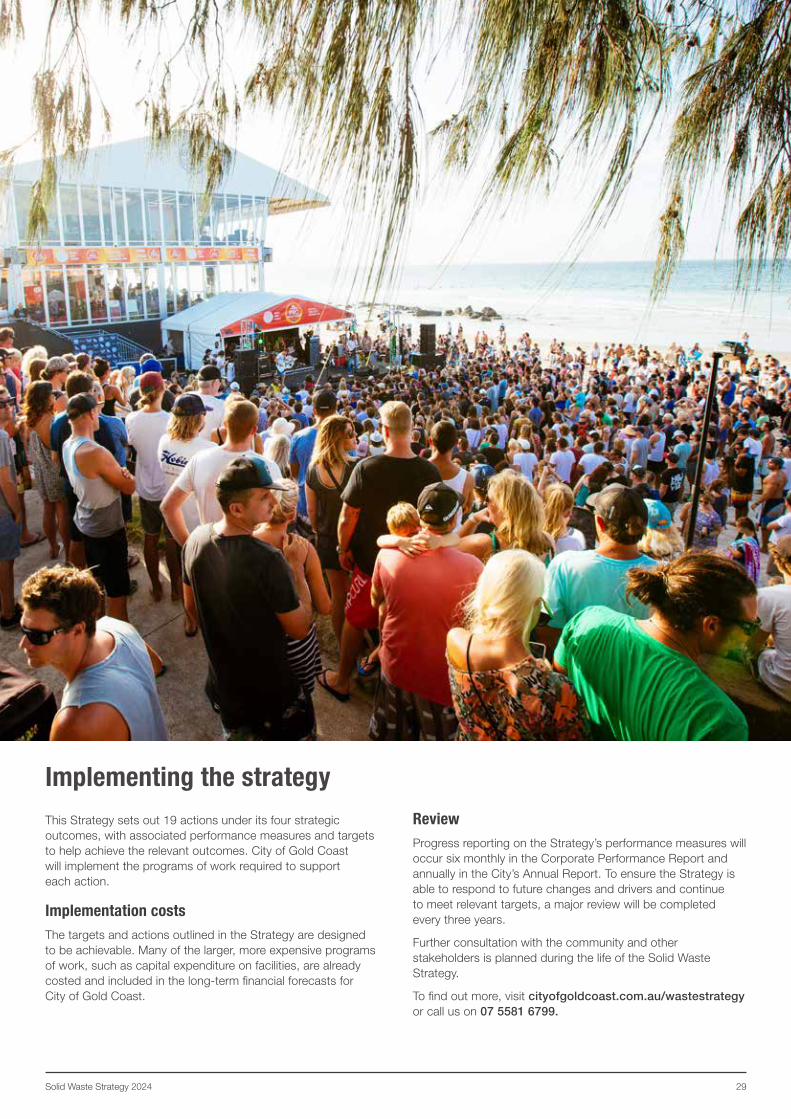
Implementing the strategyThis Strategy sets out 19 actions under its four strategic outcomes, with associated performance measures and targets to help achieve the relevant outcomes. City of Gold Coast will implement the programs of work required to support each action.
Implementation costsThe targets and actions outlined in the Strategy are designed to be achievable. Many of the larger, more expensive programs of work, such as capital expenditure on facilities, are already costed and included in the long-term financial forecasts for City of Gold Coast.
ReviewProgress reporting on the Strategy’s performance measures will occur six monthly in the Corporate Performance Report and annually in the City’s Annual Report. To ensure the Strategy is able to respond to future changes and drivers and continue to meet relevant targets, a major review will be completed every three years.
Further consultation with the community and other stakeholders is planned during the life of the Solid Waste Strategy.
To find out more, visit cityofgoldcoast.com.au/wastestrategy or call us on 07 5581 6799.
30
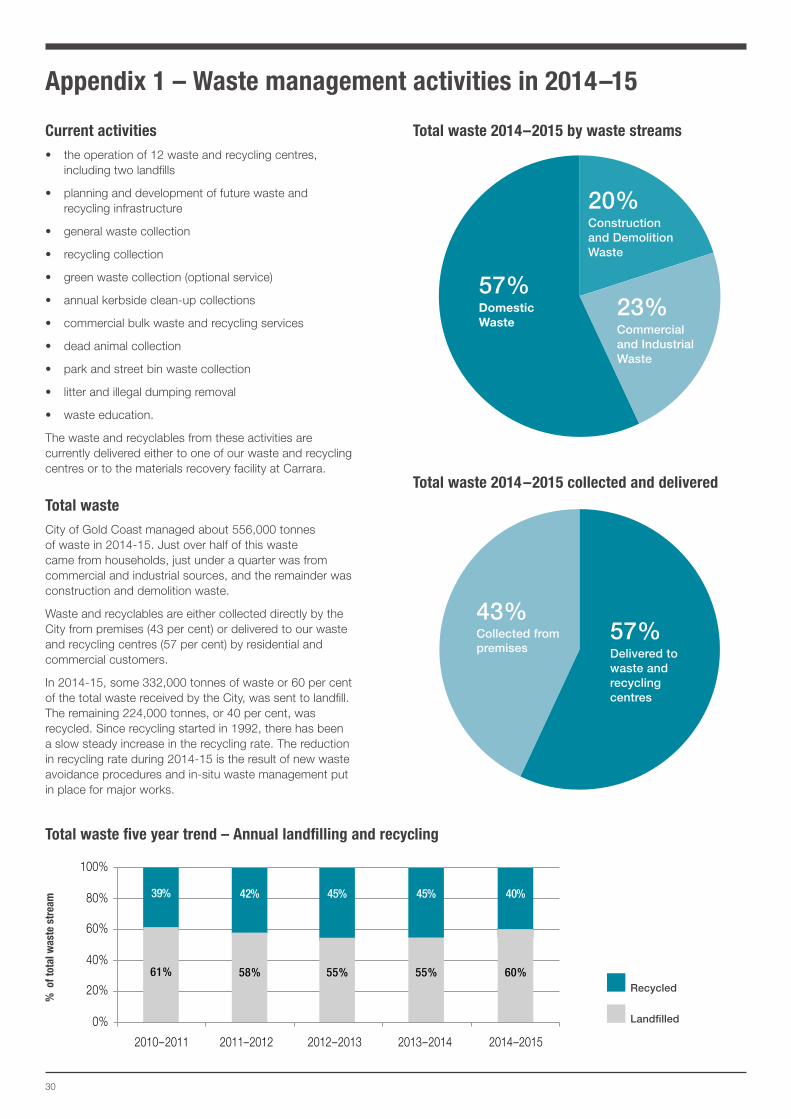
Appendix 1 – Waste management activities in 2014–15
0%
20%
40%
60%
80%
100%
27% 28% 31% 30% 29%
Domestic waste
cycling – 5 year trend
0%
20%
40%
60%
80%
100%
2010–2011 2011–2012 2012–2013 2013–2014 2014–2015
2010–2011 2011–2012 2012–2013 2013–2014 2014–2015 2010–2011 2011–2012 2012–2013 2013–2014 2014–2015
2010–2011 2011–2012 2012–2013 2013–2014 2014–2015
61%
39%
58%
42%
55%
45%
55%
45% 40%
Total waste stream
year trend
RecyclablesFood/kitchen
Green waste
Mixed waste
Other putrescible
20% 22%
31%19%
8%
Construction and demolition
waste
19%
Commercial and industrial
waste
27%Municipal
solid waste
54%
0%
20%
40%
60%
80%
100%
79%
21%
78%
22%
79% 79% 80%
20%
Commercial and industrial waste
year trend
0%
20%
40%
60%
80%
100%
95%
Construction and demolition
year trend
100%90%80%70%60%50%40%30%20%10%
0%Kerbside collection Waste and Recycling Centres
Waste from households
Bin audit – Different waste types in Gold Coast household waste bin
RecyclablesFood/kitchen
Green waste
Mixed waste
Other putrescible
20% 22%
31%19%
8%
5%25%
75% 93%
55%
96% 94%
7% 4% 6%
60%72% 70%73% 69% 71%
21% 21%
Total waste 2014–2015 by waste streams
57%Domestic Waste
20%Construction and Demolition Waste
23%Commercial and Industrial Waste
57%Delivered to waste and recycling centres
43%Collected from premises
Total waste five year trend – Annual landfilling and recycling
Recycled
Landfilled
Current activities• the operation of 12 waste and recycling centres,
including two landfills
• planning and development of future waste and recycling infrastructure
• general waste collection
• recycling collection
• green waste collection (optional service)
• annual kerbside clean-up collections
• commercial bulk waste and recycling services
• dead animal collection
• park and street bin waste collection
• litter and illegal dumping removal
• waste education.
The waste and recyclables from these activities are currently delivered either to one of our waste and recycling centres or to the materials recovery facility at Carrara.
Total wasteCity of Gold Coast managed about 556,000 tonnes of waste in 2014-15. Just over half of this waste came from households, just under a quarter was from commercial and industrial sources, and the remainder was construction and demolition waste.
Waste and recyclables are either collected directly by the City from premises (43 per cent) or delivered to our waste and recycling centres (57 per cent) by residential and commercial customers.
In 2014-15, some 332,000 tonnes of waste or 60 per cent of the total waste received by the City, was sent to landfill. The remaining 224,000 tonnes, or 40 per cent, was recycled. Since recycling started in 1992, there has been a slow steady increase in the recycling rate. The reduction in recycling rate during 2014-15 is the result of new waste avoidance procedures and in-situ waste management put in place for major works.
Total waste 2014–2015 collected and delivered
31Solid Waste Strategy 2024
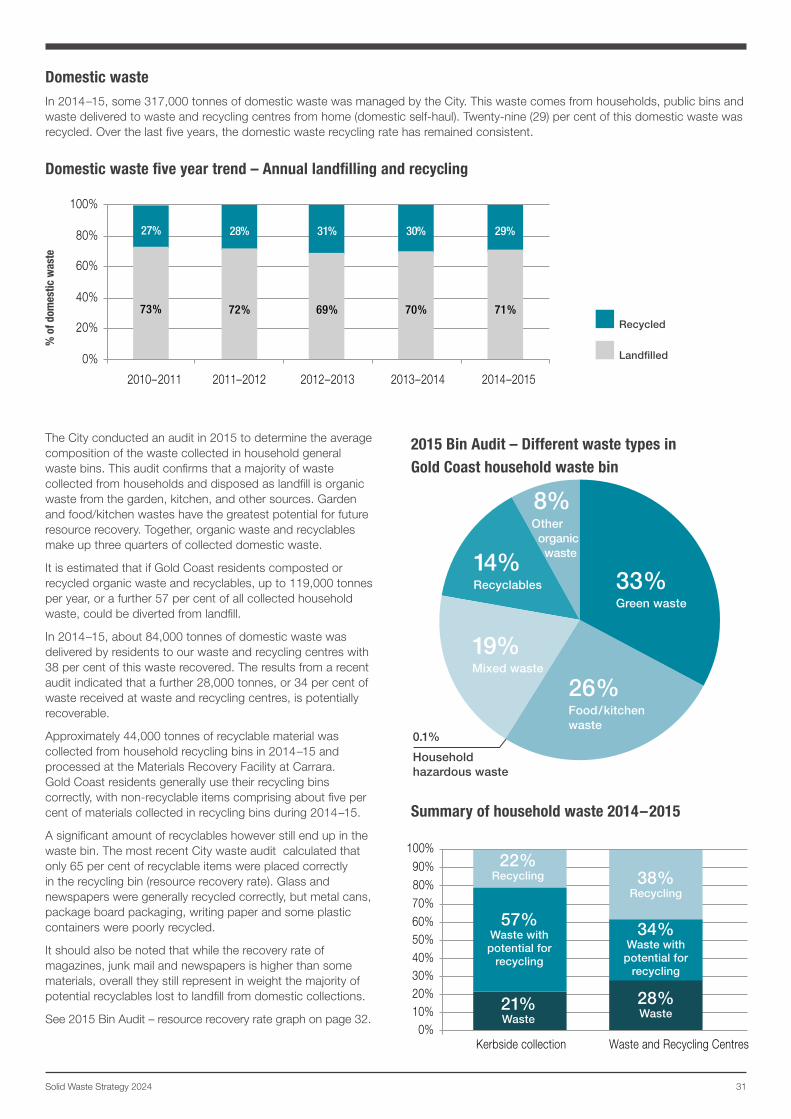
Domestic wasteIn 2014–15, some 317,000 tonnes of domestic waste was managed by the City. This waste comes from households, public bins and waste delivered to waste and recycling centres from home (domestic self-haul). Twenty-nine (29) per cent of this domestic waste was recycled. Over the last five years, the domestic waste recycling rate has remained consistent.
The City conducted an audit in 2015 to determine the average composition of the waste collected in household general waste bins. This audit confirms that a majority of waste collected from households and disposed as landfill is organic waste from the garden, kitchen, and other sources. Garden and food/kitchen wastes have the greatest potential for future resource recovery. Together, organic waste and recyclables make up three quarters of collected domestic waste.
It is estimated that if Gold Coast residents composted or recycled organic waste and recyclables, up to 119,000 tonnes per year, or a further 57 per cent of all collected household waste, could be diverted from landfill.
In 2014–15, about 84,000 tonnes of domestic waste was delivered by residents to our waste and recycling centres with 38 per cent of this waste recovered. The results from a recent audit indicated that a further 28,000 tonnes, or 34 per cent of waste received at waste and recycling centres, is potentially recoverable.
Approximately 44,000 tonnes of recyclable material was collected from household recycling bins in 2014–15 and processed at the Materials Recovery Facility at Carrara. Gold Coast residents generally use their recycling bins correctly, with non-recyclable items comprising about five per cent of materials collected in recycling bins during 2014–15.
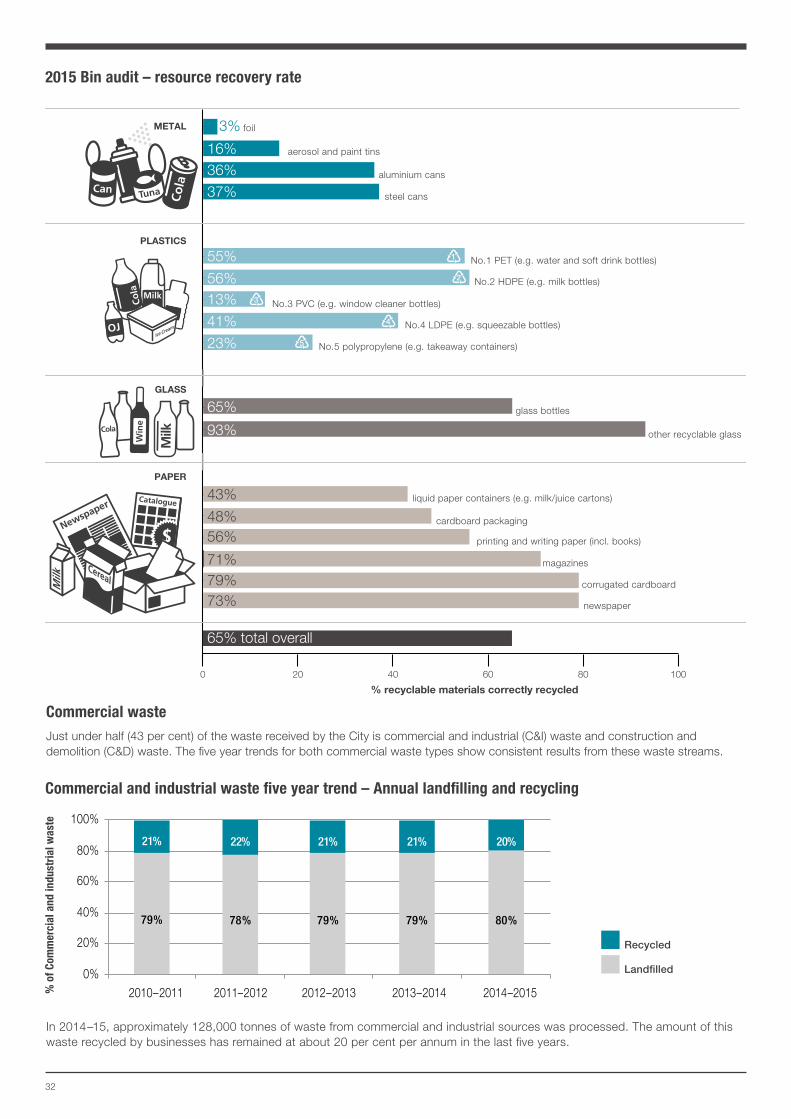
A significant amount of recyclables however still end up in the waste bin. The most recent City waste audit calculated that only 65 per cent of recyclable items were placed correctly in the recycling bin (resource recovery rate). Glass and newspapers were generally recycled correctly, but metal cans, package board packaging, writing paper and some plastic containers were poorly recycled.
It should also be noted that while the recovery rate of magazines, junk mail and newspapers is higher than some materials, overall they still represent in weight the majority of potential recyclables lost to landfill from domestic collections.
See 2015 Bin Audit – resource recovery rate graph on page 32.
0%
20%
40%
60%
80%
100%
27% 28% 31% 30% 29%
Domestic waste
cycling – 5 year trend
0%
20%
40%
60%
80%
100%
2010–2011 2011–2012 2012–2013 2013–2014 2014–2015
2010–2011 2011–2012 2012–2013 2013–2014 2014–2015 2010–2011 2011–2012 2012–2013 2013–2014 2014–2015
2010–2011 2011–2012 2012–2013 2013–2014 2014–2015
61%
39%
58%
42%
55%
45%
55%
45% 40%
Total waste stream
year trend
RecyclablesFood/kitchen
Green waste
Mixed waste
Other putrescible
20% 22%
31%19%
8%
Construction and demolition
waste
19%
Commercial and industrial
waste
27%Municipal
solid waste
54%
0%
20%
40%
60%
80%
100%
79%
21%
78%
22%
79% 79% 80%
20%
Commercial and industrial waste
year trend
0%
20%
40%
60%
80%
100%
95%
Construction and demolition
year trend
100%90%80%70%60%50%40%30%20%10%
0%Kerbside collection Waste and Recycling Centres
Waste from households
Bin audit – Different waste types in Gold Coast household waste bin
RecyclablesFood/kitchen
Green waste
Mixed waste
Other putrescible
20% 22%
31%19%
8%
5%25%
75% 93%
55%
96% 94%
7% 4% 6%
60%72% 70%73% 69% 71%
21% 21%
Domestic waste five year trend – Annual landfilling and recycling
Recycled
Landfilled
2015 Bin Audit – Different waste types in Gold Coast household waste bin
0.1%
Household hazardous waste
8%
19%Mixed waste
26%Food/kitchen waste
14%Recyclables 33%
Green waste
Other organic waste
0%
20%
40%
60%
80%
100%
27% 28% 31% 30% 29%
Domestic waste
cycling – 5 year trend
0%
20%
40%
60%
80%
100%
2010–2011 2011–2012 2012–2013 2013–2014 2014–2015
2010–2011 2011–2012 2012–2013 2013–2014 2014–2015 2010–2011 2011–2012 2012–2013 2013–2014 2014–2015
2010–2011 2011–2012 2012–2013 2013–2014 2014–2015
61%
39%
58%
42%
55%
45%
55%
45% 40%
Total waste stream
year trend
RecyclablesFood/kitchen
Green waste
Mixed waste
Other putrescible
20% 22%
31%19%
8%
Construction and demolition
waste
19%
Commercial and industrial
waste
27%Municipal
solid waste
54%
0%
20%
40%
60%
80%
100%
79%
21%
78%
22%
79% 79% 80%
20%
Commercial and industrial waste
year trend
0%
20%
40%
60%
80%
100%
95%
Construction and demolition
year trend
100%90%80%70%60%50%40%30%20%10%
0%Kerbside collection Waste and Recycling Centres
Waste from households
Bin audit – Different waste types in Gold Coast household waste bin
RecyclablesFood/kitchen
Green waste
Mixed waste
Other putrescible
20% 22%
31%19%
8%
5%25%
75% 93%
55%
96% 94%
7% 4% 6%
60%72% 70%73% 69% 71%
21% 21%
22%Recycling
57%Waste with potential for
recycling
38%Recycling
34%Waste with potential for
recycling
28%Waste
21%Waste
Summary of household waste 2014–2015
32
0%
20%
40%
60%
80%
100%
27% 28% 31% 30% 29%
Domestic waste
cycling – 5 year trend
0%
20%
40%
60%
80%
100%
2010–2011 2011–2012 2012–2013 2013–2014 2014–2015
2010–2011 2011–2012 2012–2013 2013–2014 2014–2015 2010–2011 2011–2012 2012–2013 2013–2014 2014–2015
2010–2011 2011–2012 2012–2013 2013–2014 2014–2015
61%
39%
58%
42%
55%
45%
55%
45% 40%
Total waste stream
year trend
RecyclablesFood/kitchen
Green waste
Mixed waste
Other putrescible
20% 22%
31%19%
8%
Construction and demolition
waste
19%
Commercial and industrial
waste
27%Municipal
solid waste
54%
0%
20%
40%
60%
80%
100%
79%
21%
78%
22%
79% 79% 80%
20%
Commercial and industrial waste
year trend
0%
20%
40%
60%
80%
100%
95%
Construction and demolition
year trend
100%90%80%70%60%50%40%30%20%10%
0%Kerbside collection Waste and Recycling Centres
Waste from households
Bin audit – Different waste types in Gold Coast household waste bin
RecyclablesFood/kitchen
Green waste
Mixed waste
Other putrescible
20% 22%
31%19%
8%
5%25%
75% 93%
55%
96% 94%
7% 4% 6%
60%72% 70%73% 69% 71%
21% 21%
% o
f Com
mer
cial
and
indu
stri
al w
aste
Commercial wasteJust under half (43 per cent) of the waste received by the City is commercial and industrial (C&I) waste and construction and demolition (C&D) waste. The five year trends for both commercial waste types show consistent results from these waste streams.
% recyclable materials correctly recycled
METAL
PLASTICS
GLASS
PAPER
0 20 40 60 80 100
16%36%37%
55%
56%13%
41%
23%
65%
93%
43%
48%56%
71%79%73%
65% total overall
3%
aluminium cans
foil
steel cans
aerosol and paint tins
glass bottles
No.1 PET (e.g. water and soft drink bottles)
No.2 HDPE (e.g. milk bottles)
No.3 PVC (e.g. window cleaner bottles)
No.4 LDPE (e.g. squeezable bottles)
No.5 polypropylene (e.g. takeaway containers)
other recyclable glass
liquid paper containers (e.g. milk/juice cartons)
printing and writing paper (incl. books)
cardboard packaging
magazines
corrugated cardboard
newspaper
Recycled
Landfilled
In 2014–15, approximately 128,000 tonnes of waste from commercial and industrial sources was processed. The amount of this waste recycled by businesses has remained at about 20 per cent per annum in the last five years.
2015 Bin audit – resource recovery rate
Commercial and industrial waste five year trend – Annual landfilling and recycling
33Solid Waste Strategy 2024
Recycled
Landfilled
Recycled
Landfilled
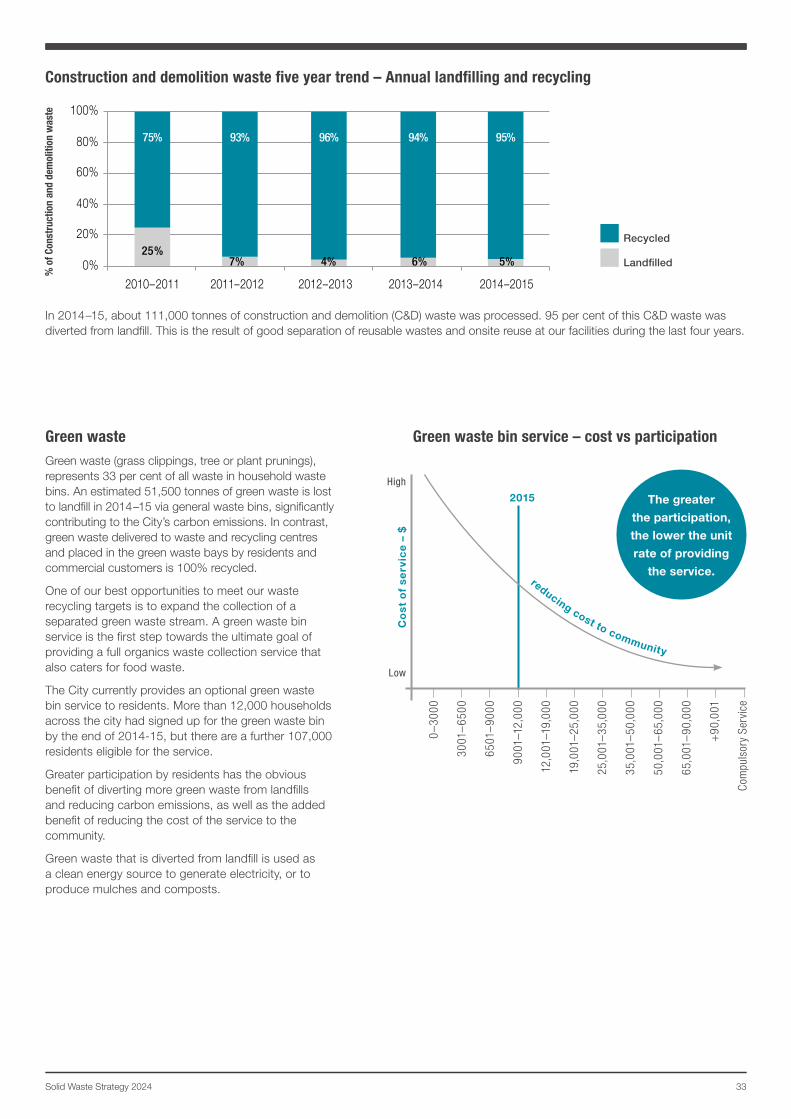
In 2014–15, about 111,000 tonnes of construction and demolition (C&D) waste was processed. 95 per cent of this C&D waste was diverted from landfill. This is the result of good separation of reusable wastes and onsite reuse at our facilities during the last four years.
Green wasteGreen waste (grass clippings, tree or plant prunings), represents 33 per cent of all waste in household waste bins. An estimated 51,500 tonnes of green waste is lost to landfill in 2014–15 via general waste bins, significantly contributing to the City’s carbon emissions. In contrast, green waste delivered to waste and recycling centres and placed in the green waste bays by residents and commercial customers is 100% recycled.
One of our best opportunities to meet our waste recycling targets is to expand the collection of a separated green waste stream. A green waste bin service is the first step towards the ultimate goal of providing a full organics waste collection service that also caters for food waste.
The City currently provides an optional green waste bin service to residents. More than 12,000 households across the city had signed up for the green waste bin by the end of 2014-15, but there are a further 107,000 residents eligible for the service.
Greater participation by residents has the obvious benefit of diverting more green waste from landfills and reducing carbon emissions, as well as the added benefit of reducing the cost of the service to the community.
Green waste that is diverted from landfill is used as a clean energy source to generate electricity, or to produce mulches and composts.
The greater
the participation,
the lower the unit
rate of providing
the service.
0–30
00
3001
–65
00
6501
–900
0
9001
–12,
000
12,0
01–1
9,00
0
19,0
01–2
5,00
0
25,0
01–3
5,00
0
35,0
01–5
0,00
0
50,0
01–
65,0
00
65,0
01–9
0,00
0
+90
,001
Com
puls
ory
Serv
ice
High
Low
Co
st o
f se
rvic
e –
$
2015
reducing cost to community
Green waste bin service – cost vs participation
Commercial and industrial waste five year trend – Annual landfilling and recycling
0%
20%
40%
60%
80%
100%
27% 28% 31% 30% 29%
Domestic waste
cycling – 5 year trend
0%
20%
40%
60%
80%
100%
2010–2011 2011–2012 2012–2013 2013–2014 2014–2015
2010–2011 2011–2012 2012–2013 2013–2014 2014–2015 2010–2011 2011–2012 2012–2013 2013–2014 2014–2015
2010–2011 2011–2012 2012–2013 2013–2014 2014–2015
61%
39%
58%
42%
55%
45%
55%
45% 40%
Total waste stream
year trend
RecyclablesFood/kitchen
Green waste
Mixed waste
Other putrescible
20% 22%
31%19%
8%
Construction and demolition
waste
19%
Commercial and industrial
waste
27%Municipal
solid waste
54%
0%
20%
40%
60%
80%
100%
79%
21%
78%
22%
79% 79% 80%
20%
Commercial and industrial waste
year trend
0%
20%
40%
60%
80%
100%
95%
Construction and demolition
year trend
100%90%80%70%60%50%40%30%20%10%
0%Kerbside collection Waste and Recycling Centres
Waste from households
Bin audit – Different waste types in Gold Coast household waste bin
RecyclablesFood/kitchen
Green waste
Mixed waste
Other putrescible
20% 22%
31%19%
8%
5%25%
75% 93%
55%
96% 94%
7% 4% 6%
60%72% 70%73% 69% 71%
21% 21%
Construction and demolition waste five year trend – Annual landfilling and recycling
Printed on 100% recycled paper
City of Gold Coast PO Box 5042 Gold Coast MC QLD 9729 Australia Email: [email protected]
CGC11311