Embed Size (px)
Citation preview
ORIGINAL PAPER
Dynamics in the Bridged State of a Magnetic Recording Slider
Thomas E. Karis Æ Xing-Cai Guo Æ Jia-Yang Juang
Received: 24 July 2006 / Accepted: 12 March 2008
� Springer Science+Business Media, LLC 2008
Abstract A novel region of tribological interaction is
explored by inducing near contact between the magnetic
recording slider and disk. In this study, we performed fric-
tional measurements over a wide range of subambient air
pressure and disk rotation rate. Since the slider is supported
over the disk by an air bearing, it has been found that cycling
from ambient to subambient and then back up to ambient
pressure over several minutes of time forms a frictional hys-
teresis loop. The high-friction branch of the loop, referred to as
the bridged state, is characterized by an average frictional
displacement and resonant vibration of the suspension mount
assembly. The bridged state is currently employed for accel-
erated wear testing of magnetic slider/disk/lubricant systems.
Future magnetic recording systems designed to operate at
increasingly lower physical spacing will need to take into
account these frictional forces which accompany the incipient
contact between the lubricated disk and slider with finite
surface roughness. A single degree of freedom model is solved
to determine the equivalent dynamic friction force on the
slider as an impulse series with random impulse frequency and
amplitude from the measured frictional displacement in the
bridged state. The mean slider-disk spacing in the bridged
state is derived from the experimental friction force, the
spacing probability density function, and the adhesion stress
from the Lifshitz model for dispersion interaction energy.
Keywords Applied tribology � Magnetic data storage �Component and machine tribology � Magnetic data disks �Friction and energy conservation � Friction mechanisms
1 Introduction
Advances in storage technology rely upon a stable and
reproducible low friction on the slider to allow precise
servo mechanical positioning of the read and write ele-
ments on the data tracks, to maintain uniform magnetic
read back signal amplitude, and to avoid mechanical
damage of the disk and slider surface layers. Intermittent
contacts between the slider and the disk increase the
chances of forming scratches or magnetic erasure by
impact with the disk [1, 2].
On the other hand, many researchers are investigating air-
bearing sliders that incorporate some contact into their
design. Understanding the origins of the contact force
between the slider and the disk is currently at the frontiers of
this work. Contact forces have been treated according to
several different approaches. Intermolecular forces were
incorporated into an air-bearing model to account for
experimentally observed flying height hysteresis [3, 4]. The
majority of publications postulate a liquid lubricant menis-
cus as the primary contribution to the friction force between
the low flying or contacting slider and the disk [5–11].
Interaction force between the low-flying slider and disk
may also arise from liquid bridges, which are expected to
form between two lubricated surfaces in close proximity
[12, 13]. From molecular dynamic simulations, shearing of
molecularly thin layers of lubricant alone is expected to
produce frictional force oscillations on the picoseconds
time scale [14, 15]. The bridged state is observed experi-
mentally by decreasing the disk rotation rate to decrease
the air-bearing lift force causing the slider to approach the
T. E. Karis (&) � X.-C. Guo � J.-Y. Juang
San Jose Research Center, Hitachi Global Storage Technologies,
3403 Yerba Buena Road, San Jose, CA 95135, USA
e-mails: [email protected]; [email protected]
X.-C. Guo
e-mail: [email protected]
J.-Y. Juang
e-mail: [email protected]
123
Tribol Lett
DOI 10.1007/s11249-008-9319-0
disk surface from above [16–18]. The bridged state can
also observed by lowering the air pressure in a disk drive
[19] or tester [20, 21]. It is now understood that when the
slider approaches the disk from above, the first contacts are
between capillary waves on the lubricant surface [22].
Consequently, the disk lubricant molecular weight, end
groups, bonding, and disk surface roughness determine the
mean spacing at which the bridged state is observed [23].
The bridged state is characterized by a high friction and
vibration of the slider, suspension, and mounting assembly.
The touch down pressure (TDP) is the pressure at which
the slider-disk interface enters the bridged state and friction
and vibration of the slider suddenly increases with
decreasing pressure; the take off pressure (TOP) is the
pressure at which the slider resumes normal flying with
increasing pressure. Most studies of the (sub ambient)
hysteresis loop in magnetic recording are focused on
determining the dependence of the TDP and TOP on
parameters such as lubricant molecular weight, end groups,
bonding, ambient humidity, disk roughness, and slider
geometry. These investigations provide phenomenological
results leading to semi-empirical hypothesis regarding the
nature of the bridged state, and the quality of the magnetic
recording slider-disk interface.
This study explores the physics of the bridged state at
the TDP. Information about the nature of the forces on the
slider in the bridged state is derived from the frictional
displacement and a single degree of freedom model for the
load beam and slider suspension assembly.
The meniscus concept has recently been applied to the
tribology of lubricated magnetic recording head and disk
interfaces, e.g., [24, 25]. We find that: (a) The meniscus
volume is less than the volume of one Ztetraol 2000
lubricant chain; (b) The wetted perimeter is the length of
about 8 lubricant chains stretched end to end; and (c) The
wetted length is about 24 lubricant chain lengths. Hence
the formation of a meniscus involves the rearrangement of
about two dozen chains, and the volume of the curved
mensicus surface is less than one lubricant molecule. At the
mid-range velocity of 10 m/s, then time between asperity
contacts is 38 ns, and the duration of an asperity contact is
8.4 ns. For the lubricant to flow out from between the two
asperities down to one flat molecular layer equal to the
atomic diameter of the chain and into the meniscus, the
initial average lubricant flow velocity estimated using
the cross-sectional area defined by the contact length and
the disk lubricant film thickness is 5.4 m/s. The shear rate,
for a 1-nm-initial film thickness is then 5.4 9 109 1/s.
Hence the meniscus model is subject to the same constraint
of viscoelasticity as a shear flow for molecularly thin and
highly bonded liquid films. It is not physically meaningful
to invoke shear flow within asperity contacts lubricated by
molecularly thin and highly bonded lubricant films because
our process time scale of 1= _c ¼ 1:8� 10�10 sec for the
shear is much less than the 10-5 s characteristic visco-
elastic relaxation time for PFPE lubricant chains [26]. We
show that a molecular adhesion model derived from dis-
persion force interaction through the Liftshitz theory is
more appropriate at the time and length scales of asperity
interactions in the bridged state.
Recent investigations have found that there is a critical
flying height below which the onset of lubricant accumu-
lation on the slider and depletion from the disk surface
is observed [27]. The existence of a critical flying height
is accounted for by intermolecular forces and transport of
lubricant molecules across the air-bearing gap. In our
molecular adhesion model which incorporates surface
roughness we show that lubricant transfer is expected to
vary almost exponentially with mean spacing between the
lubricated disk and slider surfaces.
2 Experimental
2.1 Materials and Apparatus
The disks were typical 95-mm-diameter magnetic record-
ing diks made on AlMg substrates with a carbon overcoat
and 0.8 nm of Ztetraol 2000 lubricant. The chemisorbed
fraction of lubricant was 80% measured by rinsing with
Vertrel XF and measurement with reflection Fourier
Transform Infrared Spectroscopy. Finished disk rms
roughness was 0.33 nm from atomic force microscopy.
Sliders were typical pico sliders made of N58 (Al2O3/TiC)
ceramic material and overcoated with 2.5 nm of carbon.
The slider body was 1.2 mm long, 1 mm wide and 0.3 mm
thick. The pivot point was centered on top of the slider
body. The normal load applied by the 4–micron-thick steel
suspension on the slider was 2.5 grams (or 24.5 mN). The
suspension was mounted on a load beam as shown in
Fig. 1a. A strain gage was epoxy bonded to the metal load
beam, and the suspension was bolted onto the lower end of
the load beam with the back of the slider 11 mm from the
suspension mounting point on the load beam. Force f
applied to the assembly by the head disk interface of the
slider gives rise to load beam deflection x.
Frictional hysteresis loop measurements were performed
inside a sealed disk tester with a controlled leak (CETR
Olympus). For these tests, the radial position was 30.6 mm
(near the middle diameter of the disk), and the skew angle
was close to zero degrees. The disk rotation was started at
7,200 rpm with the slider suspension on the load/unload
ramp just off the edge of the disk. The slider was accessed
to the test radius; the rotation rate was adjusted lower as
specified between 800 and 7,200 rpm. The air pressure was
controlled with an analog vacuum pressure controller
Tribol Lett
123
(MKS Instruments type 640 with a type 167 power supply/
readout). Pressure setting and measurement of the frictional
displacement was performed with National Instruments
LabView software on a PC with interface cards. The
pressure inside the tester was varied stepwise linearly from
ambient (100 kPa) toward 15 kPa and back up to ambient
over about 3 min time in approximately 1 kPa increments.
After each pressure decrement/increment, the average
frictional displacement of the strain gage and peak vibra-
tion amplitude were recorded (4,000 samples at 20 kHz).
At the end of the test, the rotation rate was increased to
7,200 rpm and the slider was accessed back to the load/
unload ramp before stopping the disk rotation.
During some of the tests the pressure was manually
controlled to enter the bridged state and then capture
200 ms friction versus time apertures for subsequent
analysis. All the tests were done with the same slider and at
the same radial position on the disk.
Following the subambient pressure tests the disk surface
was examined for wear particles, lubricant removal and
redistribution, and surface topography with a KLA Tencor
Candela 6100 Optical Surface Analyzer (OSA). For survey
scans, the encoder multiplier was 329 and the step size
was 3 microns, for a pixel size (resolution) of 3 microns
radially and 6 microns circumferentially. Lubricant thick-
ness was studied with the Q phase image (QPh, which is
similar to an ellipsometric measurement). A calibration
was performed to determine the percentage variation in
QPh with lubricant thickness.
The Q scattered image (QSc) was examined to look for
wear debris (similar to dark-field microscopy). The QSc
images can detect particles as small as 100 nm in diameter,
although the scattering volume is much larger than the
actual particle size due to pixel blooming in the CCD
camera and the discrete pixel area.
The QZc image was employed to measure surface
topography in the test tracks. Images with 3 microns cir-
cumferentially and 1 micron radially were integrated in the
circumferential direction to obtain surface profiles. The
surface level was calibrated with disk surface topography
measured with a Tencor stylus profilometer (Model P-12
Disk Profiler, with tip radius of 2 microns).
Slider surface topography before and after the tests was
measured with a Veeco Wyco optical profiler.
2.2 Friction Force Measurement
2.2.1 Dynamic Model
A dynamic model for the load beam and slider suspension
assembly was developed to provide insight into the nature
of the frictional forces acting on the slider which produce
the observed voltages measured from the strain gage
mounted on the load beam. The load beam spring constant,
resonant frequencies, and damped oscillations were calcu-
lated with ANSYS general purpose finite element analysis
software (ANSYS, Inc. http://www.ansys.com). For the
ANSYS calculation the damping coefficient was 0.5%;
(b)
Deflection, xDashpot coefficient, λ
Spring stiffness, kMass, m
Force, f
Force, f
(a)
Deflection, x
Suspension
Load Beam
Mounted End of Beam Data
AcquisitionCard
BridgeAmplifier
Strain Gauge
Slider
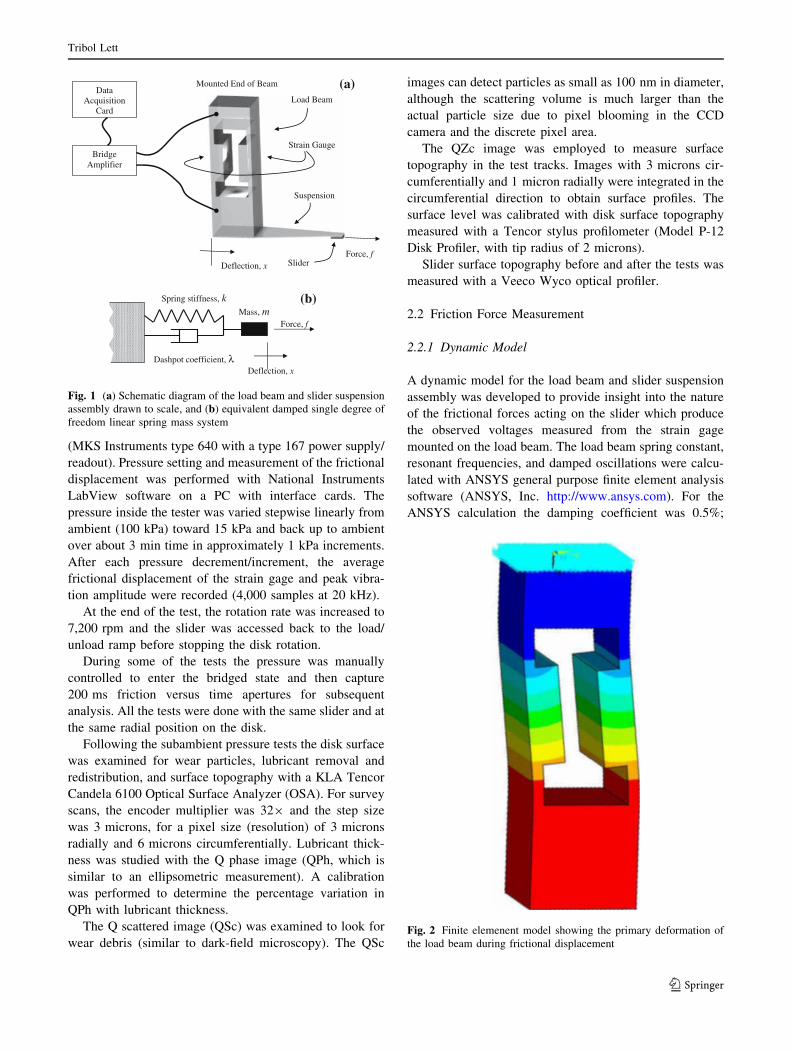
Fig. 1 (a) Schematic diagram of the load beam and slider suspension
assembly drawn to scale, and (b) equivalent damped single degree of
freedom linear spring mass system
Fig. 2 Finite elemenent model showing the primary deformation of
the load beam during frictional displacement
Tribol Lett
123
tensile modulus was 70 GPa; and density 2,700 kg/m3. The
fundamental deformation mode of the load beam is parallel
to the disk surface, as shown in Fig. 2. The parallel shear
mode determined by the design of the load beam shape
prevents small displacements from changing the elevation
of the suspension during friction measurement. The calcu-
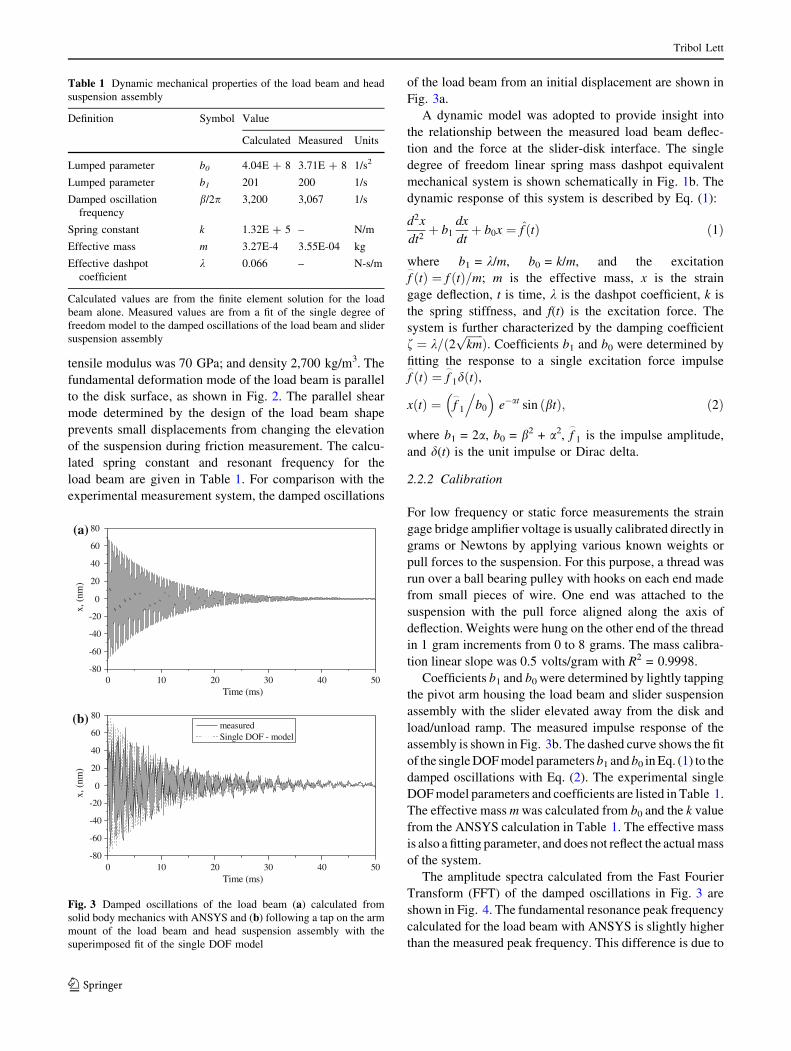
lated spring constant and resonant frequency for the
load beam are given in Table 1. For comparison with the
experimental measurement system, the damped oscillations
of the load beam from an initial displacement are shown in
Fig. 3a.
A dynamic model was adopted to provide insight into
the relationship between the measured load beam deflec-
tion and the force at the slider-disk interface. The single
degree of freedom linear spring mass dashpot equivalent
mechanical system is shown schematically in Fig. 1b. The
dynamic response of this system is described by Eq. (1):
d2x
dt2þ b1
dx
dtþ b0x ¼ f̂ tð Þ ð1Þ
where b1 = k/m, b0 = k/m, and the excitation
f_
ðtÞ ¼ f ðtÞ=m; m is the effective mass, x is the strain
gage deflection, t is time, k is the dashpot coefficient, k is
the spring stiffness, and f(t) is the excitation force. The
system is further characterized by the damping coefficient
f ¼ k=ð2ffiffiffiffiffiffi
kmpÞ. Coefficients b1 and b0 were determined by
fitting the response to a single excitation force impulse
f_
ðtÞ ¼ f_
1dðtÞ,
x tð Þ ¼ f_
1
.
b0
� �
e�at sin btð Þ; ð2Þ
where b1 = 2a, b0 = b2 + a2, f_
1 is the impulse amplitude,
and d(t) is the unit impulse or Dirac delta.
2.2.2 Calibration
For low frequency or static force measurements the strain
gage bridge amplifier voltage is usually calibrated directly in
grams or Newtons by applying various known weights or
pull forces to the suspension. For this purpose, a thread was
run over a ball bearing pulley with hooks on each end made
from small pieces of wire. One end was attached to the
suspension with the pull force aligned along the axis of
deflection. Weights were hung on the other end of the thread
in 1 gram increments from 0 to 8 grams. The mass calibra-
tion linear slope was 0.5 volts/gram with R2 = 0.9998.
Coefficients b1 and b0 were determined by lightly tapping
the pivot arm housing the load beam and slider suspension
assembly with the slider elevated away from the disk and
load/unload ramp. The measured impulse response of the
assembly is shown in Fig. 3b. The dashed curve shows the fit
of the single DOF model parameters b1 and b0 in Eq. (1) to the
damped oscillations with Eq. (2). The experimental single
DOF model parameters and coefficients are listed in Table 1.
The effective mass m was calculated from b0 and the k value
from the ANSYS calculation in Table 1. The effective mass
is also a fitting parameter, and does not reflect the actual mass
of the system.
The amplitude spectra calculated from the Fast Fourier
Transform (FFT) of the damped oscillations in Fig. 3 are
shown in Fig. 4. The fundamental resonance peak frequency
calculated for the load beam with ANSYS is slightly higher
than the measured peak frequency. This difference is due to
Table 1 Dynamic mechanical properties of the load beam and head
suspension assembly
Definition Symbol Value
Calculated Measured Units
Lumped parameter b0 4.04E + 8 3.71E + 8 1/s2
Lumped parameter b1 201 200 1/s
Damped oscillation
frequency
b/2p 3,200 3,067 1/s
Spring constant k 1.32E + 5 – N/m
Effective mass m 3.27E-4 3.55E-04 kg
Effective dashpot
coefficient
k 0.066 – N-s/m
Calculated values are from the finite element solution for the load
beam alone. Measured values are from a fit of the single degree of
freedom model to the damped oscillations of the load beam and slider
suspension assembly
0 10 20 30 40 50-80
-60
-40
-20
0
20
40
60
80
x, (
nm)
Time (ms)
0 10 20 30 40 50-80
-60
-40
-20
0
20
40
60
80
x, (
nm)
Time (ms)
measured Single DOF - model
(a)
(b)
Fig. 3 Damped oscillations of the load beam (a) calculated from
solid body mechanics with ANSYS and (b) following a tap on the arm
mount of the load beam and head suspension assembly with the
superimposed fit of the single DOF model
Tribol Lett
123
the contribution of the strain gages mounted on the load
beam, which were not included in the solution. Several other
resonances are apparent in the measured impulse response in
Fig. 4. The lower frequency resonances are from the pivot
arm housing the load beam. The higher frequency resonance
is bending of the slider suspension assembly. In the region of
the fundamental resonance, the single DOF model accurately
fits the measured peak, and has a similar shape to the ANSYS
solution. As will be shown later, the fundamental resonance
peak dominates the amplitude spectrum measured in the
bridged state.
3 Results
3.1 Frictional Hysteresis Loop
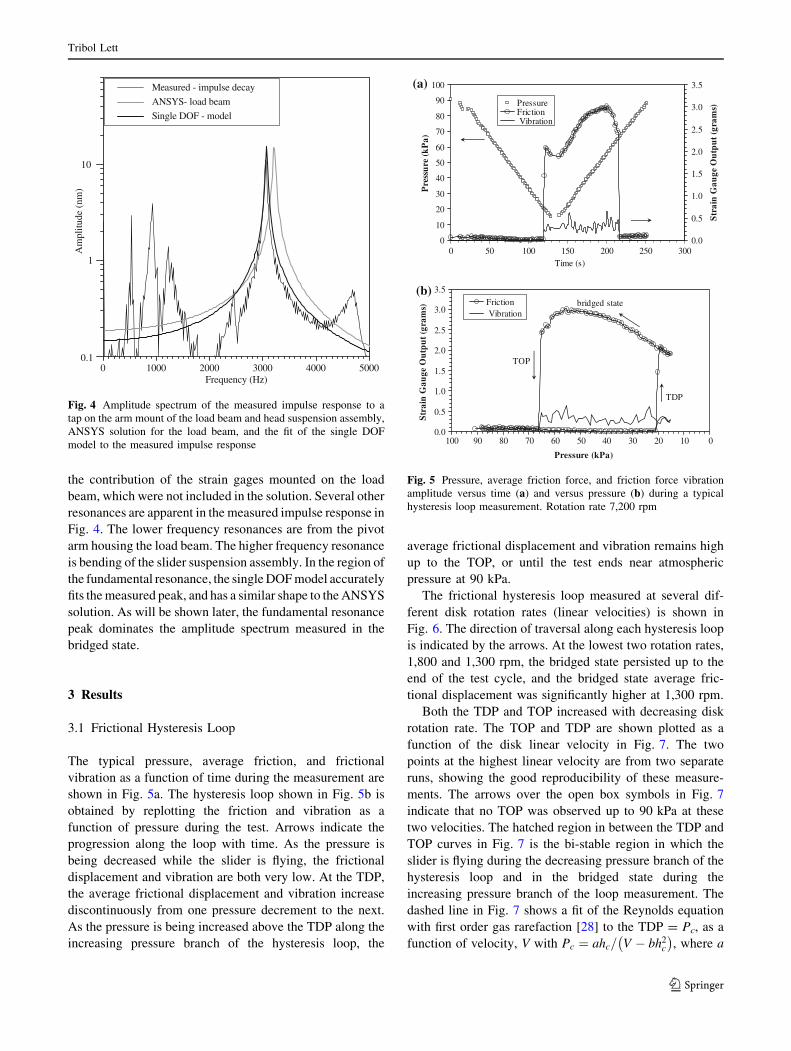
The typical pressure, average friction, and frictional
vibration as a function of time during the measurement are
shown in Fig. 5a. The hysteresis loop shown in Fig. 5b is
obtained by replotting the friction and vibration as a
function of pressure during the test. Arrows indicate the
progression along the loop with time. As the pressure is
being decreased while the slider is flying, the frictional
displacement and vibration are both very low. At the TDP,
the average frictional displacement and vibration increase
discontinuously from one pressure decrement to the next.
As the pressure is being increased above the TDP along the
increasing pressure branch of the hysteresis loop, the
average frictional displacement and vibration remains high
up to the TOP, or until the test ends near atmospheric
pressure at 90 kPa.
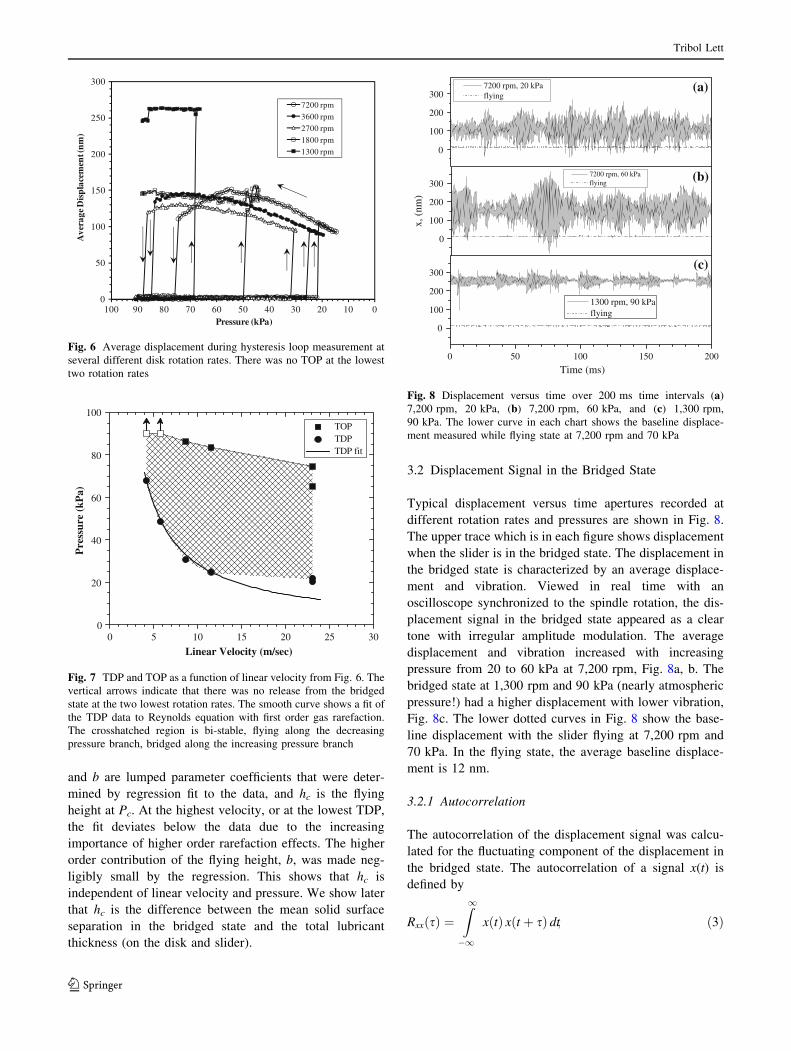
The frictional hysteresis loop measured at several dif-
ferent disk rotation rates (linear velocities) is shown in
Fig. 6. The direction of traversal along each hysteresis loop
is indicated by the arrows. At the lowest two rotation rates,
1,800 and 1,300 rpm, the bridged state persisted up to the
end of the test cycle, and the bridged state average fric-
tional displacement was significantly higher at 1,300 rpm.
Both the TDP and TOP increased with decreasing disk
rotation rate. The TOP and TDP are shown plotted as a
function of the disk linear velocity in Fig. 7. The two
points at the highest linear velocity are from two separate
runs, showing the good reproducibility of these measure-
ments. The arrows over the open box symbols in Fig. 7
indicate that no TOP was observed up to 90 kPa at these
two velocities. The hatched region in between the TDP and
TOP curves in Fig. 7 is the bi-stable region in which the
slider is flying during the decreasing pressure branch of the
hysteresis loop and in the bridged state during the
increasing pressure branch of the loop measurement. The
dashed line in Fig. 7 shows a fit of the Reynolds equation
with first order gas rarefaction [28] to the TDP = Pc, as a
function of velocity, V with Pc ¼ ahc= V � bh2c
� �
, where a
0 1000 2000 3000 4000 50000.1
1
10
Measured - impulse decay
ANSYS- load beam
Single DOF - model
Am
plit
ude
(nm
)
Frequency (Hz)
Fig. 4 Amplitude spectrum of the measured impulse response to a
tap on the arm mount of the load beam and head suspension assembly,
ANSYS solution for the load beam, and the fit of the single DOF
model to the measured impulse response
0
10
20
30
40
50
60
70
80
90
100
0 50 100 150 200 250 300Time (s)
Pre
ssu
re (
kP
a)
0.0
0.5
1.0
1.5
2.0
2.5
3.0
3.5
Str
ain
Gau
ge O
utp
ut
(gra
ms)Pressure
Friction Vibration
0.0
0.5
1.0
1.5
2.0
2.5
3.0
3.5
0102030405060708090100
Pressure (kPa)
Str
ain
Gau
ge O
utp
ut
(gra
ms) Friction
Vibration
TDP
TOP
bridged state
(a)
(b)
Fig. 5 Pressure, average friction force, and friction force vibration
amplitude versus time (a) and versus pressure (b) during a typical
hysteresis loop measurement. Rotation rate 7,200 rpm
Tribol Lett
123
and b are lumped parameter coefficients that were deter-
mined by regression fit to the data, and hc is the flying
height at Pc. At the highest velocity, or at the lowest TDP,
the fit deviates below the data due to the increasing
importance of higher order rarefaction effects. The higher
order contribution of the flying height, b, was made neg-
ligibly small by the regression. This shows that hc is
independent of linear velocity and pressure. We show later
that hc is the difference between the mean solid surface
separation in the bridged state and the total lubricant
thickness (on the disk and slider).
3.2 Displacement Signal in the Bridged State
Typical displacement versus time apertures recorded at
different rotation rates and pressures are shown in Fig. 8.
The upper trace which is in each figure shows displacement
when the slider is in the bridged state. The displacement in
the bridged state is characterized by an average displace-
ment and vibration. Viewed in real time with an
oscilloscope synchronized to the spindle rotation, the dis-
placement signal in the bridged state appeared as a clear
tone with irregular amplitude modulation. The average
displacement and vibration increased with increasing
pressure from 20 to 60 kPa at 7,200 rpm, Fig. 8a, b. The
bridged state at 1,300 rpm and 90 kPa (nearly atmospheric
pressure!) had a higher displacement with lower vibration,
Fig. 8c. The lower dotted curves in Fig. 8 show the base-
line displacement with the slider flying at 7,200 rpm and
70 kPa. In the flying state, the average baseline displace-
ment is 12 nm.
3.2.1 Autocorrelation
The autocorrelation of the displacement signal was calcu-
lated for the fluctuating component of the displacement in
the bridged state. The autocorrelation of a signal x(t) is
defined by
RxxðsÞ ¼Z
1
�1
xðtÞ xðt þ sÞ dt; ð3Þ
0
50
100
150
200
250
300
0102030405060708090100
Ave
rage
Dis
pla
cem
ent (
nm
)
Pressure (kPa)
7200 rpm
3600 rpm
2700 rpm
1800 rpm
1300 rpm
Fig. 6 Average displacement during hysteresis loop measurement at
several different disk rotation rates. There was no TOP at the lowest
two rotation rates
00 5 10 15 20 25 30
20
40
60
80
100 TOP TDP TDP fit
Pre
ssur
e (k
Pa)
Linear Velocity (m/sec)
Fig. 7 TDP and TOP as a function of linear velocity from Fig. 6. The
vertical arrows indicate that there was no release from the bridged
state at the two lowest rotation rates. The smooth curve shows a fit of
the TDP data to Reynolds equation with first order gas rarefaction.
The crosshatched region is bi-stable, flying along the decreasing
pressure branch, bridged along the increasing pressure branch
0
0 50 100 150 200
100
200
300
Time (ms)
1300 rpm, 90 kPa flying
0
100
200
300
x, (
nm)
7200 rpm, 60 kPa flying
0
100
200
300 7200 rpm, 20 kPa flying
(a)
(b)
(c)
Fig. 8 Displacement versus time over 200 ms time intervals (a)
7,200 rpm, 20 kPa, (b) 7,200 rpm, 60 kPa, and (c) 1,300 rpm,
90 kPa. The lower curve in each chart shows the baseline displace-
ment measured while flying state at 7,200 rpm and 70 kPa
Tribol Lett
123
where s is the lag (time). Repetitive patterns in a signal x(t)
show up as coherence structure in the autocorrelation
function R(s) vs. s.
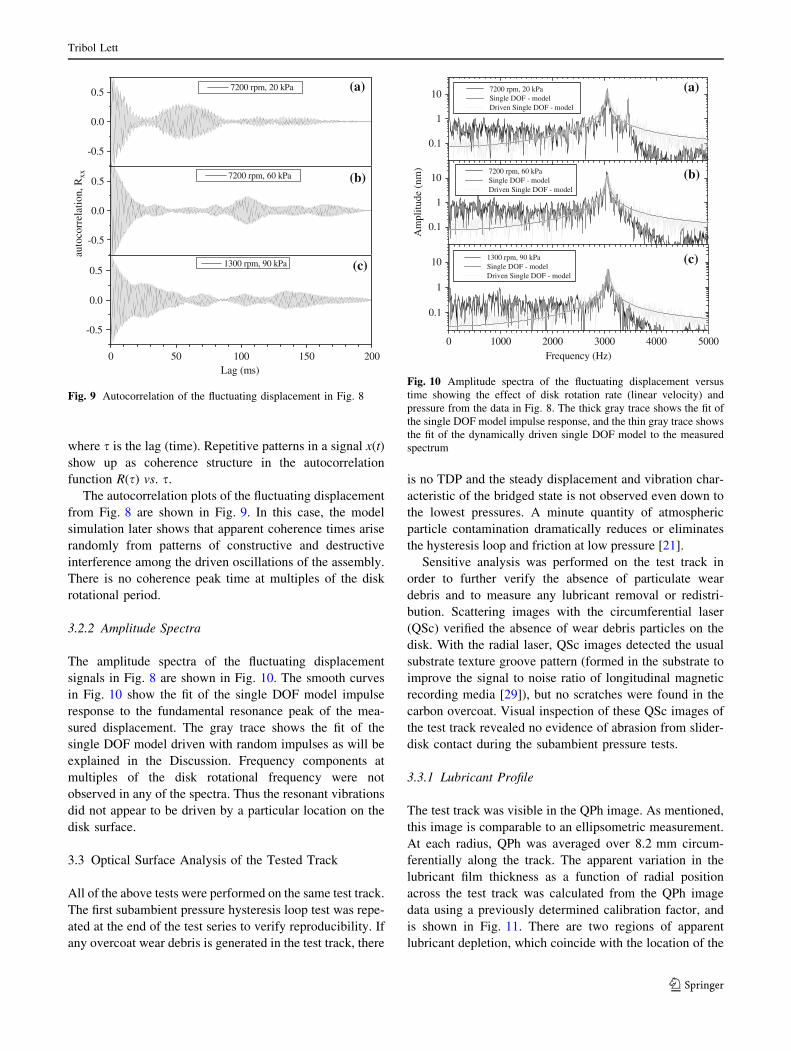
The autocorrelation plots of the fluctuating displacement
from Fig. 8 are shown in Fig. 9. In this case, the model
simulation later shows that apparent coherence times arise
randomly from patterns of constructive and destructive
interference among the driven oscillations of the assembly.
There is no coherence peak time at multiples of the disk
rotational period.
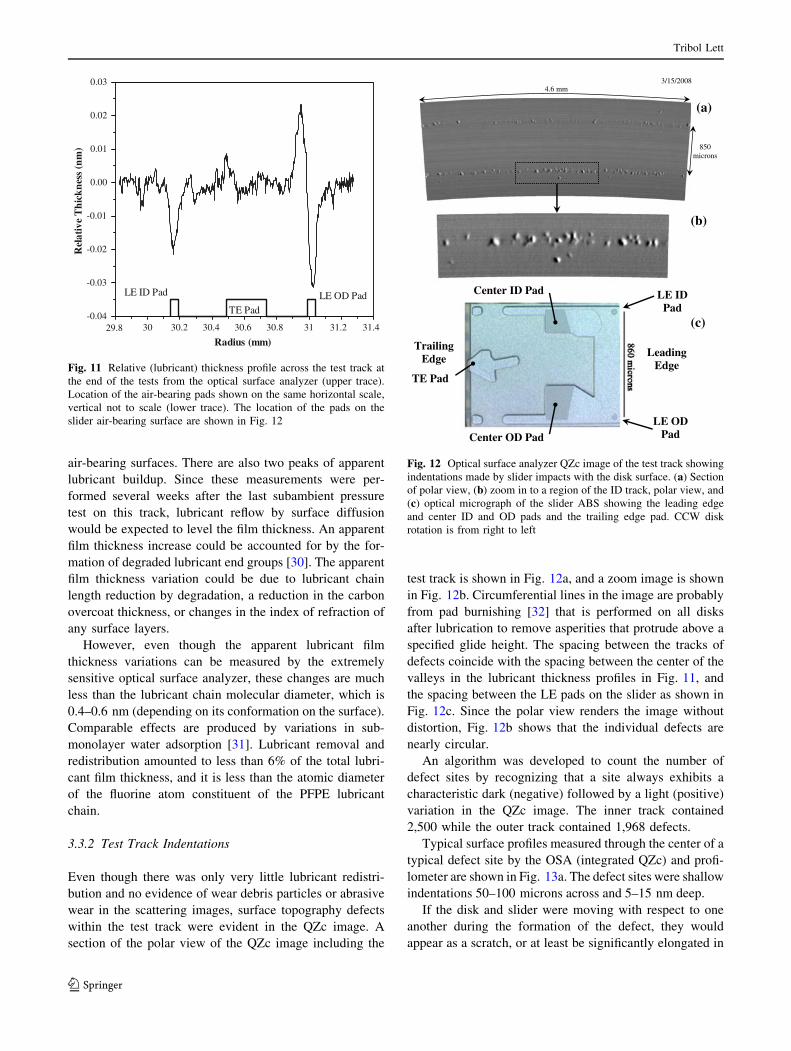
3.2.2 Amplitude Spectra
The amplitude spectra of the fluctuating displacement
signals in Fig. 8 are shown in Fig. 10. The smooth curves
in Fig. 10 show the fit of the single DOF model impulse
response to the fundamental resonance peak of the mea-
sured displacement. The gray trace shows the fit of the
single DOF model driven with random impulses as will be
explained in the Discussion. Frequency components at
multiples of the disk rotational frequency were not
observed in any of the spectra. Thus the resonant vibrations
did not appear to be driven by a particular location on the
disk surface.
3.3 Optical Surface Analysis of the Tested Track
All of the above tests were performed on the same test track.
The first subambient pressure hysteresis loop test was repe-
ated at the end of the test series to verify reproducibility. If
any overcoat wear debris is generated in the test track, there
is no TDP and the steady displacement and vibration char-
acteristic of the bridged state is not observed even down to
the lowest pressures. A minute quantity of atmospheric
particle contamination dramatically reduces or eliminates
the hysteresis loop and friction at low pressure [21].
Sensitive analysis was performed on the test track in
order to further verify the absence of particulate wear
debris and to measure any lubricant removal or redistri-
bution. Scattering images with the circumferential laser
(QSc) verified the absence of wear debris particles on the
disk. With the radial laser, QSc images detected the usual
substrate texture groove pattern (formed in the substrate to
improve the signal to noise ratio of longitudinal magnetic
recording media [29]), but no scratches were found in the
carbon overcoat. Visual inspection of these QSc images of
the test track revealed no evidence of abrasion from slider-
disk contact during the subambient pressure tests.
3.3.1 Lubricant Profile
The test track was visible in the QPh image. As mentioned,
this image is comparable to an ellipsometric measurement.
At each radius, QPh was averaged over 8.2 mm circum-
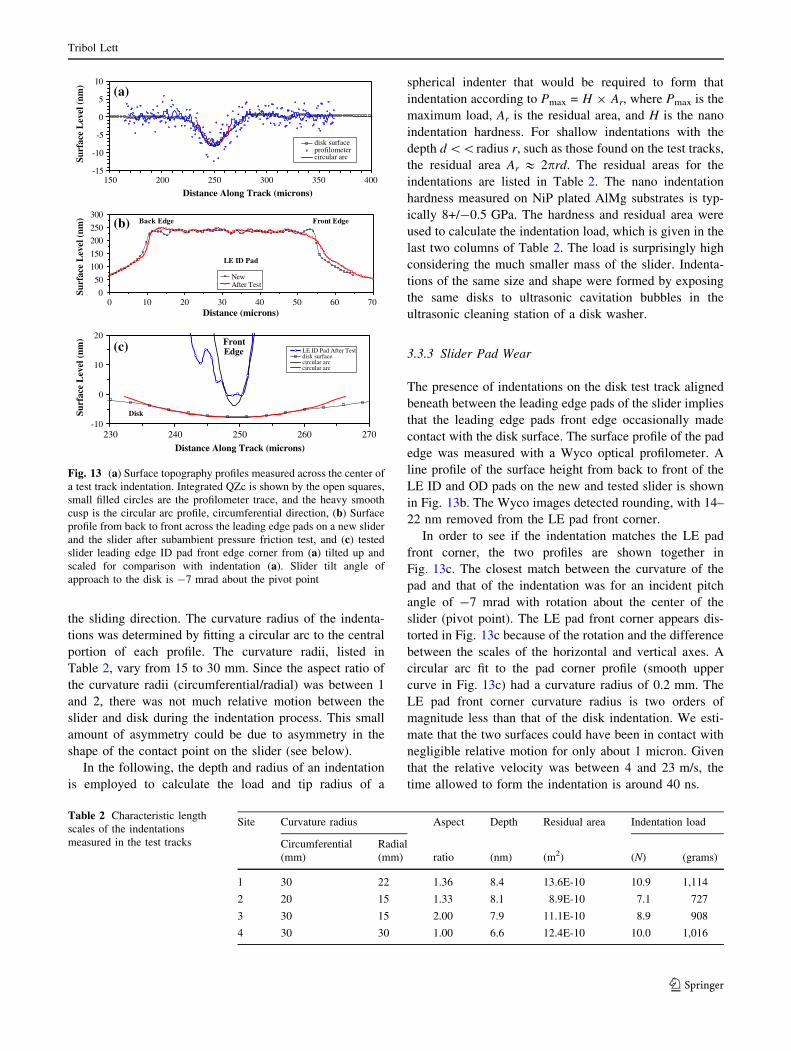
ferentially along the track. The apparent variation in the
lubricant film thickness as a function of radial position
across the test track was calculated from the QPh image
data using a previously determined calibration factor, and
is shown in Fig. 11. There are two regions of apparent
lubricant depletion, which coincide with the location of the
0 50 100 150 200
-0.5
0.0
0.5
Lag (ms)
1300 rpm, 90 kPa
-0.5
0.0
0.5
auto
corr
elat
ion,
Rxx 7200 rpm, 60 kPa
-0.5
0.0
0.5 7200 rpm, 20 kPa (a)
(b)
(c)
Fig. 9 Autocorrelation of the fluctuating displacement in Fig. 8
0 1000 2000 3000 4000 5000
0.1
1
10
0.1
1
10
0.1
1
10
1300 rpm, 90 kPa Single DOF - model Driven Single DOF - model
Frequency (Hz)
7200 rpm, 60 kPa Single DOF - model Driven Single DOF - model
Am
plit
ude
(nm
)
7200 rpm, 20 kPa Single DOF - model Driven Single DOF - model
(a)
(b)
(c)
Fig. 10 Amplitude spectra of the fluctuating displacement versus
time showing the effect of disk rotation rate (linear velocity) and
pressure from the data in Fig. 8. The thick gray trace shows the fit of
the single DOF model impulse response, and the thin gray trace shows
the fit of the dynamically driven single DOF model to the measured
spectrum
Tribol Lett
123
air-bearing surfaces. There are also two peaks of apparent
lubricant buildup. Since these measurements were per-
formed several weeks after the last subambient pressure
test on this track, lubricant reflow by surface diffusion
would be expected to level the film thickness. An apparent
film thickness increase could be accounted for by the for-
mation of degraded lubricant end groups [30]. The apparent
film thickness variation could be due to lubricant chain
length reduction by degradation, a reduction in the carbon
overcoat thickness, or changes in the index of refraction of
any surface layers.
However, even though the apparent lubricant film
thickness variations can be measured by the extremely
sensitive optical surface analyzer, these changes are much
less than the lubricant chain molecular diameter, which is
0.4–0.6 nm (depending on its conformation on the surface).
Comparable effects are produced by variations in sub-
monolayer water adsorption [31]. Lubricant removal and
redistribution amounted to less than 6% of the total lubri-
cant film thickness, and it is less than the atomic diameter
of the fluorine atom constituent of the PFPE lubricant
chain.
3.3.2 Test Track Indentations
Even though there was only very little lubricant redistri-
bution and no evidence of wear debris particles or abrasive
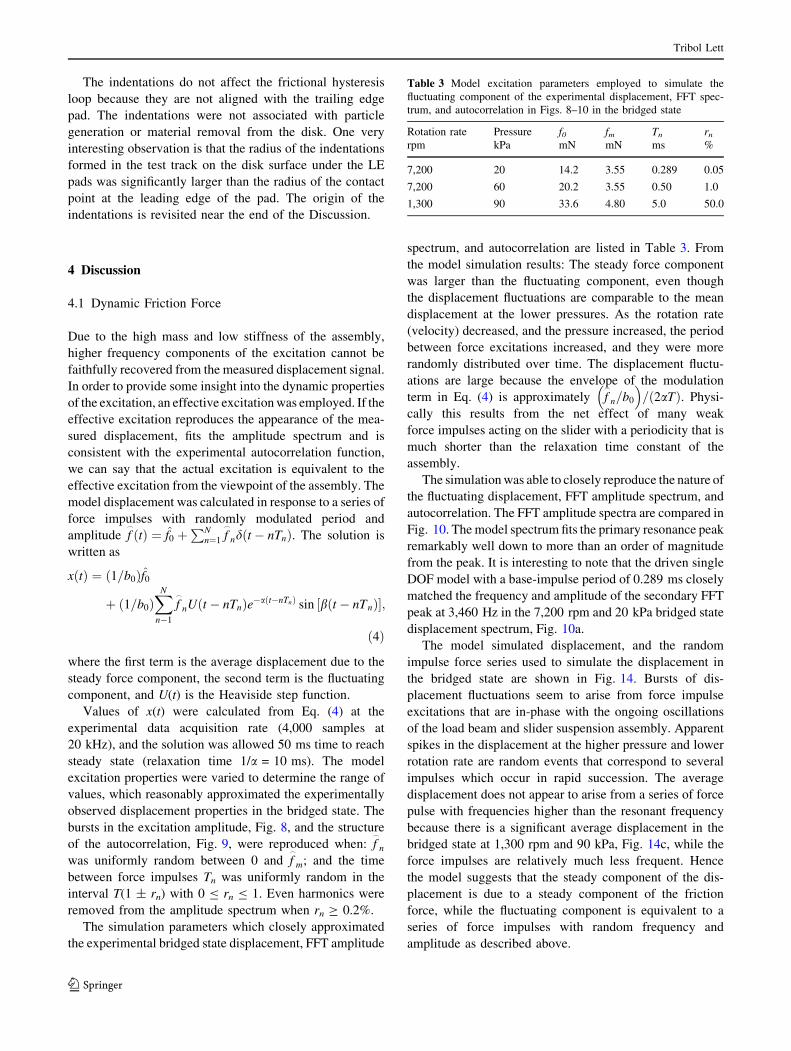
wear in the scattering images, surface topography defects
within the test track were evident in the QZc image. A
section of the polar view of the QZc image including the
test track is shown in Fig. 12a, and a zoom image is shown
in Fig. 12b. Circumferential lines in the image are probably
from pad burnishing [32] that is performed on all disks
after lubrication to remove asperities that protrude above a
specified glide height. The spacing between the tracks of
defects coincide with the spacing between the center of the
valleys in the lubricant thickness profiles in Fig. 11, and
the spacing between the LE pads on the slider as shown in
Fig. 12c. Since the polar view renders the image without
distortion, Fig. 12b shows that the individual defects are
nearly circular.
An algorithm was developed to count the number of
defect sites by recognizing that a site always exhibits a
characteristic dark (negative) followed by a light (positive)
variation in the QZc image. The inner track contained
2,500 while the outer track contained 1,968 defects.
Typical surface profiles measured through the center of a
typical defect site by the OSA (integrated QZc) and profi-
lometer are shown in Fig. 13a. The defect sites were shallow
indentations 50–100 microns across and 5–15 nm deep.
If the disk and slider were moving with respect to one
another during the formation of the defect, they would
appear as a scratch, or at least be significantly elongated in
-0.04
-0.03
-0.02
-0.01
0.00
0.01
0.02
0.03
29.8
Radius (mm)
Rel
ativ
e T
hick
nes
s (n
m)
TE Pad
LE ID Pad LE OD Pad
30 30.2 30.4 30.6 30.8 31 31.2 31.4
Fig. 11 Relative (lubricant) thickness profile across the test track at
the end of the tests from the optical surface analyzer (upper trace).
Location of the air-bearing pads shown on the same horizontal scale,
vertical not to scale (lower trace). The location of the pads on the
slider air-bearing surface are shown in Fig. 12
3/15/20084.6 mm
850microns
LeadingEdge
TrailingEdge
Center ID Pad
Center OD Pad
LE ID Pad
LE OD Pad
TE Pad
(a)
(b)
(c)
Fig. 12 Optical surface analyzer QZc image of the test track showing
indentations made by slider impacts with the disk surface. (a) Section
of polar view, (b) zoom in to a region of the ID track, polar view, and
(c) optical micrograph of the slider ABS showing the leading edge
and center ID and OD pads and the trailing edge pad. CCW disk
rotation is from right to left
Tribol Lett
123
the sliding direction. The curvature radius of the indenta-
tions was determined by fitting a circular arc to the central
portion of each profile. The curvature radii, listed in
Table 2, vary from 15 to 30 mm. Since the aspect ratio of
the curvature radii (circumferential/radial) was between 1
and 2, there was not much relative motion between the
slider and disk during the indentation process. This small
amount of asymmetry could be due to asymmetry in the
shape of the contact point on the slider (see below).
In the following, the depth and radius of an indentation
is employed to calculate the load and tip radius of a
spherical indenter that would be required to form that
indentation according to Pmax = H 9 Ar, where Pmax is the
maximum load, Ar is the residual area, and H is the nano
indentation hardness. For shallow indentations with the
depth d \\radius r, such as those found on the test tracks,
the residual area Ar & 2prd. The residual areas for the
indentations are listed in Table 2. The nano indentation
hardness measured on NiP plated AlMg substrates is typ-
ically 8+/-0.5 GPa. The hardness and residual area were
used to calculate the indentation load, which is given in the
last two columns of Table 2. The load is surprisingly high
considering the much smaller mass of the slider. Indenta-
tions of the same size and shape were formed by exposing
the same disks to ultrasonic cavitation bubbles in the
ultrasonic cleaning station of a disk washer.
3.3.3 Slider Pad Wear
The presence of indentations on the disk test track aligned
beneath between the leading edge pads of the slider implies
that the leading edge pads front edge occasionally made
contact with the disk surface. The surface profile of the pad
edge was measured with a Wyco optical profilometer. A
line profile of the surface height from back to front of the
LE ID and OD pads on the new and tested slider is shown
in Fig. 13b. The Wyco images detected rounding, with 14–
22 nm removed from the LE pad front corner.
In order to see if the indentation matches the LE pad
front corner, the two profiles are shown together in
Fig. 13c. The closest match between the curvature of the
pad and that of the indentation was for an incident pitch
angle of -7 mrad with rotation about the center of the
slider (pivot point). The LE pad front corner appears dis-
torted in Fig. 13c because of the rotation and the difference
between the scales of the horizontal and vertical axes. A
circular arc fit to the pad corner profile (smooth upper
curve in Fig. 13c) had a curvature radius of 0.2 mm. The
LE pad front corner curvature radius is two orders of
magnitude less than that of the disk indentation. We esti-
mate that the two surfaces could have been in contact with
negligible relative motion for only about 1 micron. Given
that the relative velocity was between 4 and 23 m/s, the
time allowed to form the indentation is around 40 ns.
0
50
100
150
200
250
300
0Distance (microns)
Surf
ace
Lev
el (
nm)
NewAfter Test
LE ID Pad
egdEtnorFegdEkcaB
-10
0
10
20
230
Distance Along Track (microns)
Surf
ace
Lev
el (
nm)
LE ID Pad After Testdisk surfacecircular arccircular arc
Front Edge
Disk
-15
-10
-5
0
5
10
150
Distance Along Track (microns)
Surf
ace
Lev
el (
nm)
disk surfaceprofilometercircular arc
(a)
(b)
(c)
200 250 300 350 400
10 20 30 40 50 60 70
240 250 260 270
Fig. 13 (a) Surface topography profiles measured across the center of
a test track indentation. Integrated QZc is shown by the open squares,
small filled circles are the profilometer trace, and the heavy smooth
cusp is the circular arc profile, circumferential direction, (b) Surface
profile from back to front across the leading edge pads on a new slider
and the slider after subambient pressure friction test, and (c) tested
slider leading edge ID pad front edge corner from (a) tilted up and
scaled for comparison with indentation (a). Slider tilt angle of
approach to the disk is -7 mrad about the pivot point
Table 2 Characteristic length
scales of the indentations
measured in the test tracks
Site Curvature radius Aspect Depth Residual area Indentation load
Circumferential Radial
(mm) (mm) ratio (nm) (m2) (N) (grams)
1 30 22 1.36 8.4 13.6E-10 10.9 1,114
2 20 15 1.33 8.1 8.9E-10 7.1 727
3 30 15 2.00 7.9 11.1E-10 8.9 908
4 30 30 1.00 6.6 12.4E-10 10.0 1,016
Tribol Lett
123
The indentations do not affect the frictional hysteresis
loop because they are not aligned with the trailing edge
pad. The indentations were not associated with particle
generation or material removal from the disk. One very
interesting observation is that the radius of the indentations
formed in the test track on the disk surface under the LE
pads was significantly larger than the radius of the contact
point at the leading edge of the pad. The origin of the
indentations is revisited near the end of the Discussion.
4 Discussion
4.1 Dynamic Friction Force
Due to the high mass and low stiffness of the assembly,
higher frequency components of the excitation cannot be
faithfully recovered from the measured displacement signal.
In order to provide some insight into the dynamic properties
of the excitation, an effective excitation was employed. If the
effective excitation reproduces the appearance of the mea-
sured displacement, fits the amplitude spectrum and is
consistent with the experimental autocorrelation function,
we can say that the actual excitation is equivalent to the
effective excitation from the viewpoint of the assembly. The
model displacement was calculated in response to a series of
force impulses with randomly modulated period and
amplitude f_
ðtÞ ¼ f̂0 þPN
n¼1 f_
ndðt � nTnÞ. The solution is
written as
x tð Þ ¼ 1=b0ð Þf̂0
þ 1=b0ð ÞX
N
n�1
f_
nU t � nTnð Þe�a t�nTnð Þ sin b t � nTnð Þ½ �;
ð4Þ
where the first term is the average displacement due to the
steady force component, the second term is the fluctuating
component, and U(t) is the Heaviside step function.
Values of x(t) were calculated from Eq. (4) at the
experimental data acquisition rate (4,000 samples at
20 kHz), and the solution was allowed 50 ms time to reach
steady state (relaxation time 1/a = 10 ms). The model
excitation properties were varied to determine the range of
values, which reasonably approximated the experimentally
observed displacement properties in the bridged state. The
bursts in the excitation amplitude, Fig. 8, and the structure
of the autocorrelation, Fig. 9, were reproduced when: f_
n
was uniformly random between 0 and f_
m; and the time
between force impulses Tn was uniformly random in the
interval T(1 ± rn) with 0 B rn B 1. Even harmonics were
removed from the amplitude spectrum when rn C 0.2%.
The simulation parameters which closely approximated
the experimental bridged state displacement, FFT amplitude
spectrum, and autocorrelation are listed in Table 3. From
the model simulation results: The steady force component
was larger than the fluctuating component, even though
the displacement fluctuations are comparable to the mean
displacement at the lower pressures. As the rotation rate
(velocity) decreased, and the pressure increased, the period
between force excitations increased, and they were more
randomly distributed over time. The displacement fluctu-
ations are large because the envelope of the modulation
term in Eq. (4) is approximately f_
n=b0
� �
= 2aTð Þ. Physi-
cally this results from the net effect of many weak
force impulses acting on the slider with a periodicity that is
much shorter than the relaxation time constant of the
assembly.
The simulation was able to closely reproduce the nature of
the fluctuating displacement, FFT amplitude spectrum, and
autocorrelation. The FFT amplitude spectra are compared in
Fig. 10. The model spectrum fits the primary resonance peak
remarkably well down to more than an order of magnitude
from the peak. It is interesting to note that the driven single
DOF model with a base-impulse period of 0.289 ms closely
matched the frequency and amplitude of the secondary FFT
peak at 3,460 Hz in the 7,200 rpm and 20 kPa bridged state
displacement spectrum, Fig. 10a.
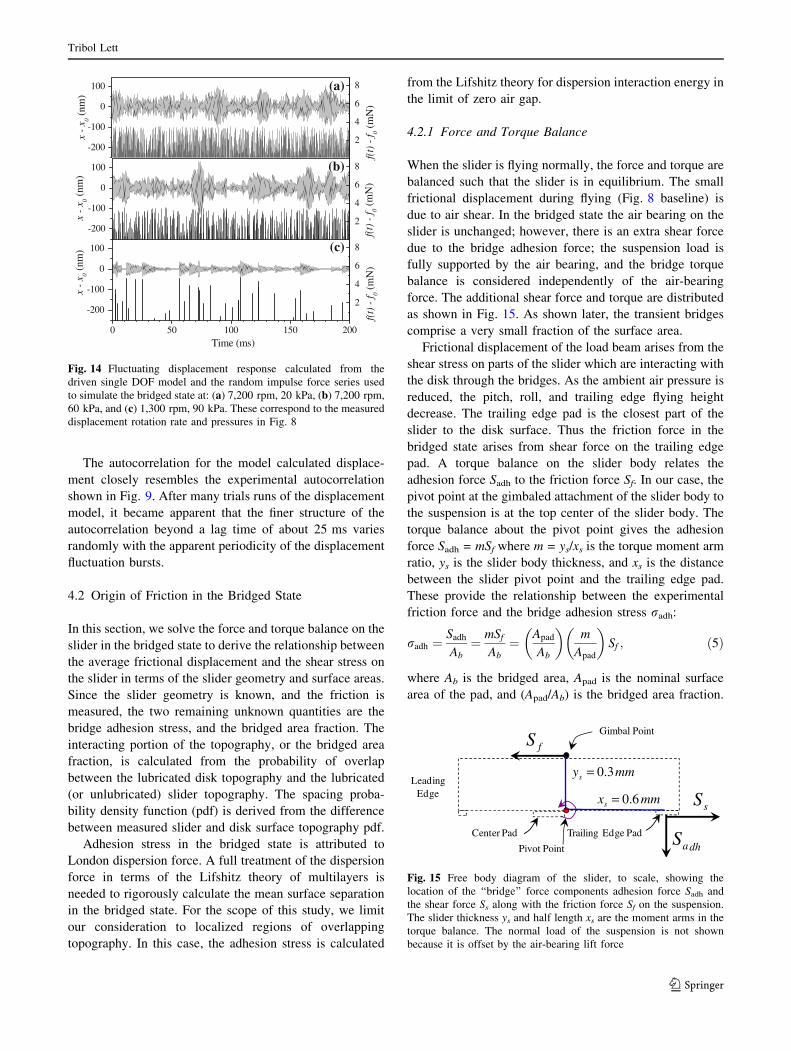
The model simulated displacement, and the random
impulse force series used to simulate the displacement in
the bridged state are shown in Fig. 14. Bursts of dis-
placement fluctuations seem to arise from force impulse
excitations that are in-phase with the ongoing oscillations
of the load beam and slider suspension assembly. Apparent
spikes in the displacement at the higher pressure and lower
rotation rate are random events that correspond to several
impulses which occur in rapid succession. The average
displacement does not appear to arise from a series of force
pulse with frequencies higher than the resonant frequency
because there is a significant average displacement in the
bridged state at 1,300 rpm and 90 kPa, Fig. 14c, while the
force impulses are relatively much less frequent. Hence
the model suggests that the steady component of the dis-
placement is due to a steady component of the friction
force, while the fluctuating component is equivalent to a
series of force impulses with random frequency and
amplitude as described above.
Table 3 Model excitation parameters employed to simulate the
fluctuating component of the experimental displacement, FFT spec-
trum, and autocorrelation in Figs. 8–10 in the bridged state
Rotation rate Pressure f0 fm Tn rn
rpm kPa mN mN ms %
7,200 20 14.2 3.55 0.289 0.05
7,200 60 20.2 3.55 0.50 1.0
1,300 90 33.6 4.80 5.0 50.0
Tribol Lett
123
The autocorrelation for the model calculated displace-
ment closely resembles the experimental autocorrelation
shown in Fig. 9. After many trials runs of the displacement
model, it became apparent that the finer structure of the
autocorrelation beyond a lag time of about 25 ms varies
randomly with the apparent periodicity of the displacement
fluctuation bursts.
4.2 Origin of Friction in the Bridged State
In this section, we solve the force and torque balance on the
slider in the bridged state to derive the relationship between
the average frictional displacement and the shear stress on
the slider in terms of the slider geometry and surface areas.
Since the slider geometry is known, and the friction is
measured, the two remaining unknown quantities are the
bridge adhesion stress, and the bridged area fraction. The
interacting portion of the topography, or the bridged area
fraction, is calculated from the probability of overlap
between the lubricated disk topography and the lubricated
(or unlubricated) slider topography. The spacing proba-
bility density function (pdf) is derived from the difference
between measured slider and disk surface topography pdf.
Adhesion stress in the bridged state is attributed to
London dispersion force. A full treatment of the dispersion
force in terms of the Lifshitz theory of multilayers is
needed to rigorously calculate the mean surface separation
in the bridged state. For the scope of this study, we limit
our consideration to localized regions of overlapping
topography. In this case, the adhesion stress is calculated
from the Lifshitz theory for dispersion interaction energy in
the limit of zero air gap.
4.2.1 Force and Torque Balance
When the slider is flying normally, the force and torque are
balanced such that the slider is in equilibrium. The small
frictional displacement during flying (Fig. 8 baseline) is
due to air shear. In the bridged state the air bearing on the
slider is unchanged; however, there is an extra shear force
due to the bridge adhesion force; the suspension load is
fully supported by the air bearing, and the bridge torque
balance is considered independently of the air-bearing
force. The additional shear force and torque are distributed
as shown in Fig. 15. As shown later, the transient bridges
comprise a very small fraction of the surface area.
Frictional displacement of the load beam arises from the
shear stress on parts of the slider which are interacting with
the disk through the bridges. As the ambient air pressure is
reduced, the pitch, roll, and trailing edge flying height
decrease. The trailing edge pad is the closest part of the
slider to the disk surface. Thus the friction force in the
bridged state arises from shear force on the trailing edge
pad. A torque balance on the slider body relates the
adhesion force Sadh to the friction force Sf. In our case, the
pivot point at the gimbaled attachment of the slider body to
the suspension is at the top center of the slider body. The
torque balance about the pivot point gives the adhesion
force Sadh = mSf where m = ys/xs is the torque moment arm
ratio, ys is the slider body thickness, and xs is the distance
between the slider pivot point and the trailing edge pad.
These provide the relationship between the experimental
friction force and the bridge adhesion stress radh:
radh ¼Sadh
Ab¼ mSf
Ab¼ Apad
Ab
� �
m
Apad
� �
Sf ; ð5Þ
where Ab is the bridged area, Apad is the nominal surface
area of the pad, and (Apad/Ab) is the bridged area fraction.
0 50 100 150 200
-200
-100
0
100
2
4
6
8
2
4
6
8
2
4
6
8
x -
x 0 (nm
)
f(t)
- f 0 (
mN
)
Time (ms)
-200
-100
0
100
x -
x 0 (nm
)
-200
-100
0
100x
- x 0 (
nm)
f(t)
- f 0 (
mN
) f(
t) -
f 0 (m
N)
(a)
(b)
(c)
Fig. 14 Fluctuating displacement response calculated from the
driven single DOF model and the random impulse force series used
to simulate the bridged state at: (a) 7,200 rpm, 20 kPa, (b) 7,200 rpm,
60 kPa, and (c) 1,300 rpm, 90 kPa. These correspond to the measured
displacement rotation rate and pressures in Fig. 8
dhaS
mmxs 6.0=sS
mmys 3.0=
Center Pad Trailing Edge Pad
Pivot Point
Gimbal Point
Leading Edge
fS
Fig. 15 Free body diagram of the slider, to scale, showing the
location of the ‘‘bridge’’ force components adhesion force Sadh and
the shear force Ss along with the friction force Sf on the suspension.
The slider thickness ys and half length xs are the moment arms in the
torque balance. The normal load of the suspension is not shown
because it is offset by the air-bearing lift force
Tribol Lett
123
4.2.2 Spacing Probability Density Function
Real slider and disk surfaces have finite surface rough-
nesses which are each characterized by a surface height
probability density function (pdf). The distance between
the surfaces is characterized by a spacing pdf, referred to
here as the spacing pdf. In this section, we describe the
calculation of the spacing pdf from scanning probe
microscope image profiles for each of the surfaces. The
bridged area fraction is then derived from the spacing pdf.
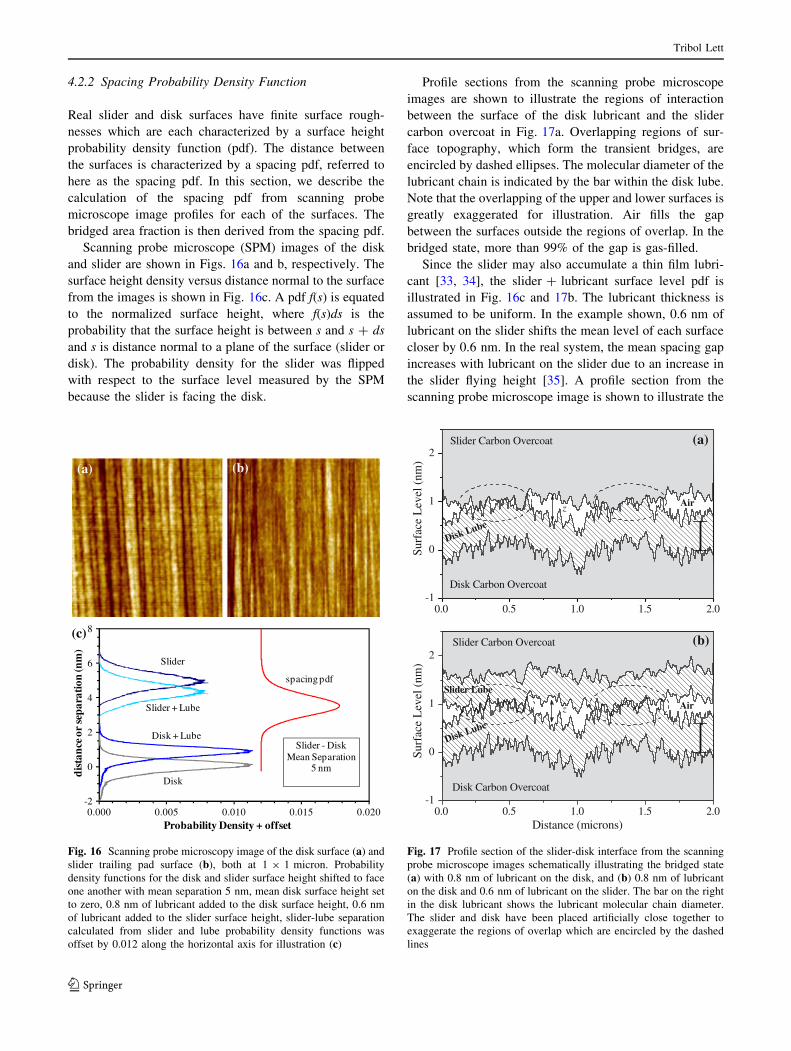
Scanning probe microscope (SPM) images of the disk
and slider are shown in Figs. 16a and b, respectively. The
surface height density versus distance normal to the surface
from the images is shown in Fig. 16c. A pdf f(s) is equated
to the normalized surface height, where f(s)ds is the
probability that the surface height is between s and s + ds
and s is distance normal to a plane of the surface (slider or
disk). The probability density for the slider was flipped
with respect to the surface level measured by the SPM
because the slider is facing the disk.
Profile sections from the scanning probe microscope
images are shown to illustrate the regions of interaction
between the surface of the disk lubricant and the slider
carbon overcoat in Fig. 17a. Overlapping regions of sur-
face topography, which form the transient bridges, are
encircled by dashed ellipses. The molecular diameter of the
lubricant chain is indicated by the bar within the disk lube.
Note that the overlapping of the upper and lower surfaces is
greatly exaggerated for illustration. Air fills the gap
between the surfaces outside the regions of overlap. In the
bridged state, more than 99% of the gap is gas-filled.
Since the slider may also accumulate a thin film lubri-
cant [33, 34], the slider + lubricant surface level pdf is
illustrated in Fig. 16c and 17b. The lubricant thickness is
assumed to be uniform. In the example shown, 0.6 nm of
lubricant on the slider shifts the mean level of each surface
closer by 0.6 nm. In the real system, the mean spacing gap
increases with lubricant on the slider due to an increase in
the slider flying height [35]. A profile section from the
scanning probe microscope image is shown to illustrate the
(b)(a)
-2
0
2
4
6
8
0.000 0.005 0.010 0.015 0.020
dis
tan
ce o
r se
para
tion
(nm
)
Probability Density + offset
Slider
Disk
spacing pdf
Disk + LubeSlider - Disk
Mean Separation 5 nm
Slider + Lube
(c)
Fig. 16 Scanning probe microscopy image of the disk surface (a) and
slider trailing pad surface (b), both at 1 9 1 micron. Probability
density functions for the disk and slider surface height shifted to face
one another with mean separation 5 nm, mean disk surface height set
to zero, 0.8 nm of lubricant added to the disk surface height, 0.6 nm
of lubricant added to the slider surface height, slider-lube separation
calculated from slider and lube probability density functions was
offset by 0.012 along the horizontal axis for illustration (c)
0.0 0.5 1.0 1.5 2.0-1
0
1
2
0.0 0.5 1.0 1.5 2.0-1
0
1
2
Surf
ace
Lev
el (
nm)
Distance (microns)
Slider Carbon Overcoat
Disk Carbon Overcoat
Disk Lube
Slider Lube
Airz
Disk Carbon Overcoat
Surf
ace
Lev
el (
nm)
Slider Carbon Overcoat
Disk Lube
Airz
(a)
(b)
Fig. 17 Profile section of the slider-disk interface from the scanning
probe microscope images schematically illustrating the bridged state
(a) with 0.8 nm of lubricant on the disk, and (b) 0.8 nm of lubricant
on the disk and 0.6 nm of lubricant on the slider. The bar on the right
in the disk lubricant shows the lubricant molecular chain diameter.
The slider and disk have been placed artificially close together to
exaggerate the regions of overlap which are encircled by the dashed
lines
Tribol Lett
123
regions of interaction between the surfaces of the disk
lubricant and the lubricant on the slider in Fig. 17b. Cal-
culations below are performed for an arbitrary combined
lubricant thickness l.
As mentioned above, the slider and disk surface height
are random variables. Hence the slider-disk spacing gap is
also a random variable. Let x represent the height of a point
on the slider surface and y represent the height of a point on
the disk surface relative to a reference plane. For conve-
nience, the reference level is taken to be the mean plane of
the unlubricated disk surface.
The spacing gap at one point between the two surfaces is
z = x–y. For example, notice that z is shown within the air
gap near the middle of Fig. 17a and b. This illustrates a
particular value of the distance that is referred to by z. The
pdf for the difference between two random variables is
given by [36]
fzðzÞ ¼Z
1
�1
fxðz� yÞfyð�yÞ dy: ð6Þ
In practice, the spacing pdf is numerically determined
from the SPM data for the slider fx(x) and the disk fy(y)
according to
T fz zð Þf g ¼ T fx xð Þf g � T� fy yð Þ�
; ð7Þ
where T{} indicates Fourier transform and T*{} is the
complex conjugate of the Fourier Transform. Fast Fourier
Transforms, complex operations, and inverse Fast Fourier
Transforms were performed on the normalize surface
level density data (500 points, 0.041 nm interval) to
obtain the measured spacing pdf fz(z). An example of the
spacing pdf is shown in Fig. 16c, where the mean solid
surface separation is set to 5 nm. Changes in the flying
height or the lubricant thickness only shift fz(z) along the
z-axis. The average, or ‘‘expected value’’ of the separation
changes according to E{z} = E{x}-E{y} where E{}
indicates the expected value and E sf g ¼R
1
�1sfsðsÞds.
Bringing the slider closer to the disk shifts fz(z) to the left
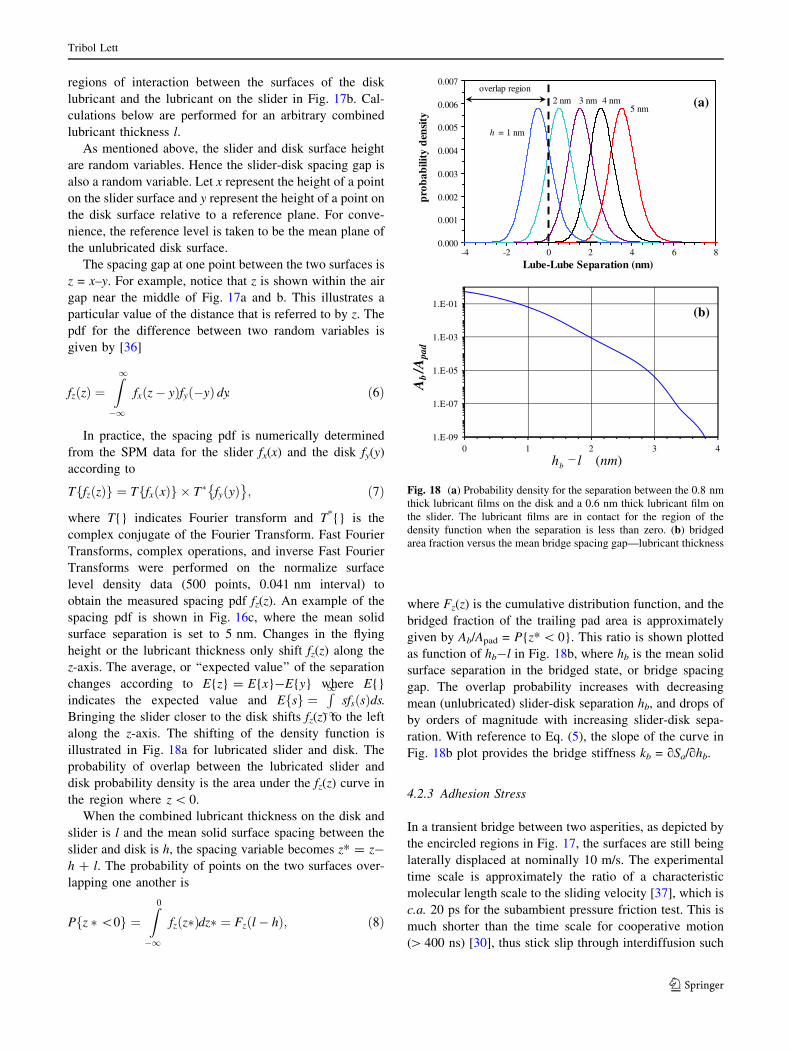
along the z-axis. The shifting of the density function is
illustrated in Fig. 18a for lubricated slider and disk. The
probability of overlap between the lubricated slider and
disk probability density is the area under the fz(z) curve in
the region where z \ 0.
When the combined lubricant thickness on the disk and
slider is l and the mean solid surface spacing between the
slider and disk is h, the spacing variable becomes z* = z-
h + l. The probability of points on the two surfaces over-
lapping one another is
P z �\0f g ¼Z
0
�1
fz z�ð Þdz� ¼ Fzðl� hÞ; ð8Þ
where Fz(z) is the cumulative distribution function, and the
bridged fraction of the trailing pad area is approximately
given by Ab/Apad = P{z* \ 0}. This ratio is shown plotted
as function of hb-l in Fig. 18b, where hb is the mean solid
surface separation in the bridged state, or bridge spacing
gap. The overlap probability increases with decreasing
mean (unlubricated) slider-disk separation hb, and drops of
by orders of magnitude with increasing slider-disk sepa-
ration. With reference to Eq. (5), the slope of the curve in
Fig. 18b plot provides the bridge stiffness kb = qSa/qhb.
4.2.3 Adhesion Stress
In a transient bridge between two asperities, as depicted by
the encircled regions in Fig. 17, the surfaces are still being
laterally displaced at nominally 10 m/s. The experimental
time scale is approximately the ratio of a characteristic
molecular length scale to the sliding velocity [37], which is
c.a. 20 ps for the subambient pressure friction test. This is
much shorter than the time scale for cooperative motion
([400 ns) [30], thus stick slip through interdiffusion such
1.E-09
1.E-07
1.E-05
1.E-03
1.E-01
0 1 2 3 4
Ab/A
pad
)(nmlhb
0.000
0.001
0.002
0.003
0.004
0.005
0.006
0.007
-4 -2 0 2 4 6 8
Lube-Lube Separation (nm)
pro
bab
ility
den
sity
5 nm 4 nm 2 nm
h = 1 nm
3 nm overlap region
(a)
(b)
Fig. 18 (a) Probability density for the separation between the 0.8 nm
thick lubricant films on the disk and a 0.6 nm thick lubricant film on
the slider. The lubricant films are in contact for the region of the
density function when the separation is less than zero. (b) bridged
area fraction versus the mean bridge spacing gap—lubricant thickness
Tribol Lett
123
as that observed at low-velocity sliding of grafted chain
monolayers [38] is absent from the bridged state in our
tests. The premise of the molecular adhesion model is as
follows. Within the short-time scale of a transient ‘‘bridge’’
between two asperities, the lubricant chains respond as
solid-like with respect to interdiffusion, and the shear
planes translate laterally by slipping relative to one another
in presence of dispersive adhesion stress. The dominant
contributions to the dispersion are in the ultraviolet and
infrared. Dispersion force operates on a time scale (1016–
1014 rad/sec), which is much shorter than the lifetime of
the transient bridges. Only dispersion force contributions to
the tensile strength are included in the following, because
the high velocity between the slider and disk asperities
does not allow time for dipole orientation [26], and there
are relatively few polar end groups per unit area of disk
surface [39].
The interaction free energy per unit area between two
material surfaces separated by a planar gap is [40, 41]:
E ¼ kT
2p
X
1
n¼0
0Z
1
0
q dq ln G nnð Þ ð9Þ
where k is the Boltzmann constant, T is absolute
temperature, q is the surface mode wave vector,
nn = n(2pkT/�h), and �h is the reduced Planck constant.
When the spacing gap is thickness L, the force per unit area
across the gap is [42]:
P ¼ � oE
oL¼ � kT
2p
X
1
n¼0
0Z
1
0
q dq1
G nnð ÞoG nnð Þ
oL: ð10Þ
The prime on the summation indicates that the n = 0
term is given half weight. In the case of an air gap between
the lubricated disk and the unlubricated slider
G nnð Þ ¼ 1� DlaDcae�2qL. In the case of an air gap
between the lubricated disk and a lubricated slider
G nnð Þ ¼ 1� D2lae�2qL. Subscript l denotes lubricant, a is
for air, and c is for the carbon overcoat. The Dla and Dca are
functions of the dispersion spectrum for each material pair
and they will be defined later. (Here we consider only the
upper layers in the dispersion force calculation.)
Following Hough and White [43], we invoke a cutoff
wave number qc above which the dispersion interaction
decreases rapidly to zero. Physically this represents the
lower wavelength limit for absorption due to the finite
molecular dimensions of the material. For interaction
energy between two dissimilar materials such as lubricant
and the carbon overcoat, we select the shorter of the two
cutoff wavelengths because of this limitation.
The bridge adhesion stress is then the limiting case of
Eq. (10) air gap L?0, or radh = -P(L?0). For a bridge
between the lubricated disk and an unlubricated slider:
radh unlubed sliderð Þ ¼ kT
3pq3
c
X
1
n¼0
0 DlaDca
1� DlaDcað11Þ
And for a bridge between the lubricated disk and a
lubricated slider:
radh lubed sliderð Þ ¼ kT
3pq3
c
X
1
n¼0
0 D2la
1� D2la
: ð12Þ
Since qc is unknown, it is calculated from the dispersive
surface energy [43, Eq. (7.24)]. The lubricant dispersive
surface energy:
cdl ¼ �
kT
8pq2
c
X
1
n¼0
0 ln 1� D2la
� �
; ð13Þ
and the dispersive surface energy of the carbon overcoat:
cdc ¼ �
kT
8pq2
c
X
1
n¼0
0 ln 1� D2ca
� �
: ð14Þ
Before calculating the surface energy and adhesion
stress, it is necessary to define the quantities Dla and Dca.
The definition arises from a solution of Maxwell’s
equations and summing the allowed normal mode
frequencies [41]:
Dla ¼el innð Þ � 1
el innð Þ þ 1; ð15Þ
and
Dca ¼ec innð Þ � 1
ec innð Þ þ 1; ð16Þ
where i ¼ffiffiffiffiffiffiffi
�1p
, el(inn) is the dispersion spectrum of the
lubricant, and ec(inn) is the dispersion spectrum of the
carbon overcoat. The dispersion spectrum of air is taken to
be 1.
The dispersion spectrum of the lubricant is provided in
White et al. [42, Fig. 2], and the dispersion spectrum of the
carbon overcoat is provided as a:CH in Dagastine et al.
[44, Fig. 2]. The literature values for the dispersion spectra
were fit using a two-frequency Ninham–Parsegian con-
struction [41, 43]:
e nð Þ ¼ 1þ P1
1þ P2 n2þ P3
1þ P4 n2; ð17Þ
where Pi are fitting parameters (Table 4). The Ninham–
Parsegian coefficients can be derived from the UV and IR
absorption spectra, the refractive index as a function of
wavelength through a Cauchy plot [43], or from the in-
terband transition strength measured with electron energy-
loss spectroscopy [40].
As mentioned above, the cutoff wavelength is calculated
from the dispersive surface energy for the carbon overcoat
and lubricant. The dispersive surface energies cd and cutoff
Tribol Lett
123
wavelengths 1/qc for the carbon and lubricant from Eqs.
(13 and 14) are listed in Table 5. These cutoff wavelengths
are close to those reported for alkanes [43].
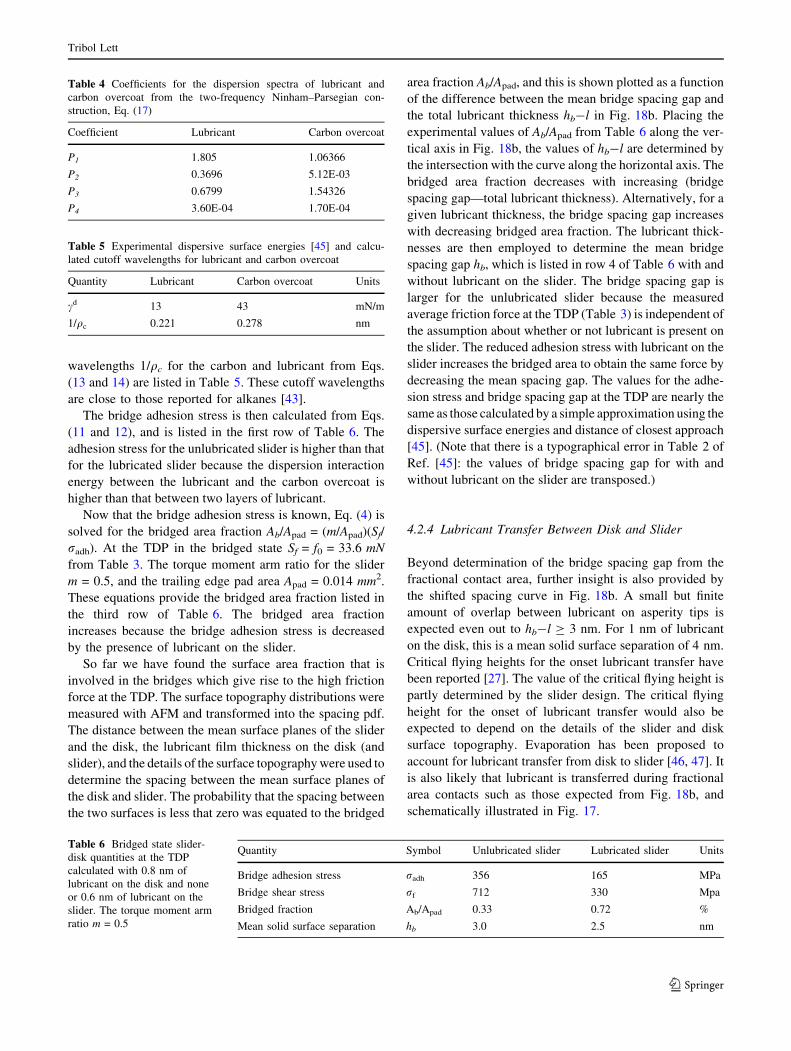
The bridge adhesion stress is then calculated from Eqs.
(11 and 12), and is listed in the first row of Table 6. The
adhesion stress for the unlubricated slider is higher than that
for the lubricated slider because the dispersion interaction
energy between the lubricant and the carbon overcoat is
higher than that between two layers of lubricant.
Now that the bridge adhesion stress is known, Eq. (4) is
solved for the bridged area fraction Ab/Apad = (m/Apad)(Sf/
radh). At the TDP in the bridged state Sf = f0 = 33.6 mN
from Table 3. The torque moment arm ratio for the slider
m = 0.5, and the trailing edge pad area Apad = 0.014 mm2.
These equations provide the bridged area fraction listed in
the third row of Table 6. The bridged area fraction
increases because the bridge adhesion stress is decreased
by the presence of lubricant on the slider.
So far we have found the surface area fraction that is
involved in the bridges which give rise to the high friction
force at the TDP. The surface topography distributions were
measured with AFM and transformed into the spacing pdf.
The distance between the mean surface planes of the slider
and the disk, the lubricant film thickness on the disk (and
slider), and the details of the surface topography were used to
determine the spacing between the mean surface planes of
the disk and slider. The probability that the spacing between
the two surfaces is less that zero was equated to the bridged
area fraction Ab/Apad, and this is shown plotted as a function
of the difference between the mean bridge spacing gap and
the total lubricant thickness hb-l in Fig. 18b. Placing the
experimental values of Ab/Apad from Table 6 along the ver-
tical axis in Fig. 18b, the values of hb-l are determined by
the intersection with the curve along the horizontal axis. The
bridged area fraction decreases with increasing (bridge
spacing gap—total lubricant thickness). Alternatively, for a
given lubricant thickness, the bridge spacing gap increases
with decreasing bridged area fraction. The lubricant thick-
nesses are then employed to determine the mean bridge
spacing gap hb, which is listed in row 4 of Table 6 with and
without lubricant on the slider. The bridge spacing gap is
larger for the unlubricated slider because the measured
average friction force at the TDP (Table 3) is independent of
the assumption about whether or not lubricant is present on
the slider. The reduced adhesion stress with lubricant on the
slider increases the bridged area to obtain the same force by
decreasing the mean spacing gap. The values for the adhe-
sion stress and bridge spacing gap at the TDP are nearly the
same as those calculated by a simple approximation using the
dispersive surface energies and distance of closest approach
[45]. (Note that there is a typographical error in Table 2 of
Ref. [45]: the values of bridge spacing gap for with and
without lubricant on the slider are transposed.)
4.2.4 Lubricant Transfer Between Disk and Slider
Beyond determination of the bridge spacing gap from the
fractional contact area, further insight is also provided by
the shifted spacing curve in Fig. 18b. A small but finite
amount of overlap between lubricant on asperity tips is
expected even out to hb-l C 3 nm. For 1 nm of lubricant
on the disk, this is a mean solid surface separation of 4 nm.
Critical flying heights for the onset lubricant transfer have
been reported [27]. The value of the critical flying height is
partly determined by the slider design. The critical flying
height for the onset of lubricant transfer would also be
expected to depend on the details of the slider and disk
surface topography. Evaporation has been proposed to
account for lubricant transfer from disk to slider [46, 47]. It
is also likely that lubricant is transferred during fractional
area contacts such as those expected from Fig. 18b, and
schematically illustrated in Fig. 17.
Table 4 Coefficients for the dispersion spectra of lubricant and
carbon overcoat from the two-frequency Ninham–Parsegian con-
struction, Eq. (17)
Coefficient Lubricant Carbon overcoat
P1 1.805 1.06366
P2 0.3696 5.12E-03
P3 0.6799 1.54326
P4 3.60E-04 1.70E-04
Table 5 Experimental dispersive surface energies [45] and calcu-
lated cutoff wavelengths for lubricant and carbon overcoat
Quantity Lubricant Carbon overcoat Units
cd 13 43 mN/m
1/qc 0.221 0.278 nm
Table 6 Bridged state slider-
disk quantities at the TDP
calculated with 0.8 nm of
lubricant on the disk and none
or 0.6 nm of lubricant on the
slider. The torque moment arm
ratio m = 0.5
Quantity Symbol Unlubricated slider Lubricated slider Units
Bridge adhesion stress radh 356 165 MPa
Bridge shear stress rf 712 330 Mpa
Bridged fraction Ab/Apad 0.33 0.72 %
Mean solid surface separation hb 3.0 2.5 nm
Tribol Lett
123
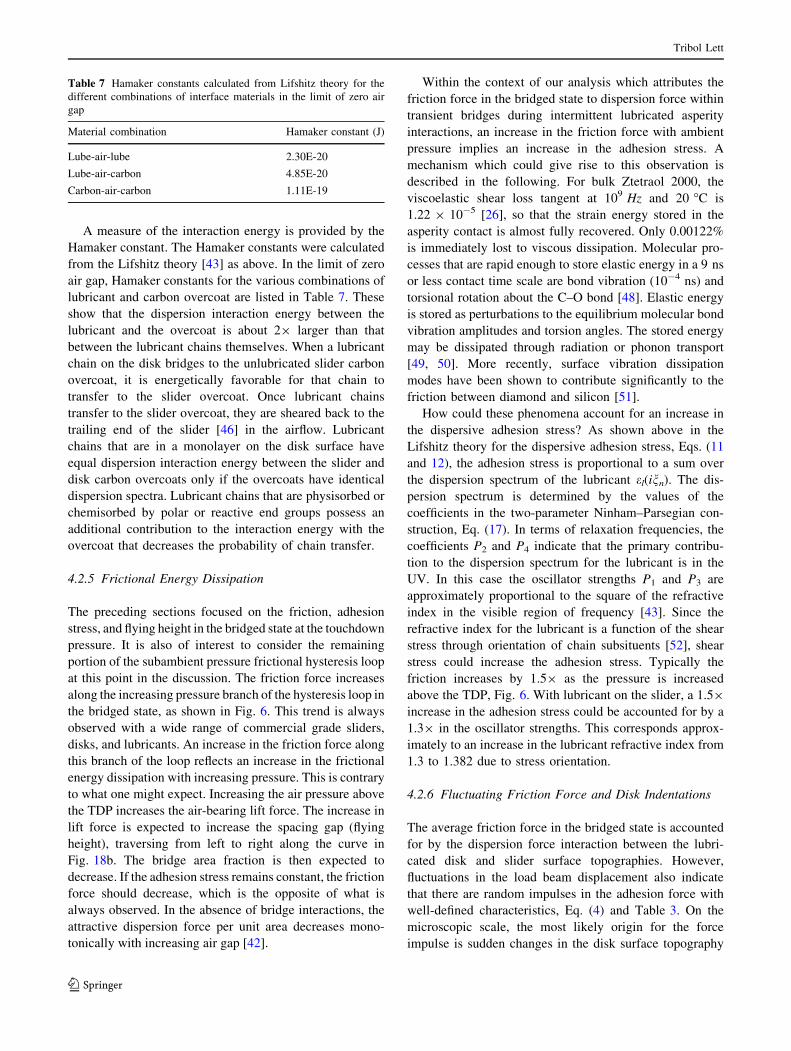
A measure of the interaction energy is provided by the
Hamaker constant. The Hamaker constants were calculated
from the Lifshitz theory [43] as above. In the limit of zero
air gap, Hamaker constants for the various combinations of
lubricant and carbon overcoat are listed in Table 7. These
show that the dispersion interaction energy between the
lubricant and the overcoat is about 29 larger than that
between the lubricant chains themselves. When a lubricant
chain on the disk bridges to the unlubricated slider carbon
overcoat, it is energetically favorable for that chain to
transfer to the slider overcoat. Once lubricant chains
transfer to the slider overcoat, they are sheared back to the
trailing end of the slider [46] in the airflow. Lubricant
chains that are in a monolayer on the disk surface have
equal dispersion interaction energy between the slider and
disk carbon overcoats only if the overcoats have identical
dispersion spectra. Lubricant chains that are physisorbed or
chemisorbed by polar or reactive end groups possess an
additional contribution to the interaction energy with the
overcoat that decreases the probability of chain transfer.
4.2.5 Frictional Energy Dissipation
The preceding sections focused on the friction, adhesion
stress, and flying height in the bridged state at the touchdown
pressure. It is also of interest to consider the remaining
portion of the subambient pressure frictional hysteresis loop
at this point in the discussion. The friction force increases
along the increasing pressure branch of the hysteresis loop in
the bridged state, as shown in Fig. 6. This trend is always
observed with a wide range of commercial grade sliders,
disks, and lubricants. An increase in the friction force along
this branch of the loop reflects an increase in the frictional
energy dissipation with increasing pressure. This is contrary
to what one might expect. Increasing the air pressure above
the TDP increases the air-bearing lift force. The increase in
lift force is expected to increase the spacing gap (flying
height), traversing from left to right along the curve in
Fig. 18b. The bridge area fraction is then expected to
decrease. If the adhesion stress remains constant, the friction
force should decrease, which is the opposite of what is
always observed. In the absence of bridge interactions, the
attractive dispersion force per unit area decreases mono-
tonically with increasing air gap [42].
Within the context of our analysis which attributes the
friction force in the bridged state to dispersion force within
transient bridges during intermittent lubricated asperity
interactions, an increase in the friction force with ambient
pressure implies an increase in the adhesion stress. A
mechanism which could give rise to this observation is
described in the following. For bulk Ztetraol 2000, the
viscoelastic shear loss tangent at 109 Hz and 20 �C is
1.22 9 10-5 [26], so that the strain energy stored in the
asperity contact is almost fully recovered. Only 0.00122%
is immediately lost to viscous dissipation. Molecular pro-
cesses that are rapid enough to store elastic energy in a 9 ns
or less contact time scale are bond vibration (10-4 ns) and
torsional rotation about the C–O bond [48]. Elastic energy
is stored as perturbations to the equilibrium molecular bond
vibration amplitudes and torsion angles. The stored energy
may be dissipated through radiation or phonon transport
[49, 50]. More recently, surface vibration dissipation
modes have been shown to contribute significantly to the
friction between diamond and silicon [51].
How could these phenomena account for an increase in
the dispersive adhesion stress? As shown above in the
Lifshitz theory for the dispersive adhesion stress, Eqs. (11
and 12), the adhesion stress is proportional to a sum over
the dispersion spectrum of the lubricant el(inn). The dis-
persion spectrum is determined by the values of the
coefficients in the two-parameter Ninham–Parsegian con-
struction, Eq. (17). In terms of relaxation frequencies, the
coefficients P2 and P4 indicate that the primary contribu-
tion to the dispersion spectrum for the lubricant is in the
UV. In this case the oscillator strengths P1 and P3 are
approximately proportional to the square of the refractive
index in the visible region of frequency [43]. Since the
refractive index for the lubricant is a function of the shear
stress through orientation of chain subsituents [52], shear
stress could increase the adhesion stress. Typically the
friction increases by 1.59 as the pressure is increased
above the TDP, Fig. 6. With lubricant on the slider, a 1.59
increase in the adhesion stress could be accounted for by a
1.39 in the oscillator strengths. This corresponds approx-
imately to an increase in the lubricant refractive index from
1.3 to 1.382 due to stress orientation.
4.2.6 Fluctuating Friction Force and Disk Indentations
The average friction force in the bridged state is accounted
for by the dispersion force interaction between the lubri-
cated disk and slider surface topographies. However,
fluctuations in the load beam displacement also indicate
that there are random impulses in the adhesion force with
well-defined characteristics, Eq. (4) and Table 3. On the
microscopic scale, the most likely origin for the force
impulse is sudden changes in the disk surface topography
Table 7 Hamaker constants calculated from Lifshitz theory for the
different combinations of interface materials in the limit of zero air
gap
Material combination Hamaker constant (J)
Lube-air-lube 2.30E-20
Lube-air-carbon 4.85E-20
Carbon-air-carbon 1.11E-19
Tribol Lett
123
as the track passes underneath the slider. In the bridged
state in the first row of Table 3, the maximum impulse
force amplitude is 3.55 mN on an average force of
14.2 mN. This corresponds to impulse changes of 25% in
the bridged area fraction Ab/Apad in Eq. (5).
The presence of disk indentations in the test track pro-
vides evidence for an occasional force impulse as high as
10 N, Table 2. The maximum adhesion force calculated
from the adhesion stress is 5 N for an unlubricated slider
and 2 N for a lubricated slider. This apparent anomaly can
be accounted for through the impact mechanism of Tao
et al. [2], which predicts the growth of plastic deformation
in the region peripheral to the contact where the von Mises
equivalent stress exceeds the yield strength. The contact
loads in their finite element model were 300 and
500 grams, which is about half of our equivalent load in
Table 2.
5 Summary and Conclusions
As the ambient pressure is decreased with the magnetic
recording slider initially flying over the lubricated disk
surface, there is a sudden transition to high friction and
vibration (bridged state) at some low touchdown pressure.
As the pressure is increased, the high friction state persists
well above the touchdown pressure before returning to the
flying state. The friction pressure curve forms a subambient
pressure frictional hysteresis loop. In hysteresis loop tests
performed over a range of disk rotation rate, the transition
to the bridged state occurred at the same flying height,
independent of linear velocity. The head suspension strain
gage assembly was modeled as a single degree of freedom
linear spring mass dashpot equivalent mechanical system
to determine the equivalent excitation function from the
strain gage. While in the bridged state, there is a steady
force and a series of force impulses with random period
and amplitude.
During several hysteresis loop tests, optical surface
analysis detected less than 0.03 nm of lubricant removal
from the test track, and no overcoat damage or wear debris.
However, evidence for occasional impact of the leading
edge pads by a sudden pitch down of the slider was
observed. The impact events formed shallow indentations
in the disk. Optical interference profilometry detected a
slight rounding on the front edges of the circular leading
edge pads of the slider.
On the time scale of an asperity contact in the bridged
state, the lubricant is viscoelastic solid-like. The Lifshitz
theory for dispersion interaction was employed to derive
the adhesion stress. The slider and disk surface spacing pdf
was derived from the measured surface topographies to
obtain the bridged area fraction. These were combined with
the average friction force to calculate the mean spacing at
the touchdown pressure.
An increase in the friction force with pressure along the
increasing pressure branch of the hysteresis loop is con-
sistent with a stress-induced increase in the oscillator
strength of the lubricant molecular orbitals.
Force impulses are consistent with point–to-point vari-
ations in the surface topography around the disk
circumference. Occasional indentations suggest impact
force on the order of Newtons, and these can be accounted
for by occasional regions of surface topography with a
high-bridged area fraction.
Lubricant transfer to low-flying sliders can be accounted
for by a higher dispersive interaction energy between the
carbon overcoat than between the lubricant chains them-
selves, and slight overlap of the slider and disk surface
topographies. This is quantified in terms of the spacing pdf.
Friction force between the low-flying slider and a
molecularly thin film of perfluoropolyether lubricant can be
fully accounted for by dispersion force without invoking
the presence of a liquid meniscus.
Acknowledgments We thank B. Marchon, P. Baumgart, M. Mate,
V. Nayak, R. Payne, B. Knigge, F. Hendriks, and Q. Dai for technical
discussions. The authors are also grateful to J. He, R. White, J.
Hopkins, and R-H. Wang for their assistance with the investigations
of surface indentations.
References
1. Yuan, Z-M., Liu, B., Wang, J.: Flash temperature induced mag-
netic degradation in high density magnetic recording. J. Appl.
Phys. 87, 6158–6160 (2000)
2. Tao, Q., Lee, H.P., Lim, S.P.: Contact analysis of impact in
magnetic head disk interfaces. Tribol. Int. 36, 49–56 (2003)
3. Thornton, B.H., Bogy, D.B.: Head-disk interface dynamic insta-
bility due to intermolecular forces. IEEE Trans. Magn. 39, 2420–
2422 (2003)
4. Ambekar, R., Gupta, V., Bogy, D.B.: Experimental and numeri-
cal investigation of dynamic instability in the head disk interface
at proximity. J. Tribol. 127, 530–536 (2005)
5. Kato, T., Watanabe, S., Matsuoka, H.: Dynamic characteristics of
an in-contact head slider considering meniscus force: part 1—
formulation and application to the disk with sinusoidal undula-
tion. J. Tribol. 122, 633–638 (2000)
6. Kato, T., Watanabe, S., Matsuoka, H.: Dynamic characteristics of
an in-contact head slider considering meniscus force: part 2—
application to the disk with random undulation and design con-
ditions. J. Tribol. 123, 168–174 (2001)
7. Tanaka, H., Yonemura, S., Tokisue, H.: Slider dynamics during
continuous contact with textured and smooth disks in ultra low
flying height. IEEE Trans. Magn. 37, 906–911 (2001)
8. Mate, C.M., Arnett, P.C., Baumgart, P., Dai, Q., Guruz,
U.M., Knigge, B.E., Payne, R.N., Ruiz, O.J., Wang, G.J.,
Yen, B.K.: Dynamics of contacting head-disk interfaces. IEEE
Trans. Magn. 40, 3156–3158 (2004)
9. Xu, J.G., Kohira, H., Tanaka, H., Saegusa, S.: Partial-contact
head-disk interface approach for high-density recording. IEEE
Trans. Magn. 41, 3031–3033 (2005)
Tribol Lett
123
10. Ono, K., Ohara, S.: Experimental identification of elastic,
damping and adhesion forces in collision of spherical sliders with
stationary magnetic disks. J. Tribol. 127, 365–375 (2005)
11. Ono, K., Yamane, M., Yamaura, H.: Experimental and analytical
study of bouncing vibrations of a flying head slider in a near-
contact regime. J. Tribol. 127, 376–386 (2005)
12. Mayeed, M.S., Kato, T., Jhon, M.S., Mitsuya, Y.: Surface per-
turbations on the perfluoropolyether molecules in the melt and the
gas-like conditions. IEEE Trans. Magn. 40, 3180–3182 (2004)
13. Matsuoka, H., Ohkubo, S., Fukui, S.: Corrected expression of the
van der Waals pressure for multilayered system with application
to analyses of static characteristics of flying head sliders with an
ultrasmall spacing: Microsyst Techn. Micro Nanosyst—Inf. Stor.
Proc. Syst. 11, 824–829 (2005)
14. Tanaka, K., Kato, T., Matsumoto, Y.: Molecular dynamics sim-
ulation of vibrational friction force due to molecular deformation
in confined lubricant film. J. Tribol. 125, 587–591 (2003)
15. Kamei, D., Zhou, H., Suzuki, K., Konno, K., Takami, S., Kubo,
M., Miyamoto, A.: Computational chemistry study on the
dynamics of lubricant molecules under shear conditions. Tribol.
Int. 36, 297–303 (2003)
16. Khurshudov, A., Baumgart, P., Waltman, R.J.: In-situ quantita-
tive analysis of nano-scale lubricant migration at the slider-disk
interface. Wear 229, 690–699 (1999)
17. Khurshudov, A., Waltman, R.J.: The contribution of thin PFPE
lubricants to slider-disk spacing. Tribol. Lett. 11, 143–149 (2001)
18. Waltman, R.J., Khurshudov, A.G.: The contribution of thin PFPE
lubricants to slider-disk spacing. 2. effect of film thickness and
lubricant end groups. Tribol. Lett. 13, 197–202 (2002)
19. Novotny, V.J.: Mechanical integration of high recording density
drives. IEEE Trans. Magn. 32, 1826–1831 (1996)
20. Karis, T.E., Tawakkul, M.A.: Water adsorption and friction on thin
film magnetic recording disks. Tribol. Trans. 46, 469–478 (2003)
21. Karis, T.E., Nayak, U.V.: Liquid nanodroplets on thin film
magnetic recording disks. Tribol. Trans. 47, 103–110 (2004)
22. Karis, T.E., Kim, W.T., Jhon, M.S.: Spreading and dewetting in
nanoscale lubrication. Tribol. Lett. 18, 27–41 (2005)
23. Tagawa, N., Mori, A.: Effects of functional end-groups on nano-
tribology characteristics of ultra-thin liquid lubricant films in hard
disk drives. IEEE Trans. Magn. 41, 825–830 (2005)
24. Bai, M., Kato, K.: Analysis of contact deformation and stiction
between textured disk and textured slider. J. Tribol. 123, 350–357
(2001)
25. Suh, A.Y., Polycarpou A.: Adhesive contact modeling for sub-5-
nm ultralow flying magnetic storage head-disk interfaces
including roughness effects. J. Appl. Phys. 97, 104328-1–
104328-11 (2005)
26. Karis, T.E.: Lubricants for the disk drive industry. In: Rudnick, L.
(ed.), Synthetic, Mineral Oil, and Bio-Based Lubricants Chem-
istry and Technology, CRC Press, Taylor & Francis Group, LLC,
Boca Raton, FL, pp. 623–654 (2006)
27. Ambekar, R.P., Bogy D.B., Dai Q., Marchon B.: Critical clear-
ance and lubricant instability at the head-disk interface of a disk
drive. Appl. Phys. Lett. 92, 033104-1–033104-3 (2008)
28. Crone, R.M., Peck, P.R., Jhon, M.S., Karis, T.E.: Scaling criteria
for slider miniaturization using the generalized reynolds equation.
J. Tribol. 115, 566–572 (1993)
29. Karis, T.E., Guo, X.-C., Marinero, E., Marchon, B.: Surface
chemistry of NiP plated substrates. IEEE Trans. Magn. 41, 3247–
3249 (2005)
30. Karis, T.E.: Tribochemistry in contact recording. Tribol. Lett. 10,
149–162 (2001)
31. Karis, T.E.: Water adsorption on thin film magnetic recording
media. J. Coll. Int. Sci. 225, 196–203 (2000)
32. Man, Y.J., Yu S.K., Liu B.: Characterization and formation
mechanism understanding of asperities to be burnished. J. Magn.
Magn. Mater. 303, e101–e105 (2006)
33. Fred Li, Z., Chen, C-Y., Liu, J.J.: Study of head-disk interference
at low-flying height. IEEE Trans. Magn. 39, 2462–2464 (2003)
34. Marchon, B., Karis, T., Dai, Q., Pit, R.: A model for lubricant
flow from disk to slider. IEEE Trans. Magn. 39, 2447–2449
(2003)
35. Ma, X., Chen, J., Richter, H.J., Tang, H., Gui, J.: Contribution of
lubricant thickness to head—media spacing. IEEE Trans. Magn.
37, 1824–1826 (2001)
36. Papoulis, A.: Probability, Random Variables, and Stochastic
Processes, McGraw-Hill Book Company, New York, NY (1965)
37. Yoshizawa, H., Chen, Y-L., Israelachvili, J.: Fundamental
mechanisms of interfacial friction. 1. relation between adhesion
and friction. J. Phys. Chem. 97, 4128–4140 (1993)
38. Persson, B.N.J.: Theory of friction: friction dynamic for boundary
lubricated surfaces. Phys. Rev. B 55, 8004–8012 (1997)
39. Yatsue, T., Ishihara, H., Matsumoto, H., Tani, H.: Design of
carbon surface functional groups on the viewpoint of lubricant
layer structure. Trib. Trans. 43, 802–808 (2000)
40. French, R.H.: Origins and applications of london dispersion
forces and hamaker constants in ceramics. J. Am. Ceram. Soc. 83,
2117–2146 (2000)
41. Ninham, B.W., Parsegian, V.A.: Van der walls forces across
triple-layer films. J. Chem. Phys. 52, 4578–4587 (1970)
42. White, L.R., Dagastine, R.R., Jones, P.M., Hsia Y-T.: Van der
waals force calculation between laminated media, pertinent to the
magnetic storage head-disk interface. J. Appl. Phys. 97, 104503
(2005)
43. Hough, D.B., White, L.R.: The calculation of hamaker constants
from lifshitz theory with applications to wetting phenomena.
Adv. Coll. Int. Sci. 14, 3–41 (1980)
44. Dagastine, R.R., White, L.R., Jones, P.M., Hsia Y-T.: Effect of
media overcoat on van der waals interaction at the head-disk
interface. J. Appl. Phys. 97, 126106 (2005)
45. Karis, T.E., Guo X-C.: Molecular adhesion model for the bridged
state of a magnetic recording slider. IEEE Trans. Magn. 43,
2232–2234 (2007)
46. Marchon, B., Karis, T., Dai, Q., Pit, R.: A model for lubricant
flow from disk to slider. IEEE Trans. Magn. 39, 2447–2449
(2003)
47. Ma, Y.S., Liu, G.: Lubricant transfer from disk to slider in hard
disk drives. Appl. Phys. Lett. 90, 143516 (2007)
48. Waltman, R.J., Tyndall, G.W., Pacansky, J., Berry, R.J.: Impact
of polymer structure and confinement on the kinetics of zdol 4000
bonding to amorphous-hydrogenated carbon. Tribol. Lett. 7, 91–
102 (1999)
49. Aranson, I.S., Tsimring, L.S., Vinokur, V.M.: Stick-slip friction
and nucleation dynamics of ultrathin liquid films. Phys. Rev. B
65, 125402 (2002)
50. Narumanchi, S.V.J., Murthy, J.Y., Amon, C.H.: Boltzmann
transport equation-based thermal modeling approaches for hot-
spots in microelectronics. Heat Mass Transfer 42, 478–491
(2006)
51. Cannara, R.J., Brukman, M.J., Cimatu, K., Sumant, A.V., Bald-
elli, S., Carpick, R.W.: Nanoscale friction varied by isotopic
shifting of surface vibrational frequencies. Science 318, 780–783
(2007)
52. Mriziq, K.S., Dai, H.J., Dadmun, M.D., Jellison, G.E., Cochran,
H.D.: High-shear-rate optical rheometer. Rev. Sci. Instr. 75,
2171–2176 (2004)
Tribol Lett
123


![EII,,l|{'11, Cetr* EiiFI-)aougc.portal.gov.bd/sites/default/files/files/ugc.portal...2020/08/12 · t Llll{r,.tHIr !& EI]J$+ l.. hMd, ffu{;r,{fr](https://img.pdfslide.us/doc/110x75/5fcea6d45a27736278507525/eiil11-cetr-eiifi-aougc-20200812-t-llllrthir-eij.jpg)