Embed Size (px)
Citation preview

SUPPLEMENTARY DATA
Chemical Genetic Screen Reveals a Role for Desmosomal Adhesion in Mammary Branching Morphogenesis*
Kaitlin J. Basham1,7, Collin Kieffer1,6,7, Dawne N. Shelton1, Christopher J. Leonard1, Vasudev R.
Bhonde2, Hariprasad Vankayalapati3, Brett Milash4, David J. Bearss3, Ryan E. Looper2, and Bryan E. Welm1,5
From the 1Department of Oncological Sciences, Huntsman Cancer Institute, 2the Department of
Chemistry, 3the Center for Investigational Therapeutics, Huntsman Cancer Institute, 4the Microarray and Genomic Analysis Core Facility, Huntsman Cancer Institute, 5the Department of Surgery, University of
Utah, Salt Lake City, UT 84112 USA. 6Present address: Division of Biology, California Institute of Technology, Pasadena, CA 91125. 7These authors contributed equally to this work.
*Running title: Chemical screen shows desmosomes regulate mammary branching
To whom correspondence should be addressed: Bryan E. Welm, PhD, Department of Surgery, Department of Oncological Sciences, Huntsman Cancer Institute, University of Utah, 2000 Circle of Hope Dr., Salt Lake City, UT, 84112, USA, Tel.: (801) 587-4633; Fax: (801) 585-9872; E-mail: [email protected] Keywords: aryl hydrocarbon receptor; chemical genetics; desmosomes; drug screen; mammary gland
Chemical screen shows desmosomes regulate mammary branching
1

SUPPLEMENTAL RESULTS
SUPPLEMENTAL FIGURE S1. MECs treated with 1023 maintain an epithelial bilayer. A. Representative DIC image of a primary MEC aggregate grown with 2.5 nM FGF2 and DMSO. B. Representative DIC image of a primary MEC aggregate grown with 2.5 nM FGF2 and 10 µM 1023. C-D. Immunofluorescence staining of a luminal epithelial marker, keratin-8 (K8, in green), and a myoepithelial marker, keratin-14 (K14, in red) in MEC aggregates grown in the FGF2 branching assay. Nuclei were stained with DAPI (in blue). C. Representative staining of a primary MEC aggregate grown with 2.5 nM FGF2 and DMSO. D. Representative staining of a primary MEC aggregate grown with 2.5 nM FGF2 and 10 µM 1023. 1023 maintained an epithelial bilayer, with luminal epithelial cells (in green) surrounded by myoepithelial cells (in red). A-D. Aggregates were grown for 144 hours in Matrigel. Scale bar = 40 µm.
Chemical screen shows desmosomes regulate mammary branching
2
SUPPLEMENTAL FIGURE S2. 1023 and TCDD activate AHR to translocate to the nucleus. Representative images of HEK-293T cells transiently expressing pACTAG2-HA-AHR after 24 hours of treatment. 10 nM TCDD and 10 µM 1023 increased nuclear localization of AHR compared to DMSO or 10 µM 1023-CF3. Dashed white line defines nuclei. Scale bar = 10 µm.
Chemical screen shows desmosomes regulate mammary branching
3
Chemical screen shows desmosomes regulate mammary branching
4

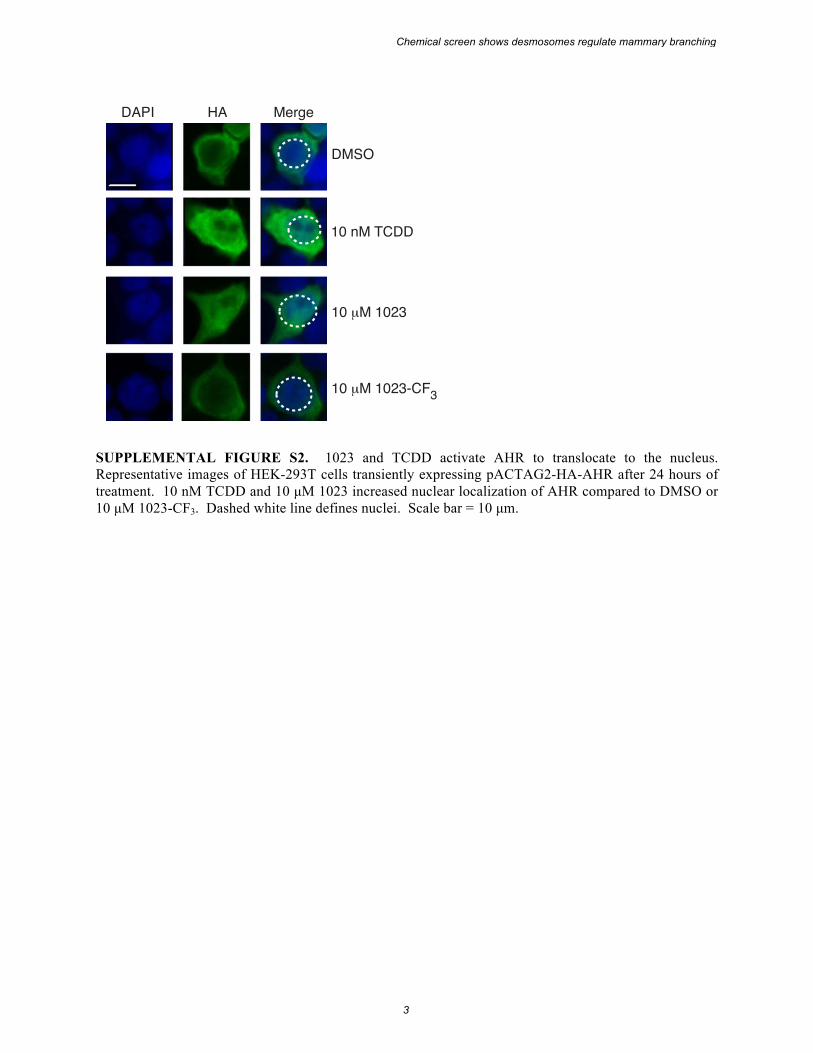
SUPPLEMENTAL FIGURE S3. AHR is the biological target of 1023. A. AHR gene expression in HC11 cells stably expressing shAHR-1. B. ARNT gene expression in HC11 cells stably expressing either shARNT-1 or shARNT-2. A-B. Gene expression was measured by RT-PCR in stable cell lines 7 days after lentiviral transduction and normalized to beta-actin. Results are shown as mean ± s.e.m. C. Cyp1a1 gene expression in untransduced HC11 cells or cells stably expressing a control shRNA, an shRNA against AHR (shAHR-1), or an shRNA against ARNT (shARNT-1 or shARNT-2). Cyp1a1 gene expression was measured by RT-PCR after 6 days of treatment with DMSO or 10 nM TCDD and normalized to beta-actin expression. Results are shown as mean ± s.e.m. D. AHR gene expression in primary MECs after transduction with lentiviral shRNA constructs against AHR. Gene expression was measured by RT-PCR in primary MECs sorted by FACS for GFP expression and normalized to beta-actin. Results are shown as mean ± s.e.m. E. Quantification of percent branching in untransduced outgrowths from primary MECs infected with a lentiviral control shRNA (Control) or shRNA against AHR (shAHR-1 or shAHR-2). Results are shown as mean ± s.d; n = 2. F. Representative images of a clonal outgrowth from primary MECs transduced with shAHR-1. Scale bar = 40 µm. E-F. Following transduction, cells were embedded in Matrigel as single cells and grown for 21 days in the presence of 2.5 nM FGF2 and DMSO, 10 nM TCDD, or 10 µM 1023.
Chemical screen shows desmosomes regulate mammary branching
5

SUPPLEMENTAL FIGURE S4. AHR activation increases expression of desmosomal cadherins. A. Relative gene expression of desmocollin 1 (Dsc1). B. Relative gene expression of desmoglein 1 (Dsg1). A-B. Aggregated primary MECs were grown for 96 hours in Matrigel with 2.5 nM EGF or 2.5 nM FGF2 and DMSO, 10 nM TCDD, or 10 µM 1023. C. Relative gene expression of Dsg1 in HC11 cells after treatment with 10 nM TCDD. D. Relative gene expression of Dsg1 in HC11 cells after treatment with 10 µM 1023. C-D. Gene expression was measured in untransduced HC11 cells or cells stably expressing a control shRNA, an shRNA against AHR (shAHR-1), or an shRNA against ARNT (shARNT-1 or shARNT-2) after 6 days of compound treatment. A-D. Gene expression was measured by RT-PCR and normalized to beta-actin expression. Results are shown as mean ± s.e.m.
Chemical screen shows desmosomes regulate mammary branching
6
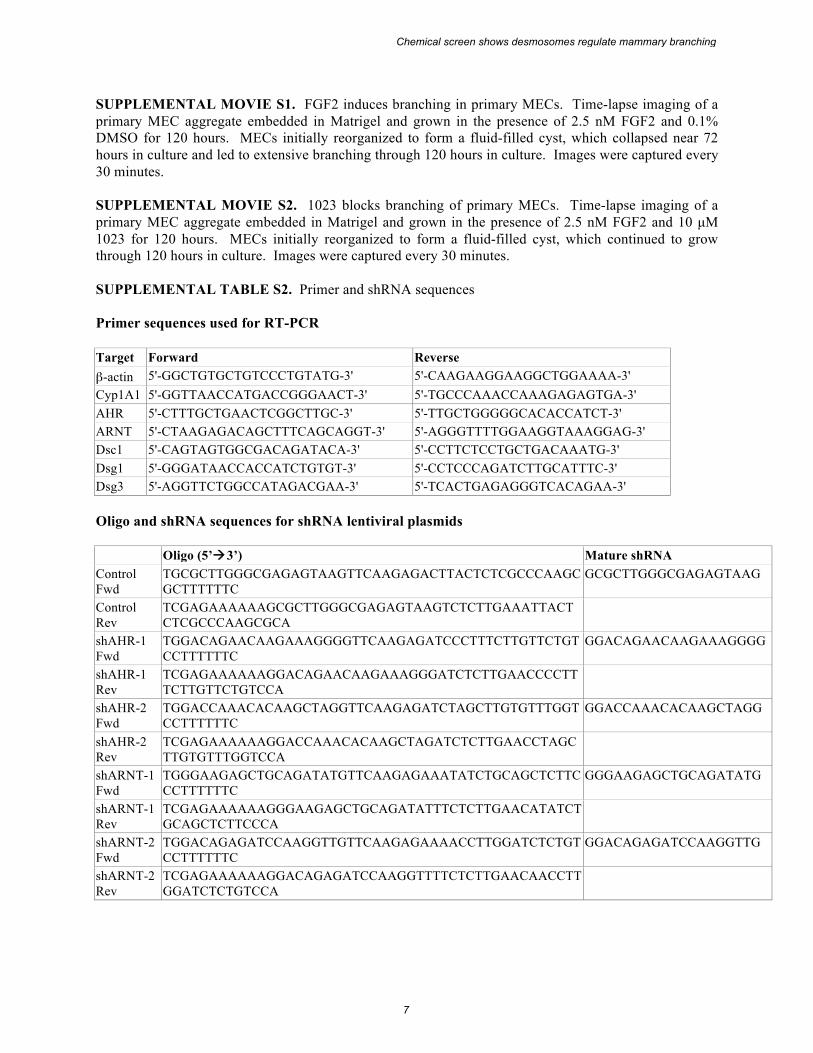
SUPPLEMENTAL MOVIE S1. FGF2 induces branching in primary MECs. Time-lapse imaging of a primary MEC aggregate embedded in Matrigel and grown in the presence of 2.5 nM FGF2 and 0.1% DMSO for 120 hours. MECs initially reorganized to form a fluid-filled cyst, which collapsed near 72 hours in culture and led to extensive branching through 120 hours in culture. Images were captured every 30 minutes. SUPPLEMENTAL MOVIE S2. 1023 blocks branching of primary MECs. Time-lapse imaging of a primary MEC aggregate embedded in Matrigel and grown in the presence of 2.5 nM FGF2 and 10 µM 1023 for 120 hours. MECs initially reorganized to form a fluid-filled cyst, which continued to grow through 120 hours in culture. Images were captured every 30 minutes. SUPPLEMENTAL TABLE S2. Primer and shRNA sequences Primer sequences used for RT-PCR Target Forward Reverse β-actin 5'-GGCTGTGCTGTCCCTGTATG-3' 5'-CAAGAAGGAAGGCTGGAAAA-3' Cyp1A1 5'-GGTTAACCATGACCGGGAACT-3' 5'-TGCCCAAACCAAAGAGAGTGA-3' AHR 5'-CTTTGCTGAACTCGGCTTGC-3' 5'-TTGCTGGGGGCACACCATCT-3' ARNT 5'-CTAAGAGACAGCTTTCAGCAGGT-3' 5'-AGGGTTTTGGAAGGTAAAGGAG-3' Dsc1 5'-CAGTAGTGGCGACAGATACA-3' 5'-CCTTCTCCTGCTGACAAATG-3' Dsg1 5'-GGGATAACCACCATCTGTGT-3' 5'-CCTCCCAGATCTTGCATTTC-3' Dsg3 5'-AGGTTCTGGCCATAGACGAA-3' 5'-TCACTGAGAGGGTCACAGAA-3' Oligo and shRNA sequences for shRNA lentiviral plasmids
Oligo (5’!3’) Mature shRNA Control Fwd
TGCGCTTGGGCGAGAGTAAGTTCAAGAGACTTACTCTCGCCCAAGCGCTTTTTTC
GCGCTTGGGCGAGAGTAAG
Control Rev
TCGAGAAAAAAGCGCTTGGGCGAGAGTAAGTCTCTTGAAATTACTCTCGCCCAAGCGCA
shAHR-1 Fwd
TGGACAGAACAAGAAAGGGGTTCAAGAGATCCCTTTCTTGTTCTGTCCTTTTTTC
GGACAGAACAAGAAAGGGG
shAHR-1 Rev
TCGAGAAAAAAGGACAGAACAAGAAAGGGATCTCTTGAACCCCTTTCTTGTTCTGTCCA
shAHR-2 Fwd
TGGACCAAACACAAGCTAGGTTCAAGAGATCTAGCTTGTGTTTGGTCCTTTTTTC
GGACCAAACACAAGCTAGG
shAHR-2 Rev
TCGAGAAAAAAGGACCAAACACAAGCTAGATCTCTTGAACCTAGCTTGTGTTTGGTCCA
shARNT-1 Fwd
TGGGAAGAGCTGCAGATATGTTCAAGAGAAATATCTGCAGCTCTTCCCTTTTTTC
GGGAAGAGCTGCAGATATG
shARNT-1 Rev
TCGAGAAAAAAGGGAAGAGCTGCAGATATTTCTCTTGAACATATCTGCAGCTCTTCCCA
shARNT-2 Fwd
TGGACAGAGATCCAAGGTTGTTCAAGAGAAAACCTTGGATCTCTGTCCTTTTTTC
GGACAGAGATCCAAGGTTG
shARNT-2 Rev
TCGAGAAAAAAGGACAGAGATCCAAGGTTTTCTCTTGAACAACCTTGGATCTCTGTCCA
Chemical screen shows desmosomes regulate mammary branching
7

SUPPLEMENTAL EXPERIMENTAL PROCEDURES Mice–FVB/n mice were maintained following protocols reviewed and approved by the University of Utah Institutional Animal Care and Use Committee.
Isolation of primary MECs–Organoids from the fourth inguinal mammary gland were isolated from 8-12 week-old female FVB/n mice as previously described (1). All plasticware was pre-coated with sterile 3% bovine serum albumin (BSA) in phosphate buffered saline (PBS) in order to minimize cell loss during preparation. Organoids were washed once in PBS without calcium or magnesium (Gibco), pelleted at 500 x g for 30 seconds, resuspended in 3 mL of PBS containing 750 µL 0.05% Trypsin/EDTA (Gibco), placed in a 6-well plate (Falcon) and incubated at 37 ºC. Every 3 minutes, cells were pipetted to break up organoids and visualized under a light microscope. This process was repeated until approximately 90% of the organoids dissociated into single cells or for a maximum of 20 minutes to minimize cell death. Hanks’ balanced salt solution (HBSS) (Gibco) with 2% fetal bovine serum (FBS) (HyClone) was added to neutralize the trypsin and cells were pelleted (450 x g, 3 minutes). The cell pellet was resuspended in 10 mL serum-free DMEM/F-12 (HyClone) containing 100 µg/mL DNase I (Sigma) and incubated at room temperature for 3 minutes with gentle mixing. Cells were filtered through a 40 µm cell strainer (BD Falcon), counted, pelleted at 450 x g for 3 minutes, and used for branching assays. Extra cells were pelleted and resuspended in DMEM/F-12 containing 20% FBS and 10% DMSO (Sigma) at a concentration of 4x10⁶ cells/mL, and frozen in liquid nitrogen.
Antibody staining–Staining for K8 (Developmental Studies Hybridoma Bank, Troma-1, 1:100) and K14 (Covance, PRB-155P-100, 1:400) was done on sections of mammary gland from virgin FVB/n mice and on primary MECs grown for 144 hours in 8-chamber culture slides (BD Falcon). Staining on sections was done using standard microtome sectioning, deparaffinization and hydration, and antigen retrieval with boiling 10 mM sodium citrate buffer, pH 6.0. For primary MECs, aggregates were embedded as described using 5 µL of Matrigel as the base layer and 200 aggregates suspended in 10 µL Matrigel on top. Aggregates were fixed with 4% PFA for 30 minutes at room temperature (RT), washed three times with PBS, and permeablized with 0.5% triton X-100 (Omnipure) for 90 minutes at RT. All samples were blocked in 5% BSA (Cell Signaling Technologies) + 1% normal goat serum for 1 hour at RT and incubated with primary antibody diluted in 1% BSA overnight at 4 ºC. For HA (Covance, MMS-101R, 1:500) staining, HEK-293T cells were fixed with 4% PFA for 15 minutes at RT, washed once with 50 nM ammonium chloride (Sigma), and permeablized with 0.2% triton X-100 in PBS for 8 minutes at RT. Cells were washed once in 1% BSA in PBS and blocked with fresh 1% BSA in PBS for 10 minutes. Following block, samples were incubated with primary antibody diluted in 1% BSA in PBS for 1 hour at RT. After primary antibody incubations, samples were washed three times with PBS and incubated with secondary antibodies (Invitrogen, Alexa series, all 1:1000 in 1% BSA in PBS) for 1 hour at RT. Nuclei were stained with 50 ng/mL DAPI (Molecular Probes) for 5 minutes at RT. Coverslips were mounted with ProLong Gold anti-fade reagent (Invitrogen).
Chemical compounds–TCDD (Cambridge Isotopes Laboratories, Inc., Andover, MA) was obtained as a DMSO stock solution. 1023 and 1023-CF3 were synthesized as described below and dissolved in DMSO at a stock concentration of 10 mM.
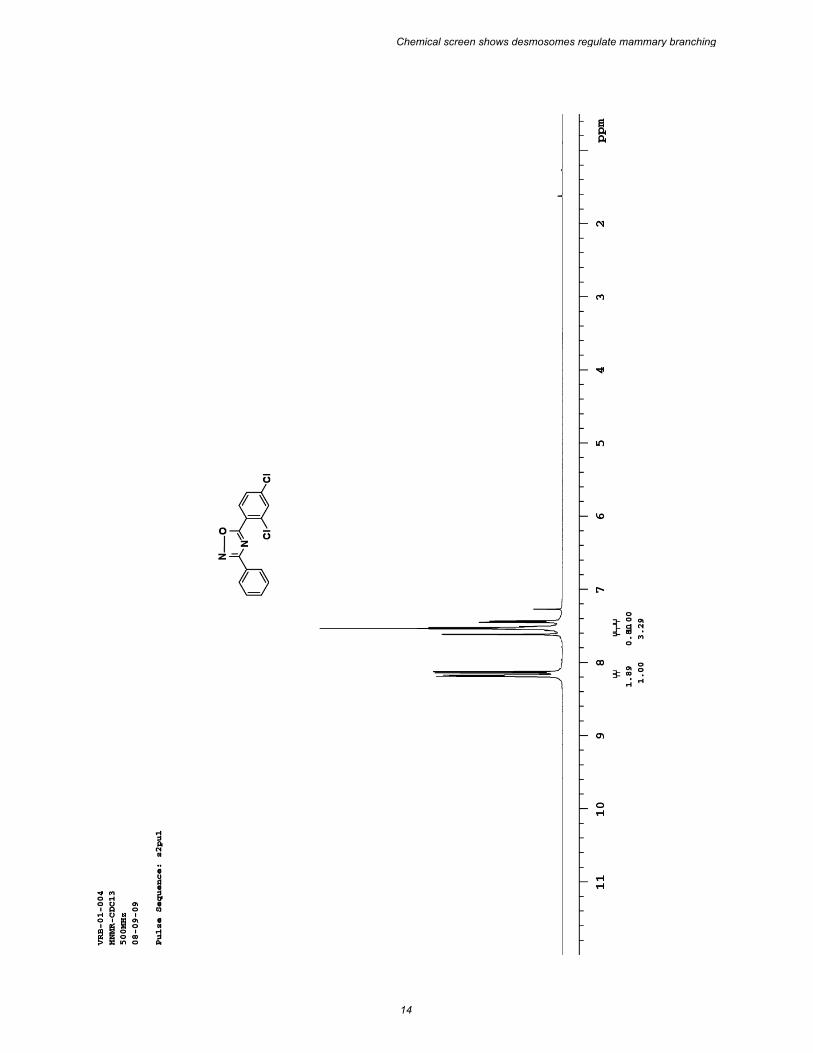
Chemical synthesis–(5-(2,4-dichlorophenyl)-3-phenyl-1,2,4-oxadiazole [1023]: To a stirring solution of benzamidoxime (500 mg, 3.67 mmol) in dioxane (35 mL), was added 2,4 dichlorobenzoyl chloride (770 mg, 3.67 mmol) followed by BF3•OEt2 (114 µL, 0.80 mmol) at 0 °C. The reaction mixture was stirred at room temperature for 30 minutes and heated to reflux for 12 hrs. After completion of the reaction, the dioxane was removed by rotary evaporation and the residue was cooled in an ice bath and quenched with ice water. The aqueous layer was then extracted with EtOAc (2 x 50 ml). The combined organic layers were dried over Na2SO4, and concentrated under reduced pressure. The resulting crude product was purified by flash column chromatography (10% EtOAc in hexanes) to yield 1023 (850 mg, 80%) as a colorless solid. 1H NMR (500 MHz, CDCl3) δ 8.18 (dd, J = 7.5, 1.4 Hz, 2H), 8.13 (d, J = 8.3 Hz, 1H), 7.61 (d, J = 1.9 Hz, 1H), 7.56 – 7.70 (m, 3H), 7.43 (dd, J = 8.3, 1.9 Hz, 1H) ppm; 13C NMR (100 MHz, CDCl3): δ (ppm) 137.7, 168.9, 139.2, 134.9, 132.9, 131.6, 131.6, 129.1, 127.8, 126.8, 122.3 ppm; IR (neat) 2152, 1595,
Chemical screen shows desmosomes regulate mammary branching
8

1569, 1452, 1392, 1363, 1135, 1104, 748, 707, 691 cm-1; HRMS (ESI) calcd for C14H9Cl2N2O (M+H): 291.0092, found: 291.0090. Mp; 55-56 oC.
(5-(2,4-dichlorophenyl)-3-(3-(trifluoromethyl)phenyl)-1,2,4-oxadiazole [1023-CF3]: To a stirring solution of 3-trifluorobenzamidoxime (346 mg, 1.69 mmol) in dioxane (17 mL), was added 2,4 dichlorobenzoyl chloride (425 mg, 2.03 mmol) followed by BF3•OEt2 (52 µL, 0.42 mmol) at 0 °C. The reaction mixture was stirred at room temperature for 30 minutes and heated to reflux for 12 hrs. After completion of the reaction, the dioxane was removed by rotary evaporation and the residue was cooled in an ice bath and quenched with ice water. The aqueous layer was then extracted with EtOAc (2 x 50 ml). The combined organic layers were dried over Na2SO4, and concentrated under reduced pressure. The resulting crude product was purified by flash column chromatography (10 % EtOAc in hexanes) to yield 1023-CF3 (415 mg, 68%) as a colorless solid. 1H NMR (CDCl3, 500 MHz) δ 8.45 (s, 1H), 8.36 (d, J= 7.8 Hz, 1H), 8.15 (d, J= 8.2 Hz, 1H), 7.80 (d, J= 7.8 Hz, 1H), 7.68- 7.63 (m, 2H), 7.48- 7.44 (m, 1H) ppm; 13C NMR (400MHz, CDCl3) δ 174.5, 167.9, 139.5, 135.0, 132.9, 131.9, 131.7, 131.6, 130.9, 129.7, 128.1, 128.1, 128.1, 127.9, 127.7, 125.3, 124.8, 124.7, 124.7, 124.7, 122.5, 122.0 ppm; IR (neat) 1590, 1569, 1493, 1390, 1323, 1313, 1169, 1116, 1073, 811, 707 cm-1; HRMS (ESI) calcd for C15H8Cl2N2OF3Cl2 (M+H): 358.9966, found: 358.9956. Mp; 83-84 oC.
Microscopy–Live time-lapse imaging was performed using a Zeiss Axiovert S-100 microscope equipped with a digital CTI-Controller 3700 and Tempcontrol-37-2 to maintain cells at 37 oC with 5% CO2. Images were captured using a 10x A-Plan objective lens every 30 minutes using OpenLab 4.0.2 software (Improvision, Inc.). All other imaging was performed using an Olympus IX81-ZDC microscope with an ORCAER CCD camera and Slidebook 5.0.0.24 software (Intelligent Imaging Innovations, Inc). DIC images were captured using a 10X Plan or 20X long working distance objective lens. Immunofluorescence imaging was performed using a 60X Plan oil objective lens (mammary sections) or 40x U-Plan objective lens (Matrigel samples and AHR nuclear localization). Imaging of single cell primary MEC outgrowths was done using a 20X U-Plan objective lens. For immunofluorescence imaging of Matrigel samples, deconvolution was performed using Slidebook software and the nearest neighbor method.
Microarray processing and analysis–Total RNA was isolated using the Qiagen RNeasy kit and assayed for quality on the Bioanalyzer RNA 6000 nano chip. Samples were labeled with the Agilent Two-Color Low RNA Input Linear Amplification Kit and hybridized to the Agilent Whole Mouse Gene Expression array (Agilent microarray design ID 014868, GEO platform ID GPL7202) using standard Agilent two-color gene expression hybridization and wash protocols. Microarray slides were scanned on an Agilent Technologies G2505B scanner at 5 micron resolution. The slide images were processed using Agilent Feature Extraction software version 9.5.1.1, which performs linear Lowess normalization to correct for dye bias. In this experiment DMSO controls were labeled with Cy3, and compound-treated samples were labeled with Cy5. The Lowess normalized data from the arrays was filtered to remove control features and features flagged as nonuniform or feature population outliers. Remaining features for any probe were averaged to yield a single value for each unique probe sequence. The normalized data set was loaded into GeneSifter software (Geospiza Inc) for analysis. The microarray data from this publication have been submitted to the Gene Expression Omnibus database (http://www.ncbi.nlm.nih.gov/geo/) and assigned the accession number GSE39249.
Sequence alignment and homology modeling of the aryl hydrocarbon receptor (AHR)– Sequences of human AHR (hAHR) (NP_001612) and murine AHR (mAHR) (NP_038492) were extracted from the NCBI protein sequence database. All sequences were imported into the ClustalW program (2) and the sequence alignment editor, BioEdit (3), for multiple pairwise alignments. The resulting alignments were examined manually. hAHR and mAHR had 27% and 50% sequence identity and similarity, respectively, to the solved crystal structure of the high affinity heterodimer of HIF2 alpha and ARNT C-terminal PAS domain (4) (PDB: 3F1O). This crystal structure was used as a template for hAHR homology modeling in ICM. Sequence similarity, 3D-PSSM threading, and ICM searches with hAHR provided the HIF2 alpha and ARNT C-terminal PAS domain as a template structure for homology modeling of hAHR. In the
Chemical screen shows desmosomes regulate mammary branching
9

HIF2 PAS-B Domain, an internal cavity was located using the Site Map with ICM, and electrostatic surfaces were generated using the identified binding sites with ICM force field. A grid spacing of 0.5 Å and dielectric constant of 80 for the solvent were employed. Molecular docking–1023 and 1023-CF3 were used for regular docking with the hAHR homology model. Docking calculations were performed using the ICM (5) docking module with default setup. The structure of each complex was energy minimized in the same environment and saved in PDB format. These energy-minimized complexes were then reposed into ICM and converted into an ICM object, and MMFF charges were assigned for the select ligand. The compounds were docked using the “interactive docking” menu of ICM. A stack of different docked conformations were generated and visually checked. 100 conformers of each ligand docking were performed on a four AMD 64-bit processors Red Hat Linux server. The best docking conformations were selected on the basis of docking energies and RMSD of the ligand from the initial ligand conformation. The docking conformation validated as most realistic for each compound was used for calculation the ligand−hAHR binding energy (Cal. ΔG) using the ICM script for binding energy calculations.
Plasmids–The HA-tagged mouse AHR expression plasmid (pACTAG-HA-mAHR) was kindly provided by Dr. Oliver Hankinson (University of California, Los Angeles, CA). The pLentiLox5.0-GFP vector used for creating lentiviral shRNA constructs was a gift from Dr. James Bear (University of North Carolina, Chapel Hill, NC). The following plasmids for generating lentivirus have been previously described: pMDLg/pRRE (6), pRSV-Rev (6), and pVSV-G (Clontech). The identity of each plasmid was confirmed by sequencing.
AHR nuclear localization assay–In 6-well tissue culture plates, 25,000 HEK-293T cells in DMEM (Gibco) with 10% charcoal-stripped FBS (CSFBS) (Dextran-coated charcoal: Sigma) were seeded onto lysine-coated glass coverslips. The media was replaced 12 hours later with DMEM containing 2% CSFBS, and 2 µg pACTAG-HA-AHR was used for polyethyleneimine (PEI) (Polysciences) mediated transfection as follows. For each well, 6 µg PEI was combined with 200 uL Opti-MEM (Invitrogen), inverted several times to mix, and incubated for 5 minutes at room temperature. Plasmid DNA was added dropwise to the PEI / Opti-MEM solution, mixed by inverting several times, and incubated at RT for 15-45 minutes. Transfection mixtures were added dropwise to each well and mixed with gentle agitation. Media was replaced 16 hours post-transfection and cells were dosed 48 hours post-transfection with 0.1% DMSO (Sigma), 10 µM 1023, or 10 nM TCDD. Samples were stained 24 hours after dosing. For each condition, a minimum of 100 cells per sample were scored.
RNA extraction and real-time PCR–HC11 cells were washed twice with PBS and scraped into 1 mL cold PBS. Cells were pelleted at 1250 x g for 5 minutes at 4 ºC and resuspended in 600 uL RLT buffer (Qiagen). For primary MECs, 1,000 aggregates were embedded per well and three wells were combined for each condition. Cells were washed twice with PBS and suspended in 600 µL RLT buffer (Qiagen) containing beta-mercaptoethanol (BME) (1:100) in order to lyse cells and solubilize Matrigel. RNA was isolated and DNase I treated using the Qiagen RNeasy Mini Kit according to manufacturers instructions. Total RNA was quantified using a Nanodrop (Thermo Scientific) and 1 µg of RNA was used to generate cDNA with the Superscript III Reverse Transcriptase Kit (Invitrogen) according to manufacturers instructions. RNase H (Qiagen) was used to remove excess RNA and cDNA was diluted 1:20 in TE buffer, pH 8.0. For real-time detection, 5 uL reactions were performed with the LightCycler 480 (Roche) in quadruplicate using 2x KAPA SYBR FAST qPCR Master Mix (Kapa Biosystems) and 200 nM each of the forward and reverse PCR primers. Beta-actin was used as an internal reference gene and relative gene expression was calculated by direct CT comparison (7). Primer sequences are listed in supplemental Table S2.
Molecular cloning–For shRNA constructs, oligonucleotides were diluted in TE Buffer pH 8.0 (Ambion) to a final concentration of 60 µM. Forward and reverse primers were combined at a final concentration of 1.2 µM each in annealing buffer (100 mM potassium acetate, 30 mM HEPES-KOH pH 7.4, 2 mM magnesium acetate) and incubated at 95 ºC for 5 minutes followed by stepwise 1 minute incubations at 0.5 ºC temperature decrements until 4 ºC was obtained. The pLentiLox5.0-GFP vector (8) was digested for 1 hour with HpaI-XhoI and dephosphorylated. Annealed oligos were diluted at 1:20 and
Chemical screen shows desmosomes regulate mammary branching
10

ligated overnight at 16 ºC with 50 ng digested pLentiLox5.0-GFP vector. Positive clones were identified using an XbaI restriction digest.
Production and titration of lentivirus–HEK-293T cells were plated on 10-cm tissue culture dishes at 7x10⁶ cells per plate in DMEM (Gibco) with 10% FBS (HyClone) 24 hours prior to transfection. The culture medium was changed 2 hours prior to transfection and a total of 10.1 µg of DNA was used for PEI mediated transfection of each 10-cm dish. For 1 mL transfection mixture per 10-cm plate, 30 µg of PEI was combined with Opti-MEM, inverted several times to mix, and incubated for 5-15 minutes at RT. Plasmids for transfection were combined at the following ratios per 10-cm plate: 5 µg transfer plasmid, 1.7 µg pMDLg/pRRE packaging plasmid, 1.7 µg pRSV-Rev export plasmid, and 1.7 µg pVSVG envelope plasmid. Plasmid DNA was added dropwise to the PEI / Opti-MEM solution, mixed by inverting several times, and incubated at RT for 15-45 minutes. Transfection mixtures were added dropwise to each plate and mixed with gentle agitation. The culture medium was replaced 12 hours after transfection and the viral supernatant was collected 24 and 48 hours later and kept at 4 ºC for all subsequent manipulations. The viral supernatants were cleared of large cell debris by centrifugation at 2450 x g for 10 minutes and filtered through a 0.45 µm cellulose acetate filter (Corning). Viral supernatants were concentrated by ultracentrifugation at 100,000 x g for 1 h 45 min. Viral pellets were resuspended in DMEM/F-12 by gentle pipetting and stored overnight at 4 ºC. The following day, concentrated virus was aliquoted and stored at -80 ºC. Viral titers were determined on HEK-293T cells as previously described with the following modifications (1). In six-well plates, 2x10⁵ cells per well were plated and allowed to adhere for 12 hours. The medium was replaced with 1 mL of either 1:200, 1:1,000, or 1:10,000 diluted viral concentrate. The number of cells per well was counted at the time of virus addition and the average of three wells was used to calculate the viral titer. Culture medium was replaced 12 hours after infection and 60 hours later, cells were harvested and analyzed for fluorescent protein expression by FACS. Viral titers were calculated (TU/ml) according to the equation [cell number x (% fluorescent cells / 100)] x 1000/µl of viral concentrate (9). Only transductions that resulted in fewer than 15% fluorescent cells were used for titer calculations.
HC11 cell culture and production of stable lines–HC11 cells were grown at 37 ºC with 5% CO2 in RPMI (HyClone) supplemented with 10% FBS, ITS-X, Pen Strep Glutamine, and 10 ng/mL murine EGF. For all compound treatments, FBS was reduced to 2% 12 hours after seeding cells. For stable shRNA expression, 1.25x10⁶ cells were seeded in a 10-cm tissue dish, cultured for 12 hours, and transduced at an MOI of 20. The transduction efficiency was determined by FACS 72 hours after infection and lines with greater than 80% transduction were used for experiments as indicated.
Lentiviral transduction of primary MECs–High efficiency lentiviral transduction of primary MECs was conducted as previously described (10) with the following modifications. Primary MECs were seeded in a 6-well tissue culture plate at a concentration of 2x10⁵ cells per well or a 10-cm tissue culture plate at a concentration of 1x10⁶ cells per plate and incubated in PMEC growth media. After 48 hours, media was aspirated and replaced with 1 mL (6-well plate) or 8 mL (10-cm dish) of fresh PMEC growth media. Lentiviral particles were layered onto primary MECs at a MOI of 40 and gently mixed. After 16 hours, virus-containing media was replaced with 2 mL (6-well plate) or 10 mL (10-cm dish) DMEM/F-12 containing ITS-X, Pen Strep, and 2.5 nM murine EGF or human FGF2. 48 hours later, primary MECs were trypsinized down to single cells, collected, and embedded in Matrigel as described.
RNA isolation from transduced primary MECs–To measure knockdown of AHR in primary cells, MECs were seeded in 10-cm tissue culture plates and transduced as described above. After 96 hours, cells were sorted by FACS based on GFP expression using a FACSAria-II SORP high-speed cell sorter. Untransduced (GFP negative) and transduced (GFP positive) cell populations were collected on ice in RLT buffer. The ratio of sample:RLT was adjusted to 100 uL:350 uL for each sample and RNA was isolated and DNase I treated using the Qiagen RNeasy Mini Kit according to manufacturers instructions.
Western blot–400 µL BD cell recovery solution (BD Biosciences#354253) per well was used to isolate primary MECs from Matrigel according to manufacturers instructions. For each sample, 3 wells of a 24 well plate (1,000 aggregates per well) were combined. Isolated primary MECs were lysed in RIPA buffer (50 mM Tris-HCl pH 8.0, 150 mM NaCl, 0.1% SDS, 0.5% sodium deoxycholate, 1% Triton
Chemical screen shows desmosomes regulate mammary branching
11

X-100, 1 mM DTT, 1X protease/phosphatase inhibitor cocktail) and sonicated at 4 ºC for 20 seconds. 30 µg whole cell lysate was separated by 10% SDS-polyacrylamide gel electrophoresis and transferred to PVDF membrane (Millipore) for detection of mDsg3 (1:200, MBL #D218-3) and α-tubulin (1:1000, Sigma-Aldrich #T6199).
Peptides–The peptides used have been previously described (11): mouse Dsc3 (LIAYASTADG), mouse Dsg3 (ITCRALNALG), E-cadherin (LYSHAVSSNG), and control (YTGDAFPALT). Peptides were synthesized by the University of Utah DNA/Peptide Synthesis Facility (Salt Lake City, UT), purified (>96% purity) by high-performance liquid chromatography, and identified by laser desorption mass spectrometry. Concentrations were determined using Ellman’s reagent (12) for mouse Dsg3, which does not contain tryptophan or tyrosine residues, and Edelhoch’s method (13) for all other peptides. Freeze-dried peptides were reconstituted in distilled water at a stock concentration of 40 mM.
Chemical screen shows desmosomes regulate mammary branching
12
SUPPLEMENTAL REFERENCES 1. Welm, B. E., Dijkgraaf, G. J., Bledau, A. S., Welm, A. L., and Werb, Z. (2008) Cell Stem Cell 2,
90-102 2. Thompson, J. D., Higgins, D. G., and Gibson, T. J. (1994) Nucleic Acids Res 22, 4673-4680 3. Hall, T. A. (1999) Nuclei Acids Symposium Series 41, 95-98 4. Scheuermann, T. H., Tomchick, D. R., Machius, M., Guo, Y., Bruick, R. K., and Gardner, K. H.
(2009) Proc Natl Acad Sci U S A 106, 450-455 5. Totrov, M., and Abagyan, R. (1997) Proteins Suppl 1, 215-220 6. Dull, T., Zufferey, R., Kelly, M., Mandel, R. J., Nguyen, M., Trono, D., and Naldini, L. (1998) J
Virol 72, 8463-8471 7. Schefe, J. H., Lehmann, K. E., Buschmann, I. R., Unger, T., and Funke-Kaiser, H. (2006) J Mol
Med (Berl) 84, 901-910 8. Cai, L., Marshall, T. W., Uetrecht, A. C., Schafer, D. A., and Bear, J. E. (2007) Cell 128, 915-929 9. Klages, N., Zufferey, R., and Trono, D. (2000) Mol Ther 2, 170-176 10. Vafaizadeh, V., Klemmt, P., Brendel, C., Weber, K., Doebele, C., Britt, K., Grez, M., Fehse, B.,
Desrivieres, S., and Groner, B. (2010) Stem Cells 28, 928-938 11. Runswick, S. K., O'Hare, M. J., Jones, L., Streuli, C. H., and Garrod, D. R. (2001) Nat Cell Biol
3, 823-830 12. Riddles, P. W., Blakeley, R. L., and Zerner, B. (1979) Anal Biochem 94, 75-81 13. Edelhoch, H. (1967) Biochemistry 6, 1948-1954
Chemical screen shows desmosomes regulate mammary branching
13
Chemical screen shows desmosomes regulate mammary branching
14

Chemical screen shows desmosomes regulate mammary branching
15

Chemical screen shows desmosomes regulate mammary branching
16

Chemical screen shows desmosomes regulate mammary branching
17