Embed Size (px)
Citation preview

MA
ST
ER
THESIS
Master's Programme in Renewable Energy Systems, 120 credits
Design of an Off-grid PV System for Householdsin Perú and Sweden.
Emiliano Gabriel Lorenzo Guevara
Dissertation in Engineering Energy, 15 credits
Halmstad 2017 06 02

I
Abstract Because of global warming and the Paris agreement, countries need to switch their energy sources into clean sources. For some countries, like Perú, renewable energies are still a new technology, depending entirely on traditional hydropower and thermal plants. Despite the high solar radiation in the coast and Andes, it is not developed and it fairly reaches the 1% of energy production. Sweden, on the other hand, also depends on hydro power in a considerable proportion. However, renewable energies like biomass and wind cover the rest of the demand. These two countries are geographically and contextually far apart. On the other hand, most of the poor citizens of Perú live in the Andes, especially in remote villages, disconnected from the national grid and suffering from the cold during winter. Because their energy demand is low, it is not profitable for the electrical companies to give them electricity. The Swedish population, however, has 100% access to electricity. Despite that, high prices on maintaining the connection to the electricity network, and constant failures because of bad weather, especially in rural areas, brings the idea to disconnect from the grid and produce one´s own electricity, with, for example, photovoltaic systems. The work done on this thesis consists on a design of an off-grid solar PV system using batteries for energy storage, both for a remote farmer village in the high Andes in Perú (Ungalluta 2) and for also a rural, low populated village in the center of Sweden (Gåsborn), both manually and by software (PVSyst), with real life components, in order to analyze costs and the possibility to live entirely on solar power. The priority when choosing the components is the lowest price. For the Ungalluta 2, with a demand of 17.1kWh/d (11 people), 13 PV modules and 1600Ah of battery capacity (Lead Acid) are needed, with a payback in approximately 40 years, renewing the PV panels on year 25 because of degradation. The initial investment is 21540EUR. For Gåsborn, with a demand of 36.44kWh/d (average Swedish family with children), 42 PV modules and 2850Ah of battery capacity (Lithium) are needed, with a negative payback, even increasing the PV modules to cover the entire year (more than 400). This is because the solar irradiation is quite low during winter and the load demand needs to be satisfied with considerable amounts of Diesel with a backup generator. After analyzing the results, it is possible and viable to build PV systems for the poor villagers in the Andes of Perú, but they will need monetary help of the government (high initial cost). For Sweden, it is not profitable to depend entirely on PV power. Other renewable sources must complement it, such as wind, to compensate the low solar irradiation and reduce the diesel consumption.
II
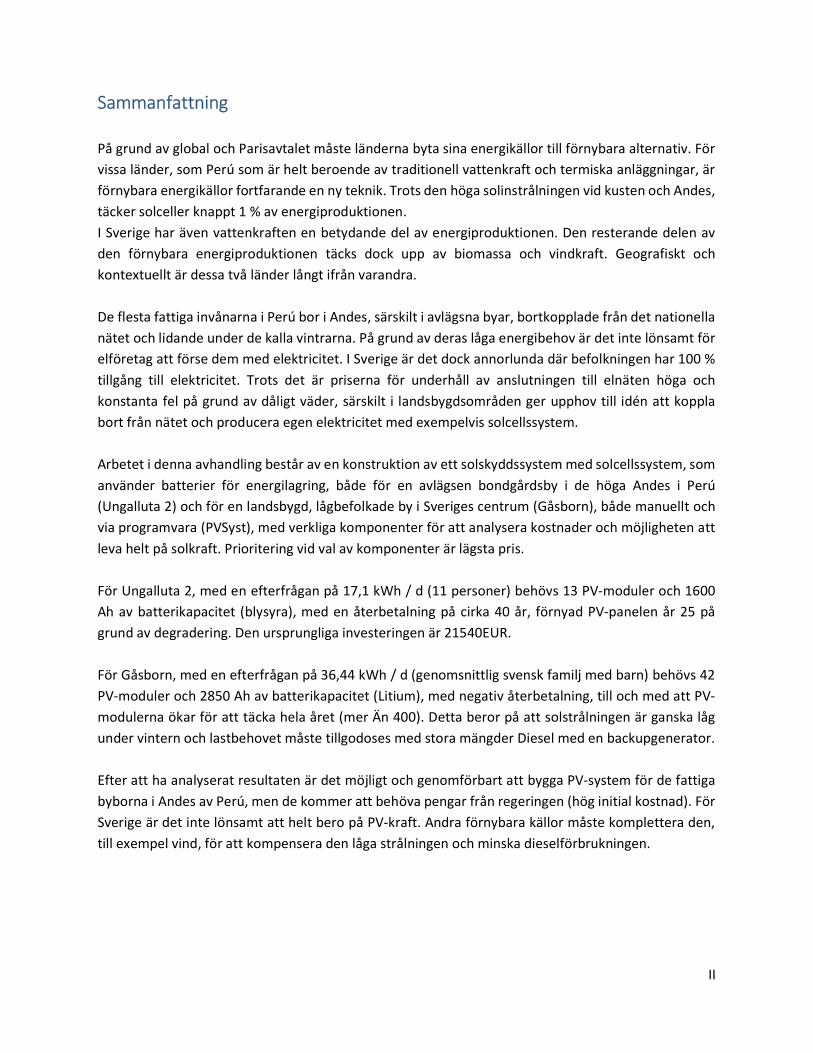
Sammanfattning På grund av global och Parisavtalet måste länderna byta sina energikällor till förnybara alternativ. För vissa länder, som Perú som är helt beroende av traditionell vattenkraft och termiska anläggningar, är förnybara energikällor fortfarande en ny teknik. Trots den höga solinstrålningen vid kusten och Andes, täcker solceller knappt 1 % av energiproduktionen. I Sverige har även vattenkraften en betydande del av energiproduktionen. Den resterande delen av den förnybara energiproduktionen täcks dock upp av biomassa och vindkraft. Geografiskt och kontextuellt är dessa två länder långt ifrån varandra. De flesta fattiga invånarna i Perú bor i Andes, särskilt i avlägsna byar, bortkopplade från det nationella nätet och lidande under de kalla vintrarna. På grund av deras låga energibehov är det inte lönsamt för elföretag att förse dem med elektricitet. I Sverige är det dock annorlunda där befolkningen har 100 % tillgång till elektricitet. Trots det är priserna för underhåll av anslutningen till elnäten höga och konstanta fel på grund av dåligt väder, särskilt i landsbygdsområden ger upphov till idén att koppla bort från nätet och producera egen elektricitet med exempelvis solcellssystem. Arbetet i denna avhandling består av en konstruktion av ett solskyddssystem med solcellssystem, som använder batterier för energilagring, både för en avlägsen bondgårdsby i de höga Andes i Perú (Ungalluta 2) och för en landsbygd, lågbefolkade by i Sveriges centrum (Gåsborn), både manuellt och via programvara (PVSyst), med verkliga komponenter för att analysera kostnader och möjligheten att leva helt på solkraft. Prioritering vid val av komponenter är lägsta pris. För Ungalluta 2, med en efterfrågan på 17,1 kWh / d (11 personer) behövs 13 PV-moduler och 1600 Ah av batterikapacitet (blysyra), med en återbetalning på cirka 40 år, förnyad PV-panelen år 25 på grund av degradering. Den ursprungliga investeringen är 21540EUR. För Gåsborn, med en efterfrågan på 36,44 kWh / d (genomsnittlig svensk familj med barn) behövs 42 PV-moduler och 2850 Ah av batterikapacitet (Litium), med negativ återbetalning, till och med att PV-modulerna ökar för att täcka hela året (mer Än 400). Detta beror på att solstrålningen är ganska låg under vintern och lastbehovet måste tillgodoses med stora mängder Diesel med en backupgenerator. Efter att ha analyserat resultaten är det möjligt och genomförbart att bygga PV-system för de fattiga byborna i Andes av Perú, men de kommer att behöva pengar från regeringen (hög initial kostnad). För Sverige är det inte lönsamt att helt bero på PV-kraft. Andra förnybara källor måste komplettera den, till exempel vind, för att kompensera den låga strålningen och minska dieselförbrukningen.

III
Preface This thesis was done in the first semester of 2017, from the program MSc. In Renewable Energy Systems from Halmstad University as the final requirement to obtain the degree. It was done with the help of the company WSP – Parssons Brinckerhoff, Halmstad and Goteborg office. I would like to thank Charlotta Winkler and Martin Skoglund from WSP for their support, the training in the PVSyst software, the place they gave me in the office, and the literature documents I received in order to do the research and make the thesis. I would also like to thank my instructor, Göran Siden, and the course supervisor, Jonny Hylander for their additional support. They were my teachers during the masters in other courses and I learned several things from them, which I appreciate. Halmstad, June 2017.

IV
Index
Abstract ................................................................................................................................. I
Sammanfattning ................................................................................................................... II
Preface ................................................................................................................................. III
Index .................................................................................................................................... IV
1 Introduction .................................................................................................................. 1
1.1 Background ............................................................................................................. 1
1.2 Purpose .................................................................................................................. 2
1.3 Limitations .............................................................................................................. 2
2 Characteristics of the solar energy ................................................................................ 3
2.1 Geographic coordinate system ................................................................................ 3
2.2 Solar radiation ........................................................................................................ 4
2.2.1 Direct and diffuse radiation ............................................................................. 5
2.2.2 Air mass, AM .................................................................................................... 6
2.2.3 Sun elevation ................................................................................................... 7
2.2.4 True north and south ..................................................................................... 10
2.3 Calculating solar radiation for a tilted PV module ................................................. 12
2.3.1 Manual calculation: The 3-component method .............................................. 12
2.3.2 Calculating solar radiation with software and web tools ................................ 19
3 PV Systems technologies ............................................................................................. 22
3.1 Semiconductor properties: Silicon ........................................................................ 23
3.1.1 N and P-type Silicon ....................................................................................... 24
3.1.2 Common manufacturing types of Silicon ........................................................ 25
3.1.3 Structure of a Solar cell .................................................................................. 26
3.2 Solar cell arrangements and electrical properties ................................................. 28
3.2.1 Peak power, area of module .......................................................................... 28
3.2.2 STC and NOCT ................................................................................................ 29
3.2.3 Voltages, currents, maximum power point, fill factor ..................................... 30
3.2.4 Module efficiency .......................................................................................... 32

V
3.2.5 Temperature coefficient ................................................................................ 32
3.2.6 Cell Mismatch, hot Spots, bypass and blocking diodes ................................... 32
4 Design ......................................................................................................................... 36
4.1 Choosing the locations .......................................................................................... 36
4.1.1 Location in Peru and load profile ................................................................... 36
4.1.2 Location in Sweden and load profile .............................................................. 42
4.2 Off-grid system structure ...................................................................................... 47
4.3 PV modules selection and battery sizing ............................................................... 50
4.3.1 Selection of modules, tilt, and battery capacity for Perú location (Ungalluta 2)52
4.3.2 Selection of modules, tilt, and battery capacity for Sweden location (Gåsborn)58
4.4 Design of inverter, charger, and battery type ........................................................ 61
4.4.1 Selection of inverter, batteries, charger for Perú location (Ungalluta 2) ......... 61
4.4.2 Selection of inverter, batteries, charger for Sweden location (Gåsborn) ........ 66
4.4.3 Schematic diagrams of chosen components................................................... 71
4.5 Economic analysis for the manual calculation ....................................................... 72
4.5.1 Economic calculation for Ungalluta 2 ............................................................. 72
4.5.2 Economic calculation for Gåsborn .................................................................. 78
4.6 Design using PVSyst software ................................................................................ 81
4.6.1 PVSyst design for Ungalluta 2 ......................................................................... 83
4.6.2 PVSyst design for Gåsborn ............................................................................. 94
5 Conclusions and recommendations ........................................................................... 102
6 References ................................................................................................................ 104

1
1 Introduction
1.1 Background Climate change is a reality and the world is working to solve it. Because of the indiscriminate use of fossil fuels, the CO2, a residual gas when burning these fuels, has increased its levels in the atmosphere in the last years to alarming levels [1]. To limit the amount of these emissions, agreements and gatherings have been made such as the climate change summit COP21 in Paris in 2015 organized by the UN-FCCC (United Nations Framework Convention on Climate Change), where concrete goals were established, like keeping the global temperature rise well below 2 degrees Celsius above pre-industrial levels, and to promote the promotion of clean energies in developing countries. On October 2016, the minimum amount of countries needed to make the terms of the COP21 agreements mandatory was reached [2]. The modern world needs energy, like heat and electricity. Renewable energies have a lower carbon footprint compared to other traditional energy sources [3]. The most used renewable energies worldwide, by installed capacity in 2015 were hydropower (1064GW), wind power (433GW), solar heat (435GW) and solar photovoltaics (227GW) [4]. Because of political decisions and different budgets, some countries have a higher share on renewables. Specifically, Sweden is on the world top 3 on renewable power capacity per capita (not counting hydropower) and second place on wind power capacity per capita [5], with a share on renewables producing electricity of 63.3% [6]. On the other side, other countries, like Peru, have a high production of electricity on hydropower because of the Andes Mountains, which generate a total of 1.8 million cubic hectometers of renewable hydric resources [7]. On 2013, the electricity production reached 52% on hydro power, 46% in conventional thermal plants, and just 2% on other renewable sources [8]. As an example, during summer, on March 31, 2017 at 11.30h (high solar radiation), the PV power supplied to the national grid was just 1% (67MW), while gas produced 1.8GW, and hydropower 3.6GW [9]. Other aspect to consider is that not all Peruvians have access to electricity, counting 3 million people (10% of the population) as of 2013 [10]. Peru’s southern Andes Mountains have a high solar radiation per year that can reach more than 2000 kWh per square meter per year [11]. However, most of these areas are not densely populated. The national grid does not connect to these small villages because of the low-density of population, making it not profitable. People who live in this area, around the 4000 meters above sea level, are mainly low-income farmers with no access to electricity or heat. Their main economic activity is to raise cattle, such as sheep and alpacas, and some agriculture, depending on the altitude. During winter (June-August), especially in the last years, there have been extreme cold episodes, mainly due to global warming [12] [13], which is making these people struggle even more during these months. Elder people

2
and young children get respiratory diseases and their cattle die because of the low temperatures and freezing of the grass they use to eat [14] [15] [16] [17]. For Sweden, the situation is different. The country is densely populated on its southern part, and becomes less densely populated in the north. However, all of its population has access to the national grid [18]. Despite this, there is a trend in developed countries to disconnect from the grid, even if the household is near to a transmission line or substation. Connecting to the grid will always carry a cost, even with no consumption (a base tariff), and in some occasions the installation of a newly built rural house to the grid can bring expensive initial costs. If there is an opportunity to use renewable sources and fulfill the energy needs (solar, wind, etc.), then an off-grid connection is not a bad idea. Nevertheless, since the solar radiation is low in Sweden because it is far from the tropics (reaching annual values between 800 and 1100 kWh/m2 [19]), relying only on PV modules would not be an economical idea. They should be complemented with other sources, like a wind turbine and a backup generator.
1.2 Purpose This thesis consists on the design of a low cost, PV off-grid system for two locations: a southern Andes traditional farmer house in Perú and a rural, low density location in Sweden. Actual products will be selected, as well as fees in case of importing. An economic and production comparison will also be made between the designs for the two locations. The design is made with the collaboration of the company WSP – Parsons Brinckerhoff [20]. The calculations are done manually and with the software PVSyst [21].
1.3 Limitations This design will not include the implementation of the actual systems and serves entirely as a design guide for similar systems in South America or Europe. It is an estimate calculation since the paper design and the real products commonly differ. Also, the mechanical design and product selection for the supporting systems and enclosures to store the modules, batteries, chargers, and electrical components are not included in this document. The component selection and schematic diagram will be the final product of this paper. Wiring dimensions between blocks will not be included either, and safety devices, such as fuses and switches, will be mentioned only on their capacities, but not actual brands or models.

3
2 Characteristics of the solar energy Solar systems energy input is solar energy. Because of this, the first section presented next contains the basic theoretical background with the solar radiation properties.
2.1 Geographic coordinate system The first definition needed to understand in this chapter is the coordinate system. Locations on earth can be defined by a latitude-longitude system:
Figure 1: Latitude and longitude system. Source: endeavour-sailing.co.uk.
The units for both are degrees, either as a decimal or as degree-minutes-seconds. The latitude starts in the equator as a value of 0 degrees, becomes positive (or a north value) towards the north; and becomes negative (or a south value) towards the south. The geographical northern and southern poles have a latitude of 90°N / 90 and 90°S / -90 respectively. The lines that mark positions on earth with the same latitude are called Parallels [22]. The longitude is an east-west measurement. It starts on Greenwich, England with a value of 0 degrees. It becomes positive towards the east (or an east value); and becomes negative towards the west (or a west value). The lines that mark positions on the earth with the same longitude are called Meridians. The meridian of 0° is called the Greenwich Meridian [22]. As an example, the city of Lima, Perú is in coordinates 12°02'45.5"S, 77°01'50.5"W (minutes-seconds) or -12.045957, -77.030699 (decimal). A useful tool to convert decimal degrees to minutes-seconds and vice versa can be found at [23].

4
2.2 Solar radiation Life on Earth would not be possible without the Sun. Its radiation, together with our atmosphere, makes it possible to have a warm climate proper for the development of life. The Sun emits approximately 3.86x10²⁰ MW of electromagnetic energy [24], which is irradiated in all directions. Its surface has a temperature of approximately 5778K, and for modelling purposes, it is considered to irradiate similarly to a blackbody of that temperature [25]. A blackbody is an ideal absorber and emitter of energy, where its radiation is composed of a spectrum of radiation of different wavelengths. The spectrum emitted by a black body with the ratio of the Sun, and a temperature of 5778K is the following [26]:
Figure 2: Ideal Blackbody radiation for a surface at 5777K, and the actual radiation received in the
Earth right outside its atmosphere (AM0). Source: Wikimedia Commons. In Figure 2, the spectrum units are Watts per square meter per nanometer. If the whole spectrum is integrated, the value of the instant radiation per square meter (W/m2) will be obtained. It can also be observed that the highest intensity of the radiation is composed of visible light, around 400nm. The second curve, called AM0, is the actual measured radiation on the Earth outside its atmosphere. This value will differ since the radiation will travel through space and have some losses, since the space between the Sun and Earth is not an ideal void without any radiation absorbing objects; and because the Sun is not a perfect black body.

5
2.2.1 Direct and diffuse radiation The radiation received right outside of the atmosphere of the Earth (called AM0) is of 1367W/m2 after integrating this spectrum, a number that is called the Solar Constant [25]. After entering the Earth’s atmosphere, some rays will be bounced back to space. Other rays will be reflected or refracted in the atmosphere and will not reach the point of measurement on the ground. Others will, as well as some direct rays reaching the measuring point in a straight line [24]:
Figure 3: Sun rays as they enter the Earth's atmosphere [24].
The final rays that will reach the Earth’s surface will be the sum of the Direct Radiation or Direct Normal Irradiation (DNI) and the Diffuse Radiation. Added together, they will be called the Global Radiation. If measured on a flat surface, which is the standard measurement of radiation in different locations, it will be called the Global Horizontal Irradiation (GHI). This last value will be one that will be needed to make the calculations for solar modules [24]. On a sunny day, the direct radiation will be higher than the diffuse, and on a cloudy day, the direct radiation may be zero. The values of GHI are measured with special tools called pyranometers and pyrheliometers [26].

6
Figure 4: Pyranometer near PV array. Source: nrel.gov.
2.2.2 Air mass, AM Another aspect to consider regarding solar radiation is the angle of the Sun respect to the place of the Earth where the radiation is measured (measurement location). As the sun is closer to the horizon, the rays will have to travel a thicker atmosphere layer. This defines the Air Mass (AM):
Figure 5: Air mass, depending on the inclination of the Sun.
Source: K. Mertens: textbook-pv.org (modified). The Air Mass is defined as how many thicknesses of the Earth´s atmosphere must be travelled by the direct Sun rays to reach a reference point [26]. Mathematically, it is the inverse of the sine of the angle of elevation of the Sun. When the Sun is right above the measurement location, called zenith, the angle is 90°, thus an AM is 1, also called AM1. This means the rays are travelling the shortest thickness possible of the atmosphere (1 atmosphere). In the worst case in Figure 5, AM4 means the light is travelling 4 thicknesses of the atmosphere. Making the operation, the angle is 14.48°. Since the atmosphere acts as a filter, the radiation in a higher AM will be weaker.

7
Moreover, solar module properties are tested in lab conditions called Standard Test Conditions or STC: AM1.5 (angle of 41.81°), radiation = 1000W/m2 and TCELL = 25°C. AM1.5 is taken since the solar elevation varies during the year, reaching this average elevation in in spring and autumn [25].
Figure 6: Solar spectrum at AM0 and AM1.5. K. Source: Mertens: textbook-pv.org (modified).
As it is observed in Figure 6, the spectrum for AM1.5 is weaker compared to the AM0. It has several wavelengths where the values are almost zero. This are the absorbed wavelengths by water vapor, CO2, and other elements present at the atmosphere. When integrating this spectrum, an approximate radiation of 835W/m2 is obtained. This value will vary in the location where it is measured, mainly because of the diffuse and reflected radiations explained before. Because of this, an average radiation of 1000W/m2 is considered an average on a clear summer day on earth [26]. 2.2.3 Sun elevation The sun has another factor already mentioned, which is the elevation, not just during the day from the sunrise to the sunset, but during the year. In countries far from the equator, the winters days are short and summer days long since the relative movement of the sun over the sky goes through a long and short distance, respectively. On locations close to the equator, the changes are not that dramatic, and days last relatively the same during the year.

8
Figure 7: Sun paths for Halmstad (Latitude 56°N). Source: Andreas Christen, University of British
Columbia (ibis.geog.ubc.ca/courses/geob300/applets/sunpath) (modified).

9
Figure 8: Sun paths for Lima (Latitude 12°S). Source: Andreas Christen, University of British Columbia
(ibis.geog.ubc.ca/courses/geob300/applets/sunpath) (modified). As it is observed in both Figures, the comparison between summer and winter in Sweden is dramatic, and it does not vary that much for Peru, since it is close from the equator (just 12 degrees south). For Halmstad, the winter months will have a maximum sun elevation of just 10 degrees, meaning high AMs, and thus low radiations and a poor electricity production for PV modules. This changes in elevation are due to the tilt of the Earth axis, about 23.4°, which are the reason seasons exist [25].

10
One method to measure an approximate elevation of the sun without the help of any special tool is using a vertical object of height h in the ground reflecting a shadow s:
Figure 9: Calculating the sun elevation, taking a shadow as a reference.
The elevation of the sun will be [26]:
= arctan ℎ
(2.1)
Another observation on Figure 7 and Figure 8 is that, in Halmstad, during the whole year, the sun will be on the southern side of the horizon for its highest radiation (low AMs) and for Lima, it will be in the northern side. This behavior repeats for southern and northern locations of the equator. Because of this, PV modules need to face the true south in the northern hemisphere, and the true north in the southern hemisphere. True south and north are the geographical north and south of the earth, differing from the magnetic north and south. 2.2.4 True north and south True north and south are the points in the earth where the longitude lines converge in a single point. This point is static and does not change. However, magnetic north and south are not located in the same position, and move constantly as years pass by. Currently, the magnetic north pole is near the northern coast of Canada. A compass will point at this direction [27]:

11
Figure 10: True and magnetic north. Source: Pearson Scott Foresman.
Solar path diagrams, like the ones from Figure 7 and Figure 8, point at the true north and south. Also, solar modules need to point at these true directions. There are two easy methods to determine them: The first method is with a correction factor called the Magnetic Declination. It is the angle of difference between true and magnetic north for a specified location. In reference [28] the coordinates can be entered, along with the date, and the magnetic declination will be obtained. It has two components: an angle magnitude, and a direction, either west or east.
Figure 11: Magnetic declination towards West and East.
Source: Natural Resources Canada (modified). In Figure 11, the magnetic declination D will tell what is the angle and direction taken from the True north TN to reach the magnetic north. This means that, for west magnetic declinations, the true north will be D degrees to the east of the north marked by the compass; and for east magnetic declinations, the true north will be D degrees to the west of the north marked by the compass [29]. As an example, for Halmstad, with coordinates 56.662654, 12.881791, on May 14, 2017, the magnetic declination is 3° 51.36´ east.

12
The true north will be almost 4 degrees to the west of the north marked by a compass. True south will be the opposite direction. The second method is using the concept of Solar Noon. It is defined as the time of the day when the sun will be at its highest position [30]. This time of the day can be obtained in weather webpages like reference [31]. At this time of the day, the sun will always make a shadow on the true north – true south axis [32]. As seen, several factors must be taken to measure the radiation of the sun on a specific point of Earth, either instantly (W/m2), or for a period of time (Wh/m2).
2.3 Calculating solar radiation for a tilted PV module Considering all the properties of the sunlight that reaches the Earth, together with the special measuring tools, the radiation at a specific point on can be calculated. Also, there are PV software and Internet based tools that have these measurements ready. However, not all of these tools offer complete information for every location on earth, especially for tilted modules. Generally, most of them offer average yearly GHI values, but not much more than that. Also, it is good to understand how the manual calculation is obtained, and with this information use the available information on software and the internet. 2.3.1 Manual calculation: The 3-component method As it was commented on the previous subchapter, the standard measurement of solar radiation is GHI, Global Horizontal Irradiation, composed of the direct and the diffuse radiations. One method from reference [25] called the 3-Component Model can be used to calculate the GHI. This model is useful when the measurement is done on a tilted surface since it includes the tilt angle on the calculations. PV modules are generally not placed horizontally. If placed at a tilt angle facing the sun, the radiation they will receive will be higher as it will be observed in the following pages.

13
Figure 12: The 3 components of the radiation reaching a PV module.
Source: K. Mertens: textbook-pv.org. The solar irradiation reaching the PV module will have 3 components: Direct irradiation, diffuse irradiation and reflected irradiation [25]:
= , + , + , (2.2)
These values can be represented as irradiation (W/m2) or, after multiplying by an area, just power units (Watts). In this thesis, the irradiation will be represented as I, while the power P. Irradiation values are more general since they can be multiplied by any area later. 2.3.1.1 Direct irradiation In here, the direct component of the Sun irradiation will be calculated.
Figure 13: Direct radiation on a tilted surface.
Source: K. Mertens: textbook-pv.org (modified). In Figure 13, the sun radiation IDIR, PERP has a value in Watts per square meters, and the sun is elevated s degrees. There are 3 modules in total: A module horizontal to ground with an area AHORIZ, a module
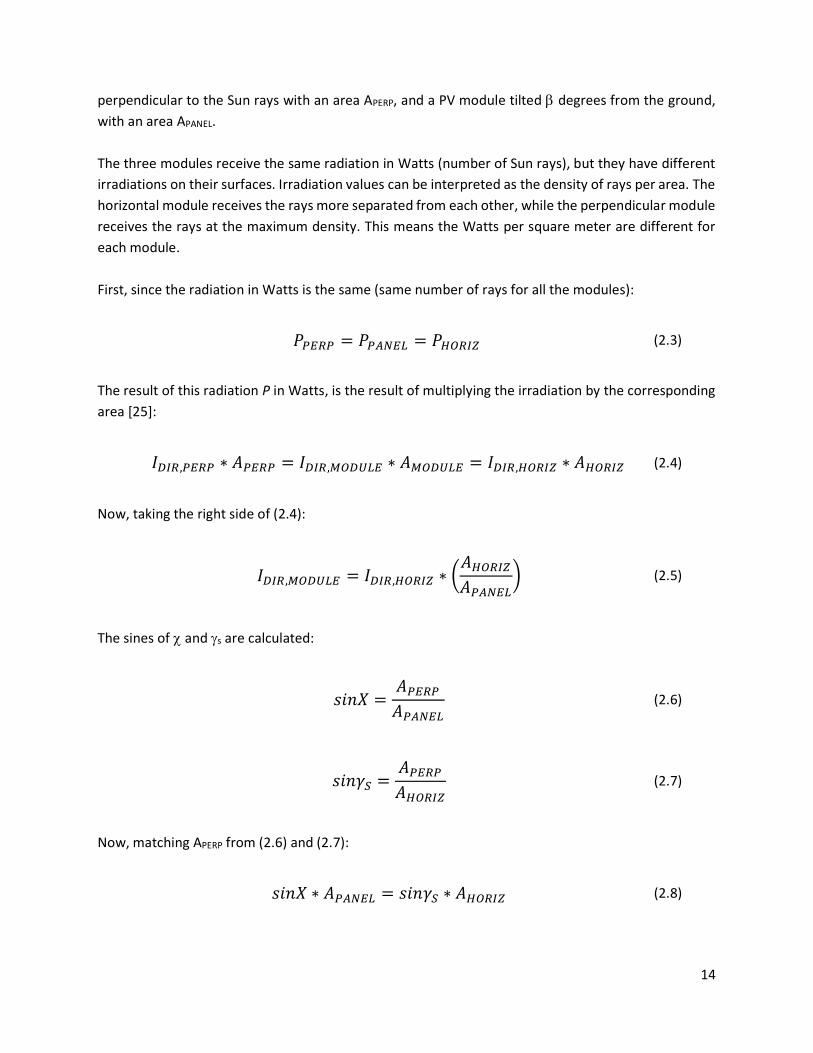
14
perpendicular to the Sun rays with an area APERP, and a PV module tilted degrees from the ground, with an area APANEL. The three modules receive the same radiation in Watts (number of Sun rays), but they have different irradiations on their surfaces. Irradiation values can be interpreted as the density of rays per area. The horizontal module receives the rays more separated from each other, while the perpendicular module receives the rays at the maximum density. This means the Watts per square meter are different for each module. First, since the radiation in Watts is the same (same number of rays for all the modules):
= = (2.3)
The result of this radiation P in Watts, is the result of multiplying the irradiation by the corresponding area [25]:
, ∗ = , ∗ = , ∗ (2.4)
Now, taking the right side of (2.4):
, = , ∗ (2.5)
The sines of and s are calculated:
= (2.6)
= (2.7)
Now, matching APERP from (2.6) and (2.7):
∗ = ∗ (2.8)

15
Next, the value of is calculated:
(180 − ) + + = 180
= + (2.9)
Replacing (2.9) in (2.8):
sin ( + ) ∗ = ∗
= sin ( + ) ∗
(2.10)
Finally, replacing (2.10) in (2.5) [25]:
, = , ∗sin ( + )
(2.11)
Most of internet based tools give the GHI and DIF (global and diffuse horizontal) irradiations for different locations. In order to obtain the direct horizontal IDIR, HORIZ, also called beam irradiation, the GHI needs to subtract the DHI. Also, most of solar calculations for PV modules are done on each month of the year. Since the Sun elevation changes during the year, a static sun elevation can be considered for each month for calculations. The maximum elevation at solar noon for each month would result in 12 different elevations during the year [33]. In order to obtain the optimum tilt angle of the module, with as variable, the derivative of (2.11) is equaled to zero in order to obtain the maximum IDIR, MODULE [25]:
, , : = 90 − (2.12)

16
2.3.1.2 Diffuse irradiation Taking the recommendation from [25], in order to simplify the calculation, it will be assumed that the radiation has the same strength (Isotropic Assumption). Having the horizontal diffuse as information, the component for the tilted module will be:
, = , ∗1 +
2 (2.13)
Figure 14: Isotropic diffuse irradiation. Source: K. Mertens: textbook-pv.org.
Since the irradiation comes from every direction, the maximum value will be when the tilt angle is zero. It can be checked by matching the derivation of (2.13) to zero. The worst case will be when the tilt angle is 90 degrees, since only half of the total diffuse radiation will face the module. 2.3.1.3 Reflected irradiation When the module is horizontal, the reflected irradiation on the ground will not affect it. However, if the module is tilted, its value needs to be taken into consideration, especially if the ground is very reflective, like snow [30]. This irradiation is highly dependent on the type of ground, since all surfaces reflect differently [25]. A method to determine the reflectance of a material is the Albedo value, which gives the percentage of light reflected on a surface [34]. An average value of 0.2 is used for unknown locations, otherwise the following table can be used [25]:

17
Table 1: Albedo factors for different surfaces. [25].
Type Albedo factor (AF) Grass 0.25 Lawn 0.18-0.23
Unmown fields 0.26 Woods 0.05-0.18 Asphalt 0.15
Concrete 0.20-0.30 Snow, fresh 0.80-0.90 Snow, old 0.45-0.70
Assuming an isotropic radiation similar to the diffuse radiation calculation, the resulting reflected irradiation is [25]:
, = ∗1 −
2∗ (2.14)
Analyzing this last equation, for a horizontal module the reflected radiation will be zero. If the module passes the 90-degree tilt (facing down) the reflected will also increase. However, the diffuse and direct components will decrease, which is not recommended. The term IGHI from (2.14) represents the global horizontal instant radiation when the measurement is made (in Watts per m2). For a monthly calculation, like in (2.11), the average solar noon elevation in the month is recommended for an estimate value [33]. 2.3.1.4 Getting all together Once the three components of the irradiation for a tilted surface are added, an estimate of the total radiation reaching a tilted PV module can be estimated.
= , ∗sin ( + )
+ , ∗1 +
2+ ∗
1 −2
∗ (2.15)
If the optimal tilt value is wanted, knowing all the other variables, the derivative equal to zero is done in order to obtain the optimum tilt value to get the maximum IPANEL. After the derivation, the optimum value of tilt β is:
18
, : = tancos
, − ∗ ∗ sin2 ∗ ,
+ sin
(2.16)
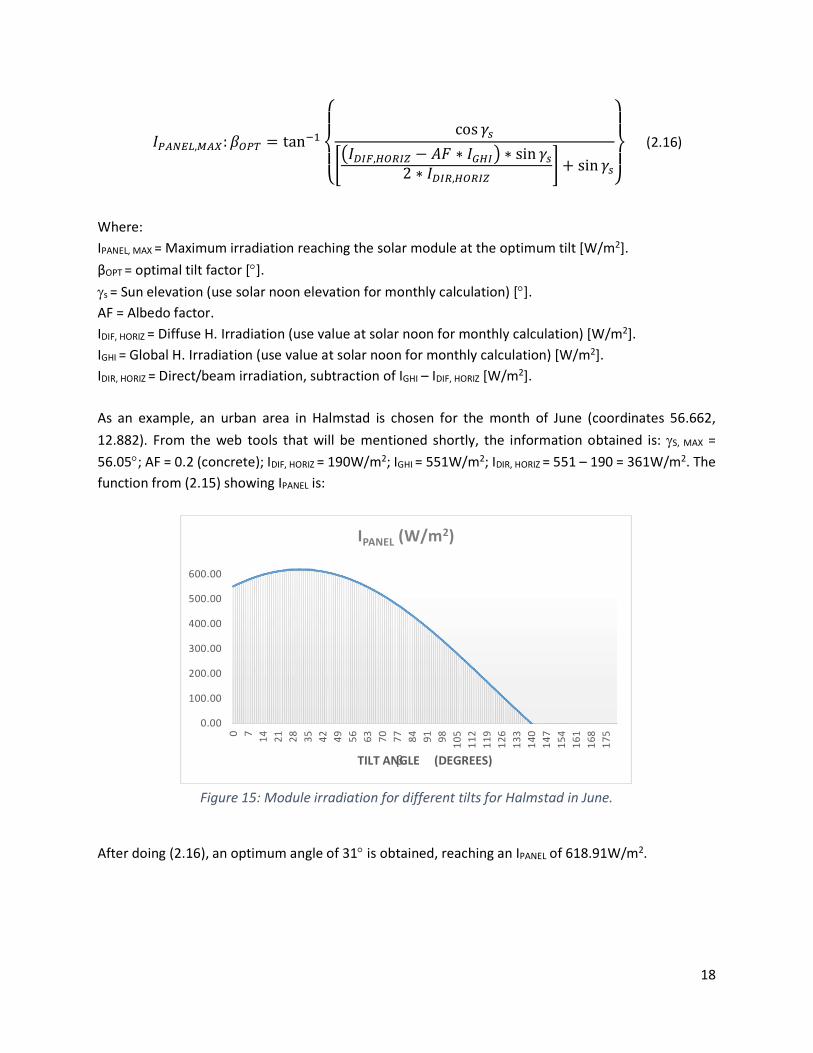
Where: IPANEL, MAX = Maximum irradiation reaching the solar module at the optimum tilt [W/m2]. βOPT = optimal tilt factor []. s = Sun elevation (use solar noon elevation for monthly calculation) []. AF = Albedo factor. IDIF, HORIZ = Diffuse H. Irradiation (use value at solar noon for monthly calculation) [W/m2]. IGHI = Global H. Irradiation (use value at solar noon for monthly calculation) [W/m2]. IDIR, HORIZ = Direct/beam irradiation, subtraction of IGHI – IDIF, HORIZ [W/m2]. As an example, an urban area in Halmstad is chosen for the month of June (coordinates 56.662, 12.882). From the web tools that will be mentioned shortly, the information obtained is: S, MAX = 56.05; AF = 0.2 (concrete); IDIF, HORIZ = 190W/m2; IGHI = 551W/m2; IDIR, HORIZ = 551 – 190 = 361W/m2. The function from (2.15) showing IPANEL is:
Figure 15: Module irradiation for different tilts for Halmstad in June.
After doing (2.16), an optimum angle of 31 is obtained, reaching an IPANEL of 618.91W/m2.
0.00
100.00
200.00
300.00
400.00
500.00
600.00
0 7 14 21 28 35 42 49 56 63 70 77 84 91 98 105
112
119
126
133
140
147
154
161
168
175
TILT ANGLE (DEGREES)
IPANEL (W/m2)
β

19
2.3.2 Calculating solar radiation with software and web tools Since the manual calculation can be long and tedious, there are easier ways to get the solar radiation for a place on earth. The ones that will be used for this thesis are the following: 2.3.2.1 World Bank Solar Atlas This tool is helpful for a quick overview of average yearly GHI and diffuse horizontal values, and shows a world map where high radiation areas can be quickly identified. It also shows the output PV production for an average solar module on the location selected and the optimum tilt angle for a fixed module through an entire year, as well as the production for that optimum angle. However, it does not show data for latitudes above 59° North (right above Oslo) or below 45° South (south of Chile). It does not show monthly radiation values either. The map van be found at [35].
Figure 16: World Bank Solar GIS map [35].

20
2.3.2.2 NASA Atmospheric Science Data Center This webpage shows a more detailed solar and meteorological data for any particular location worldwide. The values have mostly been measured by satellite and corrected with mathematical models in average for 22 years (data from July 1983 to June 2005). It shows monthly average daily values of GHI (in kWh/m2.day), diffuse horizontal irradiation, hourly irradiations for different times of the day (in kW/m2), optimum angles, and total irradiation values for tilted surfaces. It also has monthly average maximum and minimum temperature values, wind speeds, solar noon times, and several other features. The problem with this webpage relies on that it is only based on satellite measurements. This kind of measurements are not that accurate when measuring on mountainous regions due to low atmospheric density, higher ground reflection, etc. A measuring instrument placed on the location will bring the most exact measurement compared with a satellite measurement [25]. Another problem is that the satellites make measurements in grids of 100x100km. In some locations on earth, the weather can change dramatically in 100km. It is more recommended for flat areas rather than mountain regions. The NASA webpage can be found at [36].
Figure 17: NASA Online Tool for a particular location [36].

21
2.3.2.3 EU Joint Research Centre PV Geographical Information System (EU JRC PVGIS) This webpage brings similar data to the one from NASA but just for the African, European, and Asian continents as average values measured for the last 12 years. Monthly GHIs, diffuse, daily irradiation values by the hour, optimum tilt angles per month and per year, estimate PV production, etc. The difference with NASA is that it uses satellite data plus meteorological stations on Earth to do the measurements along with mathematical models. If a design needs to be done for either Europe or Africa, this web application is recommended. The web tool can be found at [37]. The data obtained for the example in Halmstad after (2.16) was taken from this webpage. The calculations in the example for Halmstad from Figure 15 were done using this tool.
Figure 18: EU-JRC-PVGIS Online tool [37].

22
2.3.2.4 PVSyst Software PVSyst is a PV design software and it was recommended by the company that is collaborating with this thesis, WSP. This software allows to make solar designs for any part on the world with more precision. Custom load profiles, horizon diagrams, and 3D modelling of the design location are a few of the many features offered by this software. About solar data, it downloads it either from the NASA webpage showed before or from a private company called Meteonorm, which counts with ground stations for more accuracy of data. The design done on this thesis will be done manually and also with PVSyst. The software is not free but offers a trial period of the full version, and it can be found at [21].
Figure 19: PVSyst Software [21].
3 PV Systems technologies

23
In this chapter, the theory of solar modules, types, module properties and common connections for PV systems will be discussed. Only the theory needed for the design in chapter 4 will be reviewed.
3.1 Semiconductor properties: Silicon Semiconductors are materials that can act as insulators or as conductors in different scenarios. Solar cells would not be possible without these materials. The most common semiconductor used in PV modules is Silicon [38]. This theoretical subchapter will focus on this material. Together, Silicon atoms form crystals, sharing their 4 valence electrons with the surrounding atoms in covalent bonds. Valence electrons are the electrons in the outermost layer of the atom [25].
Figure 20: Silicon crystal structure [25].
To conduct electricity, the electrons in an atom need to be placed on the conductive band, which is above the valence band. The separation between the valence and the conductive band is different for every element, and is called the band gap. Silicon has a bandgap of 1.12eV, which is a measure of energy. One electron volt equals 1.79x10⁻¹⁹ Joules. In order to pass one electron from the valence to the conductive band this energy is necessary [25]. As stated by Nils Bohr second statement, the transfer of an electron from one band to another occurs under the emission or absorption of electromagnetic energy. If a Silicon atom receives a photon of light with the bandgap energy (or higher), one of its atoms will jump to the conductive gap. It also can

24
happen that the material is heated, and because of thermal energy the electron reaches an energy needed to jump to the conductive band [25].
Figure 21: Valence and conduction band for different materials [25].
In Figure 21, the valence band (blue) and the conductive gap (green) are separated by a gap. Insulators have a quite big band gap, bigger than 3eV. No matter how hot the material is, their electrons will not jump to the conductive gap. Metals have the valence and conductive gap overlapped, so practically all their valence atoms are available for electrical conductivity. In semiconductors, the band gap is lower than 3eV by definition, and the material needs to be heated to around 200°C to be a good conductor. At regular room temperature, only some atoms will conduct.
Figure 22: Electron from valence band jumping into conductive band [25].
In Figure 22, it can be observed that, either by thermal excitation or by electromagnetic radiation, when an electron jumps into the conductive band, it creates a hole of “positive charge” in the valence band. This situation is called Electron-hole pair generation. 3.1.1 N and P-type Silicon

25
In a pure Silicon crystal, all the valence electrons are being used in the covalent bond with the surrounding atoms. For this reason, to increase its potential for conductivity, a process called doping is done to the material. The materials added, specifically for Silicon, are the ones with one extra or one less valence electron (3 or 5 respectively) [39]. If the material added, called impurity, has one extra valence electron (5 valence in total), then the Silicon becomes N-type (example: Phosphorus, P). If the material added has 3 valence electrons, then the Silicon becomes P-Type (example: Boron, B) [39].
Figure 23: N-Type Silicon (left) and P-Type Silicon (right) [39].
As seen in the left of Figure 23, an N-Type Silicon crystal has one extra electron that can run freely on it. For each impurity atom, there will be an extra electron. In a P-Type Silicon crystal (right side of picture), there is one missing electron, which creates a hole. This hole allows the electrons from the surrounding atoms to move freely around this space. As an analogy, if an empty box is filled with a single layer of marbles, they will not be able to move. If some marbles are taken out, the free space will let all the other marbles to move freely [39]. 3.1.2 Common manufacturing types of Silicon

26
When creating N or P-Type Silicon crystals, the most common methods are [26]:
Figure 24: Monocrystalline, Polycrystalline and Amorphous Silicon [26] .
The first type is called Monocrystalline (“Mono”), where all atoms in the crystal are arranged into a single pattern. In order to reach this, the process is not simple, making it an expensive part of a solar cell [26]. The second type is Polycrystalline (“Poly”). It is formed by joining several individual crystal patterns of Silicon together. This method is easier and less expensive than monocrystalline. Since the organization of the crystal molecules is not uniform across the entire product, its performance is lower than the monocrystalline, not allowing electrons to flow as freely as with monocrystalline [26]. The third and last type is Amorphous Silicon. It is formed by even more disorganized individual crystal patterns into the final product, leaving empty spaces between them and filled with Hydrogen in order to fill the gaps. Currently, they have a lower lifespan compared to Mono and Poly, and a worse efficiency level [26]. 3.1.3 Structure of a Solar cell

27
The most common type of solar cell uses one small layer of highly N-Type Silicon called Emitter and a thick layer of P-Type Silicon called Base [25]:
Figure 25: Structure of a Silicon solar cell [25].
In Figure 25 a simple solar cell is shown. It has an anti-reflective layer in order to absorb the maximum amount of light. The PN junction creates a Space Charge region which creates a potential difference called a Diffusion voltage on its surroundings. Finally, metallic contacts are placed in one side of the emitter and the base [25]. A light photon can fall into 4 regions: In the first case, the photon is absorbed into the highly-doped N emitter. It creates an electron-hole pair. Since the number of extra electrons is high, there is a big probability that the hole created will be covered by one of those electrons. In the second case, the photon falls into the space charge region. The diffusion voltage pushes the hole into the bottom of the module, into the P-Type zone, and the generated electron into the top, to the negative electrode. Since the base has extra holes, there is a low probability to re-absorb the generated hole so it reaches the positive electrode. If a charge is connected, there is a high probability of electricity conduction.

28
In the third case, the photon falls into the diffusion layer of the P-Type Silicon. Since there is no voltage to push the electron to the negative electrode, there is an even probability that it will reach the space charge region and thus go to the negative contact. The whole will reach the positive electron. In the last case, the photon falls deep into the P layer, with a high probability of being absorbed into one of the holes and not generating a potential electricity flow if a load were connected. As shown, the ideal photons will be the ones that fall into the second and third case. The others will just generate thermal energy and warm the module [25].
3.2 Solar cell arrangements and electrical properties A single solar cell will produce approximately 0.5-0.6V. In order to have useful values, several cells are placed in series in order to create voltages around 12 or 24VDC (arrangements of 36, 54, 60, 72 cells are common) [40]. These are known as modules.
Figure 26: Solar module made of 36 cells in series [41].
Modules / cells can be connected either in series (String) or in parallel (Group) so as to add voltage or current, respectively, according to the load requirements and circuit design. The most important electrical aspects of a solar module will be discussed next. 3.2.1 Peak power, area of module

29
One of the basic characteristics of a solar module is the peak power PMAX or WP in Watts. It represents the maximum output power of the module. Usually, the number of the peak power is included in the model number of the module [42]. The datasheet will also show the dimensions of the module. The area can be obtained by multiplying height by length. Since the irradiation depends on area, it is necessary for the design.
Figure 27: Part of datasheet from module LG Neon 2 Black, showing PMAX and area [43] (modified).
3.2.2 STC and NOCT

30
When solar modules are tested in lab facilities in order to get their properties, standard conditions are met so all manufacturers do the tests in the same environment. STC, or Standard Cell Conditions, are the basic standard for testing solar modules in manufacturing facilities. These conditions are two: Cell temperature of 25°C and a simulated sunlight spectrum of the one of 1.5AM with an irradiation of 1000W/m2. The peak power or WP will be met at these conditions [42]. However, when a solar module is installed in a real-life environment, the temperature of the cell will be different from 25°C; and the sun radiation will not be permanently 1000W/m2. The NOCT, or Normal Operating Cell Temperature, is the temperature of the cell when the following conditions are met: Irradiance of 800W/m2, ambient temperature of 20°C, wind speed of 1m/s, and an open back side of the module (base of the module not in contact with any other surface) [42]. 3.2.3 Voltages, currents, maximum power point, fill factor Other important characteristics of a solar module are its operating voltages and currents. If, on STC conditions, the load resistance varies from zero to infinite, the current and voltage of the module will vary forming the IV Curve, represented on a voltage vs. current diagram. It will show all the operating points where the module can work.
Figure 28: IV Curve of a PV module in red, and corresponding power in blue [41] (modified).
As seen on Figure 28, on one extreme of the IV curve, when the load resistance is infinite (open circuit), the voltage is called Open Circuit Voltage, VOC (with zero current), and when the load is zero, the

31
current is called Short Circuit Current, ISC (with zero volts). On this curve, there is one point where the power is the maximum. This is the rated power PMAX of the module, at a voltage and current called VMPP (Maximum Power Voltage) and IMPP (Maximum Power Current) respectively [42]. The Fill Factor, FF, is the proportion between the peak power PMAX and the product of VOC and ISC. Common Silicon modules have FF values near 80% [41]. When there is no sunlight at the module, it will work as a diode, and if connected to a power source, it drains a current called Dark Saturation Current [41]. If there is sunlight on the module, the output voltage will be somewhat stable. What will be strongly variable with the irradiation will be the output current. An interactive animation that shows the IV curve on different situations can be found at [41]. Different IV curves can be seen in Figure 29:
Figure 29: IV curves for different irradiation values for module Seraphim SRP-250-6MB.
Source: electrotecenergy.se/solcellspanel-260w-poly. Other factors to consider are that, when the radiation on the module is higher than STC (1000W/m2), the ISC will decrease, and VOC will increase; and when TCELL increases above STC (25°C), PMAX and VOC will decrease, and vice-versa [42]. Finally, since the Sun irradiation varies during the day, the maximum power point cannot be reached the entire time. On Figure 29, a maximum power can be obtained for different Sun irradiations. To reach them, it is recommended to connect the modules to a device called MPP Tracker which changes

32
the impedance seen by the module in real time, so the maximum possible power can be reached for any irradiation value [42]. There are other devices called PWM controllers, which are less sophisticated [44] [45]. 3.2.4 Module efficiency The efficiency of a solar module represents what percentage of the total energy received by the irradiation is converted into electrical energy. It is measured at STC conditions. The efficiency is always shown on datasheets, and the formula is:
=∗ ∗
(3.1)
PIN: Irradiance of 1000W/m2 (STC) multiplied by the module area (Watts). VOC, ISC: Open circuit voltage, Short circuit current (Volts, Amperes). FF: Fill factor (%). 3.2.5 Temperature coefficient As mentioned, the properties of solar modules are done at STC conditions, where the temperature of the cell is 25°C. If this temperature increases, the resulting PMAX will not be the nominal value shown in the datasheet. There is a negative factor called Temperature Coefficient with units in percentage per °C or Kelvin. The excess of temperature over 25°C needs to be multiplied by this factor to know the percentage of decrease of the PMAX of the module. To know the temperature of the cell there is a quick formula recommended by [41]:
= + ∗− 20
80 (3.2)
In the equation above, TAIR is the ambient temperature in °C, NOCT the normal operating cell temperature in °C found at the datasheet of the cell or module, and I is the instant sun irradiation in mW/cm2 (the irradiation of W/m2 just needs to be divided by 10 to get these units). 3.2.6 Cell Mismatch, hot Spots, bypass and blocking diodes

33
When on a solar module, there may be some occasions when the individual cells will not receive all the same amount of irradiation uniformly. In an extreme case, one or more cells can be totally shaded by an object in front of the module while the others don’t. This is called Shading. The shaded cells IV curve will have a lower ISC value (the horizontal part of the curve will be lower than the others) [41]. It can also happen that not all the semiconductor layers on each cell have the exact same electrical properties. Some cells may allow a better conduction of current than others and have better ISC values. This is called Cell Mismatch [41]. In both cases, the low ISC cells will limit the current flow from other cells. They will block the higher currents that the other good cells are providing. The high current from the good cells will then be dissipated as heat the problematic cells, creating overheating, glass cracking, or even melting. This is called a Hot Spot [41].
Figure 30: Three cells in series, with one shaded [25].
Shading can´t be avoided entirely. In some locations, neighboring buildings, street light poles, trees, electricity cables, etc. can create a shadow on certain areas of a module some time of the day. Also, when modules are installed on different areas of roofs over houses, some modules will have a different tilt than others, receiving less irradiation and thus creating hot spots on all their cells. On the other hand, for the cell mismatch situation, manufacturers try to group cells of similar properties together to avoid it [46] [47].

34
Figure 31: Solar module covered partially by plants. It can be observed with an infrared camera that
shadowed cells have a higher temperature compared with the others [48].
To solve the hot spots, Bypass Diodes are installed in parallel to the cells inside the module by the manufacturer. By doing this, when the cell is shadowed, most of the current from the well irradiated cells will bypass this cell and go through the diode. The shadowed cell will only drive the low current it can handle, depending on how shaded it is (its ISC will be lower). The ideal would be to install one single bypass diode per cell; but, in order to save costs, bypass diodes are installed in groups of cells, varying from one manufacturer to another. According to [26], the maximum number of cells with a shared bypass diode is 10 to 15.
Figure 32: Groups of cells with their respective bypass diodes and current flow in case one cell is
shadowed [41] (modified).
It must be emphasized that that not all modules include bypass diodes on their cells. If non-embedded bypass diodes are needed, like for example, a permanent difference in irradiation between modules installed in two different faces of a roof, they should be able to handle twice the VOC of the protected modules and 1.3 times their ISC [26].

35
Another kind of diode used in PV installations is the Blocking / String Diode. For the shading problem, it is connected in series with the output of each module of string of modules and it is used when each string has a different irradiation during the day, like different sides of a roof. Also, if the modules are directly connected to a battery, they can drain current during the night.
Figure 33: Two strings of modules in parallel, each with a string diode [49] (modified).
As seen in Figure 33, the diodes are working all the time. They drive the full operating current of each module or string of modules, and the higher the current, the higher the voltage drop in the diode. They need to be cooled if current is high according to their thermal specifications. In any other case, it is only recommended to use this kind of diodes when each string generates more than 100V and the number of parallel strings is quite high [48]. A string diode should be rated for twice the VOC and 1.25-1.5 times the ISC of its respective string. If the solar module string is grounded, the diode should be installed on the ungrounded side [26] [48]. If selecting diodes to avoid drainage from a battery during the night, a battery controller is recommended instead of the diodes [48].

36
4 Design This chapter covers the design of the off-grid systems. First, the selected locations will be explained together with their load profile calculation, and secondly, the proper design will be made.
4.1 Choosing the locations The criteria used to choose the locations in Sweden and Peru will be discussed. 4.1.1 Location in Peru and load profile For Perú, almost 3 million Peruvians don´t have access to electricity. Also, for 2016, 1.12 million people lived in extreme poverty, especially in the Andes [50]. Peru is divided in 24 regions, divided into provinces, and divided into districts. The following criteria was used to select the location in Perú:
- High risk of freezing temperatures during winter. For this information, an emergency decree emitted on 2008 made a list of 40 high risk provinces above 4000m [17].
- The national meteorology center SENAHMI made a permanent list of 93 districts with yearly high risk of freezing temperatures [51].
- This same meteorology center has ground stations that measure temperature and wind speed, accessible by internet. These stations have recorded data for several years [52]. The high-risk districts were filtered to the ones close (less than 5km) to these stations.
- The economy ministry has a GIS tool showing the percentages of child mortality, no electricity,
and extreme poverty for provinces and districts. The list is reduced [53].
- The next step is to use another GIS tool from INEI, the national statistics institute. These institute made a nationwide list of rural farmer communities; these communities are the ones that concentrate the highest poverty in Perú [54]. From the previous list, communities that qualify as rural farmer communities are chosen. This database has the exact coordinates of the rural communities (10 decimals in latitude and longitude).
- The final step is another GIS tool from the energy ministry that shows the national energy network. It also shows future projects of grid connection to disconnected communities, along with their project code, linked with the economy ministry. The communities are reduced to the ones with no projected connections [55].

37
The final list had 6 communities with populations from 3 to 11 habitants. An 11-people community was chosen as recommended by WSP for a medium-size group of people.
- Region (Región): Tacna. - Province (Provincia): Tacna. - District (Distrito): Palca. - Rural community (Centro poblado rural): Ungalluta 2. - Population: 11 inhabitants. - Altitude: 4626m above sea level. - Average GHI per year: 2383kWh/m2. Yr. [35]. - Coordinates of chosen household: -17.5084916668, -69.8033366663.
Figure 34: INEI rural community GIS tool [54] (modified).

38
Figure 35: Peru national grid, showing some projected low-tension lines when zooming in [55]
(modified).

39
Figure 36: Peru average yearly GHI irradiation and selected rural community Ungalluta2 colored in
white near the southern border with Chile. Source: solargis.info (modified).

40
Figure 37: Economy ministry social gaps GIS tool per district, showing percentage of population per
district without electricity access on zoom below [53] (modified).
The location of Ungalluta 2 can be accessed by the satellite images of Google Maps [56]. However, the Street Maps feature is not accessible. The household, like the one from Sweden, has several square meters of empty land for installing PV modules. Since the construction of most of these rural houses is made of mud bricks and covered in hay, it wouldn’t be stable to suit PV modules over them. It is recommended to place them at ground level.

41
Figure 38: Isolated rural communities in the Peruvian Andes are commonly build on mud bricks and
covered in hay. Source: elcomercio.pe.
Figure 39: Satellite view of Ungalluta 2 (right) and Paucarani lagoon close by (left). Source:
diariocorreo.pe (modified), [56].
The load demand calculation will be done differently from Sweden. Instead of by area, a list of home appliances was calculated for the 11 people [57] [58]:
- 1 small laptop (50W) for 4 daily hours: 200Wh. - 6x20W Energy saving light bulbs for 9 hours: 1080Wh. - 2x3500W electric showers for 2 hours: 14000Wh. - 1x150W TV for 4 hours: 600Wh. - 1 small fridge x 50W the entire day: 1200Wh. - The total is 17.104kWh/day.

42
4.1.2 Location in Sweden and load profile It was mentioned on the introduction that Sweden has a 100% access to electricity. In here, the situation is quite different from Perú. Some reasons that can justify an off-grid design are:
- A new household built in a rural area of low population density can bring a considerable investment if making a brand-new connection to the electricity network.
- The desire of a household owner, who is already connected to the network, to be independent from the network. As commented by [33], it is common to have power failures during the year because of trees falling over power lines, storms, etc.
- Electricity providers will charge a base tariff to the household, even if no power has been consumed during the month. For summer houses that are not used half of the year, the owner still needs to make payments every month to stay connected to the network.
To select a location for Sweden, an initial view of the national grid was done. From Figure 40 it can be observed that some areas in the far north and a considerable area in the west of Örebro does not have a high density of transformers / substations. From this last area, the small parish of Gåsborn and a house was chosen (white circle on Figure 34) [59] [56].
- Region (Landsdel): Västra Svealand. - County (Län): Värmland. - Municipality (Kommun): Filipstad. - Parish (Socken): Gåsborns. - Community (Kyrkbin): Gåsborn. - Population density: 1.1 inhabitant per km2. - Altitude: 230m above sea level. - Average GHI per year: 932kWh/m2. Yr. [35]. - Coordinates of chosen household: 59.877763, 14.325217.

43
Figure 40: National grid map for Sweden. Location of Gåsborn selected from white circle.
Source: http://www.svk.se/en/national-grid/map (modified).

44
Figure 41: GHI yearly irradiation for Sweden. Gåsborn marked in black circle [37] (modified).
By using the Satellite view and Street View from [56], the size of the selected house was calculated:

45
Figure 42: Picture of selected household on the top right, along with 3 barns, probably from the same owner [56].

46
Figure 43: Roof area of house and barns [56] (modified).
The house roof has an area of approximately 175m2. Together with the barns, the available roof area for PV installations is approximately 849m2. The PV modules can also be installed on the ground: the free terrain is approximately 92000m2. To get the load profile for this house, a report from the Swedish energy agency Energimyndigheten was inspected [60]. It shows the energy consumption for Swedish families of different ages with or without children, including heating or not. For this design, electric heating will not be included, since solar heating can be a good option for it. It is assumed that a complete family lives in this house (because of the big size of the house) and the total area to will be 175m2 (the house is 2 storey-high, but it is assumed that most of the electronic artifacts are on the first floor. From the report, the chart in Figure 44 is extracted and an average value of 76kWh/m2.year is obtained. Multiplied by 175m2 and divided by 365 days gives a consumption of 36.44kWh/day.

47
Figure 44: Yearly consumption in kWh per m2 for a Swedish average family with children, without
including electric heating [60].
4.2 Off-grid system structure The block diagram for an off-grid system, including a backup generator, after reading several PV manuals and thesis works, commonly can have 3 configurations [21] [25] [26] [30] [39] [40] [48] [61] [62] [63] [64]:
Figure 45: Block diagram for first type of off-grid system. Blue arrows: DC; Red: AC.

48
Figure 46: Block diagram for second type of off-grid system. Blue arrows: DC; Red: AC.
Figure 47: Block diagram for third type of off-grid system. Blue arrows: DC; Red: AC.
In Figure 45, the battery charger is the only device responsible for the batteries. At the same time, the inverter converts the battery voltage into AC for the loads. In case it is needed, the generator is turned on manually and feeds the loads directly. In Figure 46, the inverter is called an off-grid inverter-charger. The external charger and the inverter are both capable of recharging the batteries. The generator, if turned on, charges the batteries through the inverter-charger and does not feed the AC loads directly. The inverter-charger can simultaneously
49
charge batteries and provide AC output to the load. The generator can be turned on automatically or manually, if the inverter detects a low charge on the batteries. In Figure 46, an inverter-charger is also used. However, the PV modules are not connected to a charger. They are connected to an inverter that directly converts their power into AC, which feeds the inverter-charger, which is the only one in charge of the batteries. The inverter-charger will receive AC from the generator, the module inverters and the battery bank and its output will feed the loads in the household. The selection of which design will be used is going to be based on local availability of the components, as well as a low price. Some observations from diagrams on Figure 46, Figure 46 and Figure 46:
- The modules should count with internal bypass diodes to avoid hotspots. Additionally, for Sweden, the modules should change their tilt every month to use the maximum possible irradiation. For Perú, for cost saving, the tilt will be optimized and fixed throughout the year.
- The battery bank will be rated for 48VDC, since this is a common rated voltage for medium sized systems [65]. Also, for Perú, the batteries will be Lead-acid of the deep discharge type, since they have a long lifespan [24] [25] [66] [48]. For Sweden, the battery bank will be Lithium (higher efficiency), since the solar radiation is low in this location and the sun radiation needs to be utilized as much as possible [33] [48]. In both locations, an autonomy of 3 days will be selected, meaning the number of days the household can survive without any solar irradiation [25] [66].
- The individual battery charger or module inverter, accordingly to the configuration selected, will have an internal MPP tracker to deliver the maximum power from the modules to the batteries / inverter-charger (see section 3.2.3). It should also prevent the modules from draining power during the night. Otherwise, a blocking diode would be installed in the output of the modules.
- The individual charger, as well as the inverter-charger if selected, will allow to select the type of batteries connected, and measure their state of charge, SOC, to decide the best charging strategy and preserve their lifespan, since batteries are the most sensible component in the system [24]. Overcharging or deep discharging the Lead-acid type will cause sulfating and gasification, causing them to degrade rapidly. For this type, it is recommended not to discharge them below 20 to 40% of their capacity, so the value of 30% is selected as the Minimum SOC [24] [25]. It should count with a preventive circuit that doesn´t allow the batteries from deep discharging below this minimum SOC. Otherwise, an external battery disconnector will have to

50
be installed. The Lithium batteries can, on the other hand, reach SOCs down to 20% without a problem, so the charger should be able to set the minimum SOC [67].
- Moreover, the charger(s) should also count with a temperature sensor and decide the charging strategy on this variable as well, since cold temperatures need a higher charge limit, while hot temperatures the opposite [66] [68].
- The DC to AC inverter must be True Sine Wave, since the other type, the Modified Sine Wave inverters can cause overheating and premature damage of appliances. It should also have filters to reduce harmonics, with a Total Harmonic Distortion lower than 6% [40]. Additionally, it should have a sleep / standby feature, which keeps the inverter off when there are no loads connected. This feature should have a low threshold so low power loads can be detected when connected to the household AC grid [66].
- The generator will supply extra power on the non-PV covered months since covering the entire
year will result expensive. The power will be according to the peak load. It should run on an 80% full load or higher values to have an optimum fuel usage [69].
- As security measures, the output of each module string and the battery bank will all have a
fuse, as recommended in [62] [70]. The AC output of the inverter which goes to the final AC loads will have a thermomagnetic switch that shuts down automatically in case of a current surge. Finally, grounding must be installed for all components according to regulation [61] [71].
- It is recommended to read the entire installation manuals from each chosen component if the items are going to be implemented on real life
4.3 PV modules selection and battery sizing In this section, the PMAX for each design, as well as the battery bank capacity will be manually calculated. Since this thesis involves real components in the market, online stores were looked up for Sweden and Perú. For Sweden, the following stores with prices on their webpage could be found: Swedensol, Nordensolar, Electrotec, Solelgrossisten, Solcellgrossen, Europe Solar Shop, WattUneed, and Kvänums Järn. All components will be chosen from these webpages, with the price as the priority. For Perú it was more difficult since there are few online solar stores, and the ones available do not have a big variety of products. Two were found: Module Solar Perú and Proviento, and a US online store that ships internationally: Webosolar. From the Peruvian pages, the generator and batteries will be purchased. All the other components will be purchased directly from the US store to simplify calculations [72] [73] [74] [75] [76] [77] [78] [79] [80] [81] [82].
51
The method used is the one recommended from Konrad´s book [25]. In here, the Full Load Hours definition is used. Some modifications have been added with the assistance of the instructor [33] to get a better accuracy on the results. The full load hours are the number of hours needed to fully satisfy a GHI on a period of time. For example, if a city in January has a GHI of 5kWh/m2. d, assuming an instant average horizontal irradiation of 1000W/m2, by dividing these values it gives a result of 5h. In other words, on a single day in January it is needed 5 full load hours at 1000W/m2 to reach the daily irradiation [25]:
= (4.1)
The method requires the following steps, where the worst case is used for the design:
- First, to get the average daily GHI per each month of the year (horizontal global irradiation). The factors involving a tilted module will be added later.
- Second, to obtain the maximum average air temperatures on each month.
- Third, to get, for all months, the instant daily irradiation at solar noon (Watts/m2).
- Fourth, to obtain the Full-Load hours for each month by using (4.1) with the results from the first and third steps.
- Fifth, to obtain the tilt factor, temperature factor, line losses factor, battery conversion factor
and adaptation factor (will be explained next).
- The final step is to apply the formula for the modules peak power PPV, max [25]:
, = ℎ
∗ ∗ ∗ ∗ ∗ (4.2)
In the end, the highest value will be considered (worst case, highest requirement). For the battery sizing in Ampere-hours, the following formula is used [25]. If the capacity in Wh wants to be known, the Vbatt is removed from the formula:

52
= ℎ ∗
(1 − ) ∗ (4.3)
4.3.1 Selection of modules, tilt, and battery capacity for Perú location (Ungalluta 2) Before starting to calculate values for Perú, the modules need to be selected for some parameters needed for calculations (the rest of components will be decided later). From the stores mentioned, a list of the lowest priced modules, considering the price per Watt (not including shipping or customs yet), is made:
Table 2: List of low cost modules for Ungalluta 2.
In the table above, the 2 modules in green are chosen because they have bypass diodes and they show a low price per Watt. These prices do not include shipping or taxes yet. It will be done in the next chapter together with the other components. Now the calculations. For Perú, the data was obtained with the help of PVGIS, NASA and PVSyst (check section 2.3.2). For the manual calculation, the PVGIS tool is the most useful. However, this database does not have information for the American continent. The solution was to take a similar latitude in Africa to get similar optimal angles and tilt factors [39].
Figure 48: Ungalluta 2 and a similar latitude location in Namibia, Africa [56].
For this similar latitude location, the tool PVGIS was used and an optimum fixed yearly angle of 20° was obtained. This will be the angle for Perú. The GHI values and Global values at these tilt for the Namibia location are:
Store Model Made in Type Wp EUR/Wp Price EUR η (%) Observations Area (m2)WeboSolar Trina Solar ALLMAX 280w China Mono 280 0.51 143.29 17.7 No bypass diodes 1.55WeboSolar Hanwha QCELLS 330w China / Germany Poly 330 0.52 170.88 16.50 Bypass diodes 1.99WeboSolar Hanwha QCELLS 265w China / Germany Poly 265 0.53 140.62 15.90 Bypass diodes 1.67WeboSolar Solartec S72MC 315w USA Mono 315 0.53 168.21 16.26 No bypass diodes 1.94WeboSolar Hanwha QCELLS 290w China / Germany Mono 290 0.56 163.76 17.40 Bypass diodes 1.67
Panel Solar Peru Yi Solar YI6B 230P China Poly 230 1.01 232.2 15.68 Bypass diodes 1.47Panel Solar Peru Yi Solar YI6A 260M China Mono 260 1.40 364.5 16.01 Bypass diodes 1.62

53
Table 3: GHI and 20° Global Irradiation values for the Namibia location, along with KTILT.
KTILT is the relation between the tilted and horizontal irradiation and will be similar for Ungalluta2 since it has the same latitude. These values will be used to calculate PPV, MAX. To find the instant irradiation at noon for the FLH calculation, the NASA webpage only gives instant horizontal values for 10am. PVSyst only gives monthly but not instant values. The NASA values are take: now they need to be tilted for 20°. A new tilt factor, for the instant irradiation needs to be calculated. Because of this, the Namibia location is used again for 10am instant irradiation, to get a relation that can be multiplied by the NASA value:
Table 4: Instant radiations for 10am for Namibia.
Month Opt tilt (°) GINSTANT (kW/m2)@ 10am, horizontal
GINSTANT (kW/m2)@ 10am, tilt 20°
Relation
Jan 20 0.838 0.823 0.98Feb 20 0.796 0.721 0.91Mar 20 0.773 0.673 0.87Apr 20 0.761 0.590 0.78Maj 20 0.741 0.507 0.68Jun 20 0.707 0.450 0.64Jul 20 0.716 0.472 0.66
Aug 20 0.789 0.580 0.74Sep 20 0.876 0.723 0.83Okt 20 0.915 0.830 0.91Nov 20 0.911 0.881 0.97Dec 20 0.903 0.899 1.00
54
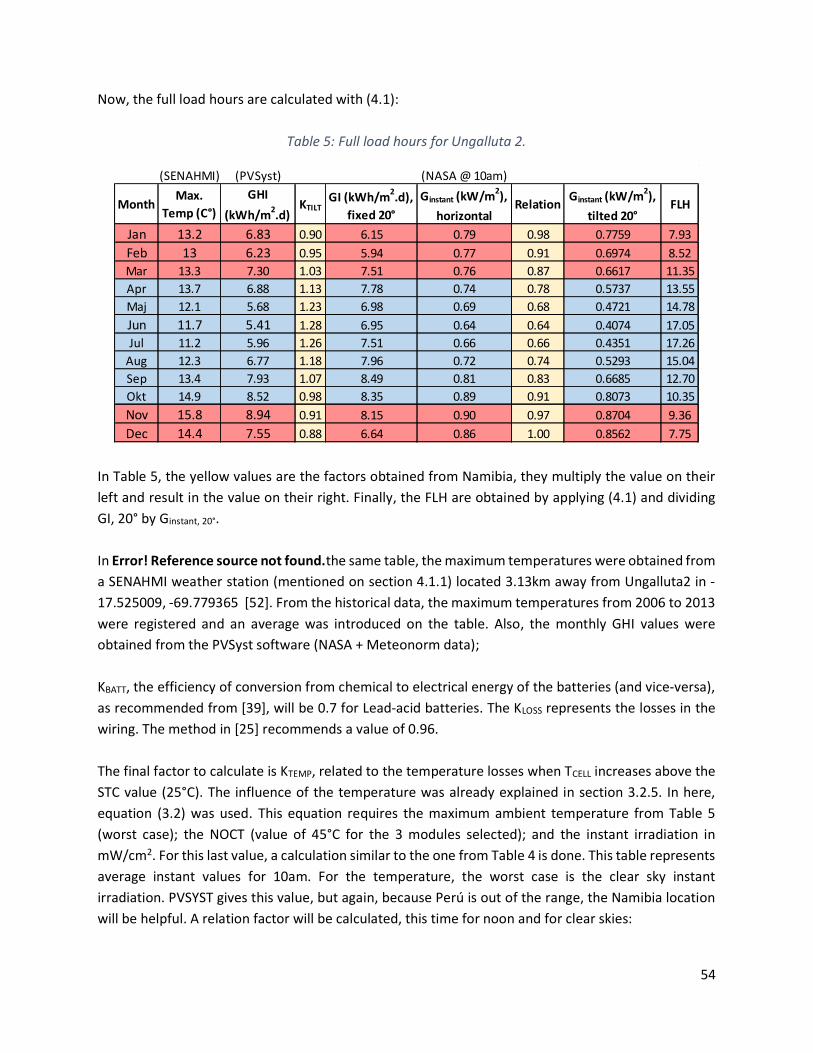
Now, the full load hours are calculated with (4.1):
Table 5: Full load hours for Ungalluta 2.
In Table 5, the yellow values are the factors obtained from Namibia, they multiply the value on their left and result in the value on their right. Finally, the FLH are obtained by applying (4.1) and dividing GI, 20° by Ginstant, 20°. In Error! Reference source not found.the same table, the maximum temperatures were obtained from a SENAHMI weather station (mentioned on section 4.1.1) located 3.13km away from Ungalluta2 in -17.525009, -69.779365 [52]. From the historical data, the maximum temperatures from 2006 to 2013 were registered and an average was introduced on the table. Also, the monthly GHI values were obtained from the PVSyst software (NASA + Meteonorm data); KBATT, the efficiency of conversion from chemical to electrical energy of the batteries (and vice-versa), as recommended from [39], will be 0.7 for Lead-acid batteries. The KLOSS represents the losses in the wiring. The method in [25] recommends a value of 0.96. The final factor to calculate is KTEMP, related to the temperature losses when TCELL increases above the STC value (25°C). The influence of the temperature was already explained in section 3.2.5. In here, equation (3.2) was used. This equation requires the maximum ambient temperature from Table 5 (worst case); the NOCT (value of 45°C for the 3 modules selected); and the instant irradiation in mW/cm2. For this last value, a calculation similar to the one from Table 4 is done. This table represents average instant values for 10am. For the temperature, the worst case is the clear sky instant irradiation. PVSYST gives this value, but again, because Perú is out of the range, the Namibia location will be helpful. A relation factor will be calculated, this time for noon and for clear skies:
(SENAHMI) (PVSyst) (NASA @ 10am)
MonthMax.
Temp (C°)GHI
(kWh/m2.d)KTILT
GI (kWh/m2.d),fixed 20°
Ginstant (kW/m2),horizontal
Relation Ginstant (kW/m2),tilted 20°
FLH
Jan 13.2 6.83 0.90 6.15 0.79 0.98 0.7759 7.93Feb 13 6.23 0.95 5.94 0.77 0.91 0.6974 8.52Mar 13.3 7.30 1.03 7.51 0.76 0.87 0.6617 11.35Apr 13.7 6.88 1.13 7.78 0.74 0.78 0.5737 13.55Maj 12.1 5.68 1.23 6.98 0.69 0.68 0.4721 14.78Jun 11.7 5.41 1.28 6.95 0.64 0.64 0.4074 17.05Jul 11.2 5.96 1.26 7.51 0.66 0.66 0.4351 17.26
Aug 12.3 6.77 1.18 7.96 0.72 0.74 0.5293 15.04Sep 13.4 7.93 1.07 8.49 0.81 0.83 0.6685 12.70Okt 14.9 8.52 0.98 8.35 0.89 0.91 0.8073 10.35Nov 15.8 8.94 0.91 8.15 0.90 0.97 0.8704 9.36Dec 14.4 7.55 0.88 6.64 0.86 1.00 0.8562 7.75
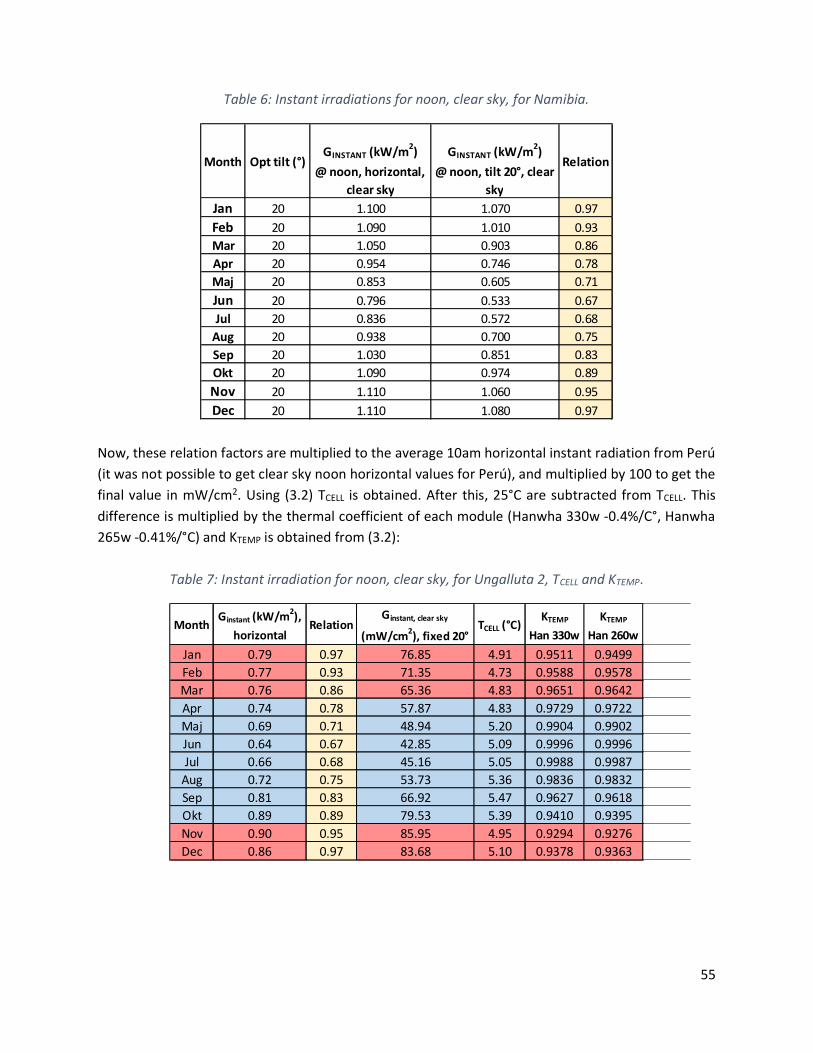
55
Table 6: Instant irradiations for noon, clear sky, for Namibia.
Now, these relation factors are multiplied to the average 10am horizontal instant radiation from Perú (it was not possible to get clear sky noon horizontal values for Perú), and multiplied by 100 to get the final value in mW/cm2. Using (3.2) TCELL is obtained. After this, 25°C are subtracted from TCELL. This difference is multiplied by the thermal coefficient of each module (Hanwha 330w -0.4%/C°, Hanwha 265w -0.41%/°C) and KTEMP is obtained from (3.2):
Table 7: Instant irradiation for noon, clear sky, for Ungalluta 2, TCELL and KTEMP.
Month Opt tilt (°)GINSTANT (kW/m2)
@ noon, horizontal, clear sky
GINSTANT (kW/m2)@ noon, tilt 20°, clear
sky
Relation
Jan 20 1.100 1.070 0.97Feb 20 1.090 1.010 0.93Mar 20 1.050 0.903 0.86Apr 20 0.954 0.746 0.78Maj 20 0.853 0.605 0.71Jun 20 0.796 0.533 0.67Jul 20 0.836 0.572 0.68
Aug 20 0.938 0.700 0.75Sep 20 1.030 0.851 0.83Okt 20 1.090 0.974 0.89Nov 20 1.110 1.060 0.95Dec 20 1.110 1.080 0.97
MonthGinstant (kW/m2),
horizontalRelation
Ginstant, clear sky
(mW/cm2), fixed 20°TCELL (°C)
KTEMP
Han 330wKTEMP
Han 260wJan 0.79 0.97 76.85 4.91 0.9511 0.9499Feb 0.77 0.93 71.35 4.73 0.9588 0.9578Mar 0.76 0.86 65.36 4.83 0.9651 0.9642Apr 0.74 0.78 57.87 4.83 0.9729 0.9722Maj 0.69 0.71 48.94 5.20 0.9904 0.9902Jun 0.64 0.67 42.85 5.09 0.9996 0.9996Jul 0.66 0.68 45.16 5.05 0.9988 0.9987
Aug 0.72 0.75 53.73 5.36 0.9836 0.9832Sep 0.81 0.83 66.92 5.47 0.9627 0.9618Okt 0.89 0.89 79.53 5.39 0.9410 0.9395Nov 0.90 0.95 85.95 4.95 0.9294 0.9276Dec 0.86 0.97 83.68 5.10 0.9378 0.9363
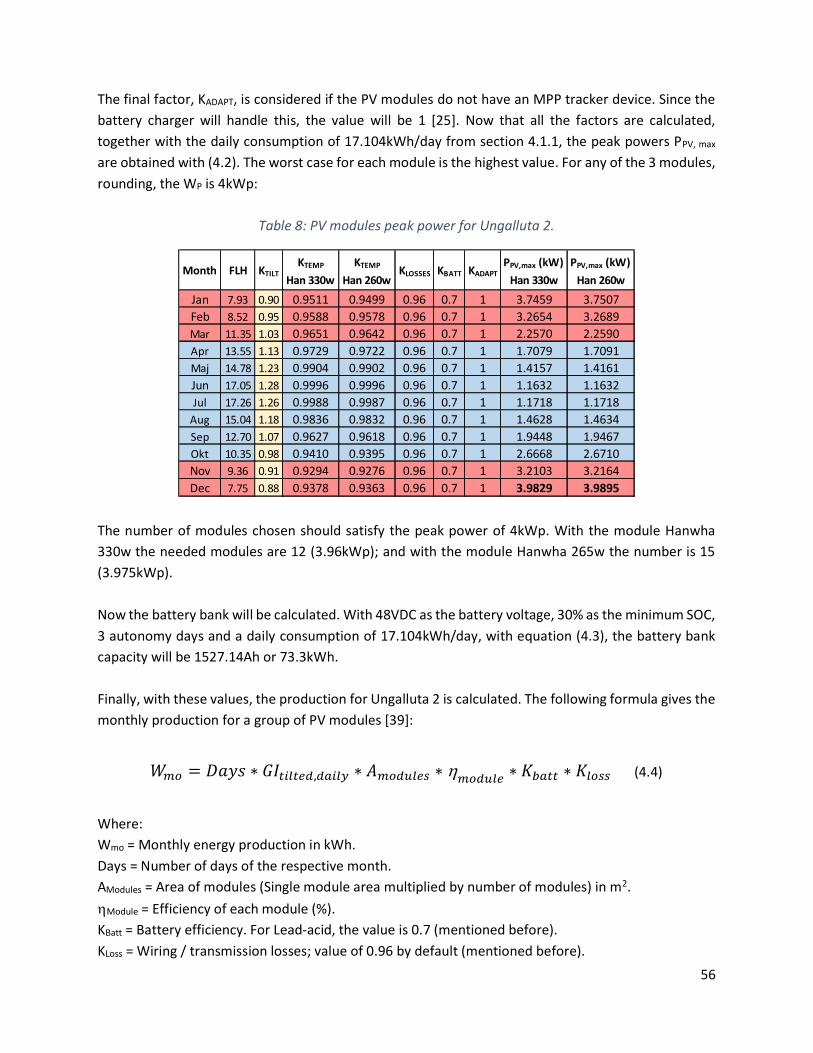
56
The final factor, KADAPT, is considered if the PV modules do not have an MPP tracker device. Since the battery charger will handle this, the value will be 1 [25]. Now that all the factors are calculated, together with the daily consumption of 17.104kWh/day from section 4.1.1, the peak powers PPV, max are obtained with (4.2). The worst case for each module is the highest value. For any of the 3 modules, rounding, the WP is 4kWp:
Table 8: PV modules peak power for Ungalluta 2.
The number of modules chosen should satisfy the peak power of 4kWp. With the module Hanwha 330w the needed modules are 12 (3.96kWp); and with the module Hanwha 265w the number is 15 (3.975kWp). Now the battery bank will be calculated. With 48VDC as the battery voltage, 30% as the minimum SOC, 3 autonomy days and a daily consumption of 17.104kWh/day, with equation (4.3), the battery bank capacity will be 1527.14Ah or 73.3kWh. Finally, with these values, the production for Ungalluta 2 is calculated. The following formula gives the monthly production for a group of PV modules [39]:
= ∗ , ∗ ∗ ∗ ∗ (4.4)
Where: Wmo = Monthly energy production in kWh. Days = Number of days of the respective month. AModules = Area of modules (Single module area multiplied by number of modules) in m2. Module = Efficiency of each module (%). KBatt = Battery efficiency. For Lead-acid, the value is 0.7 (mentioned before). KLoss = Wiring / transmission losses; value of 0.96 by default (mentioned before).
Month FLH KTILTKTEMP
Han 330wKTEMP
Han 260wKLOSSES KBATT KADAPT
PPV,max (kW)Han 330w
PPV,max (kW)Han 260w
Jan 7.93 0.90 0.9511 0.9499 0.96 0.7 1 3.7459 3.7507Feb 8.52 0.95 0.9588 0.9578 0.96 0.7 1 3.2654 3.2689Mar 11.35 1.03 0.9651 0.9642 0.96 0.7 1 2.2570 2.2590Apr 13.55 1.13 0.9729 0.9722 0.96 0.7 1 1.7079 1.7091Maj 14.78 1.23 0.9904 0.9902 0.96 0.7 1 1.4157 1.4161Jun 17.05 1.28 0.9996 0.9996 0.96 0.7 1 1.1632 1.1632Jul 17.26 1.26 0.9988 0.9987 0.96 0.7 1 1.1718 1.1718
Aug 15.04 1.18 0.9836 0.9832 0.96 0.7 1 1.4628 1.4634Sep 12.70 1.07 0.9627 0.9618 0.96 0.7 1 1.9448 1.9467Okt 10.35 0.98 0.9410 0.9395 0.96 0.7 1 2.6668 2.6710Nov 9.36 0.91 0.9294 0.9276 0.96 0.7 1 3.2103 3.2164Dec 7.75 0.88 0.9378 0.9363 0.96 0.7 1 3.9829 3.9895

57
Now, using this last formula, with the areas from Table 2, the monthly production is:
Table 9: Monthly production for Ungalluta 2 for the 3 modules selected.
Next, by knowing the daily, thus the monthly consumption, it will be compared with the corresponding production. If production is higher than demand, the month will be fully satisfied by PV power. If not, the difference in kWh will be needed by the generator. It can be observed that it will only be necessary to use the generator in January and February:
Table 10: Needed fuel power in kWh for Ungalluta 2.
As seen in the table above, it is needed a lower amount of fuel for the module Hanwha 265w. However, it needs 15 units, 3 more than the Hanwha 330w, to produce a similar peak power. With the criteria of choosing the lowest number of modules, to occupy a smaller area, the Hanwha 330w will be the final selection. The datasheet can be found at [83].
Month Days GI (kWh/m2.d),fixed 20°
KBATT KLOSSES nHan330Wmo (kWh),Hanwha 330w
nHan265Wmo (kWh),Hanwha 265w
Jan 31 6.15 0.7 0.96 0.17 504.56 0.16 510.03Feb 28 5.94 0.7 0.96 0.17 438.79 0.16 443.55Mar 31 7.51 0.7 0.96 0.17 617.18 0.16 623.87Apr 30 7.78 0.7 0.96 0.17 617.56 0.16 624.26Maj 31 6.98 0.7 0.96 0.17 573.46 0.16 579.68Jun 30 6.95 0.7 0.96 0.17 550.07 0.16 556.04Jul 31 7.51 0.7 0.96 0.17 616.40 0.16 623.09
Aug 31 7.96 0.7 0.96 0.17 655.72 0.16 662.84Sep 30 8.49 0.7 0.96 0.17 674.01 0.16 681.32Okt 31 8.35 0.7 0.96 0.17 685.35 0.16 692.79Nov 30 8.15 0.7 0.96 0.17 646.23 0.16 653.24Dec 31 6.64 0.7 0.96 0.17 545.35 0.16 551.27
MonthDemand per
month (kWh)Fuel (kWh) needed
for Hanwha 330wFuel (kWh) needed
for Hanwha 265w
Jan 530.22 25.66 20.19Feb 478.91 40.12 35.36Mar 530.22 0.00 0.00Apr 513.12 0.00 0.00Maj 530.22 0.00 0.00Jun 513.12 0.00 0.00Jul 530.22 0.00 0.00
Aug 530.22 0.00 0.00Sep 513.12 0.00 0.00Okt 530.22 0.00 0.00Nov 513.12 0.00 0.00Dec 530.22 0.00 0.00

58
4.3.2 Selection of modules, tilt, and battery capacity for Sweden location (Gåsborn) The procedure is analogous to Perú, but somewhat simpler since tilted irradiation values can be obtained directly from PVGIS. First, the modules are selected from the mentioned stores:
Table 11: List of low cost modules for Gåsborn.
In here, the 2 modules in green were chosen (bypass diodes and lowest cost per Watt). For the calculations, the data was obtained directly from PVGIS and NASA (for temperatures). On the first, on the monthly data tab, the optimum tilt angles were searched for each month. The result was rounded to a multiple of 5 degrees to have easy-to-fix tilts. Also, the monthly maximum temperature values were obtained from the NASA webpage (25-year average). For the GHI, the values were obtained also from PVGIS (monthly tab, tilt 0°). The tilted values were obtained from the same source by selecting the chosen tilt at each month. Their division is KTILT. The instant irradiation at noon was obtained from the daily tab on the same webtool, also for the selected tilt for each month. Finally, the full load hours are calculated with (4.1):
Table 12: Full load hours for Gåsborn.
Store Model Made in Type Wp EUR/Wp Price EUR η (%) Observations Area (m2)Solcellsgrossen Astronergy 310w Germany Poly 310 0.60 184.9 15.80 No bypass diodes 1.94Solcellsgrossen Trina Solar 270w China Poly 270 0.61 163.5 16.50 No bypass diodes 1.64Solcellsgrossen Sunerg 285w Italy Mono 285 0.67 190.7 17.50 Bypass diodes 1.63Solcellsgrossen Trina Solar 275w China Mono 275 0.67 184.0 16.80 No bypass diodes 1.64Solelgrossisten Brukbet 260w Poland Poly 260 0.73 188.5 16.00 No bypass diodes 1.63Solelgrossisten Brukbet 265w Poland Poly 265 0.73 192.8 16.35 No bypass diodes 1.63
Swedensol Astronergy 315w Germany Poly 315 0.75 235.4 16.30 No bypass diodes 1.94Solelgrossisten Jinko Solar 265w China Poly 265 0.75 198.8 16.19 No bypass diodes 1.64
Swedensol Trina Solar Tri270 China Mono 270 0.79 213.8 16.50 No bypass diodes 1.63Electrotec Axitec Axipower 250w Germany Poly 250 0.80 200.5 15.37 Bypass diodes 1.63
(PVGIS) (NASA) (PVGIS) (PVGIS) (PVGIS)
MonthOpt.
Tilt (°)Sel.
Tilt (°)Max.
Temp (C°)GHI
(kWh/m2.d)GI @ Sel. Tilt °
(kWh/m2.d)KTILT
Ginstant (kW/m2),@ noon, Sel. Tilt°
FLH
Jan 74 75 -1.19 0.339 0.844 2.49 0.209 4.04Feb 69 70 -0.23 0.908 1.900 2.09 0.306 6.21Mar 60 60 3.56 2.500 4.210 1.68 0.578 7.28Apr 43 45 8.73 3.840 4.800 1.25 0.589 8.15Maj 28 30 14.9 4.980 5.380 1.08 0.577 9.32Jun 21 20 18.4 5.550 5.770 1.04 0.575 10.03Jul 24 25 20.7 4.870 5.140 1.06 0.531 9.68
Aug 36 35 19.6 3.860 4.460 1.16 0.520 8.58Sep 52 50 14.6 2.560 3.620 1.41 0.481 7.53Okt 64 65 9.18 1.190 2.160 1.82 0.331 6.53Nov 73 75 3.0 0.416 1.000 2.40 0.203 4.93Dec 66 65 -0.3 0.170 0.297 1.75 0.153 1.94
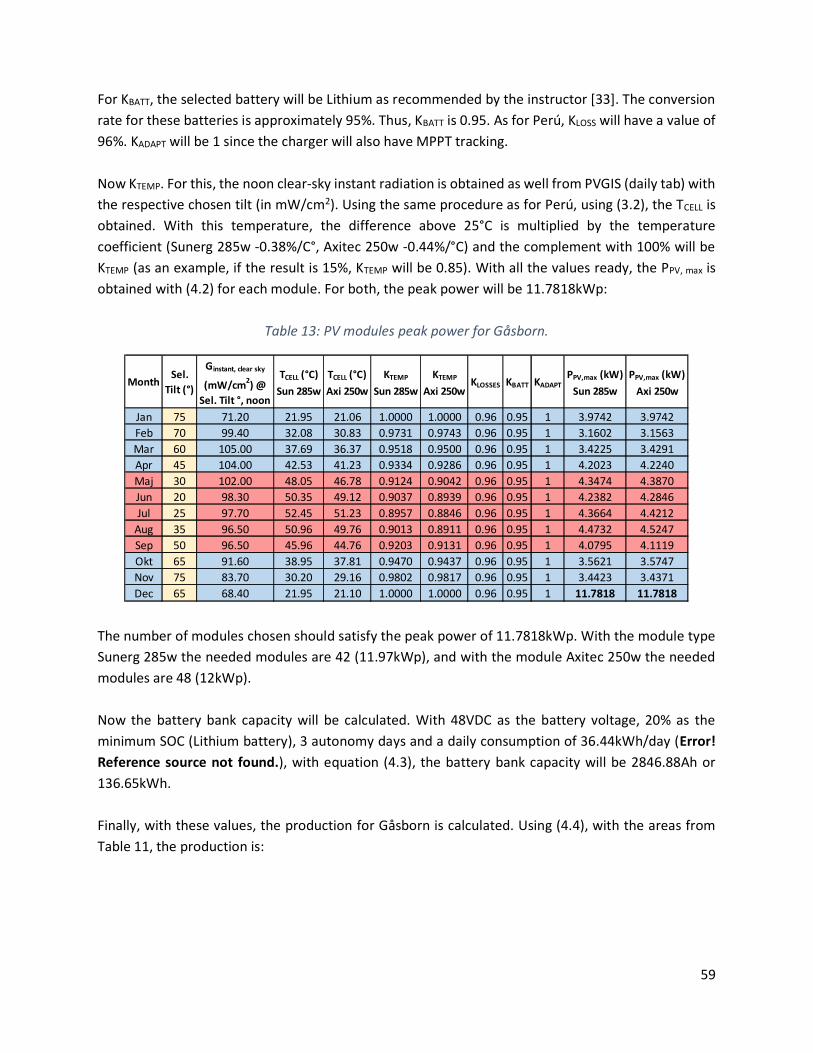
59
For KBATT, the selected battery will be Lithium as recommended by the instructor [33]. The conversion rate for these batteries is approximately 95%. Thus, KBATT is 0.95. As for Perú, KLOSS will have a value of 96%. KADAPT will be 1 since the charger will also have MPPT tracking. Now KTEMP. For this, the noon clear-sky instant radiation is obtained as well from PVGIS (daily tab) with the respective chosen tilt (in mW/cm2). Using the same procedure as for Perú, using (3.2), the TCELL is obtained. With this temperature, the difference above 25°C is multiplied by the temperature coefficient (Sunerg 285w -0.38%/C°, Axitec 250w -0.44%/°C) and the complement with 100% will be KTEMP (as an example, if the result is 15%, KTEMP will be 0.85). With all the values ready, the PPV, max is obtained with (4.2) for each module. For both, the peak power will be 11.7818kWp:
Table 13: PV modules peak power for Gåsborn.
The number of modules chosen should satisfy the peak power of 11.7818kWp. With the module type Sunerg 285w the needed modules are 42 (11.97kWp), and with the module Axitec 250w the needed modules are 48 (12kWp). Now the battery bank capacity will be calculated. With 48VDC as the battery voltage, 20% as the minimum SOC (Lithium battery), 3 autonomy days and a daily consumption of 36.44kWh/day (Error! Reference source not found.), with equation (4.3), the battery bank capacity will be 2846.88Ah or 136.65kWh. Finally, with these values, the production for Gåsborn is calculated. Using (4.4), with the areas from Table 11, the production is:
MonthSel.
Tilt (°)
Ginstant, clear sky
(mW/cm2) @Sel. Tilt °, noon
TCELL (°C)Sun 285w
TCELL (°C)Axi 250w
KTEMP
Sun 285wKTEMP
Axi 250wKLOSSES KBATT KADAPT
PPV,max (kW)Sun 285w
PPV,max (kW)Axi 250w
Jan 75 71.20 21.95 21.06 1.0000 1.0000 0.96 0.95 1 3.9742 3.9742Feb 70 99.40 32.08 30.83 0.9731 0.9743 0.96 0.95 1 3.1602 3.1563Mar 60 105.00 37.69 36.37 0.9518 0.9500 0.96 0.95 1 3.4225 3.4291Apr 45 104.00 42.53 41.23 0.9334 0.9286 0.96 0.95 1 4.2023 4.2240Maj 30 102.00 48.05 46.78 0.9124 0.9042 0.96 0.95 1 4.3474 4.3870Jun 20 98.30 50.35 49.12 0.9037 0.8939 0.96 0.95 1 4.2382 4.2846Jul 25 97.70 52.45 51.23 0.8957 0.8846 0.96 0.95 1 4.3664 4.4212
Aug 35 96.50 50.96 49.76 0.9013 0.8911 0.96 0.95 1 4.4732 4.5247Sep 50 96.50 45.96 44.76 0.9203 0.9131 0.96 0.95 1 4.0795 4.1119Okt 65 91.60 38.95 37.81 0.9470 0.9437 0.96 0.95 1 3.5621 3.5747Nov 75 83.70 30.20 29.16 0.9802 0.9817 0.96 0.95 1 3.4423 3.4371Dec 65 68.40 21.95 21.10 1.0000 1.0000 0.96 0.95 1 11.7818 11.7818

60
Table 14: Monthly production for Gåsborn.
Finally, like the procedure for Perú: the fuel needed per month:
Table 15: Fuel needed for Gåsborn.
As seen, with both modules, the production and fuel needed are practically the same. However only 42 units are needed for Sunerg, compared to 48 for Axitec. Because of this, the Sunerg will be the final choice. The datasheet can be found at [84].
Month DaysSel.
Tilt (°)GI @ Sel. Tilt °
(kWh/m2.d)KBATT KLOSSES nSun285
Wmo (kWh),Sun 285w
nAxi250Wmo (kWh),
Axi 250w
Jan 31 75 0.844 0.95 0.96 0.175 288.88 0.1537 289.97Feb 28 70 1.900 0.95 0.96 0.175 587.39 0.1537 589.60Mar 31 60 4.210 0.95 0.96 0.175 1437.57 0.1537 1442.97Apr 30 45 4.800 0.95 0.96 0.175 1589.94 0.1537 1595.91Maj 31 30 5.380 0.95 0.96 0.175 1841.46 0.1537 1848.37Jun 30 20 5.770 0.95 0.96 0.175 1911.24 0.1537 1918.41Jul 31 25 5.140 0.95 0.96 0.175 1759.31 0.1537 1765.92
Aug 31 35 4.460 0.95 0.96 0.175 1526.56 0.1537 1532.29Sep 30 50 3.620 0.95 0.96 0.175 1199.08 0.1537 1203.58Okt 31 65 2.160 0.95 0.96 0.175 739.32 0.1537 742.10Nov 30 75 1.000 0.95 0.96 0.175 331.24 0.1537 332.48Dec 31 65 0.297 0.95 0.96 0.175 101.66 0.1537 102.04
MonthDemand per
month (kWh)Fuel (kWh) needed
for Sunerg 285wFuel (kWh) needed
for Axi 250w
Jan 1129.64 840.76 839.67Feb 1020.32 432.93 430.72Mar 1129.64 0.00 0.00Apr 1093.20 0.00 0.00Maj 1129.64 0.00 0.00Jun 1093.20 0.00 0.00Jul 1129.64 0.00 0.00
Aug 1129.64 0.00 0.00Sep 1093.20 0.00 0.00Okt 1129.64 390.32 387.54Nov 1093.20 761.96 760.72Dec 1129.64 1027.98 1027.60

61
4.4 Design of inverter, charger, and battery type The calculations for Sweden and Perú were done in an excel sheet, where the module properties, number of modules desired and load are entered and the result shows automatically which months need generator backup. As extra information, to have full autonomy for the Ungalluta 2 design (12 months covered), for the Hanwha 330w it is needed 14 modules (4.5kWp); and for Gåsborn, since the radiation is quite low during winter, the modules needed for full autonomy with the Sunerg 285w are 467 (133kWp). From [26], there is an indicator which tells when a generator is recommended to save costs in an off-grid system. It is called the Hybrid Indicator:
Figure 49: Hybrid indicator [26].
In this graph, the daily load needs to be compared with the Array-to-load Ratio, which is the division between the peak power of the modules for full autonomy by the daily demand. For Perú, the ratio is 0.26 with a demand of 17kWh/day: It can be observed that the intersection is inside the hybrid area, but close from the limit (it is just needed a couple more modules from the original FLH design to get full autonomy). For Sweden, the ratio is 3.65 with a demand of 36.4kWh/day: for this case, since the radiation is quite low, the intersection is deep inside the hybrid area, and the use of a generator is strongly recommended (around 450 extra modules from the FLH design to get full autonomy). 4.4.1 Selection of inverter, batteries, charger for Perú location (Ungalluta 2)
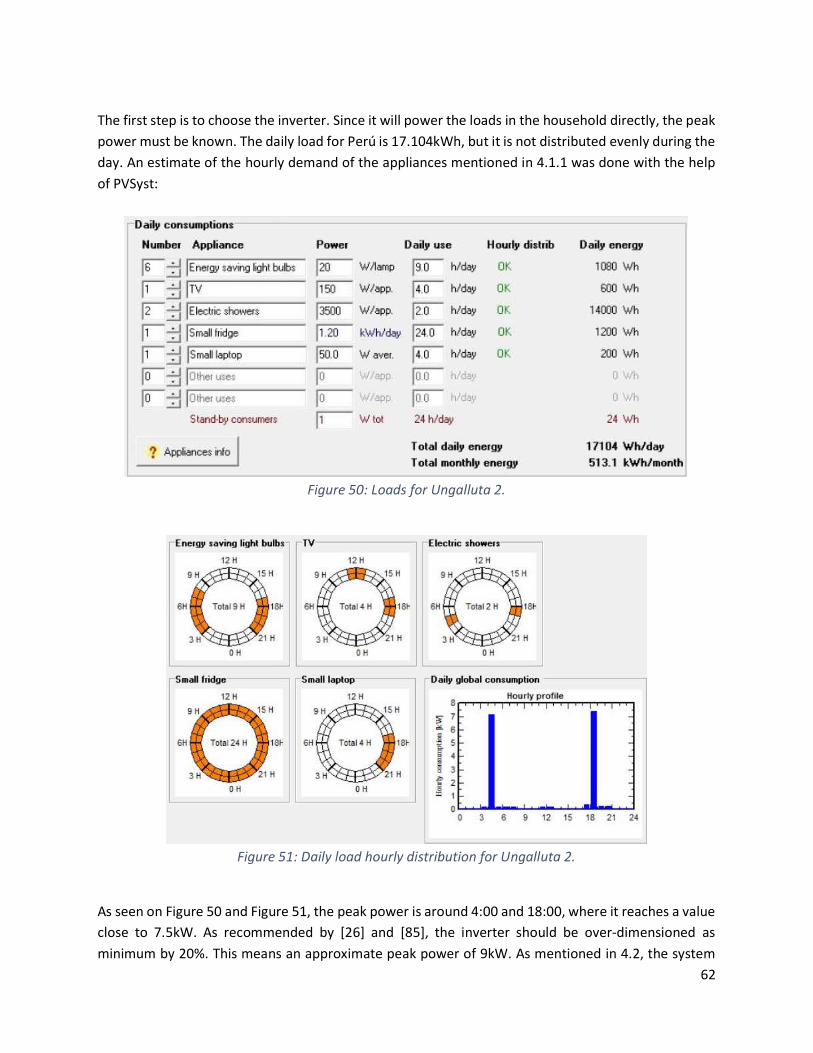
62
The first step is to choose the inverter. Since it will power the loads in the household directly, the peak power must be known. The daily load for Perú is 17.104kWh, but it is not distributed evenly during the day. An estimate of the hourly demand of the appliances mentioned in 4.1.1 was done with the help of PVSyst:
Figure 50: Loads for Ungalluta 2.
Figure 51: Daily load hourly distribution for Ungalluta 2.
As seen on Figure 50 and Figure 51, the peak power is around 4:00 and 18:00, where it reaches a value close to 7.5kW. As recommended by [26] and [85], the inverter should be over-dimensioned as minimum by 20%. This means an approximate peak power of 9kW. As mentioned in 4.2, the system

63
(DC section) will be 48VDC. Based on these parameters (48VDC input, 9kW output @ 220-240VAC, voltage of Perú grid), the selection on the mentioned online stores was made, without including shipping yet, and considering the lowest price:
Table 16: Suitable AC inverters for Ungalluta 2.
As seen on Table 16, the three configurations correspond to true-sine inverter-chargers as mentioned in Figure 46, which are common for off-grid systems. These chargers are the ones shown in the second type of configuration on Figure 46, and they show the lowest prices, so this configuration will be used. The first model in the top consists in two parallel-connected 4kW inverter-chargers. To stack them, 3 extra items are needed. The safe margin over the 7.5kW of peak load is just 7%. In the central model, only one 8kW inverter-charger is selected. The safe margin is also low, 7%. The bottom model in green consists in two parallel-connected 4.4kW inverter-chargers plus extra items for the parallel connection. The safe margin is 17%, close to the recommended of 20% above the load peak power. This model will be selected. It also has a THD of less than 5% and is of a true sine wave type. In the list, it is also included a generator auto-starter for when the battery level is low. The datasheets can be found in [86] [87] [88] [89] [90]. Next comes the battery selection. The batteries selected were all VRLA type, Valve Regulated Lead-acid, which have a low discharge characteristic (thick plates) and are commonly used for PV systems. The AGM, Absorber Glass Matt and the Gel types are the two subtypes. Both are sealed and require no maintenance. The following list comes from the Peruvian online stores mentioned:
Store Model Qty. Made in In-Out Price EUR η (%) ObservationsWeboSolar Outback GS4048A Inverter/Chg (4kW) 2 USA 48VDC-240VAC 5101.5 95% 2 stackedWeboSolar Outback MATE3 Display 1 USA NA 388.9 NA Needed to stackWeboSolar Outback HUB-4 Hub 1 USA NA 137.1 NA Needed to stackWeboSolar Outback RTS Temp. Sensor 1 USA NA 0.0 NA Included
TOTAL7%
Store Model Qty. Made in In-Out Price EUR η (%) ObservationsWeboSolar Outback GS8048A Inverter/Chg (8kW) 1 USA 48VDC-240VAC 3826.1 95% Only one neededWeboSolar Outback RTS Temp. Sensor 1 USA NA 0.0 NA Included
TOTAL7%
Model Qty. Made in In-Out Price EUR η (%) ObservationsWeboSolar Magnum MS4448PAE Inverter/Chg (4.4kW) 2 USA 48VDC-240VAC 3843.4 94% 2 stackedWeboSolar Magnum ME-RTR Router 1 USA NA 284.1 NA Needed to stackWeboSolar Magnum ME-AGS-S Gen. starter 1 USA NA 234.2 NA Gen. auto startWeboSolar Magnum BTS Temp. sensor 1 USA NA 0.0 NA Included
TOTAL17%
4361.7Extra power over max. demand:
Extra power over max. demand:5627.5
3826.1Extra power over max. demand:

64
Table 17: Lowest priced batteries for Ungalluta 2.
The list on Table 17 contains the 6 lowest EUR-per-Ah priced batteries. From these, based on the capacity of 1527.14Ah calculated on 4.3.1, together with the requirement of a 48VDC battery bank, the arrangement of parallel and series batteries is made. The resulting Ah, and total batteries needed are shown. The results with an excessive number of batteries is discarded. The final decision is the Ritar RA12-100 battery, with a 4.8% extra capacity and the lowest total price. The bank will consist on 16 strings of 4 batteries in series, creating a total capacity of 1600Ah and 48VDC. The datasheet can be found in [91]. The next step is the battery charger selection. For this, some theory needs to be reviewed. The battery charger has 3 important parameters: The Maximum battery charge current, the MPPT / battery operating voltage rate and the Maximum open circuit voltage. For the first parameter, the designed peak power of the modules must be known [92] [93]:
. > ,
.∗ 1.2 (4.5)
This equation consists on calculating the Suitable Charge current and adding a safety factor of 20% as recommended by the US National Energy Commission [92]. The battery voltage is 48VDC for the current design, and the PMAX is 4kWp, as calculated in 4.3.1 for Ungalluta 2. The maximum charging current of the charger must be higher than this value. The second parameter will be shown as a DC voltage range in the datasheet [92] [93]:
, , . > , ∗ , > , , . (4.6)
This equation indicates that the VMPP of each module, multiplied by the number of modules in series/string, must be inside the range of the operating voltage range of the charger. As an example, if the VMPP of a module is 10VDC and the array consists on strings of 3 modules, then the value will be 3 times 10, resulting in 30VDC, which must be inside the range of the operating voltage of the charger.
Model V Cap. (Ah) EUR/Ah Price EUR Observations Series Parallel Total bats. Total Ah Diff Total EURRitar RA12-100 12 100 1,4 143,1 AGM, 12yr. useful life 4 16 64 1600 4,8% 9158,4
Sunbright 6-FM-20 12 20 1,6 31,2 AGM, 1200 cycles @ 30% DOD 4 77 308 1540 0,8% 9594,2Ritar RT1270 12 7 1,7 11,6 AGM, 12yr. useful life 4 219 876 1533 0,4% 10170,4
Ritar RA12-65 12 65 1,7 111,5 AGM, 12yr. useful life 4 24 96 1560 2,2% 10705,0Ritar RA12-55 12 55 1,8 99,6 AGM, 12yr. useful life 4 28 112 1540 0,8% 11158,6
Sunbright 6-GFM(G)-100 12 100 1,8 178,0 Gel, 2400 cycles @ 30% DOD 4 16 64 1600 4,8% 11392,0

65
The final parameter is especially important for locations with low temperatures, because since it was seen in 3.2.3, the VOC of a module increases when the temperature decreases below of SOC. For this, the historical lowest temperature must be known for the location:
(25° − , ) ∗ . (4.7)
This result is the percentage of increment of the Open Circuit Voltage. The coefficient is obtained from the module datasheet. The result needs to be added to the VOC,25°C to have the new value of VOC at the extreme low temperature [92] [93]:
, . ∗ , < . , (4.8)
As with (4.6), if more than one module is connected on a string, this value needs to be multiplied by the number of modules and be inside the limit. From the available models in the online store, 3 configurations were the most economical:
Table 18: Battery charger for Ungalluta 2
The bottom, green highlighted option only requires one charger of 100A, the Magnum PT100. The other option can handle less current, and thus needs to be stacked, and needs additional components to work in parallel. The datasheet of the selected model can be found in [89] [94] [95]. By using (4.5), (4.6), (4.7) and (4.8), and for a design peak power of PVMAX = 3.96kWp for the module selected Hanwha 330w, the parameters for the charger are the following:
- Nominal battery voltage = 48VDC.
- Suitable charge current + 20% = 99A. It is, with the safety factor included, lower than the 100A of the charger.
Store Model Qty. Made in Imax Voc max Vmpp Price EUR ObservationsWeboSolar Morningstar TS-MPPT-30 3 USA 30A 150VDC 8-72VDC 1019.9 3 stackedWeboSolar Morningstar Meterhub HUB-1 1 USA NA NA NA 88.1 Needed to stackWeboSolar Morningstar Tristar Meter TS-M-2 1 USA NA NA NA 89.0 Needed to stack
TOTAL 1197.1
Store Model Qty. Made in Imax Voc max Vmpp Price EUR ObservationsWeboSolar Magnum PT-100 MPPT Charger 1 USA 100A 240VDC 10-66VDC 988.8 Only one neededWeboSolar Magnum BTS Temp. sensor 1 USA NA NA NA 0.0 Included
TOTAL 988.8

66
- Operating MPP voltage = 37.02VDC for the module. If chosen, it can’t be in more than 1 unit per string (two of them would make 74.04VDC, outside of the range of the inverter).
- Open circuit voltage, lowest temperature = 51.63VDC for the module (historical Ungalluta minimum temperature is -12.6°C measured from 2006 to 2013 in near SENAHMI weather station [52]). Only two modules per string would be allowed to be below the 150VDC limit; however, the MPP voltage already limits it for one single module per string.
After this, the only arrangement option is 12 modules, all in parallel, creating a peak of 3.96kWp as designed [96]. The final step is to select a proper backup generator. It will charge the batteries and power the AC loads in case of excess power, as mentioned in the specifications of the selected inverter-charger. The peak load for Ungalluta 2 will be 7.5kW as calculated on 4.1.1. The generator will be purchased locally as mentioned, and must have a 220VAC, 60Hz output:
Table 19: Generator for Ungalluta 2.
The only two generators that could be found from an online Peruvian store are shown on Table 19. The Daewoo generator is chosen because it has a rated power equal to the peak load demand. The generator information can be found at [97] 4.4.2 Selection of inverter, batteries, charger for Sweden location (Gåsborn) The similar steps as for Perú are taken. First, the inverter is chosen. The peak power, with the help of PVSyst, will be 6.5kWh. The load is distributed during the day to reach the daily consumption calculated on 4.1.2 of 36.44kWh. Each load individual power is taken from [98]:
Store Model Fuel Pnom Price EUR Fuel cons. Fuel cons.Sodimac Daewoo GDA8000E Genset Gasoline 90 Oct 7500W 1214.7 0.69gal/h 2.60L/hSodimac Yamaha EF7200DE Genset Gasoline 90 Oct 7200W 1620.0 0.86gal/h 3.25L/h
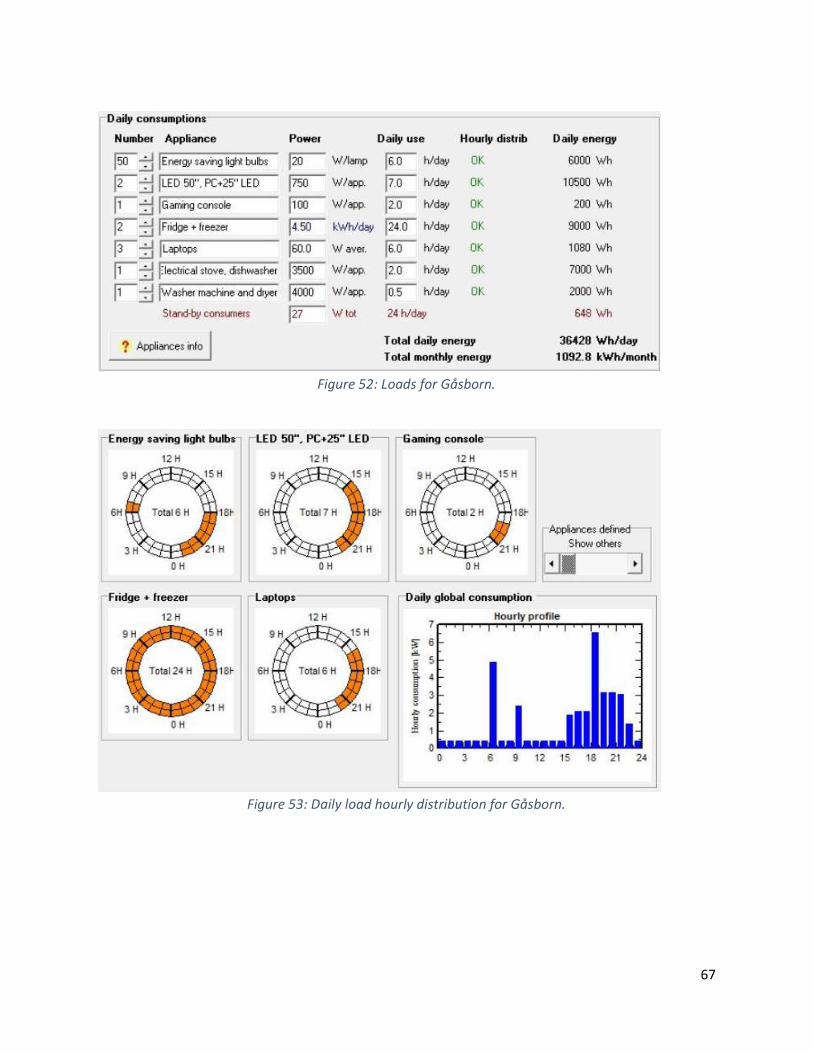
67
Figure 52: Loads for Gåsborn.
Figure 53: Daily load hourly distribution for Gåsborn.

68
Figure 54: Daily load hourly distribution for Gåsborn.
As for Perú, the recommended 20% safe load is taken. This means the inverter will have to be rated for 7.8kW at least. The battery system will also be 48VDC. Based on these parameters, the lowest cost inverters are:
Table 20: Suitable inverters for Gåsborn.
Store Model Qty. Made in In-Out Price EUR η (%) Observations48VDC-230VAC 4589.8 95%
TOTAL11%
Store Model Qty. Made in In-Out Price EUR η (%) Observations48VDC-230VAC 4815.2 95%
TOTAL23%
Store Model Qty. Made in In-Out Price EUR η (%) Observations
SMA Sunny Remote Control 1 Germany NA 274.0 NA NeededTOTAL
2%
Store Model Qty. Made in In-Out Price EUR η (%) Observations
SMA Sunny Remote Control 1 Germany NA 274.0 NA NeededTOTAL
42%
Solelgrossisten
Solelgrossisten
Europe Solarshop
Europe Solarshop
2 stacked, doesn’t show THD, not for
Lithium
3 stacked, doesn’t show THD, not for
Lithium
2 Germany 48VDC-230VAC 95% 2 stacked5388.0
2 stackedSMA Sunny Island inverter-charger 4.4M (3300W@25°C)
5026.0Extra power over max. demand:
2 96%4752.048VDC-230VACGermany
Victron Phoenix inverter 48/5000 (4000W@25°C)
Victron Phoenix inverter 48/3000 (2400W@25°C)
SMA Sunny Island inverter-charger 6.0H-11 (4600W@25°C)
5662.0Extra power over max. demand:
Netherlands2
3
4815.2Extra power over max. demand:
4589.8Extra power over max. demand:
Netherlands

69
From the table, the first and third inverter set are discarded because their safe margin does not reach the 20%. From the other two, the Victron 48/5000 inverter does not have a charging feature, and doesn’t show its THD. It is just an inverter. This would involve purchasing an additional battery charger (configuration from Figure 45). From all the available online stores, a suitable battery charger for Lithium batteries could not be found. Lithium batteries usually have an electronic module that needs to communicate with its respective charger. They are not so simple to charge as the ones with Lead. This means that the only configuration available is the one from Figure 47. Hence, the Sunny Island 6.0H inverter-charger shown in green is chosen (2 stacked in parallel). It has a THD of less than 4%, and it is a true sine wave type. A remote display is also included to easily configure it. The datasheets can be found at [99] [100]. The next step is the battery selection. As mentioned, for Gåsborn, the batteries will be of Lithium to have a good conversion efficiency. The following table are the available batteries from the online stores:
Table 21: Lithium batteries for Gåsborn.
From the table, the LG batteries are discarded since they can only be configured for maximum 2 in parallel, together with the Mercedes batteries that also have a limit of 20kWh (8 batteries in parallel). From the remaining, the Pylontech batteries are the most economical, and, after confirming with the online store, they can be stacked limitlessly. Their charging voltage is 52.5-54VDC, and 57 of the Pylontech batteries will be needed. The BMS feature means the batteries carry control electronics (Battery Management System) in charge of monitoring the charge and status of each module. They have RS485 interface, which can be connected to the inverter for better monitoring. The Sunny Island inverter chosen also has this interface. The datasheet of the batteries can be found at [101] [102]. The price includes a discount, which was asked by mail, and the quotation can be found in Figure C1, on Appendix C. The next step for the chosen configuration is the module inverter. Like for Perú, the parameters must be checked to decide the compatibility with the modules. Since it will replace the battery charger, equation (4.5) will not be used (the inverters do not have a charging feature). Instead, the following equation will replace it:
= ,
, , (4.9)
Store Model VCapacity
(Ah)EUR/Ah
EUR each
Observations Series ParallelTotal bats.
Total Ah
Diff Total EUR
Europe Solarshop LG Chem RESU10 48 189 26.4 4982.8 Lithium, BMS, 2 max 1 16 16 3024 6.2% 79724.8Europe Solarshop LG Chem RESU6.5 48 126 30.2 3808.1 Lithium, BMS, 2 max 1 23 23 2898 1.8% 87586.8
WattUneed Pylontech US2000B 48 50 22.5 1123.2 Lithium, BMS, stacking 1 57 57 2850 0.1% 64019.7WattUneed Mercedes Home 2.5kWh x8 48 416.67 31.1 12944.4 Lithium, BMS, 8 max 1 7 7 2917 2.5% 90610.9
Europe Solarshop LG Chem RESU3.3 48 63 41.6 2619.0 Lithium, BMS, 2 max 1 46 46 2898 1.8% 120474.0Europe Solarshop Sony Fortelion Life PO4 48 192 54.5 10473.0 Lithium, BMS 1 15 15 2880 1.2% 157095.0

70
This equation means that the number of inverters needed will be the division of the calculated modules peak power by the inverter maximum input power. Equations (4.6), (4.7) and (4.8) will also be used to select the inverter. From the available inverters in the stores, the SMA were chosen since they will be able to interconnect with the Sunny Island Inverter-charger chosen via a data cable. The list is:
Table 22: Module inverters for Gåsborn.
The modules shown are the ones with the lowest price. From them, The SMA Sunnyboy 4.0 and 4000TL are the cheapest. Since the 4.0 is the newest version, it will be chosen. The modules just need a data cable to parallel their outputs to the same AC line that will power the Sunny Island Inverter-charger. The calculation of the string limits is done the following way:
- By using (4.9), with a peak power for Gåsborn of 11.97kWp, 3 inverters are needed.
- Their MPP range is 140-500V, and their voltage limit is 600V. The chosen module, the Sunerg 285w, has a VMPP of 32.52V per module; and, for the lowest registered temperature in Gåsborn, which is -7°C (NASA webpage, [36]), the highest VOC is 43.43V per module.
- Within these limits, the maximum modules per string can be 5 to 13 for the Sunny Island 4.0 inverter. From this range, an appropriate number of modules per string, and total number of string need to be calculated, to reach the 42 modules obtained on 4.3.2. The combinations available are 6 strings of 7, or 7 strings of 6 modules.
- For the 6x7 configuration, 7 strings need to be shared on the 3 calculated inverters. It is not symmetrical. However, for the 7x6 configuration, 6 strings need to be shared on the 3 inverters. By placing 2 strings per inverter, the circuit is symmetrical.
By the calculations shown, the final arrangement of modules will be 2 strings of 7 in series for each Sunnyboy 4.0 [96]. The datasheets of the inverter can be found at [103]. The final step is the selection of the generator. It will be rated 220VAC, 50Hz, and it will be connected directly to the Sunny Island inverter-charger, just like the design for Perú. They must be chosen for the
Europe Solarshop SMA Sunnyboy 4.0 1129 3 3387 140-500V 600V 5 to 13 6x7, 7x6 7x2 eachEurope Solarshop SMA Sunnyboy 4000TL 1140 3 3420 175-500V 750V 6 to 15 14x3, 6x7, 7x6 14x1 each, 7x2 eachEurope Solarshop SMA Sunnyboy 3.0 899 4 3596 110-500V 600V 4 to 13 6x7, 7x6 Not symmetricalEurope Solarshop SMA Sunnyboy 3.6 959 4 3836 130-500V 600V 4 to 13 6x7, 7x6 Not symmetricalEurope Solarshop SMA Sunnyboy 2.5 774 5 3870 260-500V 600V 8 to 13 7x6 Not symmetricalEurope Solarshop SMA Sunnyboy 5.0 1299 3 3897 175-500V 600V 6 to 13 6x7, 7x6 7x2 eachEurope Solarshop SMA Sunnyboy 5000TL 1350 3 4050 175-500V 750V 6 to 15 14x3, 6x7, 7x6 14x1 each, 7x2 each
String limits
Possible module combinations (series x parallel)
Module strings per inverter
Store Inverter Vin limit
Inverter MPP range
Brand Model Price EUR
Qty. for Wp
Total EUR
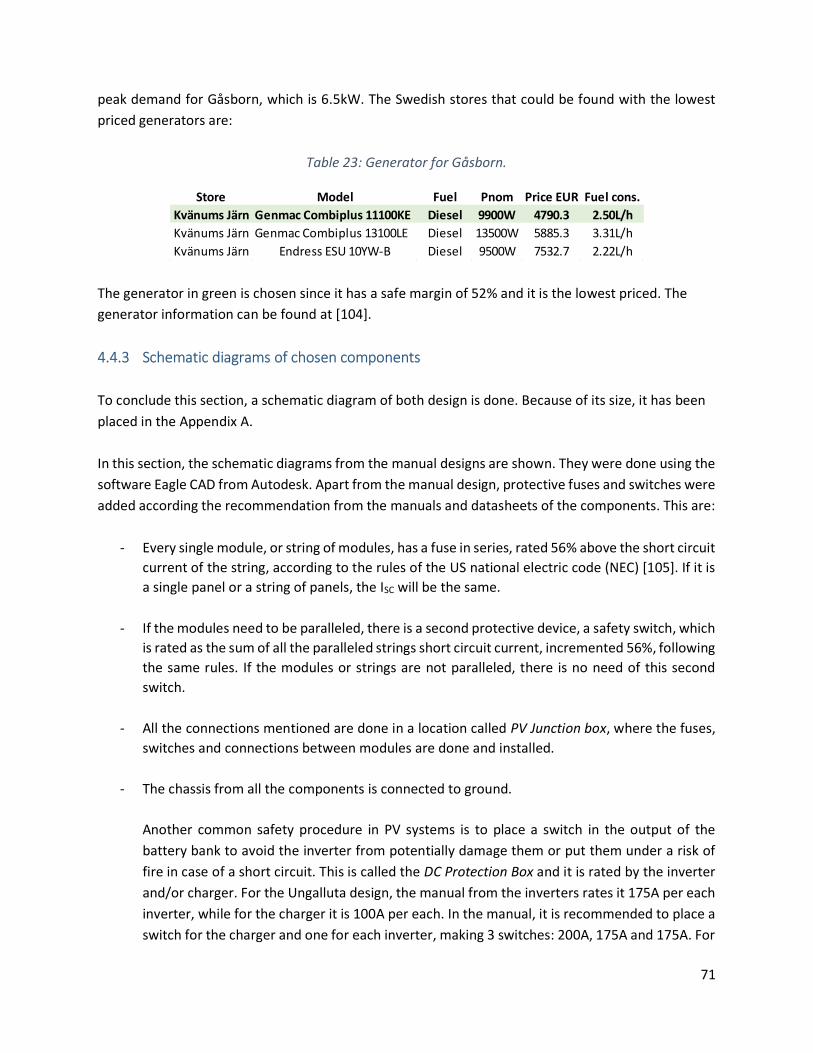
71
peak demand for Gåsborn, which is 6.5kW. The Swedish stores that could be found with the lowest priced generators are:
Table 23: Generator for Gåsborn.
The generator in green is chosen since it has a safe margin of 52% and it is the lowest priced. The generator information can be found at [104]. 4.4.3 Schematic diagrams of chosen components To conclude this section, a schematic diagram of both design is done. Because of its size, it has been placed in the Appendix A. In this section, the schematic diagrams from the manual designs are shown. They were done using the software Eagle CAD from Autodesk. Apart from the manual design, protective fuses and switches were added according the recommendation from the manuals and datasheets of the components. This are:
- Every single module, or string of modules, has a fuse in series, rated 56% above the short circuit current of the string, according to the rules of the US national electric code (NEC) [105]. If it is a single panel or a string of panels, the ISC will be the same.
- If the modules need to be paralleled, there is a second protective device, a safety switch, which is rated as the sum of all the paralleled strings short circuit current, incremented 56%, following the same rules. If the modules or strings are not paralleled, there is no need of this second switch.
- All the connections mentioned are done in a location called PV Junction box, where the fuses, switches and connections between modules are done and installed.
- The chassis from all the components is connected to ground. Another common safety procedure in PV systems is to place a switch in the output of the battery bank to avoid the inverter from potentially damage them or put them under a risk of fire in case of a short circuit. This is called the DC Protection Box and it is rated by the inverter and/or charger. For the Ungalluta design, the manual from the inverters rates it 175A per each inverter, while for the charger it is 100A per each. In the manual, it is recommended to place a switch for the charger and one for each inverter, making 3 switches: 200A, 175A and 175A. For
Store Model Fuel Pnom Price EUR Fuel cons.Kvänums Järn Genmac Combiplus 11100KE Diesel 9900W 4790.3 2.50L/hKvänums Järn Genmac Combiplus 13100LE Diesel 13500W 5885.3 3.31L/hKvänums Järn Endress ESU 10YW-B Diesel 9500W 7532.7 2.22L/h
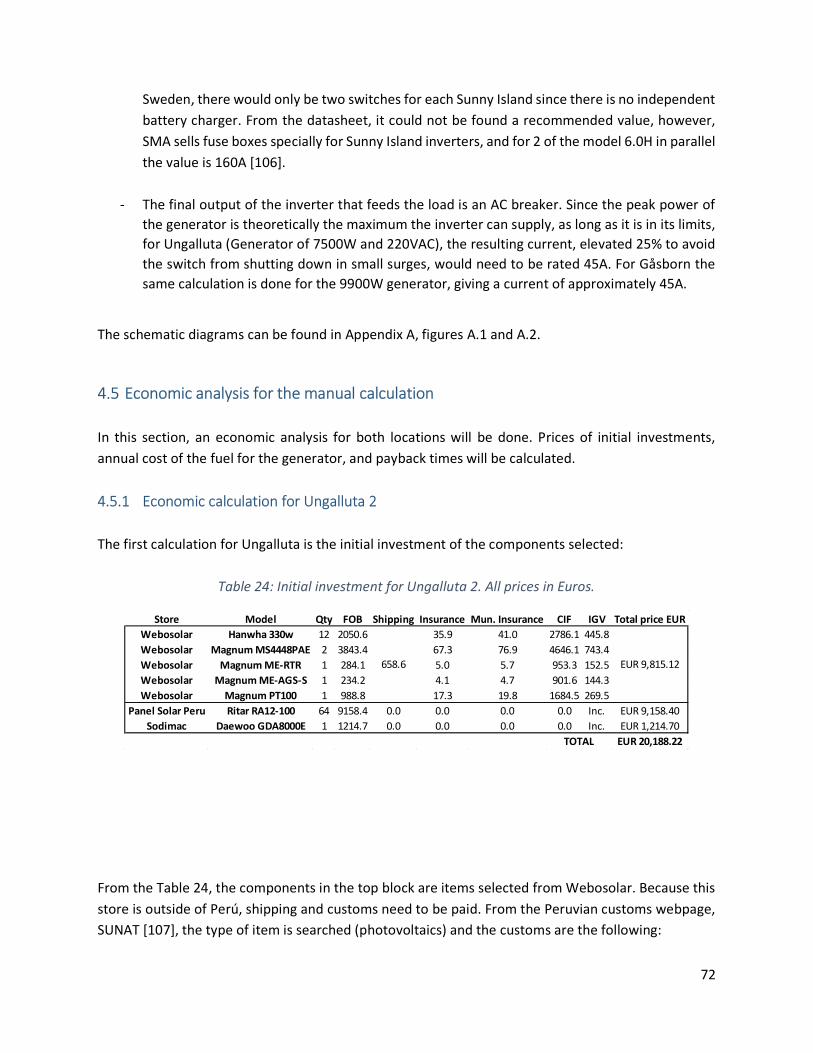
72
Sweden, there would only be two switches for each Sunny Island since there is no independent battery charger. From the datasheet, it could not be found a recommended value, however, SMA sells fuse boxes specially for Sunny Island inverters, and for 2 of the model 6.0H in parallel the value is 160A [106].
- The final output of the inverter that feeds the load is an AC breaker. Since the peak power of the generator is theoretically the maximum the inverter can supply, as long as it is in its limits, for Ungalluta (Generator of 7500W and 220VAC), the resulting current, elevated 25% to avoid the switch from shutting down in small surges, would need to be rated 45A. For Gåsborn the same calculation is done for the 9900W generator, giving a current of approximately 45A.
The schematic diagrams can be found in Appendix A, figures A.1 and A.2.
4.5 Economic analysis for the manual calculation In this section, an economic analysis for both locations will be done. Prices of initial investments, annual cost of the fuel for the generator, and payback times will be calculated. 4.5.1 Economic calculation for Ungalluta 2 The first calculation for Ungalluta is the initial investment of the components selected:
Table 24: Initial investment for Ungalluta 2. All prices in Euros.
From the Table 24, the components in the top block are items selected from Webosolar. Because this store is outside of Perú, shipping and customs need to be paid. From the Peruvian customs webpage, SUNAT [107], the type of item is searched (photovoltaics) and the customs are the following:
Store Model Qty FOB Shipping Insurance Mun. Insurance CIF IGV Total price EURWebosolar Hanwha 330w 12 2050.6 35.9 41.0 2786.1 445.8Webosolar Magnum MS4448PAE 2 3843.4 67.3 76.9 4646.1 743.4Webosolar Magnum ME-RTR 1 284.1 5.0 5.7 953.3 152.5Webosolar Magnum ME-AGS-S 1 234.2 4.1 4.7 901.6 144.3Webosolar Magnum PT100 1 988.8 17.3 19.8 1684.5 269.5
Panel Solar Peru Ritar RA12-100 64 9158.4 0.0 0.0 0.0 0.0 Inc. EUR 9,158.40Sodimac Daewoo GDA8000E 1 1214.7 0.0 0.0 0.0 0.0 Inc. EUR 1,214.70
EUR 20,188.22
658.6 EUR 9,815.12
TOTAL

73
Table 25: Customs fees for PV related items.
From the table, the fees were applied the following way:
- The FOB is the price of the item without including shipping - The Promoción Municipal fee of 2% and the Seguro fee of 1.75% are applied from the FOB
amount. - The CIF is the sum of the fees mentioned above, plus the shipping, plus the FOB. - The total taxes, Impuesto General a las Ventas or IGV, is the 16% of the CIF. - The final payment is the item price (FOB), plus the shipping, plus the IGV.
The calculation formulas were taken from the SUNAT customs webpage [108] and from [109]. For the second block, the items are bought nationally, so there are no custom fees. The final price includes the IGV or sales taxes. The next step is to calculate the price of the fuel for the generator. From 4.4.1, the consumption of the generator is known: 0.69gal/h or 2.6L/h. The fuel it consumes is gasoline 90 octanes. Fuels are sold in Perú in American gallons, and the prices for the Tacna region (where Ungalluta 2 is located) have been taken from the OSINERGMIN webpage, which has a search tool of fuels per region [110]. The price of the fuel is 11.49PEN/gal or 3.03PEN/L. From the daily consumption of Ungalluta 2, the instant consumption is calculated to an approximate value:

74
( ) = ( ℎ)
24ℎ (4.10)
By using this formula, the average instant consumption for Ungalluta 2 is 0.71kW. The next step is to calculate the generator efficiency in kWh/L:
= ( )
( /ℎ) (4.11)
After using these formulas, the generator for Ungalluta 2 will have an efficiency of 0.27kWh/L, meaning a cost of 11.22PEN/kWh or 3.03EUR/kWh. Continuing with the information given in Table 10, the price of gasoline will be:
Table 26: Fuel cost per month for Ungalluta 2.
The value showed above would be true if the degradation of the PV modules weren’t considered. All modules have a degradation in their peak power as time passes by and it is specified in their datasheets [25] [26] [24]. For the selected module, Hanwha 330w, the degradation is 0.6% per year [83]. Because of this, the production every month will be smaller every year, thus requiring more fuel every year. To calculate the evolution of the yearly costs with this variable production, an annual Payback analysis is done [39]. For this, the following parameters are considered:
MonthFuel (EUR) neededfor Hanwha 330w
Jan 77.09Feb 120.51Mar 0.00Apr 0.00Maj 0.00Jun 0.00Jul 0.00
Aug 0.00Sep 0.00Okt 0.00Nov 0.00Dec 0.00
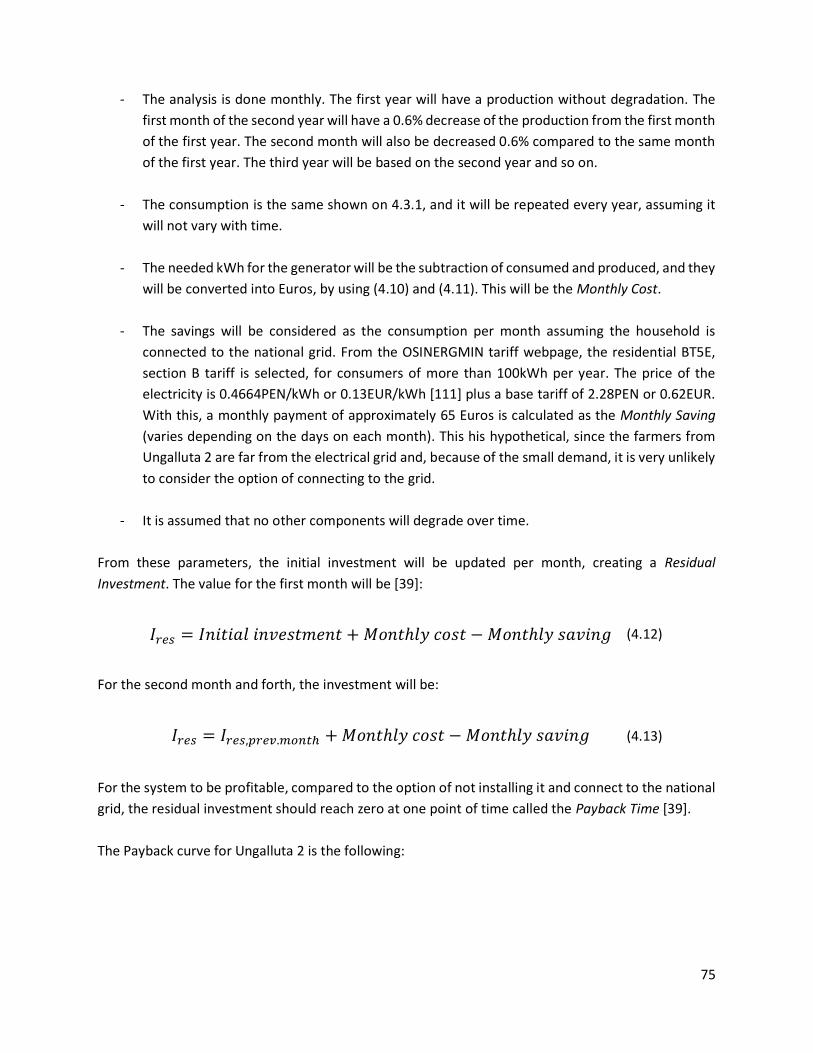
75
- The analysis is done monthly. The first year will have a production without degradation. The first month of the second year will have a 0.6% decrease of the production from the first month of the first year. The second month will also be decreased 0.6% compared to the same month of the first year. The third year will be based on the second year and so on.
- The consumption is the same shown on 4.3.1, and it will be repeated every year, assuming it
will not vary with time.
- The needed kWh for the generator will be the subtraction of consumed and produced, and they will be converted into Euros, by using (4.10) and (4.11). This will be the Monthly Cost.
- The savings will be considered as the consumption per month assuming the household is connected to the national grid. From the OSINERGMIN tariff webpage, the residential BT5E, section B tariff is selected, for consumers of more than 100kWh per year. The price of the electricity is 0.4664PEN/kWh or 0.13EUR/kWh [111] plus a base tariff of 2.28PEN or 0.62EUR. With this, a monthly payment of approximately 65 Euros is calculated as the Monthly Saving (varies depending on the days on each month). This his hypothetical, since the farmers from Ungalluta 2 are far from the electrical grid and, because of the small demand, it is very unlikely to consider the option of connecting to the grid.
- It is assumed that no other components will degrade over time.
From these parameters, the initial investment will be updated per month, creating a Residual Investment. The value for the first month will be [39]:
= + ℎ − ℎ (4.12)
For the second month and forth, the investment will be:
= , . + ℎ − ℎ (4.13)
For the system to be profitable, compared to the option of not installing it and connect to the national grid, the residual investment should reach zero at one point of time called the Payback Time [39]. The Payback curve for Ungalluta 2 is the following:
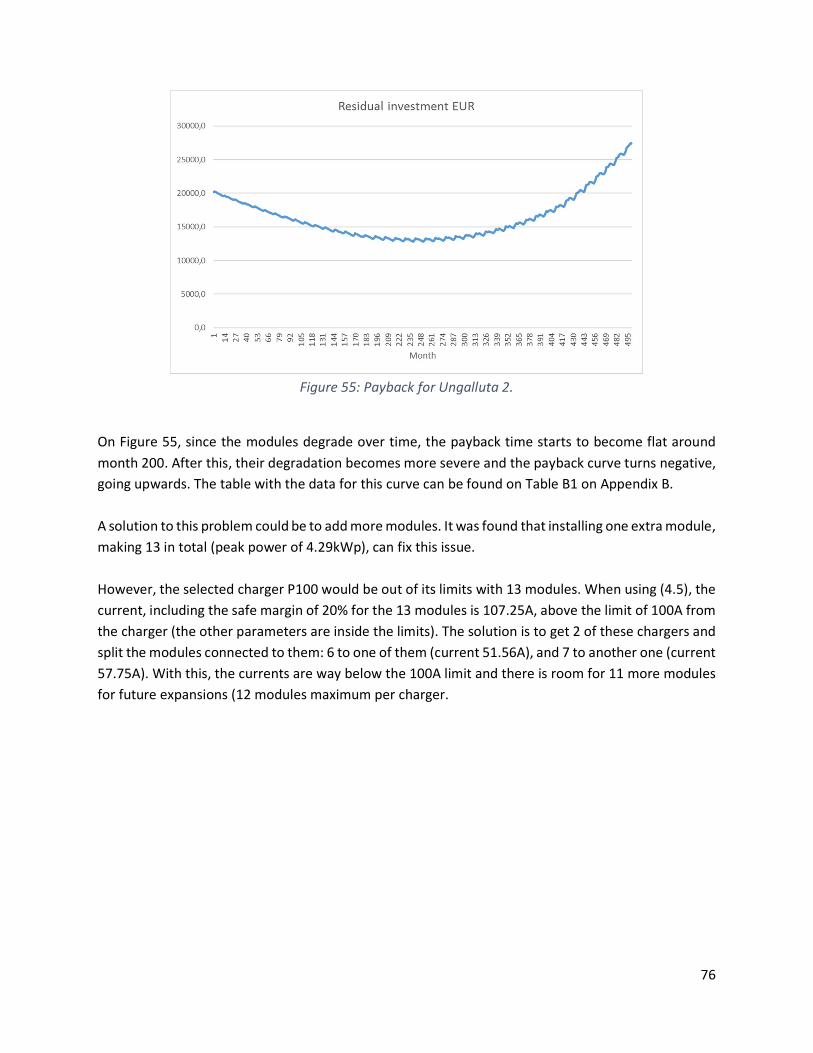
76
Figure 55: Payback for Ungalluta 2.
On Figure 55, since the modules degrade over time, the payback time starts to become flat around month 200. After this, their degradation becomes more severe and the payback curve turns negative, going upwards. The table with the data for this curve can be found on Table B1 on Appendix B. A solution to this problem could be to add more modules. It was found that installing one extra module, making 13 in total (peak power of 4.29kWp), can fix this issue. However, the selected charger P100 would be out of its limits with 13 modules. When using (4.5), the current, including the safe margin of 20% for the 13 modules is 107.25A, above the limit of 100A from the charger (the other parameters are inside the limits). The solution is to get 2 of these chargers and split the modules connected to them: 6 to one of them (current 51.56A), and 7 to another one (current 57.75A). With this, the currents are way below the 100A limit and there is room for 11 more modules for future expansions (12 modules maximum per charger.
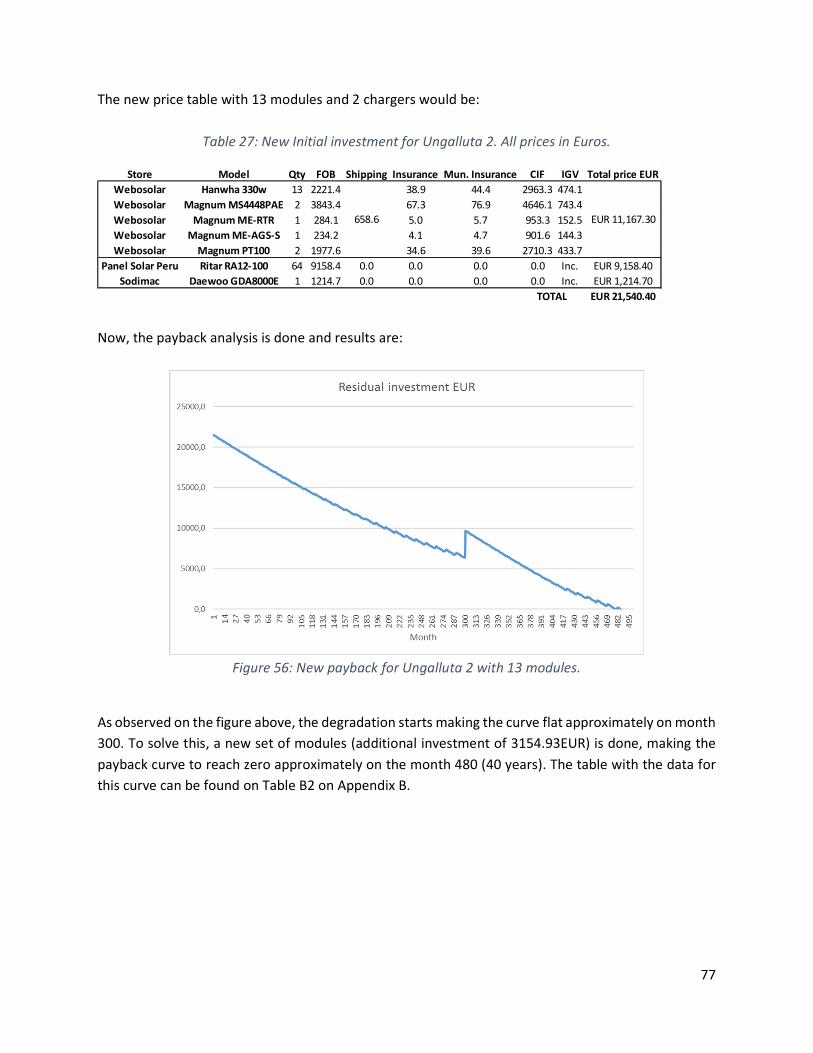
77
The new price table with 13 modules and 2 chargers would be:
Table 27: New Initial investment for Ungalluta 2. All prices in Euros.
Now, the payback analysis is done and results are:
Figure 56: New payback for Ungalluta 2 with 13 modules.
As observed on the figure above, the degradation starts making the curve flat approximately on month 300. To solve this, a new set of modules (additional investment of 3154.93EUR) is done, making the payback curve to reach zero approximately on the month 480 (40 years). The table with the data for this curve can be found on Table B2 on Appendix B.
Store Model Qty FOB Shipping Insurance Mun. Insurance CIF IGV Total price EURWebosolar Hanwha 330w 13 2221.4 38.9 44.4 2963.3 474.1Webosolar Magnum MS4448PAE 2 3843.4 67.3 76.9 4646.1 743.4Webosolar Magnum ME-RTR 1 284.1 5.0 5.7 953.3 152.5Webosolar Magnum ME-AGS-S 1 234.2 4.1 4.7 901.6 144.3Webosolar Magnum PT100 2 1977.6 34.6 39.6 2710.3 433.7
Panel Solar Peru Ritar RA12-100 64 9158.4 0.0 0.0 0.0 0.0 Inc. EUR 9,158.40Sodimac Daewoo GDA8000E 1 1214.7 0.0 0.0 0.0 0.0 Inc. EUR 1,214.70
EUR 21,540.40
658.6 EUR 11,167.30
TOTAL

78
The new monthly production and diesel costs for the first year are:
Table 28: Monthly production and fuel requirements with 13 modules for Ungalluta 2.
4.5.2 Economic calculation for Gåsborn For Gåsborn, the steps are the same as Perú. First comes the initial investment. Since the stores selected are inside Sweden or the EU, there are no customs fees:
Table 29: Initial investment for Gåsborn. All prices in Euros.
The next step is to calculate the price of the fuel for the generator. From 4.4.1, the consumption of the generator is known: 2.5L/h. The fuel it consumes is Diesel. The prices of the fuel in Gåsborn were taken from the database Bensinepriser.se [112]. The price for the closest city, Filipstad, is 12.98SEK/L or 1.33EUR/L. After using (4.10) and (4.11), the chosen generator will have an efficiency of 0.61kWh/L, meaning a cost of 21.28SEK/kWh or 2.19EUR/kWh.
MonthWmo (kWh),Hanwha 330w
Fuel (kWh) neededfor Hanwha 330w
Fuel (EUR) neededfor Hanwha 330w
Jan 546.61 0.00 0.00Feb 475.36 3.56 10.68Mar 668.61 0.00 0.00Apr 669.02 0.00 0.00Maj 621.25 0.00 0.00Jun 595.91 0.00 0.00Jul 667.77 0.00 0.00
Aug 710.37 0.00 0.00Sep 730.18 0.00 0.00Okt 742.47 0.00 0.00Nov 700.08 0.00 0.00Dec 590.80 0.00 0.00
Store Model Qty Price inc. shipping Total priceSolcellgrossen Sunerg 285w 42 8009.4
Europe Solar Shop SMA Sunny Island 6.0H 2 5388.0Europe Solar Shop SMA Sunny Remote Control 1 274.0Europe Solar Shop SMA Sunnyboy 4.0 3 3672.0
WattuNeed Pylontech US2000B 57 64019.7Kvänums Järn Genmac Combiplus 11100KE 1 4790.3
EUR 86,153.4

79
Continuing with Table 15, the price for the Diesel would be:
Table 30: Fuel cost per month for Gåsborn.
Again, this would be true every year without considering the modules degradation. For the Sunerg 285w, the degradation is approximately 0.8% per year [84]. A payback analysis will be done with the following criteria, similarly to Perú:
- The analysis is done monthly. The months of the first year will have a production without degradation. The following months will have a 0.8% decrease of the production from the corresponding month of the previous year, and so on.
- The consumption is the same shown on 4.3.24.3.1, repeated every year.
- The monthly cost will be the needed kWh for the generator, converted into Euros, by using
(4.10) and (4.11).
- The savings will be considered as the monthly payments assuming the household is connected to the grid. From the Elskling tariff webpage [113], for the selected location of Gåsborn, by using the lowest price provider with the longest contract period (Nordic Green Energy, more than 3 years contract), for the annual consumption of 13300kWh/year (calculated on 4.1.2), the price of the electricity is 0.7601SEK/kWh or 0.078EUR7kWh. The monthly payment is approximately 88 Euros, becoming the monthly savings. The price for a new connection to the grid is not included.
- As for Perú, it is assumed that no other components will degrade over time.
MonthFuel (EUR) needed
for Sunerg 285w
Jan 1847.19Feb 951.16Mar 0.00Apr 0.00Maj 0.00Jun 0.00Jul 0.00
Aug 0.00Sep 0.00Okt 857.55Nov 1674.07Dec 2258.53

80
The payback curve for Gåsborn is the following (data on Appendix B Table B3):
Table 31: Payback for Gåsborn.
From Table 31, the payback curve does not reach zero because:
- The initial investment is high, especially because of the Lithium batteries.
- The FLH calculation only covers 7 months of the year. If more months want to be covered, the
number of modules increases (65 modules for 8 months, 73 modules for 9, 139 modules for 10, 165 for 11 and 467 for 12).
- The electricity cost from the network is much lower than the cost of the diesel. There would be 5 months of the year not covered by solar power and significant amounts of diesel must be purchased.
A solution to bring the payback to a negative trend is to increase the modules. However, the number needed is big. In the extreme case of covering the entire year, 467 modules, and assuming 1 Sunny boy 4.0 inverter per 14 modules (inside its limits), the new cost would be:
Table 32: New initial investment for Gåsborn. Generator as backup. All prices in Euros.
Store Model Qty Price inc. shipping Total priceSolcellgrossen Sunerg 285w 467 89056.9
Europe Solar Shop SMA Sunny Island 6.0H 2 5388.0Europe Solar Shop SMA Sunny Remote Control 1 274.0Europe Solar Shop SMA Sunnyboy 4.0 34 41616.0
WattuNeed Pylontech US2000B 57 64019.7Kvänums Järn Genmac Combiplus 11100KE 1 4790.3
EUR 205,144.9

81
With this, the payback curve would be:
Figure 57: New payback for Gåsborn with 467 modules.
As seen on Figure 57, even for an entirely autonomous design, the payback does not reach zero on 500 months (40 years). The data for this curve can be found in Appendix B, Table B4.
4.6 Design using PVSyst software The software PVSyst was recommended by WSP for the design of the same locations. The software gives detailed results and has other features compared to the manual calculations. The first step is to create the geographical locations for Ungalluta 2 and Gåsborn. In Databases – Geographical data – New, the coordinates are introduced and the data from Meteonorm (as recommended by the software since NASA is less accurate) is downloaded.
Figure 58: Databases menu in PVSyst.

82
Next comes the project design. On the main window, Project Design – Stand-alone is selected:
Figure 59: Creating an off-grid project in PVSyst.
For this design, however, PVSyst only offers one topology, with a single universal controller:
Figure 60: Off-grid topology for PVSyst.
As seen on Figure 60, the regulator is in charge of receiving the DC power from the modules, the AC from the generator, charging and inverting the DC from the batteries, and feeding the AC loads. Some controllers of this type were found on the online stores for Peru and Sweden, but were not selected because of their power limitations or unavailability to connect in parallel. Because this is the only option offered by PVSyst, a Universal Controller design will be made, since the Ungalluta 2 and Gåsborn topologies are different.

83
4.6.1 PVSyst design for Ungalluta 2 For Ungalluta 2, the location is created as the first step, selecting Meteonorm as the solar data source.
Figure 61: Creating Ungalluta 2 location in PVSyst.
The next step is to check on the database (Figure 58) if the solar modules, batteries and generator are introduced. If not, the items must be created based on their datasheet. The template is detailed, with some advanced properties. If unknown, the default values must be selected (check mark box):
Figure 62: Creating PV module.

84
Figure 63: Creating new battery type.
Figure 64: Creating new generator.
The next step is to create the off-grid project. The main window has several inputs:
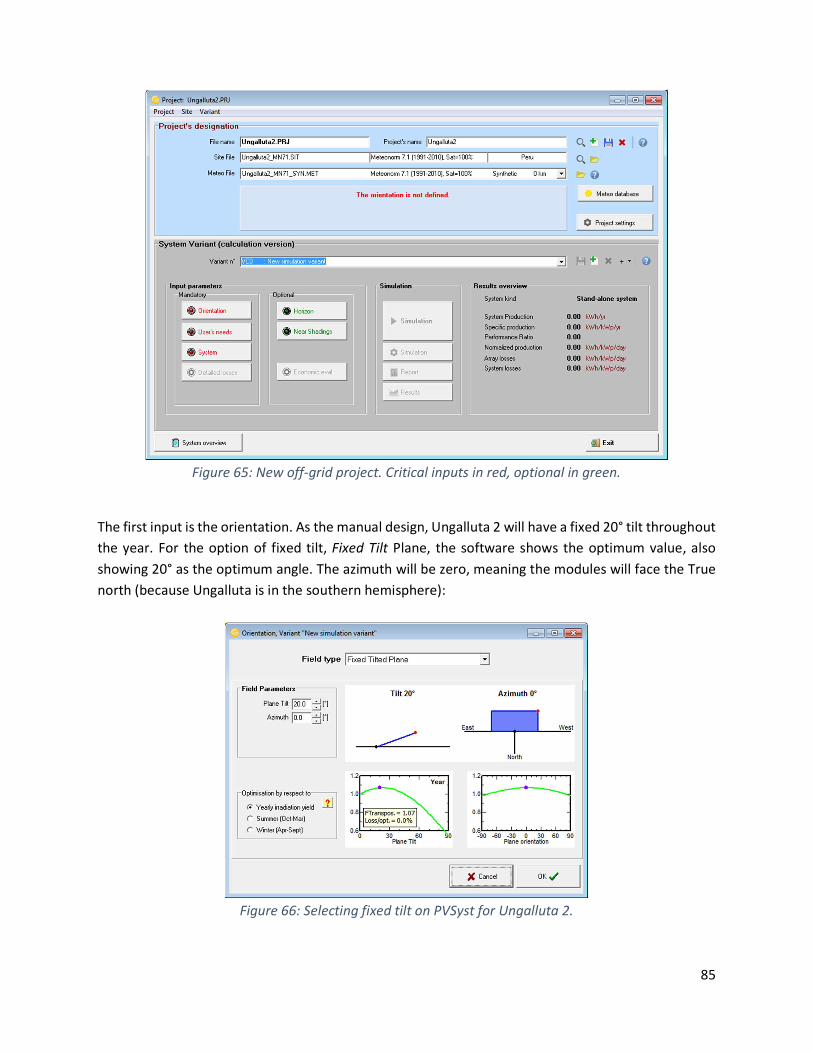
85
Figure 65: New off-grid project. Critical inputs in red, optional in green.
The first input is the orientation. As the manual design, Ungalluta 2 will have a fixed 20° tilt throughout the year. For the option of fixed tilt, Fixed Tilt Plane, the software shows the optimum value, also showing 20° as the optimum angle. The azimuth will be zero, meaning the modules will face the True north (because Ungalluta is in the southern hemisphere):
Figure 66: Selecting fixed tilt on PVSyst for Ungalluta 2.
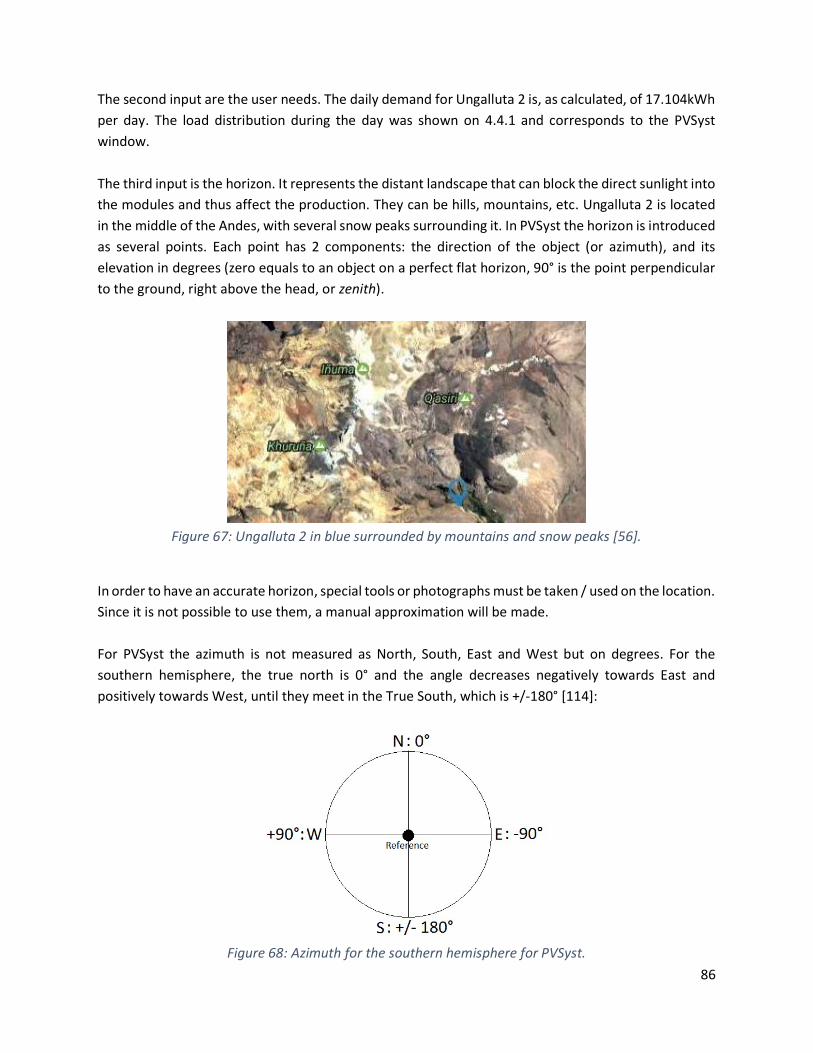
86
The second input are the user needs. The daily demand for Ungalluta 2 is, as calculated, of 17.104kWh per day. The load distribution during the day was shown on 4.4.1 and corresponds to the PVSyst window. The third input is the horizon. It represents the distant landscape that can block the direct sunlight into the modules and thus affect the production. They can be hills, mountains, etc. Ungalluta 2 is located in the middle of the Andes, with several snow peaks surrounding it. In PVSyst the horizon is introduced as several points. Each point has 2 components: the direction of the object (or azimuth), and its elevation in degrees (zero equals to an object on a perfect flat horizon, 90° is the point perpendicular to the ground, right above the head, or zenith).
Figure 67: Ungalluta 2 in blue surrounded by mountains and snow peaks [56].
In order to have an accurate horizon, special tools or photographs must be taken / used on the location. Since it is not possible to use them, a manual approximation will be made. For PVSyst the azimuth is not measured as North, South, East and West but on degrees. For the southern hemisphere, the true north is 0° and the angle decreases negatively towards East and positively towards West, until they meet in the True South, which is +/-180° [114]:
Figure 68: Azimuth for the southern hemisphere for PVSyst.

87
The convention used internationally to determine an azimuth or bearing is different from PVSyst. The bearing is a positive angle, no matter on which hemisphere one is located, and begins with 0° on North. It goes positive towards the east and reaches 360° when returning to North, in a clockwise movement [115]. The conversion from international to PVSyst formats is done with the following formula: If the bearing is bigger than 180°:
ℎ = 360° − (4.13)
If the bearing is smaller than 180°:
ℎ = − (4.14)
From Figure 67, with the help of Free Map Tools [116], a web tool that shows the elevation of a coordinate, several points around Ungalluta at distances of approximately 2 to 5km were selected. With another web tool, which calculates the distance between two coordinates and their bearing, [117], and together with the elevation formula (2.1) from the first chapter, the points are entered on PVSyst:
Figure 69: PVSyst horizon diagram for Ungalluta 2. The mountains nearby, as observed, block the sun
rays in the early morning.

88
Another input are the near shadings. This represent objects that are at a short distance from the household, such as neighboring buildings, trees, etc. Since Ungalluta is a remote location, there will not be an input for it. The final parameter to setup before the simulation is the system, which has 5 input areas. The first one are the Pre-Sizing Suggestions. In here, the program asks for autonomy days (3 days as established on section 4.2), battery voltage (48VDC, also mentioned on section 4.2), and Accepted LOL. This value represents the probability of the system not being able to satisfy the user loads because of a low state of charge SOC on the batteries [118]. According to the literature study, on the Wenham book [26], the Availability of a non-critical stand-alone system, which is the complement of the LOL, is usually 95%. This means the LOL would be 5%. This recommendation is taken for PVSyst.
Figure 70: Pre-sizing suggestions in PVSyst for Ungalluta 2. It shows a recommended battery capacity
and module peak power, which can be modified in the following tabs.
The next configuration inside the System parameter is the Storage tab. In here, the type of battery is selected (already added on the database), together with the number of batteries in series and parallel (already selected on section 4.4.1, Table 17). For Ungalluta 2, The Ritar battery is selected (100Ah) in a 4x16 configuration, creating a total capacity of 1600Ah:
Figure 71: Storage arrangement for Ungalluta 2. Check marks are recommended default values, and
they can be modified by typing the desired number on the left.

89
Inside the battery tab, there is an option that allows to select the ambient temperatures surrounding the batteries, since their performance and lifetime will depend on it. Based on the SENAHMI historical data from the weather station located close by, temperature values are selected for each month (Monthly Specified Values option). The criteria considered is about 2 degrees above the average temperature on each month [52]:
Figure 72: Batteries average surrounding ambient temperature during the year.
The next tab is the PV Array. In here, the type of module (already created on the database) and controller are selected. For Ungalluta 2 the module selected is the Hanwha Q Cells 330w, in an arrangement of 13 modules in parallel (a single module per string). The 13 modules option is selected because of the payback analysis from section 4.5.1. The modules arrangement is entered in the PV Array Design grey area. On the Pre-sizing Help area, the calculated peak power is entered (in this case, 13 times 330w, 4.29kWp). The green area selects the controller. As explained, a universal type of the MPPT type will be selected (the charger selected has MPPT tracking).

90
Figure 73: Module type, arrangement and controller selected for Ungalluta 2 in PVSyst.
The next and final tab is the Backup, where the generator (if used) is selected. Since the generator has been already created on the database, it is selected from the list, together with the effective operating power. In this case, the maximum load is selected (from section 4.4.1):
Figure 74: Generator selection for Ungalluta 2 in PVSyst.
The final tab, Schema, shows the arrangement from Figure 60, with the universal controller, which cannot be changed. After all the mentioned parameters are entered, the Simulate option is selected. The software simulates the design for an entire year and shows several results. The most important ones will be shown next.

91
The first table are the Energy Use results. It shows the energy supplied to the user, E User and the energy need of the user, E Load during the year. A parameter called SolFrac shows a value lower than 1 if the demand is higher than the production. For PVSyst, the month of January will need generator power, differently from the manual calculation, which showed February as the month that doesn’t cover the entire user needs. The parameter E BkUp shows the kWh that the generator will need for the specified month:
Table 33: Energy use for Ungalluta 2 on PVSyst. February will need generator power.

92
The next table and figure show the SOC of the batteries at the end of each month. The end of February will be the month when the battery will be at its lowest charge (around 49%):
Table 34: SOC at the end of each month for Ungalluta 2 on PVSyst.
Figure 75. SOC during the year for PVSyst. January and February will be the worse because of the
rainy season, cloudy weather, thus low production.

93
Next, a Gantt diagram showing the energy flows on the system:
Figure 76: Energy flow on the Ungalluta 2 system for PVSyst. The backup generator contributes to the
0.3% of the demand, while the unused energy is almost 30%.
And finally, the environmental benefit from the system. On a 30 year period, 60 tons of CO2 are avoided from being emitted to the atmosphere:
Figure 77: CO2 avoided emissions during 30 years.

94
4.6.2 PVSyst design for Gåsborn The same procedure is done for Gåsborn. First, the site is created on the database:
Figure 78: Creating Gåsborn location in PVSyst.
The next step is to create the database for the selected module from the manual calculation, Sunerg X-Style 285; for the Lithium battery Pylontech US2000B (in type of battery, Undefined is selected since there is no option for Lithium); and the generator Genmac Combiplus 11100KE, following the same steps as for Perú. After this, the new off-grid project is selected. The first parameter to enter is the orientation or tilt of the modules . For Gåsborn, the angles will vary every month in order to reach the maximum electricity output. From the manual calculations in section 4.3.2, the selected tilts are in the 20° to 75° range. Because of this, the Tracking Horizontal Axis E-W option is selected with the minimum and maximum tilt similar to the angles mentioned. The Axis Orientation or azimuth will be 0°, meaning the modules will face the True South since the location is in the northern hemisphere:

95
Figure 79: Variable tilt angle for Gåsborn in PVSyst.
Next comes the user needs. The hourly demand was already mentioned on section 4.4.2, with a demand of 36.44kWh per day. After the load comes the horizon diagram. For the northern hemisphere, PVSyst has another convention, differently from the southern hemisphere. The True South is 0° and it decreases negatively towards East and positively towards West, until they meet in the True North, which is +/-180° [114]:
Figure 80: Azimuth for the northern hemisphere for PVSyst.
With this information, the bearing is converted into PVSyst values is the following formula:

96
ℎ = − 180° (4.15)
Using the same procedure as for Perú, the horizon diagram is done for the Gåsborn location. Because of the availability of Google Street View, it can be compared with the real horizon [56]. Similarly as for Perú, no near shadings will be entered on the design.
Figure 81: PVSyst horizon diagram for Gåsborn. The hills nearby, as observed, block the sun rays in
the early morning.
Figure 82: View of the outside of the household in Gåsborn, facing to the True South [56].
The final parameter is the System. The configuration is similar as for Perú:

97
- On Pre-Sizing Suggestions, 3 days of autonomy and 5% LOL are entered, together with a battery
voltage of 48VDC.
- In the Storage tab, the US2000B battery from Pylontech, already created on the database, is entered. From section 4.4.2, Table 21, the arrangement is set: 57 batteries in parallel with one battery per string, creating a total capacity of 2850Ah.
- In the battery temperature tab, monthly values are set based on the monthly average temperature from the PVSyst database when creating the location for Gåsborn. It is assumed that the batteries will be stored 2 or 3 degrees above these values:
Figure 83: Batteries average surrounding ambient temperature during the year.
- On the PV Array tab, a planned power of 11.97kWp is entered. The module selected is the
Sunerg X-Style 285, and the selected arrangement calculated from section 4.4.2 is 6 strings of 7 modules in series. The controller will also be Universal + MPPT since the Sunny Boy inverters selected on the manual calculations have this feature.
- The final tab is Backup. In here, the Genmac Combiplus 11100KE, already created on the
database, is selected. A 6.5kW peak power is entered as the effective operating power, since this is the peak demand calculated on section 4.4.2.
Finally, the simulation is done and the results are the following:

98
Table 35: Energy use for Gåsborn on PVSyst. Nine months will need generator power.
As seen, PVSyst has a more pessimistic approach for Gåsborn. On one side, the FLH calculation specified that for 42 modules, 7 months would be covered: March to September. However, the software only estimate s autonomy for April, June and July. This would carry a considerable amount of diesel required for the generator.
Table 36: SOC at the end of each month for Gåsborn on PVSyst.

99
Figure 84: SOC during the year in PVSyst for Gåsborn. October to February will be the worse because
of the cold season, thus low production.
From Table 36 and Figure 84, it is observed that the battery bank will keep a low SOC during the autumn and winter, practically from the beginning of October until late February. This is because of the cold season together with the low sun altitude during this months, decreasing the energy production dramatically. For the Gantt diagram, it can be observed that a third of the energy needed during the year is supplied from the generator. This is a considerable number and the diesel cost will be high.
Figure 85: Energy flow on the Gåsborn system for PVSyst. The backup generator contributes to the
33% of the demand, while the unused energy is 14%.

100
Finally, as suspected because of the considerable diesel use, the environmental benefit from the system, on a 30 year period, is negative. The emissions are 14 tons of CO2 compared to a connection to the grid:
Figure 86: CO2 emissions during 30 years.
Similarly to the economical calculations, the Gåsborn design is not recommended with the calculated number of modules, 42. With the concern of the CO2 emissions, making the simulation with a higher number of modules, it is observed that it is needed 132 as minimum in order to reach a positive saving. However, this would increase the initial investment up to 111884.4EUR, a 30% more:
Table 37: Production for Gåsborn with PVSyst for 132 modules.

101
The emissions for this new configuration would become positive almost reaching the year 30, meaning this is the minimum number of modules needed in order to make a positive environmental impact:
Figure 87: Saved CO2 emissions for Gåsborn with PVSyst and 132 modules.
In Table 37, seven months are fully covered for 132 modules. However, when doing the manual calculation, the needed energy per month for the generator on the first year is more optimistic:
Table 38. Energy needed per month for Gåsborn for 132 modules, manual calculation.
MonthFuel (kWh) needed
for Sunerg 285w
Jan 221,72Feb 0,00Mar 0,00Apr 0,00Maj 0,00Jun 0,00Jul 0,00
Aug 0,00Sep 0,00Okt 0,00Nov 52,17Dec 810,15

102
5 Conclusions and recommendations The Full-Load-Hours manual calculation, as seen on chapter 4, is an effective method to design a PV System. However, when taking into consideration small details, the software design brings more real results. For the Peruvian design in Ungalluta 2:
- The solar radiation, as seen, is quite high in that part of the Andes. Just 13 modules are needed to satisfy a family of 11 people, 1.2 modules per person. However, the investment is high (21540EUR). These families are extremely poor and would need help from the government in order to acquire the equipment. However, since the majority of poverty in the Andes is located in these remote areas, it would be beneficial for the government to invest on solar energy. The access to electricity would increase and it is related to the reduction in poverty, as mentioned on [119].
- The economic calculations were done assuming none of the components, besides the solar
modules, decay over time, which is not true in real life. Because of the precarious status of many of the households in the high Andes, special care needs to be taken in order to install the system in a proper area, far from the direct sunlight and protected from the rain and snow.
For the Swedish design in Gåsborn:
- As seen, the average irradiation in Sweden is low, even in Gåsborn, which is located in mid-Sweden. As seen on PVSyst and the manual calculations, it is not profitable to depend entirely on PV power on these latitudes. Because of the low radiation during winter, even with optimum tilts, the production is not enough to satisfy an average rural family home of 175m2, unless a considerable number of modules is used (more than 100). This would mean an area approximately the same size of the household just for electricity production. Also, the electricity has a low cost in Sweden [33], and the access is 100% nationwide as mentioned in the introduction. Comparing only PV, it is more convenient, more profitable, and more environmental friendly to connect to the electricity grid for the chosen latitude, and logically, upper latitudes too. A solution for this problem is to use, together with sun, other sources of renewables, especially during the cold season, such as wind power or small hydro power plants. This would dramatically decrease the fuel consumption for the generator, and thus reducing the carbon contribution.
To finish, some recommendations for both designs:

103
- The battery bank positive and negative terminal cables should come from opposite corners of
the bank. This way all the batteries stored energy is equally used.
- For the VRLA batteries in Ungalluta, at least 2cm must be left between batteries. Also, the top connectors should be washed twice per year. Before the assembly, it is recommended to apply a non-hardening sealant to all the metal parts of the terminals, like Vaseline, to avoid corrosion. Finally, an equalization of the batteries is recommended every 3 weeks [77].
- The installation manuals from each of the selected components must be read entirely. In them, important information such as wiring sizes for each part of the system are recommended, as well as operating conditions.
- For installations of modules on ground, there are optimum distances between modules depending on their area and tilt. The sources [26], [25] and [48] talk about them in detail.

104
6 References
[1] IPCC, Intergovernmental Panel on Climate Change, "Climate Change 2007: The Physical Science Basis," 2007. [Online]. Available: https://www.ipcc.ch/pdf/assessment-report/ar4/wg1/ar4-wg1-ts.pdf. [Accessed 27 March 2017].
[2] UN-FCCC, United Nations Framework Convention on Climate Change, "The Paris Agreement," 2016. [Online]. Available: http://unfccc.int/paris_agreement/items/9485.php. [Accessed 27 March 2017].
[3] H.-H. R. K. G. Ralph E.H. Sims, "Carbon emission and mitigation cost comparisons between fossil fuel, nuclear and renewable energy resources for electricity generation," ELSEVIER, 2003. [Online]. Available: https://www.iaea.org/OurWork/ST/NE/Pess/assets/Energy%20Policy%202003.pdf. [Accessed 27 March 2017].
[4] UNEP REN21, United Nations Environment Program Renewable Energy Policy Network for the 21th Century, "Renewable Energy Indicators 2015," 2016. [Online]. Available: http://www.ren21.net/wp-content/uploads/2016/10/REN21_GSR2016_FullReport_en_11.pdf. [Accessed 27 March 2017].
[5] UNEP REN21, United Nations Environment Program Renewable Energy Policy Network for the 21th Century, "Total Capacity or Generation as of end of 2015," 2016. [Online]. Available: http://www.ren21.net/wp-content/uploads/2016/10/REN21_GSR2016_FullReport_en_11.pdf. [Accessed 27 March 2017].
[6] UNEP REN21, United Nations Environment Program Renewable Energy Policy Network for the 21th Century, "Share of Electricity Generation from Renewable Sources, Targets and 2014 Shares," 2016. [Online]. Available: http://www.ren21.net/wp-content/uploads/2016/10/REN21_GSR2016_FullReport_en_11.pdf. [Accessed 27 March 2017].
[7] MINAGRI, Peru agriculture ministry, "ANA, National water authority," [Online]. Available: http://www.snirh.gob.pe/portalsnirh/index.php/en/. [Accessed 13 May 2017].

105
[8] MINEM, Energy and Mining Ministry of Peru, "National Energetic Plan 2014-2025," [Online]. Available: http://www.minem.gob.pe/minem/archivos/2ResEje-2014-2025%20Vf.pdf. [Accessed 29 March 2017].
[9] COES, National Peruvian Grid, "Real Time Generation, online SCADA monitoring system," [Online]. Available: http://www.coes.org.pe/Portal/portalinformacion/generacion. [Accessed 30 March 2017].
[10] UNEP REN21, United Nations Environment Program Renewable Energy Policy Network for the 21th Century, "Electricity Access by Region and Country, 2013 and Targets," 2016. [Online]. Available: http://www.ren21.net/wp-content/uploads/2016/10/REN21_GSR2016_FullReport_en_11.pdf. [Accessed 29 March 2017].
[11] World Bank Group, ESMAP, Solar GIS, "Global Horizontal Radiation for Peru," [Online]. Available: http://globalsolaratlas.info/downloads/peru. [Accessed 29 March 2017].
[12] "In the Andes, Freak Cold Extracts a Brutal Toll," The Daily Climate, 2012.
[13] UN-FAO, United Nations Food and Agriculture Organization, "Analysis of the Impact of the Cold Events (“Friaje”) on 2008 in the High Andean Agriculture and on Peru," 2008. [Online]. Available: http://www.fao.org/fileadmin/user_upload/emergencies/docs/1_Peru_ESTUDIO_FINAL_FRIAJE_OCT_13_2008.pdf. [Accessed 31 March 2017].
[14] UN-FAO, United Nations Food and Agriculture Organization, "FAO Responds to “Friaje” Emergency in Peru," 2008.
[15] "Puno and Arequipa: This is How to live in one of the coldest places on Peru," El Comercio, 2016.
[16] "Arequipa: Temperature will reach minus 18 degrees Celsius," El Comercio, 2015.
[17] P. p. o. t. c. o. m. PCM, "Declaratory of State Emergency on the Regions of Apurímac, Arequipa, Ayacucho, Cuzco, Huancavelica, Junín, Lima, Moquegua, Pasco, Puno and Tacna," Official Newspaper “El Peruano”, 18 June 2008.
[18] World Bank, "Access to Electricity per Percentage of Population," 2014. [Online]. Available: http://data.worldbank.org/indicator/EG.ELC.ACCS.ZS. [Accessed 13 May 2017].

106
[19] W. Bank, "Global Solar Atlas," [Online]. Available: http://globalsolaratlas.info/. [Accessed 13 May 2017].
[20] "WSP – Parsons Brinckerhoff," [Online]. Available: http://www.wsp-pb.com/en/WSP-Sweden/Who-we-are/About-WSP/. [Accessed 31 March 2017].
[21] "PVSyst software," [Online]. Available: http://www.pvsyst.com/en/software/functionalities. [Accessed 31 March 2017].
[22] University of Minnesota Duluth, "The Geographic Coordinate System," 2010. [Online]. Available: nrri.umn.edu/worms/downloads/team/TheGeographicCoordinateSystem.pdf. [Accessed 14 May 2017].
[23] US Federal Communications Comission, "Converter Degrees-Minutes-Seconds to / from Decimal Degrees," 25 August 2016. [Online]. Available: https://www.fcc.gov/media/radio/dms-decimal. [Accessed 15 May 2017].
[24] US Solar Energy Research Institute, Basic Photovoltaic Principles and Methods, 1982.
[25] K. Mertens, Photovoltaics Fundamentals, Tecnhology and Practice, Münster: Wiley, 2014.
[26] M. A. G. M. E. W. R. C. Stuart R. Wenham, Applied Photovoltaics, Cornwall: Earthscan, 2007.
[27] GIS Geography, "Magnetic North vs Geographic (True) North Pole," 24 January 2017. [Online]. Available: http://gisgeography.com/magnetic-north-vs-geographic-true-pole/. [Accessed 14 May 2017].
[28] Natural Resources Canada, "Magnetic declination calculator," 24 February 2017. [Online]. Available: http://geomag.nrcan.gc.ca/calc/mdcal-en.php. [Accessed 14 May 2017].
[29] Natural Resources Canada, "Using a Compass," 24 February 2017. [Online]. Available: http://geomag.nrcan.gc.ca/mag_fld/compass-en.php#compass. [Accessed 14 May 2017].
[30] P. A. Lynn, Electricity from Sunlight, West Sussex: Wiley, 2010.
[31] TimeandDate.com, "Sunrise and Sunset Calculator - City Lookup," [Online]. Available: https://www.timeanddate.com/sun/. [Accessed 14 May 2017].

107
[32] Build it Solar, "Which Way is South?," 6 February 2009. [Online]. Available: http://www.builditsolar.com/SiteSurvey/FindingSouth.htm. [Accessed 14 May 2017].
[33] G. Siden, Thesis assessment, Halmstad, 2017.
[34] J. A. Coakley, "Reflectance and Albedo, Surface," 2003. [Online]. Available: http://curry.eas.gatech.edu/Courses/6140/ency/Chapter9/Ency_Atmos/Reflectance_Albedo_Surface.pdf. [Accessed 15 May 2017].
[35] World Bank, "Global Solar Atlas," 2016. [Online]. Available: http://globalsolaratlas.info/. [Accessed 15 May 2017].
[36] NASA Atmospheric Science Data Center, "NASA Surface meteorology and Solar Energy - Location," [Online]. Available: https://eosweb.larc.nasa.gov/cgi-bin/sse/[email protected]. [Accessed 15 May 2017].
[37] EU - Joint Research Centre, "PV Geographical Information System EU-JRC-PVGIS," [Online]. Available: http://re.jrc.ec.europa.eu/pvgis/apps4/pvest.php#. [Accessed 15 May 2017].
[38] G. Svantesson, "Energilagring för ökad egenanvändning av solel i flerbostadshus (Energy storage for improved self consumption of PV electricity in multi-dwelling buildings)," Uppsala Universitet, Uppsala, 2017.
[39] G. Siden, Förnybar Energi (Renewable Energy), Halmstad, 2015.
[40] NREL, US National Renewable Energy Laboratory, "Advanced Power Electronic Interfaces for Distributed Energy Systems," March 2008. [Online]. Available: http://www.nrel.gov/docs/fy08osti/42672.pdf. [Accessed 17 May 2017].
[41] S. B. Christiana Honsberg, "Photovoltaic Education Network," UNSW - University of New South Wales, [Online]. Available: http://www.pveducation.org/. [Accessed 17 May 2017].
[42] G. Boyle, Renewable Energy: Power for a Sustainable Future, Oxford: Oxford University Press, 2004.
[43] LG, "Module LG Neon 2 Black," [Online]. Available: http://www.lg.com/global/business/solar/neon/lg-neon-2-black. [Accessed 17 May 2017].

108
[44] Ecodirect, "Comparison: MPPT vs. PWM charge controllers," [Online]. Available: https://www.ecodirect.com/Charge-Controller-Comparison-s/251.htm. [Accessed 21 May 2017].
[45] Victron Energy, "Which Solar Charge Controller: PWM or MPPT?," [Online]. Available: https://www.victronenergy.com/blog/2014/07/21/which-solar-charge-controller-pwm-or-mppt/. [Accessed 21 May 2017].
[46] Solar Facts, "Blocking and Bypass Diodes in Solar Panels," [Online]. Available: www.solar-facts.com/panels/panel-diodes.php. [Accessed 31 May 2017].
[47] Alternative Energy Tutorials, "Solar Photovoltaic Panel," [Online]. Available: http://www.alternative-energy-tutorials.com/solar-power/pv-panel.html. [Accessed 31 May 2017].
[48] H. Häberlin, Photovoltaics System Design and Practice, Berne: Wiley, 2012.
[49] T. M. L. C. Augustin McEvoy, Practical Handbook of Photovoltaics. Fundamentals and Applications, Oxford: Elsevier, 2012.
[50] INEI, Peru National Statistics Institute, "Poverty measurement results for 2016," 10 May 2017. [Online]. Available: https://www.inei.gob.pe/prensa/noticias/en-el-peru-264-mil-personas-dejaron-de-ser-pobres-entre-los-anos-2015-y-2016-9710/. [Accessed 17 May 2017].
[51] Senamhi, Peru national service or meteorology and hidrology, "Districts in yearly high risk of freezing temperatures during winter," June 2015. [Online]. Available: http://www.peruclima.pe/usr/pdf/helada-dist-muyalto.pdf. [Accessed 17 May 2017].
[52] Senahmi, Peru national service of meteorology and hidrology, "Historical meteorological data," [Online]. Available: http://www.peruclima.pe/?p=data-historica. [Accessed 17 May 2017].
[53] MEF, Peru economics ministry, "Public investment GIS tool," [Online]. Available: http://ofi5.mef.gob.pe/geosnip/Inicio.html. [Accessed 17 May 2017].
[54] INEI, Peru national statistics Institute, "National GIS of rural communities," [Online]. Available: http://sige.inei.gob.pe/test/atlas/. [Accessed 17 May 2017].
[55] Peru energy ministry, "National electricity grid GIS tool," [Online]. Available: mapas.minem.gob.pe/map_dger/. [Accessed 17 May 2017].

109
[56] Google, "Google Maps," 2017. [Online]. Available: maps.google.com. [Accessed 14 May 2017].
[57] Wholesale Solar, "Home appliances power consumption," 2003. [Online]. Available: https://pdf.wholesalesolar.com/Download%20folder/Power-table.pdf. [Accessed 18 May 2017].
[58] MINEM, Peru energy and mining ministry - Energy efficiency office, "Web tool to calculate power consumption," [Online]. Available: http://www.minem.gob.pe/minem/archivos/file/DGEE/eficiencia%20energetica/calculadora/EQUIPU.html. [Accessed 18 May 2017].
[59] H. Harlén, Sverige från A till Ö: geografisk-historisk uppslagsbok (Sweden from A to Z: geographical-historical reference book), Stockholm: Kommentus, 2003.
[60] Enertech, "End-use metering campaign in 400 households in Sweden," September 2009. [Online]. Available: http://www.enertech.fr/pdf/54/consommations%20usages%20electrodomestiques%20en%20Suede_2009.pdf. [Accessed 17 May 2017].
[61] MINEM, Peru energy and mines ministry, "Technical specs of PV systems and their components for rural electrification," PUCP - Pontifical Catholic University of Peru, September 2015. [Online]. Available: http://www.minem.gob.pe/archivos/legislacion-7243dzdy4z4mz236z6zz-EETT_Sistemas_Fotovoltaicos_y_Componentes.pdf. [Accessed 18 May 2017].
[62] P. D. V. Salas, "Design of a PV System for the Electricity Supply to 15 Laptops in the PUCP," June 2014. [Online]. Available: http://tesis.pucp.edu.pe/repositorio/handle/123456789/5447. [Accessed 17 May 2017].
[63] J. M. M. M. Carmen L. de Guevara Muñoz, "Mini-Grid System Study Applied to a Single Stand-Alone House Located in Málaga, Spain," University of Skövde, 2015. [Online]. Available: http://www.diva-portal.se/smash/get/diva2:829794/FULLTEXT01.pdf. [Accessed 18 May 2017].
[64] Solar Quotes, "Micro Inverters, Inverter Chargers," 5 November 2014. [Online]. Available: https://www.solarquotes.com.au/blog/micro-inverters-battery-backup-compatible/. [Accessed 21 May 2017].
110
[65] Webo Solar, "How to Select Your Lead-acid Batteries," [Online]. Available: http://webosolar.com/blog/how-to-select-your-lead-acid-batteries/. [Accessed 23 May 2017].
[66] Wholesale solar, "Solar panels," 2017. [Online]. Available: https://www.wholesalesolar.com/solar-panels. [Accessed 18 May 2017].
[67] Altenergy Magazine, "A Comparison of Lead Acid to Lithium-ion in Stationary Storage Applications," [Online]. Available: www.altenergymag.com/content.php?post_type=1884. [Accessed 28 May 2017].
[68] SMA, "Battery Management in Off-Grid Systems," [Online]. Available: http://files.sma.de/dl/3491/TECHBATT-AEN114414.pdf. [Accessed 18 mAY 2017].
[69] IEA, International Energy Agency, "A User Guide to Simple Monitoring and Sustainable Operation of PV-Diesel Generator Systems," 3 November 2015. [Online]. Available: https://energypedia.info/images/0/09/A_User_Guide_to_Simple_Monitoring_and_Sustainable_Operation_of_PV-diesel_Hybrid_Systems.pdf. [Accessed 18 May 2017].
[70] NREL, US National Renewable Energy Lab, "Best Practices in Photovoltaic System Operations and Maintenance," December 2016. [Online]. Available: http://www.nrel.gov/docs/fy15osti/63235.pdf. [Accessed 18 May 2017].
[71] The solar market, "Grounding and lightning prevention," 1996. [Online]. Available: http://www.thesolarsupermarket.com/toolbox-grounding.php. [Accessed 18 May 2017].
[72] Swedensol, "Online Store," [Online]. Available: www.swedensol.se. [Accessed 22 May 2017].
[73] Norden Solar, "Online Store," [Online]. Available: www.nordensolar.se. [Accessed 22 May 2017].
[74] Electrotec, "Online store," [Online]. Available: electrotecenergy.se. [Accessed 22 May 2017].
[75] Panel Solar Perú, "Online Store," [Online]. Available: www.panelsolarperu.com. [Accessed 22 May 2017].
[76] Proviento, "Online Store," [Online]. Available: www.proviento.com.pe. [Accessed 22 May 2017].
111
[77] Webo Solar, "Online Store," [Online]. Available: webosolar.com/store/en/. [Accessed 22 May 2017].
[78] Solelgrossisten, "Online Store," [Online]. Available: www.solelgrossisten.se. [Accessed 28 May 2017].
[79] Solcellsgrossen, "Online Store," [Online]. Available: www.solcellsgrossen.se. [Accessed 28 May 2017].
[80] WattUneed, "Online Store," [Online]. Available: www.wattuneed.com/en. [Accessed 29 May 2017].
[81] Europe Solar Shop, "Online Store," [Online]. Available: www.europe-solarshop.com. [Accessed 29 May 2017].
[82] Kvänums Järn, "Online Store," [Online]. Available: kvanumsjarn.se. [Accessed 29 May 2017].
[83] Webo Solar, "Solar Panel Hanwha Q Cells 330W," [Online]. Available: https://webosolar.com/store/en/index.php?controller=attachment&id_attachment=485. [Accessed 22 May 2017].
[84] Sollcellsgrossen, "Module Sunerg 285W Mono Svart," [Online]. Available: www.solcellsgrossen.se/index.php?route=product/product/download&product_id=202&download_id=30. [Accessed 28 May 2017].
[85] Leonics, "How to Design a Solar PV System," [Online]. Available: http://www.leonics.com/support/article2_12j/articles2_12j_en.php. [Accessed 22 May 2017].
[86] Webo Solar, "Off-grid Inverter Charger Magnum MS4448PAE," [Online]. Available: https://webosolar.com/store/en/index.php?controller=attachment&id_attachment=394. [Accessed 22 May 2017].
[87] Wholesale Solar, "Magnum Energy ME-RTR Router," [Online]. Available: https://pdf.wholesalesolar.com/inverter-accessories/me-rtr-3.1-manual.pdf. [Accessed 22 May 2017].
[88] Wholesale Solar, "Magnum Energy ME-AGS-S Auto Gen Start," [Online]. Available: https://pdf.wholesalesolar.com/inverter%20pdf%20folder/AGS-owners-manual.pdf. [Accessed 22 May 20117].

112
[89] Wholesale Solar, "Magnum Energy ME-BTS-15 Battery Temp Sensor," [Online]. Available: https://www.wholesalesolar.com/9901543/magnum-energy/inverter-accessories/magnum-energy-me-bts-15-battery-temp-sensor. [Accessed 22 May 2017].
[90] Morningstar, "Parallel Charging Using Multiple Controllers With Separate PV Arrays," [Online]. Available: https://www.morningstarcorp.com/parallel-charging-using-multiple-controllers-separate-pv-arrays/. [Accessed 22 May 2017].
[91] Ritar Batteries, "Battery AGM Ritar RA12-100," [Online]. Available: http://www.ritarpower.com/upimg/20151211154018926.pdf. [Accessed 22 May 2017].
[92] Leonics, "Basics of MPPT Solar Charge Controller," [Online]. Available: http://www.leonics.com/support/article2_14j/articles2_14j_en.php##6. [Accessed 22 May 2017].
[93] "Choosing the Right MPPT Solar Charge Controller," [Online]. Available: https://www.civicsolar.com/support/installer/articles/choosing-right-mppt-solar-charge-controller. [Accessed 22 May 2017].
[94] Wholesale Solar, "Battery charger Magnum PT100 MPPT," [Online]. Available: https://www.wholesalesolar.com/cms/four-star-solar-pt-100-pv-center-installation-manual-1974847470.pdf. [Accessed 22 May 2017].
[95] Webo Solar, "Battery Charger Magnum PT100 MPPT," [Online]. Available: http://webosolar.com/store/en/mppt-controllers/1654-magnum-energy-pt-100-mppt-charge-controller.html. [Accessed 17 May 2017].
[96] HESPV, ”How to Wire Solar Panels in Parallel or Series,” [Online]. Available: http://hespv.ca/blog/wire-solar-panels-parallel-vs-series/. [Använd 31 May 2017].
[97] Daewoo Power Products, "GDA8000E Gasoline Generator," [Online]. Available: http://daewoopowerproducts.com/product-detail.php?producto=565. [Accessed 28 May 2017].
[98] Energy Use Calculator, "Calculating Electrical Usage," [Online]. Available: http://energyusecalculator.com/calculate_electrical_usage.htm. [Accessed 29 May 2017].

113
[99] SMA, "Sunny Island 6.0H Battery Inverter," [Online]. Available: http://www.sma.de/en/products/battery-inverters/sunny-island-44m-60h-80h.html. [Accessed 29 May 2017].
[100] SMA, "Sunny Remote Control," [Online]. Available: http://www.sma.de/en/products/battery-inverters/sunny-remote-control.html. [Accessed 29 May 2017].
[101] Pylontech, "US2000B Lithium Battery," [Online]. Available: www.pylontech.com.cn/pro_detail.aspx?id=100&cid=23. [Accessed 29 May 2017].
[102] WattUneed, "Pylontech US2000B Battery Specs," [Online]. Available: https://www.wattuneed.com/en/lithium-batteries-/1927-lihium-battery-pylontech-200-0712971131118.html. [Accessed 29 May 2017].
[103] SMA, "Sunnyboy 4.0 Inverter," [Online]. Available: www.sma.de/en/products/solarinverters/sunny-boy-30-36-40-50.html. [Accessed 29 May 2017].
[104] Kvänums Järn, "Gasoline Generator Genmac Combiplus 11100KE," [Online]. Available: http://kvanumsjarn.se/product.html/genmac-combiplus-11100ke?category_id=27. [Accessed 29 May 2017].
[105] Cooper Bussmann, "Photovoltaic System Overcurrent Protection," [Online]. Available: www1.cooperbussmann.com/pdf/9df1f7ec-8c62-4210-8cf8-9504927394f0.pdf. [Accessed 2 June 2017].
[106] SMA, "Batfuse for Sunny Island Inverters," [Online]. Available: http://files.sma.de/dl/5646/BatFuse-BE-en-30W.pdf. [Accessed 2 June 2017].
[107] SUNAT, Peru National Taxes Superintendency, "Customs Fees per Item Type Search Tool," [Online]. Available: www.aduanet.gob.pe/itarancel/arancelS01Alias. [Accessed 29 May 2017].
[108] SUNAT, Peru National Taxes Superintendency, "Customs," [Online]. Available: www.sunat.gob.pe/orientacionaduanera/aranceles/index.html. [Accessed 29 May 2017].
[109] Blogspot, "Internet Shopping Guide - Calculating Taxes, CIF and FOB," [Online]. Available: http://enviospostales.blogspot.se/. [Accessed 29 May 2017].

114
[110] OSINERGMIN - Peru Supervising Organism of the Energy and Mining Investments, "Facilito - National Fuel Prices Search Tool," [Online]. Available: www.facilito.gob.pe/facilito/pages/facilito/buscadorEESS.jsp. [Accessed 29 May 2017].
[111] OSINERGMIN - Peru Supervising Organism of the Energy and Mining Investments, "Public Electricity Tariffs," [Online]. Available: www2.osinerg.gob.pe/Tarifas/Electricidad/PliegosTarifariosUsuarioFinal.aspx?Id=150000. [Accessed 29 May 2017].
[112] Bensinepriser.se, "Fuel Prices for Filipstad," [Online]. Available: www.bensinpriser.se/v%C3%A4rmlands-l%C3%A4n/filipstad. [Accessed 30 May 2017].
[113] Elskling.se, "Electrical Tariffs for Sweden," [Online]. Available: www.elskling.se. [Accessed 30 May 2017].
[114] PVSyst, "Help Topics: Plane Azimuth," [Online]. Available: http://files.pvsyst.com/help/index.html?plane_azimuth.htm. [Accessed 31 May 2017].
[115] Lifewire, "Definition of Bearing in GPS Navigation," [Online]. Available: https://www.lifewire.com/what-is-bearing-in-gps-1683320. [Accessed 31 May 2017].
[116] Free Map Tools, "Elevation Finder," [Online]. Available: https://www.freemaptools.com/elevation-finder.htm. [Accessed 31 May 2017].
[117] Boulter.com, "Coordinate Distance and Bearing Calculator," [Online]. Available: http://boulter.com/gps/distance/. [Accessed 31 May 2017].
[118] PVSyst, "Help File: Loss of Load Probability," [Online]. Available: http://files.pvsyst.com/help/dimensisole_lol.htm. [Accessed 31 May 2017].
[119] M. Robinson, "Role of Sustainable Energy in Ending Poverty and Advancing Climate Justice," [Online]. Available: https://www.youtube.com/watch?v=LTlfm_jqqUs. [Accessed 31 May 2017].

PO Box 823, SE-301 18 HalmstadPhone: +35 46 16 71 00E-mail: [email protected]
My name is Emiliano Lorenzo, I am anelectronic engineer from Perú with alot of interest in renewable energies.They are the future and I think i cancontribute to have a cleaner, moreenergy efficient world.