Embed Size (px)
Citation preview
11 THE MACROECONOMICS OF
OPEN ECONOMIES
Chapter 31Open-Economy Macroeconomics:
Basic Concepts

Open-Economy Macroeconomics: Basic Concepts
• Open and Closed Economies
• A closed economy is one that does not interact with other economies in the world.
• There are no exports, no imports, and no capital flows.
• An open economy is one that interacts freely with other economies around the world

Open-Economy Macroeconomics: Basic Concepts
• An Open Economy
• An open economy interacts with other countries in two ways.
• It buys and sells goods and services in world product markets.
• It buys and sells capital assets in world financial markets

31.1 The International Flow of Goods and Capital
• An Open Economy
• The United States is a very large and open economy—it imports and exports huge quantities of goods and services.
• Over the past four decades, international trade and finance have become increasingly important.
31.1.1 The Flow of Goods: Exports, Imports, Net Exports
• Exports are goods and services that are produced domestically and sold abroad.
• Imports are goods and services that are produced abroad and sold domestically.
31.1.1 The Flow of Goods: Exports, Imports, Net Exports
• Net exports (NX) are the value of a nation’s exports minus the value of its imports.
• Net exports are also called the trade balance 贸易余额 .
31.1.1 The Flow of Goods: Exports, Imports, Net Exports
• A trade deficit 贸易赤字 is a situation in which net exports (NX) are negative.
• Imports > Exports
• A trade surplus 贸易盈余 is a situation in which net exports (NX) are positive.
• Exports > Imports
• Balanced trade 平衡贸易 refers to when net exports are zero—exports and imports are exactly equal.
31.1.1 The Flow of Goods: Exports, Imports, Net Exports
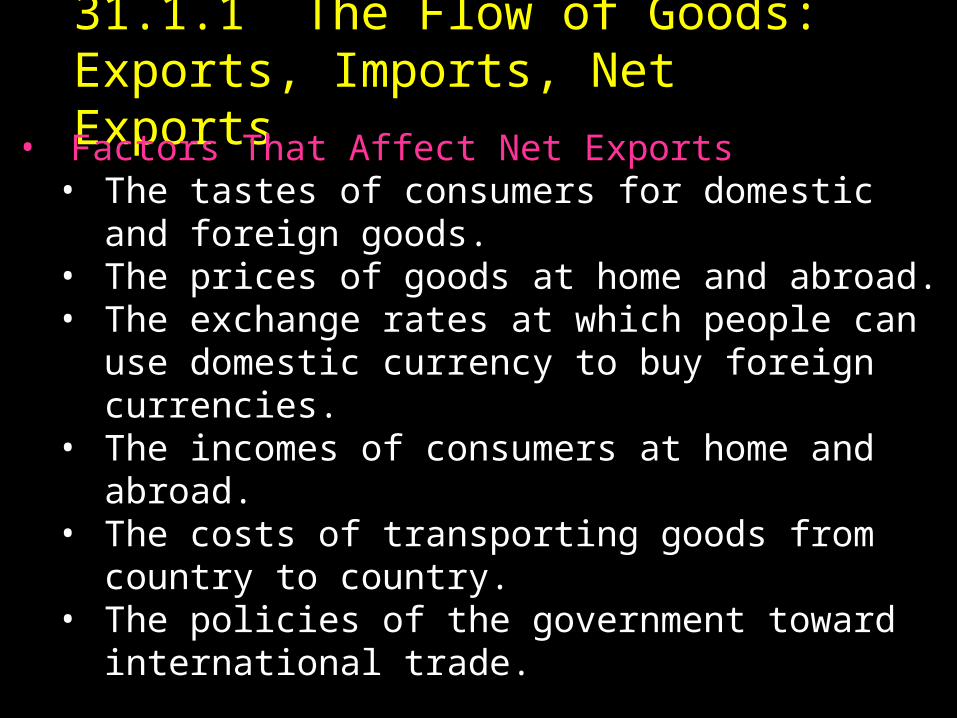
• Factors That Affect Net Exports• The tastes of consumers for domestic and
foreign goods.• The prices of goods at home and abroad.• The exchange rates at which people can use
domestic currency to buy foreign currencies.• The incomes of consumers at home and abroad.• The costs of transporting goods from country to
country.• The policies of the government toward
international trade.

Figure 1 The Internationalization of the U.S. Economy
Percentof GDP
0
5
10
15
1950 1955 1960 1965 1970 1975 1980 19901985 20001995
Exports
Imports

Figure2. The Internationalization of the China Economy
Figure2. 1952-2005中国经济的国际化
0
10
20
30
40
50
60
70
export / GDP export&i mport / GDP
31.1.2 The Flow of Financial Resources: Net Capital Outflow
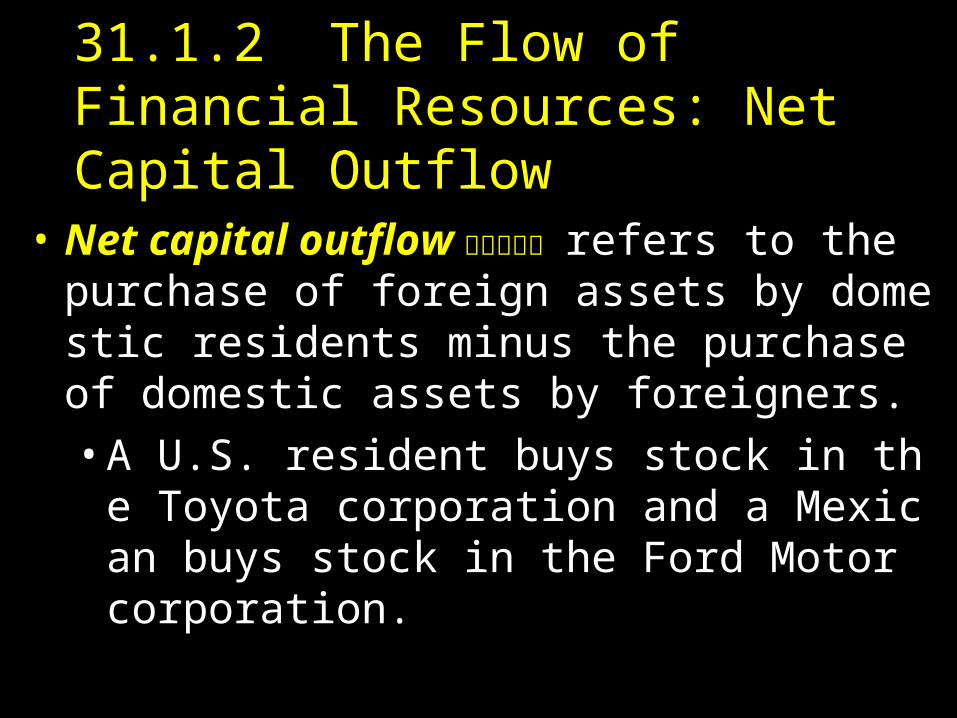
• Net capital outflow 资本净流出 refers to the purchase of foreign assets by domestic residents minus the purchase of domestic assets by foreigners.
• A U.S. resident buys stock in the Toyota corporation and a Mexican buys stock in the Ford Motor corporation.
31.1.2 The Flow of Financial Resources: Net Capital Outflow
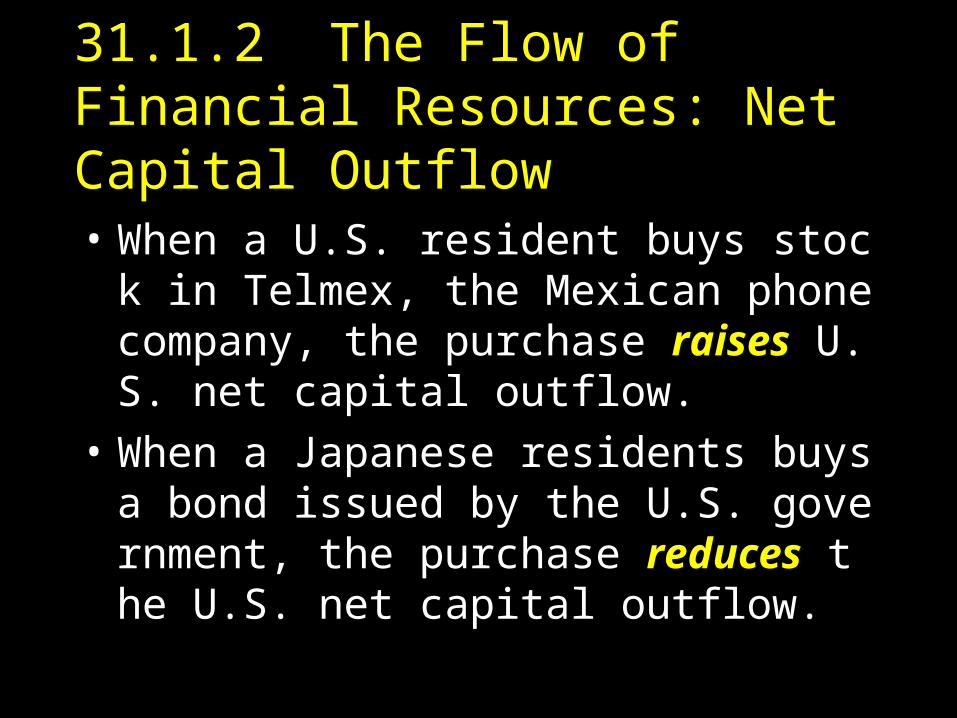
• When a U.S. resident buys stock in Telmex, the Mexican phone company, the purchase raises U.S. net capital outflow.
• When a Japanese residents buys a bond issued by the U.S. government, the purchase reduces the U.S. net capital outflow.

31.1.2 The Flow of Financial Resources: Net Capital Outflow
• Variables that Influence Net Capital Outflow.
• The real interest rates being paid on foreign assets.
• The real interest rates being paid on domestic assets.
• The perceived economic and political risks of holding assets abroad.
• The government policies that affect foreign ownership of domestic assets.
31.1.3 The Equality of Net Exports and Net Capital Outflow
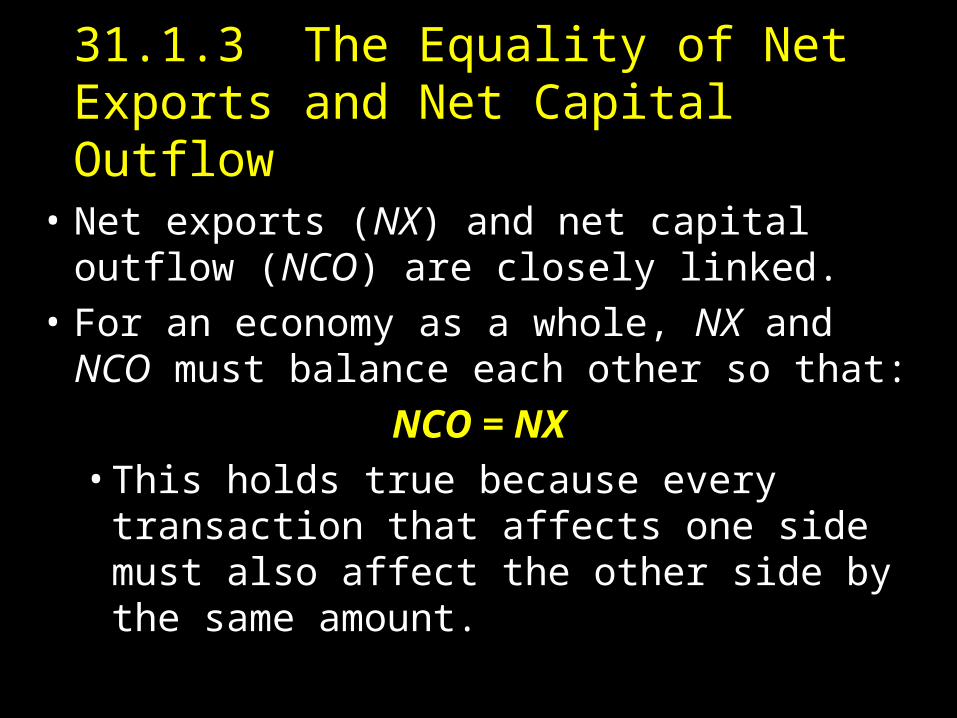
• Net exports (NX) and net capital outflow (NCO) are closely linked.
• For an economy as a whole, NX and NCO must balance each other so that:
NCO = NX
• This holds true because every transaction that affects one side must also affect the other side by the same amount.
31.1.3 The Equality of Net Exports and Net Capital Outflow
• To see why this accounting identity is true, consider an example.Suppose that Boeing, the U.S.aircraft maker, sells some planes to a Japanese airline. In this sale, a U.S.company gives planes to a Japanese company, and a Japanese company gives yen to a U.S. Company. Notice that two things have occurred simultaneously. The U.S. has sold to a foreigner some of its output(the planes), and this sale increases U.S. Net exports. In addition, the U.S. has acquired some foreign assets(the yen), and this acquisition increases U.S. Net capital outflow.
31.1.3 The Equality of Net Exports and Net Capital Outflow
• The equality of net exports and net capital outflow follows from the fact that every international transaction is an exchange. When a seller country transfers a good or service to a buyer country, the buyer country gives up some asset to pay for this good or service. The value of that asset equals the value of the good or service sold. When we add everything up, the net value of goods and services sold by a country (NX) must equal the net value of assets acquired(NCO). The international flow of goods and services and the international flow of capital are two sides of the same coin.

31.1.4 Saving, Investment, and Their Relationship to the International Flows
• Net exports is a component of GDP:
Y = C + I + G + NX
• National saving is the income of the nation that is left after paying for current consumption and government purchases:
Y - C - G = I + NX
31.1.4 Saving, Investment, and Their Relationship to the International Flows
• National saving (S) equals Y - C - G so:S = I + NX
orS = I + NCO
Saving = Domestic Investment + Net Capital Outflow• This equation shows that a nation’s saving must eq
ual its domestic investment plus its net capital outflow. In other words, when Chinese citizens save a dollar of their income for the future, that dollar can be used of finance accumulation of domestic capital or it can be used to finance the purchase of capital abroad.

Figure 2 National Saving, Domestic Investment, and Net Foreign Investment
Percentof GDP
20
18
16
14
12
101960 1965 199519901985198019751970
(a) National Saving and Domestic Investment (as a percentage of GDP)
2000
Domestic investment
National saving

Figure 2 National Saving, Domestic Investment, and Net Foreign Investment
Percentof GDP
4
–4
–3
–2
–1
0
1
2
3
Net capitaloutflow
(b) Net Capital Outflow (as a percentage of GDP)
1960 1965 199519901985198019751970 2000
31.1.5 Summing Up• Consider first a country with a trade surplus. By
definition, a trade surplus means that the value of exports exceeds the value of imports. Because net exports are exports minus imports, net exports(NX) are greater than zero. As a result, income(Y=C+I+G +NX) must be greater than domestic spending (C+I+G). But if Y is more than C+I+G, then(Y-C-G) must be more than I. That is, saving (S=Y-C-G) must exceed investment. Because the country is saving more than it is investing, it must be sending some of its saving abroad. That is, the net capital outflow must be greater than zero.
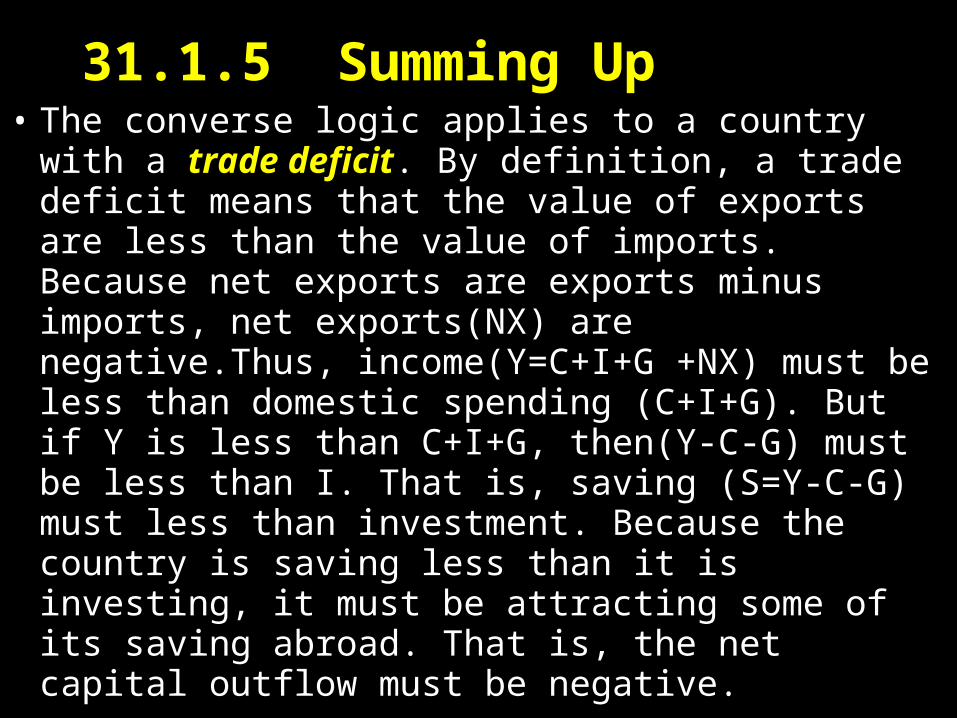
31.1.5 Summing Up• The converse logic applies to a country with a trade
deficit. By definition, a trade deficit means that the value of exports are less than the value of imports. Because net exports are exports minus imports, net exports(NX) are negative.Thus, income(Y=C+I+G +NX) must be less than domestic spending (C+I+G). But if Y is less than C+I+G, then(Y-C-G) must be less than I. That is, saving (S=Y-C-G) must less than investment. Because the country is saving less than it is investing, it must be attracting some of its saving abroad. That is, the net capital outflow must be negative.

31.1.5 Summing Up
Trade Deficit Balanced Trade Trade Surplus
Exports < Imports Exports = Imports Exports > Imports
Net txports < 0 Net txports = 0 Net txports > 0
Y < C + I + G Y = C + I + G Y > C + I + G
Saving < Investment Saving = Investment Saving > Investment
Net capital outflow < 0 Net capital outflow = 0 Net capital outflow > 0
Table 1 International Flows of Goods and Capital: SummaryThis table shows the three possible outcomes for an open economy.
(Source:Mankiw, Priciples of Economics, chapter31, p683.)

31.2 The Prices for International Transactions: Real and Nominal
Exchange Rates• International transactions are influenced by
international prices.
• The two most important international prices are the nominal exchange rate and the real exchange rate.
31.2.1 Nominal Exchange Rates
• The nominal exchange rate is the rate at which a person can trade the currency of one country for the currency of another.
• The nominal exchange rate is expressed in two ways:
– In units of foreign currency per one U.S. dollar.
– And in units of U.S. dollars per one unit of the foreign currency.
31.2.1 Nominal Exchange Rates
• Assume the exchange rate between the Japanese yen and U.S. dollar is 80 yen to one dollar.
• One U.S. dollar trades for 80 yen.
• One yen trades for 1/80 (= 0.0125) of a dollar.

31.2.1 Nominal Exchange Rates• If the exchange rate changes so that a dollar buys
more foreign currency, that change is called an appreciation of the dollar.
• Appreciation refers to an increase in the value of a currency as measured by the amount of foreign currency it can buy.
• If the exchange rate changes so that a dollar buys less foreign currency, that change is called an depreciation of the dollar.
• Depreciation refers to a decrease in the value of a currency as measured by the amount of foreign currency it can buy.

31.2.1 Nominal Exchange Rates
• If a dollar buys more foreign currency, there is an appreciation of the dollar.
• If it buys less there is a depreciation of the dollar.
31.2.2 Real Exchange Rates
• The real exchange rate is the rate at which a person can trade the goods and services of one country for the goods and services of another.
• If a case of German beer is twice as expensive as American beer, the real exchange rate is 1/2 case of German beer per case of American beer.

31.2.2 Real Exchange Rates
• The real exchange rate compares the prices of domestic goods and foreign goods in the domestic economy.
• The real exchange rate depends on the nominal exchange rate and the prices of goods in the two countries measured in local currencies.

31.2.2 Real Exchange Rates
• Suppose that a bushel of American rice sells for $100, and a bushel of Japanese rice sell $16,000 yen. What is the real exchange rate between American and Japanese rice?
• Bushel: measure for grain and fruit (8 gallons or about 36.4 litres)

31.2.2 Real Exchange Rates• The real exchange rate is a key determinant of how
much a country exports and imports.
Foreign PriceReal exchange rate=
Nominal exchange rate Domestic price
16,000 yen per bushel of Japanese riceReal exchange rate=
(80 yen per dollar)($100per bushel of American rice)
16,000 yen per bushel of Japanese rice=
8000 yen per bushel of American rice
= 1/2 bushel of Japanese rice per bushel of American rice.

31.2.2 Real Exchange Rates
• A depreciation (fall) in the U.S. real exchange rate means that U.S. goods have become cheaper relative to foreign goods.
• This encourages consumers both at home and abroad to buy more U.S. goods and fewer goods from other countries.

31.2.2 Real Exchange Rates
• As a result, U.S. exports rise, and U.S. imports fall, and both of these changes raise U.S. net exports.
• Conversely, an appreciation in the U.S. real exchange rate means that U.S. goods have become more expensive compared to foreign goods, so U.S. net exports fall.

Foreignexchangereserves(100 millionUSD)
Foreignexchangerates (Yuanper USDollar) , (PeriodAverage)
流通中现金Currency incirculation(M0),(Unit:100MillionYuan)
货币Money(M1),(Unit:100MillionYuan)
货币和准货币Money& Quasimoney(M2),(Unit:100MillionYuan)
2003. 12 4032. 51 8. 277 19746. 23 84118. 81 219226. 81
2004. 12 6099. 32 8. 2765 21468. 3 95970. 82 253207. 7
2005. 1 6236. 46 8. 2765 24015. 41 97079. 03 257708. 47
2005. 12 8188. 72 8. 0759 24031. 67 107278. 57 298755. 48
2006. 1 8451. 8 8. 0668 29310. 37 107250. 68 303571. 65
2006. 12 10663. 44 7. 8238 27072. 62 126028. 05 345577. 91
2007. 1 11046. 92 7. 7898 27949. 13 128484. 06 351498. 77
2007. 12 15282. 49 7. 3676 30334. 32 152519. 17 403401. 3
2008. 1 15898. 1 7. 2478 36673. 15 154872. 59 417846. 17
2008. 3 16821. 77 7. 0752 30433. 07 150867. 47 423054. 53
Source: 中国人民银行(www.pbc.gov.cn/diaochatongji/tongjishuju/gofile.asp?file=2008S08.htm)

3个月 6个月 1年 2年 3年 5年
1990.04.15 2.88 6.3 7.74 10.08 10.98 11.88 13.68
1990.08.21 2.16 4.32 6.48 8.64 9.36 10.08 11.52
1991.04.21 1.8 3.24 5.4 7.56 7.92 8.28 9
1993.05.15 2.16 4.86 7.2 9.18 9.9 10.8 12.06
1993.07.11 3.15 6.66 9 10.98 11.7 12.24 13.86
1996.05.01 2.97 4.86 7.2 9.18 9.9 10.8 12.06
1996.08.23 1.98 3.33 5.4 7.47 7.92 8.28 9
1997.10.23 1.71 2.88 4.14 5.67 5.94 6.21 6.66
1998.03.25 1.71 2.88 4.14 5.22 5.58 6.21 6.66
1998.07.01 1.44 2.79 3.96 4.77 4.86 4.95 5.22
1998.12.07 1.44 2.79 3.33 3.78 3.96 4.14 4.5
1999.06.10 0.99 1.98 2.16 2.25 2.43 2.7 2.88
2002.02.21 0.72 1.71 1.89 1.98 2.25 2.52 2.79
2004.10.29 0.72 1.71 2.07 2.25 2.7 3.24 3.6
2006.08.19 0.72 1.8 2.25 2.52 3.06 3.69 4.14
2007.03.18 0.72 1.98 2.43 2.79 3.33 3.96 4.41
2007.05.19 0.72 2.07 2.61 3.06 3.69 4.41 4.95
2007.07.21 0.81 2.34 2.88 3.33 3.96 4.68 5.22
2007.08.22 0.81 2.61 3.15 3.6 4.23 4.95 5.49
2007.09.15 0.81 2.88 3.42 3.87 4.5 5.22 5.76
2007.12.21 0.72 3.33 3.78 4.14 4.68 5.4 5.85
source: 中国人民银行http://www.pbc.gov.cn/detail.asp?col=462&ID=1902
Table1: 金融机构人民币存款基准利率(单位:年利率%)
定期调整时间 活期

调整时间 6个月 1年 1—3 ( )年 含 3—5 ( )年 含 5年以上
1991. 04. 21 8. 1 8. 64 9 9. 54 9. 72
1993. 05. 15 8. 82 9. 36 10. 8 12. 06 12. 24
1993. 07. 11 9 10. 98 12. 24 13. 86 14. 04
1995. 01. 01 9 10. 98 12. 96 14. 58 14. 76
1995. 07. 01 10. 08 12. 06 13. 5 15. 12 15. 3
1996. 05. 01 9. 72 10. 98 13. 14 14. 94 15. 12
1996. 08. 23 9. 18 10. 08 10. 98 11. 7 12. 42
1997. 10. 23 7. 65 8. 64 9. 36 9. 9 10. 53
1998. 03. 25 7. 02 7. 92 9 9. 72 10. 35
1998. 07. 01 6. 57 6. 93 7. 11 7. 65 8. 01
1998. 12. 07 6. 12 6. 39 6. 66 7. 2 7. 56
1999. 06. 10 5. 58 5. 85 5. 94 6. 03 6. 21
2002. 02. 21 5. 04 5. 31 5. 49 5. 58 5. 76
2004. 10. 29 5. 22 5. 58 5. 76 5. 85 6. 12
2006. 04. 28 5. 4 5. 85 6. 03 6. 12 6. 39
2006. 08. 19 5. 58 6. 12 6. 3 6. 48 6. 84
2007. 03. 18 5. 67 6. 39 6. 57 6. 75 7. 11
2007. 05. 19 5. 85 6. 57 6. 75 6. 93 7. 2
2007. 07. 21 6. 03 6. 84 7. 02 7. 2 7. 38
2007. 07. 21 6. 03 6. 84 7. 02 7. 2 7. 38
2007. 07. 21 6. 03 6. 84 7. 02 7. 2 7. 38
2007. 08. 22 6. 21 7. 02 7. 2 7. 38 7. 56
2007. 09. 15 6. 48 7. 29 7. 47 7. 65 7. 83
2007. 12. 21 6. 57 7. 47 7. 56 7. 74 7. 83
Table2: 金融机构人民币贷款基准利率(单位:年利率%)
Source: 中国人民银行http://www.pbc.gov.cn/detail.asp?col=462&ID=1903

1985 年 统一为 10%
1987 年 从 10% 上调为 12%
1988 年 从 12% 上调为 13%
1998 年 3 月 21 日 从 12% 下调为 8%
1999 年 11 月 21 日 从 8% 下调为 6%
2003 年 9 月 21 日 从 6% 上调为 7%
2004 年 4 月 25 日 从 7% 上调为 7.5%
2006 年 7 月 5 日 从 7.5% 上调为 8%
2006 年 8 月 15 日 从 8% 上调为 8.5%
2006 年 11 月 15 日 从 8.5% 上调为 9%
2007 年 1 月 15 日 从 9% 上调为 9.5%
2007 年 2 月 25 日 从 9.5 %上调为 10 %2007 年 4 月 16 日 从 10 %上调为 10.5 %2007 年 5 月 15 日 从 10.5 %上调为 11 %2007 年 6 月 5 从 11 %上调为 11.5 %

31.3 A FIRST THEORY OF EXCHANGE-RATE
DETERMINATION: PURCHASING-POWER PARITY
• The purchasing-power parity theory is the simplest and most widely accepted theory explaining the variation of currency exchange rates.
• Purchasing-power parity is a theory of exchange rates whereby a unit of any given currency should be able to buy the same quantity of goods in all countries.

31.3.1 The Basic Logic of Purchasing-Power Parity
• The theory of purchasing-power parity is based on a principle called the law of one price. This law asserts that a good must sell for the same price in all locations.

31.3.1 The Basic Logic of Purchasing-Power Parity
• If the law of one price were not true, unexploited profit opportunities would exist.
• The process of taking advantage of differences in prices in different markets is called arbitrage 套利 .

31.3.1 The Basic Logic of Purchasing-Power Parity
• If arbitrage occurs, eventually prices that differed in two markets would necessarily converge.
• According to the theory of purchasing-power parity, a currency must have the same purchasing power in all countries and exchange rates move to ensure that.

31.3.2 Implications of Purchasing-Power Parity• Suppose that P is the price of a basket of goods in
the US. (measured in dollars), P* is the price of a basket of goods in Japan (measured in yen), and e is the nominal exchange rate (the number of yen a dollar can buy). Now consider the quantity of goods a dollar can buy at home and abroad. At home, the price level is P, so the purchasing power of $1 at home is 1/P. Abroad, a dollar can be exchanged into e units of foreign currency, which in turn have purchasing power e/P*. For the purchasing power of a dollar to be the same in the two countries, it must be the case that
1/ P = e / P*

31.3.2 Implications of Purchasing-Power Parity
1/ P = e /P*
• With rearrangement, this equation becomes
1 = eP / P*
• Notice that the left-hand side of this equation is a constant, and the right-hand side is the real exchange rate. Thus, If the purchasing power of the dollar is always the same at home and abroad, then the exchange rate----the relative price of domestic and foreign goods---- cannot change.

31.3.2 Implications of Purchasing-Power Parity
1 = eP / P*We can rearrange the equation to solve for the nomin
al exchange rate:e = P* / P
• That is, the nominal exchange rate equals the ratio of the foreign price level (measured in units of the foreign currency) to the domestic price level (measured in units of the domestic currency). According to the theory of purchasing-power parity, the nominal exchange rate between the currencies of two countries must reflect the different price levels in those countries.

31.3.2 Implications of Purchasing-Power Parity
• A key implication of this theory is that nominal exchange rates change when price levels change. The price level in any country adjusts to bring the quantity of money supplied and the quantity of money demanded into balance.
• When the central bank prints large quantities of money, the money loses value both in terms of the goods and services it can buy and in terms of the amount of other currencies it can buy.

Figure 3 Money, Prices, and the Nominal Exchange Rate During the German Hyperinflation
10,000,000,000
1,000,000,000,000,000
100,000
1
.00001
.00000000011921 1922 1923 1924
Exchange rate
Money supply
Price level
1925
Indexes(Jan. 1921 5 100)
31.3.3 Limitations of Purchasing-Power Parity
• Purchasing power provides a simple model of how exchange rates are determined.
• Yet the theory of purchasing-power parity is not completely accurate. That is, exchange rates do not always move to ensure that a dollar has the same real value in all countries all the time.There are two reasons why the theory of purchasing-power parity does not always hold in practice.

31.3.3 Limitations of Purchasing-Power Parity
1) The first reason is that many goods are not easily traded or shipped from one country to another.
2) The second reason that purchasing-power parity does not always hold is that even tradable goods are not always perfect substitutes when they are produced in different countries.
– Eg. some consumers prefer German cars, and others prefer American cars. Moreover, consumer tastes can change over time.
Summary
• Net exports are the value of domestic goods and services sold abroad minus the value of foreign goods and services sold domestically.
• Net capital outflow is the acquisition of foreign assets by domestic residents minus the acquisition of domestic assets by foreigners

Summary
• An economy’s net capital outflow always equals its net exports.
• An economy’s saving can be used to either finance investment at home or to buy assets abroad.
Summary
• The nominal exchange rate is the relative price of the currency of two countries.
• The real exchange rate is the relative price of the goods and services of two countries.

Summary
• When the nominal exchange rate changes so that each dollar buys more foreign currency, the dollar is said to appreciate or strengthen.
• When the nominal exchange rate changes so that each dollar buys less foreign currency, the dollar is said to depreciate or weaken.

Summary
• According to the theory of purchasing-power parity, a unit of currency should buy the same quantity of goods in all countries.
• The nominal exchange rate between the currencies of two countries should reflect the countries’ price levels in those countries.

Mankiw - ch31
Questions for Review

1.Define net exports and net capital outflow. Explain how and why they are related. (Mankiw,3rd edition, p676,678,680)
2. Explain the relationship among saving, investment, and net capital outflow.(Mankiw,3rd edition, p681-682.)
3.What are nominal exchange rate and real exchange rates?
3. 如果日本汽车价格为 50万日元,一辆类似的美国汽车价格为 l万美元,而且,如果 1美元可以兑换 lO0日元,名义汇率与实际汇率是多少?
4. Describe the economic logic behind the theory of purchasing-powering parity.(Mankiw,3rd edition, p689)
5. 如果美联储开始大量印发美元, 1美元所能购买的日元数量会有什么变化?