Embed Size (px)
Citation preview
11th European AIDS Conference
Madrid, SpainOctober 24-27, 2007

Treatment of ARV-Naïve Patients
Richard Elion MD
George Washington University School of Medicine
Washington, DC
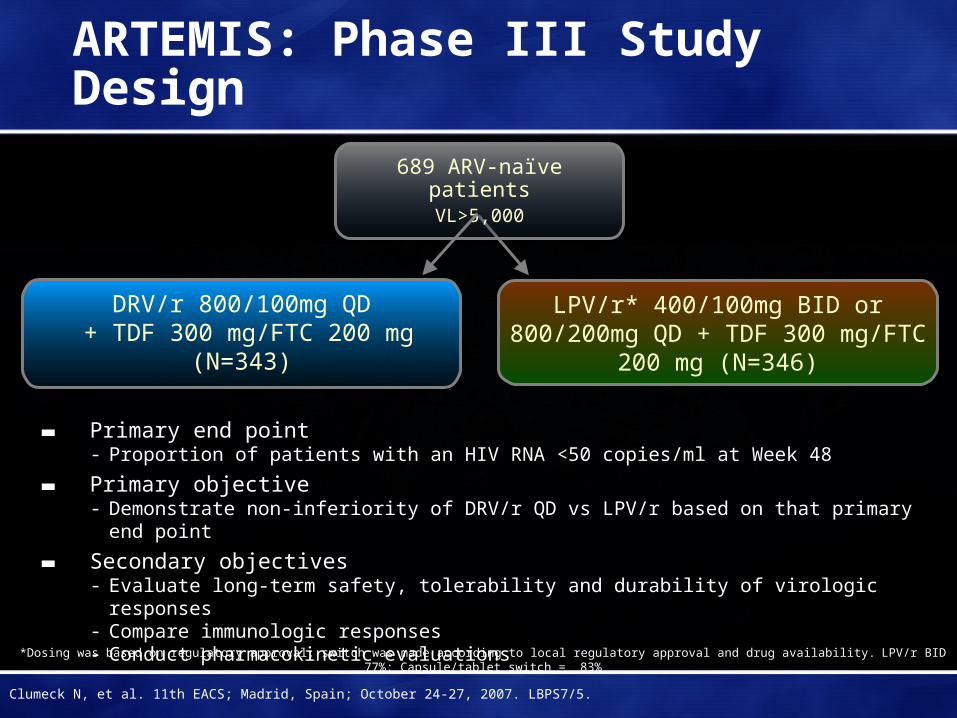
ARTEMIS: Phase III Study Design
▬ Primary end point- Proportion of patients with an HIV RNA <50 copies/ml at Week 48
▬ Primary objective- Demonstrate non-inferiority of DRV/r QD vs LPV/r based on that primary end point
▬ Secondary objectives- Evaluate long-term safety, tolerability and durability of virologic responses- Compare immunologic responses- Conduct pharmacokinetic evaluations
DRV/r 800/100mg QD + TDF 300 mg/FTC 200 mg
(N=343)
DRV/r 800/100mg QD + TDF 300 mg/FTC 200 mg
(N=343)
LPV/r* 400/100mg BID or 800/200mg QD + TDF 300 mg/FTC 200 mg
(N=346)
689 ARV-naïve patientsVL>5,000
*Dosing was based on regulatory approval; switch was made according to local regulatory approval and drug availability. LPV/r BID 77%; Capsule/tablet switch = 83%
Clumeck N, et al. 11th EACS; Madrid, Spain; October 24-27, 2007. LBPS7/5.
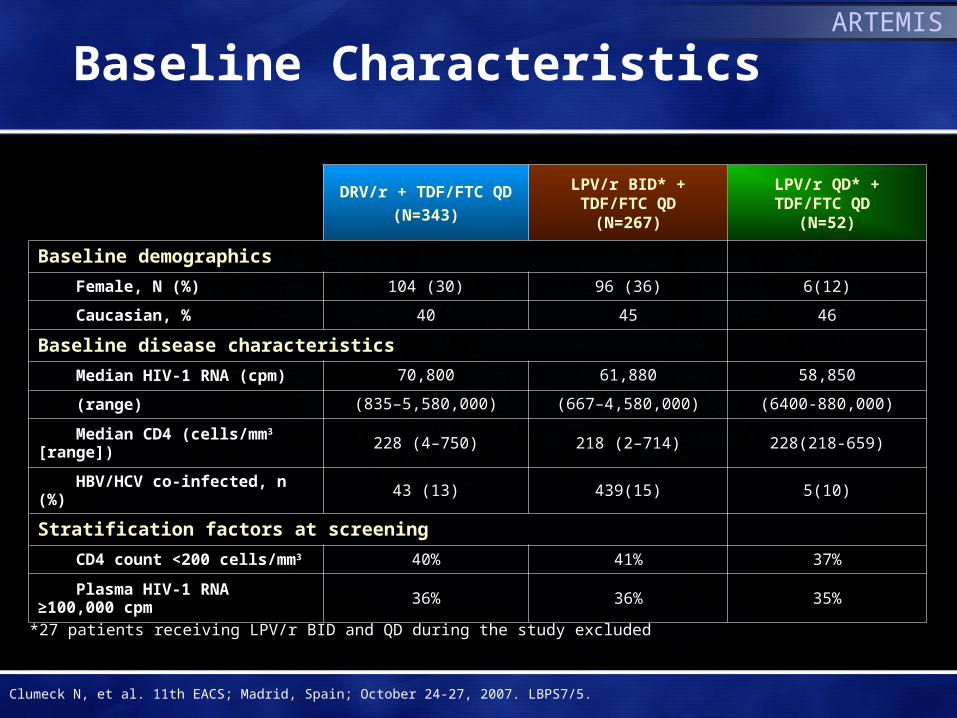
Baseline Characteristics
DRV/r + TDF/FTC QD
(N=343)
LPV/r BID* +TDF/FTC QD
(N=267)
LPV/r QD* +TDF/FTC QD
(N=52)
Baseline demographics
Female, N (%) 104 (30) 96 (36) 6(12)
Caucasian, % 40 45 46
Baseline disease characteristics
Median HIV-1 RNA (cpm) 70,800 61,880 58,850
(range) (835–5,580,000) (667–4,580,000) (6400-880,000)
Median CD4 (cells/mm3 [range]) 228 (4–750) 218 (2–714) 228(218-659)
HBV/HCV co-infected, n (%) 43 (13) 439(15) 5(10)
Stratification factors at screening
CD4 count <200 cells/mm3 40% 41% 37%
Plasma HIV-1 RNA ≥100,000 cpm 36% 36% 35%
*27 patients receiving LPV/r BID and QD during the study excluded
Clumeck N, et al. 11th EACS; Madrid, Spain; October 24-27, 2007. LBPS7/5.
ARTEMIS
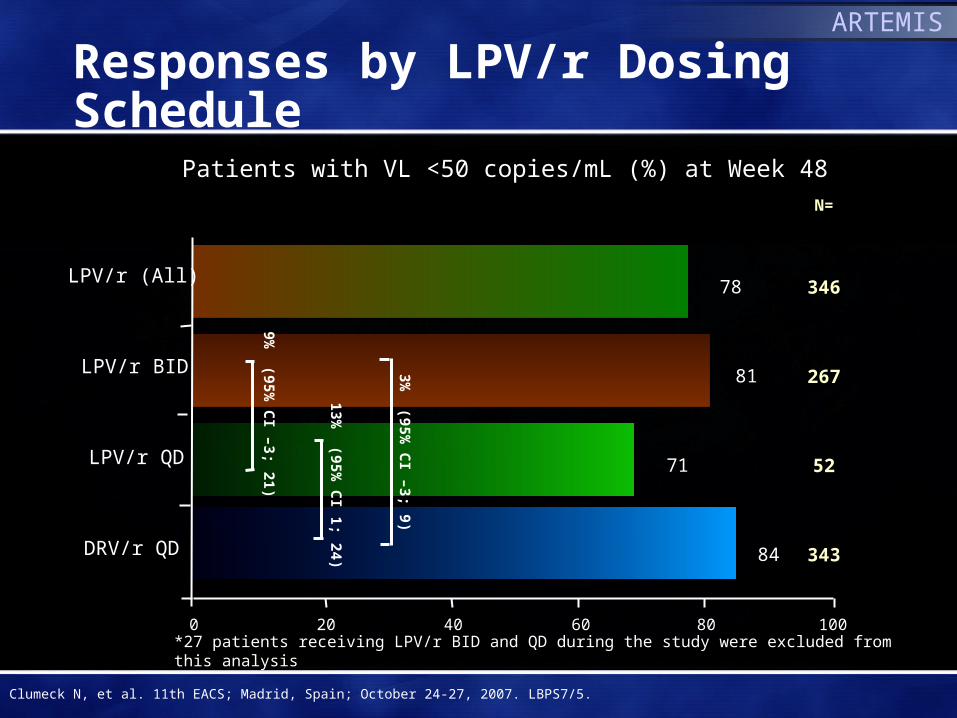
Responses by LPV/r Dosing Schedule
*27 patients receiving LPV/r BID and QD during the study were excluded from this analysis
0 20 40 60 80 100
Patients with VL <50 copies/mL (%) at Week 48
DRV/r QD 84
LPV/r (All)78
LPV/r BID 81
LPV/r QD 71
343
346
267
52
N=
3% (95%
CI –3; 9)
13% (95%
CI 1; 24)
9% (95%
CI –3; 21)
Clumeck N, et al. 11th EACS; Madrid, Spain; October 24-27, 2007. LBPS7/5.
ARTEMIS

Week 48 Response by Baseline Viral Load
†27 patients receiving LPV/r BID and QD during the study were excluded from this analysis
86
7985
Baseline viral load <100,000 copies/mL
0
20
40
60
80
100
Pat
ient
s w
ith V
L <
50 c
opie
s/m
L (%
)
86
79
67 71
56
N = 226 175 34 226 120 92 18 117
0
20
40
60
80
100
Pat
ient
s w
ith V
L <
50 c
opie
s/m
L (%
)
DRV/r QD
LPV/r (All)
LPV/rBID†
LPV/rQD†
DRV/r QD
LPV/r(All)
LPV/rBID†
LPV/rQD†
Baseline viral load ≥100,000 copies/mL
P<0.05
P<0.05
Clumeck N, et al. 11th EACS; Madrid, Spain; October 24-27, 2007. LBPS7/5.
ARTEMIS

Virologic Failure and Resistance
DRV/r QD† (343) LPV/r† All (346) LPV/r† BID (267) LPV/r† QD (52)
VF >50 c/mL 34 (10%) 49 (14%) 31 (12%) 10 (19%)
Paired baseline & VF genotype available
10 18 11 4
IAS USA PI RAMS 0 1* 1* 0
IAS USA NRTI RAMS 1‡ 2‡ 1‡ 1‡
VF by TLOVR non-VF censored (at any time, regardless of reason for discontinuation) †All given with TDF/FTC QD*A71T, V77I‡M184V or M184I/V
Clumeck N, et al. 11th EACS; Madrid, Spain; October 24-27, 2007. LBPS7/5.
ARTEMIS
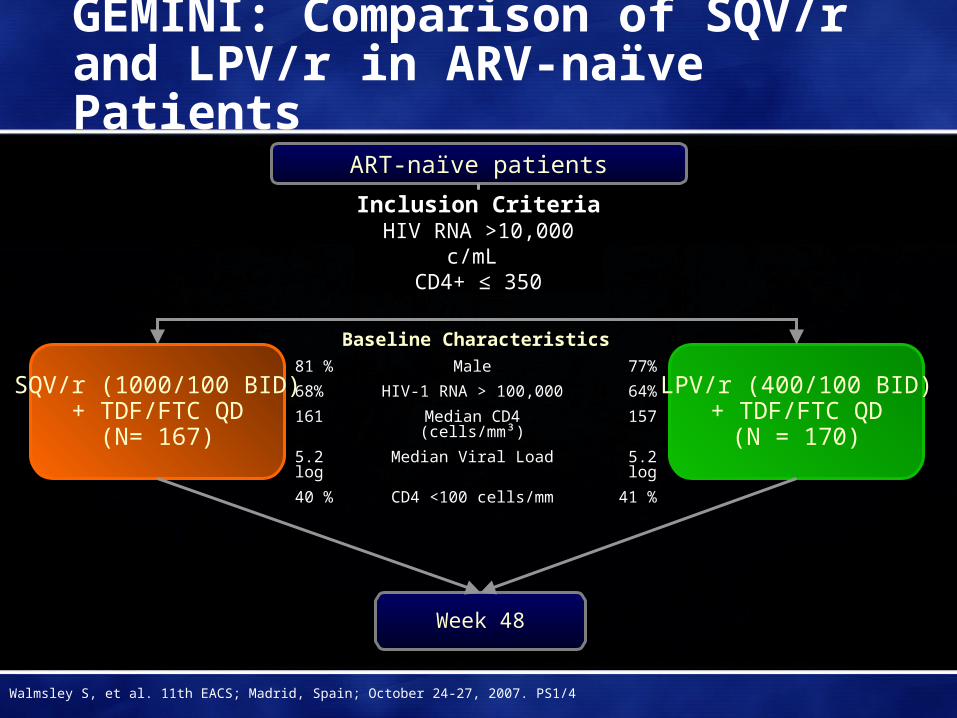
Week 48
LPV/r (400/100 BID)+ TDF/FTC QD
(N = 170)
ART-naïve patients
SQV/r (1000/100 BID)+ TDF/FTC QD
(N= 167)
GEMINI: Comparison of SQV/r and LPV/r in ARV-naïve Patients
Baseline Characteristics81 % Male 77%
68% HIV-1 RNA > 100,000 64%
161 Median CD4 (cells/mm³) 157
5.2 log Median Viral Load 5.2 log
40 % CD4 <100 cells/mm 41 %
Inclusion CriteriaHIV RNA >10,000 c/mL
CD4+ ≤ 350
Walmsley S, et al. 11th EACS; Madrid, Spain; October 24-27, 2007. PS1/4

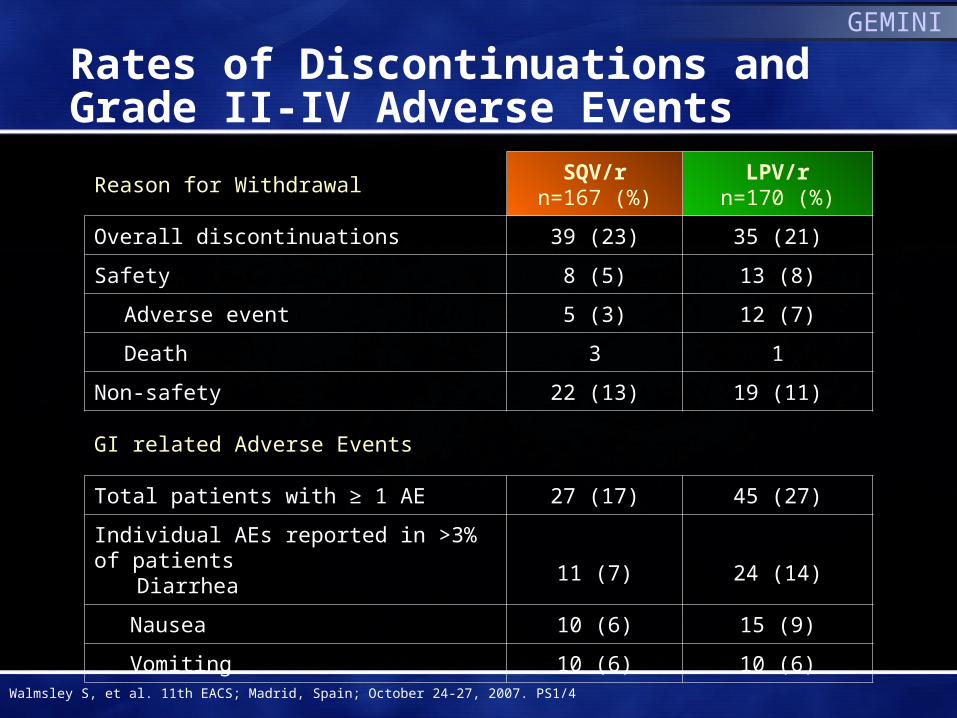
Rates of Discontinuations and Grade II-IV Adverse Events
Reason for WithdrawalSQV/r
n=167 (%)LPV/r
n=170 (%)
Overall discontinuations 39 (23) 35 (21)
Safety 8 (5) 13 (8)
Adverse event 5 (3) 12 (7)
Death 3 1
Non-safety 22 (13) 19 (11)
GI related Adverse Events
Total patients with ≥ 1 AE 27 (17) 45 (27)
Individual AEs reported in >3% of patients Diarrhea 11 (7) 24 (14)
Nausea 10 (6) 15 (9)
Vomiting 10 (6) 10 (6)
Walmsley S, et al. 11th EACS; Madrid, Spain; October 24-27, 2007. PS1/4
GEMINI
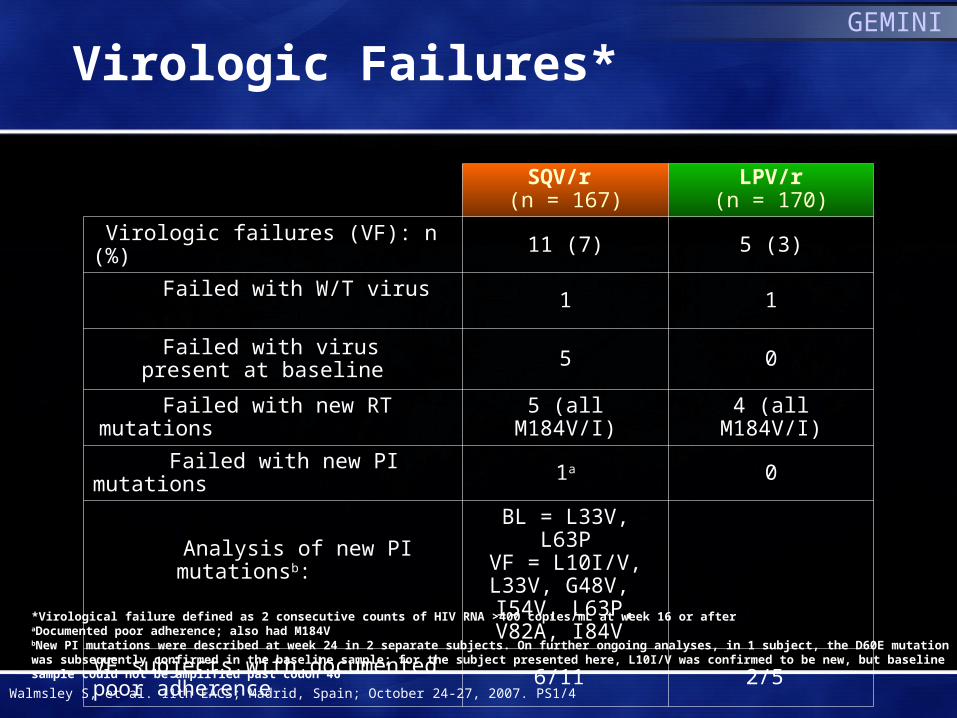
Virologic Failures*
SQV/r (n = 167)
LPV/r(n = 170)
Virologic failures (VF): n (%) 11 (7) 5 (3)
Failed with W/T virus 1 1
Failed with virus present at baseline 5 0
Failed with new RT mutations 5 (all M184V/I) 4 (all M184V/I)
Failed with new PI mutations 1a 0
Analysis of new PI mutationsb:
BL = L33V, L63PVF = L10I/V,
L33V, G48V, I54V, L63P, V82A, I84V
VF subjects with documented poor adherence 6/11 2/5
*Virological failure defined as 2 consecutive counts of HIV RNA >400 copies/mL at week 16 or afteraDocumented poor adherence; also had M184VbNew PI mutations were described at week 24 in 2 separate subjects. On further ongoing analyses, in 1 subject, the D60E mutation was subsequently confirmed in the baseline sample; for the subject presented here, L10I/V was confirmed to be new, but baseline sample could not be amplified past codon 46
Walmsley S, et al. 11th EACS; Madrid, Spain; October 24-27, 2007. PS1/4
GEMINI

Baton Study: ATV/r + TDF/FTC
Single-arm, open-label, multicenter, prospective trialEntry criteria: HIV+ adult, ARV-naïve, plasma HIV RNA 1000 copies/mL, 40-60% HIV RNA ≥100,000 c/mL, GFR > 50
ml/min (CG)
Primary analysis at week 48 < 50 c/mlSecondary Analysis:< 400 c/ml, CD4 ∆, development of resistance
ATV 300 mg/RTV 100 mg + TDF/FTC FDC QD with food(N = 100)
Elion R, et al. 11th EACS; Madrid, Spain; October 24-27, 2007. P7.3/20
Baseline Characteristics
Male 82%
Caucasian 58%
Age (Median) 39
Median CD4 (cells/mm³) 256
Median Viral Load (log10 copies/mL ) 4.8

Disposition of Patients
Number of patients enrolled 102
Number of patients who received study medication 100
Number of patients who discontinued early 17
Reasons for study drug discontinuation,
Safety or tolerability reasons (1 patient each)
- Tuberculosis, hepatitis, hyperbilirubinemia, maculo-papular rash, lactic acidosis, increase in Scr (Grade 2) 6
Lost to follow-up 5
Withdrew consent 3
Investigator discretion 2
Subject returned study drug (never dosed) 1Deaths (1 patient each) Multi-organ failure (not study drug-related; secondary to
non-Hodgkin’s lymphoma); lactic acidosis (study drug-related)2
BATON
Elion R, et al. 11th EACS; Madrid, Spain; October 24-27, 2007. P7.3/20

Efficacy and Resistance
Median CD4+ ∆: 217 cells/mm3
Resistance
• Baseline: Thymidine analogue mutations (TAMs) in 4 pts M41L, T215 reversions (T215D/E) and K219R mutations
• Virologic failure: 5 pts, 1 with M184V; No ATV- or TDF-related mutations
Note: All ATV Ctroughs exceeded values associated with greater virologic response (Ctrough >150ng/mL)Elion R, et al. 11th EACS; Madrid, Spain; October 24-27, 2007. P7.3/20
BATON
0 4 12 24 36 48
20
100
60
40
N=100 98 92 88 87 86Study Week
80
0
<50 c/mL<400 c/mL
Per
cent
age
of P
atie
nts
84%
81%
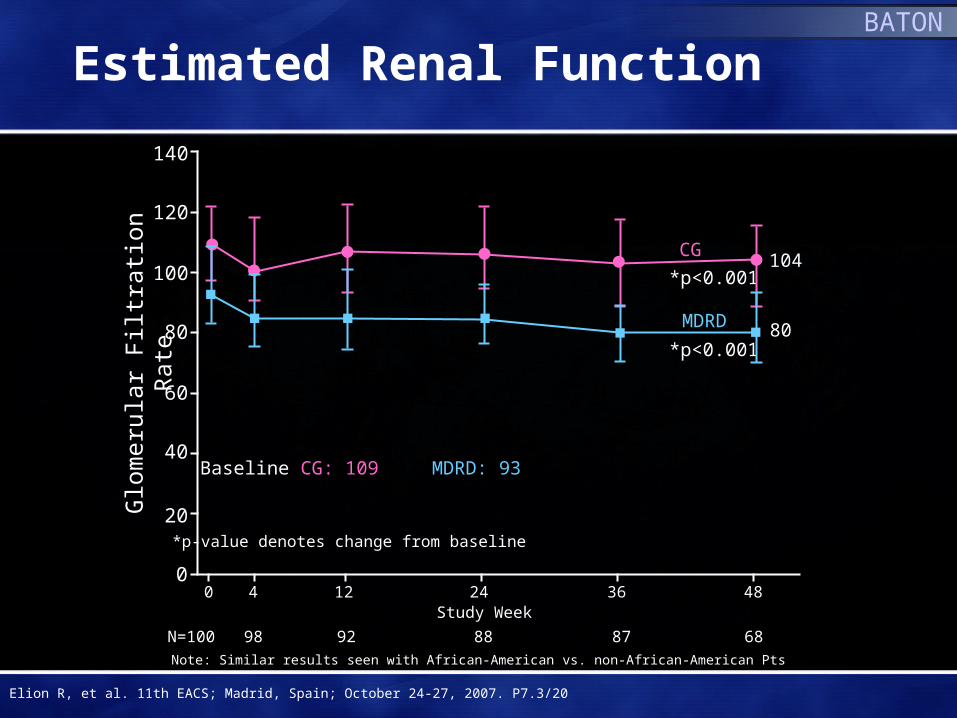
Estimated Renal FunctionBATON
*p-value denotes change from baseline
Glo
mer
ular
Filt
ratio
n R
ate
Elion R, et al. 11th EACS; Madrid, Spain; October 24-27, 2007. P7.3/20
Baseline CG: 109 MDRD: 93
*p<0.001
*p<0.001
MDRD
CG
80
104
0 4 12 24 36 480
N=100 98 92 88 87 68
Study Week
20
40
60
80
100
120
140
Note: Similar results seen with African-American vs. non-African-American Pts

48-Week Fasting Lipids withATV/r + TDF/FTC
Med
ian
Cha
nge
fro
m B
asel
ine
(mg/
dL)
11
32
5
-5
0
5
10
15
20
25
Total Cholesterol HDL Cholesterol LDL Cholesterol Triglycerides
Elion R, et al. 11th EACS; Madrid, Spain; October 24-27, 2007. P7.3/20
BATON
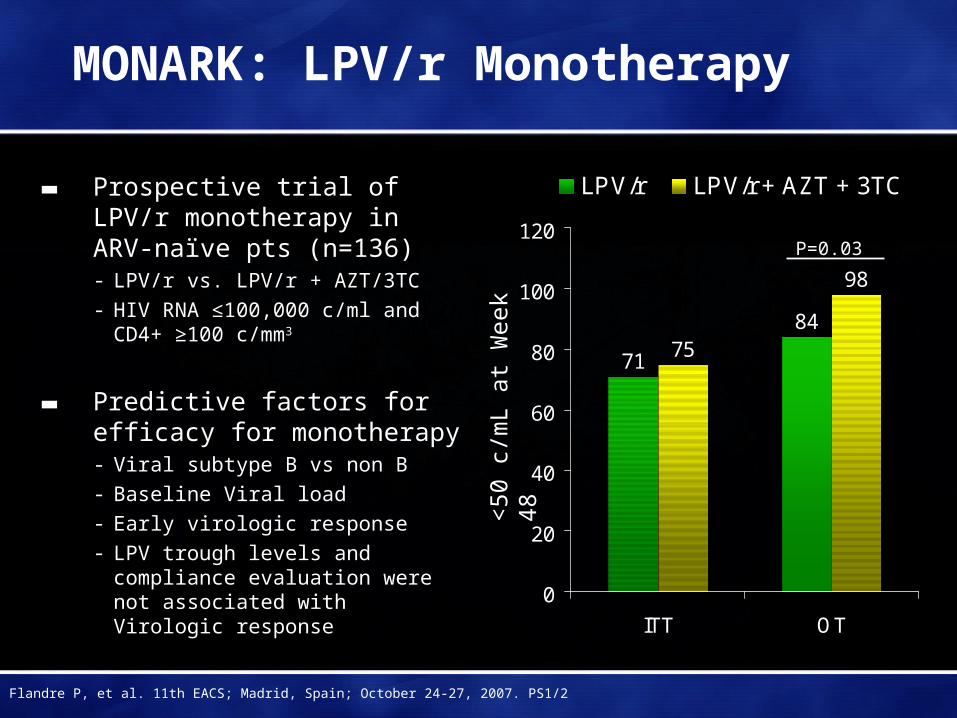
MONARK: LPV/r Monotherapy
▬ Prospective trial of LPV/r monotherapy in ARV-naïve pts (n=136)- LPV/r vs. LPV/r + AZT/3TC- HIV RNA ≤100,000 c/ml and CD4+
≥100 c/mm3
▬ Predictive factors for efficacy for monotherapy - Viral subtype B vs non B- Baseline Viral load- Early virologic response- LPV trough levels and compliance
evaluation were not associated with Virologic response
71
8475
98
0
20
40
60
80
100
120
ITT OT
LPV/r LPV/r + AZT + 3TC
P=0.03
Flandre P, et al. 11th EACS; Madrid, Spain; October 24-27, 2007. PS1/2
<50
c/m
L at
Wee
k 48
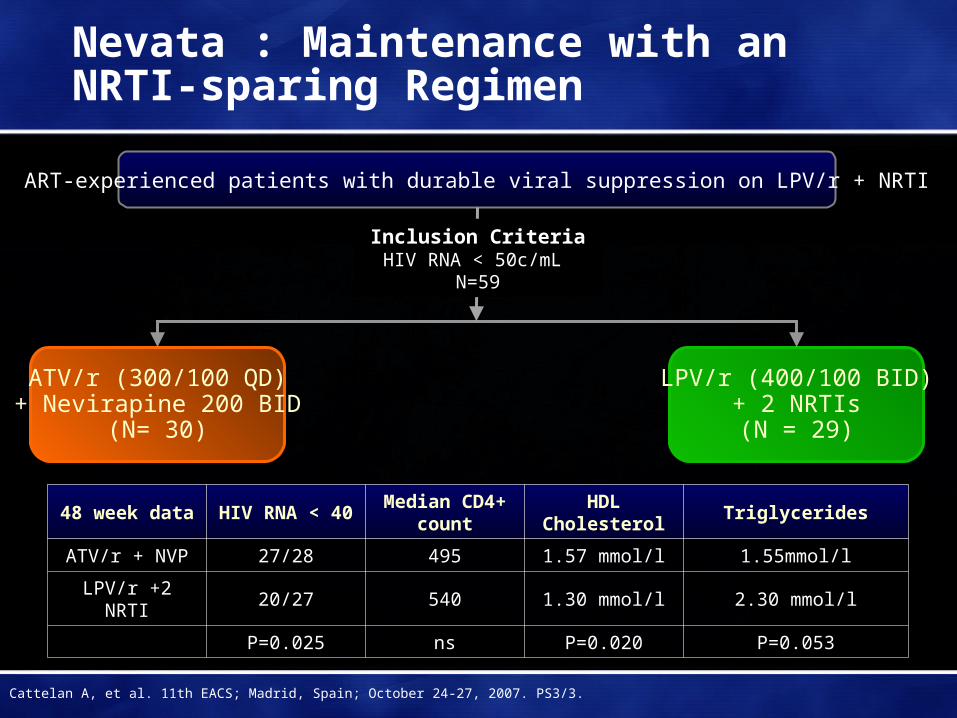
LPV/r (400/100 BID)+ 2 NRTIs(N = 29)
ART-experienced patients with durable viral suppression on LPV/r + NRTI
ATV/r (300/100 QD)+ Nevirapine 200 BID
(N= 30)
Nevata : Maintenance with anNRTI-sparing Regimen
Inclusion CriteriaHIV RNA < 50c/mL
N=59
48 week data HIV RNA < 40Median CD4+
countHDL
CholesterolTriglycerides
ATV/r + NVP 27/28 495 1.57 mmol/l 1.55mmol/l
LPV/r +2 NRTI 20/27 540 1.30 mmol/l 2.30 mmol/l
P=0.025 ns P=0.020 P=0.053
Cattelan A, et al. 11th EACS; Madrid, Spain; October 24-27, 2007. PS3/3.
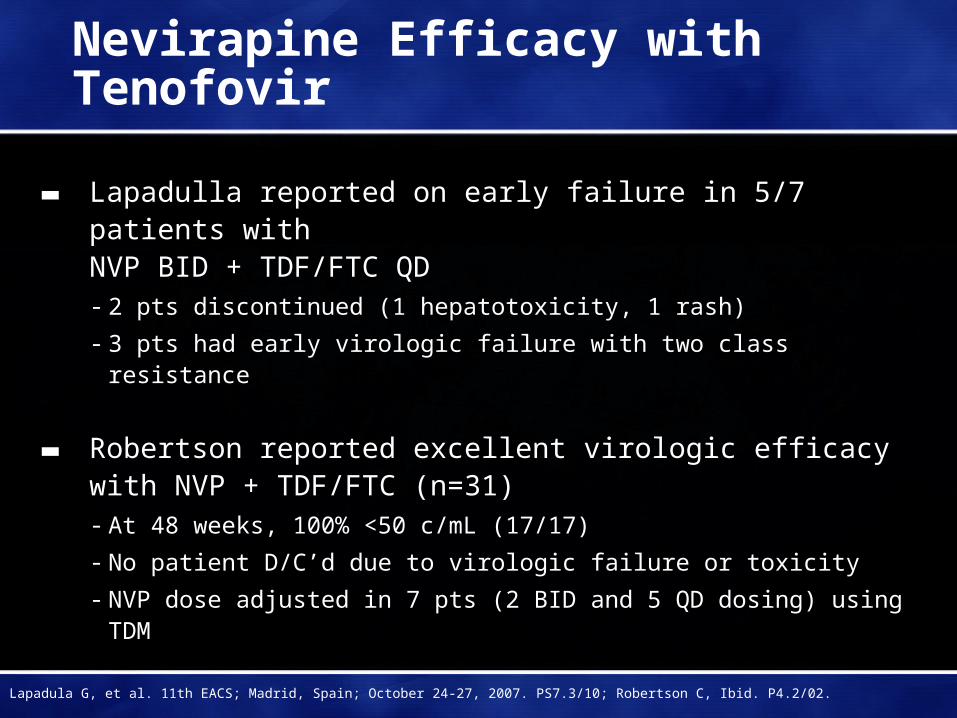
Nevirapine Efficacy with Tenofovir
▬ Lapadulla reported on early failure in 5/7 patients with NVP BID + TDF/FTC QD- 2 pts discontinued (1 hepatotoxicity, 1 rash)
- 3 pts had early virologic failure with two class resistance
▬ Robertson reported excellent virologic efficacy with NVP + TDF/FTC (n=31)- At 48 weeks, 100% <50 c/mL (17/17)
- No patient D/C’d due to virologic failure or toxicity
- NVP dose adjusted in 7 pts (2 BID and 5 QD dosing) using TDM
Lapadula G, et al. 11th EACS; Madrid, Spain; October 24-27, 2007. PS7.3/10; Robertson C, Ibid. P4.2/02.

GS 903E:Long-term Data on TDF + 3TC + EFV
TDF QDEFV QD3TC BIDd4T Placebo BID
Study 903
3 Years (144 weeks)
d4T BIDEFV QD3TC BIDTDF Placebo QD
TDF QDEFV QD3TC QD(Open-Label)
7 Years (336 weeks)
Study 903E Mean ± SD Age in yrs (Range) 33 ± 7 (19 to 51)
Male 62%
Race White Black Other
70%12%18%
Mean ± SD HIV-RNA in log10 c/mL 4.86 ± 0.6
Mean ± SD CD4 count in cells/mm3 299 ± 188
Casetti I, et al. 11th EACS; Madrid, Spain; October 24-27, 2007. PS7.3/15.
GS 903E
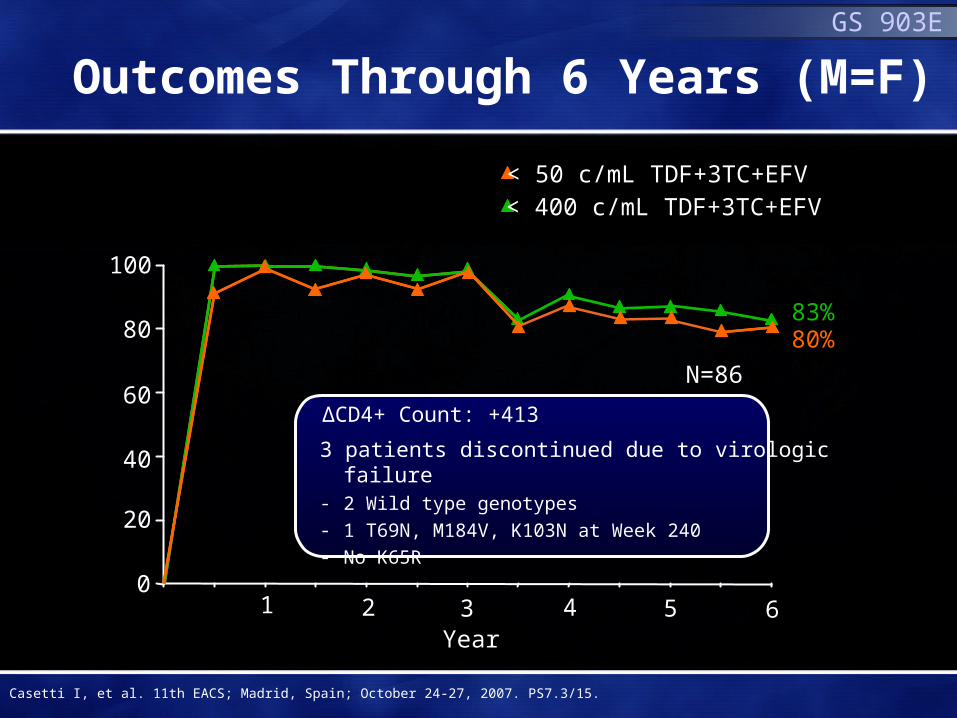
Outcomes Through 6 Years (M=F)
< 400 c/mL TDF+3TC+EFV
3 patients discontinued due to virologic failure- 2 Wild type genotypes - 1 T69N, M184V, K103N at Week 240- No K65R
1 2 3 4 5 6Year
100
80
60
40
20
0
83%
N=86
< 50 c/mL TDF+3TC+EFV
80%
∆CD4+ Count: +413
Casetti I, et al. 11th EACS; Madrid, Spain; October 24-27, 2007. PS7.3/15.

0
160
20
40
60
80
100
120
140
mL/
min
Median Baseline GFR: 116
1 2 3 4 50Years
Cockcroft-Gault
128
6
160
0204060
80100120140
mL/
min
/1.7
3m2
0 1 2 3 4
Median Baseline GFR: 112
MDRD
117
5 6
N=73 (through 6 years)
GS 903E
Median GFR Through 6 Yearsof TDF+3TC +EFV
Casetti I, et al. 11th EACS; Madrid, Spain; October 24-27, 2007. PS7.3/15.
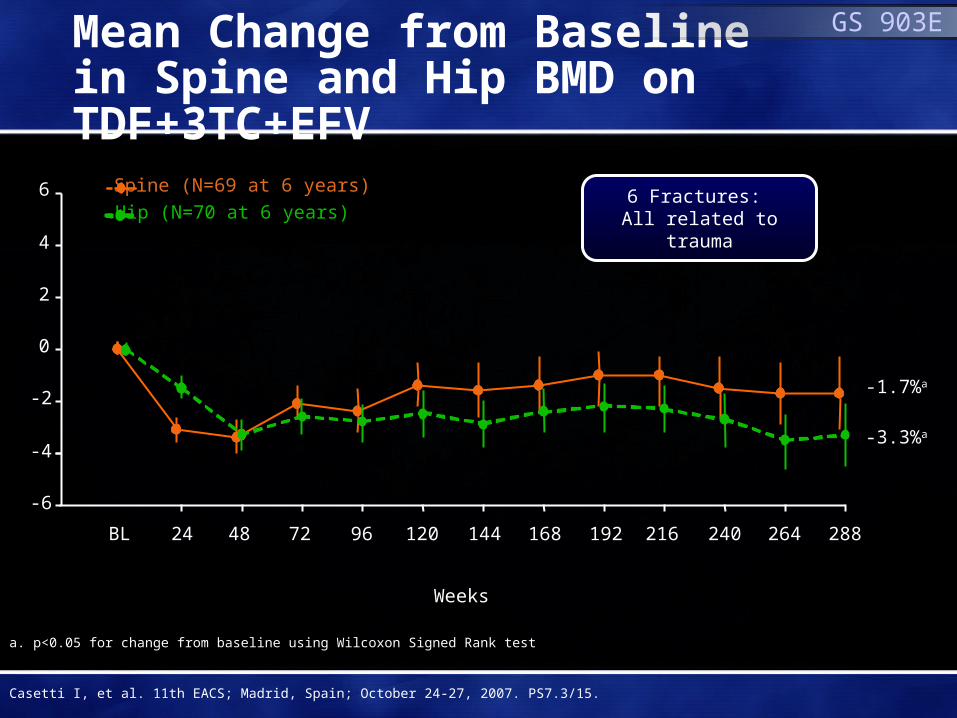
Mean Change from Baselinein Spine and Hip BMD on TDF+3TC+EFV
6 Fractures: All related to trauma
WeeksWeeks
BL 24 48 72 96 120 144 168 192 216 240 264 288
-6
-4
-2
0
2
4
6
-3.3%a
-1.7%a
Spine (N=69 at 6 years)
Hip (N=70 at 6 years)
a. p<0.05 for change from baseline using Wilcoxon Signed Rank test
GS 903E
Casetti I, et al. 11th EACS; Madrid, Spain; October 24-27, 2007. PS7.3/15.

Studies of HIV Resistance and Treatment Experienced Patients
Calvin Cohen MDHarvard Vanguard Medical Associates
CRI New EnglandBoston MA

FTC/TDF + EFVZDV/3TC + EFV
8 16 32 48 72 96 120 144
Weeks
0
20
40
60
80
100
Arribas J, et al. 4th IAS Conference; Sydney, Australia; July 22-25, 2007. Abstract WEPEB029.
Res
pond
er (
%) 71%
58%
<400 c/mLP = 0.004
64%56%
<50 c/mLP = 0.08
GS 934
Week 144 Results (TLOVR)
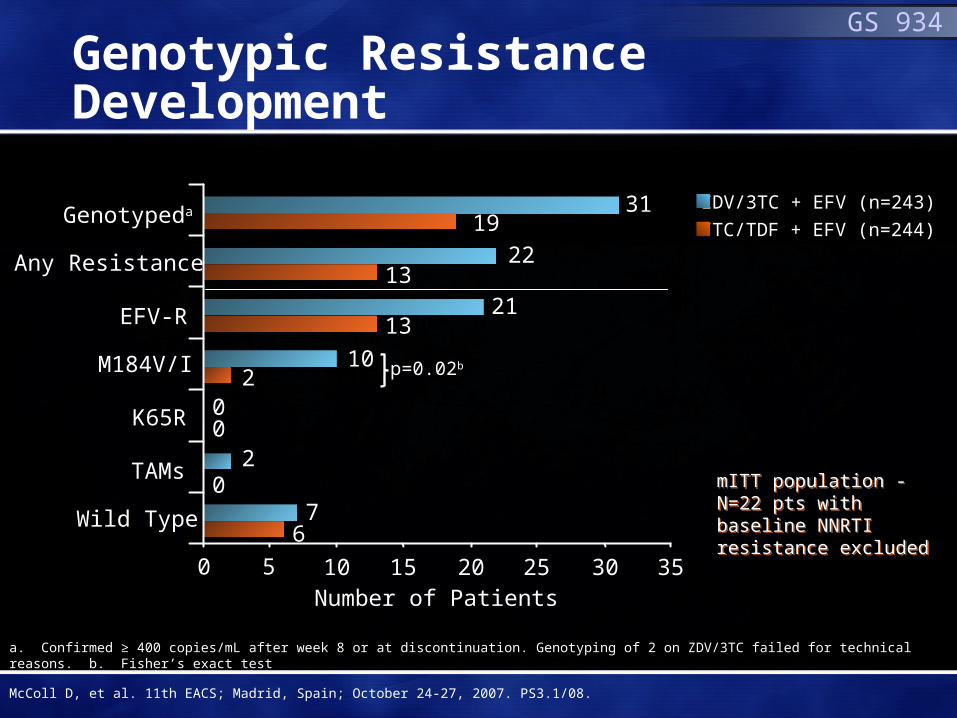
Genotypic Resistance Development
FTC/TDF + EFV (n=244)
ZDV/3TC + EFV (n=243)
p=0.02b
0
2
7
0
0
6
10
31
22
21
2
13
19
0 5 10 15 20 25 30 35
13
Genotypeda
Number of Patients
Any Resistance
EFV-R
M184V/I
K65R
TAMs
Wild Type
a. Confirmed ≥ 400 copies/mL after week 8 or at discontinuation. Genotyping of 2 on ZDV/3TC failed for technical reasons. b. Fisher’s exact test
mITT population - N=22 pts with baseline NNRTI resistance excluded
mITT population - N=22 pts with baseline NNRTI resistance excluded
GS 934
McColl D, et al. 11th EACS; Madrid, Spain; October 24-27, 2007. PS3.1/08.
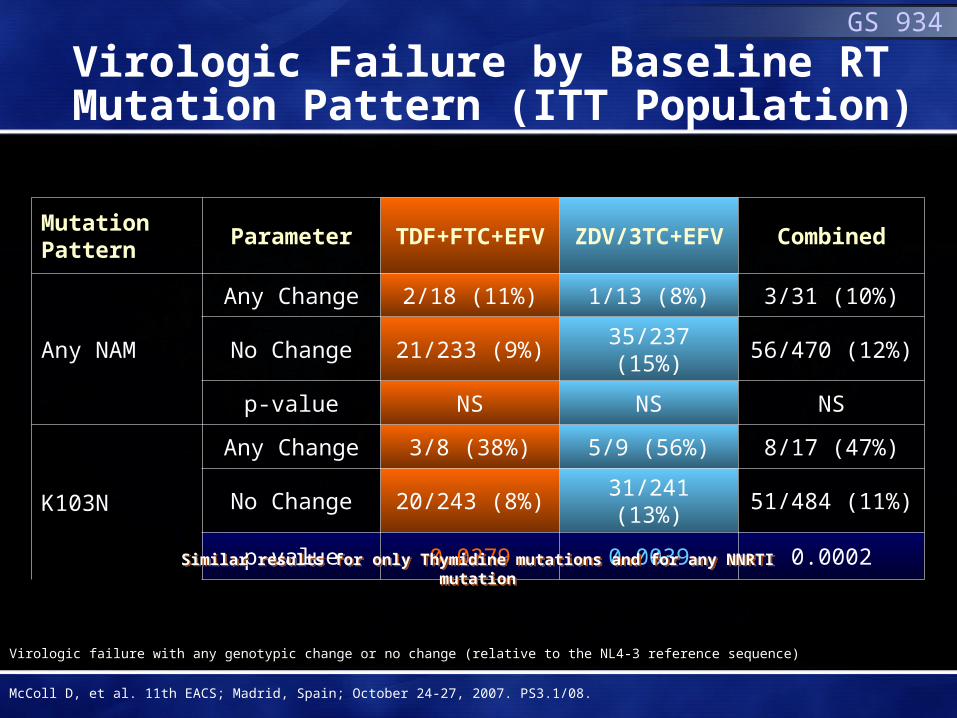
Virologic Failure by Baseline RT Mutation Pattern (ITT Population)
Mutation Pattern
Parameter TDF+FTC+EFV ZDV/3TC+EFV Combined
Any NAM
Any Change 2/18 (11%) 1/13 (8%) 3/31 (10%)
No Change 21/233 (9%) 35/237 (15%) 56/470 (12%)
p-value NS NS NS
K103N
Any Change 3/8 (38%) 5/9 (56%) 8/17 (47%)
No Change 20/243 (8%) 31/241 (13%) 51/484 (11%)
p-value 0.0279 0.0039 0.0002
Similar results for only Thymidine mutations and for any NNRTI mutationSimilar results for only Thymidine mutations and for any NNRTI mutation
Virologic failure with any genotypic change or no change (relative to the NL4-3 reference sequence)
McColl D, et al. 11th EACS; Madrid, Spain; October 24-27, 2007. PS3.1/08.
GS 934

▬ Study Population: - Virologically suppressed
(<200 c/mL) HIV-1+ pts. on stable HAART regimenfor ≥ 3 months
▬ Primary Objective:- Compare proportion with
plasma VL<200 c/mL at week 48 between treatment arms using TLOVR† analysis
▬ Unplanned 24 week interim efficacy analysis presented
Stable HAART X ≥ 3 mo
Stratify PI vs. NNRTI
48weeks
†Time to loss of Virologic Response. *SBR: Stayed on Background Regimen
AI266073: Study Design
HAART toEFV/FTC/TDF Switch
2:1(EFV/FTC/TDF: SBR*)
EFV/FTC/TDF QD SBR
DeJesus E, et al. 11th EACS; Madrid, Spain; October 24-27, 2007. LBPS7/6.

Baseline Characteristics
EFV/FTC/TDF
(n=203)
SBR
(n=97)
Total
(n=300)
Male (n/%) 181(89) 83 (86) 264(88)
Mean Age (years) 42.3 44.5 43.0
Black (n/%) 56 (28%) 30 (31%) 86(29%)
Regimen before randomization (n/%)
NNRTI
PI
95 (47%)
108 (53%)
45 (46%)
52(54%)
140 (47%)
160 (53%)
HIV-1 RNA (copies/mL)
<50
50<200
≥2001
194 (96%)
7(3%)
2 (<1%)
95 (98%)
2 (2%)
0 (0%)
289 (96%)
9 (3%)
2 (<1%)
CD4 cell count (cells/μL)
Mean
≤ 200
537
13(6%)549
13 (13%)
541
26 (9%)
NOTE: Most frequent NNRTI regimen was EFV + AZT/3TC. Most frequent PI regimen was ATV/r + FTC/TDF 1. All subjects had HIV-1 RNA <200 copies/mL at screening.
AI266073
DeJesus E, et al. 11th EACS; Madrid, Spain; October 24-27, 2007. LBPS7/6.

Week 24 Efficacy Analyses
24 Wk endpoint (%)
EFV/FTC/TDF
(N=203)
SBR
(N=97)
Difference
EFV/FTC/TDF-SBR
(95% CI)
HIV-1 RNA <50 copies/mL
PVR* 96.5% 96.8%-0.4%
(4.7%to 4.0%)
M=F‡ 93.1% 90.7%2.4%
(-4.0%to 10.3%)
▬ Early treatment discontinuation through 24 weeks:▬ EFV/FTC/TDF: n = 16 (8%)
- 9/16 d/c due to AEs- 5/9 d/c for CNS events (all from PI stratum)
▬ SBR: n = 6 (6%)- 4/6 on SBR d/c due to consent withdrawal
*PVR: Lack of two confirmed VL>50 or one VL>50 c/mL if no subsequent test available; ‡Missing equals Failure
AI266073
DeJesus E, et al. 11th EACS; Madrid, Spain; October 24-27, 2007. LBPS7/6.

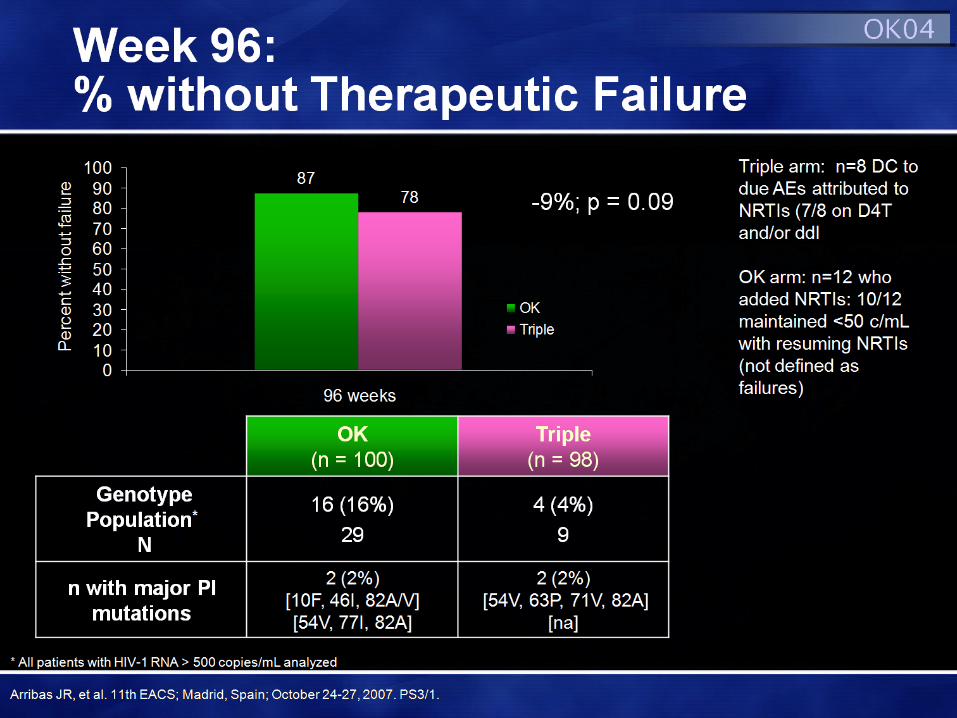
OK04: Study Design
Primary endpoint: Therapeutic failure at 48 weeks
▬ 2 viral loads > 500 c/mL 2 weeks apart* (and lack of resuppression after restarting NRTI in the OK arm) OR
▬ Change of randomized therapy for reasons different from re-induction OR
▬ Treatment discontinuation OR
▬ Lost to follow-up
Failure on OK arm if NRTI intensification needed:
▬ Decrease in HIV-1 RNA < 1 log 4 wks after intensification OR
▬ Failure to achieve VL < 50 c/mL 16 wks after intensification
Visits: Screening, Baseline, Week 4 and 12, then every 12 weeks up to Week 96
▬ HIV-1 RNA < 50 c/mL for > 6 months
▬ No history of virological failure while taking a PI
▬ Receiving LPV/r for + 2 NRTIs > 1 month
LPV/r SGC 400/100 mg BID
+ 2 NRTIs (“Triple”)(n=100)
LPV/r SGC 400/100 mg BID
(“OK”)(n=100) LPV/r Tablet
(“OK”)400/100 mg BID
Week 96
Arribas JR, et al. 11th EACS; Madrid, Spain; October 24-27, 2007. PS3/1.
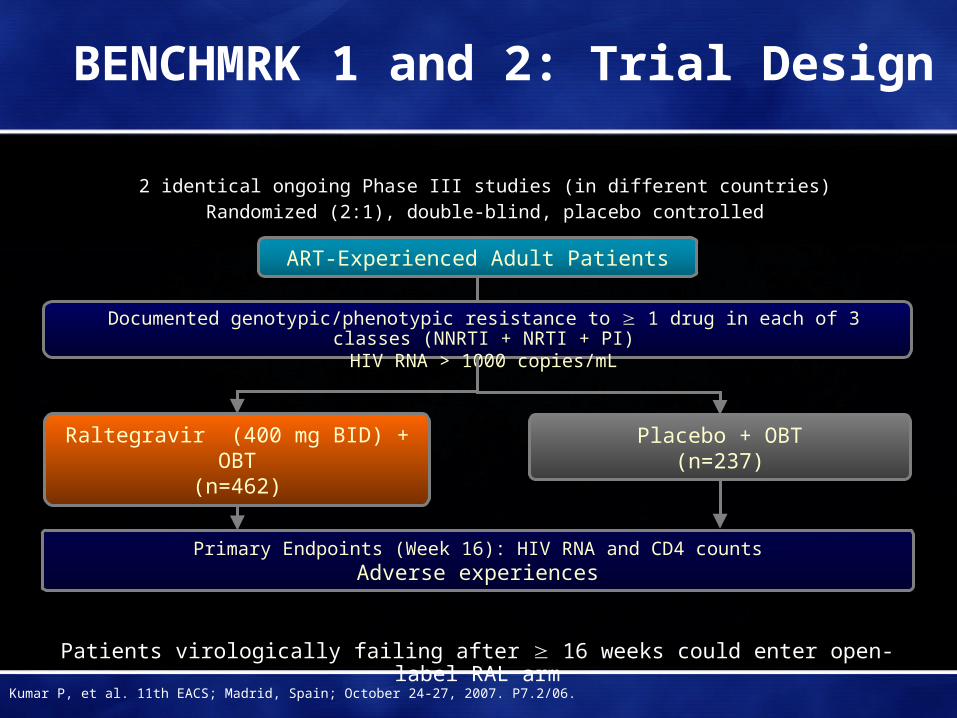
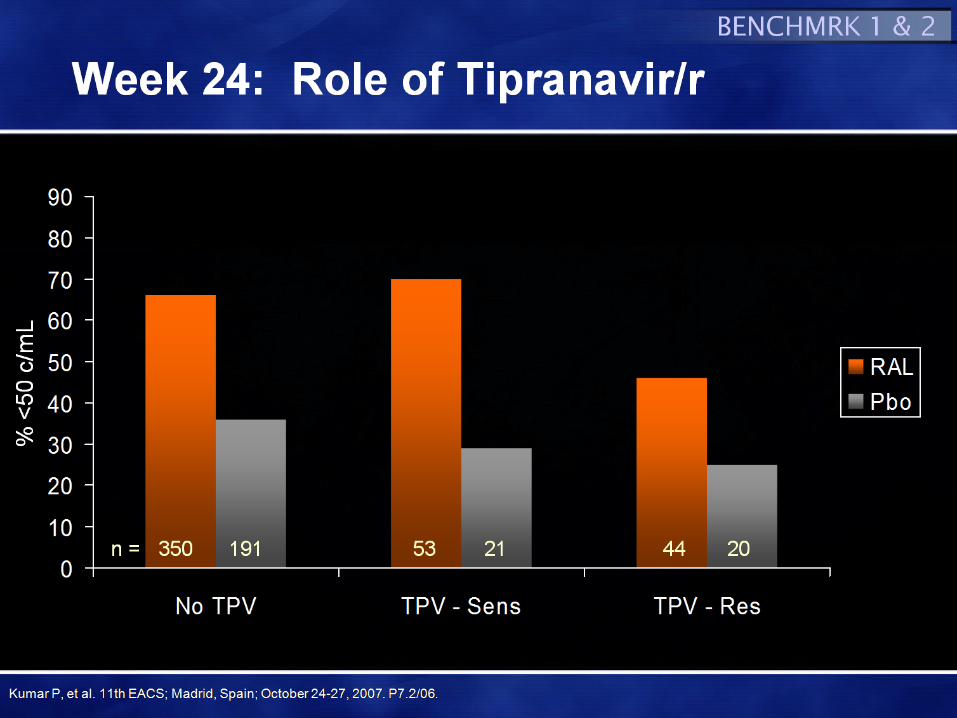
BENCHMRK 1 and 2: Trial Design
Primary Endpoints (Week 16): HIV RNA and CD4 countsAdverse experiences
Raltegravir (400 mg BID) + OBT(n=462)
Placebo + OBT(n=237)
ART-Experienced Adult Patients
2 identical ongoing Phase III studies (in different countries)Randomized (2:1), double-blind, placebo controlled
Documented genotypic/phenotypic resistance to 1 drug in each of 3 classes (NNRTI + NRTI + PI)HIV RNA > 1000 copies/mL
Patients virologically failing after 16 weeks could enter open-label RAL arm
Kumar P, et al. 11th EACS; Madrid, Spain; October 24-27, 2007. P7.2/06.

Baseline Patient Characteristics
BENCHMRK-1 BENCHMRK-2
RAL(n = 232)
Placebo (n = 118)
RAL(n = 230)
Placebo (n = 119)
Mean Age, yrs (SD)% Male% Caucasian
46 (9)8475
44 (8)8781
45 (9)9155
46 (8)9065
Mean CD4 Count, cells/mm3
GM Viral Load, copies/mL (log10HIV RNA)
% AIDSMedian Yrs of Prior ARTs (median # ART)
% Hep B+/% Hep C+
15640519 (4.6)
94 11 (12)
8/15
153 31828 (4.5)
9010 (12)
4/20
14648366 (4.7)
9110 (12)
10/3
16347789 (4.7)
9210 (12)
3/4
% GSS§ 0/1% PSS§ 0/1% new enfuvirtide in OBT% new darunavir in OBT
30/3319/29
2127
29/4118/33
2025
20/4410/34
1945
26/4019/27
2050
§ GSS/PSS = total ART in OBT to which pt’s virus showed geno/phenotypic sensitivity by Phenosense GT assay. Enfuvirtide and darunavir use in naïve patients were each counted as + 1 active agent and added to GSS/PSS.
BENCHMRK 1 & 2
Kumar P, et al. 11th EACS; Madrid, Spain; October 24-27, 2007. P7.2/06.

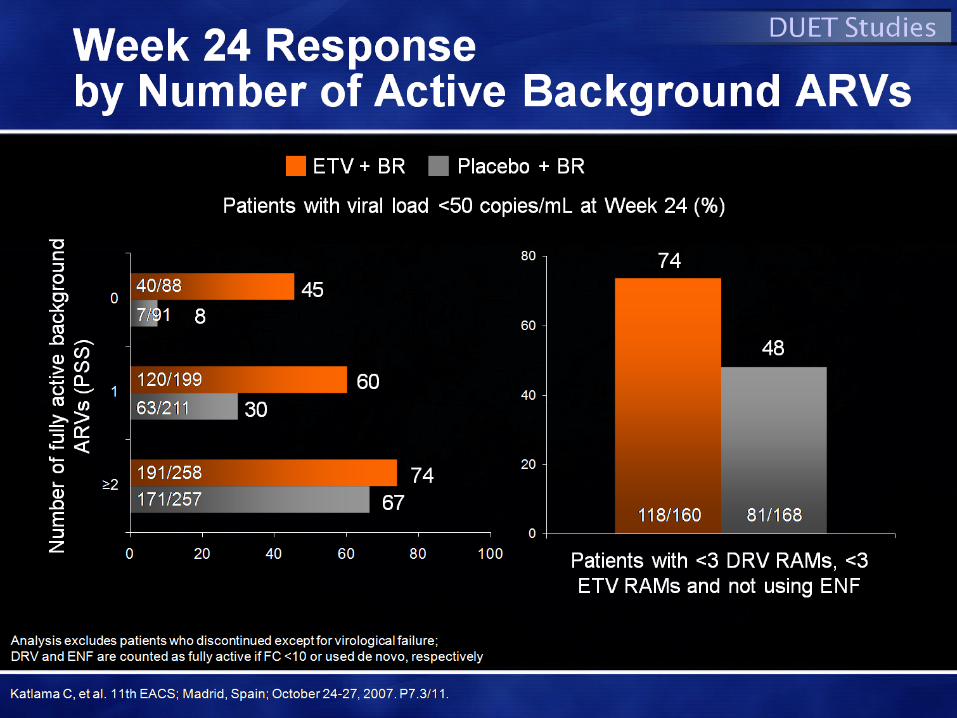
Response RatesOverall and by GSS at Week 24
0
10
20
30
40
50
60
70
80
90
<400 <50 CD4
RAL
Pbo
*p<0.001*p<0.001
**** **
N = 448 on RAL arms; 230 on PboN = 448 on RAL arms; 230 on Pbo
0
10
20
30
40
50
60
70
80
90
0 1 2 or more
RAL
Pbo
n =111 64 173 94 157 70n =111 64 173 94 157 70
By GSS score of OBBy GSS score of OB
Kumar P, et al. 11th EACS; Madrid, Spain; October 24-27, 2007. P7.2/06.
BENCHMRK 1 & 2%
<50
c/m
L


TITAN: Study Design
• LPV-naïve, treatment-experienced
• VL >1,000 copies/mL
• Stable HAART for ≥12 weeks (STI allowed)
DRV/r 600/100mg bid + OBR (n=298)
LPV/r 400/100mg bid + OBR (n=297)
Rollover and follow-up
phase after 1 and 4 weeks
Screening phase (4 weeks)
Treatment phase (96 weeks)
595 patients randomised and treated
STI = structured treatment interruption; OBR = optimized background regimen
De Meyer S, et al. 47th ICAAC; Chicago, IL; September 17-20, 2007; Abst. H-1020.

*excludes patients with missing LPV FC at baseline; †D30N, V32I, L33F, M46I/L, I47A/V, G48V, I50V/L, I54L/M, L76V, V82A/F/L/S/T, I84V, N88S or L90M11. Johnson VA, et al. Top HIV Med 2006;14:125–30.
Number of IAS-USA primary PI mutations1
DRV/r (n=263)
LPV/r (n=261)
All patients with LPV FC ≤10*
0
10
20
30
40
50
60
70
80
90
0 1 2 ≥3
HIV
RN
A <
50 c
opie
s/m
L (I
TT
-TLO
VR
, %)
66
59
50
43
69
78
6865
DRV/r (n=172)
LPV/r (n=174)
Patients with prior PI experience and LPV FC ≤10*
69
77
6863
6155
4743
0
10
20
30
40
50
60
70
80
90
0 1 2 ≥3H
IV R
NA
<50
cop
ies/
mL
(IT
T-T
LOV
R, %
)
DRV Median FCLPV Median FC
195 197 32 32 19 18 17 14n=
0.50 0.50 0.40 0.50 0.70 0.65 0.90 0.85
0.70 0.70 0.80 1.10 1.80 2.60 3.60 5.35
1.00 1.00 2.00 2.50 4.00 4.00 5.00 6.50Med LPV mutations
106 114 31 29 19 17 16 14
0.55 0.50 0.40 0.50 0.70 0.70 0.90 0.85
0.70 0.70 0.80 1.10 1.80 2.90 3.75 5.35
1.00 1.00 2.00 3.00 4.00 4.00 5.00 6.50
TITAN
Impact of IAS-USA Primary PI Mutations at Baseline on Week 48 Results
Berger D, et al. 11th EACS; Madrid, Spain; October 24-27, 2007. P7.3/27.
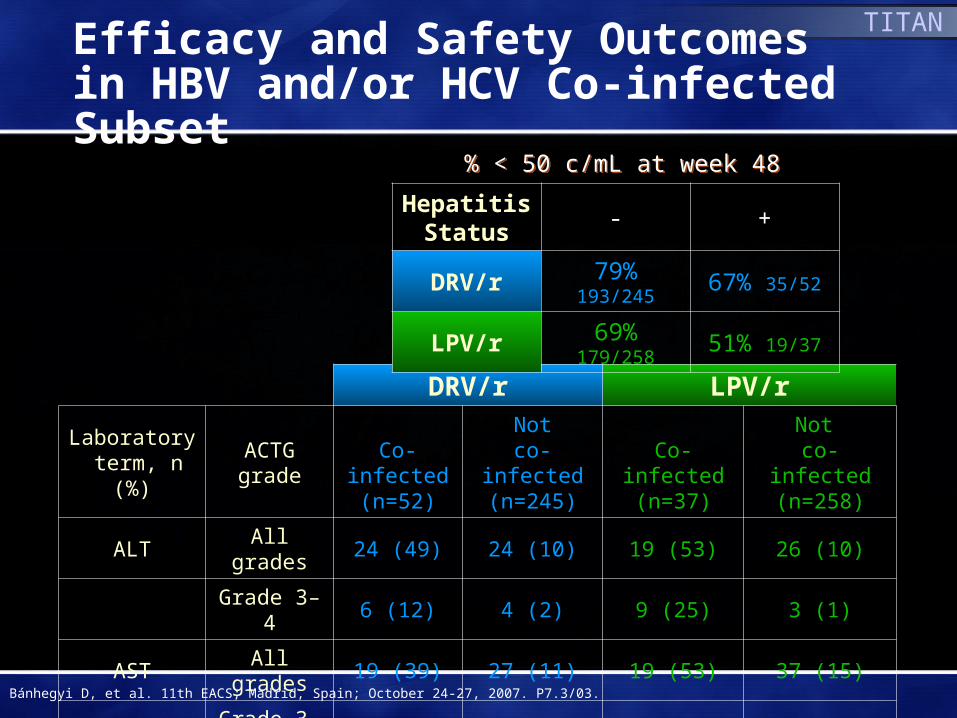
DRV/r LPV/r
Laboratory term, n (%)
ACTG grade
Co-infected(n=52)
Notco-infected
(n=245)Co-infected
(n=37)
Not co-infected
(n=258)
ALT All grades 24 (49) 24 (10) 19 (53) 26 (10)
Grade 3–4 6 (12) 4 (2) 9 (25) 3 (1)
AST All grades 19 (39) 27 (11) 19 (53) 37 (15)
Grade 3–4 5 (10) 4 (2) 8 (22) 2 (1)
Hepatitis Status
- +
DRV/r 79% 193/245 67% 35/52
LPV/r 69% 179/258 51% 19/37
% < 50 c/mL at week 48% < 50 c/mL at week 48
TITAN
Efficacy and Safety Outcomesin HBV and/or HCV Co-infected Subset
Bánhegyi D, et al. 11th EACS; Madrid, Spain; October 24-27, 2007. P7.3/03.
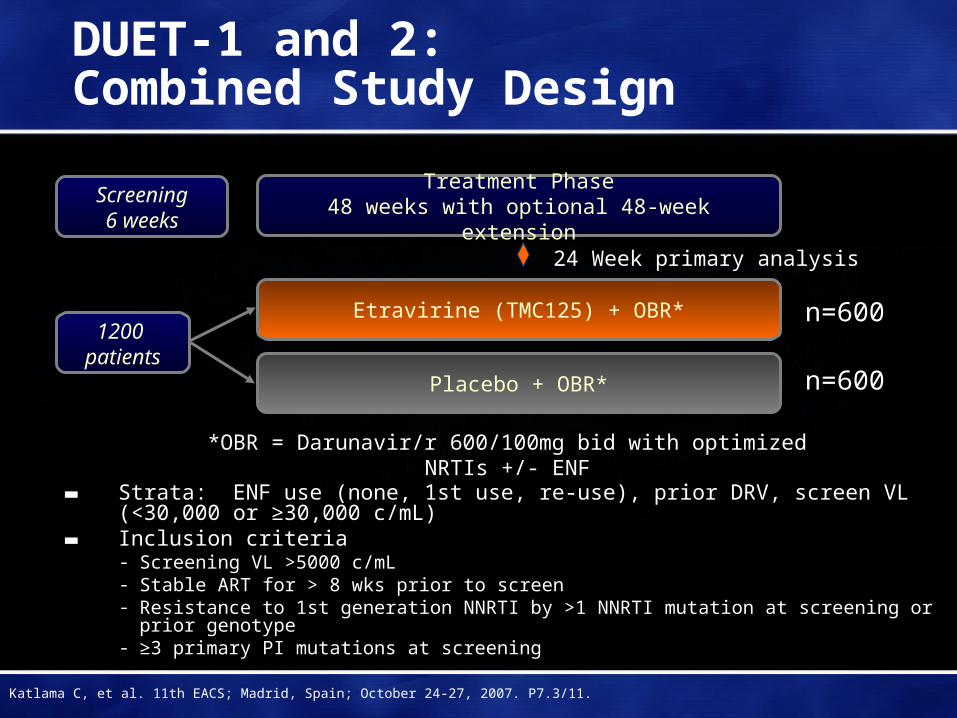
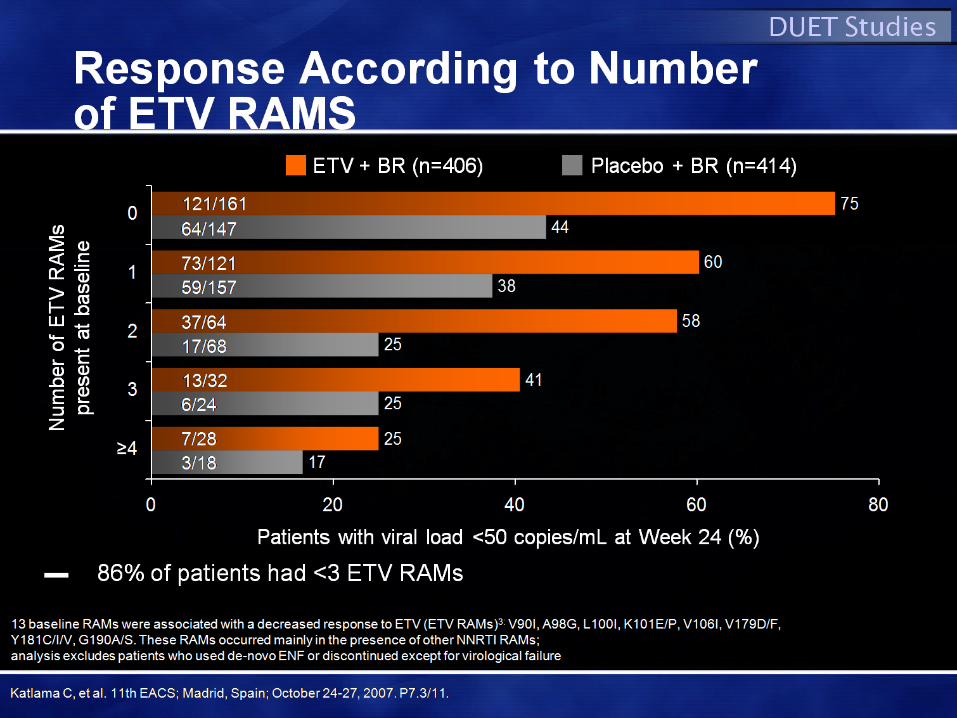
DUET-1 and 2: Combined Study Design
▬ Strata: ENF use (none, 1st use, re-use), prior DRV, screen VL (<30,000 or ≥30,000 c/mL)
▬ Inclusion criteria- Screening VL >5000 c/mL- Stable ART for > 8 wks prior to screen- Resistance to 1st generation NNRTI by >1 NNRTI mutation at screening or
prior genotype- ≥3 primary PI mutations at screening
*OBR = Darunavir/r 600/100mg bid with optimized NRTIs +/- ENF
24 Week primary analysis
Etravirine (TMC125) + OBR*
Placebo + OBR*
n=600
n=600
Screening6 weeks
1200 patients
Treatment Phase48 weeks with optional 48-week extension
Katlama C, et al. 11th EACS; Madrid, Spain; October 24-27, 2007. P7.3/11.
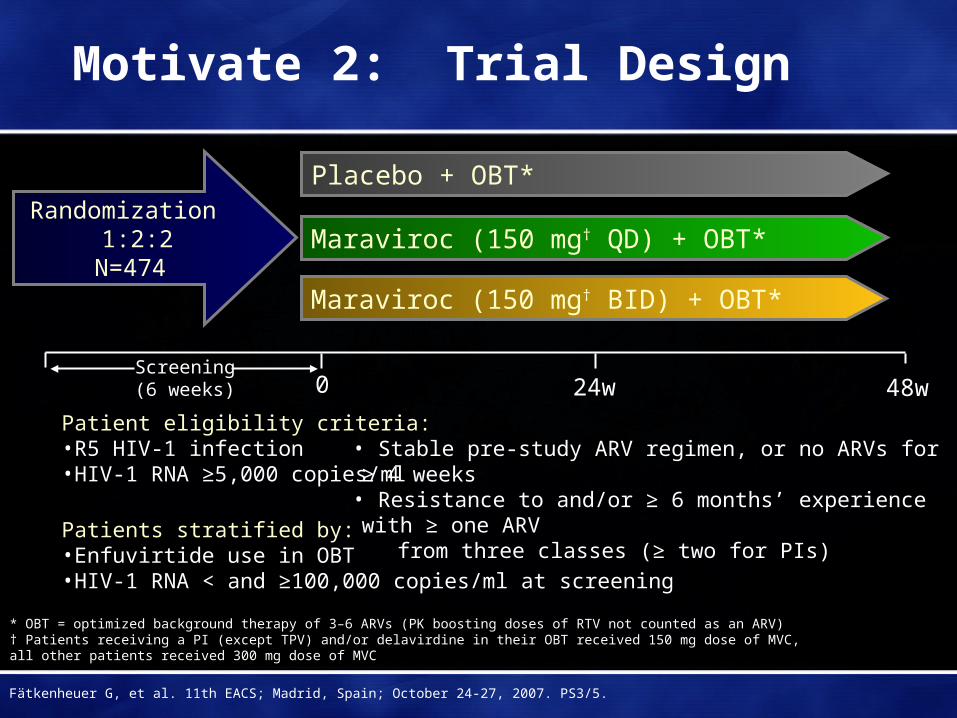
Motivate 2: Trial Design
Randomization 1:2:2N=474
Maraviroc (150 mg† BID) + OBT*
Maraviroc (150 mg† QD) + OBT*
Placebo + OBT*
0 24w
* OBT = optimized background therapy of 3–6 ARVs (PK boosting doses of RTV not counted as an ARV)† Patients receiving a PI (except TPV) and/or delavirdine in their OBT received 150 mg dose of MVC, all other patients received 300 mg dose of MVC
Screening(6 weeks) 48w
Patients stratified by:•Enfuvirtide use in OBT •HIV-1 RNA < and ≥100,000 copies/ml at screening
Patient eligibility criteria: •R5 HIV-1 infection•HIV-1 RNA ≥5,000 copies/ml
• Stable pre-study ARV regimen, or no ARVs for ≥ 4 weeks• Resistance to and/or ≥ 6 months’ experience with ≥ one ARV
from three classes (≥ two for PIs)
Fätkenheuer G, et al. 11th EACS; Madrid, Spain; October 24-27, 2007. PS3/5.
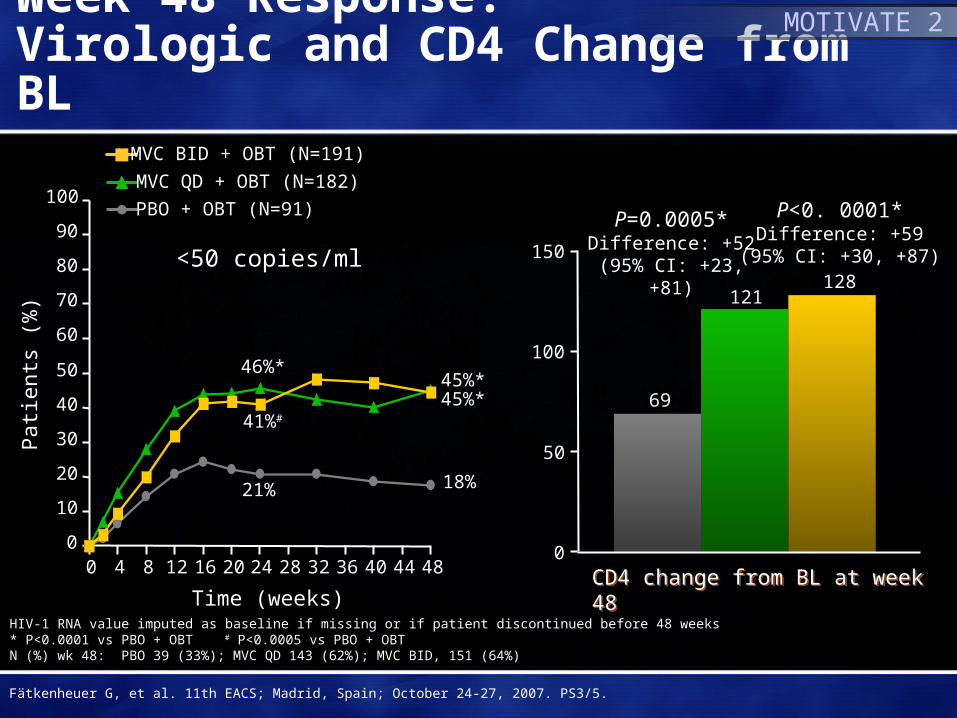
Pat
ient
s (%
)
HIV-1 RNA value imputed as baseline if missing or if patient discontinued before 48 weeks* P<0.0001 vs PBO + OBT # P<0.0005 vs PBO + OBTN (%) wk 48: PBO 39 (33%); MVC QD 143 (62%); MVC BID, 151 (64%)
PBO + OBT (N=91)
MVC QD + OBT (N=182)
MVC BID + OBT (N=191)
Week 48 Response: Virologic and CD4 Change from BL
0
10
20
30
40
50
60
70
80
90
100
Time (weeks)
45%*45%*
18%
<50 copies/ml
0 4 8 12 16 20 24 28 32 36 40 44 48
46%*
41%#
21%
P=0.0005*Difference: +52
(95% CI: +23, +81)
P<0. 0001*Difference: +59
(95% CI: +30, +87)
69
121128
0
50
100
150
CD4 change from BL at week 48CD4 change from BL at week 48
MOTIVATE 2
Fätkenheuer G, et al. 11th EACS; Madrid, Spain; October 24-27, 2007. PS3/5.
0
20
40
60
80
100
120
140
Mea
n ch
ange
fro
m b
asel
ine
in
CD
4+ c
ount
(ce
lls/m
m3 )
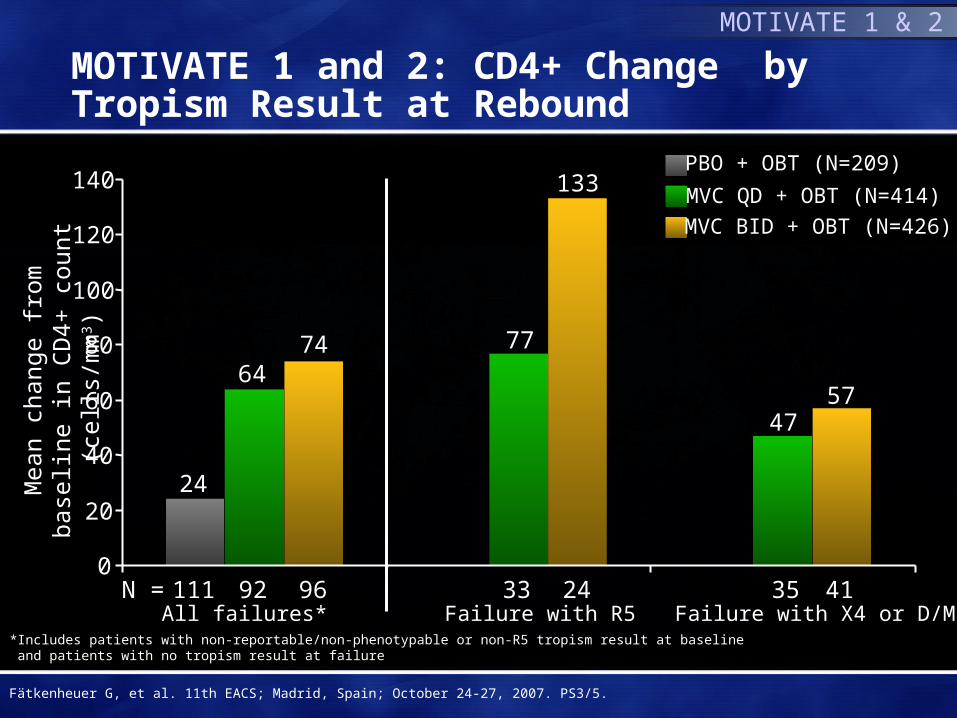
N = 111 92 96 33 24 35 41All failures* Failure with R5 Failure with X4 or D/M
*Includes patients with non-reportable/non-phenotypable or non-R5 tropism result at baseline and patients with no tropism result at failure
24
6474 77
133
4757
MVC QD + OBT (N=414)
MVC BID + OBT (N=426)
PBO + OBT (N=209)
MOTIVATE 1 and 2: CD4+ Change by Tropism Result at Rebound
MOTIVATE 1 & 2
Fätkenheuer G, et al. 11th EACS; Madrid, Spain; October 24-27, 2007. PS3/5.
Toxicities and Metabolism
Graeme Moyle MD
Chelsea and Westminster Hospital
London, UK
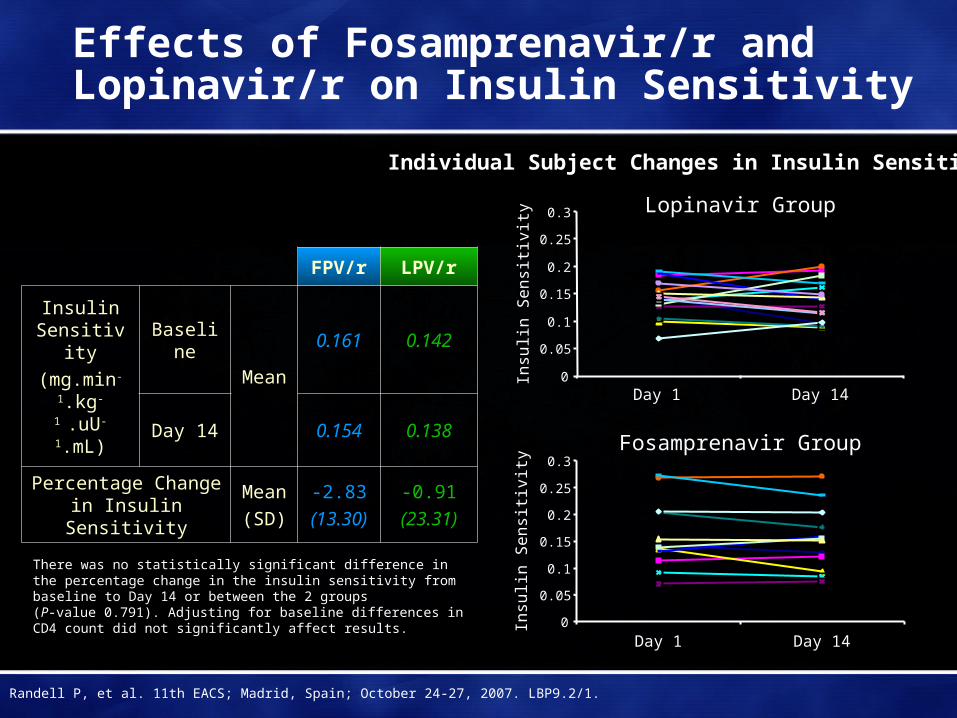
Effects of Fosamprenavir/r and Lopinavir/r on Insulin Sensitivity
FPV/r LPV/r
Insulin Sensitivity
(mg.min-
1.kg-1 .uU-
1.mL)
Baseline
Mean
0.161 0.142
Day 14 0.154 0.138
Percentage Change in Insulin Sensitivity
Mean
(SD)
-2.83
(13.30)
-0.91
(23.31)
Fosamprenavir Group
0
0.05
0.1
0.15
0.2
0.25
0.3
Day 1 Day 14
Insu
lin S
en
sitiv
ity
Lopinavir Group
0
0.05
0.1
0.15
0.2
0.25
0.3
Day 1 Day 14
Insu
lin S
en
sitiv
ity
Individual Subject Changes in Insulin Sensitivity
There was no statistically significant difference in the percentage change in the insulin sensitivity from baseline to Day 14 or between the 2 groups (P-value 0.791). Adjusting for baseline differences in CD4 count did not significantly affect results.
Randell P, et al. 11th EACS; Madrid, Spain; October 24-27, 2007. LBP9.2/1.
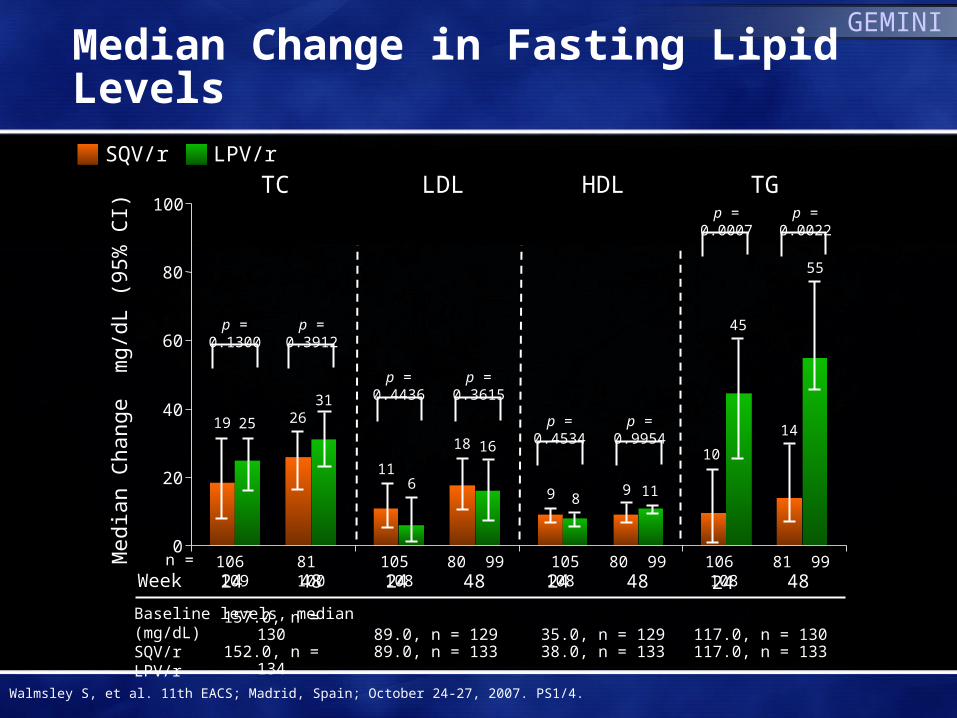
Baseline levels, median (mg/dL)SQV/rLPV/r
Med
ian
Cha
nge
mg/
dL (
95%
CI)
n =
p = 0.1300
157.0, n = 130152.0, n = 134
p = 0.3912
p = 0.4436 p = 0.3615
p = 0.0007 p = 0.0022
89.0, n = 12989.0, n = 133
117.0, n = 130117.0, n = 133
TC TG
24 48 24 48 24 48Week
LPV/rSQV/r
24 48
HDLLDL
p = 0.4534 p = 0.9954
106 109 81 100 105 108 80 99 106 108 81 99 105 108 80 99
35.0, n = 12938.0, n = 133
19
9
10
25
8
45
18
9
14
31
16
11
55
0
20
40
60
80
100
26
116
GEMINI
Median Change in Fasting Lipid Levels
Walmsley S, et al. 11th EACS; Madrid, Spain; October 24-27, 2007. PS1/4.
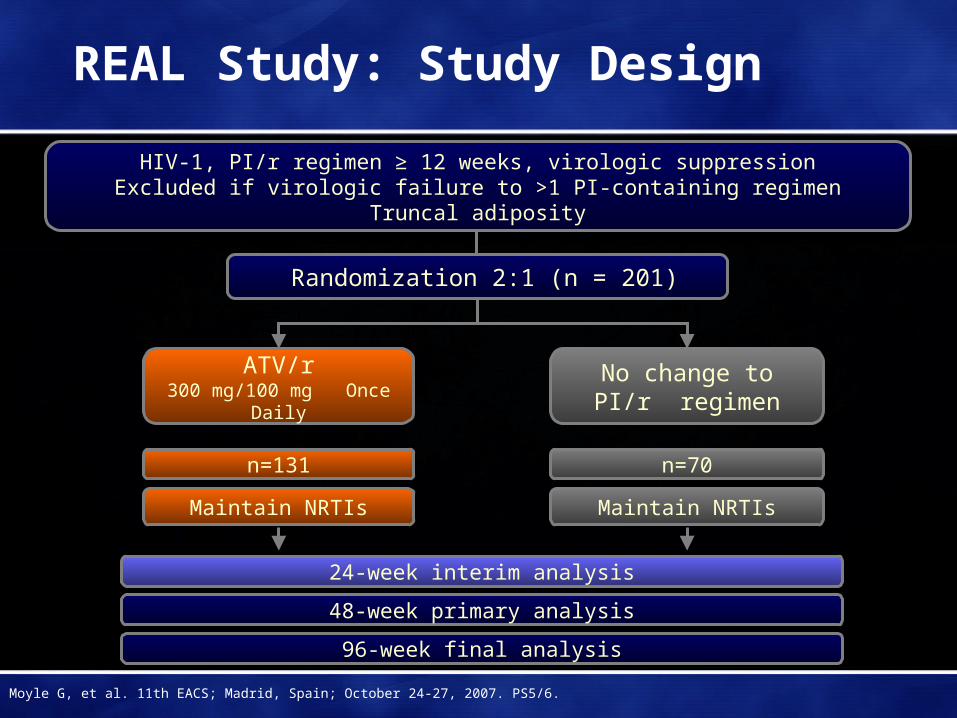
REAL Study: Study Design
HIV-1, PI/r regimen ≥ 12 weeks, virologic suppressionExcluded if virologic failure to >1 PI-containing regimen
Truncal adiposity
Randomization 2:1 (n = 201)
ATV/r300 mg/100 mg Once Daily
Maintain NRTIs
n=131
No change toPI/r regimen
Maintain NRTIs
n=70
24-week interim analysis
48-week primary analysis
96-week final analysis
Moyle G, et al. 11th EACS; Madrid, Spain; October 24-27, 2007. PS5/6.
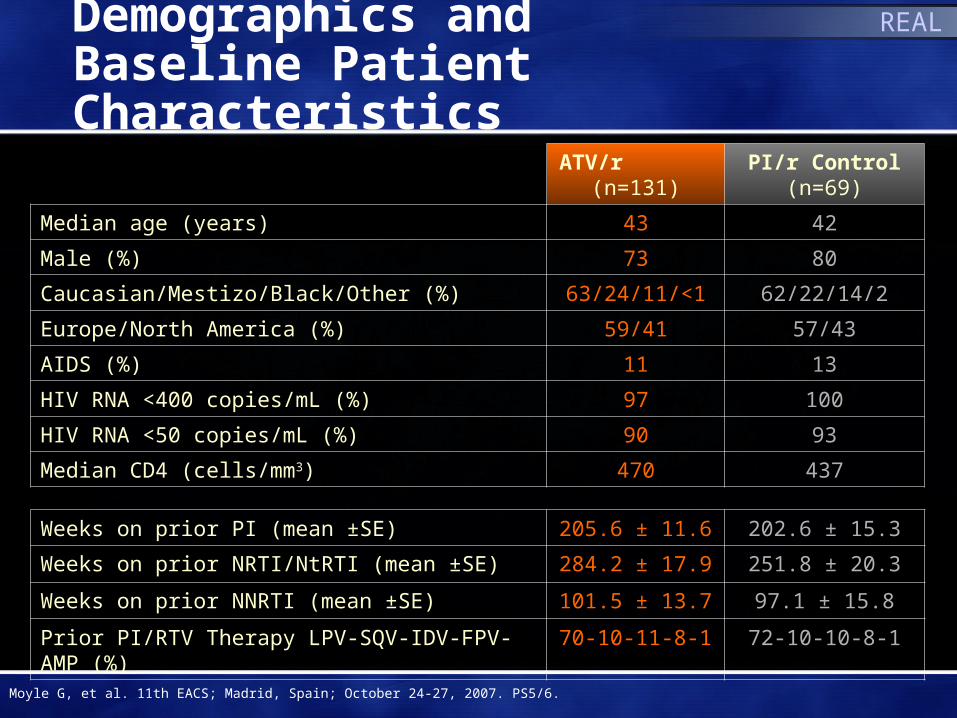
Demographics and Baseline Patient Characteristics
ATV/r (n=131)
PI/r Control (n=69)
Median age (years) 43 42
Male (%) 73 80
Caucasian/Mestizo/Black/Other (%) 63/24/11/<1 62/22/14/2
Europe/North America (%) 59/41 57/43
AIDS (%) 11 13
HIV RNA <400 copies/mL (%) 97 100
HIV RNA <50 copies/mL (%) 90 93
Median CD4 (cells/mm3) 470 437
Weeks on prior PI (mean ±SE) 205.6 ± 11.6 202.6 ± 15.3
Weeks on prior NRTI/NtRTI (mean ±SE) 284.2 ± 17.9 251.8 ± 20.3
Weeks on prior NNRTI (mean ±SE) 101.5 ± 13.7 97.1 ± 15.8
Prior PI/RTV Therapy LPV-SQV-IDV-FPV-AMP (%) 70-10-11-8-1 72-10-10-8-1
REAL
Moyle G, et al. 11th EACS; Madrid, Spain; October 24-27, 2007. PS5/6.

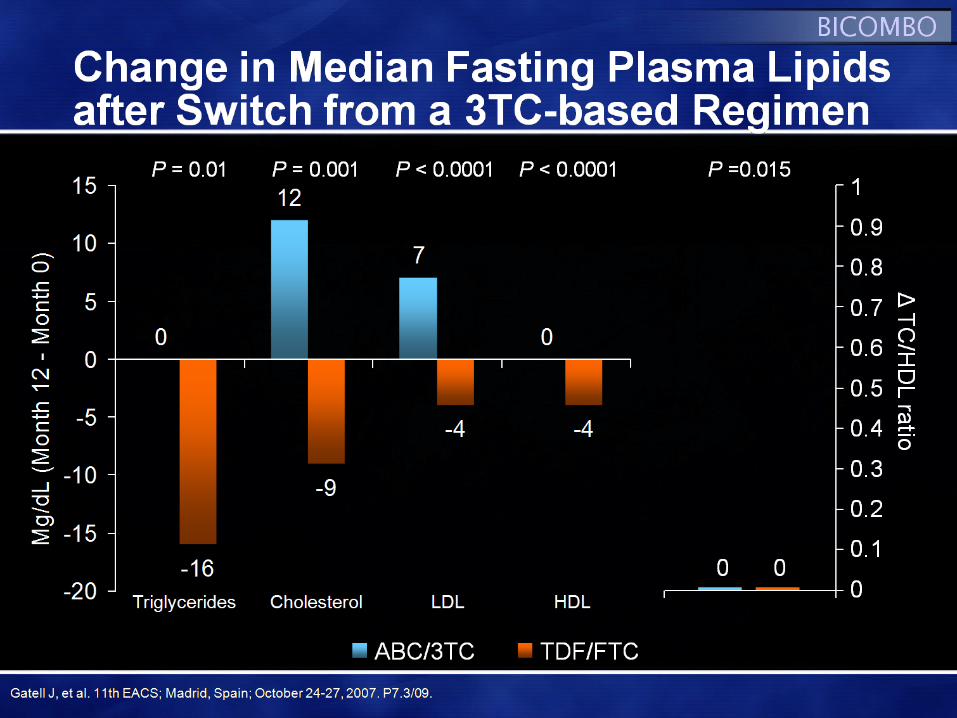
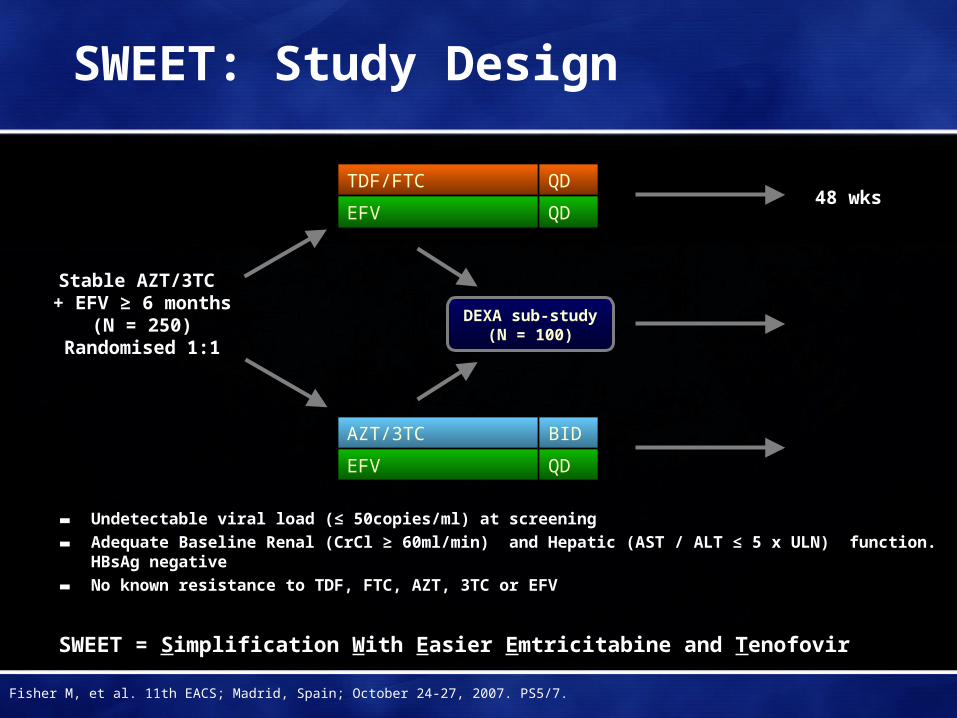
SWEET: Study Design
▬ Undetectable viral load (≤ 50copies/ml) at screening
▬ Adequate Baseline Renal (CrCl ≥ 60ml/min) and Hepatic (AST / ALT ≤ 5 x ULN) function. HBsAg negative
▬ No known resistance to TDF, FTC, AZT, 3TC or EFV
SWEET = Simplification With Easier Emtricitabine and Tenofovir
TDF/FTC QD
EFV QD48 wks
Stable AZT/3TC + EFV ≥ 6 months
(N = 250)Randomised 1:1
DEXA sub-study (N = 100)
AZT/3TC BID
EFV QD
Fisher M, et al. 11th EACS; Madrid, Spain; October 24-27, 2007. PS5/7.
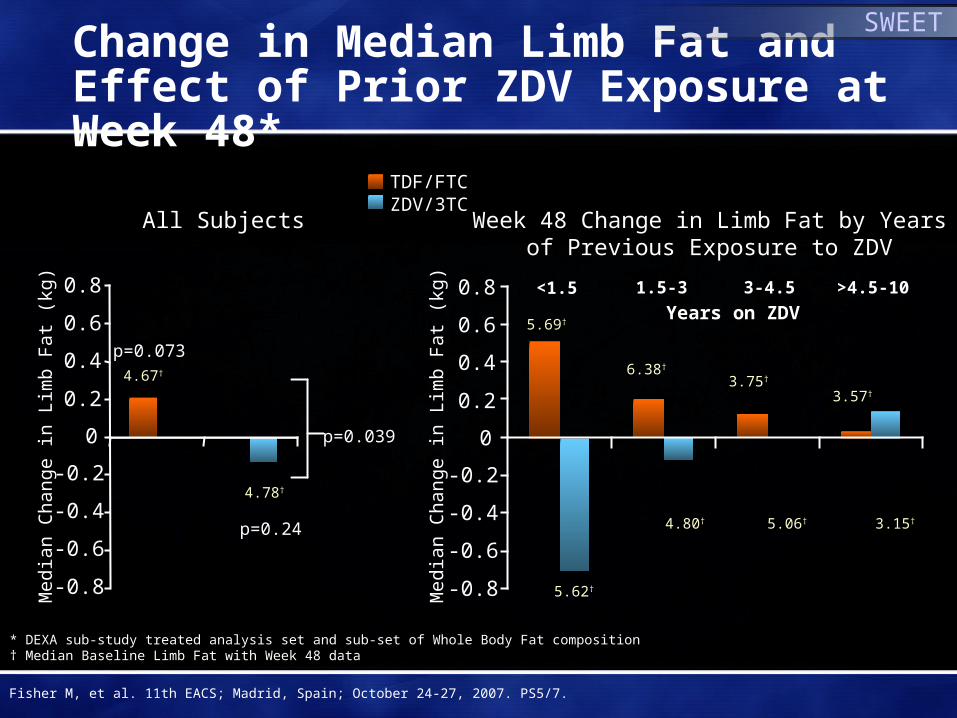
Change in Median Limb Fat and Effect of Prior ZDV Exposure at Week 48*
* DEXA sub-study treated analysis set and sub-set of Whole Body Fat composition† Median Baseline Limb Fat with Week 48 data
SWEET
TDF/FTCZDV/3TC
-0.8
-0.6
-0.4
-0.2
0
0.2
0.4
0.6
0.8
All Subjects
Years on ZDV<1.5 1.5-3 3-4.5 >4.5-10
p=0.24
-0.8
-0.6
-0.4
-0.2
0
0.2
0.4
0.6
0.8
Week 48 Change in Limb Fat by Yearsof Previous Exposure to ZDV
5.62†
4.80† 5.06† 3.15†
4.78†
4.67†
p=0.073
p=0.039
5.69†
6.38†
3.75†
3.57†
Med
ian
Cha
nge
in L
imb
Fa
t (k
g)
Med
ian
Cha
nge
in L
imb
Fa
t (k
g)
Fisher M, et al. 11th EACS; Madrid, Spain; October 24-27, 2007. PS5/7.
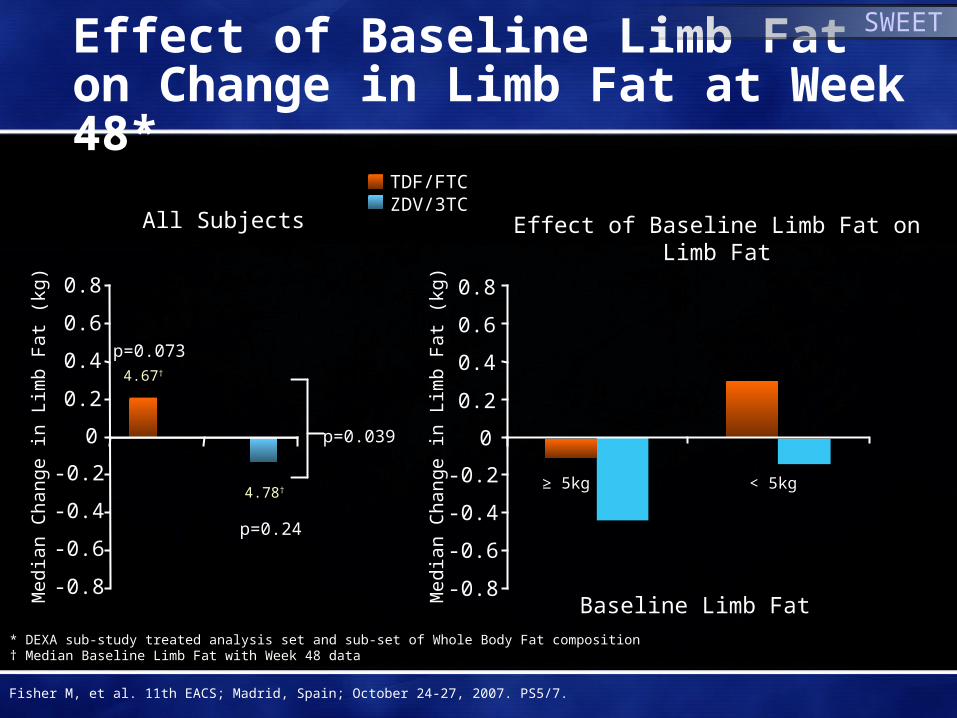
Effect of Baseline Limb Fat on Change in Limb Fat at Week 48*
Effect of Baseline Limb Fat on Limb Fat
SWEET
≥ 5kg < 5kg
* DEXA sub-study treated analysis set and sub-set of Whole Body Fat composition† Median Baseline Limb Fat with Week 48 data
TDF/FTCZDV/3TC
-0.8
-0.6
-0.4
-0.2
0
0.2
0.4
0.6
0.8
All Subjects
Baseline Limb Fat
p=0.24
-0.8
-0.6
-0.4
-0.2
0
0.2
0.4
0.6
0.8
4.78†
4.67†
p=0.073
p=0.039M
edia
n C
hang
e in
Lim
b F
at
(kg)
Med
ian
Cha
nge
in L
imb
Fa
t (k
g)
Fisher M, et al. 11th EACS; Madrid, Spain; October 24-27, 2007. PS5/7.

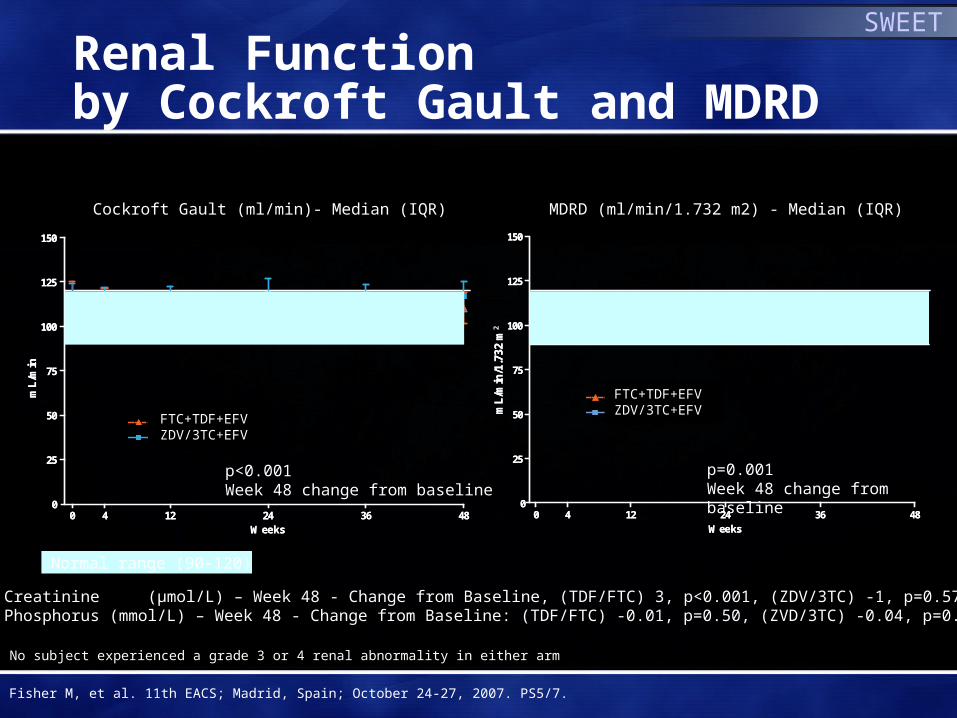
Renal Function by Cockroft Gault and MDRD
SWEET
0 4 12 24 36 480
25
50
75
100
125
150
FTC+TDF+EFV
CBV+EFV
Weeks
mL
/min
/1.7
32m
2
0 4 12 24 36 480
25
50
75
100
125
150
FTC+TDF+EFV
CBV+EFV
Weeks
mL
/min
/1.7
32m
0 4 12 24 36 480
25
50
75
100
125
150
FTC+TDF+EFV
CBV+EFV
Weeks
mL
/min
0 4 12 24 36 480
25
50
75
100
125
150
FTC+TDF+EFV
CBV+EFV
Weeks
mL
/min
p<0.001 Week 48 change from baseline
p=0.001Week 48 change from baseline
Median Creatinine (µmol/L) – Week 48 - Change from Baseline, (TDF/FTC) 3, p<0.001, (ZDV/3TC) -1, p=0.57Median Phosphorus (mmol/L) – Week 48 - Change from Baseline: (TDF/FTC) -0.01, p=0.50, (ZVD/3TC) -0.04, p=0.67
MDRD (ml/min/1.732 m2) - Median (IQR)Cockroft Gault (ml/min)- Median (IQR)
Normal range (90-120)
No subject experienced a grade 3 or 4 renal abnormality in either arm
Fisher M, et al. 11th EACS; Madrid, Spain; October 24-27, 2007. PS5/7.
FTC+TDF+EFVZDV/3TC+EFV
FTC+TDF+EFVZDV/3TC+EFV
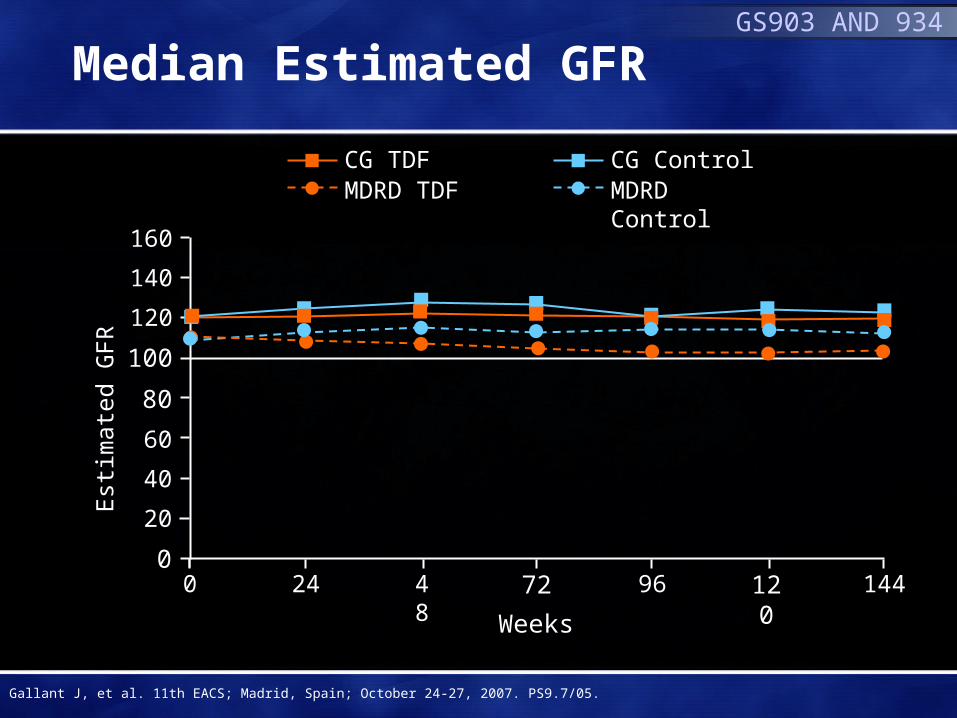
Median Estimated GFRGS903 AND 934
CG TDFMDRD TDF
CG ControlMDRD Control
0
20
60
100
120
160
Est
imat
ed G
FR
24 48 72 96 120 144
Weeks
0
140
40
80
Gallant J, et al. 11th EACS; Madrid, Spain; October 24-27, 2007. PS9.7/05.

Est
imat
ed G
FR
020
60
100120
160
24 48 72 96 120 1440
140
40
80
Median eGFR: Patients with Mild Renal Impairment at Baseline* and Concomitant Anti-hypertensive/Anti-diabetic Medications
GS903 AND 934
CG TDFMDRD TDF
CG ControlMDRD Control
Weeks
Est
imat
ed G
FR
020
60
100120
160
24 48 72 96 120 1440
140
40
80
Gallant J, et al. 11th EACS; Madrid, Spain; October 24-27, 2007. PS9.7/05.
*GFR 50-80 mL/min by Cockcroft-Gault

120120
No Differences in Renal Function by NRTI Use over 84 Months
No use TDF during follow-upNo use TDF during follow-upTDFTDF
Time (month)Time (month)
MD
RD
(ml/m
in/1
.73m
2)M
DR
D(m
l/min
/1.7
3m2)
Median According to Tenofovir (TDF) use,ANRS C08 APROCO-COPILOTE
Median According to Tenofovir (TDF) use,ANRS C08 APROCO-COPILOTE
110110
100100
9090
8080
7070
00 44 88 1212 1616 2020 2424 2828 3232 3636 4040 4444 4848 5252 5656 6060 6464 6868 7272 7676 8080 8484
Use TDF during follow-upUse TDF during follow-up
Ravasi G, et al. 11th EACS; Madrid, Spain; October 24-27, 2007. PS9.7/03.
ANRS-APROCO Cohort
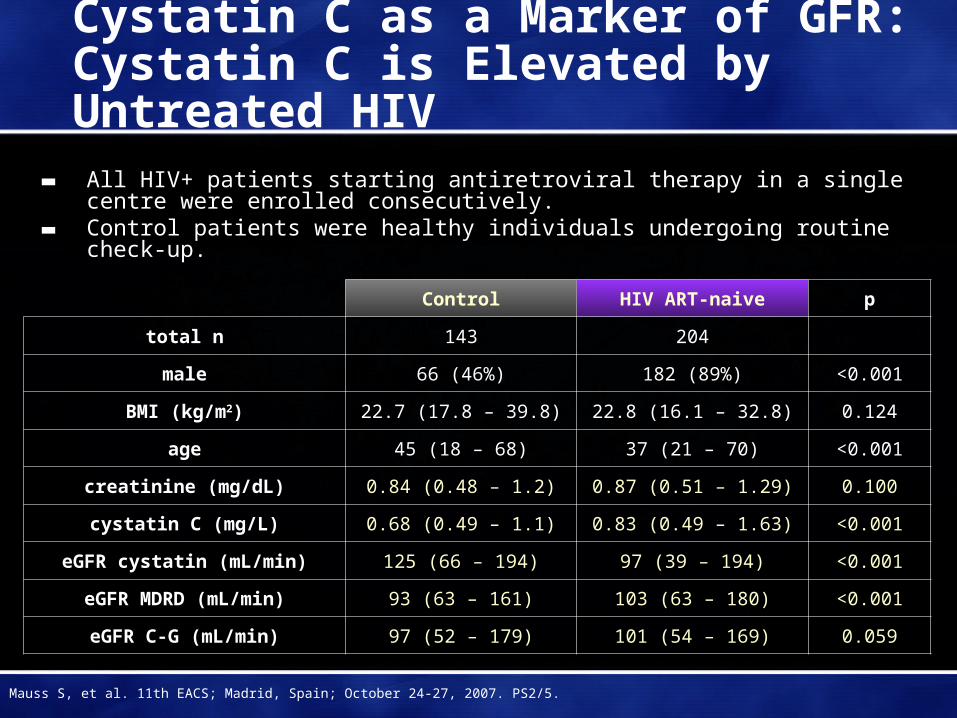
Cystatin C as a Marker of GFR:Cystatin C is Elevated by Untreated HIV
▬ All HIV+ patients starting antiretroviral therapy in a single centre were enrolled consecutively.
▬ Control patients were healthy individuals undergoing routine check-up.
Control HIV ART-naive p
total n 143 204
male 66 (46%) 182 (89%) <0.001
BMI (kg/m2) 22.7 (17.8 – 39.8) 22.8 (16.1 – 32.8) 0.124
age 45 (18 – 68) 37 (21 – 70) <0.001
creatinine (mg/dL) 0.84 (0.48 – 1.2) 0.87 (0.51 – 1.29) 0.100
cystatin C (mg/L) 0.68 (0.49 – 1.1) 0.83 (0.49 – 1.63) <0.001
eGFR cystatin (mL/min) 125 (66 – 194) 97 (39 – 194) <0.001
eGFR MDRD (mL/min) 93 (63 – 161) 103 (63 – 180) <0.001
eGFR C-G (mL/min) 97 (52 – 179) 101 (54 – 169) 0.059
Mauss S, et al. 11th EACS; Madrid, Spain; October 24-27, 2007. PS2/5.

0
1
2
3
4
5
6
7
8
9
Inci
denc
e (%
)
3.4%(27/803)
7.8%(66/847)
2.7%(23/842)
OR 0.40P < 0.0001
OR 0.03P < 0.0001
Control arm
Prospective HLA-B*5701 screening arm
Clinically SuspectedHSR
Immunologically ConfirmedHSR
Clinically Suspected and Immunologically Confirmed ABC HSR
0.0%(0/802)
(0.25, 0.62)
(0, 0.18)
PREDICT 1
Molina J-M, et al. 11th EACS; Madrid, Spain; October 24-27, 2007. PS5/1.

Management Issues
Brian Boyle MD
Weill Medical College of Cornell University
New York, NY
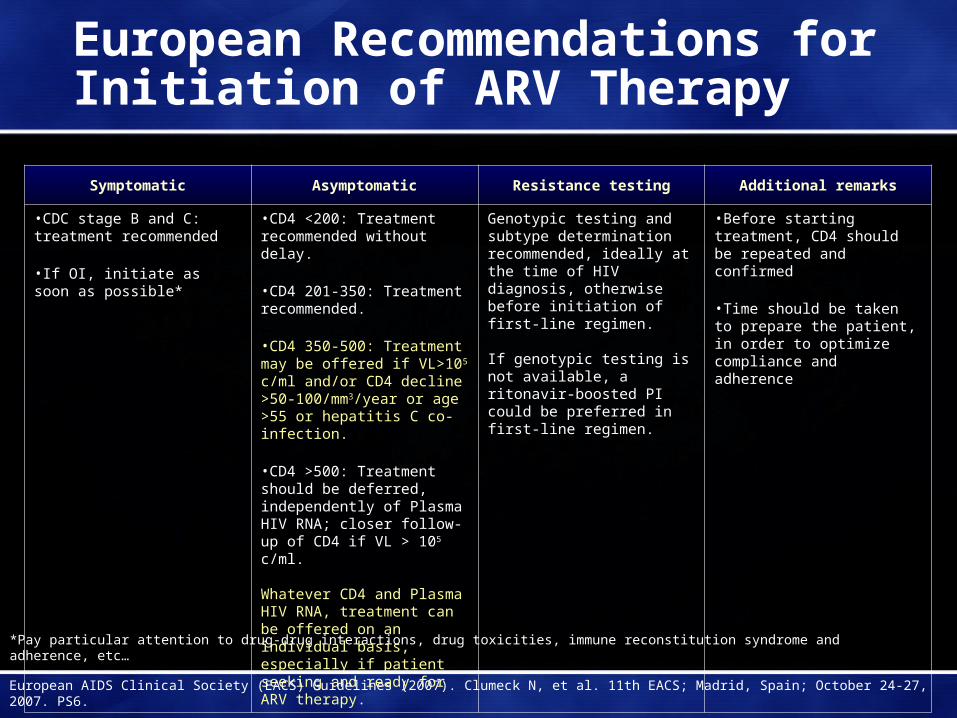
European Recommendations for Initiation of ARV Therapy
Symptomatic Asymptomatic Resistance testing Additional remarks
•CDC stage B and C: treatment recommended
•If OI, initiate as soon as possible*
•CD4 <200: Treatment recommended without delay.
•CD4 201-350: Treatment recommended.
•CD4 350-500: Treatment may be offered if VL>105 c/ml and/or CD4 decline >50-100/mm3/year or age >55 or hepatitis C co-infection.
•CD4 >500: Treatment should be deferred, independently of Plasma HIV RNA; closer follow-up of CD4 if VL > 105 c/ml.
Whatever CD4 and Plasma HIV RNA, treatment can be offered on an individual basis, especially if patient seeking and ready for ARV therapy.
Genotypic testing and subtype determination recommended, ideally at the time of HIV diagnosis, otherwise before initiation of first-line regimen.
If genotypic testing is not available, a ritonavir-boosted PI could be preferred in first-line regimen.
•Before starting treatment, CD4 should be repeated and confirmed
•Time should be taken to prepare the patient, in order to optimize compliance and adherence
*Pay particular attention to drug-drug interactions, drug toxicities, immune reconstitution syndrome and adherence, etc…
European AIDS Clinical Society (EACS) Guidelines (2007). Clumeck N, et al. 11th EACS; Madrid, Spain; October 24-27, 2007. PS6.
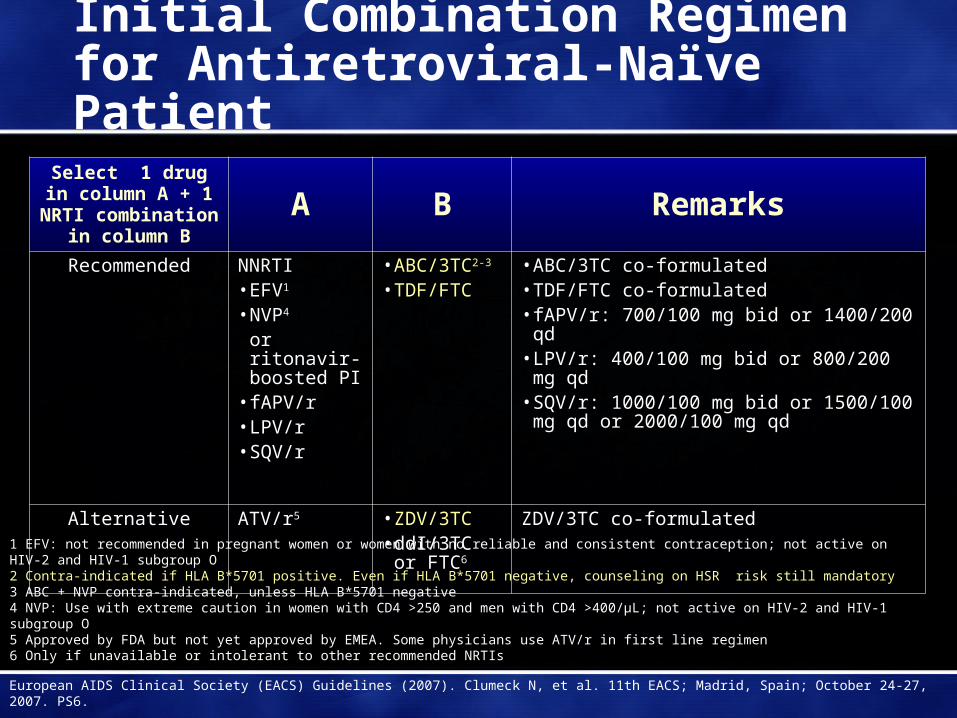
Initial Combination Regimen for Antiretroviral-Naïve Patient
Select 1 drug in column A + 1 NRTI
combination in column B
A B Remarks
Recommended NNRTI• EFV1
• NVP4
or ritonavir-boosted PI
• fAPV/r• LPV/r• SQV/r
• ABC/3TC2-3
• TDF/FTC• ABC/3TC co-formulated• TDF/FTC co-formulated• fAPV/r: 700/100 mg bid or 1400/200 qd• LPV/r: 400/100 mg bid or 800/200 mg qd• SQV/r: 1000/100 mg bid or 1500/100 mg qd
or 2000/100 mg qd
Alternative ATV/r5 • ZDV/3TC• ddI/3TC or
FTC6
ZDV/3TC co-formulated
European AIDS Clinical Society (EACS) Guidelines (2007). Clumeck N, et al. 11th EACS; Madrid, Spain; October 24-27, 2007. PS6.
1 EFV: not recommended in pregnant women or women with no reliable and consistent contraception; not active on HIV-2 and HIV-1 subgroup O2 Contra-indicated if HLA B*5701 positive. Even if HLA B*5701 negative, counseling on HSR risk still mandatory3 ABC + NVP contra-indicated, unless HLA B*5701 negative4 NVP: Use with extreme caution in women with CD4 >250 and men with CD4 >400/μL; not active on HIV-2 and HIV-1 subgroup O5 Approved by FDA but not yet approved by EMEA. Some physicians use ATV/r in first line regimen6 Only if unavailable or intolerant to other recommended NRTIs
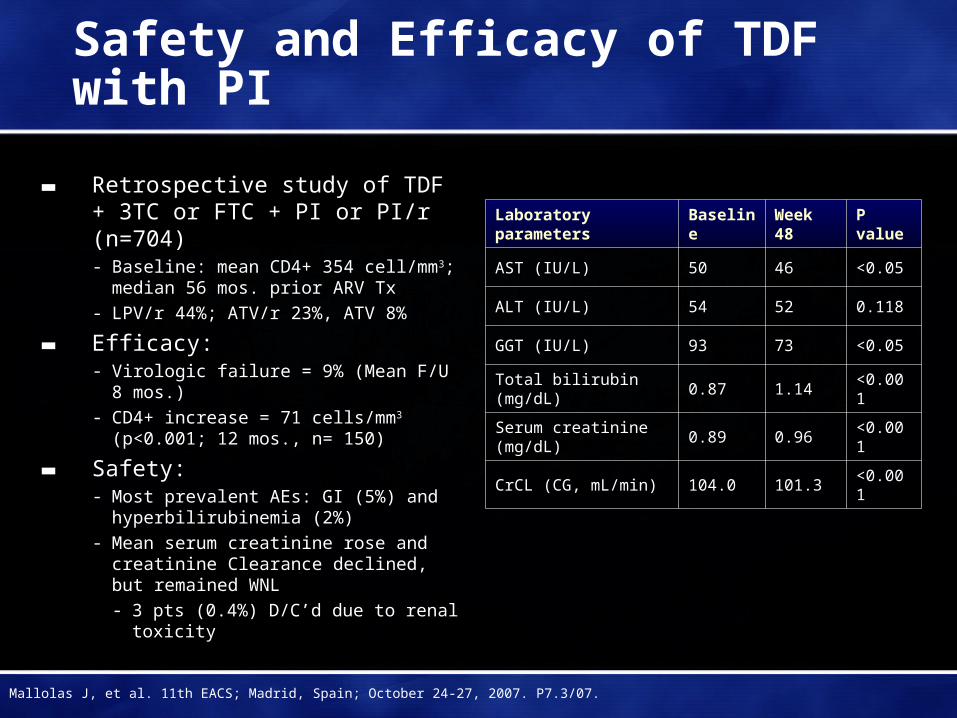
Safety and Efficacy of TDF with PI
▬ Retrospective study of TDF + 3TC or FTC + PI or PI/r (n=704)- Baseline: mean CD4+ 354 cell/mm3;
median 56 mos. prior ARV Tx
- LPV/r 44%; ATV/r 23%, ATV 8%
▬ Efficacy:- Virologic failure = 9% (Mean F/U 8 mos.)
- CD4+ increase = 71 cells/mm3 (p<0.001; 12 mos., n= 150)
▬ Safety:- Most prevalent AEs: GI (5%) and
hyperbilirubinemia (2%)
- Mean serum creatinine rose and creatinine Clearance declined, but remained WNL
- 3 pts (0.4%) D/C’d due to renal toxicity
Laboratory parameters BaselineWeek 48
P value
AST (IU/L) 50 46 <0.05
ALT (IU/L) 54 52 0.118
GGT (IU/L) 93 73 <0.05
Total bilirubin (mg/dL) 0.87 1.14 <0.001
Serum creatinine (mg/dL)
0.89 0.96 <0.001
CrCL (CG, mL/min) 104.0 101.3 <0.001
Mallolas J, et al. 11th EACS; Madrid, Spain; October 24-27, 2007. P7.3/07.
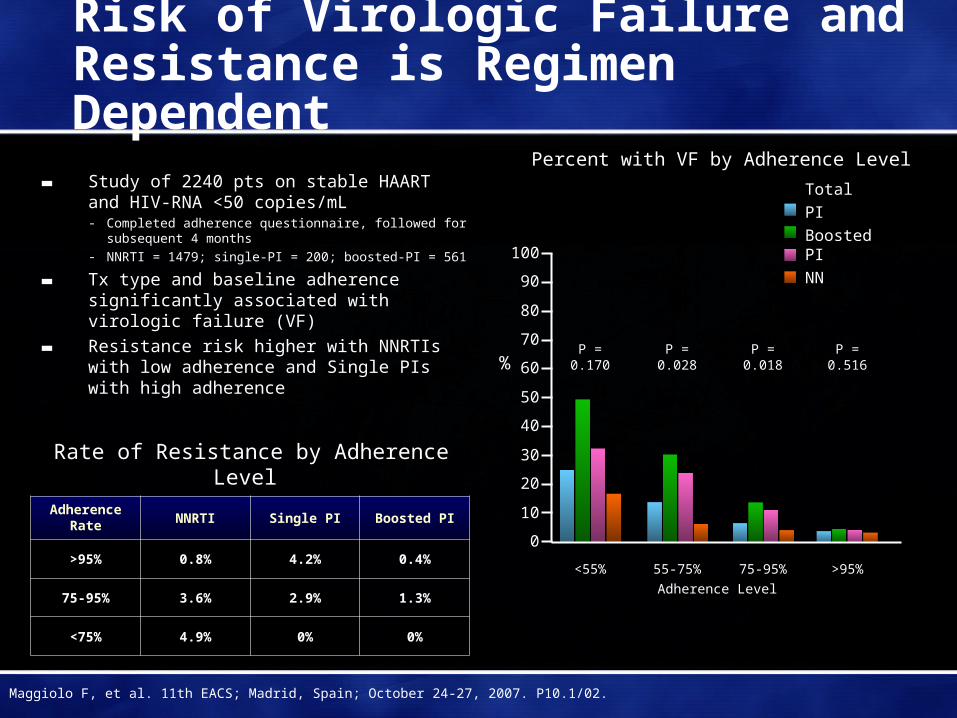
Risk of Virologic Failure and Resistance is Regimen Dependent
▬ Study of 2240 pts on stable HAART and HIV-RNA <50 copies/mL- Completed adherence questionnaire, followed for
subsequent 4 months
- NNRTI = 1479; single-PI = 200; boosted-PI = 561
▬ Tx type and baseline adherence significantly associated with virologic failure (VF)
▬ Resistance risk higher with NNRTIs with low adherence and Single PIs with high adherence
Percent with VF by Adherence Level
Adherence Rate NNRTI Single PI Boosted PI
>95% 0.8% 4.2% 0.4%
75-95% 3.6% 2.9% 1.3%
<75% 4.9% 0% 0%
Maggiolo F, et al. 11th EACS; Madrid, Spain; October 24-27, 2007. P10.1/02.
Rate of Resistance by Adherence Level
Total
PI
Boosted PI
NN
0
10
20
30
40
50
60
70
80
90
100
% P = 0.170 P = 0.028 P = 0.018 P = 0.516
<55% 55-75% 75-95% >95%
Adherence Level
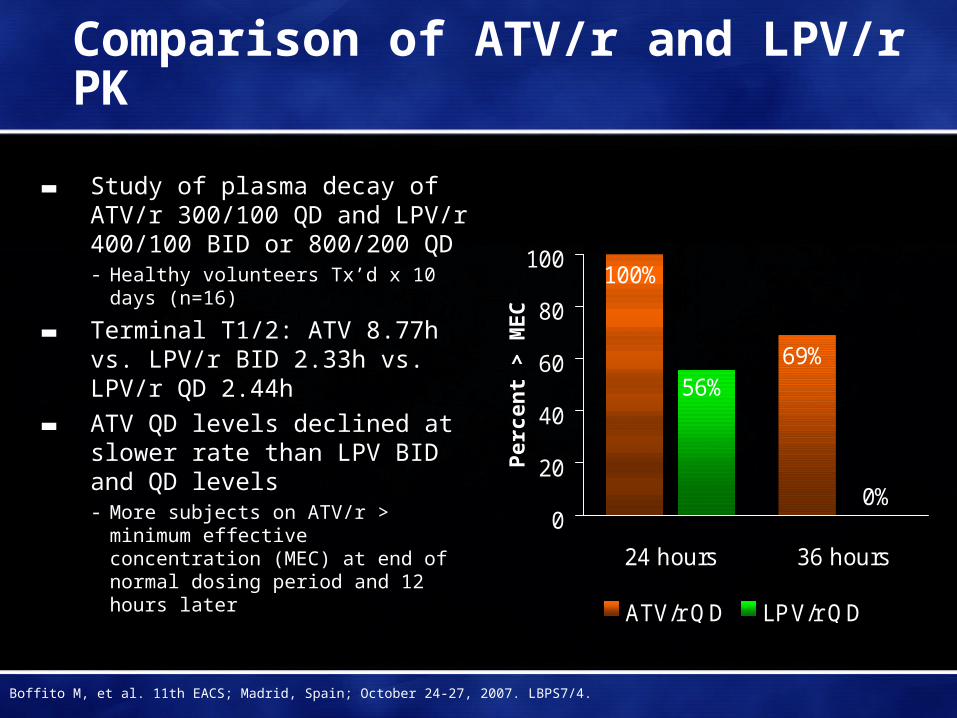
Comparison of ATV/r and LPV/r PK
▬ Study of plasma decay of ATV/r 300/100 QD and LPV/r 400/100 BID or 800/200 QD- Healthy volunteers Tx’d x 10 days
(n=16)
▬ Terminal T1/2: ATV 8.77h vs. LPV/r BID 2.33h vs. LPV/r QD 2.44h
▬ ATV QD levels declined at slower rate than LPV BID and QD levels- More subjects on ATV/r > minimum
effective concentration (MEC) at end of normal dosing period and 12 hours later
100%
69%
0%
56%
0
20
40
60
80
100
24 hours 36 hours
ATV/r QD LPV/r QD
Per
cen
t >
ME
C
Boffito M, et al. 11th EACS; Madrid, Spain; October 24-27, 2007. LBPS7/4.
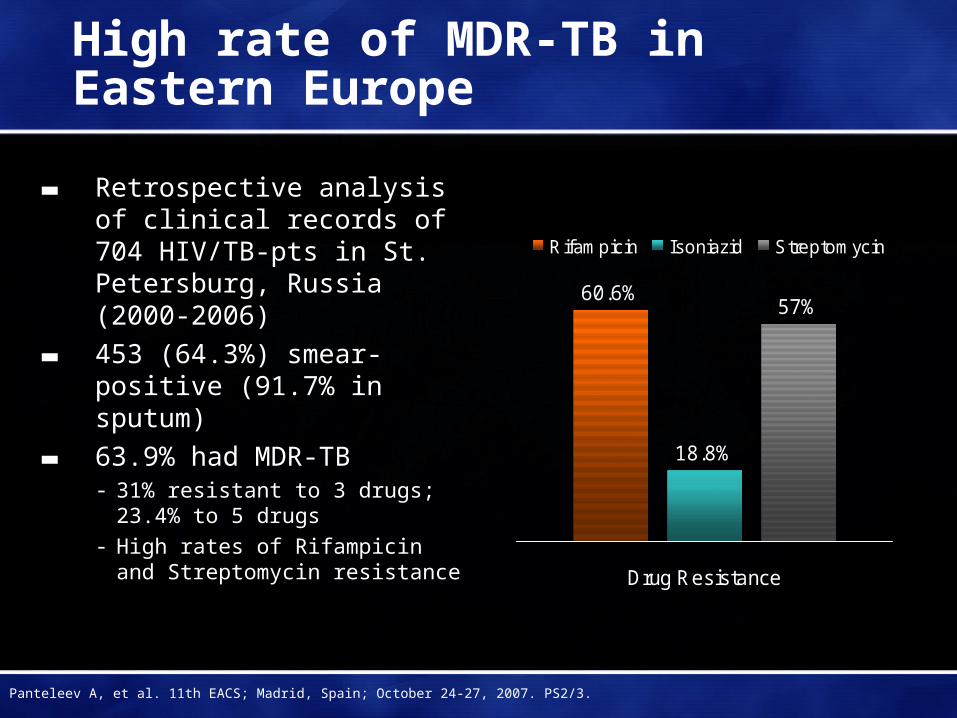
High rate of MDR-TB in Eastern Europe
▬ Retrospective analysis of clinical records of 704 HIV/TB-pts in St. Petersburg, Russia (2000-2006)
▬ 453 (64.3%) smear-positive (91.7% in sputum)
▬ 63.9% had MDR-TB- 31% resistant to 3 drugs; 23.4% to 5
drugs- High rates of Rifampicin and
Streptomycin resistance
60.6%
18.8%
57%
Drug Resistance
Rifampicin Isoniazid Streptomycin
Panteleev A, et al. 11th EACS; Madrid, Spain; October 24-27, 2007. PS2/3.
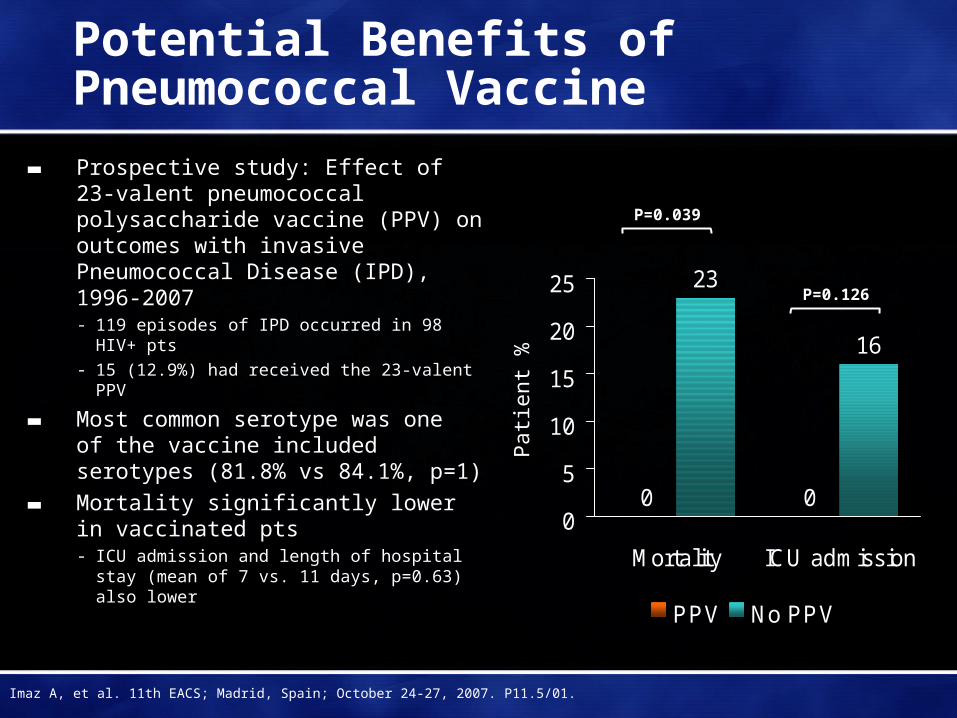
Potential Benefits of Pneumococcal Vaccine
▬ Prospective study: Effect of 23-valent pneumococcal polysaccharide vaccine (PPV) on outcomes with invasive Pneumococcal Disease (IPD), 1996-2007- 119 episodes of IPD occurred in 98 HIV+ pts
- 15 (12.9%) had received the 23-valent PPV
▬ Most common serotype was one of the vaccine included serotypes (81.8% vs 84.1%, p=1)
▬ Mortality significantly lower in vaccinated pts- ICU admission and length of hospital stay
(mean of 7 vs. 11 days, p=0.63) also lower
0 0
23
16
0
5
10
15
20
25
Mortality ICU admission
PPV No PPV
Pat
ient
%
P=0.039
P=0.126
Imaz A, et al. 11th EACS; Madrid, Spain; October 24-27, 2007. P11.5/01.
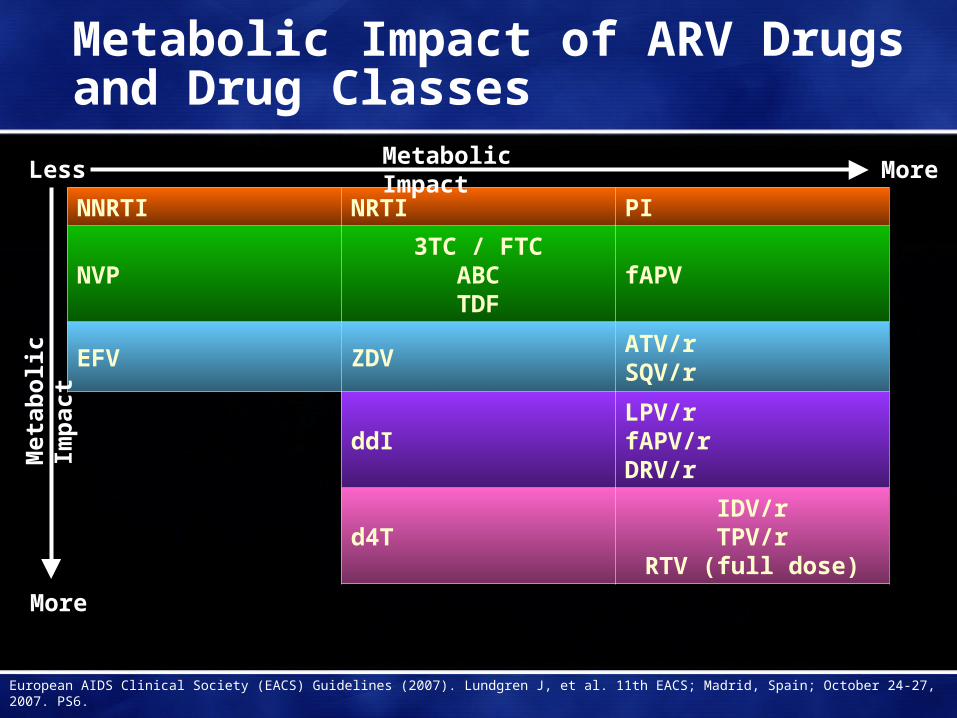
Metabolic Impact of ARV Drugs and Drug Classes
NNRTI NRTI PI
NVP3TC / FTC
ABCTDF
fAPV
EFV ZDVATV/rSQV/r
ddILPV/rfAPV/rDRV/r
d4TIDV/rTPV/r
RTV (full dose)
Less More
More
European AIDS Clinical Society (EACS) Guidelines (2007). Lundgren J, et al. 11th EACS; Madrid, Spain; October 24-27, 2007. PS6.
Metabolic Impact
Met
abo
lic
Imp
act

EACS Guidelines for Lipodystrophy
Lipoatrophy
▬ Prevention- Avoid d4T and ZDV or pre-emptively switch
away from them
▬ Management- Switch d4t or ZDV to ABC or TDF- Switch to regimen not including NRTIs
▬ Surgical intervention- Offered for cosmetic relief of facial lipoatrophy
only
▬ Pharmacological interventions to treat lipoatrophy have not been proven to be effective and may introduce new complications
Lipohypertrophy
▬ Prevention- No proven strategy- Weight gain expected with effective ART- Weight reduction or avoidance of weight gain
may decrease visceral adiposity
▬ Management- Diet and exercise may reduce visceral
adiposity
▬ Pharmacological interventions to treat lipohypertrophy have not been proven to provide long-term effects and may introduce new complications- Growth Hormone- Metformin- Surgical therapy can be considered for
localized lipomas/buffalo humps
European AIDS Clinical Society (EACS) Guidelines (2007). Lundgren J, et al. 11th EACS; Madrid, Spain; October 24-27, 2007. PS6.

Maraviroc Drug–Drug Interaction Studies
Effect of Maraviroc on other Drugs
▬ ARVsZidovudine (renal excretion)Lamivudine (renal excretion)
▬ OthersOral Contraceptives
EthinylestradiolLevonorgestrel
Midazolam (CYP3A4 probe)Debrisoquine metabolic ratio (CYP2D6 probe)6 β-hydroxycortisol/cortisol ratio (CYP3A4 induction probe)
Effect of other Drugs on Maraviroc
▬ ARVsAtazanavir (± RTV)Darunavir EfavirenzElvitegravirEtravirineLopinavir/r (± EFV)RitonavirSaquinavir Saquinavir/r (± EFV)TenofovirTipranavir/r
▬ OthersKetoconazoleRifampinSulfamethoxazole/trimethoprim
Davis J, et al. 11th EACS; Madrid, Spain; October 24-27, 2007. P4.3/02; Mcfadyen M, et al. Ibid. P4.1/06
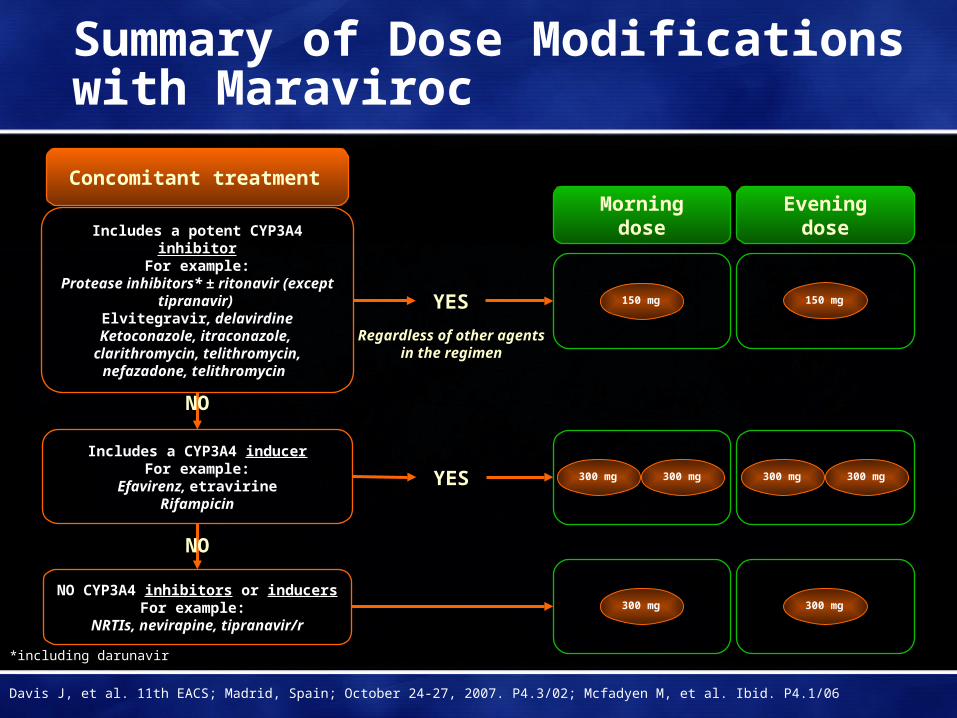
Includes a CYP3A4 inducerFor example:
Efavirenz, etravirineRifampicin
Includes a potent CYP3A4 inhibitorFor example:
Protease inhibitors* ± ritonavir (except tipranavir)
Elvitegravir, delavirdineKetoconazole, itraconazole,
clarithromycin, telithromycin, nefazadone, telithromycin
150 mg
YES
YES
Regardless of other agents in the regimen
NO CYP3A4 inhibitors or inducersFor example:
NRTIs, nevirapine, tipranavir/r
150 mg
Morning dose Evening dose
300 mg300 mg 300 mg300 mg
300 mg 300 mg
Concomitant treatment
Summary of Dose Modifications with Maraviroc
*including darunavir
Davis J, et al. 11th EACS; Madrid, Spain; October 24-27, 2007. P4.3/02; Mcfadyen M, et al. Ibid. P4.1/06
NO
NO

Elvitegravir Drug-Drug Interaction Studies
NRTIs•FTC/TDF
•ddI
•d4T
•ABC
•ZDV
PIs• DRV/r
• TPV/r
• ATV/r
• LPV/r
• FPV/r
Other Agents• Antacids
• Omeprazole
• Rifabutin
• Ketoconazole
Other Studies• Ritonavir-boosting dose ranging
• Mass Balance
• QT/QTc
• Special populations (pediatrics, hepatic impairment)
New ARVs• TMC125
• Maraviroc
Ramanathan S, et al. 11th EACS; Madrid, Spain; October 24-27, 2007. PS4/7.
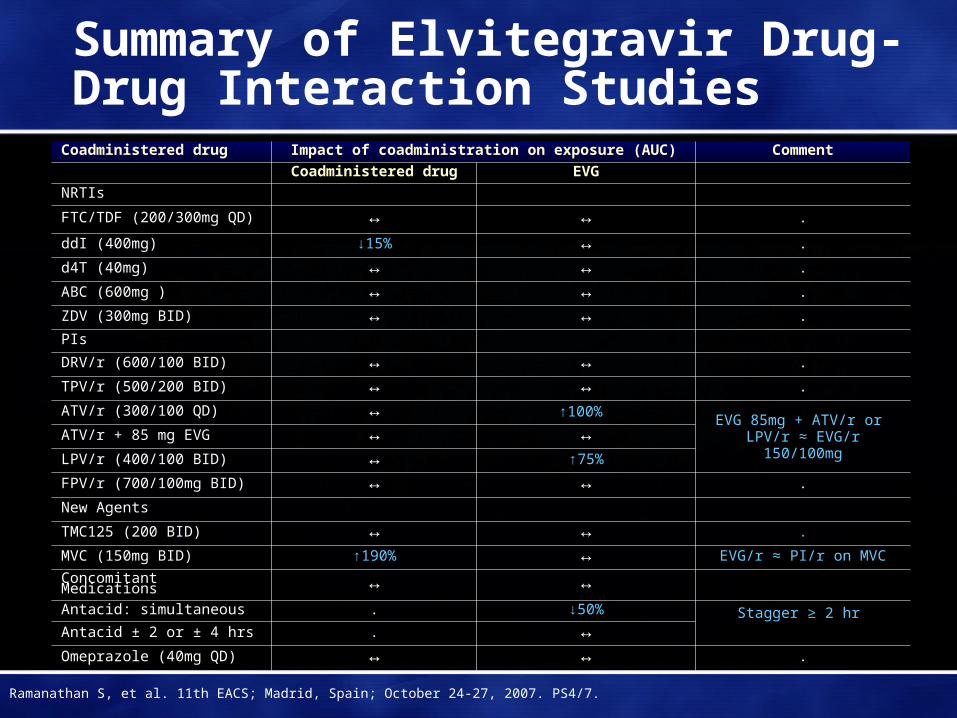
Summary of Elvitegravir Drug-Drug Interaction Studies
Coadministered drug Impact of coadministration on exposure (AUC) Comment
Coadministered drug EVG
NRTIs
FTC/TDF (200/300mg QD) ↔ ↔ .
ddI (400mg) ↓15% ↔ .
d4T (40mg) ↔ ↔ .
ABC (600mg ) ↔ ↔ .
ZDV (300mg BID) ↔ ↔ .
PIs
DRV/r (600/100 BID) ↔ ↔ .
TPV/r (500/200 BID) ↔ ↔ .
ATV/r (300/100 QD) ↔ ↑100% EVG 85mg + ATV/r or
LPV/r ≈ EVG/r 150/100mgATV/r + 85 mg EVG ↔ ↔LPV/r (400/100 BID) ↔ ↑75%
FPV/r (700/100mg BID) ↔ ↔ .
New Agents
TMC125 (200 BID) ↔ ↔ .
MVC (150mg BID) ↑190% ↔ EVG/r ≈ PI/r on MVC
Concomitant Medications ↔ ↔Antacid: simultaneous . ↓50% Stagger ≥ 2 hr Antacid ± 2 or ± 4 hrs . ↔Omeprazole (40mg QD) ↔ ↔ .
Ramanathan S, et al. 11th EACS; Madrid, Spain; October 24-27, 2007. PS4/7.
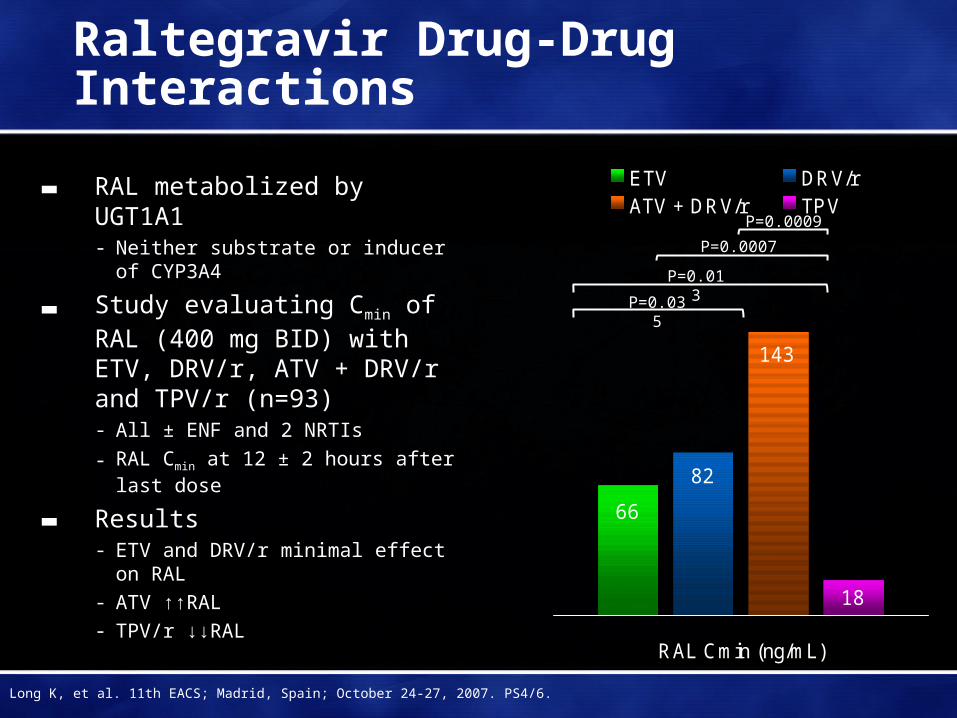
Raltegravir Drug-Drug Interactions
▬ RAL metabolized by UGT1A1- Neither substrate or inducer of
CYP3A4
▬ Study evaluating Cmin of RAL (400 mg BID) with ETV, DRV/r, ATV + DRV/r and TPV/r (n=93)- All ± ENF and 2 NRTIs
- RAL Cmin at 12 ± 2 hours after last dose
▬ Results- ETV and DRV/r minimal effect on RAL- ATV ↑↑RAL- TPV/r ↓↓RAL
66
82
143
18
RAL Cmin (ng/mL)
ETV DRV/rATV + DRV/r TPV
P=0.035
P=0.013
P=0.0007
P=0.0009
Long K, et al. 11th EACS; Madrid, Spain; October 24-27, 2007. PS4/6.
No Effect of TDF/FTC on NVP Levels
▬ PK sub-study of open label trial of FTC, TDF, and NVP in ARV-naïve patients (n=7)- PK sampling at week 2 and week 8
▬ Mean NVP Cmin levels at weeks 2 and 8 were 2876 and 4971 ng/mL- Range and SD of the week 8 values was 2330-8300 ng/mL and 1985 ng/mL
- Week 2 normalized Cmin (Cmin/Dose) was 0.86
▬ The median reduction in HIV RNA at week 8 from baseline was 2.69 log10 copies/mL
▬ TDF/FTC have no effect on NVP concentrations and combination is associated with a potent antiviral response
Davis C, et al. 11th EACS; Madrid, Spain; October 24-27, 2007. P4.1/03.
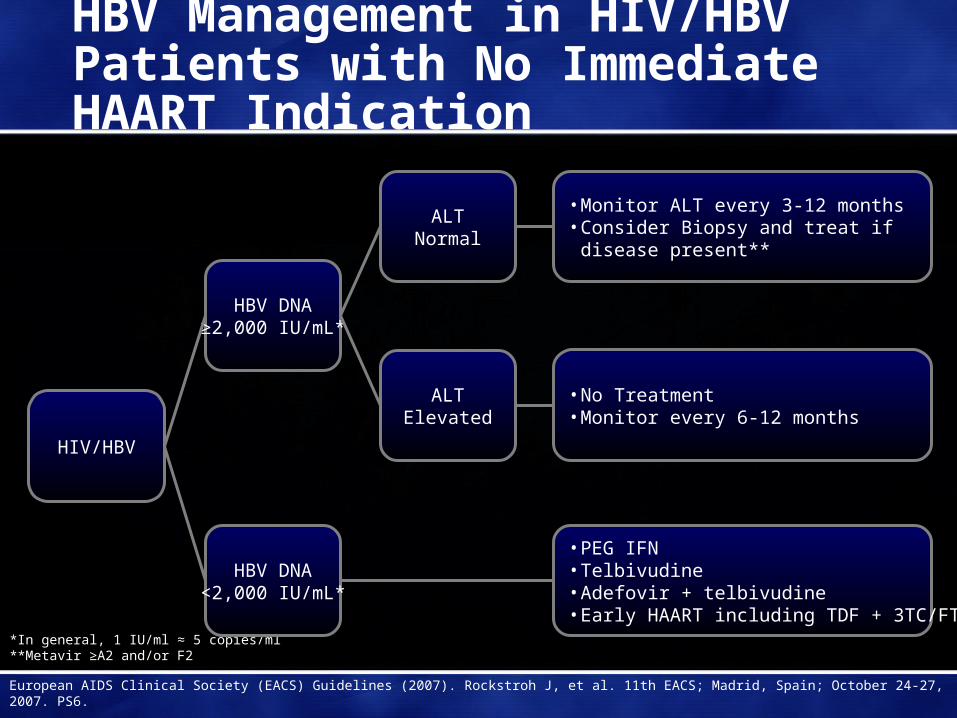
HBV Management in HIV/HBV Patients with No Immediate HAART Indication
*In general, 1 IU/ml ≈ 5 copies/ml**Metavir ≥A2 and/or F2
European AIDS Clinical Society (EACS) Guidelines (2007). Rockstroh J, et al. 11th EACS; Madrid, Spain; October 24-27, 2007. PS6.
• No Treatment• Monitor every 6-12 months
• PEG IFN• Telbivudine• Adefovir + telbivudine• Early HAART including TDF + 3TC/FTC
• Monitor ALT every 3-12 months• Consider Biopsy and treat if
disease present**
HBV DNA<2,000 IU/mL*
HBV DNA≥2,000 IU/mL*
ALTNormal
ALTElevated
HIV/HBV
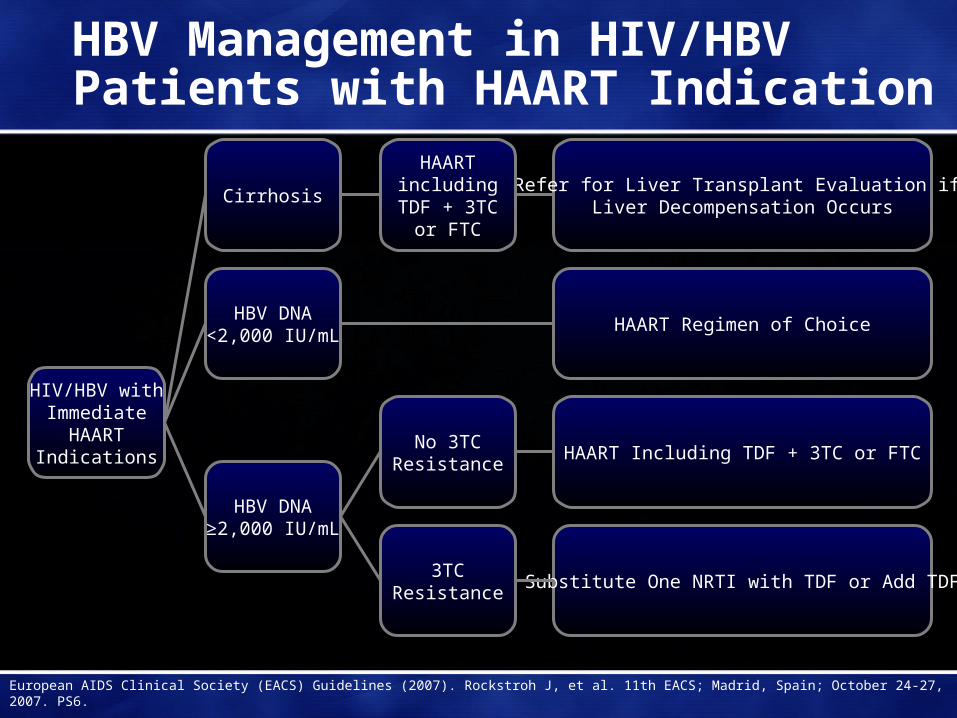
HBV Management in HIV/HBV Patients with HAART Indication
European AIDS Clinical Society (EACS) Guidelines (2007). Rockstroh J, et al. 11th EACS; Madrid, Spain; October 24-27, 2007. PS6.
HAART Including TDF + 3TC or FTC
Substitute One NRTI with TDF or Add TDF
Refer for Liver Transplant Evaluation if Liver Decompensation Occurs
3TCResistance
Cirrhosis
HAARTincluding
TDF + 3TCor FTC
No 3TCResistance
HIV/HBV withImmediate
HAARTIndications
HBV DNA≥2,000 IU/mL
HBV DNA<2,000 IU/mL
HAART Regimen of Choice
20%
80%
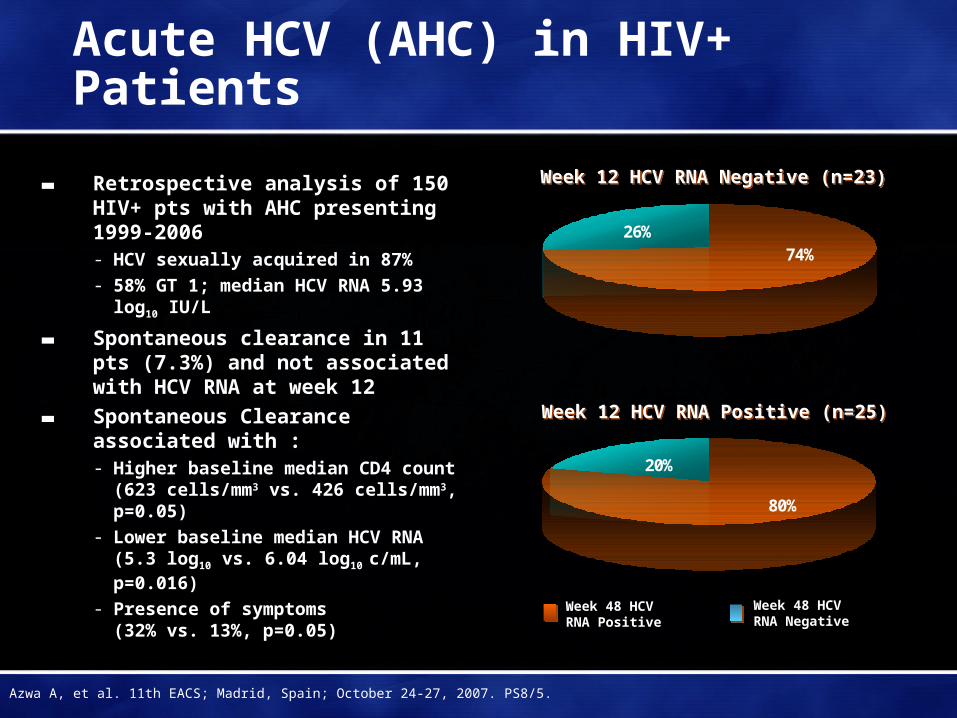
Acute HCV (AHC) in HIV+ Patients
▬ Retrospective analysis of 150 HIV+ pts with AHC presenting 1999-2006- HCV sexually acquired in 87%
- 58% GT 1; median HCV RNA 5.93 log10 IU/L
▬ Spontaneous clearance in 11 pts (7.3%) and not associated with HCV RNA at week 12
▬ Spontaneous Clearance associated with :- Higher baseline median CD4 count
(623 cells/mm3 vs. 426 cells/mm3, p=0.05)
- Lower baseline median HCV RNA (5.3 log10 vs. 6.04 log10 c/mL, p=0.016)
- Presence of symptoms (32% vs. 13%, p=0.05)
Azwa A, et al. 11th EACS; Madrid, Spain; October 24-27, 2007. PS8/5.
26%74%
Week 12 HCV RNA Negative (n=23)Week 12 HCV RNA Negative (n=23)
Week 12 HCV RNA Positive (n=25)Week 12 HCV RNA Positive (n=25)
Week 48 HCV RNA Positive
Week 48 HCV RNA Negative
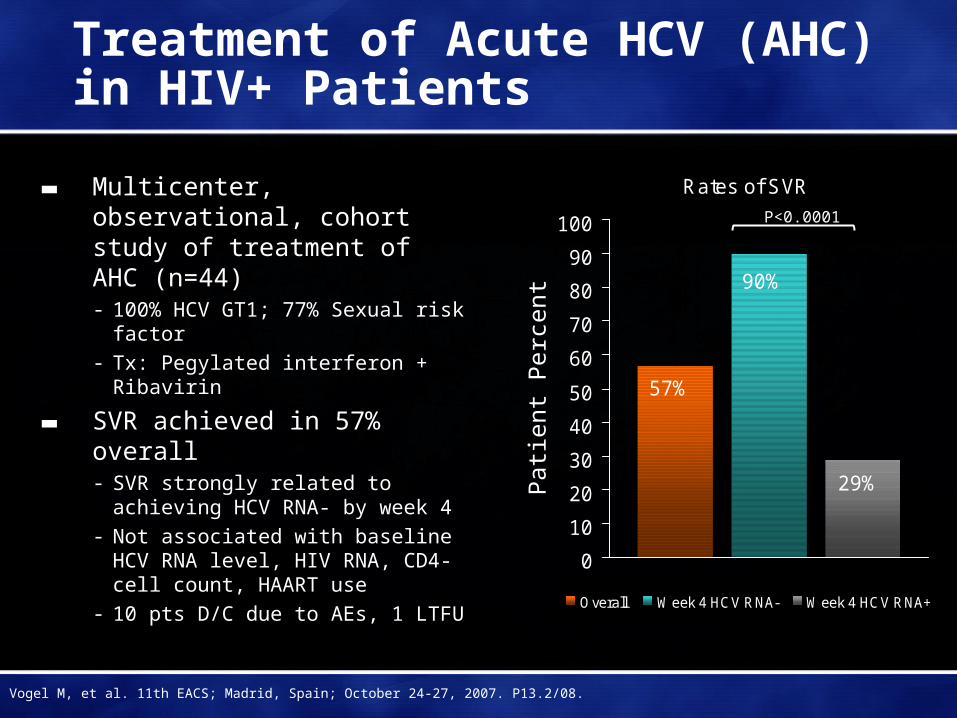
Treatment of Acute HCV (AHC) in HIV+ Patients
▬ Multicenter, observational, cohort study of treatment of AHC (n=44)- 100% HCV GT1; 77% Sexual risk
factor- Tx: Pegylated interferon + Ribavirin
▬ SVR achieved in 57% overall - SVR strongly related to achieving
HCV RNA- by week 4- Not associated with baseline HCV
RNA level, HIV RNA, CD4-cell count, HAART use
- 10 pts D/C due to AEs, 1 LTFU
Rates of SVR
57%
90%
29%
0
10
20
30
40
50
60
70
80
90
100
Overall Week 4 HCV RNA- Week 4 HCV RNA+
Vogel M, et al. 11th EACS; Madrid, Spain; October 24-27, 2007. P13.2/08.
Pat
ient
Per
cent
P<0.0001