Embed Size (px)
Citation preview

Emerging Financial Markets11. Raw Materials & Natural Resources
Prof. J.P. Mei
Note: Most materials used here are adopted from a research from Naissance. It is to be used for classroom discussion only.
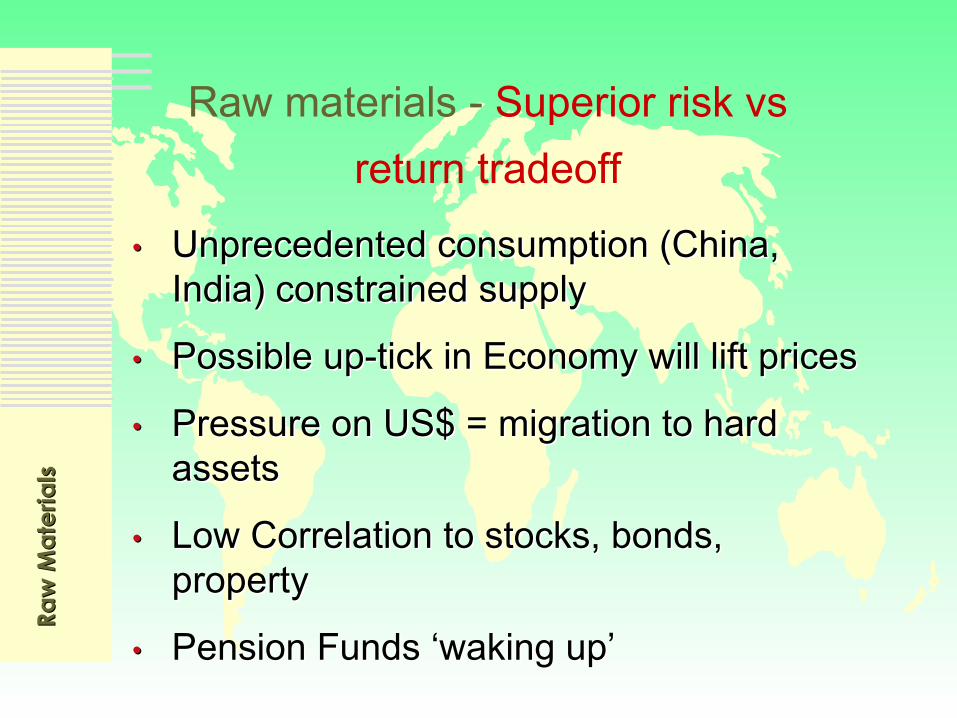
Raw materials - Superior risk vsreturn tradeoff
Raw
Mat
eria
lsRa
w M
ater
ials
•• Unprecedented consumption (China, Unprecedented consumption (China, India) constrained supplyIndia) constrained supply
•• Possible upPossible up--tick in Economy will lift pricestick in Economy will lift prices
•• Pressure on US$ = migration to hard Pressure on US$ = migration to hard assetsassets
•• Low Correlation to stocks, bonds, Low Correlation to stocks, bonds, propertyproperty
•• Pension Funds ‘waking up’Pension Funds ‘waking up’

Superior Risk / Return TradeoffRa
w M
ater
ials
Raw
Mat
eria
ls
Equities (last 5 years)
Equities (Historical)
Naissance Raw Materials
Real Estate
Corporate Bonds
US Treasury Bill
-4
0
4
8
12
16
0 5 10 15 20 25
Risk - Annualized Std. Deviation %
Annu
aliz
ed R
etur
n %
better value
worse value

Rising Population = Rising demand
Raw
Mat
eria
lsRa
w M
ater
ials

Growth Means ConsumptionRa
w M
ater
ials
Raw
Mat
eria
ls
Source: World Bank
0 10 20 30 40 50 60
Years
China 1977 - 1987
Republic of Korea 1966 - 1977
India 1980 - 1998
Brazil 1961 - 1979
Turkey 1857 - 1877
Japan 1885 - 1919
Unites States 1839 - 1886
United Kingdom 1780 - 1888
Doubling of GDP per person

Unprecedented ConsumptionRa
w M
ater
ials
Raw
Mat
eria
ls
Source:Goldman Sachs
Estimated Year China, India and Russia GDP surpass developed economies
2000 2010 2020 2030 2040 2050
China
India
Russia
UK Germany Japan USA
Italy France Germany Japan
Italy France Germany

China: Give vs TakeRa
w M
ater
ials
Raw
Mat
eria
ls
Source: Rio Tinto
Alumina Lead Molybdenum TinBorates Salt Talc Thermal CoalCopper TiO2 feedstockIron Ore Zinc
Copper Steel Aluminum MagnesiumNickel Titanium Pigments Lead ZincPlatinum
Raw Materials
Processsed Materials
ExporterImporter
ExporterImporter

Example: Iron oreRa
w M
ater
ials
Raw
Mat
eria
ls
China - iron ore imports
0
50
100
150
200
250
300
350
1990
1992
1994
1996
1998
2000
2002
2004
2006
2008
2010
Mill
ion
tonn
es
Source: Financial Times
(in orange: forecasts)
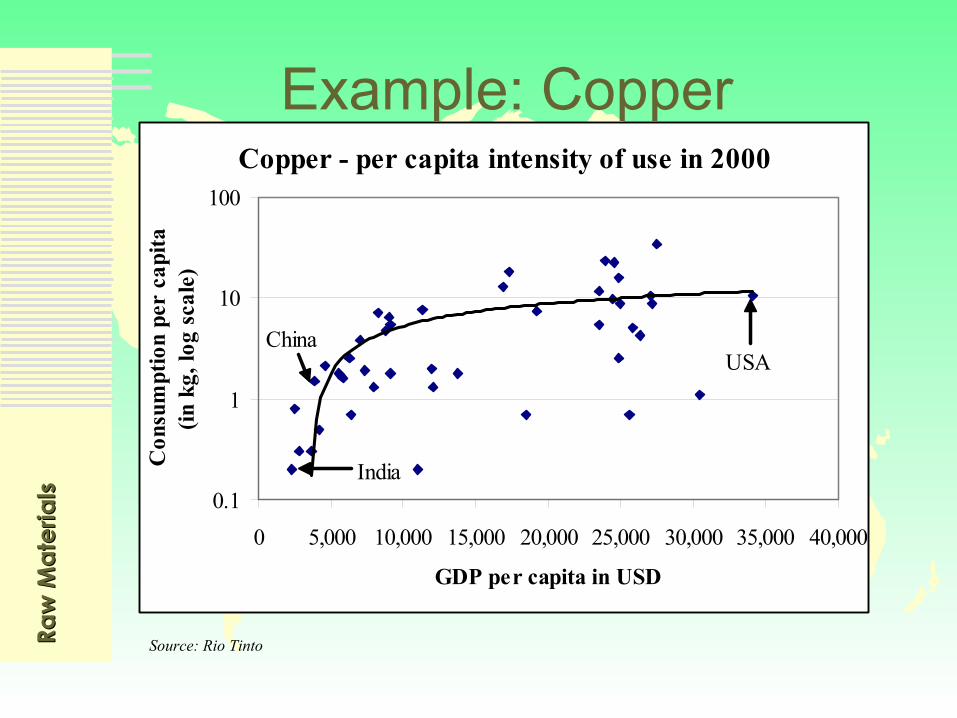
Example: CopperRa
w M
ater
ials
Raw
Mat
eria
ls
Source: Rio Tinto
Copper - per capita intensity of use in 2000
0.1
1
10
100
0 5,000 10,000 15,000 20,000 25,000 30,000 35,000 40,000
GDP per capita in USD
Con
sum
ptio
n pe
r ca
pita
(in k
g, lo
g sc
ale)
USAChina
India

Example: Chinese Timber ImportsRa
w M
ater
ials
Raw
Mat
eria
ls
Source: FAO
2003 – 2005 estimates
Rising Chinese imports
0
10
20
30
40
50
1997 1998 1999 2000 2001 2002 2003 2004 2005
Mill
ion
Cubi
c Met
ers

Chinese Timber Consumption: Driving ForcesRa
w M
ater
ials
Raw
Mat
eria
ls
•• Privatization of statePrivatization of state--owned housingowned housing
•• 2008 Beijing Olympics: 2nd largest public 2008 Beijing Olympics: 2nd largest public work i.e. 100 work i.e. 100 –– 130 million square feet of 130 million square feet of new housing (670,000 units) new housing (670,000 units)
•• 1998 Logging Ban implemented due to 1998 Logging Ban implemented due to erosion = constraints in forest usageerosion = constraints in forest usage
•• Explosive industrial growth (Explosive industrial growth (ieie GDP +8,5%)GDP +8,5%)

Timber Investment ReturnsRa
w M
ater
ials
Raw
Mat
eria
ls
Source: Hancock Timber Resource Group
Performance of Timber Portfolios in different regions over the past 20 years
0%
5%
10%
15%
20%
10.00% 15.00% 20.00% 25.00% 30.00%
Pacific Northwest
British Columbia
New Zealand

Fewer CompetitorsRa
w M
ater
ials
Raw
Mat
eria
ls
Source: Cazenove
Proportion of production controlled by top 5 producers
0%
20%
40%
60%
80%
100%
Platin
umDiam
onds
Traded
iron o
re
Titaniu
m feed
stock
Nickel
Traded
Therm
al Coa
lAlum
inaCop
per
Alumini
umCok
ing C
oal
Gold Zinc Steel

Pension Funds ‚Waking Up‘
Raw
Mat
eria
lsRa
w M
ater
ials
•• Largest Dutch Pension Fund (ABP) Largest Dutch Pension Fund (ABP) allocating up to 5% of $160 billion allocating up to 5% of $160 billion
•• Goldman Sachs now recommends Goldman Sachs now recommends allocation of 5% to US institutionsallocation of 5% to US institutions
•• AIG established own raw materials AIG established own raw materials index, allocating 3% of own fundsindex, allocating 3% of own funds‘Sheep like behavior’ will drive raw ‘Sheep like behavior’ will drive raw material price increasesmaterial price increases

Raw
Mat
eria
lsRa
w M
ater
ials
Raw Material Index CompositionAgriculture Orange Juice 0.66% ForestryWheat 2.33% Oats 0.50% Timber 10.00%Corn 1.33% Silk 0.15% Rubber 1.00%Cotton 1.00% Flaxseed 0.15%Soybeans 1.00% Industrial MetalsLive Cattle 1.00% Precious Metals Copper 7.00%Coffee 1.00% Gold 15.00% Iron Ore 6.00%Rice 1.00% Platinum 6.00% Nickel 4.00%Palm Oil/Soybean Oil 1.00% Silver 2.00% Aluminum 1.20%Live Hogs 0.67% Palladium 1.75% Lead 0.50%Sugar 0.66% Zinc 0.40%Azuki Beans 0.66% Energy Tin 0.40%Cocoa 0.66% Crude Oil 20.00%Wool 0.66% Heating Oil/Diesel 3.00%Barley 0.66% Unleaded Gas 3.00%Canola 0.66% Natural Gas 3.00% Total 100.00%
China Net Imports
Σ 's 79.33%

PerformanceRa
w M
ater
ials
Raw
Mat
eria
ls
Name YTDCompounded
Annual ReturnAnnualized
STD1 S. Korean KOSPI Index 13.7% 15.8% 38.1%2 Naissance Raw Materials 14.0% 14.7% 18.1%
3Lehman Brothers Treasury Bond Index -3.1% 6.9% 9.3%
4 Barclays CTA Index 3.2% 6.5% 8.7%
5JP Morgan World Government Bond Index 4.2% 6.1% 7.3%
6Dow Jones AIG Commodity Index 5.6% 5.2% 15.3%
7 S&P Commodity Index 5.7% 4.3% 17.2%8 Treasury Bills US 0.6% 3.6% 0.5%9 S&P 500 13.7% -1.1% 18.8%
10NASDAQ Composite Index 29.9% -1.5% 37.5%
* August 1, 1998 till July 31, 2003

Low Correlation to Stocks/ BondsRa
w M
ater
ials
Raw
Mat
eria
ls
NRM EAFE S&P 500 JPMGNaissance Raw Material (NRM) 1.00
MSCI EAFE* (EAFE) 0.18 1.00
S&P 500 0.13 0.84 1.00JP Morgan Gov't Bond Index (JPMG) 0.19 0.04 -0.11 1.00
*MSCI World excluding North America
Source: MSCI, Bloomberg

Greenback vs GreenspanRa
w M
ater
ials
Raw
Mat
eria
ls
US Living beyond its means:US Living beyond its means:
US Consumer; Corp. debt at all time highsUS Consumer; Corp. debt at all time highs
Budget Deficit (financing of Iraq)Budget Deficit (financing of Iraq)
Unprecedented Trade Deficit and GrowingUnprecedented Trade Deficit and Growing
FED has ‘little rope left’ FED has ‘little rope left’
US borrowing other peoples’ savings (China, US borrowing other peoples’ savings (China, Japan) to make ends meetJapan) to make ends meet
US$ weakness shifts investor attention to hard assets

Leveraged US ConsumerRa
w M
ater
ials
Raw
Mat
eria
ls
Rising Household Debt
0
2,000
4,000
6,000
8,000
10,000
1974 1981 1988 1995 2002
in b
illio
n 19
96 U
SD
40%
50%
60%
70%
80%
90%
Household Debt Household debt as % of GDP

Uncle Sam Borrows too Much !Ra
w M
ater
ials
Raw
Mat
eria
ls
Rising Public Debt
01,0002,0003,0004,0005,0006,0007,000
1974 1981 1988 1995 2002
in b
illio
ns 1
996
US
D
30%
40%
50%
60%
70%
Public debt Public debt as % of GDP

Weaker $ needed to Reverse Trade DeficitRa
w M
ater
ials
Raw
Mat
eria
ls
Rising Current Acount Deficit
-500-400-300-200-100
0100
1974 1981 1988 1995 2002in b
illio
ns 1
996
USD
-6.0%
-4.0%
-2.0%
0.0%
2.0%
Current Account deficitCurrent account deficit as % of GDP

Investment Strategy:Ra
w M
ater
ials
Raw
Mat
eria
ls
• Highly diversified
• Index Approach
• Emphasise Commodities China / India need in greatest quantities
• Prefer Capital intensive commodities, with long lead time to adjust supply (ie 7 yrs to start new Copper mines)
• Precious Metals raised to about 25% due to US$ malaise
• 18-36 mos view – modest annual adjustments

AIG Guarantee: An Interesting Product Feature
Raw
Mat
eria
lsRa
w M
ater
ials
•• Optional Optional –– for risk averse investorsfor risk averse investors
•• AAAAAA
•• 100% capital guarantee100% capital guarantee
•• 8 years8 years•• 100% participation in capital 100% participation in capital
appreciationappreciation•• Monthly liquidityMonthly liquidity

Terms & ConditionsRa
w M
ater
ials
Raw
Mat
eria
ls
Flat Fee- with guarantee 2.00%- without guarantee 1.25%
Performance Fee 20.00%High Water Mark YesPlace of domicile Cayman IslandsMinimum Investment USD 100,000Currency of denomination EUR / USDHedging Policy Currency hedgedRedemption policy Monthly Reporting of NAV Monthly (more frequently
on request)Custodian UBSAuditors PricewaterhouseCoopersLawyers Maples & CalderPortfolio Administration Citco