Embed Size (px)
Citation preview
11 October, 2016, Petten
#REmap
◉ IRENA’s REmap programme explores potential, cost and benefits
of doubling the share of renewables in global energy mix (SE4ALL
objective), key to realize SDG 7: Affordable and clean energy
◉ Technology Options:
◎ This is no a target setting exercise
◎ Each technology option is characterized by its cost and potentials
◎ Technology options can be combined into roadmaps or plans and translated into
policy action
◉ Includes power, district heat, end-uses (industry, transport, buildings)
◎ Including sector coupling and power systems aspects
◉ Developed together with and validated by country experts
The REmap approach
2
#REmap
◉ REmap global analysis issued March 2016
◉ Today 50 country roadmaps covering 85% of global energy use ◉ 10 country reports, 4 regional reports
◉ Bottom-up analysis of technology options to accelerate RE use ◉ Developed in close cooperation with country experts
◉ Leading institutes CNREC, NREL, UCC etc.
◉ All data, assumptions and detailed results are available online: ◉ www.irena.org/remap - new REmap on REsource Dashboard
◉ Analysis can inform areas for cooperation and joint action, including
investment, cost, benefits (climate, environment, security, macro-
economics) of possible new RE objectives
Country potentials and technology roadmaps
3
#REmap
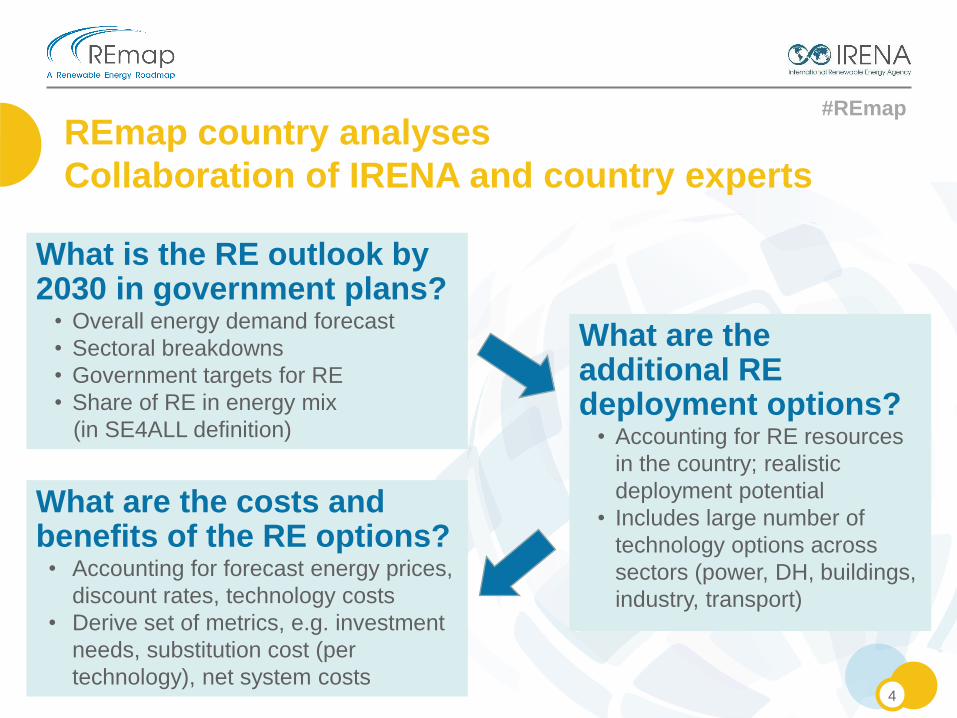
REmap country analyses
Collaboration of IRENA and country experts
4
What is the RE outlook by 2030 in government plans?
• Overall energy demand forecast
• Sectoral breakdowns
• Government targets for RE
• Share of RE in energy mix
(in SE4ALL definition)
What are the costs and benefits of the RE options? • Accounting for forecast energy prices,
discount rates, technology costs
• Derive set of metrics, e.g. investment
needs, substitution cost (per
technology), net system costs
What are the additional RE deployment options?
• Accounting for RE resources
in the country; realistic
deployment potential
• Includes large number of
technology options across
sectors (power, DH, buildings,
industry, transport)
#REmap
◉ Sustainable energy and climate change objectives can be reached
by doubling the share of renewable energy by 2030
◉ Doubling renewables in the world’s energy mix by 2030 will lead to
savings exceeding costs up to 15 times
◉ Savings related to air pollution alone are up to 10 times more
than costs
◉ The transition to renewables, with greater energy efficiency, can
limit the global temperature increase to below 2 degrees
◉ Doubling the share of renewable energy by 2030 is feasible, but
only with immediate, concerted action in transport, buildings
and industry
REmap 2030 highlights
5
#REmap
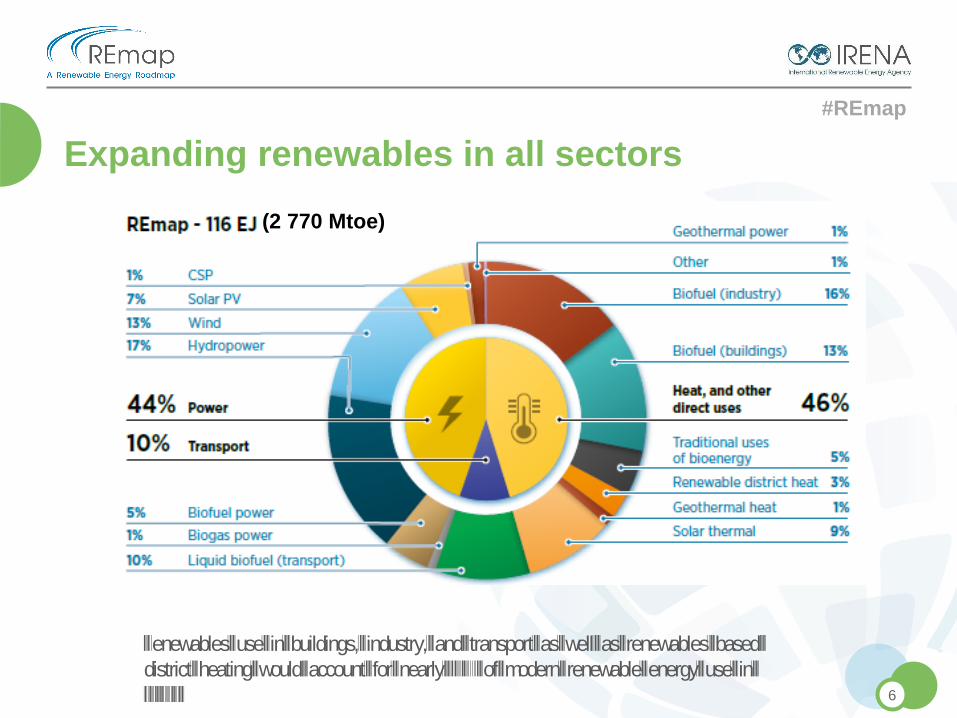
Renewables use in buildings, industry, and transport as well as renewables-based
district heating would account for nearly 60% of modern renewable energy use in
2030
Expanding renewables in all sectors
6
(2 770 Mtoe)
#REmap
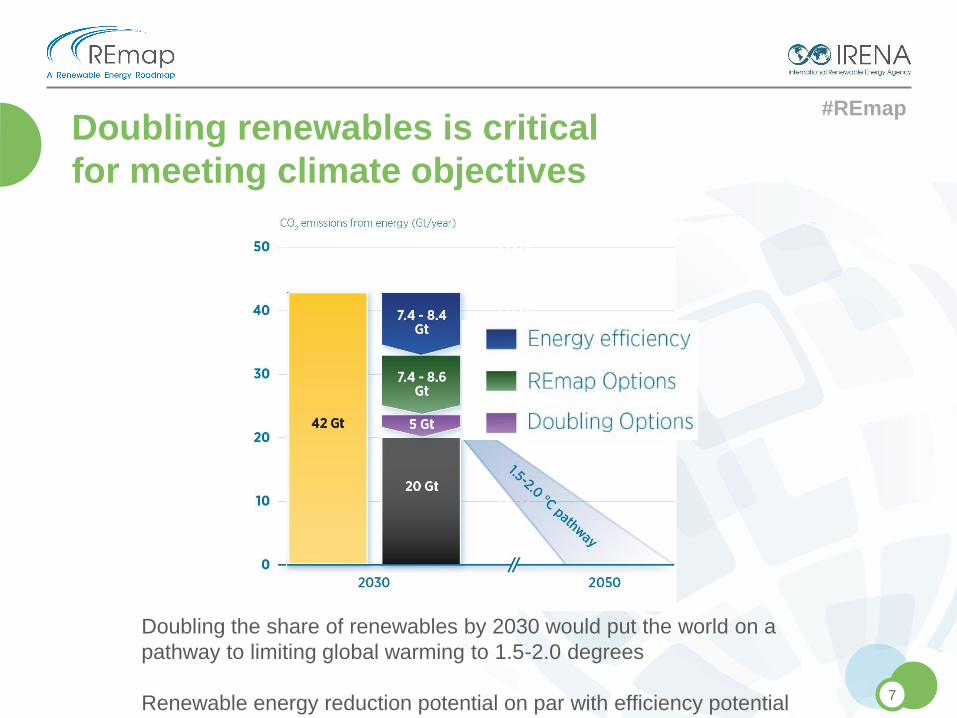
Doubling the share of renewables by 2030 would put the world on a
pathway to limiting global warming to 1.5-2.0 degrees
Renewable energy reduction potential on par with efficiency potential
Doubling renewables is critical
for meeting climate objectives
7
#REmap
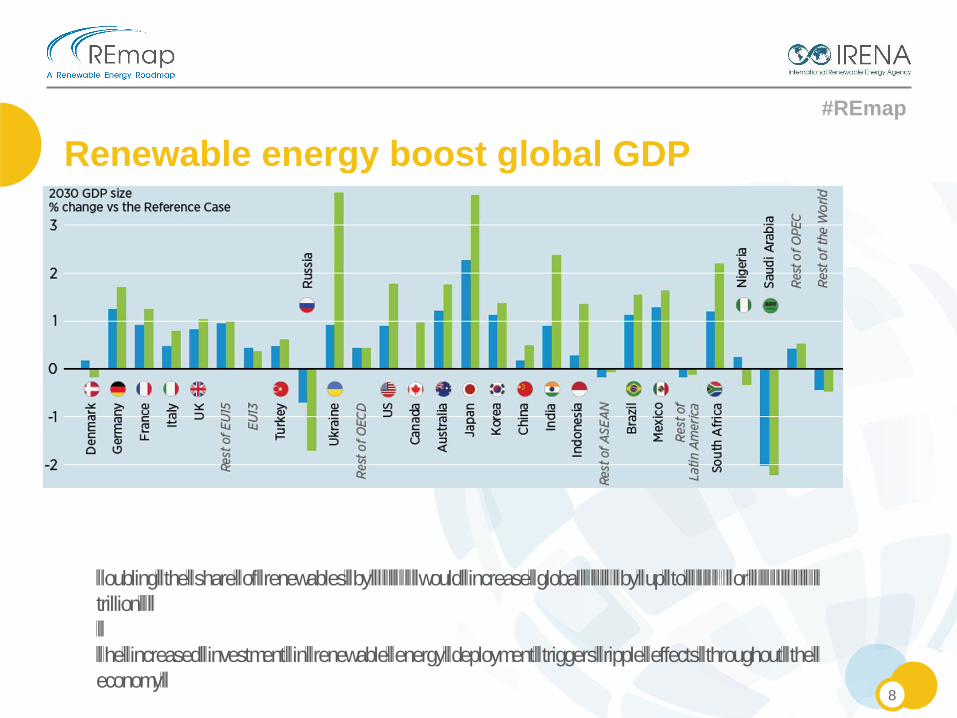
Doubling the share of renewables by 2030 would increase global GDP by up to 1.1% or USD 1.3
trillion
The increased investment in renewable energy deployment triggers ripple effects throughout the
economy
Renewable energy boost global GDP
8
#REmap
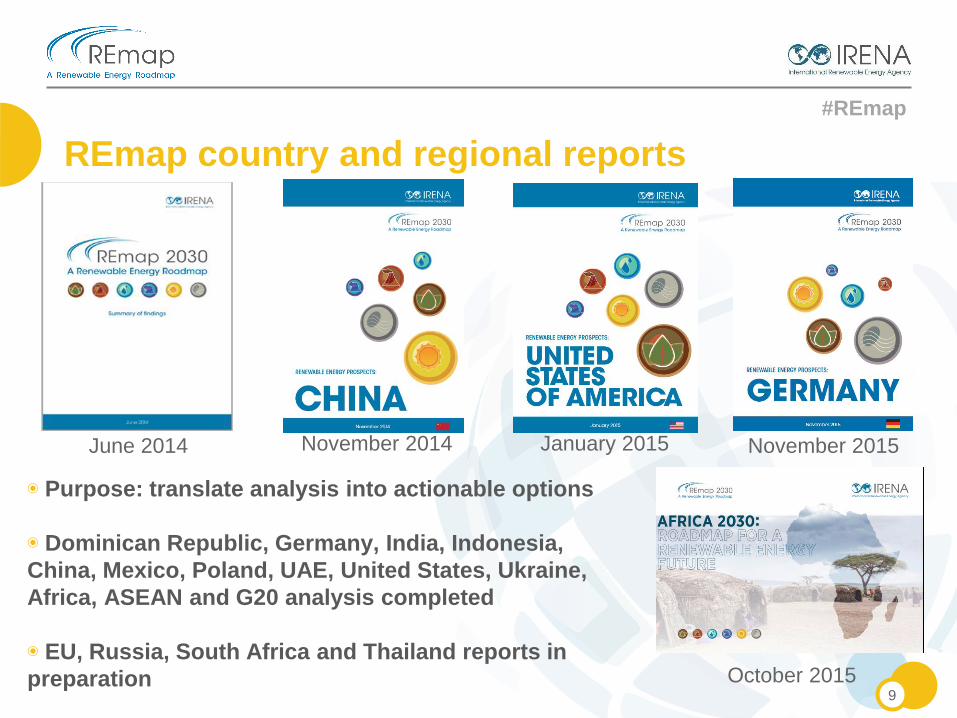
REmap country and regional reports
9
November 2014 January 2015 November 2015 June 2014
October 2015
◉ Purpose: translate analysis into actionable options
◉ Dominican Republic, Germany, India, Indonesia,
China, Mexico, Poland, UAE, United States, Ukraine,
Africa, ASEAN and G20 analysis completed
◉ EU, Russia, South Africa and Thailand reports in
preparation
#REmap
◉ Project for the European Commission, in cooperation with MS
◉ Goal: advise regarding options in all sectors and their implications
to meet the 27% 2030 RE target and role RE can play for
decarbonisation
◉ 1st working group meeting Brussels 20 October
◉ Prepared detailed PLEXOS model to study power sector flexibility
and integration issues
◉ Detailed REmap analysis for 11 largest EU countries (70% of energy
use), streamlined quickscan analysis for the remaining 17 members
◉ Belgium, Cyprus, Denmark, France, Germany, Italy,
Netherlands, Poland, Spain, Sweden, UK
◉ Calibrated Reference Case with latest PRIMES Reference
Scenario
REmap EU – scope and timeline
10
#REmap
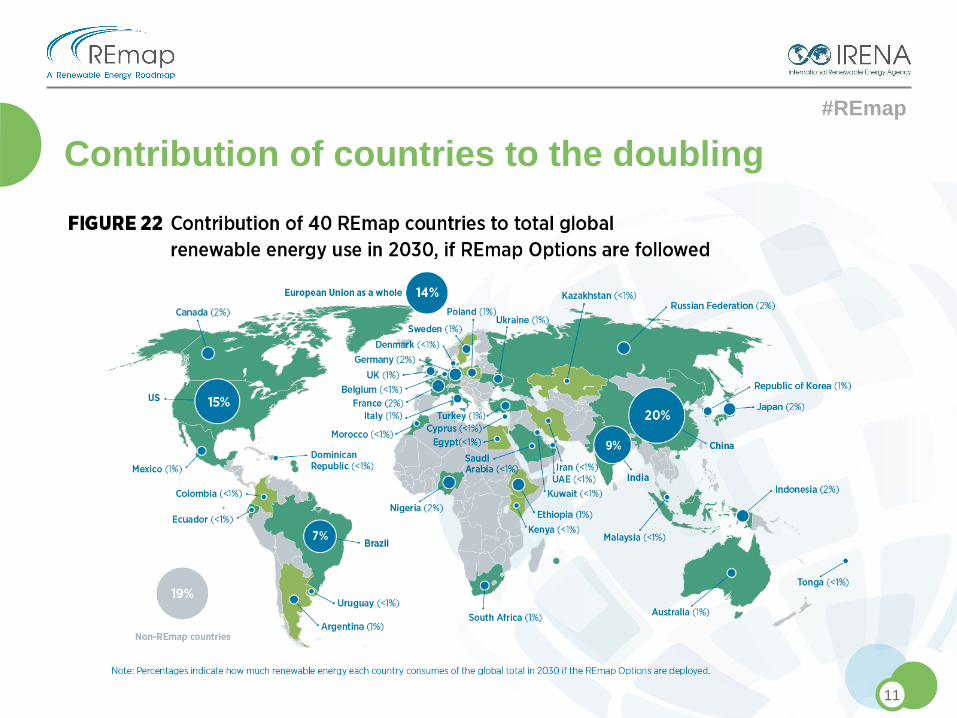
Contribution of countries to the doubling
11
#REmap
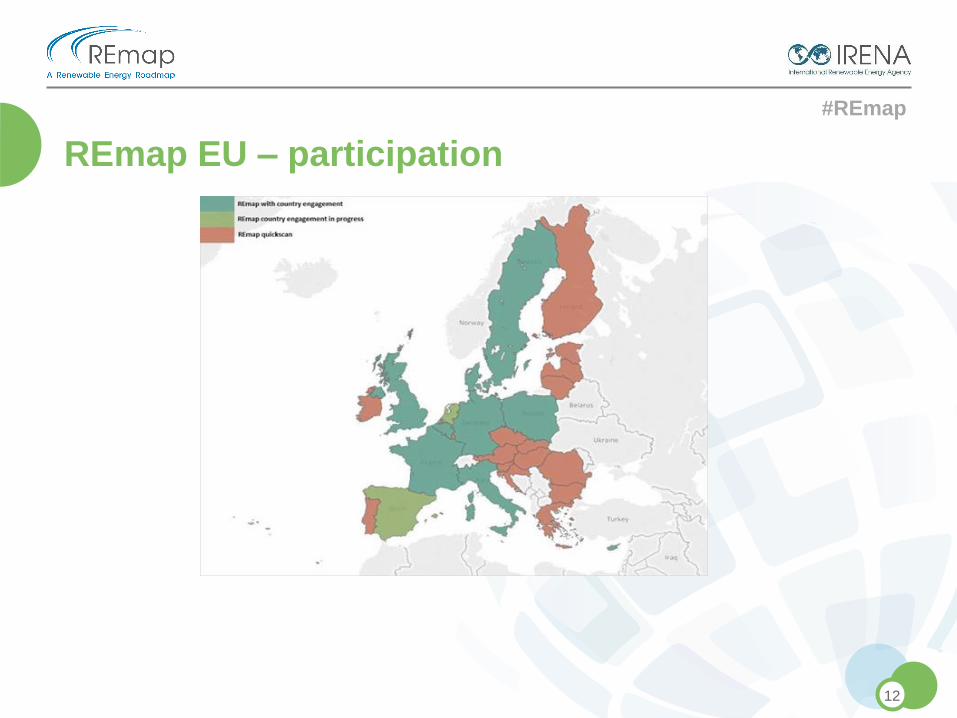
REmap EU – participation
12
#REmap
◉ Climate change is high on the agenda and EU has a central role
◉ 2017 German Presidency of the G20 focus on decarbonisation
◉ Marrakech RE day at COP22
◉ Various other climate related discussions (eg UNFCCC)
◉ Need to understand the role of RE in view of the CO2 commitments
◉ Currently EU not on a decarbonisation path to 2050
◉ Many challenges to deployment of RE and EE in end-use
sectors – potential and cost/benefits needs to be understood
better
◉ Role countries need to play toward realising the EU target unclear
◉ Need to assess cost-effectiveness of different allocation
mechanisms to reach 27% and go beyond in RE share
REmap EU – relevance to policy discussions
13
#REmap
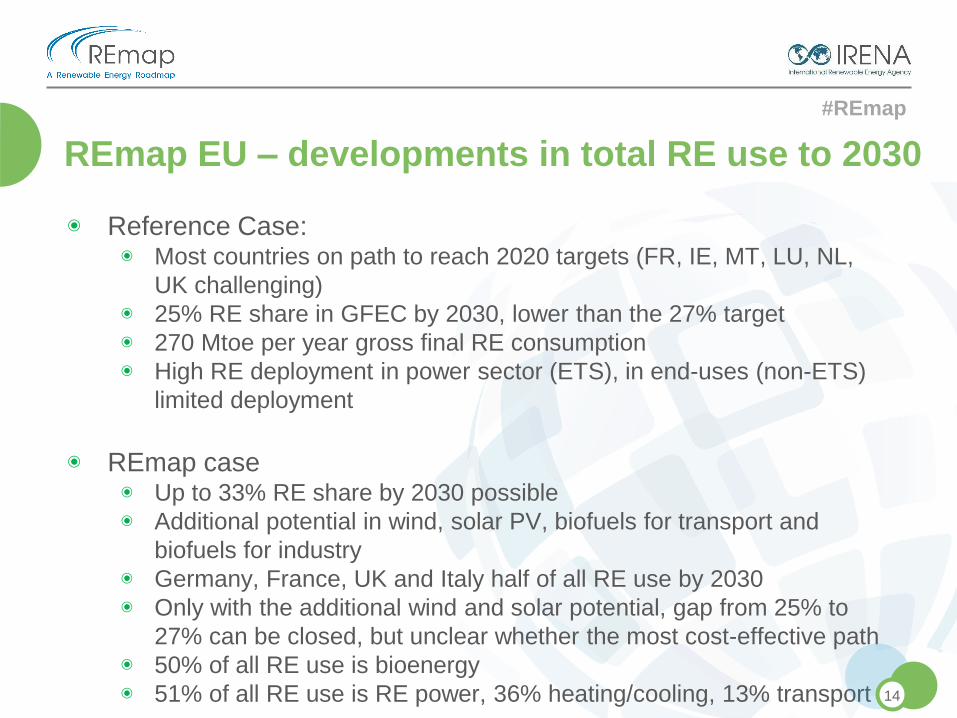
◉ Reference Case: ◉ Most countries on path to reach 2020 targets (FR, IE, MT, LU, NL,
UK challenging)
◉ 25% RE share in GFEC by 2030, lower than the 27% target
◉ 270 Mtoe per year gross final RE consumption
◉ High RE deployment in power sector (ETS), in end-uses (non-ETS)
limited deployment
◉ REmap case ◉ Up to 33% RE share by 2030 possible
◉ Additional potential in wind, solar PV, biofuels for transport and
biofuels for industry
◉ Germany, France, UK and Italy half of all RE use by 2030
◉ Only with the additional wind and solar potential, gap from 25% to
27% can be closed, but unclear whether the most cost-effective path
◉ 50% of all RE use is bioenergy
◉ 51% of all RE use is RE power, 36% heating/cooling, 13% transport
REmap EU – developments in total RE use to 2030
14
#REmap
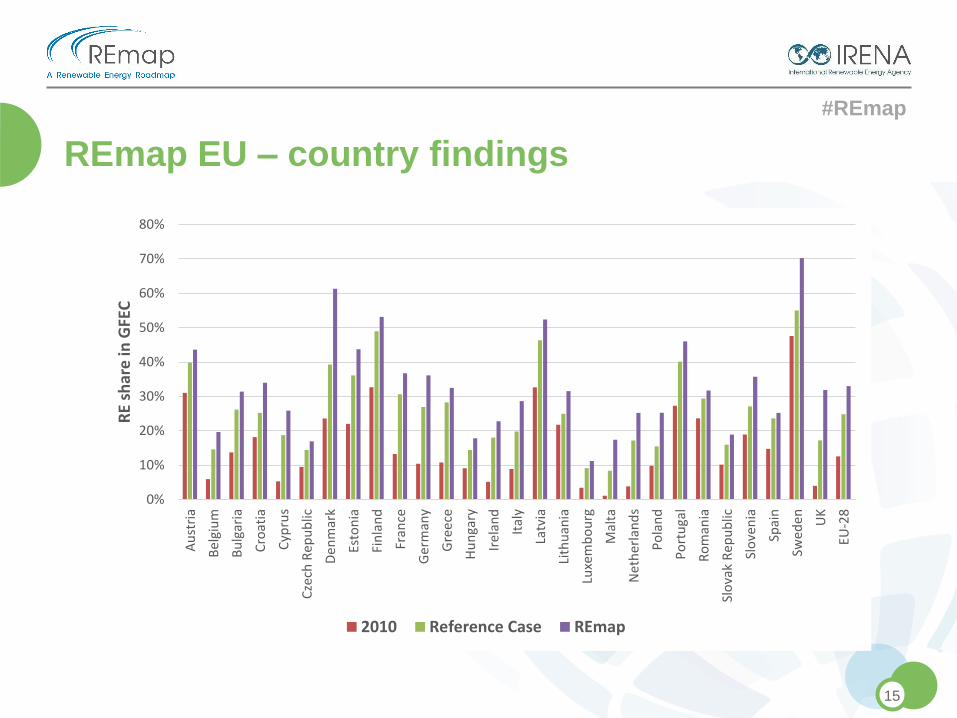
REmap EU – country findings
15
0%
10%
20%
30%
40%
50%
60%
70%
80%
Au
stri
a
Be
lgiu
m
Bu
lgar
ia
Cro
atia
Cyp
rus
Cze
ch R
epu
blic
De
nm
ark
Esto
nia
Fin
lan
d
Fran
ce
Ger
man
y
Gre
ece
Hu
nga
ry
Ire
lan
d
Ital
y
Latv
ia
Lith
uan
ia
Luxe
mb
ou
rg
Mal
ta
Net
her
lan
ds
Po
lan
d
Po
rtu
gal
Ro
man
ia
Slo
vak
Rep
ub
lic
Slo
ven
ia
Spai
n
Swed
en
UK
EU-2
8
RE
shar
e in
GFE
C
2010 Reference Case REmap
#REmap
REmap EU – transport
16
0%
5%
10%
15%
20%
25%
Au
stri
a
Be
lgiu
m
Bu
lgar
ia
Cro
atia
Cyp
rus
Cze
ch R
epu
blic
De
nm
ark
Esto
nia
Fin
lan
d
Fran
ce
Ger
man
y
Gre
ece
Hu
nga
ry
Ire
lan
d
Ital
y
Latv
ia
Lith
uan
ia
Luxe
mb
ou
rg
Mal
ta
Net
her
lan
ds
Po
lan
d
Po
rtu
gal
Ro
man
ia
Slo
vak
Rep
ub
lic
Slo
ven
ia
Spai
n
Swed
en
UK
EU-2
8
RE
shar
e in
tra
nsp
ort
2010 Reference Case REmap Transport RE target 2020
#REmap
REmap EU – transport
17
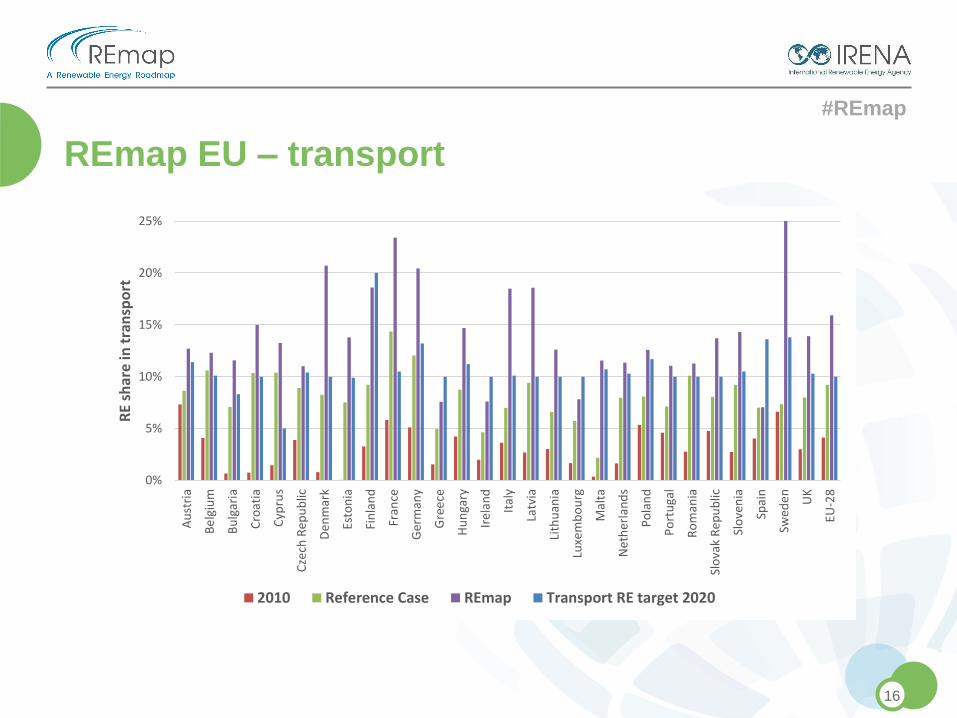
◉ Just above 4% of the sector’s energy use is biofuels today
◉ Few countries have high RE shares (eg Sweden, Finland)
◉ In REmap, 16.5% RE share possible (13.5% biofuels, 3% RE power
– partly from modal shift opportunities)
◉ Biofuels demand triples to 60+ billion liter per year by 2030
◉ Challenges around realising the potential:
◉ Investments in biofuels have slowed down
◉ Lower profitability of ethanol producers in the past years
◉ Concerns on sustainability of biofuels (GHG emissions, iLUC)
◉ Advanced biofuel deployment is limited, and production costs high
◉ Limited solutions for aviation and shipping
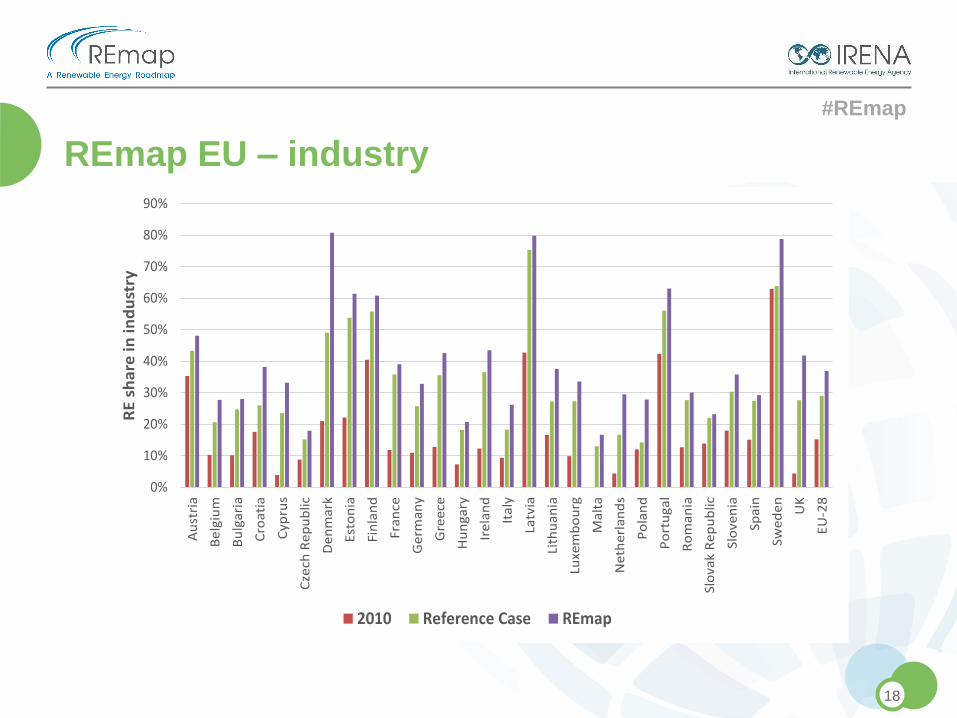
#REmap
REmap EU – industry
18
0%
10%
20%
30%
40%
50%
60%
70%
80%
90%A
ust
ria
Be
lgiu
m
Bu
lga
ria
Cro
ati
a
Cyp
rus
Cze
ch R
ep
ub
lic
De
nm
ark
Est
on
ia
Fin
lan
d
Fra
nce
Ge
rma
ny
Gre
ece
Hu
ng
ary
Ire
lan
d
Ita
ly
Latv
ia
Lith
ua
nia
Luxe
mb
ou
rg
Ma
lta
Ne
the
rla
nd
s
Po
lan
d
Po
rtu
ga
l
Ro
ma
nia
Slo
vak
Re
pu
blic
Slo
ven
ia
Spa
in
Swe
de
n
UK
EU
-28
RE
sh
are
in
in
du
stry
2010 Reference Case REmap
#REmap
REmap EU – industry
19
◉ Represents 1/3 of EU’s total energy demand, 20% RE share in 2014
◉ Potential to reach 37% by 2030 (50% biofuels, 35% RE power, 15%
SWH, geothermal, heat-pumps, RE-based district heat)
◉ Challenges around realising the potential:
◉ Deployment of RE in energy-intensive sectors (iron/steel, cement,
aluminium, petrochemicals) is limited and technologies currently not fully
commercialised
◉ Integration of heating/cooling technologies may require process
modifications
◉ Maintaining cost-competitiveness is essential for the sector
#REmap
REmap EU – buildings
20
0%
10%
20%
30%
40%
50%
60%
70%
80%
90%
100%A
ust
ria
Be
lgiu
m
Bu
lgar
ia
Cro
atia
Cyp
rus
Cze
ch R
epu
blic
De
nm
ark
Esto
nia
Fin
lan
d
Fran
ce
Ger
man
y
Gre
ece
Hu
nga
ry
Ire
lan
d
Ital
y
Latv
ia
Lith
uan
ia
Luxe
mb
ou
rg
Mal
ta
Net
her
lan
ds
Po
lan
d
Po
rtu
gal
Ro
man
ia
Slo
vak
Rep
ub
lic
Slo
ven
ia
Spai
n
Swed
en
UK
EU-2
8
RE
shar
e in
bu
ildin
gs
2010 Reference Case REmap
#REmap
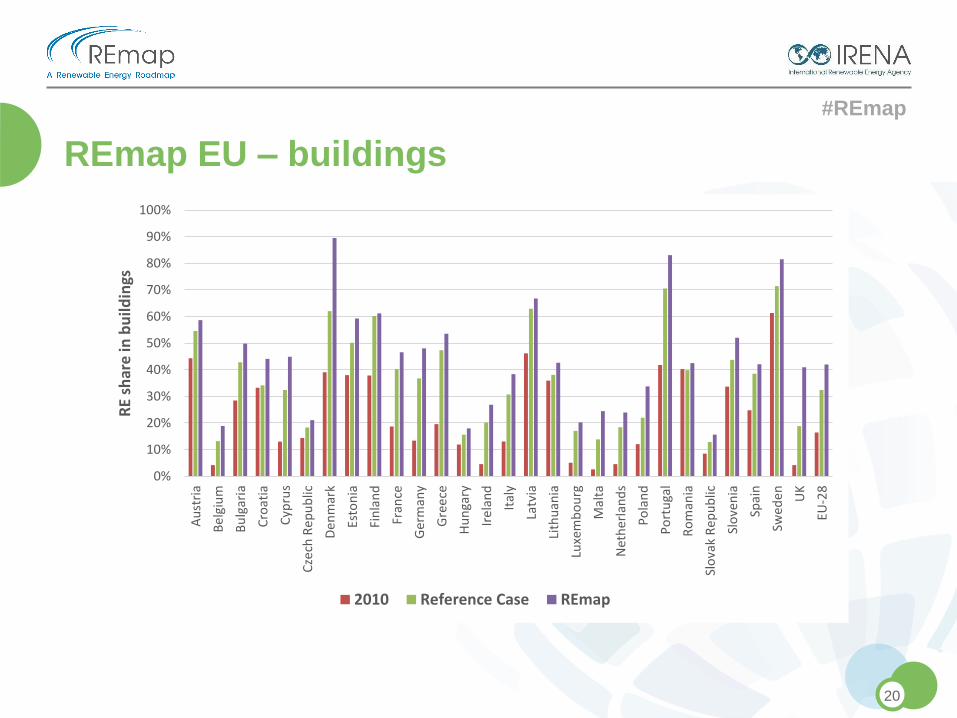
REmap EU – buildings
21
◉ Represents 40% of EU’s total energy demand, 32% RE share in 2014
◉ Potential to reach 42% by 2030
◉ Various RE technologies have potential
◉ 1/3 biofuels, 1/3 RE power, 1/3 SWH, geothermal, heat-pumps, RE-
based district heat
◉ Challenges around realising the potential
◉ New buildings attract more investments in RE than existing stock
◉ Renovation rates are slow
◉ Integration of heating/cooling technologies may require process
modifications
◉ Cost-competitiveness is key
#REmap
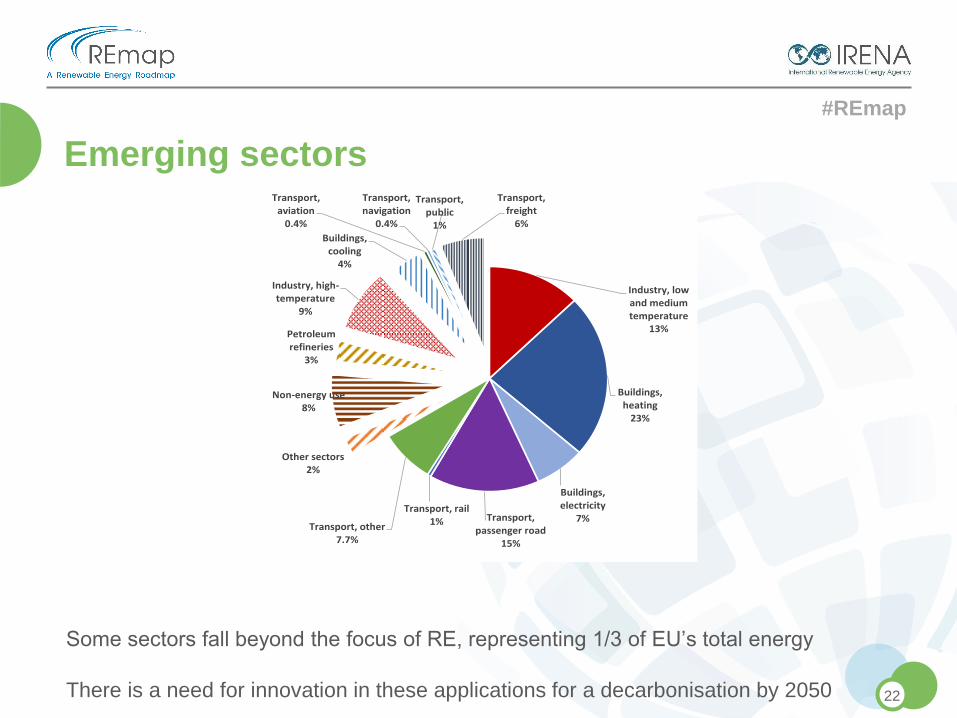
Emerging sectors
22
Industry, low and medium temperature
13%
Buildings, heating
23%
Buildings, electricity
7%Transport, passenger road
15%
Transport, rail1%Transport, other
7.7%
Other sectors2%
Non-energy use8%
Petroleum refineries
3%
Industry, high-temperature
9%
Buildings, cooling
4%
Transport, aviation
0.4%
Transport, navigation
0.4%
Transport, public
1%
Transport, freight
6%
Some sectors fall beyond the focus of RE, representing 1/3 of EU’s total energy
There is a need for innovation in these applications for a decarbonisation by 2050
#REmap
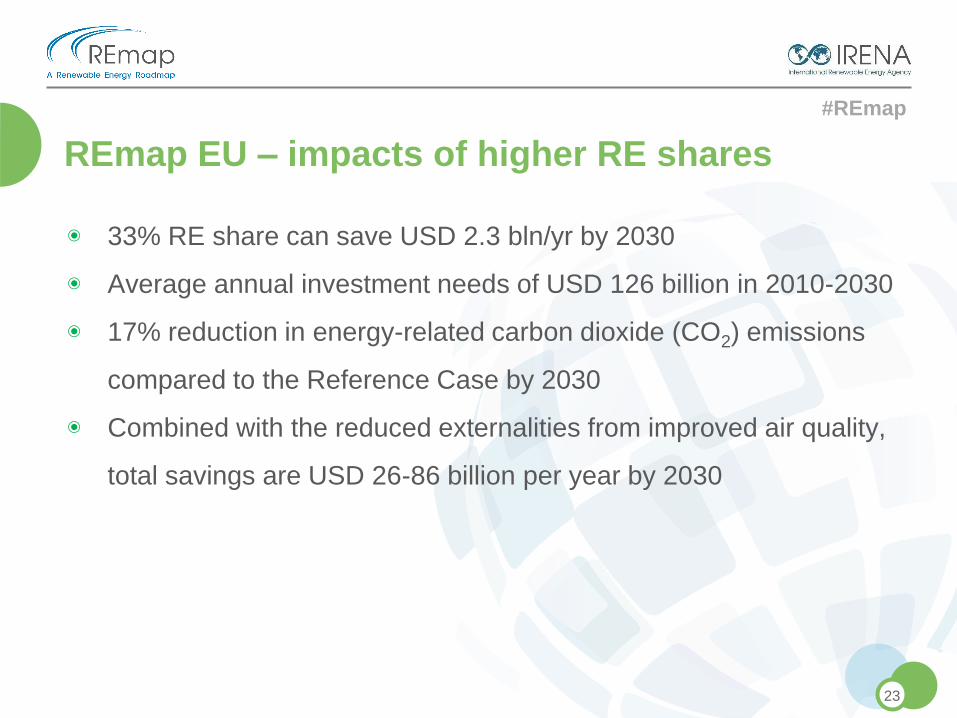
REmap EU – impacts of higher RE shares
23
◉ 33% RE share can save USD 2.3 bln/yr by 2030
◉ Average annual investment needs of USD 126 billion in 2010-2030
◉ 17% reduction in energy-related carbon dioxide (CO2) emissions
compared to the Reference Case by 2030
◉ Combined with the reduced externalities from improved air quality,
total savings are USD 26-86 billion per year by 2030
#REmap
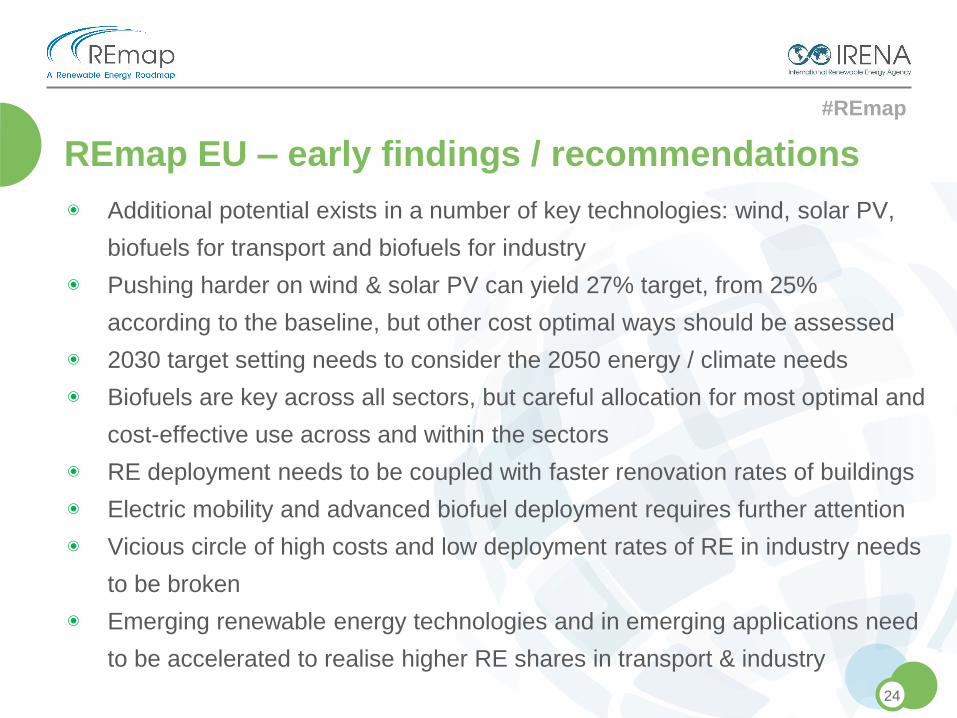
REmap EU – early findings / recommendations
24
◉ Additional potential exists in a number of key technologies: wind, solar PV,
biofuels for transport and biofuels for industry
◉ Pushing harder on wind & solar PV can yield 27% target, from 25%
according to the baseline, but other cost optimal ways should be assessed
◉ 2030 target setting needs to consider the 2050 energy / climate needs
◉ Biofuels are key across all sectors, but careful allocation for most optimal and
cost-effective use across and within the sectors
◉ RE deployment needs to be coupled with faster renovation rates of buildings
◉ Electric mobility and advanced biofuel deployment requires further attention
◉ Vicious circle of high costs and low deployment rates of RE in industry needs
to be broken
◉ Emerging renewable energy technologies and in emerging applications need
to be accelerated to realise higher RE shares in transport & industry
#REmap
◉ Joint work of countries and IRENA
◉ Two parallel tracks:
◉ Country analysis (for all countries included)
◉ REmap comprehensive country reports (with interested countries)
◉ IRENA works with country experts to conduct analysis
◉ Approximately 1-3 man-weeks of work required by country expert
◉ Country report based on close collaboration, longer process
◉ An established “REmap tool”
◉ REmap country analysis yields:
◉ Technology pathways
◉ Costs, benefits, investment needs
◉ Engagement with IRENA on other programmatic activities
REmap engagement process
26
#REmap
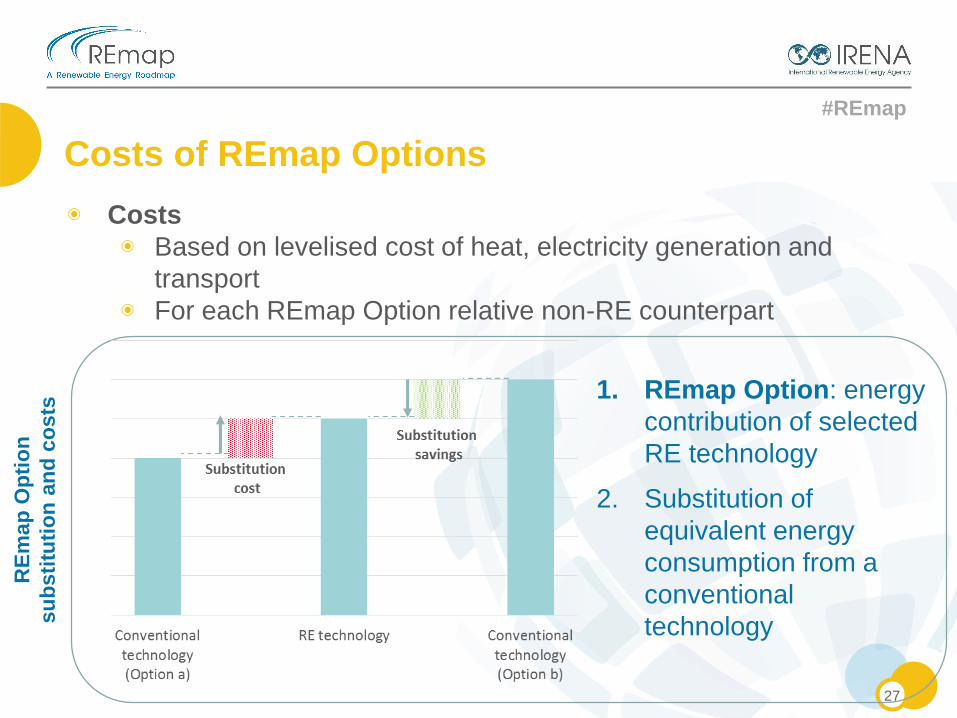
◉ Costs
◉ Based on levelised cost of heat, electricity generation and
transport
◉ For each REmap Option relative non-RE counterpart
Costs of REmap Options
27
1. REmap Option: energy
contribution of selected
RE technology
2. Substitution of
equivalent energy
consumption from a
conventional
technology
RE
map
Op
tio
n
su
bsti
tuti
on
an
d c
osts
#REmap
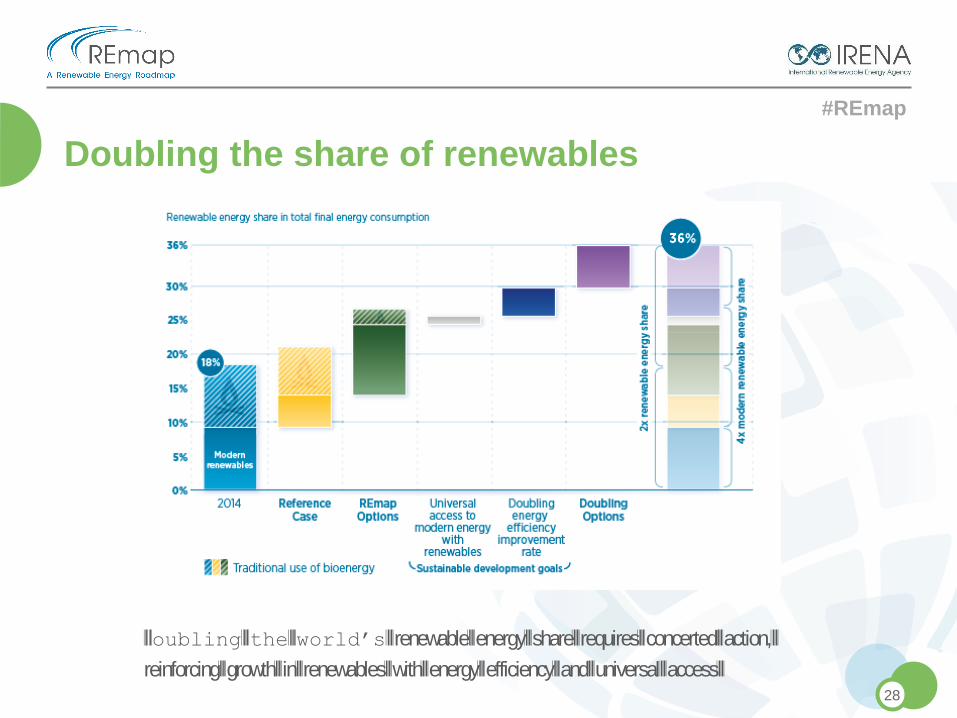
Doubling the world’s renewable energy share requires concerted action,
reinforcing growth in renewables with energy efficiency and universal access
Doubling the share of renewables
28
#REmap
29
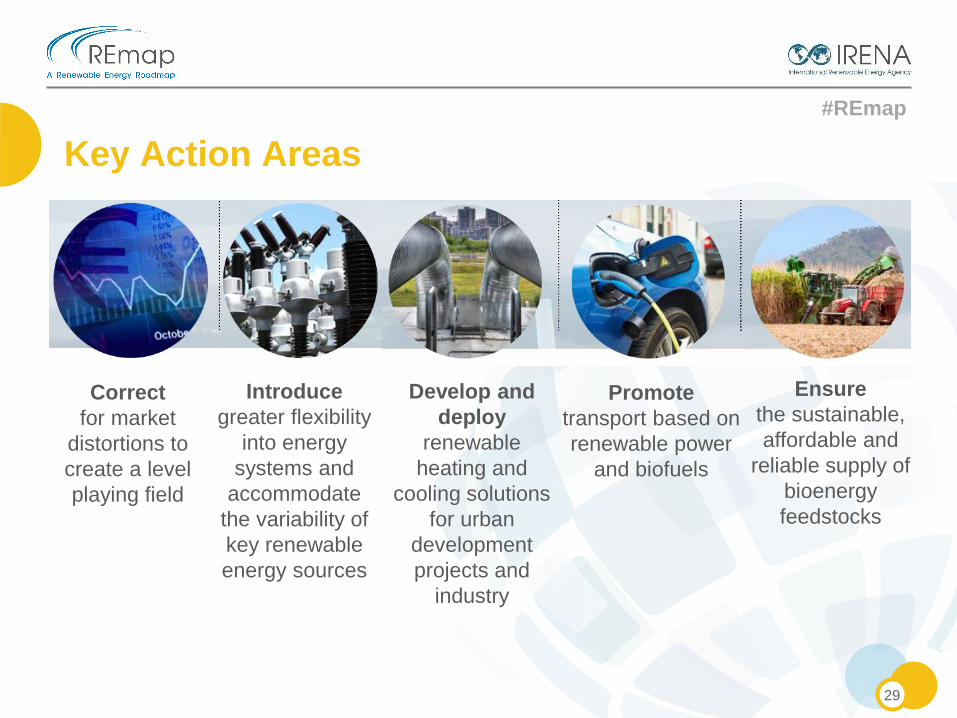
Correct
for market
distortions to
create a level
playing field
Introduce
greater flexibility
into energy
systems and
accommodate
the variability of
key renewable
energy sources
Develop and
deploy
renewable
heating and
cooling solutions
for urban
development
projects and
industry
Promote
transport based on
renewable power
and biofuels
Ensure
the sustainable,
affordable and
reliable supply of
bioenergy
feedstocks
Key Action Areas
#REmap
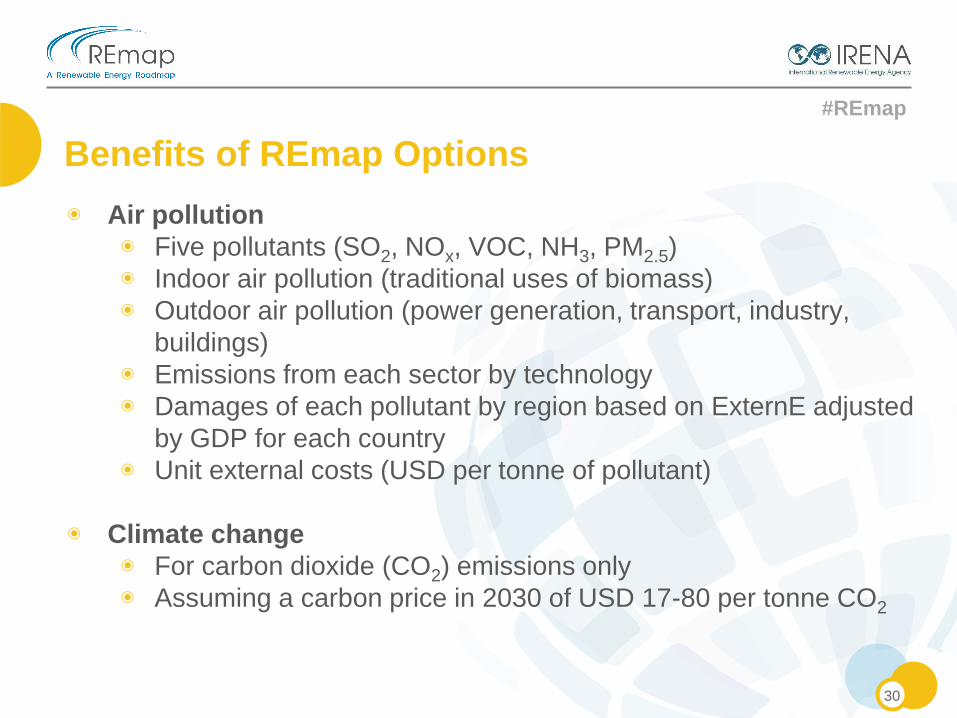
◉ Air pollution
◉ Five pollutants (SO2, NOx, VOC, NH3, PM2.5)
◉ Indoor air pollution (traditional uses of biomass)
◉ Outdoor air pollution (power generation, transport, industry,
buildings)
◉ Emissions from each sector by technology
◉ Damages of each pollutant by region based on ExternE adjusted
by GDP for each country
◉ Unit external costs (USD per tonne of pollutant)
◉ Climate change
◉ For carbon dioxide (CO2) emissions only
◉ Assuming a carbon price in 2030 of USD 17-80 per tonne CO2
Benefits of REmap Options
30
#REmap
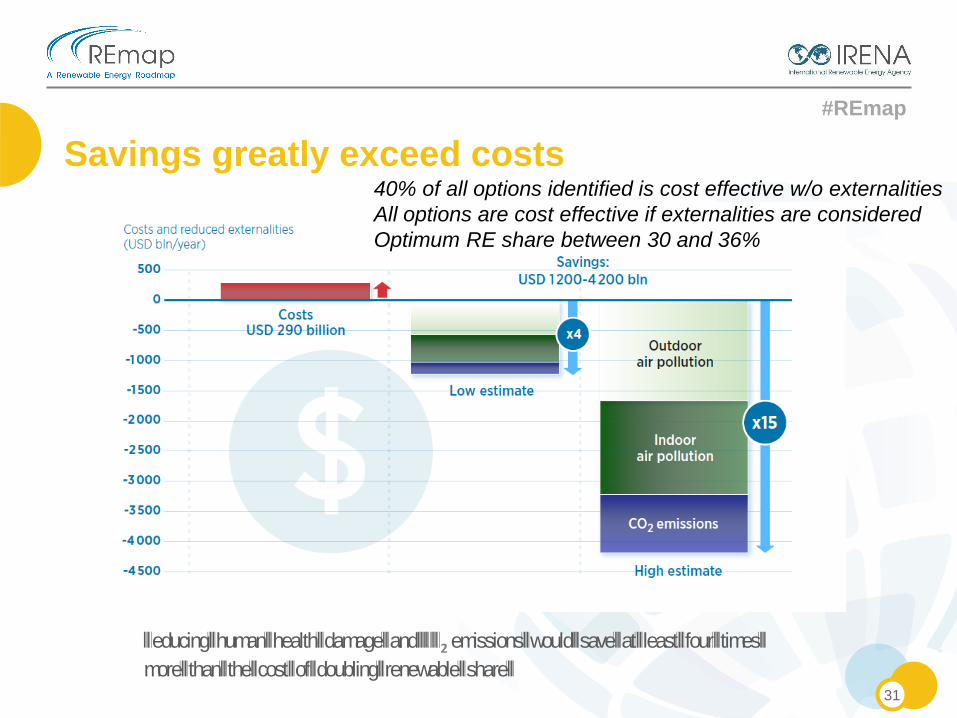
Reducing human health damage and CO2 emissions would save at least four times
more than the cost of doubling renewable share
Savings greatly exceed costs
31
40% of all options identified is cost effective w/o externalities
All options are cost effective if externalities are considered
Optimum RE share between 30 and 36%
#REmap
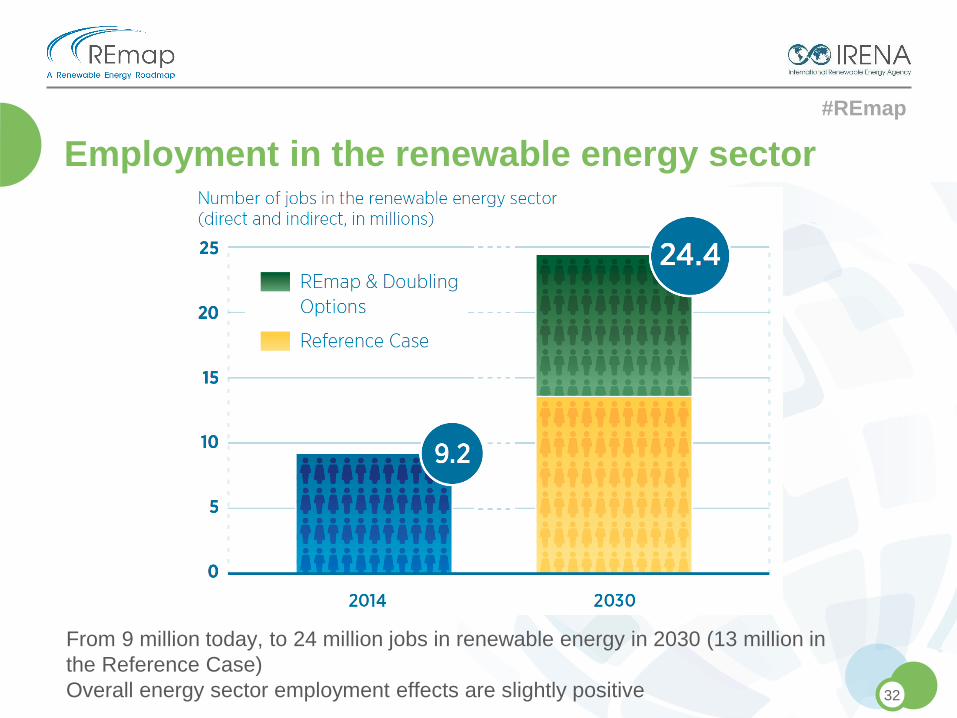
Employment in the renewable energy sector
32
From 9 million today, to 24 million jobs in renewable energy in 2030 (13 million in
the Reference Case)
Overall energy sector employment effects are slightly positive