Embed Size (px)
Citation preview
11 November 2021
The Secretary Corporate Relationship Dept. The Bombay Stock Exchange 1st Floor, New Trading Ring Rotunda Building Phiroze Jeejeebhoy Towers Dalal Street, Mumbai – 400 001
The Secretary National Stock Exchange of India Limited Exchange Plaza Bandra Kurla Complex Mumbai – 400 051
Dear Sir, Sub: Press Release & Investor Presentation - Reg We herewith enclosed the Press Release and Investor Presentation for the Quarter ended 30 September 2021. This is for your information and records. Thanking you, Yours truly, For Page Industries Limited Murugesh C Company Secretary Encl: as above
Page Industries Limited Registered Office: Cessna Business Park, Tower-1, 7th Floor, Umiya BusinessBay, Varthur Hobli, Outer Ring Road, Bengaluru, 560103 Tel: 080 - 4945 4545 | CIN: L18101KA1994PLC016554 1
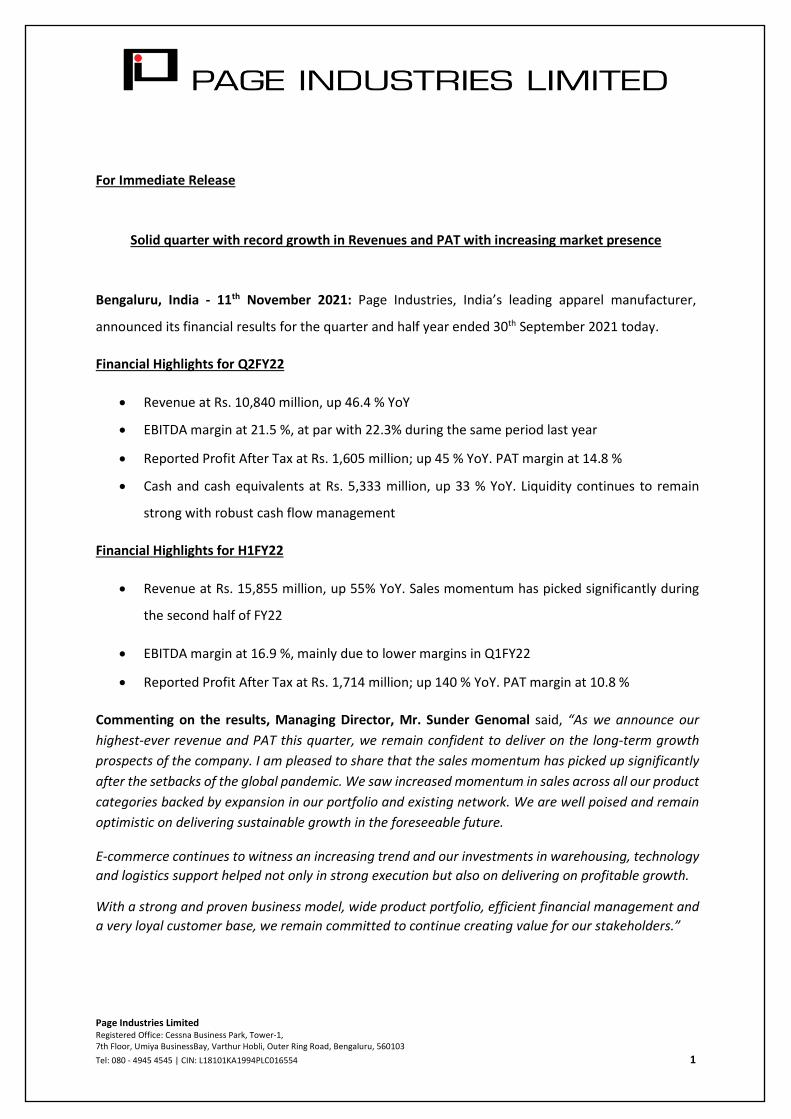
For Immediate Release
Solid quarter with record growth in Revenues and PAT with increasing market presence
Bengaluru, India - 11th November 2021: Page Industries, India’s leading apparel manufacturer,
announced its financial results for the quarter and half year ended 30th September 2021 today.
Financial Highlights for Q2FY22
• Revenue at Rs. 10,840 million, up 46.4 % YoY
• EBITDA margin at 21.5 %, at par with 22.3% during the same period last year
• Reported Profit After Tax at Rs. 1,605 million; up 45 % YoY. PAT margin at 14.8 %
• Cash and cash equivalents at Rs. 5,333 million, up 33 % YoY. Liquidity continues to remain
strong with robust cash flow management
Financial Highlights for H1FY22
• Revenue at Rs. 15,855 million, up 55% YoY. Sales momentum has picked significantly during
the second half of FY22
• EBITDA margin at 16.9 %, mainly due to lower margins in Q1FY22
• Reported Profit After Tax at Rs. 1,714 million; up 140 % YoY. PAT margin at 10.8 %
Commenting on the results, Managing Director, Mr. Sunder Genomal said, “As we announce our highest-ever revenue and PAT this quarter, we remain confident to deliver on the long-term growth prospects of the company. I am pleased to share that the sales momentum has picked up significantly after the setbacks of the global pandemic. We saw increased momentum in sales across all our product categories backed by expansion in our portfolio and existing network. We are well poised and remain optimistic on delivering sustainable growth in the foreseeable future.
E-commerce continues to witness an increasing trend and our investments in warehousing, technology and logistics support helped not only in strong execution but also on delivering on profitable growth.
With a strong and proven business model, wide product portfolio, efficient financial management and a very loyal customer base, we remain committed to continue creating value for our stakeholders.”

Page Industries Limited Registered Office: Cessna Business Park, Tower-1, 7th Floor, Umiya BusinessBay, Varthur Hobli, Outer Ring Road, Bengaluru, 560103 Tel: 080 - 4945 4545 | CIN: L18101KA1994PLC016554 2
About Page Industries Limited
Page Industries is the exclusive licensee of JOCKEY International Inc. (USA) for manufacture, distribution and marketing of the JOCKEY® brand in India, Sri Lanka, Bangladesh, Nepal, Oman, Qatar, Maldives, Bhutan and UAE. Page Industries is also the exclusive licensee of Speedo International Ltd. for the manufacture, marketing and distribution of the Speedo brand in India.
Jockey is the company’s flagship brand and a market leader in the premium innerwear and leisure wear category. The brand is distributed in 2,895+ cities & towns and available in 94,000+ Multi Brand Outlets, 1,000+ Exclusive Brand Outlets (EBO) with extensive presence in 2500+ Large Format Stores, as also online. The company also has 7 EBOs outside India. Speedo brand is available in 1,340+ stores including 26+ EBOs and 15+ Large Format Stores, spread across 90+ cities.
For further information, please visit www.jockeyindia.com
Investor Contact – [email protected]
Disclaimer: Certain statements that may be made or discussed in this release may be forward-looking statements and/or based on management’s current expectations and beliefs concerning future developments and their potential effects upon Page Industries and its associates. The forward-looking statements are not a guarantee of future performance and involve risks and uncertainties and there are important factors that could cause actual results to differ, possibly materially, from expectations reflected in such forward-looking statements. Page Industries does not intend, and is under no obligation, to update any forward-looking statement made in this release.

PERFORMANCEHIGHLIGHTS Q2FY22
NOVEMBER 11, 2021
SAFE HARBOUR STATEMENT
This presentation, by Page Industries Limited (the “Company”), has been prepared solely for information purposes and does not constitute any offer, recommendation or invitation to purchase or subscribe for any securities.
This Presentation has been prepared by the Company based on information and data which the Company considers reliable, but the Company makes no representation or warranty, express or implied, whatsoever of the contents of this Presentation. This Presentation may not be all inclusive and may not contain all of the information that you may consider relevant. Any liability in respect of the contents of, or any omission from, this Presentation is expressly excluded.
This presentation updated as on November 11, 2021 may contain certain forward-looking statements concerning the Company’s future business prospects and business profitability, which are subject to a number of risks and uncertainties and the actual results could materially differ from those in such forward-looking statements. The risks and uncertainties relating to these statements include, but are not limited to, risks and uncertainties regarding fluctuations in earnings, our ability to manage growth, competition, economic growth in our markets, ability to attract and retain highly skilled professionals, our ability to manage our operations, government policies and actions, interest and other fiscal costs generally prevailing in the economy. The Company does not undertake to make any announcement in case any of these forward-looking statements become materially incorrect in future or update any forward-looking statements made from time to time by or on behalf of the Company.
2
COMPANY OVERVIEW
• COMPANY OVERVIEW
• ATTRACTIVE MACRO OPPORTUNITY
• KEY HIGHLIGHTS
• MULTIPLE PRODUCTS OFFERING
• NEW LAUNCHES
• UNMATCHED MARKET COVERAGE
• EXTENSIVE BRAND REACH
• MANUFACTURING CAPABILITIES
• FINANCIAL HIGHLIGHTS
• SUSTAINABILITY
• SHAREHOLDING PATTERN
CONTENTS
3
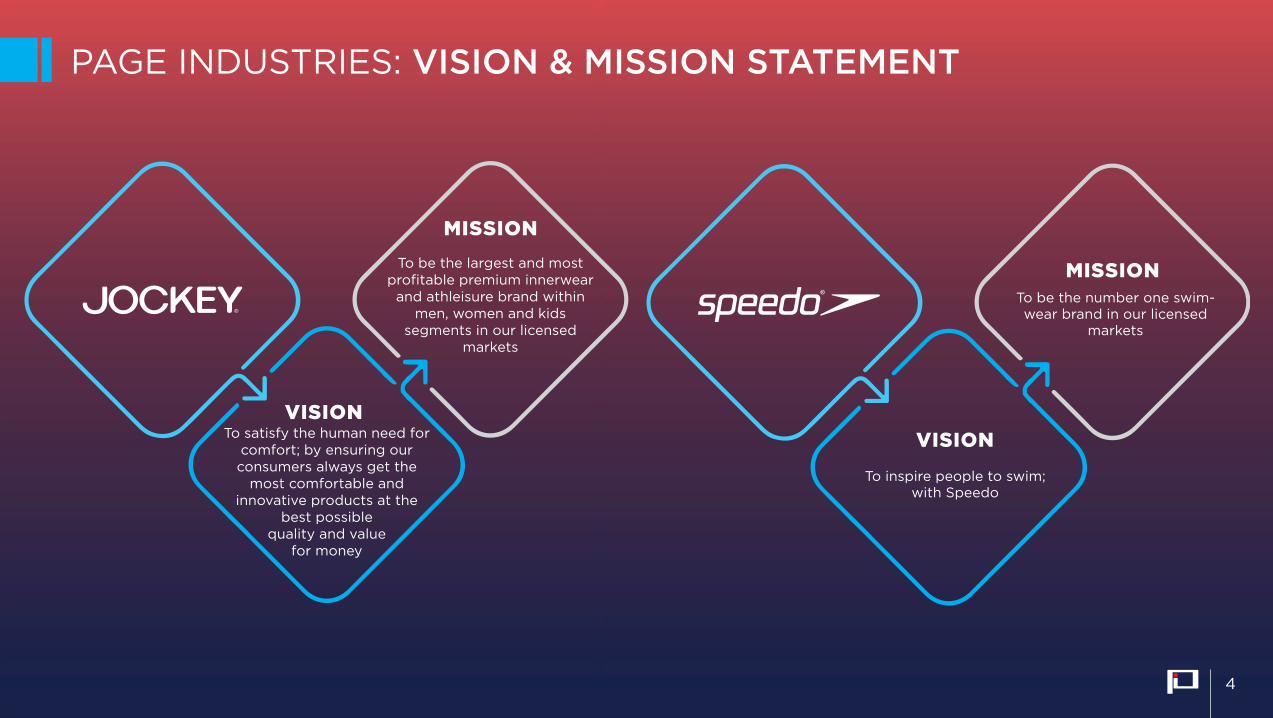
VISIONVISION
MISSION
MISSION
To satisfy the human need forcomfort; by ensuring ourconsumers always get the
most comfortable and innovative products at the
best possiblequality and value
for money
To inspire people to swim; with Speedo
To be the largest and mostprofitable premium innerwear
and athleisure brand withinmen, women and kids
segments in our licensedmarkets
To be the number one swim-wear brand in our licensed
markets
PAGE INDUSTRIES: VISION & MISSION STATEMENT
4
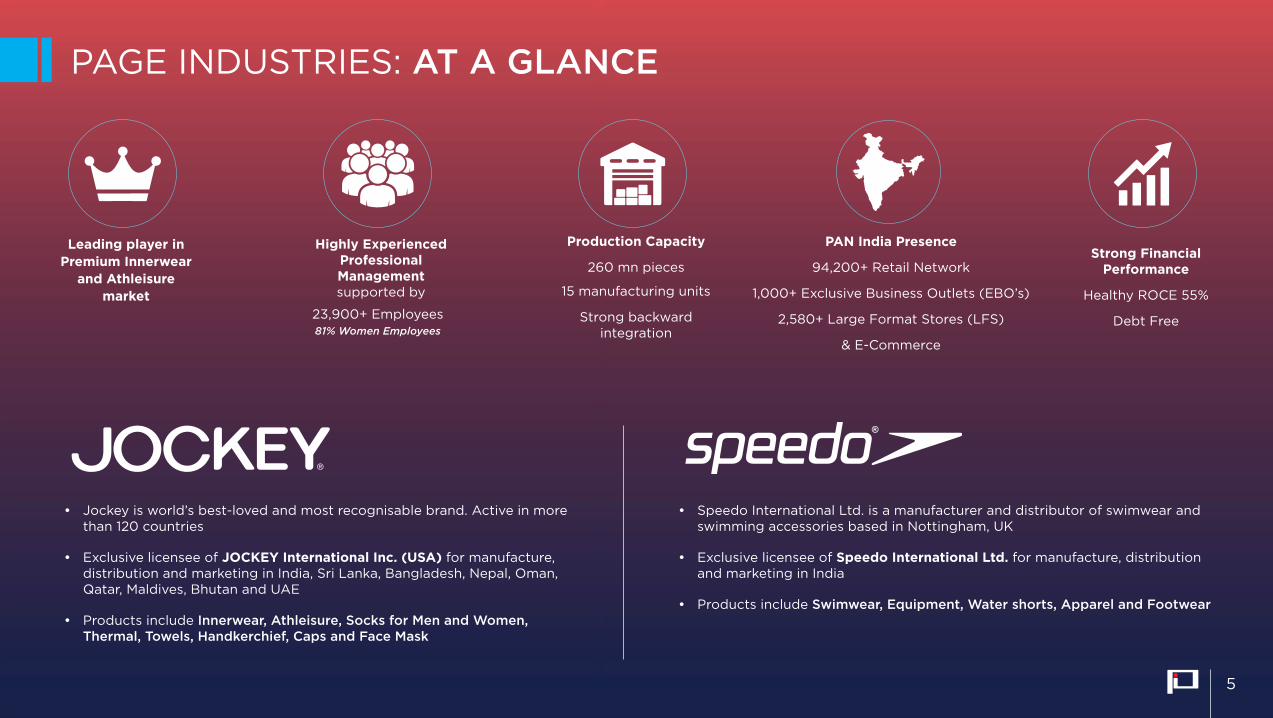
Leading player in Premium Innerwear
and Athleisure market
PAN India Presence
94,200+ Retail Network
1,000+ Exclusive Business Outlets (EBO’s)
2,580+ Large Format Stores (LFS)
& E-Commerce
Production Capacity
260 mn pieces
15 manufacturing units
Strong backward integration
Strong Financial Performance
Healthy ROCE 55%
Debt Free
• Jockey is world’s best-loved and most recognisable brand. Active in more than 120 countries
• Exclusive licensee of JOCKEY International Inc. (USA) for manufacture, distribution and marketing in India, Sri Lanka, Bangladesh, Nepal, Oman, Qatar, Maldives, Bhutan and UAE
• Products include Innerwear, Athleisure, Socks for Men and Women, Thermal, Towels, Handkerchief, Caps and Face Mask
• Speedo International Ltd. is a manufacturer and distributor of swimwear and swimming accessories based in Nottingham, UK
• Exclusive licensee of Speedo International Ltd. for manufacture, distribution and marketing in India
• Products include Swimwear, Equipment, Water shorts, Apparel and Footwear
Highly Experienced Professional Management supported by
23,900+ Employees 81% Women Employees
PAGE INDUSTRIES: AT A GLANCE
5

1995
1997
2003
2013
2007
2008
2005
• Incorporation of the Company under the name and style of Page Apparel Manufacturing Private Ltd.
• Brand Jockey reached 100 towns
• Launched Jockey products for women under the style of ‘Jockey For Her’
• Launched the middle range of men’s undergarments
• The turnover of the Company crossed INR 500m
• Retail network of 10,000 outlets
• Achieved production of 1m pieces a month
• First Jockey EBO in Dubai
• Launched Jockey Towels
Successful completion of IPO and listing on NSE and BSE
Jockey available across 1000 towns 2016
2014
Jockey.inlaunched
PAGE launched the Just Jockeying campaign to transform Jockey into a lifestyle brand
2018
2021
• Jockey Licensing agreement extended till 2040
• Jockey Active wear range launched
• Speedo apparel range launched
• Jockey woman launched
• 500 Jockey EBO’s
• QE Sep'21 Best Revenue & PAT in history
• 1000+ Jockey EBOs
• Added 22K MBOs in calendar year
2019
• Jockey Juniors launched
• 25 years of Jockey in India
• The turnover of the Company crossed INR 1b in terms of factory selling price
• Production crossed 2m pieces per month
2004
Jockey Socks launched
Launch of Jockey brassieres in India
2006
• Licensing agreement with Jockey International Inc. extended till 2030
• Also been awarded the sole marketing and distribution rights for UAE
• Speedo Launch
2011• Launch of first
International format EBO in Bengaluru
• Launched its own B2C e-commerce channel and tied up with various leading online retailers to increase reach of products
2015 • First Jockey EBO in Sri Lanka
• Brand Jockey reached 50,000 outlets in India
2017OUR JOURNEY
6

Capacity Ramp-up in both Manufacturing and Sales
Expanding Channel presence in distribution, Exclusive Brand outlets, Large Format Stores & E-Commerce
Expanding investments and spends in Sales and Marketing at Point of Sale
Enhance investments in R&D, Product Development and Innovation, Automation and Digital Transformation
MANAGEMENT GROWTH INITIATIVES
Page’s ValueSystem
Quality
Integrity
Simplicity
Transparency
PeopleEmphasis
CustomerDelight
7
ATTRACTIVE MACRO OPPORTUNITY
• COMPANY OVERVIEW
• ATTRACTIVE MACRO OPPORTUNITY
• KEY HIGHLIGHTS
• MULTIPLE PRODUCTS OFFERING
• NEW LAUNCHES
• UNMATCHED MARKET COVERAGE
• EXTENSIVE BRAND REACH
• MANUFACTURING CAPABILITIES
• FINANCIAL HIGHLIGHTS
• SUSTAINABILITY
• SHAREHOLDING PATTERN
CONTENTS
8
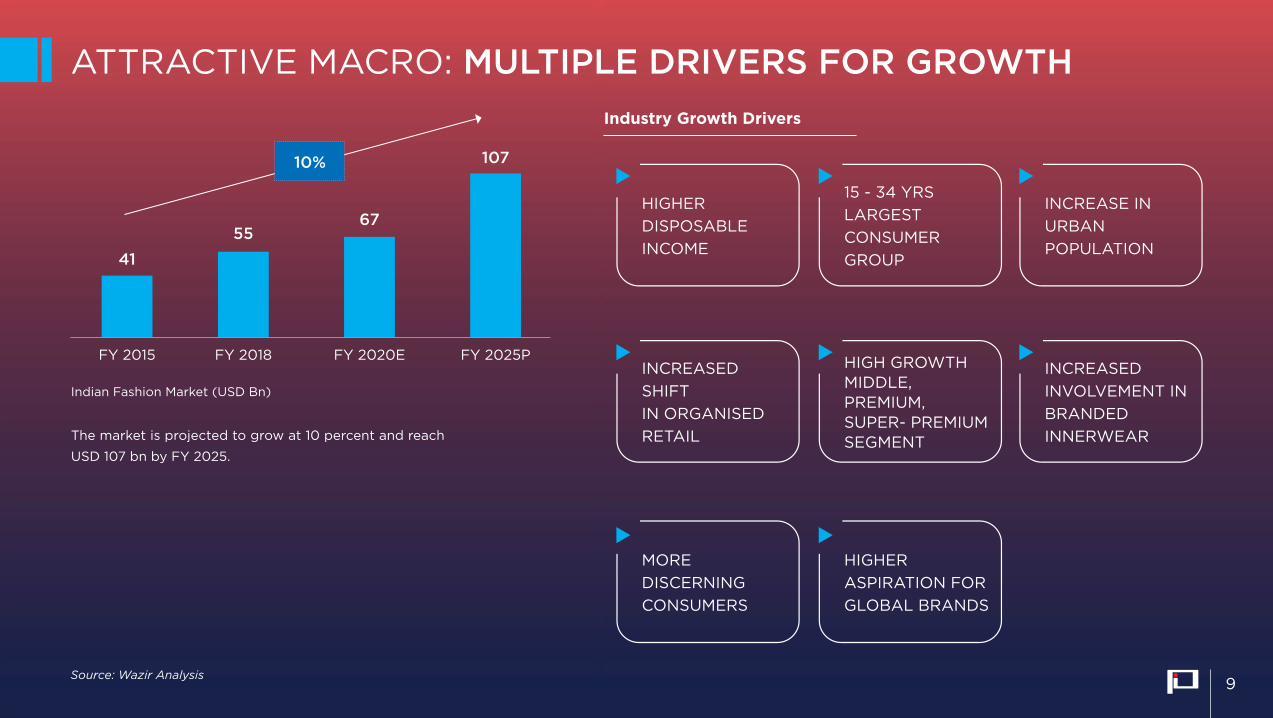
HIGHERDISPOSABLEINCOME
INCREASED SHIFTIN ORGANISEDRETAIL
MOREDISCERNINGCONSUMERS
15 - 34 YRSLARGESTCONSUMERGROUP
HIGH GROWTHMIDDLE, PREMIUM,SUPER- PREMIUMSEGMENT
HIGHER ASPIRATION FOR GLOBAL BRANDS
INCREASE INURBANPOPULATION
INCREASEDINVOLVEMENT INBRANDED INNERWEAR
Industry Growth Drivers
ATTRACTIVE MACRO: MULTIPLE DRIVERS FOR GROWTH
FY 2015 FY 2018 FY 2020E FY 2025P
4155
67
10710%
The market is projected to grow at 10 percent and reach
USD 107 bn by FY 2025.
Source: Wazir Analysis
Indian Fashion Market (USD Bn)
9
ATTRACTIVE MACRO: INDIAN APPAREL MARKET SEGMENTS
Source: Wazir Analysis
27.7
45.3
Total Market Size
CAGR
(US
D B
n)
Formal Casual Innerwear Activewear Others
14.3
21.6
6.8
13.2
1.93.1
0.9 1.73.8
5.7
10.3% 8.6% 14.2% 10.3% 13.6% 8.4%
FY 2020E FY 2025P
Men’s Apparel Market
Women’s Apparel Market
24.9
39.0
Total Market Size
CAGR
(US
D B
n)
Ethnic Innerwear Formal Casual Others
16.9
24.4
4.4
8.5
1.0 1.80.9
1.9 1.72.4
9.4% 7.6% 14.1% 12.5% 16.1% 7.1%
FY 2020E FY 2025P
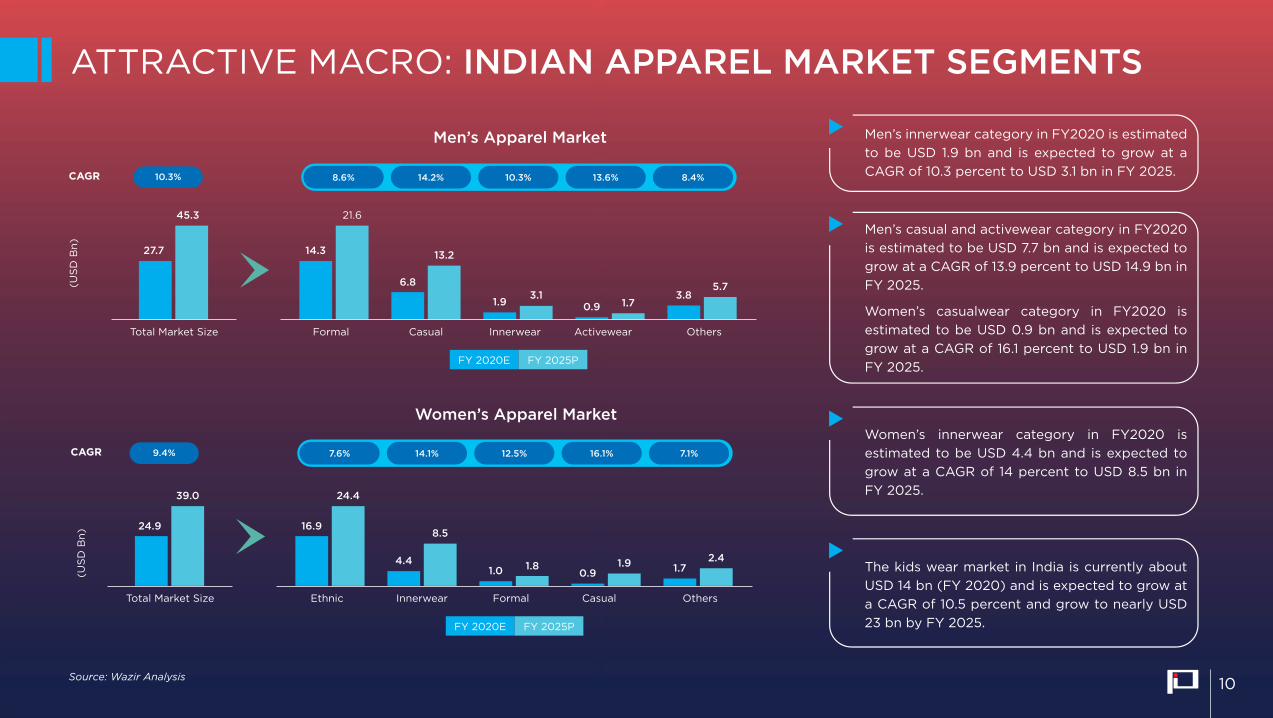
Men’s innerwear category in FY2020 is estimated to be USD 1.9 bn and is expected to grow at a CAGR of 10.3 percent to USD 3.1 bn in FY 2025.
Women’s innerwear category in FY2020 is estimated to be USD 4.4 bn and is expected to grow at a CAGR of 14 percent to USD 8.5 bn in FY 2025.
Men’s casual and activewear category in FY2020 is estimated to be USD 7.7 bn and is expected to grow at a CAGR of 13.9 percent to USD 14.9 bn in FY 2025.
Women’s casualwear category in FY2020 is estimated to be USD 0.9 bn and is expected to grow at a CAGR of 16.1 percent to USD 1.9 bn in FY 2025.
The kids wear market in India is currently about USD 14 bn (FY 2020) and is expected to grow at a CAGR of 10.5 percent and grow to nearly USD 23 bn by FY 2025.
10
KEY HIGHLIGHTS
• COMPANY OVERVIEW
• ATTRACTIVE MACRO OPPORTUNITY
• KEY HIGHLIGHTS
• MULTIPLE PRODUCTS OFFERING
• NEW LAUNCHES
• UNMATCHED MARKET COVERAGE
• EXTENSIVE BRAND REACH
• MANUFACTURING CAPABILITIES
• FINANCIAL HIGHLIGHTS
• SUSTAINABILITY
• SHAREHOLDING PATTERN
CONTENTS
11
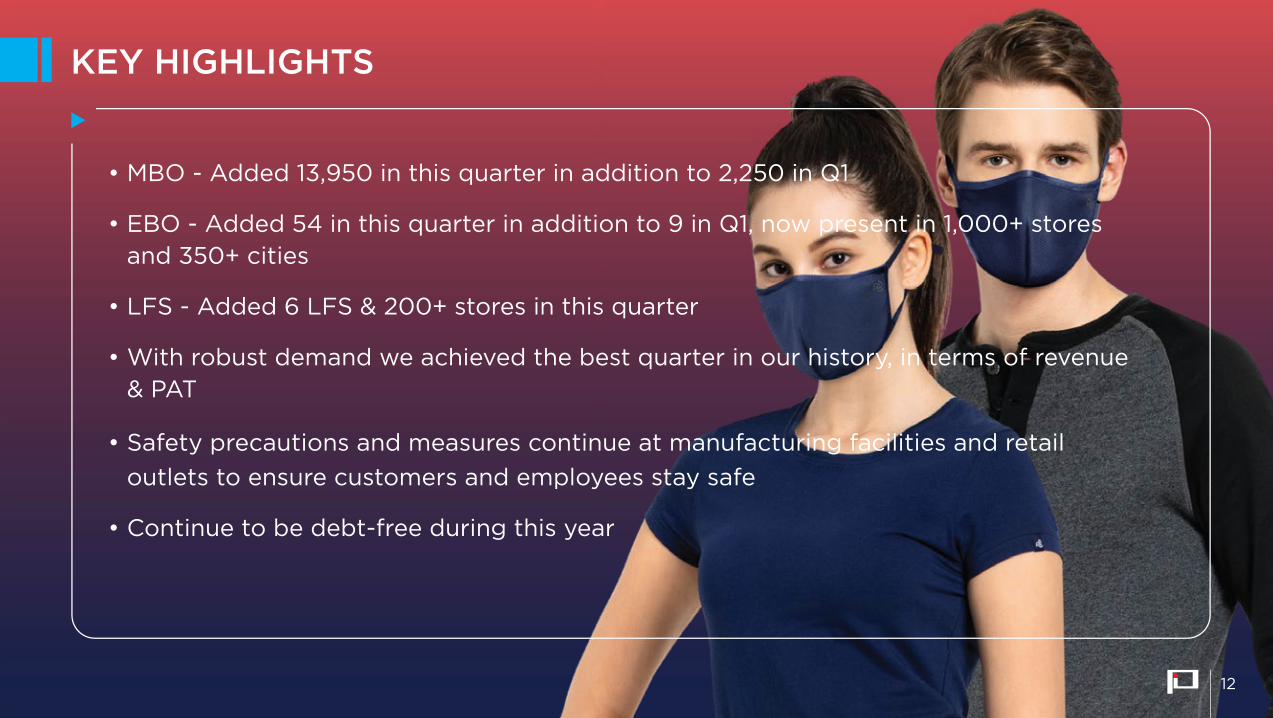
• MBO - Added 13,950 in this quarter in addition to 2,250 in Q1
• EBO - Added 54 in this quarter in addition to 9 in Q1, now present in 1,000+ stores and 350+ cities
• LFS - Added 6 LFS & 200+ stores in this quarter
• With robust demand we achieved the best quarter in our history, in terms of revenue & PAT
• Safety precautions and measures continue at manufacturing facilities and retail outlets to ensure customers and employees stay safe
• Continue to be debt-free during this year
KEY HIGHLIGHTS
12
MULTIPLE PRODUCTS OFFERING
• COMPANY OVERVIEW
• ATTRACTIVE MACRO OPPORTUNITY
• KEY HIGHLIGHTS
• MULTIPLE PRODUCTS OFFERING
• NEW LAUNCHES
• UNMATCHED MARKET COVERAGE
• EXTENSIVE BRAND REACH
• MANUFACTURING CAPABILITIES
• FINANCIAL HIGHLIGHTS
• SUSTAINABILITY
• SHAREHOLDING PATTERN
CONTENTS
13
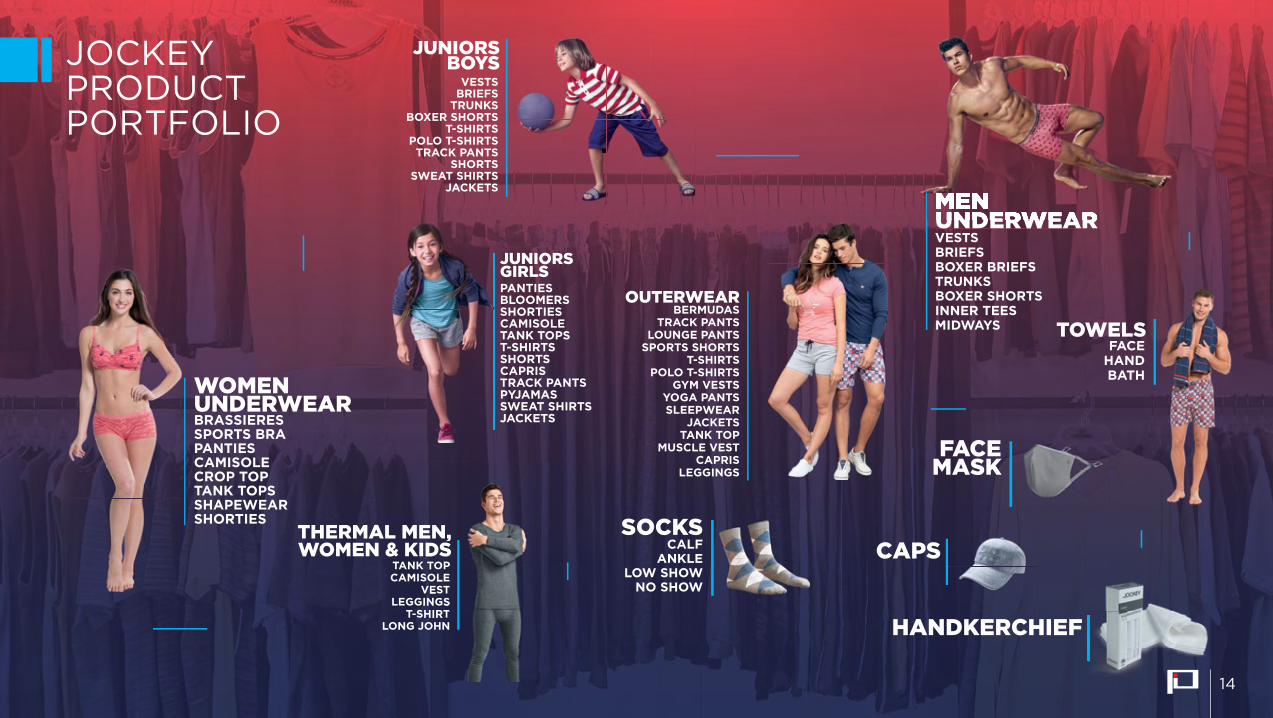
OUTERWEARBERMUDAS
TRACK PANTSLOUNGE PANTS
SPORTS SHORTST-SHIRTS
POLO T-SHIRTSGYM VESTS
YOGA PANTSSLEEPWEAR
JACKETSTANK TOP
MUSCLE VESTCAPRIS
LEGGINGS
THERMAL MEN, WOMEN & KIDS
TANK TOPCAMISOLE
VESTLEGGINGS
T-SHIRTLONG JOHN
VESTSBRIEFSBOXER BRIEFSTRUNKSBOXER SHORTSINNER TEESMIDWAYS
FACE HAND BATH
SOCKS
TOWELS
CALFANKLE
LOW SHOWNO SHOW
MENUNDERWEAR
VESTSBRIEFS
TRUNKSBOXER SHORTS
T-SHIRTSPOLO T-SHIRTS
TRACK PANTSSHORTS
SWEAT SHIRTSJACKETS
JUNIORSBOYS
EN,IDSK TOPSOLEVESTINGSHIRT
JOHN
FACEMASK
PANTIESBLOOMERSSHORTIESCAMISOLETANK TOPST-SHIRTSSHORTSCAPRISTRACK PANTSPYJAMASSWEAT SHIRTSJACKETS
JUNIORSGIRLS
WOMENUNDERWEARBRASSIERESSPORTS BRAPANTIESCAMISOLECROP TOPTANK TOPSSHAPEWEARSHORTIES
CAPS
HANDKERCHIEF
JOCKEY PRODUCTPORTFOLIO
14
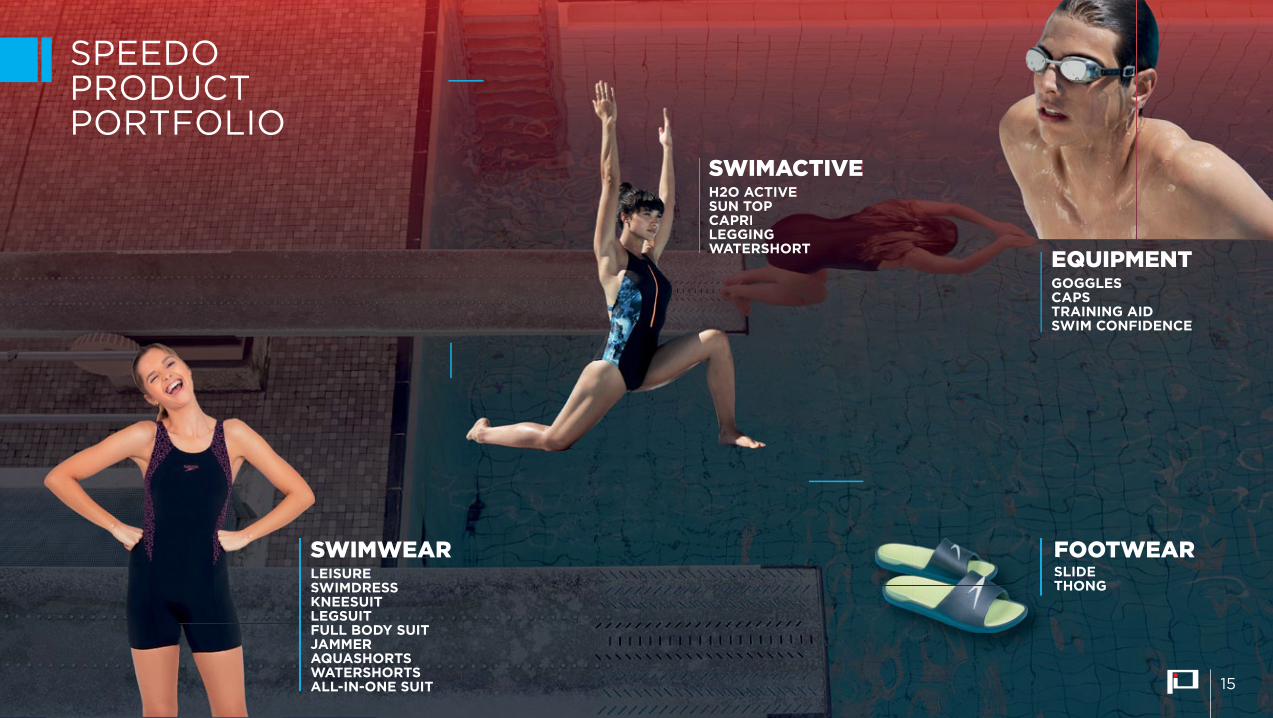
SWIMWEARLEISURESWIMDRESSKNEESUITLEGSUITFULL BODY SUITJAMMERAQUASHORTSWATERSHORTSALL-IN-ONE SUIT
EQUIPMENTGOGGLESCAPSTRAINING AIDSWIM CONFIDENCE
SLSKLFJAWA
SWIMACTIVEH2O ACTIVESUN TOPCAPRILEGGINGWATERSHORT
SWIMH2O ACTSUN TOPCAPRILEGGINGWATERS
FOOTWEARSLIDETHONG
FST
SPEEDO PRODUCTPORTFOLIO
15
NEW LAUNCHES
• COMPANY OVERVIEW
• ATTRACTIVE MACRO OPPORTUNITY
• KEY HIGHLIGHTS
• MULTIPLE PRODUCTS OFFERING
• NEW LAUNCHES
• UNMATCHED MARKET COVERAGE
• EXTENSIVE BRAND REACH
• MANUFACTURING CAPABILITIES
• FINANCIAL HIGHLIGHTS
• SUSTAINABILITY
• SHAREHOLDING PATTERN
CONTENTS
16

Style No. UM36Jogger
Style No. A111 Jacket
Style No. IM22Full Sleeve T-Shirt
JOCKEY - NEW LAUNCHES
Style No. AB26Hoodie Sweatshirt
Style No. RG12Long LengthT-shirt
Style No. A1003/4th Sleeve T-Shirt
17
UNMATCHED MARKET COVERAGE
• COMPANY OVERVIEW
• ATTRACTIVE MACRO OPPORTUNITY
• KEY HIGHLIGHTS
• MULTIPLE PRODUCTS OFFERING
• NEW LAUNCHES
• UNMATCHED MARKET COVERAGE
• EXTENSIVE BRAND REACH
• MANUFACTURING CAPABILITIES
• FINANCIAL HIGHLIGHTS
• SUSTAINABILITY
• SHAREHOLDING PATTERN
CONTENTS
18
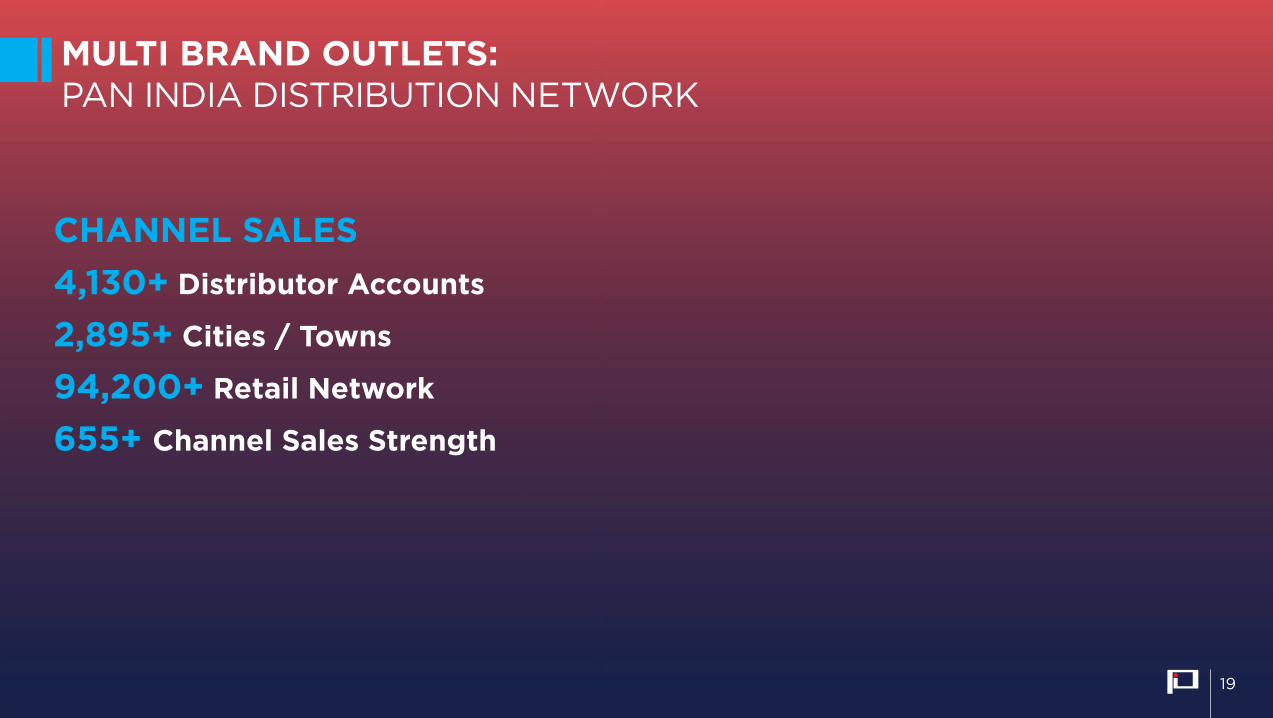
MULTI BRAND OUTLETS:PAN INDIA DISTRIBUTION NETWORK
CHANNEL SALES 4,130+ Distributor Accounts
2,895+ Cities / Towns
94,200+ Retail Network
655+ Channel Sales Strength
19
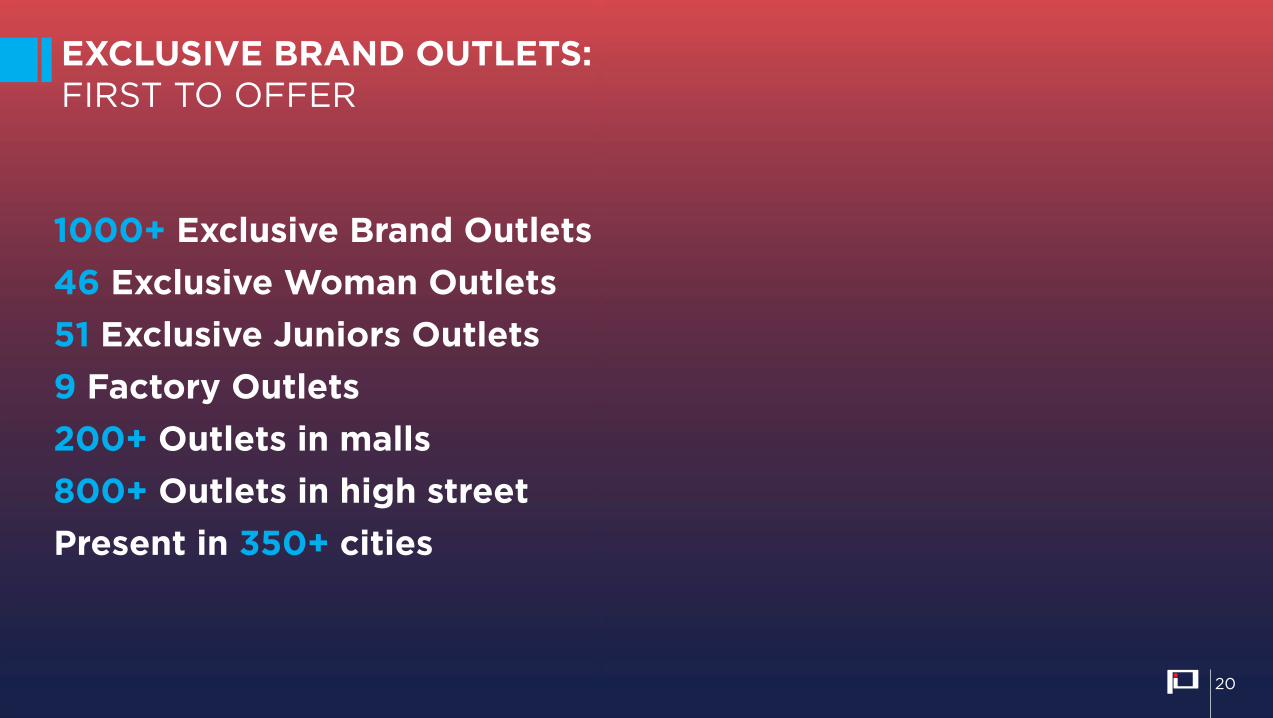
EXCLUSIVE BRAND OUTLETS:FIRST TO OFFER
1000+ Exclusive Brand Outlets 46 Exclusive Woman Outlets51 Exclusive Juniors Outlets9 Factory Outlets200+ Outlets in malls 800+ Outlets in high street Present in 350+ cities
20
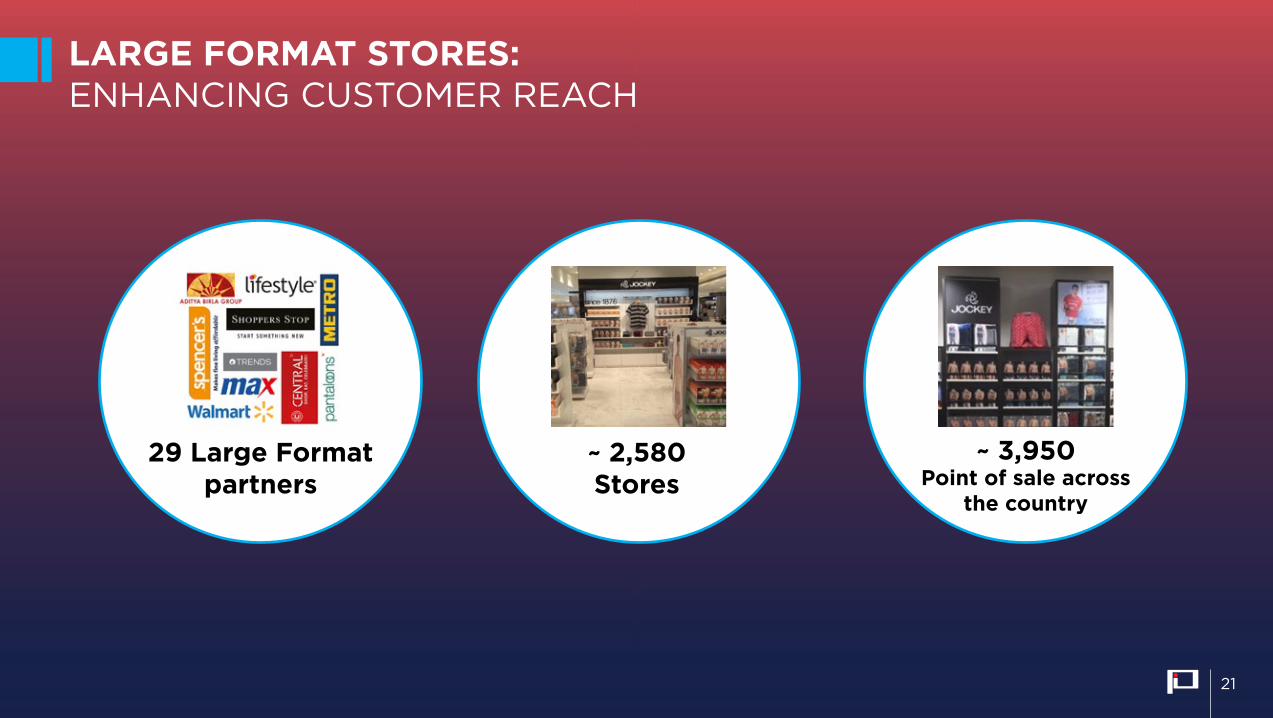
LARGE FORMAT STORES: ENHANCING CUSTOMER REACH
29 Large Format partners
~ 2,580 Stores
~ 3,950 Point of sale across
the country
21
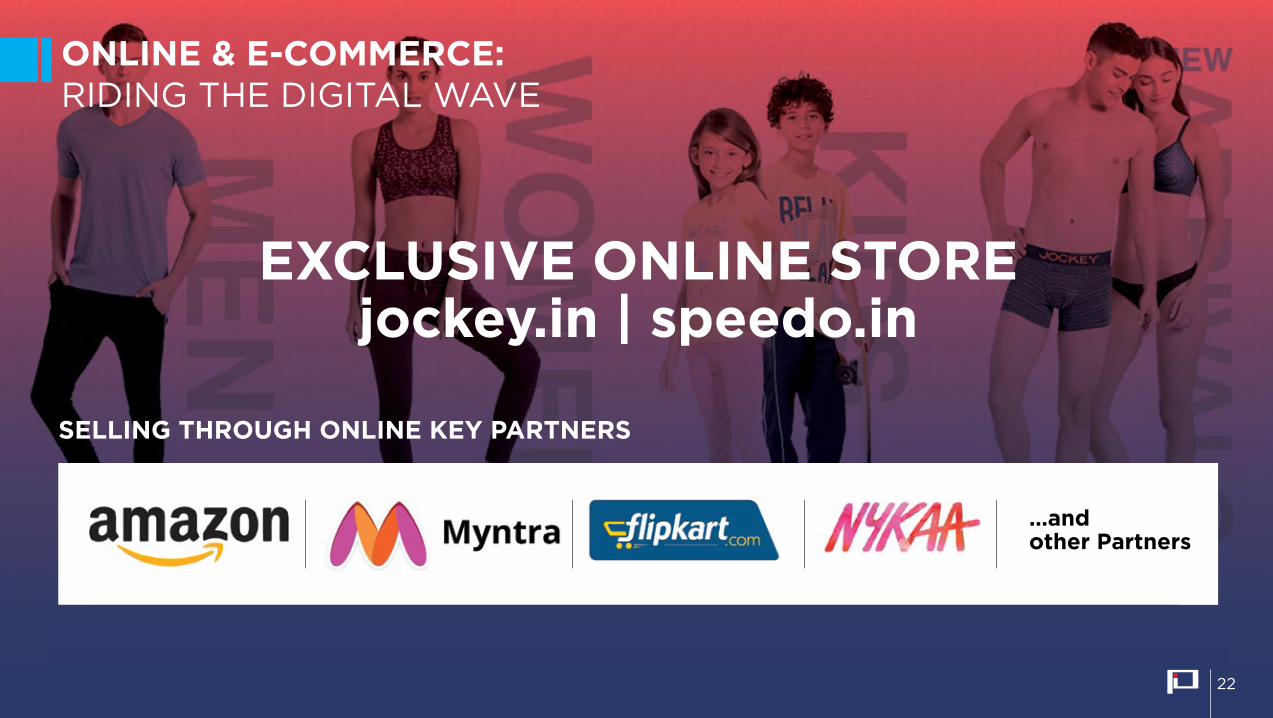
SELLING THROUGH ONLINE KEY PARTNERS
…andother Partners
EXCLUSIVE ONLINE STOREjockey.in | speedo.in
ONLINE & E-COMMERCE: RIDING THE DIGITAL WAVE
22
EXTENSIVE BRAND REACH
• COMPANY OVERVIEW
• ATTRACTIVE MACRO OPPORTUNITY
• KEY HIGHLIGHTS
• MULTIPLE PRODUCTS OFFERING
• NEW LAUNCHES
• UNMATCHED MARKET COVERAGE
• EXTENSIVE BRAND REACH
• MANUFACTURING CAPABILITIES
• FINANCIAL HIGHLIGHTS
• SUSTAINABILITY
• SHAREHOLDING PATTERN
CONTENTS
23
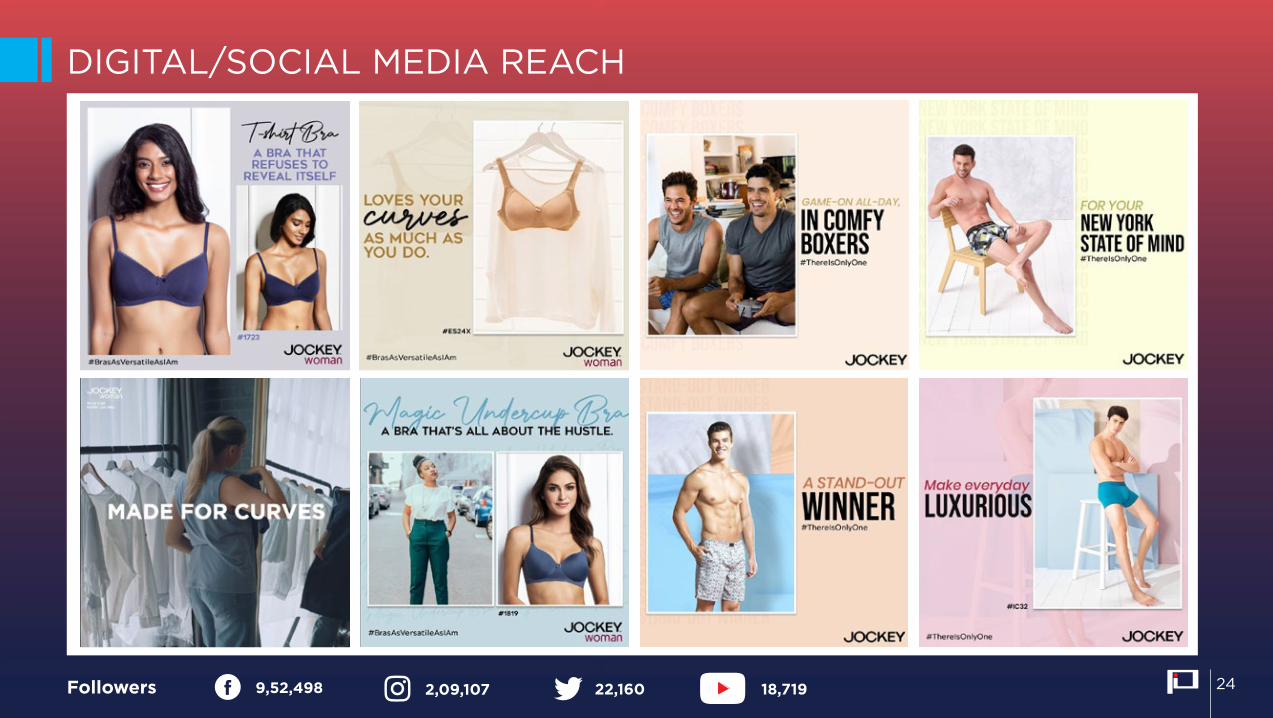
DIGITAL/SOCIAL MEDIA REACH
9,52,498 2,09,107 22,160 18,719Followers 24
MANUFACTURING CAPABILITIES
• COMPANY OVERVIEW
• ATTRACTIVE MACRO OPPORTUNITY
• KEY HIGHLIGHTS
• MULTIPLE PRODUCTS OFFERING
• NEW LAUNCHES
• UNMATCHED MARKET COVERAGE
• EXTENSIVE BRAND REACH
• MANUFACTURING CAPABILITIES
• FINANCIAL HIGHLIGHTS
• SUSTAINABILITY
• SHAREHOLDING PATTERN
CONTENTS
25
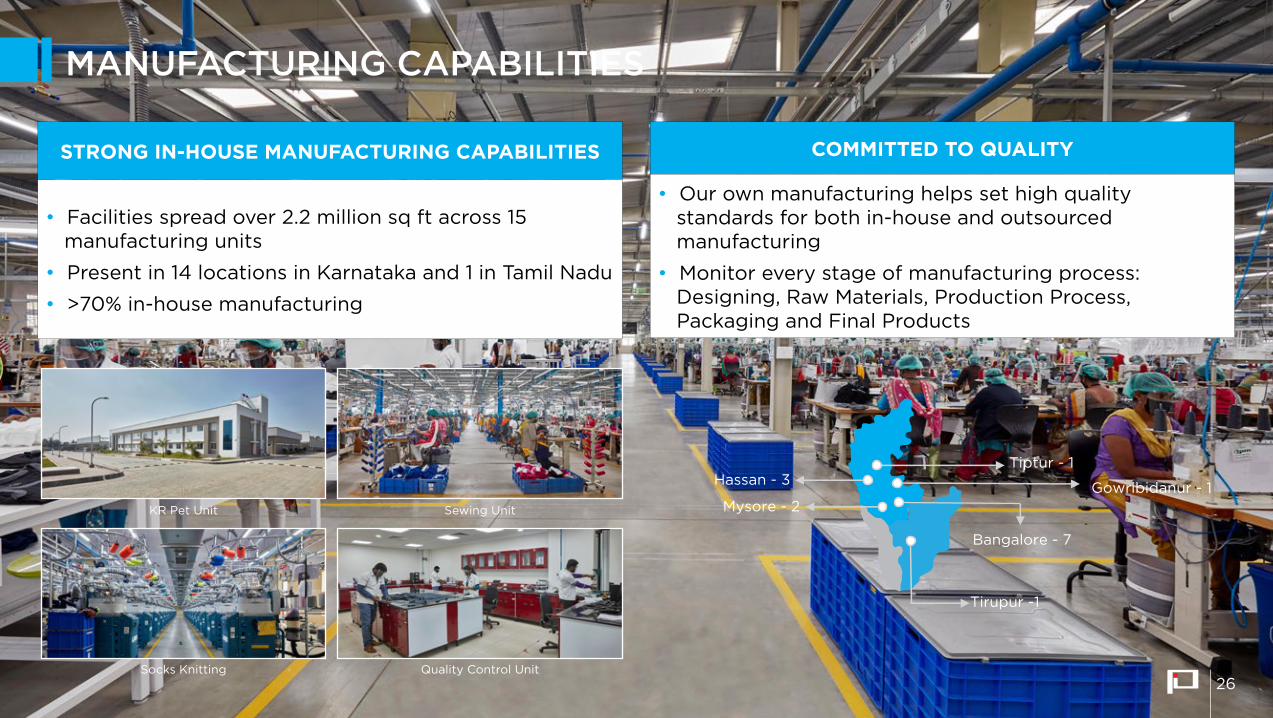
MANUFACTURING CAPABILITIES
STRONG IN-HOUSE MANUFACTURING CAPABILITIES
• Facilities spread over 2.2 million sq ft across 15 manufacturing units
• Present in 14 locations in Karnataka and 1 in Tamil Nadu
• >70% in-house manufacturing
COMMITTED TO QUALITY
• Our own manufacturing helps set high quality standards for both in-house and outsourced manufacturing
• Monitor every stage of manufacturing process: Designing, Raw Materials, Production Process, Packaging and Final Products
Tiptur - 1
Tirupur -1
Bangalore - 7
Gowribidanur - 1Mysore - 2
Hassan - 3
KR Pet Unit
Socks Knitting
Sewing Unit
Quality Control Unit26
FINANCIAL HIGHLIGHTS
• COMPANY OVERVIEW
• ATTRACTIVE MACRO OPPORTUNITY
• KEY HIGHLIGHTS
• MULTIPLE PRODUCTS OFFERING
• NEW LAUNCHES
• UNMATCHED MARKET COVERAGE
• EXTENSIVE BRAND REACH
• MANUFACTURING CAPABILITIES
• FINANCIAL HIGHLIGHTS
• SUSTAINABILITY
• SHAREHOLDING PATTERN
CONTENTS
27
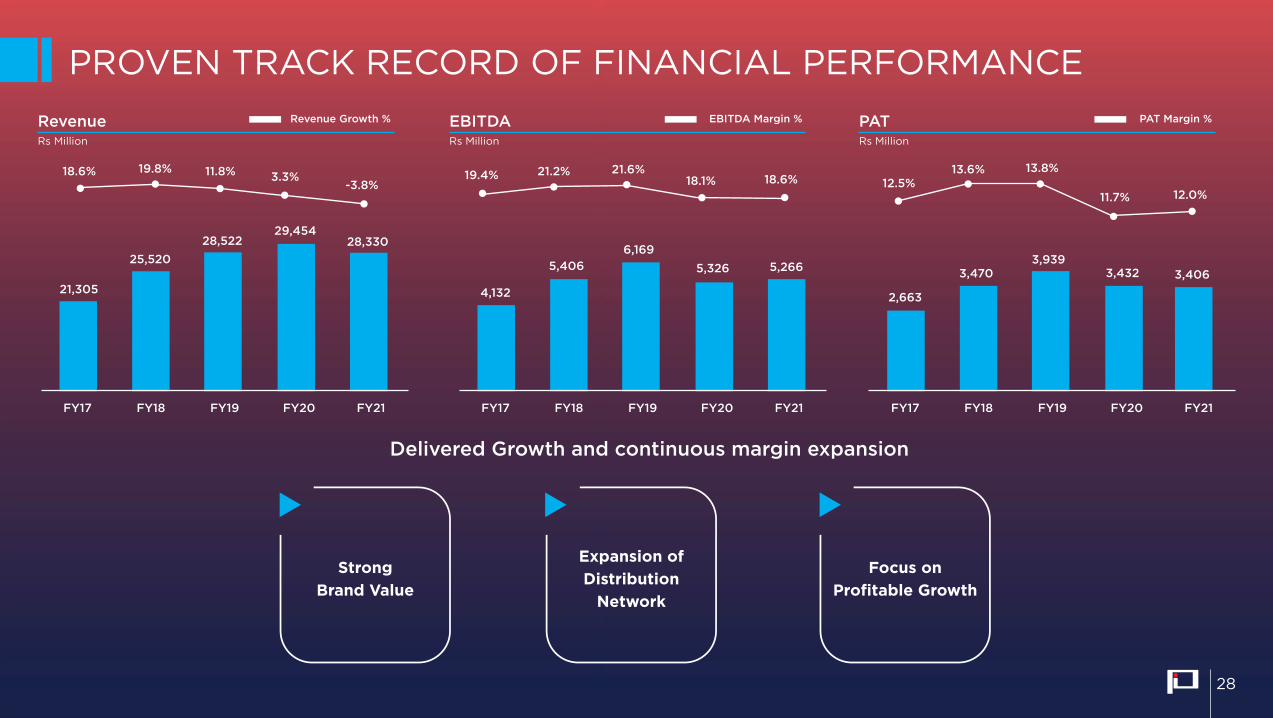
PROVEN TRACK RECORD OF FINANCIAL PERFORMANCE
FY17 FY17 FY17FY18 FY18 FY18FY19 FY19 FY19FY20 FY20 FY20FY21 FY21 FY21
21,305 4,132 2,663
5,406 3,470
6,1693,939
5,326 5,266 3,432 3,40625,520
28,52229,454
28,330
Revenue EBITDA PATRs Million Rs Million Rs Million
Revenue Growth % EBITDA Margin % PAT Margin %
19.8%18.6% 11.8% 19.4%12.5%
13.6% 13.8%
11.7% 12.0%
21.2% 21.6%18.6%18.1%3.3%
-3.8%
Delivered Growth and continuous margin expansion
Strong Brand Value
Expansion of Distribution
Network
Focus on Profitable Growth
28
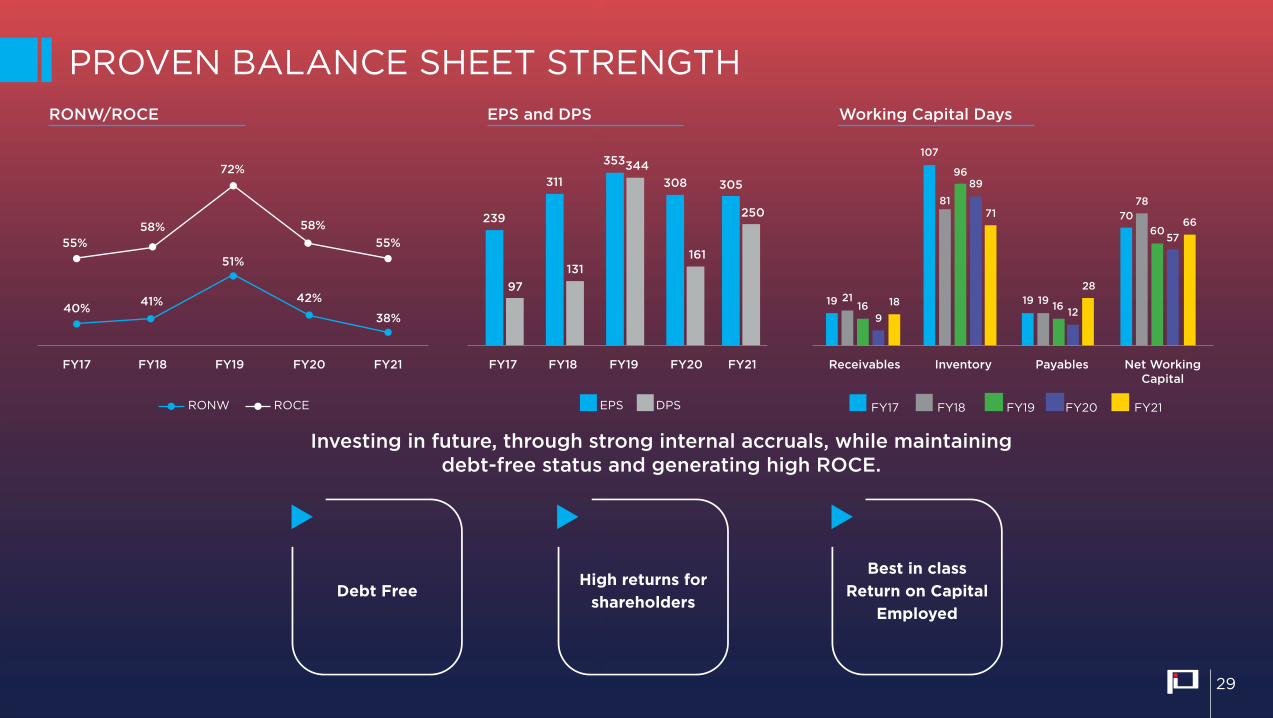
40%
51%
41% 42%
38%
55%58%
72%
58%55%
FY17 FY17
239
19 19 19 16 12
28
7078
6057
66
107
81
9689
71
1621
918
311
353
308 305
161
250
97131
344
FY18 FY18
EPS DPS FY18FY17 FY19 FY20 FY21
FY19 FY19
RONW ROCE
FY20 FY20 FY21FY21 Receivables Inventory Payables Net Working Capital
RONW/ROCE EPS and DPS Working Capital Days
Investing in future, through strong internal accruals, while maintaining debt-free status and generating high ROCE.
Debt Free High returns for
shareholders
Best in class Return on Capital
Employed
PROVEN BALANCE SHEET STRENGTH
29
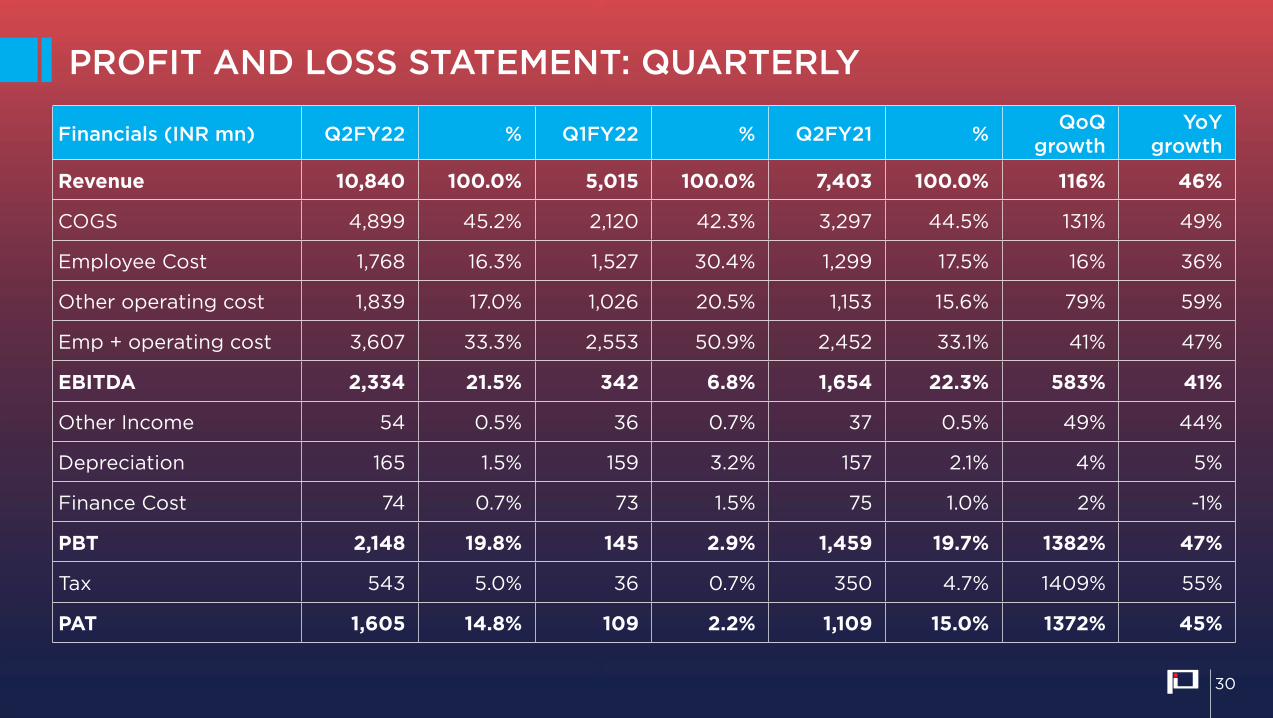
PROFIT AND LOSS STATEMENT: QUARTERLY
Financials (INR mn) Q2FY22 % Q1FY22 % Q2FY21 % QoQ growth
YoY growth
Revenue 10,840 100.0% 5,015 100.0% 7,403 100.0% 116% 46%
COGS 4,899 45.2% 2,120 42.3% 3,297 44.5% 131% 49%
Employee Cost 1,768 16.3% 1,527 30.4% 1,299 17.5% 16% 36%
Other operating cost 1,839 17.0% 1,026 20.5% 1,153 15.6% 79% 59%
Emp + operating cost 3,607 33.3% 2,553 50.9% 2,452 33.1% 41% 47%
EBITDA 2,334 21.5% 342 6.8% 1,654 22.3% 583% 41%
Other Income 54 0.5% 36 0.7% 37 0.5% 49% 44%
Depreciation 165 1.5% 159 3.2% 157 2.1% 4% 5%
Finance Cost 74 0.7% 73 1.5% 75 1.0% 2% -1%
PBT 2,148 19.8% 145 2.9% 1,459 19.7% 1382% 47%
Tax 543 5.0% 36 0.7% 350 4.7% 1409% 55%
PAT 1,605 14.8% 109 2.2% 1,109 15.0% 1372% 45%
30
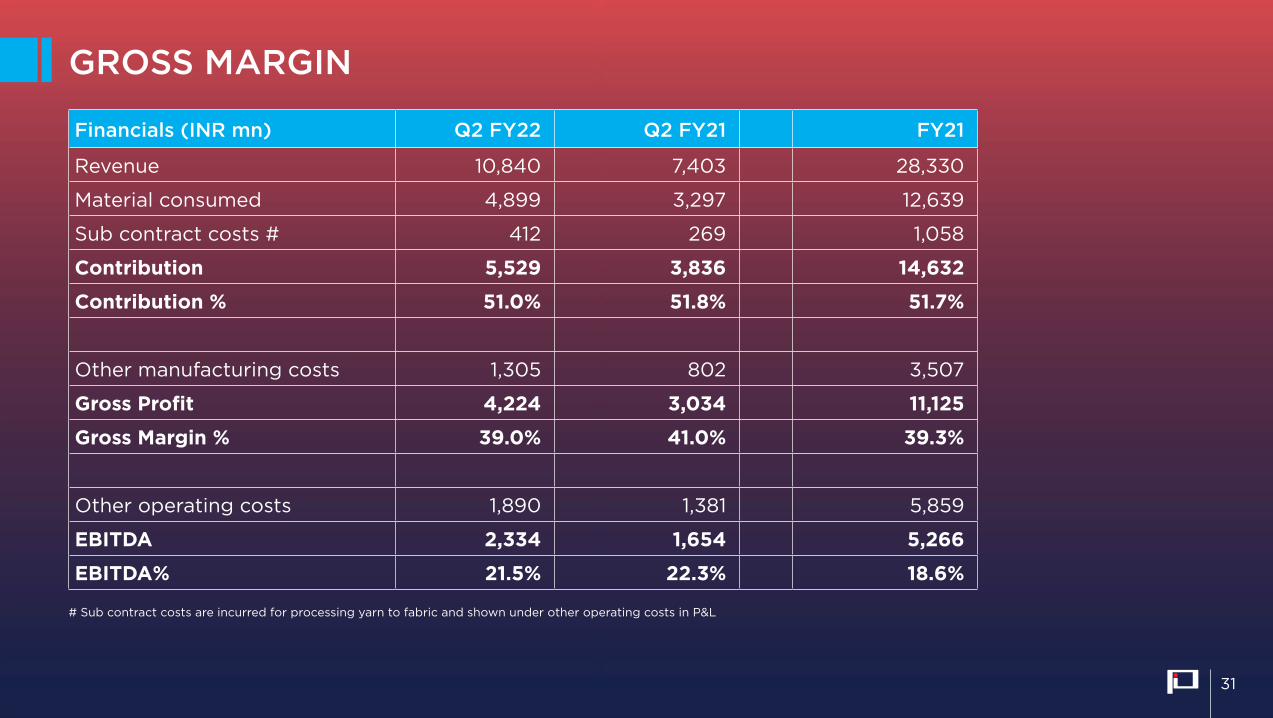
GROSS MARGIN
Financials (INR mn) Q2 FY22 Q2 FY21 FY21
Revenue 10,840 7,403 28,330
Material consumed 4,899 3,297 12,639
Sub contract costs # 412 269 1,058
Contribution 5,529 3,836 14,632
Contribution % 51.0% 51.8% 51.7%
Other manufacturing costs 1,305 802 3,507
Gross Profit 4,224 3,034 11,125
Gross Margin % 39.0% 41.0% 39.3%
Other operating costs 1,890 1,381 5,859
EBITDA 2,334 1,654 5,266
EBITDA% 21.5% 22.3% 18.6%
# Sub contract costs are incurred for processing yarn to fabric and shown under other operating costs in P&L
31
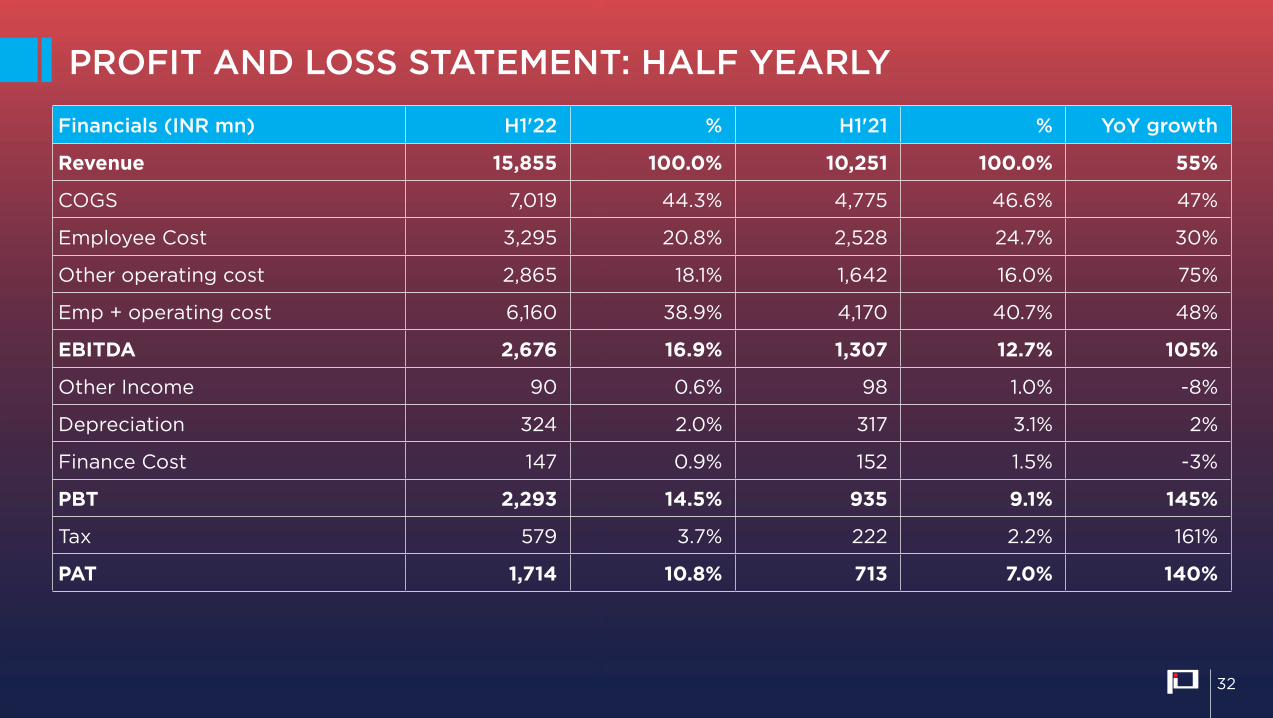
PROFIT AND LOSS STATEMENT: HALF YEARLY
Financials (INR mn) H1'22 % H1'21 % YoY growth
Revenue 15,855 100.0% 10,251 100.0% 55%
COGS 7,019 44.3% 4,775 46.6% 47%
Employee Cost 3,295 20.8% 2,528 24.7% 30%
Other operating cost 2,865 18.1% 1,642 16.0% 75%
Emp + operating cost 6,160 38.9% 4,170 40.7% 48%
EBITDA 2,676 16.9% 1,307 12.7% 105%
Other Income 90 0.6% 98 1.0% -8%
Depreciation 324 2.0% 317 3.1% 2%
Finance Cost 147 0.9% 152 1.5% -3%
PBT 2,293 14.5% 935 9.1% 145%
Tax 579 3.7% 222 2.2% 161%
PAT 1,714 10.8% 713 7.0% 140%
32
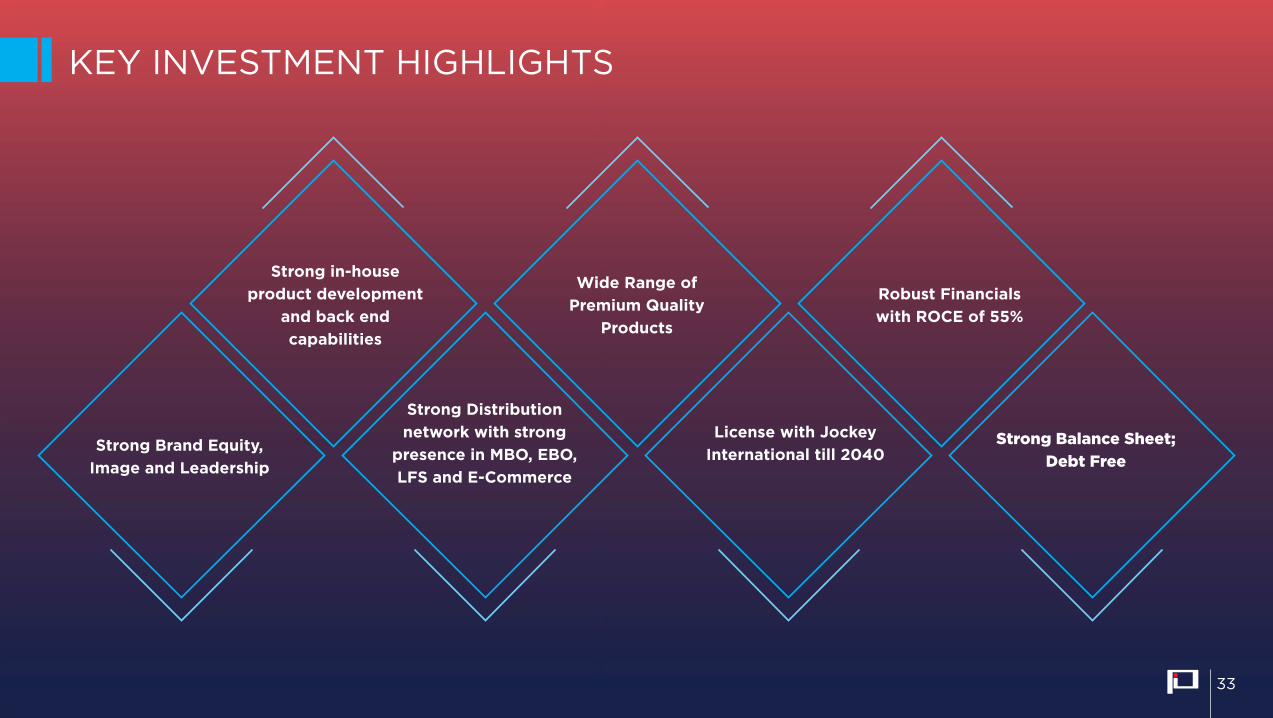
KEY INVESTMENT HIGHLIGHTS
Strong Brand Equity, Image and Leadership
Strong Distribution network with strong
presence in MBO, EBO, LFS and E-Commerce
License with Jockey International till 2040
Strong Balance Sheet; Debt Free
Strong in-house product development
and back end capabilities
Wide Range of Premium Quality
Products
Robust Financials with ROCE of 55%
33

SUSTAINABILITY
• COMPANY OVERVIEW
• ATTRACTIVE MACRO OPPORTUNITY
• KEY HIGHLIGHTS
• MULTIPLE PRODUCTS OFFERING
• NEW LAUNCHES
• UNMATCHED MARKET COVERAGE
• EXTENSIVE BRAND REACH
• MANUFACTURING CAPABILITIES
• FINANCIAL HIGHLIGHTS
• SUSTAINABILITY
• SHAREHOLDING PATTERN
CONTENTS
34
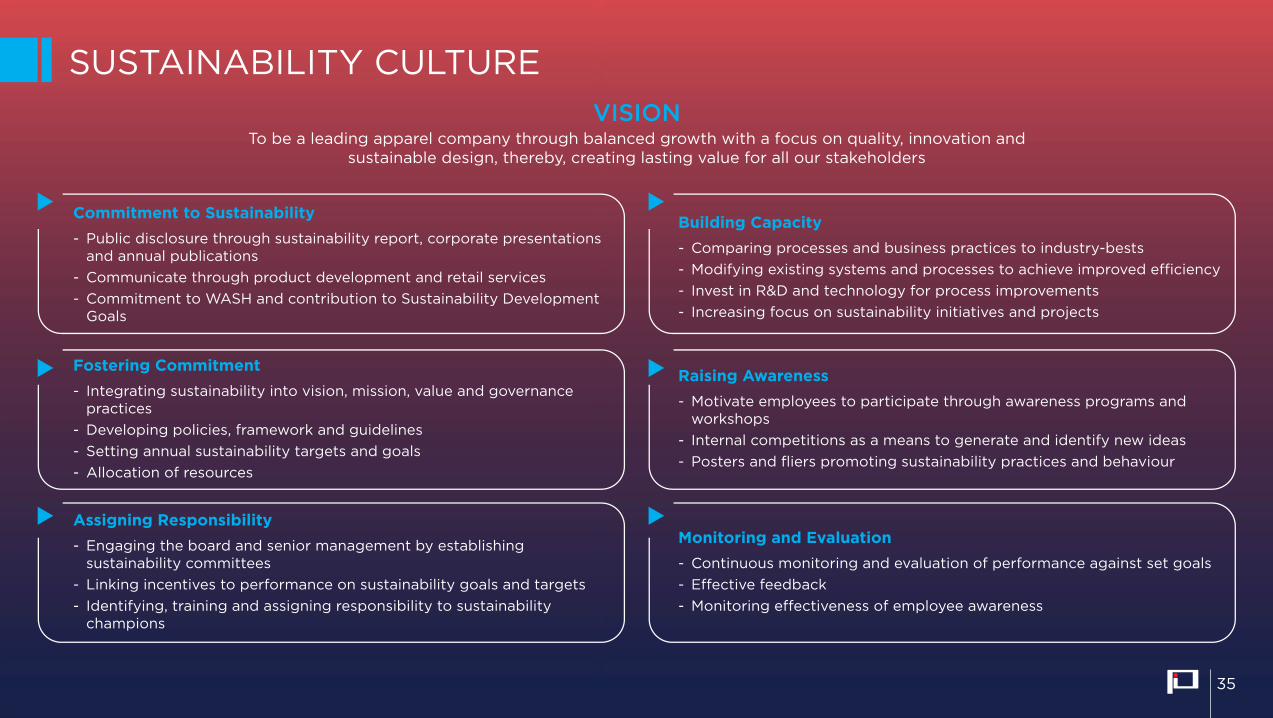
SUSTAINABILITY CULTURE
Commitment to Sustainability- Public disclosure through sustainability report, corporate presentations
and annual publications- Communicate through product development and retail services- Commitment to WASH and contribution to Sustainability Development
Goals
Building Capacity- Comparing processes and business practices to industry-bests- Modifying existing systems and processes to achieve improved efficiency- Invest in R&D and technology for process improvements- Increasing focus on sustainability initiatives and projects
Fostering Commitment- Integrating sustainability into vision, mission, value and governance
practices- Developing policies, framework and guidelines- Setting annual sustainability targets and goals- Allocation of resources
Raising Awareness- Motivate employees to participate through awareness programs and
workshops- Internal competitions as a means to generate and identify new ideas- Posters and fliers promoting sustainability practices and behaviour
Assigning Responsibility- Engaging the board and senior management by establishing
sustainability committees- Linking incentives to performance on sustainability goals and targets- Identifying, training and assigning responsibility to sustainability
champions
Monitoring and Evaluation- Continuous monitoring and evaluation of performance against set goals- Effective feedback- Monitoring effectiveness of employee awareness
VISIONTo be a leading apparel company through balanced growth with a focus on quality, innovation and
sustainable design, thereby, creating lasting value for all our stakeholders
At Page, we have imbibed sustainability at the heart of our business strategy, core operations and product development.
35
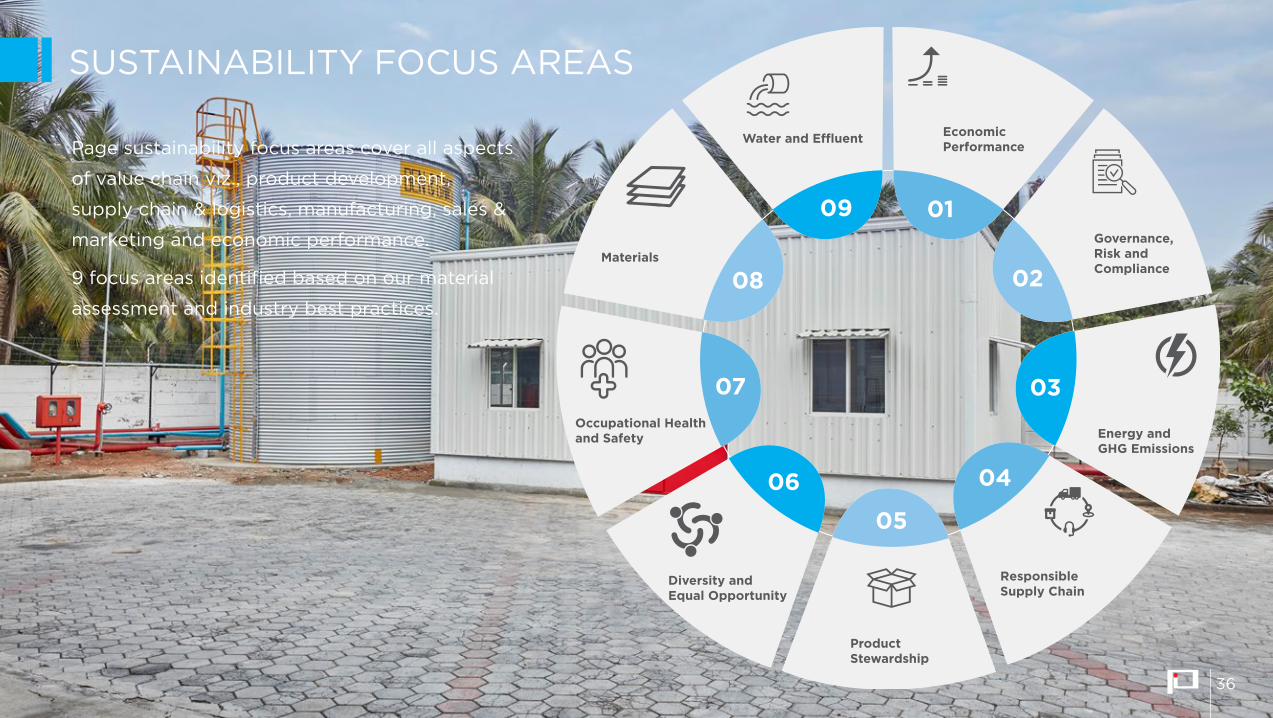
SUSTAINABILITY FOCUS AREAS
01
02
03
04
05
06
07
08
09
Economic Performance
Energy andGHG Emissions
ResponsibleSupply Chain
ProductStewardship
Diversity andEqual Opportunity
Occupational Healthand Safety
Materials
Water and E�uent
Governance, Risk and Compliance
Page sustainability focus areas cover all aspects
of value chain viz., product development,
supply chain & logistics, manufacturing, sales &
marketing and economic performance.
9 focus areas identified based on our material
assessment and industry best practices.
36
SUSTAINABILITY FOCUS AREAS
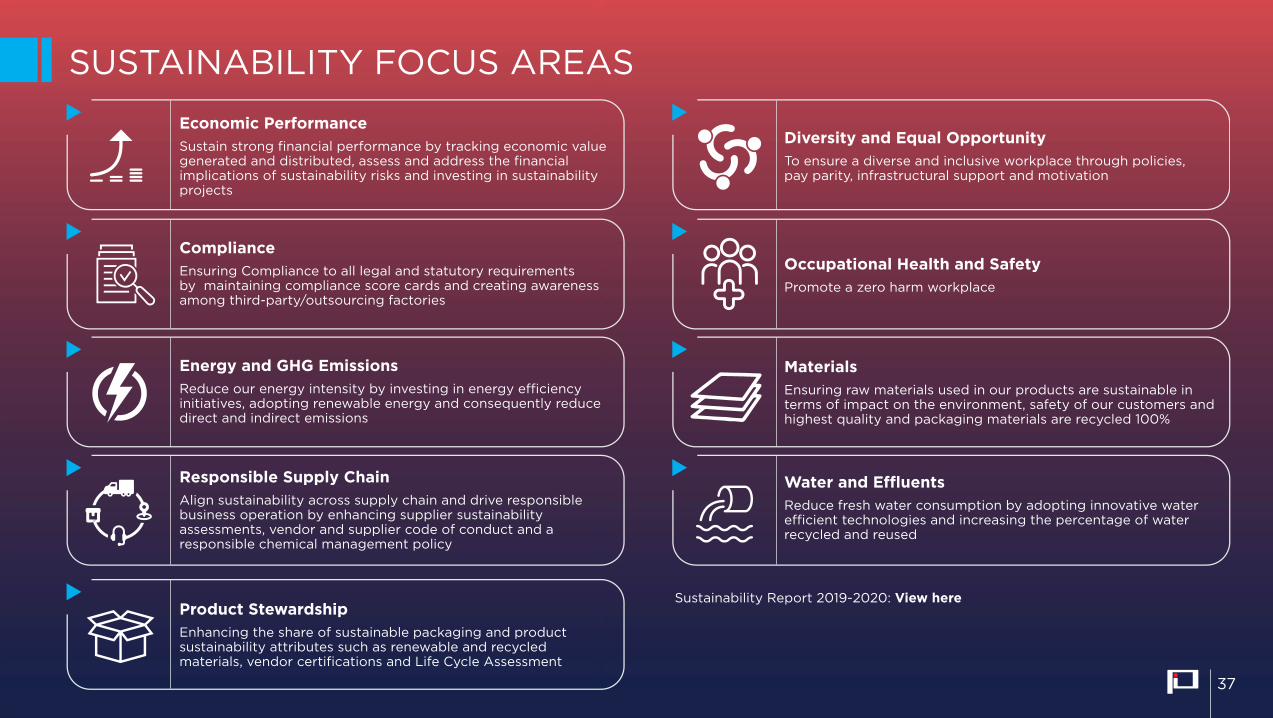
Economic PerformanceSustain strong financial performance by tracking economic value generated and distributed, assess and address the financial implications of sustainability risks and investing in sustainability projects
Responsible Supply ChainAlign sustainability across supply chain and drive responsible business operation by enhancing supplier sustainability assessments, vendor and supplier code of conduct and a responsible chemical management policy
Product StewardshipEnhancing the share of sustainable packaging and product sustainability attributes such as renewable and recycled materials, vendor certifications and Life Cycle Assessment
Energy and GHG EmissionsReduce our energy intensity by investing in energy efficiency initiatives, adopting renewable energy and consequently reduce direct and indirect emissions
ComplianceEnsuring Compliance to all legal and statutory requirements by maintaining compliance score cards and creating awareness among third-party/outsourcing factories
Diversity and Equal OpportunityTo ensure a diverse and inclusive workplace through policies, pay parity, infrastructural support and motivation
Occupational Health and SafetyPromote a zero harm workplace
MaterialsEnsuring raw materials used in our products are sustainable in terms of impact on the environment, safety of our customers and highest quality and packaging materials are recycled 100%
Water and EffluentsReduce fresh water consumption by adopting innovative water efficient technologies and increasing the percentage of water recycled and reused
Sustainability Report 2019-2020: View here
37
SHAREHOLDING PATTERN
• COMPANY OVERVIEW
• ATTRACTIVE MACRO OPPORTUNITY
• KEY HIGHLIGHTS
• MULTIPLE PRODUCTS OFFERING
• NEW LAUNCHES
• UNMATCHED MARKET COVERAGE
• EXTENSIVE BRAND REACH
• MANUFACTURING CAPABILITIES
• FINANCIAL HIGHLIGHTS
• SUSTAINABILITY
• SHAREHOLDING PATTERN
CONTENTS
38
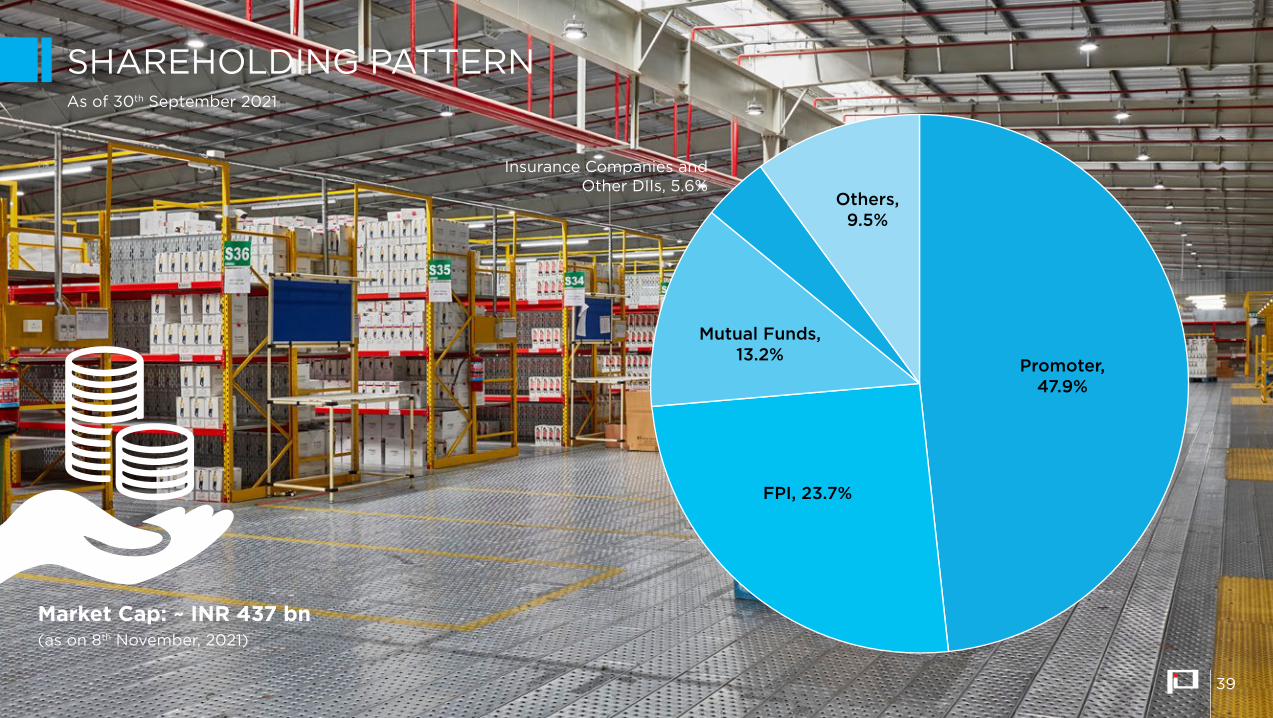
SHAREHOLDING PATTERN
Promoter, 47.9%
FPI, 23.7%
Mutual Funds, 13.2%
Others, 9.5%
As of 30th September 2021
Market Cap: ~ INR 437 bn(as on 8th November, 2021)
Insurance Companies and Other DIIs, 5.6%
39

THANK YOU
PAGE INDUSTRIES LIMITEDCIN: L18101KA1994PLC016554
Contact Us: For Investor Relations: [email protected]: www.jockey.in
40


![Chair Secretary - National Fire Protection Association€¦ · William M. Lambert, Secretary ... Donald Aldridge, Lion Apparel Inc., OH [M] ... Piano Fire Dept., TX [U]](https://img.pdfslide.us/doc/110x75/5b4f16d67f8b9a3e6e8b9109/chair-secretary-national-fire-protection-association-william-m-lambert-secretary.jpg)