Embed Size (px)
Citation preview

1
1.1 Introduction to Pesticides
“The most intelligent species on earth poisons its food before eating it.” These
startling words by Rishi Miranhshah [1] reveal the stark reality of destruction that we
face today due to the relentless and injudicious use of pesticides. We are continuously
fed on pesticide diet as they reach our food, drinking water, air, etc. Their continued
use on pests is also known to develop pest resistance, thus arises the need to probe
and develop new alternatives. United States federal law under Federal Insecticide,
fungicide and Rodenticide Act (FIFRA) defines pesticide as [2] "any substance or
mixture of substances intended for preventing, destroying, repelling or mitigating any
insects, rodents, nematodes fungi or weed or any other form of life declared to be
pest, and any substance or mixture of substances intended for use as a plant regulator,
defoliant, or desiccant."
As India is a tropical country, it suffers severe losses in agriculture due to pests [3].
This necessitates the use of pesticides to protect our crops against the attack of several
pests. Pesticides are the chemicals that kill or destroy the pests. Even though the
pesticides are poisonous chemicals, they are a major savior of humankind as they
have helped us to keep up with the food demands of the growing population.
Pesticides are our evil necessity which we cannot do without. Pesticides are relied
upon for various purposes namely increasing agriculture production, forestry, public
health, etc. In the absence of pesticides the humans, plants and animals would suffer
from various diseases [4]. The first known pesticide is Arsenic and the most popular
one has been DDT (dichlorodiphenyltrichlorethane) which was introduced in 1934 by
a scientist Paul Mullah during World War II. It was used as an effective tool to
eradicate malaria. The effective control of these pests and diseases require the use of
chemical pesticides whose usage depends upon the price, risk, credit availability and

2
cropping patterns [5]. But, it is also true that their excessive usage has made the planet
unlivable. As per WHO guidelines [6] every pesticide should be used according to the
recommended method of application. A set of guidelines should also be followed by
the manufacturers so that different companies manufacturing the same pesticide
should produce pesticide of same efficacy. The specification is even more important
as pesticides are no longer protected by patents but have become ordinary
commodities. The impurities present in the active ingredient also demand serious
attention as this may affect the toxicity and action of pesticide. Analytical methods
may also be needed to detect the impurities in the formulations. But all these steps
entail high expenditure which the developing countries like India may not be able to
afford. Hence, it is recommended that the funds, equipments and resources may be
shared between different centers in a country or with other countries. As pesticides are
meant for controlling harmful or unwanted organisms we must ensure that safeguards
are in place to protect the people, environment and wildlife from their ill-effects.
Though, the pesticides are very useful in protecting crops but these are risky by way
of their very nature. Their nature to kill the living organisms has become a bane from
living beings and environment [7]. Hence, the research is on for funding safe and
efficient methods. It is important to identify the pest to be eliminated and chose a
suitable pesticide for it. Using a general pesticide for an unsuitable pest will be a sheer
wastage of pesticide. Pesticide labels should never be ignored as they clearly state the
risks involved and the necessary precautions to be followed. The issue of pesticide
usage is a very touchy one involving $ 500 billion agro industry, environmentalists,
health concern advocates and common people. But the truth is pesticides are toxic and
need to be eliminated from the environment.
1.1.1 Pesticides Use
Agriculture is the mainstay of the Indian economy. It is a formidable task to ensure

3
food security for more than 1 billion Indian people with shrinking cultivable land
resources and this necessitates the use of high yielding variety of seeds, balanced use
of fertilizers and judicious application of quality pesticides along with education to
farmers for the implementation of modern farming techniques. One of the eight
targets marked by United Nations Hunger Task Force is to conserve the nature and
safeguard our environment [8]. As per estimates, India approximately loses 18% of
the crop yield valued at Rs.900 billion due to pest attack each year [9]. The average
pesticide consumption in India is a low 288 g/ha as compared to the global average of
900 g/ha. [10]. The use of pesticides helps to reduce the crop losses [11], provide
economic benefits to farmers, reduce soil erosion and help to ensure food safety and
security for the nation. Pesticide use is high in the cultivated regions with better
irrigation facilities and where commercial crops are planted [12], e.g., cotton is grown
in 5% of cropped area but uses up whopping 45% of total pesticides. Over 56% of
India’s population are engaged in agricultural practices and have exposure to the
pesticides used in agriculture [13]. Pesticides being used in agricultural tracts are
released into the environment and come into human contact directly or indirectly. The
production of food grains has almost quadrupled from 50 million tonnes in 1948-49 to
198 million tonnes in 1996-97 and the credit goes to increasing use of pesticides along
with betterment of technology, seeds and use of fertilizers [14]. Punjab is one of the
highest users of these pesticides since the advent of green revolution. Punjab accounts
for 1.5% landmass of the country, but its pesticide consumption is 17% of India, the
per hectare consumption being 923 g/ha, which is the highest among the other
agriculturally advanced states like Haryana, Andhra Pradesh, Tamil Nadu, Karnataka
and Gujarat. India suffers agricultural export losses worth Rs. 1000 crore due to
rejection of produce on account of excess pesticide residues [15]. India accounted for
85,000 MT of pesticide production worth Rs.74 bn inclusive of exports worth Rs. 29

4
billion during FY 07 which is the second highest in Asia (behind China) and twelfth
globally [11]. But the spread of pesticides has been uneven, the world over [16], as
North America and Western Europe account for more than 50% of global
consumption but comprise only 25% global cropland. Developing countries, which
have 55% of the world’s agricultural land use 20% of the pesticides. Proper use of
pesticides has brought many rewards. Not only has it increased the crop yields and the
income of farming community but also the quality of cereals and seeds. Pesticides
have played a crucial role in taming several vector borne diseases like malaria and
typhus, which had gained epidemic proportions. Malaria alone accounted for 300
million cases and 3 million deaths. DDT was instrumental in bringing the menace of
malaria under control in several countries of Mediterranean, India, Sri Lanka, Java,
Bali, Far East, Central and South America. As far as the gains for the mankind with
the use of DDT are concerned in the war against malaria and typhus are concerned,
they far outweigh the detrimental effects of DDT. In this light, problems of pesticide
safety, regulation of pesticide use, use of biotechnology, and biopesticides, and use of
pesticides obtained from natural plant sources such as neem extracts are some of the
future strategies for minimizing human exposure to pesticides. The pesticides have
been classified into several sub-divisions as per their chief target pest. But this doesn’t
imply that its effect will be limited to that particular class of pests. Many herbicides
can be toxic to mammals or insects and some lethal pesticides are broadly called
biocides [17].
Developed Countries follow the intensive commercial model of agriculture. In the
United States, the use of synthetic pesticides since 1945 has grown thirty-three-fold to
about 0.5 billion kilograms (kg) per year or 3 kg per hectare per year
(http://www.pollutionissues.com/A-Bo/Agriculture.html). The toxicity of modern
pesticides has increased by more than ten-fold over those pesticides used in the early

5
1950s and hence the risk posed has also increased manifold. Ground and surface
water contamination from pesticides is a serious issue. India is one of the only two
countries worldwide (along with the United States) to have applied more than 100,000
tons of dichlorodiphenyl trichloroethane (DDT) since its initial formulation. Because
of the excessive and indiscriminate use of pesticides in India, the total intake of
organochemicals per person in our country is the highest in the world.
Table 1.1: Classification of Pesiticides17
S. No. Sub-Division Target Pest
1. Acaricides Mites, spiders
2. Algacides Algae
3. Antibiotic Bacteria and virus
4. Avicide Birds
5. Dessicants Dry up animals or plants
6. Fungicides Fungi
7. Herbicides Plants
8. Insecticides Insects
9. Molluscicids Molluscs
10. Nematocides Nematodes
11. Piscicides Fish
12. Plant Regulators Retrard or speed plant growth
13. Repellants Drive away pests
14. Rodenticides Rodents

6
15. Sterilants Stop Reproduction
1.1.2 Creating Awareness
Most Indian farmers rely on chemical pesticides even though being aware of their
hazardous effect on health. Many of them do not take adequate precautions while
handling these dangerous chemicals thus creating a precarious situation in rural
environment where these are abundantly used. Knowledge is power, therefore, when
farmers have knowledge of all the available options, they can reduce the risks by
avoiding most toxic substances and use the less toxic formulations. The frequency of
spraying and the volume of pesticides used should also be monitored. The farmers
should be taught how pesticides may enter our bodies and what precautions are
needed to avoid life-threatening situations. Information about the correct storage and
disposal practices must be disseminated so as to avoid contamination of food, water,
etc. The knowledge about signs and symptoms of pesticide poisoning is another
important aspect to be taken care of. In view of the above discussion, it becomes
amply clear that awareness about pesticide use needs to be spread widely and at the
same time better and less toxic alternatives must be explored. A pesticide passes
through many checks and regulations before it enters the market. Then it must be
registered with the appropriate Government Authority as mentioned under the
Insecticides Act 1968 before it is allowed to be used. The Ministry of Agriculture
administering this Act, recommends the type and dosage of a pesticide for use on a
particular crop. The Ministry of Health and Family Welfare prescribes standards for
different pesticides which can be allowed to remain in the case of particular
agricultural commodity [7]. Under the Prevention of Food Adulteration Act, 1954
7
MRLs (Maximum Residual Limits) are prescribed for pesticide residues in
agricultural commodities. MRL is expressed in mg/kg.
1.1.2.1 New Alternatives to Conventional Pesticides
The chemical control of disease vectors has been remarkably successful, but it is clear
that if our aim is sustainable development, the dependence on chemical methods has
to be reduced and alternative methods of biological control and environmental
management must be implemented. Hence, Integrated Pest Management (IPM) must
be followed to develop safe and effective methods for crop protection while
preserving the environmental balance and resources [18-21].Various new alternatives
for pesticides have emerged lately:
1. Biopesticides are green pesticides which are derived from plants or other
organisms. Biopesticides generally include: microbial living systems-bacteria, fungi,
virus, entomopathogenic nematodes, insect predators and natural parasites, plant-
derived products, insect pheromones and metabolites. Biopesticides are being seen as
a possible alternative as these are safer, cost-effective, target specific, biodegradable
and ensure sustainable agriculture.
i.) Botanical Pesticides: are derived from the plant sources, examples include
Azadirachtin from neem, pyrethrum daisy extract; eucalyptus globules etc.
ii.) Microbial Insecticides: comprise of microscopic living organisms (virus,
bacteria, fungi, protozoa or nematodes) [22-29]. Greatest progress has been made with
biological control agent, e.g., Bacillus thuringiensis serotype H-14.
iii.) Fly-ash based herbal pesticides [30]: derived from waste material from thermal
power plants has proved to be a useful insecticide against several pests infesting the
rice, vegetables and other field crops. It is being developed as a potential dust
8
insecticide as well as an active carrier in many insecticide formulations like dust,
wettable powder and granules.
2. Other substitutes for Pesticides
Some other viable alternatives to pesticides can be the use of physical barriers
(www.oznet.ksu.edu/dp_hfrr/extensn/Hort_Tips/Garden_Tips/Alternative%20Pesticid
es.htm) to block entry of pests and crop rotation and diversification can be used as a
means to restrict pest attacks and movement.
1.1.2.2 Future Outlook
It is being projected that the continued regulatory pressures will drive the need for
safer, cost-effective disease and pest management [31-34]. This in turn shall help
newer products and GMOs to emerge. The adoption of biopesticides is bound to
increase due to better grower understanding of customer value equation and consumer
demand. These factors along with the continued integration of cost effective
alternatives will bring a paradigm shift in the mindset. Biopesticides are here to stay
and will remain an integral part of crop production as "life-extenders" or "stand-
alone" entities in commercial agriculture.
1.1.3 Pesticide Hazards
In India, 63% of the pesticide usage is for the agricultural sector and rest of it is used
in the non-agricultural sector [35]. The impact of pesticides in agricultural output is
remarkable, for example, in United Kingdom, the yields of wheat and barley crops
doubled between 1950 and 1975, with the use of pesticides along with fertilizers and
other agricultural inputs. Although the use of pesticides has helped to enhance
economic gains through crop protection but these gains cannot nullify the hazards of
pesticides. They have had serious implications to human health and non-target plants

9
and animals by accumulating in food and water. Widespread use of pesticides has
resulted in their bioaccumulation due to their lipophilic properties. Dikshith has
studied the effect of pesticides on the behavior of animals, the morphological and
biochemical lesions and the metabolic pathways of pesticides have been studied in
aquatic environment and various fauna [36]. The path breaking work of Rachel
Carlson, “Silent Spring” in 1962 warned that OC compounds could pollute the tissues
of virtually every life form on the earth, the air, the lakes and the oceans, the fishes
that live in them and the birds that feed on the fishes [37]. The US National Academy
of Sciences made a shocking expose that the DDT metabolite, DDE causes eggshell
thinning and that the bald eagle population in the United States declined primarily
because of exposure to DDT and its metabolites [38]. Many pesticides act as
endocrine disruptors which act by mimicking or destroying the natural hormones in
the body and their long-term, low-dose exposure is responsible for many dreaded
conditions like immunosuppression, hormone disruption, diminished intelligence,
reproductive abnormalities and cancer [39-41]. The first case of pesticide poisoning in
India was reported from Kerala in 1958 where, over 100 people died after consuming
wheat flour contaminated with parathion [42]. Even though the consumption of
pesticides in India is still very low yet the food commodities are widely contaminated
with pesticide residues, mainly because of the non-judicious use of pesticides. It has
been found that 51% of food commodities in India are contaminated with pesticide
residues and 20% of these residues are above the maximum residue level values.
Many vegetable samples taken from the farm gate in West Bengal were found to
contain various pesticides (0.01-2.23 ppm) [42-44]. On the contrary, the UK Pesticide
Residue Committee annual report (2002) showed that over 70% of the food in the UK
was pesticide free and only 1.09% contained residues above the statutory maximum
residue levels (MRLs) [44].

10
In this light, problems of pesticide safety, regulations of pesticides use, use of
biotechnology, and biopesticides are some of the future strategies for minimizing
human exposure to pesticides. U.S. data show that 18 percent of all pesticides and
about 90 percent of all fungicides are carcinogenic. In addition to humans, thousands
of domestic animals are also poisoned by pesticides in the United States. The
destruction of natural predators and parasites is costing the USA more than $ 500
million each year and resulting in the development of pesticide resistance
[http://www.pollutionissues.com/A-Bo/Agriculture.html].
Indiscriminate aerial spraying will make the atmosphere a major reservoir for drift
prone finely divided particulate pesticides and highly volatile compounds. After
spraying, the pesticides can evaporate from soil and foliage and contaminate the
environment [45]. The volatilization rate can be as high as 80-90 percent of the
applied pesticide within a few days of application [46]. Many studies have
consistently confirmed the presence of pesticide residues in air. Almost all the
investigated pesticides have been detected in rain, air, fog, or snow across the USA at
different times of the year [47]. Pesticide drift can account for wastage of 2 to 25% of
the chemical being applied; the some of the pesticides have the capacity to spread
over a distance of several miles.
Pesticides are responsible for severe environmental imbalance as some microbe
populations may perish and others may flourish like the saphrophytic and spore
forming [48]. One spoonful of healthy soil has millions of tiny organisms which
include fungi, bacteria, and a host of others. These microorganisms act as facilitators
for the plants to help them utilize the soil nutrients. Microorganisms also play a vital
role in storage of water and nutrients in the soil and regulating water flow [49]. The
accumulation of residual pesticides and their metabolites can drastically alter the soil
chemical properties, further disrupting delicate balance in the soil microenvironment,

11
which may reduce the soil fertility and its ability to support life. The population of
some of the useful soil invertebrates like earthworms, mites, centipedes and beetles
may dwindle due to non-target or residual pesticide toxicity [48]. The study carried
out by the U.S. Geological Survey (USGS) on major river basins across the country in
the early to mid- 90s yielded shocking results as it was stated that more than 90
percent of water and fish samples from all streams were found to be contaminated
with one, or more often, several pesticides [50]. A survey in Bhopal has revealed that
58% of drinking water samples drawn from various hand pumps and wells around
Bhopal are contaminated with organochlorine pesticides above the EPA standards of
[51]. The ground water which is once polluted with toxic chemicals may involve a lot
[51]. The ground water which is once polluted with toxic chemicals may involve a lot
money and time and yet the clean up may not be completely possible [52-54].
1.1.3.1 Pesticide Poisoning
Some 500,000 people are either killed or incapacitated by poisoning every year and
developing countries make most of these casualties due to the extensive and non-
judicious use [55, 56]. As per an estimate, worldwide nearly 10,000 deaths occur
annually, worldwide, owing to the use of chemical pesticides, with about 75% of
these casualties being from developing countries [57]. At present, India is the largest
producer of pesticides in Asia and ranks twelfth in the world for the use of pesticides
with an annual production of 90,000 tons. Humans are exposed to pesticides found in
environmental media (soil, water, air and food) by different routes of exposure such
as inhalation, ingestion and dermal contact. Exposure to pesticides results in acute and
chronic health problems. These range from temporary acute effects like irritation of
eyes, excessive salivation to chronic diseases like cancer, reproductive and
developmental disorders, etc [58]. Pesticides are harmful in another way also, as their
use also leads to increased and unnecessary pest outbreaks causing additional crop

12
losses, necessitating more pesticide use and thus destroying enemies of pests and
emergence of pesticide resistant and secondary pests. This pulls the farmers into a
vicious cycle as it creates the need to spray increased doses of stronger pesticides to
kill the mutilating pests [59]. This is supported by the fact that in 1938, 7 species of
insects and mites were reported to be pesticide resistant, but in 1984, this figure
rocketed to 477 with the increase in pesticide use. Hence, it is wrong to assume that
more pesticide use will usher us into pest free society, rather we get resistant pests in
bargain, which are highly difficult to control by the prevailing methods. A PGIMER
(Post Graduate Institute for Medical Education and Research), Chandigarh, research
has linked the use of large amounts of pesticides to the ever increasing cancer cases in
the Bathinda cotton belt. A house-to-house survey of cancer cases in Punjab has put
the figures at an alarming 31 cases per lakh of population [60, 61]. Murali et al
conducted a study on acute poisoning cases in PGIMER, Chandigarh covering 15
years (1990 to 2004). The most common agents were anticholinesterases (35.1%) and
aluminum phosphide (26.1%). Maximum case fatality ratio was due to aluminum
phosphide exposures followed by anticholinesterase agents. This calls for integrated
pesticide management and training of farmers in spraying techniques [61]. The link
between unsafe and indiscriminate pesticide use has further been validated by a study
conducted by Grace et al among farmers of Thanjavur district (South India) [62].
Silva et al conducted a study on groundwater evaluation in oryziculture areas in
Portugal and the groundwater was found to be contaminated with several pesticides
which call for sustainable use of pesticides to preserve aquatic and soil resources
[63].There is strong evidence now that pesticides have entered our food chains
through ground and surface waters. CSE (Centre for Science and Environment), New
Delhi in 2004 detected pesticides in samples of renowned soft drink brands; Coke and

13
Pepsi, and these were thought to be contaminated by the water used for the production
of these drinks [7].
The pesticide invasion into US homes has been studied by Landrigan et al have
studied the [64]. As per this research, 90% of the US households use pesticides and
this makes up for $ 2 billion industry. Children are particularly a high risk group as
they are exposed to pesticides through their homes and also through the diet including
drinking water. Endosulfan is an organochlorine pesticide which has become a
leading chemical used against pests in agriculture, to kill fish in water bodies and as
an insecticide but is not recommended for household use as it is known as a potent
poison. Endosulfan got publicity when it was aerially sprayed at Kasargad in Kerala
and caused physical and mental defects in poor farmers and their families. It is proven
to accumulate in human breast milk and is the cause of heinous congenital defects,
which are still being observed at Kasargad, “Kerala’s Bhopal”. After this, 62
countries have either banned or restricted Endosulfan use, but still, India continues to
be the largest producer and exporter of this pesticide. The government has not woken
up to its dangers and succumbed to the pressure of industrialists’ lobby, and continue
to call it safe, so far, as a result of these, only the state of Kerala has banned it [65].
In rural Asia, the easy access to pesticides is turning out to be bane as the cases of
self-poisoning with agricultural pesticides has become the most common means of
suicide. Rao et al conducted a study in district government hospital of Warangal in
Andhra Pradesh [66] for the years 1997 to 2002 on 8040 patients admitted with
pesticide poisoning with the fatality rate being 22.6% and 96% had intentionally
poisoned themselves. Monocrotophos and endosulfan, accounted for the majority of
deaths in the study. Inappropriate and low doses of antidotes used were some of the
reasons for high mortality rate. As per estimates every year 250,000 to 370,000
suicides occur due to pesticide poisoning worldwide [67]. In Asian countries like

14
China, Malaysia and Sri Lanka, pesticide self-poisoning makes up 60% to 90% of all
suicides cases. The study conducted by Mohamed et al in Sri Lanka concluded that
pesticides were readily available to the people inflicting self-poisoning within their
homes or nearby. In this context it becomes imperative to reduce the accessibility of
pesticides in the domestic environment as it can have a direct bearing on reducing the
number of pesticide related suicides [68]. It is important that the pesticides be stored
safely and efforts must be made to make the sale of pesticides safer from the shops. In
a study conducted on workers (N=356) in four units manufacturing HCH by Nigam et
al revealed that 21% of the studied workerses had neurological symptoms related to
the intensity of exposure [69]. The National Institute of Occupational Health (NIOH)
studied the magnitude of the toxicity risk involved in the spraying of methomyl, a
carbamate insecticide, in field conditions [70]. The study highlighted immense
changes in the ECG and the levels of serum LDH and ChE activities in the spray men
thus underlining the cardiotoxic effects of methomyl. The detrimental impact of
sprayed pesticides like OC, OP and carbamates was studied for reproductive toxicity
in 1,106 couples when the males were associated with the spraying of pesticides (OC,
OP and carbamates) in cotton fields [71]. Another study brings to the fore the harmful
effects of HCH in malaria spray men (N=216) over a period of 16 weeks in field
conditions [72].
1.1.4 Pesticide Regulations in India
1.1.4.1 Use and regulation of insecticides and pesticides in India
The Ministry of Agriculture has the powers to regulate the manufacture, sale, import,
export and use of pesticides through the ‘Insecticides Act, 1968’ [7] and the rules
framed in it. A Central Insecticides Board (CIB) was constituted under Section 4 of
this 1968 Act, which advises Central and State Governments on pesticide related

15
matters. The Act also comprises a Registration Committee (RC) that is responsible for
granting approval to the use of pesticides and new formulations. While, the Ministry
of Health and Family Welfare, monitors the pesticides residue levels in food, a
Central Insecticide Board (CIB) was constituted under Section 4 of the Insecticides
Act, 1968. Its task was to advise Central Government and State Governments on
technical matters regarding pesticides viz:
(i) Requisite safety measures to prevent risk to human beings or animals in
manufacture, sale, storage, distribution and application;
(ii) Decide suitability for aerial use;
(iii) Ascertain and specify shelf-life;
(iv) Specify residue tolerance limit and waiting period;
(v) Suggest colorization;
(vi) Recommend which chemicals/substances should be included in the Schedule or
insecticide list;
(vii) Other functions pertaining to these matters, as per the need.
A Registration Committee (RC) was constituted under Section 5 of the Insecticides
Act, 1968 to register insecticides for their usage after scrutinizing different aspects of
pesticides. The Committee was informed that so far 181 pesticides have been
registered for regular use in the country. The Ministry of Health and Family Welfare
under PFA (Act), 1954 prescribes the MRL values of pesticides in food and
commodities. The Registration Certificate mandates that a label be put on the
packaging, indicating the nature of the insecticide (Agricultural or Household use),
composition, active ingredient, target pest(s), recommended dosage, caution sign and
safety precautions. Hence, a pesticide labeled for agriculture should not be used in a
household. The CIB & RC periodically reviews all pesticides and their application
and may ban some pesticides before registration. Internationally, several aid

16
organizations help to increase the skills and resources available to pesticide regulatory
authorities in developing countries. The Food and Agriculture Organization (FAO),
United Nations Environment Programme (UNEP), The US Agency for International
Aid (USAID), World Health Organisation (WHO) and others provide training,
information systems, support, analytical equipment to study risks, benefits and help
for the legislative reforms [73]. The pesticides and their residues in food products are
monitored and regulated through concepts like MRL, ADI and GAP [74].
MRL: It is the maximum concentration of pesticide residue present in a food item
or crop, when the pesticide is applied according to GAP (Good Agricultural
Practices). MRL is expressed in milligrams of pesticide residue per kg of commodity
or animal food. No Observed Adverse Effect Level (NOAEL) is calculated from
evaluation of MRL and the chronic toxicity studies. NOAEL is expressed in
milligrams of the substance being considered per kg of body weight.
ADI: ADI is calculated by dividing NOAEL normally with a safety factor of 100
(10x10), the first 10 provides interspecies variation while the 2nd
10 is for intraspecies
variation.
Good agricultural Practices: Some of the Good agricultural Practices (GAP) include
adhering to the provisions of the Insecticides Act, 1968, education of farmers
regarding the dangers of pesticides, need-based use of pesticides as per the prescribed
dosage, application technique and the recommended waiting period. Observing the
IPM (Integrated Pest Management) practices and benefiting from organic farming.
1.2 Introduction to Sample Preparation Techniques Applied
1.2.1 Microextraction by Packed Sorbent (MEPS)

17
Microextraction by packed sorbent or MEPS is a novel sample preparation and clean
up technique which can be connected online to LC and GC [75]. This technique is a
miniaturized version of solid phase extraction (SPE).The MEPS syringe has
approximately 1 mg of the packing material inserted on the bed. The sample is passed
through the solid support; the analytes get adsorbed on the sorbent. The process of
drawing in the sample is repeated several times (10 to 40) for optimum adsorption
onto the syringe bed. The solid phase is given washing with water to remove the
interferences. The analytes are then eluted with a solvent like methanol or the mobile
phase. The process can be made fully automated [76]. The elution volume of MEPS is
compatible with the injection volumes for LC and GC systems. Additionally, the
MEPS technique can be used with as low sample volumes as 10µL which is
particularly useful for analyzing biological samples.
Figure 1.1: MEPS needle with 30µm C18 Packed bed SPE device [www.sge.com]
MEPS also helps to suppress the interferences due to complex biological and
environmental matrices [75]. Another advantage of this novel technique is that the
MEPS syringe can be used over 100 times for urine and plasma samples; on the
contrary, the SPE syringe can only be used once.

18
This new approach to sample preparation and clean-up is rapid, convenient and more
cost effective than the SPE procedure. Several factors like solvent volume, number of
times the sample is drawn through syringe, washing volume etc. affect the
performance of MEPS [77].
1.2.1 Solid Phase Extraction
Solid phase extraction is a technique developed in 70s to replace liquid-liquid
extraction technique for clean-up, separation and pre-concentration of solutes in a
given sample [78-80]. SPE and LLE are similar in principle as both involve
partitioning of solute between two phases [81], but in the SPE, one of the phases is
liquid (matrix) and the other is solid sorbent of the cartridge.
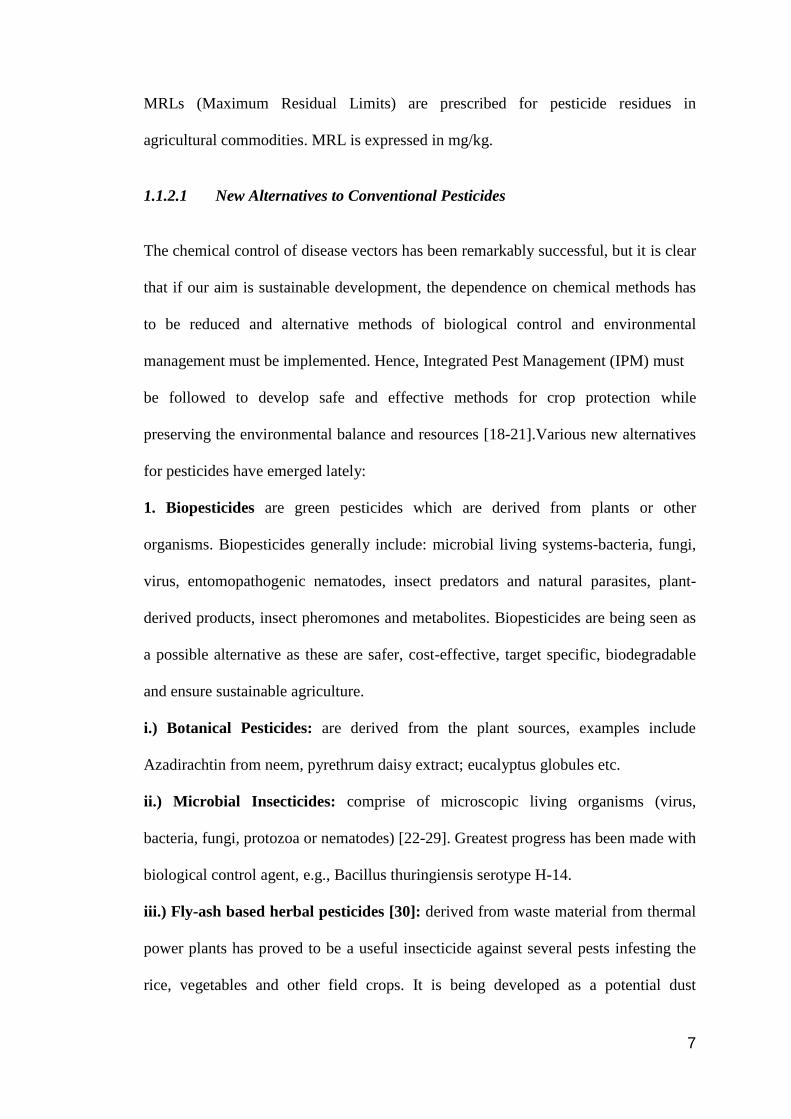
The SPE operation includes three or four consecutive steps. These steps are illustrated
in the figure 1.2. The first step is conditioning whereby, the solid sorbent is
conditioned with an appropriate solvent depending on the type of solid sorbent. The
solvent is used to wet the packing material and also helps to remove the initial
impurities present on the packing bed. By this step, air is removed from the column
and void volume is filled with solvent. It is imperative that the solid sorbent is not
allowed to dry in between various steps, as drying up will cause poor retention of
analyte onto the sorbent. The second step is the loading of the sample on the sorbent
bed through percolation. The volume for sample loading can vary from 1 mL to 1 L,
depending on the choice of analysis selected and other factors.
Washing/
Loading
Washing Elution
Conditioning

19
Figure 1.2: Stepwise working of SPE procedure [82]
The sample flow rate must be adjusted so as to strike a balance to have optimum
retention and to avoid over retention. During this step, many matrix components pass
through the cartridge, while some are retained on the sorbent. This step entails the
concentration of analyte on the sorbent. The third step is washing of the loaded
sorbent with a suitable solvent to eliminate the matrix components without the elution
of analytes. This is an optional step; it may be followed by drying step for aqueous
matrices to remove traces of water. The last step is to elute the adsorbed analytes with
an appropriate solvent which has higher affinity for analyte particles rather than the
matrix. Solvent volume and solvent flow should be adjusted to ensure high pre-
concentration of the analyzed substance.
A variety of sorbent materials are available for the SPE discs depending upon the type
of analyte to be pre-concentrated. Reversed phase sorbents like C18, C2, C8,
Normal/Reverse phase sorbents like cyanopropyl, aminopropyl and normal phase
sorbents like silica, florisil, alumina, etc. are available for various requirements [83].
1.3 Introduction to Derivative Spectrophotometry
20
Spectrophotometry is the measurable or the quantifiable study of electromagnetic
spectra. Derivative spectroscopic technique was used to further enhance the
information obtained from simple absorbance spectra [84]. The concept of derivative
spectroscopy was first introduced in 1950s and it was found to be very advantageous.
With the development of technology and the advent of microcomputers, it became
highly practicable and easily reproducible thus, becoming a very popular tool for
analytical studies. Derivative spectrophotometry (DS) involves the differentiation of a
normal spectrum and helps in enhancing the resolution of mixtures by increasing the
detectability of minor spectral features [85-90]. Derivative spectrophotometry (DS)
makes use of first and higher derivatives of absorption spectra with respect to
wavelength for qualitative analysis and for quantification. The derivatization makes
the absorbance spectra more meaningful as it allows to remove broad band
interferences caused by turbidity or matrix absorption. Derivative spectra can be
obtained by optical, electronic and mathematical methods. The mathematical
technique has superseded the other techniques. In this approach, the spectrum is
digitalized having a sampling interval of Δλ [91]. The size of Δλ depends upon the
natural bandwidth of the bands being processed and on the bandwidth of the
instrument being used. The derivative spectra are complex as compared to the zero
order spectra. The 1st derivative is the rate of change of absorbance against
wavelength. This spectrum starts at zero and then passes through zero at the
wavelength same as the λmax of the original spectrum. The 1st derivative has a positive
and a negative band. The second order derivative is characterized by a negative band
with the minimum at the wavelength corresponding to λmax of the zero order bands.
Two positive satellite bands are also present on the either sides of the main band. The
1st and the 2
nd derivatives are very sensitive to the variation in slope of the absorption
spectrum, thus DS is suitable to analyze shoulders or the overlapping bands. Hence,

21
DS is quite handy for trace detections and quantitative determinations in analytical
chemistry.
Lambert –Beer Law 92
A = ε.c.d
1st derivative dA/dλ = c x d dε/dλ
2nd
derivative d2A/ d
2 λ = c x d d
2ε / d
2 λ
4th
derivative has a positive band. The even order spectra have a strong positive or
negative bands with the minimum or maximum at the same wavelength as λmax. The
number of bands obtained in the derivative spectrum is one more than the order of the
spectrum [93, 94].
1.3.1 Peak Measurement
Derivative Spectrophotometry (DS) technique has been used for the determination of
pesticides [95,96] and for simultaneous determination of metal ions [97-99]. The
various aspects of the DS technique have been discussed by several authors [100-
106]. Zero-crossing derivative spectra are used most frequently to simultaneously
analyze the binary mixtures showing overlapping spectra [107]. But the zero-crossing
method is not appropriate for the ternary mixtures of compounds showing overlapping
in spectra as the zero-crossing process mandates the selection of a critical wavelength.
This selection leads to lesser sensitivity and precision. For ternary mixtures, “ratio
spectra derivative” helps to avoid the above problems [108]. Salinas et al have also
provided solutions for similar problems [109]. DS can also be combined with
Fourier-Transform smoothing with ratio spectra derivative spectrophotometry for the
analysis of binary and ternary mixtures [110]. Several other advancements have been
made in the field of DS like applying flow-injection through sensor with diode-array
detector and first derivative spectra [111].
22
1.3.2 Features and Applications
Graphics
As the order of derivative increases, the number of bands also increases. The
increasing complexity can be useful for qualitative analysis involving characterization
and identification. The overlapped peaks of absorption spectra can separate out by
derivatization.
Resolution
It is observed that the derivative centroid bandwidth of even order derivatives
decreases with increasing order. In comparison with the zero-order spectrum, the
derivative centroid band-width for a Gaussian band decreases to 53%, 41% and 34%
of the original bandwidth in the 2nd
, 4th
and 6th
orders respectively. This feature can be
employed for resolution enhancement of two analytes with similar λmax values and
which are not resolved in the absorbance spectrum.
Background elimination
Baseline shift is a common unwanted effect in spectroscopy. It can be eliminated
through the 1st order derivative, thereby improving the efficiency of the
quantification. Some other background effects are directly proportional to higher
orders of the wavelength as:
A = ao + a1 λ1
….+ an λn
can be eliminated by using higher orders of derivative.
Discrimination
A very useful aspect of the DS is that it suppresses the broad bands more as compared
to the sharp ones and this feature increases with increasing derivative order. This
effect arises due to the fact that the amplitude, Dn
of a Gaussian band in the nth
derivative is inversely proportional to the original bandwidth, W, raised to the nth
degree:

23
Dn =1/W
n
Hence, for two coincident bands of equal intensity but different bandwidth in the zero
order, the nth
derivative amplitude of the sharper band, X, is greater than that of the
broader band, Y, by a factor dependent on the relative bandwidth and the derivative
order:
Dn
X/Dn
Y = Wn
Y/Wn
X
This property is used to improve the accuracy of quantification of a narrow band
component in the presence of a broad component and to reduce the error caused by
scattering. In general, the instrumental requirements for the derivative as well as
absorbance spectroscopy are the same but for DS the wavelength reproducibility and
signal to noise ratio are quite important as even small wavelength errors can cause
great large signal errors in derivative mode. The instrument should ideally have low
noise levels because of the negative impact of derivatization on the S/N ratio. The
spectrophotometer should preferably be able to scan and average multiple spectra
before derivatization. Controlling the degree of smoothing is also an important aspect
of derivatization which can be done with Savitzky-Golay method whereby the
smoothing is changed by varying the order of the polynomial and the number of data
points used. A new fractional DS technique is proposed by Mo et al [112].
1.4 Introduction to High Performance Liquid Chromatography
(HPLC)
Russian Botanist Tswett
is considered to be the inventor of chromatography. In 1903
he succeeded in separating leaf pigments using a solid polar stationary phase.
Chromatography is a separation technique where a mobile phase carrying the analytes
is moved in contact with adsorbent stationary phase. The compounds can be identified
by the different rate of flow and interaction with the mobile phase. High Performance

24
Liquid Chromatography (or high pressure liquid chromatography) has become the
analytical technique of choice for analysts for the past more than 25 years bring used
in about 75% of the laboratories [113]. HPLC is a type of column chromatography
used to separate, quantify and identify compounds based on their unique polarities
and interactions with the column’s stationary phase [114-119].
1.4.1 Principle
Chromatography is an analytical method based on the separation of components in a
mixture (the solute) due to the difference in migration rates of the components
through a stationary phase by a gaseous or liquid mobile phase. High performance
liquid chromatography, which is a highly improved version of column
chromatography, uses high pressures of up to 400 atmospheres to force the solvent
through the column, instead of a solvent being allowed to drip through under gravity,
thus greatly increasing the speed. This allows the use of very minute particles for the
column packing material and hence increasing the surface area for interactions
between the stationary phase and the molecules flowing past it. All these factors
contribute to better separation of the components of the analyzed mixture. The small
volume of the sample to be analyzed is introduced into the stream of mobile phase.
The analyte undergoes specific physical and chemical interactions with the stationary
phase and elutes at a particular time called its retention time which is considered to be
its unique identification feature. Most common solvents used as mobile phase are
acetonitrile and methanol along with water, to which buffers may be added to increase
the separation of analytes. Gradient elution can also be used to further resolve the
multi component samples. In gradient elution, the composition of the mobile phase is
changed over the course of analysis. The other major improvement over column
chromatography concerns the detection methods which can be used.

25
These methods are highly automated and extremely sensitive. A host of developments
in the field of HPLC instrumentation are responsible for the popularization of this
technique. Apart from the commonly used UV detectors, several new and improved
options like photodiode array, electron light scattering, scanning fluorescence,
electrochemical, conductivity and mass spectrometer detectors. Better and more user-
friendly system control programs are also available, making HPLC the obvious choice
of analytical chemists around the world.
1.4.2 Pumps
Apart from this, the pump systems with better reproducibility and reliability, and the
possibility of using wide range of solvents, use of gradient systems with multistep and
non-linear profile abilities have made the analysis with HPLC a better option. Most of
the analytical pumps are designed in a way to operate efficiently between 0.1 to
10ml/min [120].The latest auto sampler systems can deliver precise amounts of
samples of the required concentrations at hot or cold temperatures and can even rinse
or clean the needles. This combined with the availability of wide range of solvents
and columns have been instrumental in increasing the popularity of this technique.
The U.S. Food and Drug Administration (FDA) have adopted and recommended
HPLC for the analysis of thermally labile, nonvolatile, highly polar compounds as
HPLC carries out the separations and detection at ambient temperatures [121].
1.4.3 Columns
The columns used in HPLC can be open, tubular or packed ones. Packed bed columns
are being used frequently. The size of packing particles in such columns could be 3 to
10 μm (diameter) or 20-50 μm (diameter). These particles are generally made of
incompressible substances like silica, alumina, C or polymers [122,123]. Apart from
26
this latest packings used are cellulose and cyclodextrins [124]. Silica is the most
commonly used material for chromatographic support of bonded phases. Bonded
phases are generally made up of alkyl silanes. The packing particles can be permeable
or impermeable to the flow of the solvent. Several commercially available columns
have polystyrene-divinyl benzene as chromatographic phase in homogeneous form
and it’s useful for RP and gel permeation chromatography. Alkyl silane, phenyl and
cyano columns have bonded phases are useful for RP chromatography, whereas,
amino column is a normal phase or ion-exchange column. Poly (methylmethacrylate)
is a homogeneous phase column employed in gel permeation chromatography.
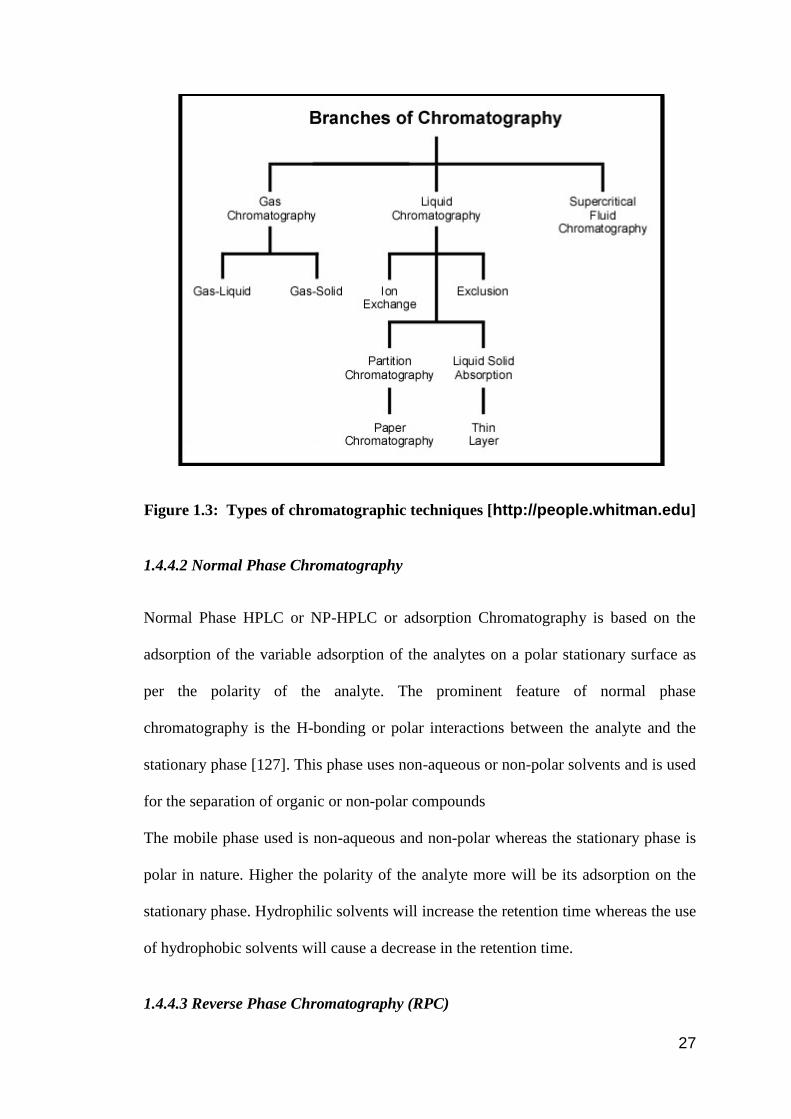
1.4.4 Types of HPLC [125,126]
1.4.4.1 Partition Chromatography
Partition chromatography uses a retained solvent on the surface of or within the grains
of an inert solid matrix. The equilibration or partition of the molecules between a
liquid stationary phase and the eluent is called Hydrophilic Interaction Liquid
Chromatography (HILIC) in HPLC and it separates analytes based on polarity
differences. HILIC is advantageous as it can separate acidic, basic and neutral solutes
in a single chromatogram.
27
Figure 1.3: Types of chromatographic techniques [http://people.whitman.edu]
1.4.4.2 Normal Phase Chromatography
Normal Phase HPLC or NP-HPLC or adsorption Chromatography is based on the
adsorption of the variable adsorption of the analytes on a polar stationary surface as
per the polarity of the analyte. The prominent feature of normal phase
chromatography is the H-bonding or polar interactions between the analyte and the
stationary phase [127]. This phase uses non-aqueous or non-polar solvents and is used
for the separation of organic or non-polar compounds
The mobile phase used is non-aqueous and non-polar whereas the stationary phase is
polar in nature. Higher the polarity of the analyte more will be its adsorption on the
stationary phase. Hydrophilic solvents will increase the retention time whereas the use
of hydrophobic solvents will cause a decrease in the retention time.
1.4.4.3 Reverse Phase Chromatography (RPC)
28
RPLC or reversed phase liquid chromatography is the most widely used form of
HPLC. A solute adsorbed on the reversed phase column undergoes hydrophobic
interactions. Its working is just opposite to that of the normal phase chromatography.
In reverse phase HPLC a non polar stationary phase and an aqueous moderately polar
mobile phase is used. The stationary phase is Silica treated with RMe2SiCl, where R
has 18 or 8 Carbon chain. In these stationary phases polar molecules elute faster RPC
operates on the principle of hydrophobic forces due to the high symmetry in the di-
polar water structure.
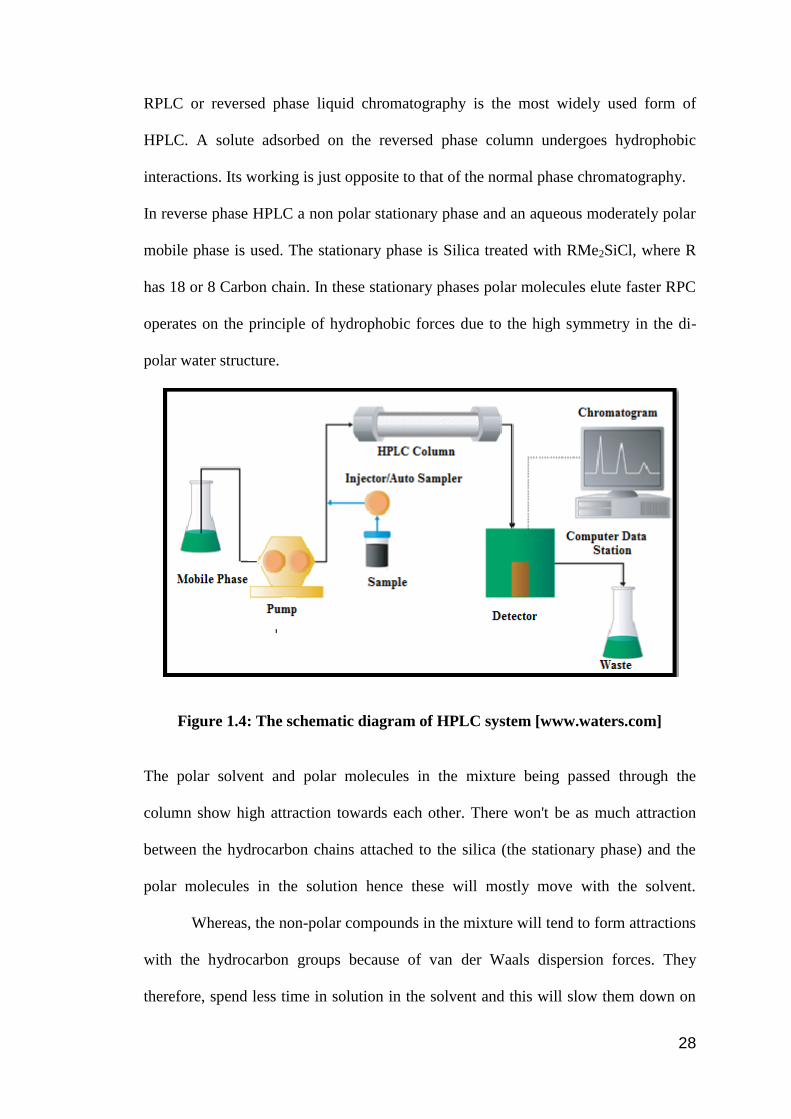
Figure 1.4: The schematic diagram of HPLC system [www.waters.com]
The polar solvent and polar molecules in the mixture being passed through the
column show high attraction towards each other. There won't be as much attraction
between the hydrocarbon chains attached to the silica (the stationary phase) and the
polar molecules in the solution hence these will mostly move with the solvent.
Whereas, the non-polar compounds in the mixture will tend to form attractions
with the hydrocarbon groups because of van der Waals dispersion forces. They
therefore, spend less time in solution in the solvent and this will slow them down on

29
their way through the column. Analyte adsorbs and desorbs on the stationary phase
hence its rate of movement through the column is lesser than that of the solvent. The
solvent system used has water (polarity, p’=10.2) and miscible organic solvents like
methanol (p’=5.1) or acetonitrile (p’=5.8) or tetrahydrofuran (p’=4.0). The
proportions of water to non-polar solvent are optimized such that the capacity factor
of the last eluted analyte gets a value of nearly 2 [128]. Capacity factor, k’= (tr – to)/t’0.
1.4.4.4 Size-Exclusion Chromatography or Gel Permeation Chromatography
The property of gel permeation chromatography is the separation of particles on the
basis of size. Since it is a low resolution chromatography hence is mainly used for the
final step of resolution. It can also be employed to determine the tertiary structure of
purified proteins and large molecules like polymers. In this type of chromatography,
the stationary phase consists of pores of particular size. Analyte particles which are
bigger in size than the pores are removed from these cavities and hence are able to
pass through the column at a faster rate than the smaller analyte particles [129].
1.4.4.5 Ion-exchange Chromatography
In this kind of chromatography, the basis of retention of analyte is the attraction
between the solute ions and the charged sites attached to the stationary phase. The
different types of ion exchangers used are:
Polystyrene resins, Gels (Cellulose and dextran ion exchangers), Porous silica or
Controlled-pore glass.

30
UV Visible
detector
Pump
HPLC-UV System at Punjabi University, Patiala
Solvent containers
Figure1.5: The HPLC-UV System (Dionex, Germany) at Chemistry Department, Punjabi University, Patiala
31
1.5 Pesticides Selected for Present Study
Five phenylurea herbicides (linuron, diuron, monuron, metoxuron and metazachlor),
four dithiocarbamtae pesticides (zineb, maneb, ziram and propineb), one
organophosphorous compound (dimethoate), two triazines (propazine and terbutryn),
one carbamate (aldicarb) and a nature derived pesticide i.e., biopesticide
(azadirachtin) were selected for this study.

32
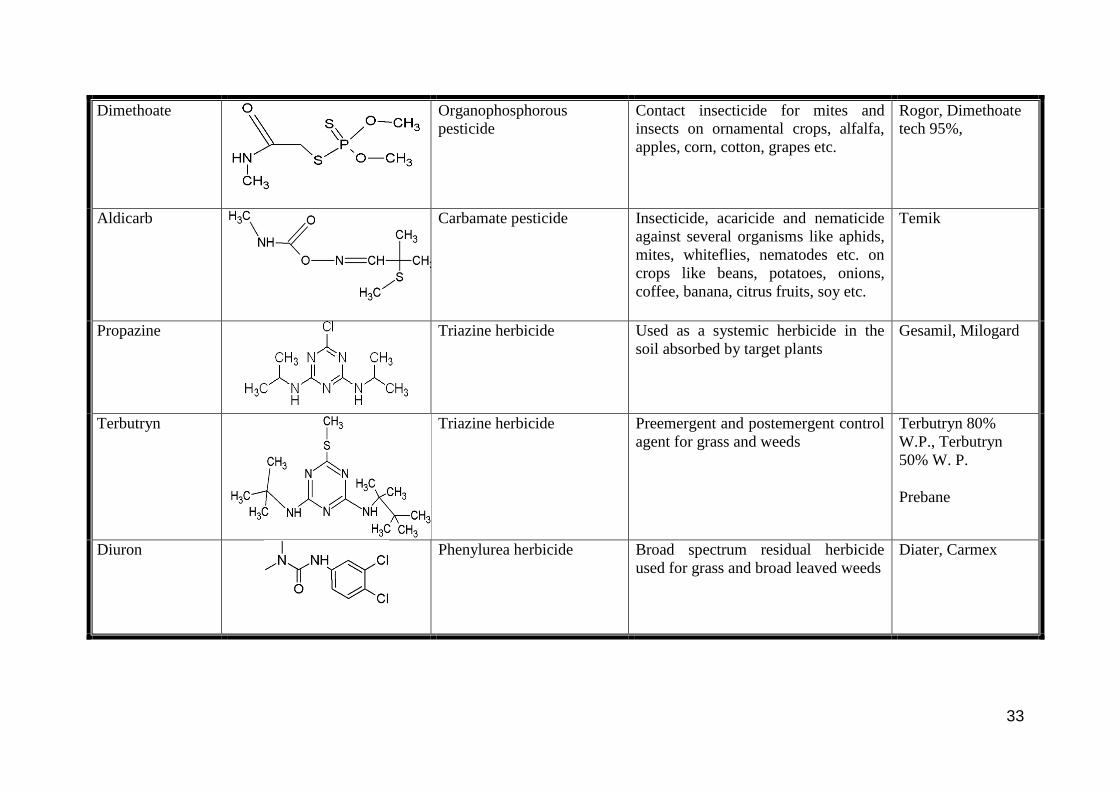
Table 1.2: Characteristics of various Pesticides studied during this work
Common name Structure Class Use Commercial name
Zineb
Dithiocarbamate fungicide Used against potato and tomato blight,
downy mildew, rust etc.
Dithane Z 78,
Amitan
Maneb
Dithiocarbamate fungicide Used to control the early and late
blights of potatoes and tomatoes and
various diseases of fruits, vegetables,
field crops, and ornamentals
Dithane M-45,
Dithane M-22
Propineb
Dithiocarbamate fungicide Protectant fungicide, used against
potato and tomato blight, downy
mildew, apple scab, blue mould of
tobacco etc.
Antracol, Propineb
70% W. P.
Ziram
Dithiocarbamate fungicide Fungicide on stone fruits, pome fruits,
nut crops, commercially grown
ornamentals for several diseases like
scab, leaf curl, early blight, leaf hole,
brown spot etc.
Ziram 85G
33
Dimethoate
Organophosphorous
pesticide
Contact insecticide for mites and
insects on ornamental crops, alfalfa,
apples, corn, cotton, grapes etc.
Rogor, Dimethoate
tech 95%,
Aldicarb
Carbamate pesticide Insecticide, acaricide and nematicide
against several organisms like aphids,
mites, whiteflies, nematodes etc. on
crops like beans, potatoes, onions,
coffee, banana, citrus fruits, soy etc.
Temik
Propazine
Triazine herbicide Used as a systemic herbicide in the
soil absorbed by target plants
Gesamil, Milogard
Terbutryn
Triazine herbicide Preemergent and postemergent control
agent for grass and weeds
Terbutryn 80%
W.P., Terbutryn
50% W. P.
Prebane
Diuron
Phenylurea herbicide Broad spectrum residual herbicide
used for grass and broad leaved weeds
Diater, Carmex

34
Linuron
Phenylurea herbicide Used to check growth of annual and
perennial weeds at crop and non-crop
sites.
Afalon, DuPont 326
Metazachlor
Phenylurea herbicide Used to control pre-emergence and
early post-emergence grasses and
broad-leaved weeds in broccoli,
asparagus, cabbage, cauliflower, garlic
etc.
Clayton Metazachlor
50 SC
Monuron
Phenylurea herbicide Used for the control of weeds and
grasses in non-croppable areas
Monuron (Telvar)
Metoxuron
Phenylurea herbicide It is a contact herbicide used to kill
broadleaf weeds in carrot, wheat,
barley
Dosaflo
Azadirachtin
Neem derived natural
pesticide
Tetranortriterpenoid
Effective for control of over 200
species of insects
Neem Extract
35
1.6 Objectives and Scope of Present Study
The main objectives of this study are:
a) To development of accurate, efficient and selective methods for the
simultaneous determination of pesticides in various food stuffs and
environmental matrices via liquid chromatographic and spectrophotometric
techniques.
b) To apply and validate the developed methods on the analysis of pesticide
residues in food stuffs and different environmental matrices.
c) To determine various active ingredients in commercial pesticide formulations.

36
References
1. Revolutionary thought, The Tribune, 23rd October, 2011.
2. Chapter two, Pesticide Laws and definitions, FIFRA Inspection Manual,
February 2002, p 12.
3. S. Ignacimuthu, Curr. Sci. 8 (2004) 86.
4. A. A. Tijani, K. O. Osotimehin, Res. J. Agric. Biol. Sci.3 (2007) 129.
5. Mike Shanahan, Pesticides, agro-chemicals Report, Vol. III, Jan- March
(2003) 23.
6. WHO Technical Report series no. 679 (1982).
7. Joint Committee on Pesticide Residues in safety standards for soft drinks, fruit
juice and other beverages, 13th
Lok Sabha, (2004) January.
8. P.A. Sanchez and M. S. Swaminathan, Science 307 (2005) 357.
9. A. Singh and O.P. Sharma, Integrated Pest Management for Sustainable
Agriculture, from Integrated Pest Management in Indian Agriculture,
Proceedings 11, Eds. P. S. Birthal and O.P. Sharma, NCAP, New Delhi.
10. N. P. Agnihotri, Pestic. Res. J. 12 (2000) 150.
11. L. Gianessi and S. Sankula at www. Ncfap.org.
12. P. K. Shetty, Econ. Polit. Weekly 39 (2004) 5261.
13. N. S. Tiwana, N. Jerath, G. Singh and R. Singh, Asian J. Water Environ.
Pollut. 6 (2009) 89.
14. Employment Information: Indian Labour Statistics 1994. Chandigarh: Labour
Bureau, Ministry of Labour, 1996.
15. M. Yudelman, A. Ratta and D. F. Nygaard “Pest Management and food
Production: Looking into the Future” (1998) International development.
16. Basic Guide to Pesticides: Their characterization and Hazards, Rachel Carson

37
Counsel Inc., (1992) CRC Press, Taylor and Francis group, p 9.
17. Government of India. Tenth five-year plan: 2002-2007. Planning Commission
of India, New Delhi, (2001) 513 http://planningcommission.nic.in/
plans/planrel/fiveyr/welcome.html.
18. S. A. Greene and R. P. Pohanish (Eds.), Sitting’s Handbook of Pesticides and
Agricultural Chemicals. (2005) SciTech Publishing, Inc. ISBN 0-8155-1516-
2.
19. C. Tomlin (Ed.), The Pesticide Manual, 14th edition, (2006), British Crop
Protection Council.
20. M. J. Levine, Pesticides: A Toxic Time Bomb in our Midst, (2007) Praeger
Publishers.
21. G. W. Ware and D. M. Whitcare, The Pesticide Book, 6th
edition, (2004)
Meister Pro Publishing Co. Ohio.
22. R. Weinzeirl, T. Henn, P. G. Koehler and C. L. Tucker, Microbial insecticides,
University of Florida, IFAS Extension, (2005) June, 1.
23. P. Ferron, Ann Rev. Entomol. 23 (1978) 409.
24. J. R. Fuxa, Ann. Rev. Entomol. 32 (1987) 225.
25. J. D. Harper, Crop Protection 6 (1987) 117.
26. L. A. Lacey and A. H. Undeeen, Ann. Rev. Entomol. 31 (1986) 265.
27. E. Kurstak (Ed.), Microbial and Viral Pesticides, (1982) Marcel Dekker, New
York, 724.
28. C. W. McCoy (Ed.), Microbial Agents for use in Integrated Pest Management
Systems. Southern Cooperative Series Bulletin 318. Southern Regional Project
S-315: Entomopathogens for use in Pest Management Systems (1987)
Arkansas Agricultural Experiment Station, Fayetteville, 32.
29. J. L. Woodring and H. K. Kaya, Steinernmematid and Heterohabditid

38
Nematodes: A Handbook of Techniques. Southern Cooperative Series Bulletin
331. Southern Regional Project S-315: Entomopathogens for use in Pest-
Management Systems (1988) Arkansas Agricultural Experiment Station,
Fayetteville, 30.
30. S. A. Sankari and P. Narayanasamy, Curr. Sci. 92 (2007) 811.
31. M. D. Donaldson, IPM Conference, (2003) Indianapolis, USA.
32. R. Bates, Pestic. Outlook 13 (2002) 142.
33. International workshop on Technology of Application of Pesticides, Kandy
(Sri Lanka) (2003) June, 23-26.
34. A. R. Waters, Outreach Coordinator, Pesticide Control Programme.
35. Annual Report 2005-06 of Ministry of Chemicals and fertilizers, Department
of Chemicals and Petrochemicals.
36. T. S. S. Dikshith (Ed.), Toxicology of Pesticides in the Animals, (1991) CRC
Press, Boca Raton, Florida, p 4.
37. R. Carlson, Silent Spring, (1962) Houghton-Mifflin Co. Boston.
38. R. A. Liroff, Pestic. Safety News 4 (2000) 3.
39. T. M. Crisp, E. D. Clegg, R. L. Cooper, W. P. Wood, D. G. Anderson, K. P.
Baeteke, J. L. Hoffmann, M. S. Morrow, D. J. Rodier, J. E. Schaeffer, L. W.
Touart, M. G. Zeeman and Y. M. Patel, Environ. Health Perspect. 106 suppl
(1998) 11.
40. P. M. Hurley, R. N. Hill and R. J. Whiting, Environ. Health Perspect. 106
(1998) 437.
41. A. Brouwer, M. P. Longnecker, L. S. Birnbaum, J. Cogliano, P. Kostyniak, J.
Moore, S. Schantz, and G. Winneke, Environ. Health Perspect. 107 (1999)
639.
42. P. K. Gupta, Toxicol. 198 (2004) 1.

39
43. P.C. Abhilash and N. Singh, J. Haz. Mat. 165 (2009) 1.
44. R. K. Kole, H. Banerjee and A. Bhattacharyya, Pest. Res. J. 14 (2002) 77.
45. D. E. Glotfelty and C. J. Schomburg, “Volatilization of pesticides from soil”
in Reactions and Movements of organic chemicals in soil. Eds. B. L. Sawhney
and K. Brown. W. I. Madison, (1989) Soil Science Society of America Special
Pub, 181.
46. M. Majewski and P. Capel, Pesticides in the atmosphere: distribution, trends,
and governing factors. Volume one, Pesticides in the Hydrologic System.
(1995) Ann Arbor Press Inc.
47. U.S. Geological Survey. (1999). The quality of our nation’s waters – nutrients
and pesticides. Circular 1225. Reston VA: SGS, http:// water. usgs.gov /pubs
circ/circ1225/.
48. T. T. Iyaniwura, Rev. Environ. Health 9 (1991) 161.
49. M. W. Aktar and M. Paramasivam, Impact of Pesticide Use in Indian
Agriculture-Their Benefits and Hazards, http://www. shamskm.com/ env/
impact-of-pesticide-use-in-Indian-agriculture.html.
50. G. Bortleson and D. Davis. (1987-1995). U.S. Geological Survey &
Washington State Department of Ecology. Pesticides in selected small streams
in the Puget Sound Basin, p 1.
51. R. K. Kole and M. M. Bagchi, J. Inland Fish. Soc. India. 27 (1995) 79.
52. US EPA. (2001). Managing small-scale application of pesticides to prevent
contamination of drinking water. Water protection practices bulletin,
Washington, DC: Office of Water (July). EPA 816-F-01-031.
53. J. Johnson and W. G. Ware, Pesticide litigation manual 1992 Edition. C. B.
Callaghan Environmental Law Series, New York, NY. 65. US EPA (1999)
Spray drift of pesticides. Washington, DC: Office of Pesticide Programs

40
(December).http:// www.epa.gov/pesticides/citizens/spraydrift.htm#1.
54. US EPA. (1999). Spray drift of pesticides. Washington, DC: Office of
Pesticide Programs (December). http://www.epa.gov/ pesticides/ citizens/spray
drift.htm#1.
55. K. Jalees and R. Vemuri, Int. J. Environ. Studies 15 (1980) 49.
56. B. Dinham, The pesticide hazard: a global health and environmental audit.
57. L. Horrigan, R. S. Lawerence and P. Walker, Environ. Health Perspect. 110
(2002) 445.
58. The Energy and Resources Institute, India. Online at:
http://www.teri.res.in/teriin/news/terivsn/issue31/pesticid.htm.
59. World Agriculture; Towards 2010; A FAO Study, by Nikolas Alexandratos,
(1995) Food and Agriculture Organisation of the United Nations.
60. “Pawar doesn’t know of Punjab’s Cancer Belt!”The Tribune, 13th
May, 2010.
61. R. Murali, A. Bhalla, D. Singh and S. Singh, Clin. Toxicol. 47 (2009) 35.
62. A. C. Grace, V. R, Muraleedharan, T. Swaminathan and D. Veeraraghavan,
wwwecondse.org/hn/pesticides.pdf,1.
63. E. Silva, S. Batista, P. Viana, P. Antunes, L. Serdio, A. T. Cardoso and M. J.
Cerejeira, Int. J. Environ. Anal. Chem. 86 (2006) 955.
64. P. J. Landrigan, L. Claudio, S. B. Markowitz, G. S. Berkowitz, B. L. Brenner,
H. Romero, J. G. Wetmur, T. D. Matte, A. C. Gore, J. H. Godbold and M. S.
Wolff, Environ. Health Perspect. 107 Suppl (1997) 431.
65. Endosulfan Conspiracy, Down to Earth, 15th
July, 2002.
66. C. H. S. Rao, V. Venkateswarlu, T. Surender, M. Eddleston and N. A.
Buckley, Trop. Med. Int. Health.10 (2005) 581.
67. D. Gunnell, M. Eddleston, M. R. Phillips and F. Konradsen, BMC Public
Health 7 (2007) 357.

41
68. F. Mohamed, G. Manuweera, D. Gunnell, S. Azher, M. Eddleston, A. Dawson
and F. Konradsen, BMC Public Health 9 (2009) 405.
69. S. K. Nigam, A. B. Karnik, P. Chattopadhyay, B. C. Lakkad, K. Venkaiah and
S. K. Kashyap, Int. Arch. Occup. Environ. Health 65 suppl (1993) S193.
70. H. N. Saiyed, H. G. Sadhu, V. K. Bhatnagar, A. Dewan, K. Venkaiah and S.
K. Kashyap, Hum. Exp. Toxicol. 11 (1992) 93.
71. D. S. Rupa, P. P. Reddy and O. S. Reddy, Environ. Res. 55 (1994) 123.
72. S. K. Gupta, J. R. Parikh, M. P. Shah, S. K. Chatterjee and S. K. Kashyap,
Arch. Environ. Health 37 (1982) 41.
73. M. E. Loevinsohn, Environ. Manag. 17 (1993) 706.
74. L. M. L. Nollet and H.S. Rathore (Eds.), Handbook of Pesticides: Methods of
Pesticide Residue Analysis, (2009) CRC Press, Boca Raton, Florida.
75. M. Abdel-Rehim, LCGC Asia Pacific 12 (2009).
76. S. Matysik and F. M. Matysik, Microchim. Acta 166 (2009) 109.
77. Z. Altun and M. Abdel-Rehim, Anal. Chim. Acta 630 (2008) 116.
78. E. M. Thurman and M. S. Mills, Solid-phase Extraction-Principle and Practice
(1998) John Wiley & sons, INC.
79. M. Henry in N. J. K. Simpson, Ed. Solid Phase Extraction, principles,
techniques and applications, (2000) Marcel Dekker, New York, 125.
80. J. R. Dean, Extraction methods for environmental analysis, (1998) Wiley,
Chichester, p 225.
81. A. Żwir-Ferenc and M. Biziuk, Polish J. of Environ. Stud. 15 (2006) 677.
82. C. M. Kin, PhD. Thesis (2008) University of Malaya, Kualalumpur.
83. P. D McDonald, A sample preparation primer and guide to solid phase
extraction methods development, http://www.waters.com/webassets
42
/cms/library/docs/wa20300.pdf.
84. G. Rendina, Experimental Methods in Modern Biochemistry, (1976) W. B.
Saunders Company: Philadelphia, p 46.
85. J. R. Morrey, Anal. Chem. 40 (1968) 905.
86. G. Talsky, L. Mayring and H. Kreuzer, Angew. Chem. 17 (1978) 785.
87. T. C. O. Haver, Anal. Chem. 51 (1979) 91A.
88. J. E. Cahill, Am. Lab. 11 (1979) 79.
89. P. Levillain and D. Fompeydie, Analusis 14 (1986) 1.
90. R. Traveset, V. Such, R. Gonzalo and E. Gelpi, J. Pharm. Sci. 69 (1980) 629.
91. C. B. Ojeda and F. S. Rojas, Anal. Chim. Acta 518 (2004) 1.
92. A. Liebmann, A. Jungnickel and R. Rurainski, Use of Derivative
Spectroscopy, Analytical Solutions, Analytik Jena AG, 1.
93. G. Talsky, Derivative Spectrophotometry, first ed. (1994) VCH, Weinheim.
94. A. Savitzky and M. J. E. Golay, Anal. Chem. 36 (1964) 1627.
95. M. Kaur, V. Kaur, A. K. Malik, N. Verma, B. Singh and A. L. J. Rao, J. Braz.
Chem. Soc. 20 (2009) 993.
96. V. Kumar Sharma, J. S. Aulakh, S. Bansal, A. K. Malik and R. Mahajan,
Intern. J. Environ. Anal. Chem. 84 (2004) 1105.
97. A. Abbaspour and L. Baramakeh, Anal. Sci. 18 (2002) 1127.
98. N. K. Agnihotri, S. Ratnani, V. K. Singh and H. B. Singh, Anal. Sci. 20 (2004)
955.
99. A. Afkhami and A.R. Zarei, Anal. Sci. 19 (2003) 917.
100. J. N. Miller, T. A. Ahmad and A. F. Fell, Anal. Proc. 19 (1982) 37.
101. T. R. Griffiths, K. King, H. V. St. A. Hubbard, M. J. Schwing-Weill, J.
Meullemeestre, Anal. Chim. Acta 143 (1982) 163.
102. F. Delaye, M. D. Gaye and J. J. Aaron, Anal. Chim. Acta 223 (1) 395.

43
103. I. Y. Bershtein, M.M. Mogilinitskii and E. V. Komarov, Anal. Chim. Acta 222
(1989) 335.
104. G. Talsky, Fresenius J. Anal. Chem. 333 (1989) 702.
105. I. Dol, M. Knochen and C. Altesor, Analyst (London) 116 (1991) 69.
106. M. Knochen and I. Dol, Analyst (London) 117 (1992) 1385.
107. A. A. Y. El-Sayed and N. A. El-Salem, Anal. Sci. 21 (2005) 595.
108. J. J. B. Nevado, J. R. Flores and M. L. M. Pardo, Fresenius J. Anal. Chem. 349
(1994) 756.
109. F. Salinas, J. J. Berzas and A. Espinosa, Talanta 37 (1990) 347.
110. Z. Lin, L. J. Lui and G. Chen, Fresenius J. Anal. Chem. 370 (1990) 997.
111. E. Vereda, A. Rios and M. Valcarcel, Analyst 122 (1997) 85.
112. D. Mo, X. F. He , Y. Y. Lin, Z. X. Yu , X. Zhang and G. Z. Zhou, Proc. Asia-
Pacific, Phys. Conf. 2 (1994) 2828.
113. P. C. Sadek, Troubleshooting HPLC Systems: A Bench Manual (1999) John
Wiley and Sons.
114. R. D. Shah and C. A. Maryanoff (Ed. J. K. Swadesh), Chapter Four, HPLC:
Practical and industrial applications, 2nd
Edition (1999) CRC Press, New
York.
116. R. G. Beri, L. S. Hacche and C. F. Martin (Ed. J. K. Swadesh), Chapter Six,
HPLC: Practical and industrial applications, 2nd
edition (1999) CRC Press,
New York.
117. L. R. Snyder, J. J. Kirkland and J. L. Glajch, Chapter Five, Practical HPLC
Method Development , 2nd
edition (1997) John Wiley & Sons, New York.
118. P. R. Brown and R. A. Hartwick (Eds.), High performance Liquid
Chromatography, (1989) John Wiley & Sons, New York.
119. B. A. Bidlingmeyer, in Practical HPLC Methodology and Applications, (1992)

44
John Wiley & Sons, New York.
120. V. R. Meyer, Practical High-Performance Liquid chromatography, 2nd
Edition
(1994) John Wiley & Sons.
121. L. R. Snyder and J. J. Kirkland, Introduction to Modern Liquid
Chromatography, (1979) John Wiley & Sons.
122. J. R. Larson, J. E. Tingstad and J. K. Swadesh, Chapter I: Introduction, Ed. J.
K. Swadesh HPLC Practical and Industrial Applications, 2nd
Edition (1999)
CRC Press, New York.
123. A. Gratzfeld-Hüsgen and R. Schuster, HPLC for Food Analysis: A primer,
Agilent Technologies.
124. S. Levin, Introduction to High performance Liquid Chromatographic modes,
Medtechnica, at Homepage:http://www.forumsci.co.il/HPLC.
125. R. E. Majors, J. Chromatogr. Sci. 18 (1980) 488.
126. R. E. Majors, New Chromatography Columns and Accessories at the 1992
Pittsburgh Conference, Part I, LC-GC 10 (1992) 188.
127. R. Ehwald, G. Fuhr, M. Olbrich, H. Göring, R. Knösche, R. Kleine,
Chromatographia 28 (1989) 561.
128. B. L. Karger, L. R. Snyder and Cs. Horvath, An Introduction to Separation
Science, (1973) John Wiley & Sons, New York.
129. J. H. Knox, High Performance Liquid Chromatography, (1978) Edinburgh
University Press, Edinburgh.