Embed Size (px)
Citation preview
1 1
CHAPTER FIFTEEN
DIVIDEND DISCOUNT MODELS
2 2
CAPITALIZATION OF INCOME METHOD
• THE INTRINSIC VALUE OF A STOCK– represented by present value of the income
stream
3 3
CAPITALIZATION OF INCOME METHOD
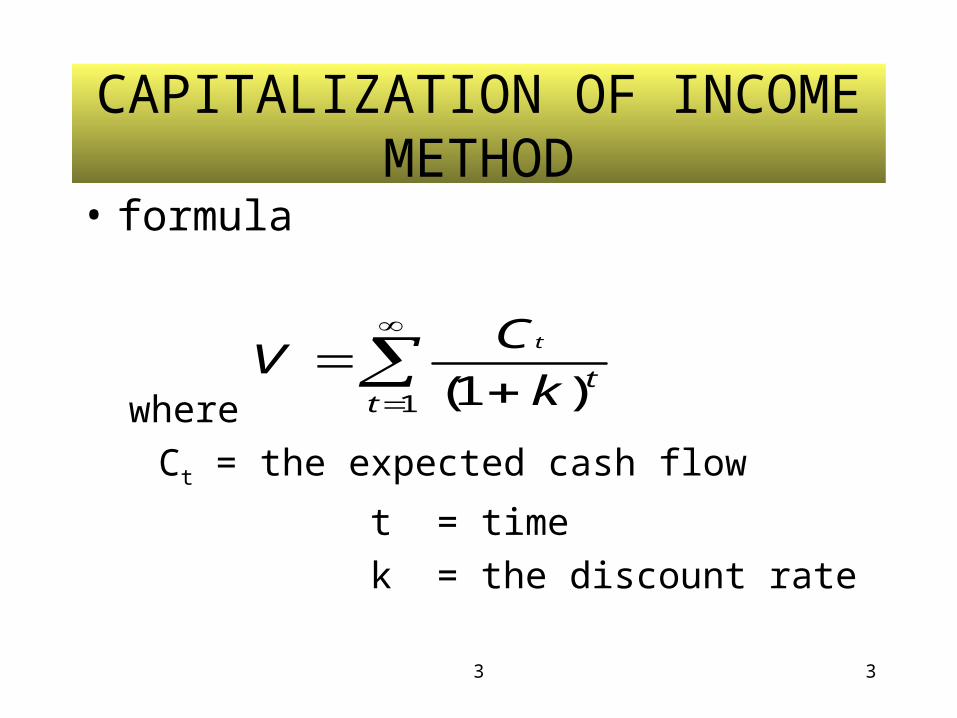
• formula
where
Ct = the expected cash flow
t = time
k = the discount rate
1 )1(ttk
CV
t
7 4
CAPITALIZATION OF INCOME METHOD
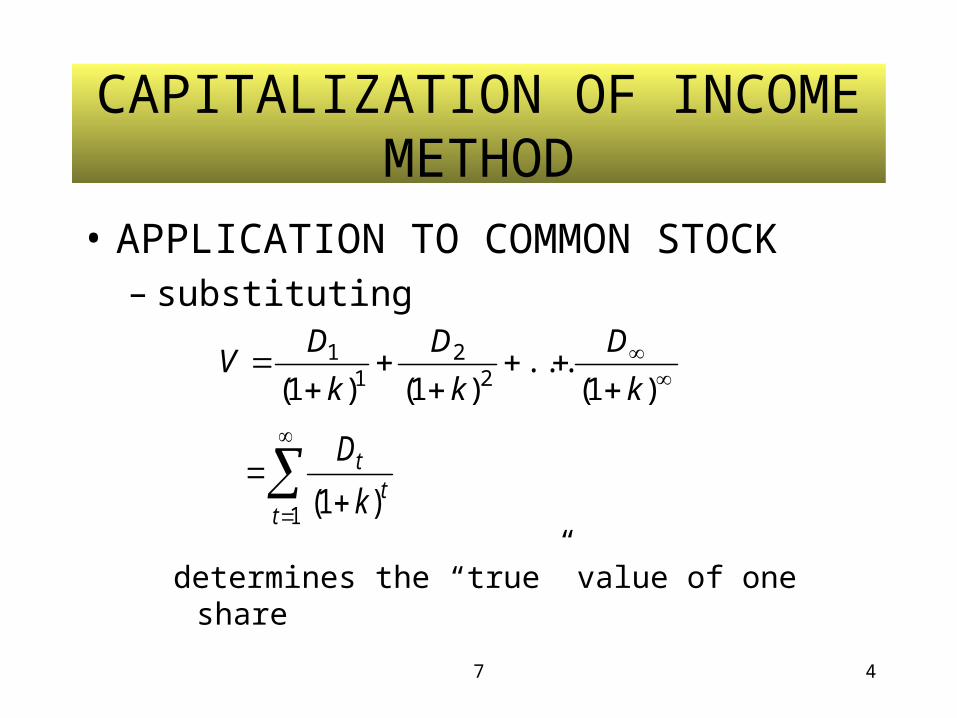
• APPLICATION TO COMMON STOCK– substituting
determines the “true” value of one share
)1(...
)1()1( 22
11
k
D
k
D
k
DV
1 )1(tt
t
k
D
8 5
CAPITALIZATION OF INCOME METHOD
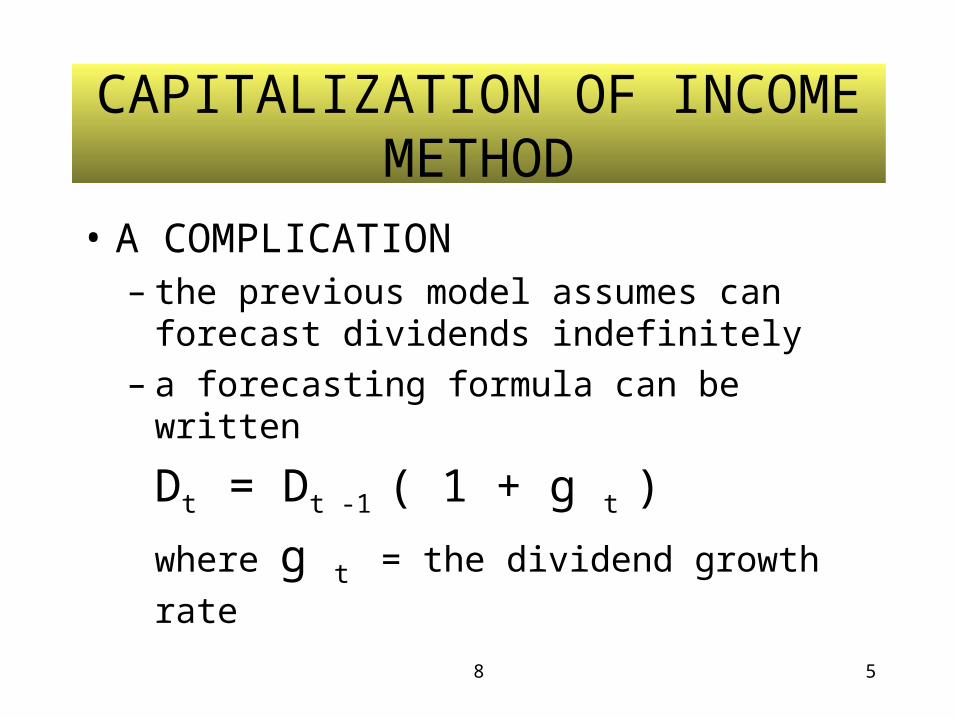
• A COMPLICATION– the previous model assumes can forecast
dividends indefinitely– a forecasting formula can be written
Dt = Dt -1 ( 1 + g t )
where g t = the dividend growth rate
9 6
THE ZERO GROWTH MODEL
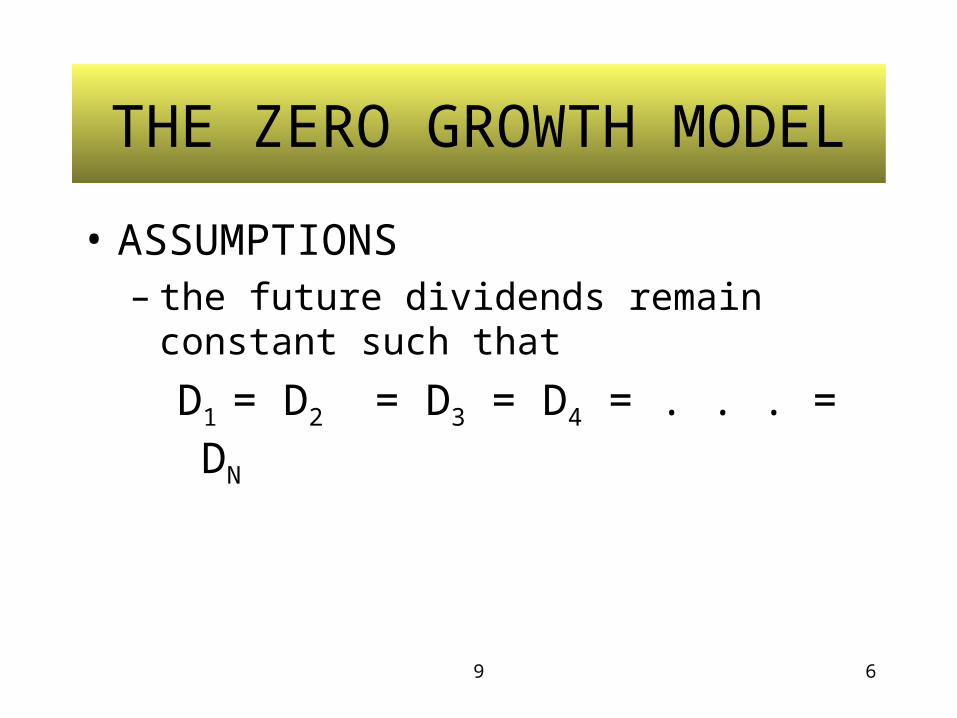
• ASSUMPTIONS– the future dividends remain constant such that
D1 = D2 = D3 = D4 = . . . = DN
12 7
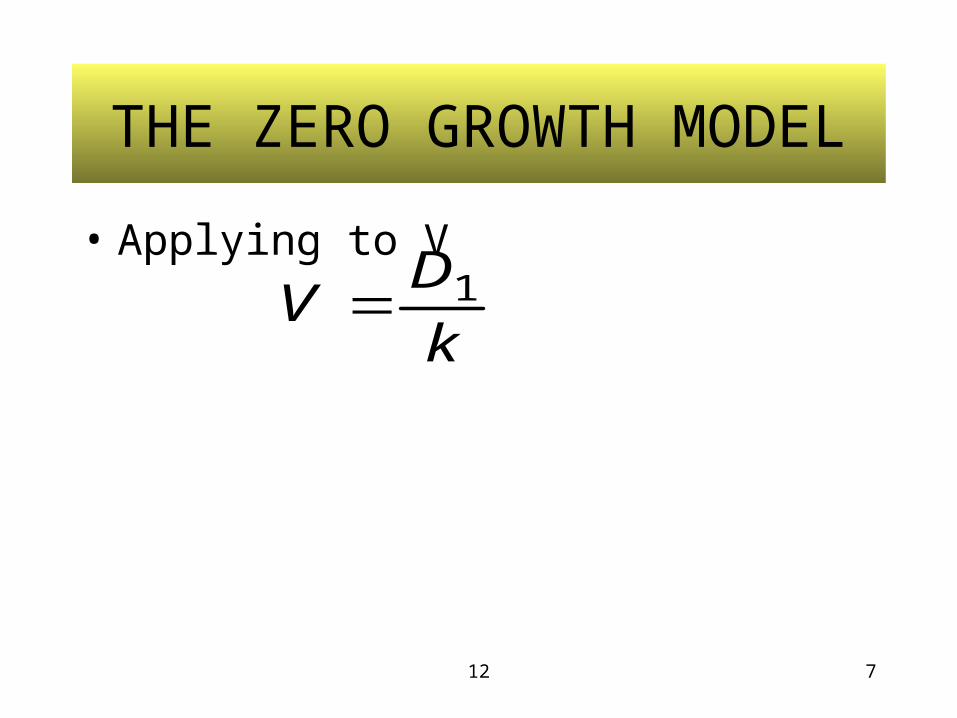
THE ZERO GROWTH MODEL
• Applying to V
k
DV 1
13 8
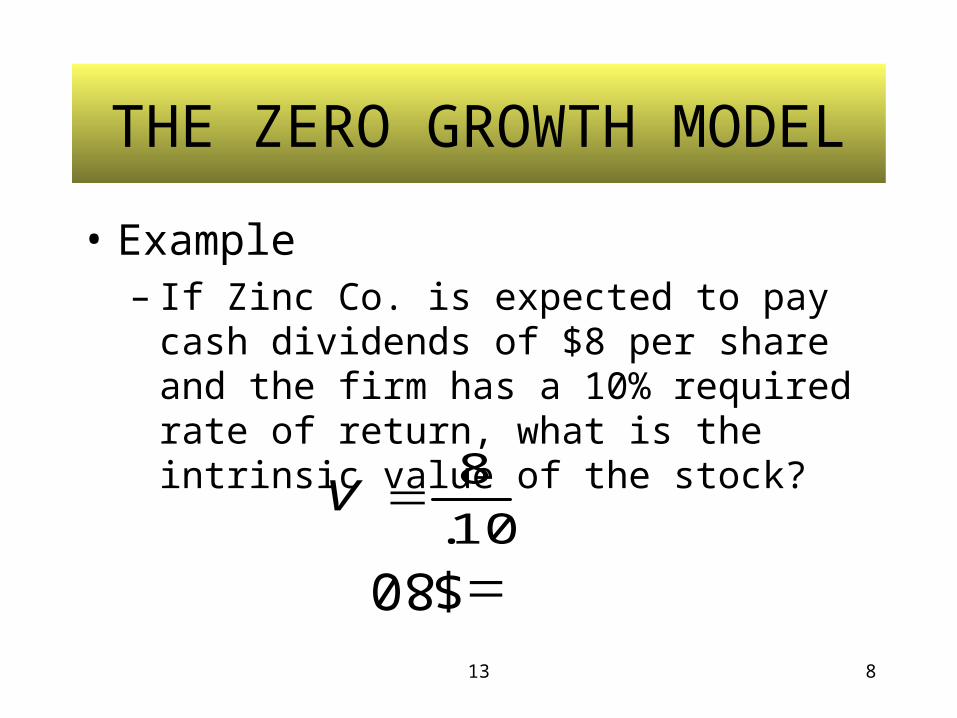
THE ZERO GROWTH MODEL
• Example– If Zinc Co. is expected to pay cash dividends of
$8 per share and the firm has a 10% required rate of return, what is the intrinsic value of the stock?
10.
8V
80 $
14 9
THE ZERO GROWTH MODEL
• Example(continued)If the current market price is $65, the stock is
underpriced.
Recommendation:
BUY
* 10
THE CONSTANT-GROWTH MODEL
• ASSUMPTIONS:
• growth rate in dividends is constant
• earnings per share is constant
• payout ratio is constant
16 11
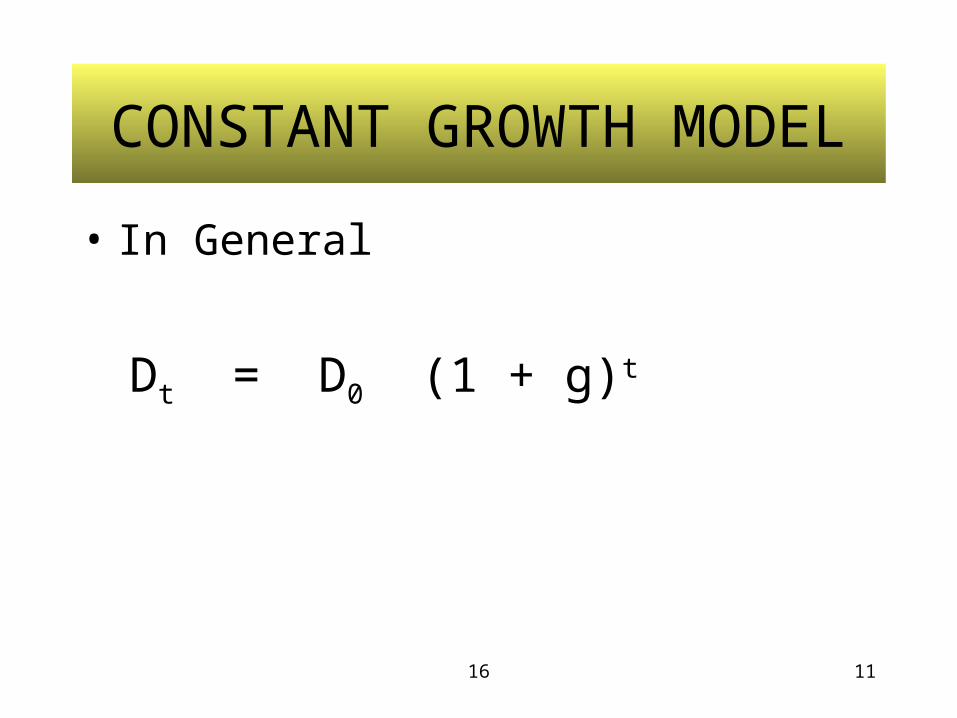
CONSTANT GROWTH MODEL
• In General
Dt = D0 (1 + g)t
18 12
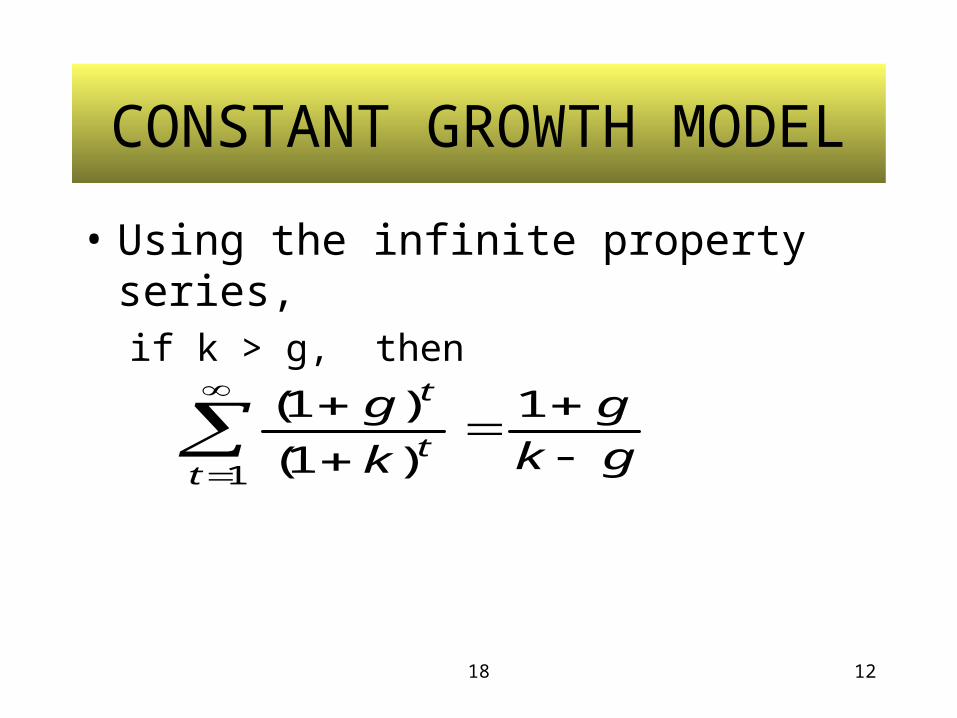
CONSTANT GROWTH MODEL
• Using the infinite property series,if k > g, then
gk
g
k
g
tt
t
1
)1(
)1(
1
20 13
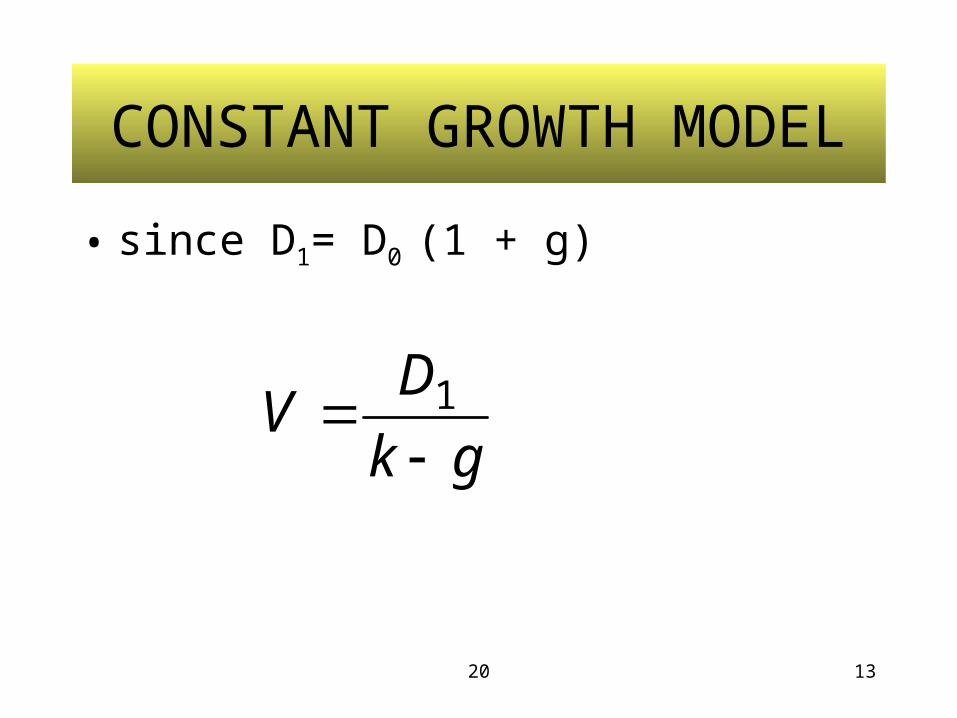
CONSTANT GROWTH MODEL
• since D1= D0 (1 + g)
gk
DV
1
* 14
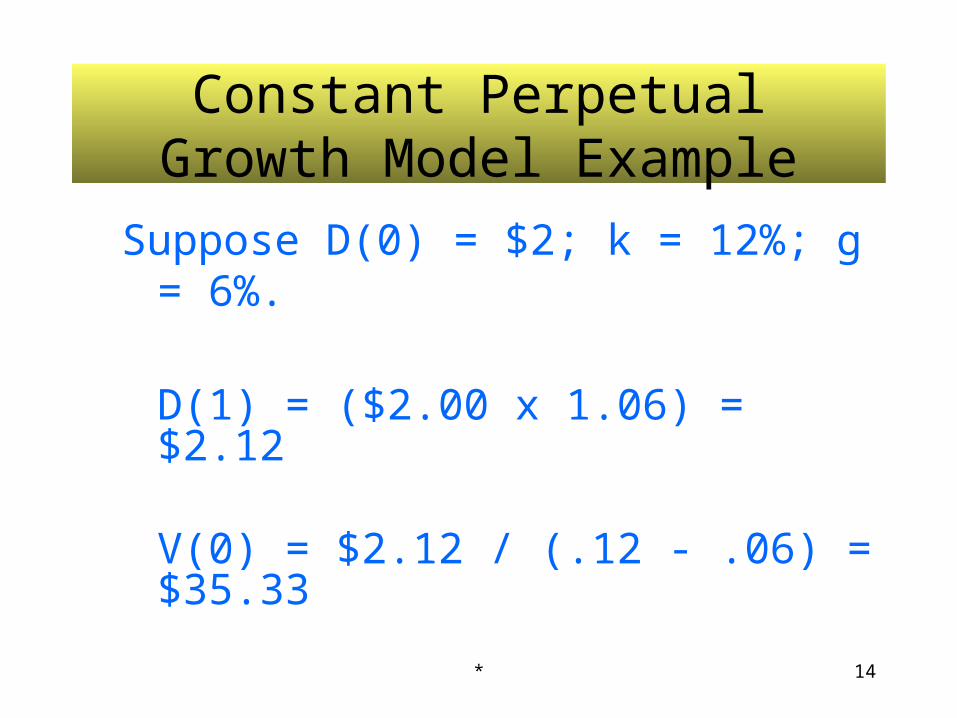
Constant Perpetual Growth Model Example
Suppose D(0) = $2; k = 12%; g = 6%.
D(1) = ($2.00 x 1.06) = $2.12
V(0) = $2.12 / (.12 - .06) = $35.33
* 15
Constant Perpetual Growth• Advantage
– easy to compute
• Disadvantages– not usable for firms paying no dividends– not usable when g > k– sensitive to choice of g and k– k and g may be very difficult to estimate– constant perpetual growth is often unrealistic
21 16
THE MULTIPLE-GROWTH MODEL
• ASSUMPTION:– future dividend growth is not constant
• Model Methodology– to find present value of forecast stream of
dividends– divide stream into parts (lifecycle stage)– each representing a different value for g
23 17
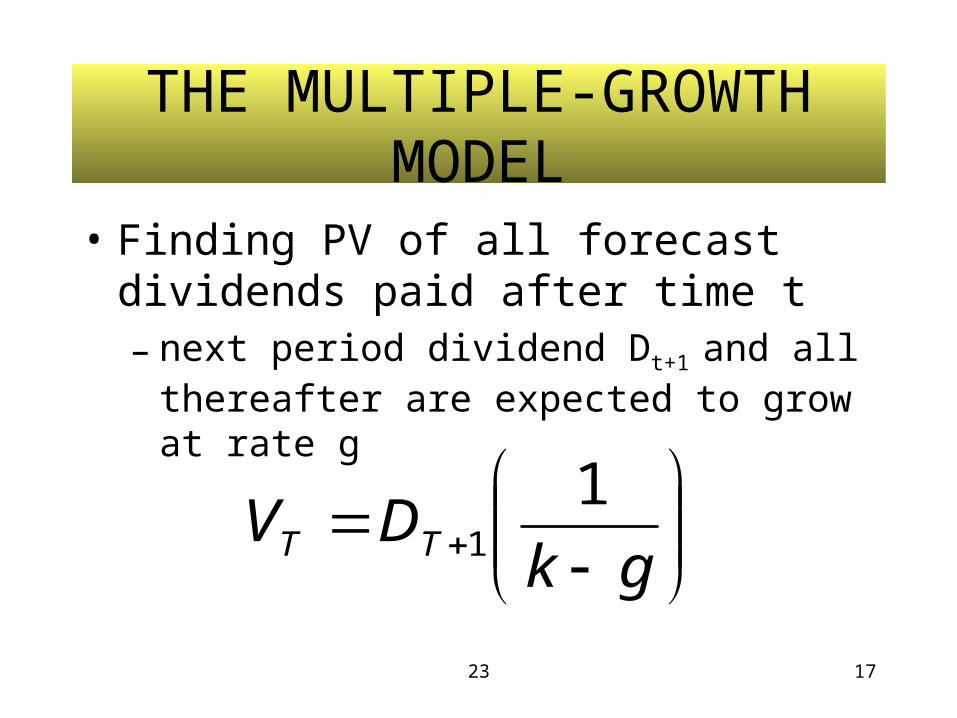
THE MULTIPLE-GROWTH MODEL
• Finding PV of all forecast dividends paid after time t– next period dividend Dt+1 and all thereafter are
expected to grow at rate g
gkDV TT
11
* 18
Two-Stage (any number) Dividend Growth Model
If you have two different growth rates, one for an early period and one for a later period, you would use the two-stage model
* 19
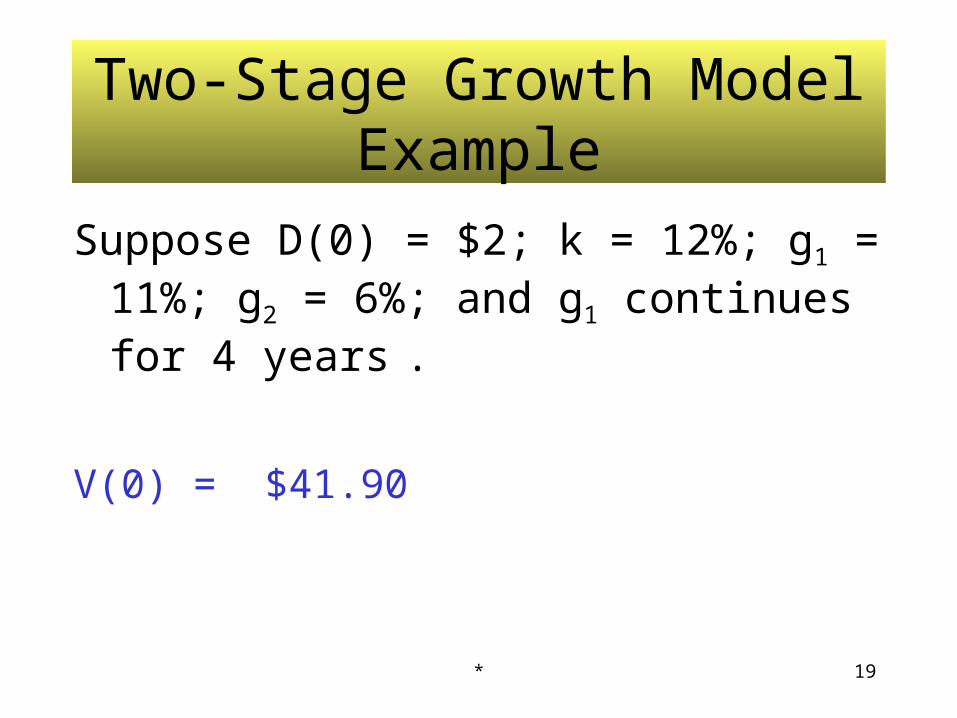
Two-Stage Growth Model Example
Suppose D(0) = $2; k = 12%; g1 = 11%; g2 = 6%; and g1 continues for 4 years .
V(0) = $41.90
* 20
Two-Stage Growth
• Advantage– allows for two different growth rates– g can be greater than k during period 1
• Disadvantages– not usable for firms paying no dividends– sensitive to choice of g and k– k and g may be difficult to estimate
* 21
Estimating the Discount RateStart with the CAPM (covered later):
Discount rate =
Risk-free rate + (Stock beta x Market risk premium)
where:
Risk-free rate = U.S. T-bill rate, which is the wait component or time value of money.
Stock beta measures the individual stock’s risk relative to the market.
Market risk premium measures the difference in return between investing in the market and investing in T-bills.
* 22
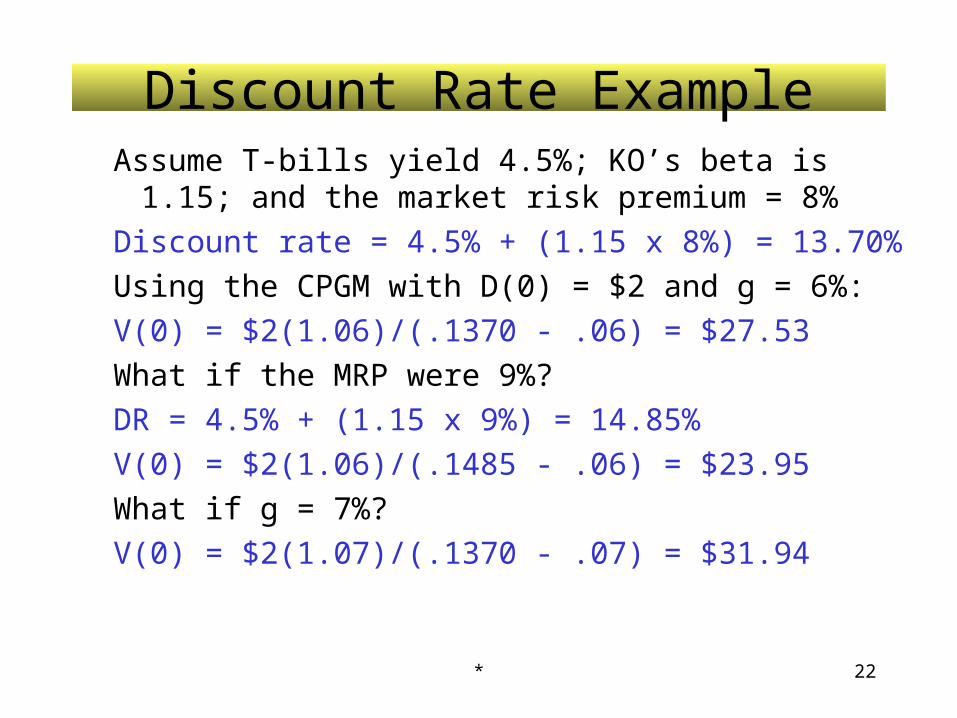
Discount Rate ExampleAssume T-bills yield 4.5%; KO’s beta is 1.15; and the
market risk premium = 8%
Discount rate = 4.5% + (1.15 x 8%) = 13.70%
Using the CPGM with D(0) = $2 and g = 6%:
V(0) = $2(1.06)/(.1370 - .06) = $27.53
What if the MRP were 9%?
DR = 4.5% + (1.15 x 9%) = 14.85%
V(0) = $2(1.06)/(.1485 - .06) = $23.95
What if g = 7%?
V(0) = $2(1.07)/(.1370 - .07) = $31.94
26 23
MODELS BASED ON P/E RATIO
• PRICE-EARNINGS RATIO MODEL– Many investors prefer the earnings multiplier
approach since they feel they are ultimately entitled to receive a firm’s earnings
27 24
MODELS BASED ON P/E RATIO
• PRICE-EARNINGS RATIO MODEL– EARNINGS MULTIPLIER:
= PRICE - EARNINGS RATIO
= Current Market Pricefollowing 12 month earnings
30 25
PRICE-EARNINGS RATIO MODEL
• The P/E Ratio is a function of – the expected payout ratio ( D1 / E1 )
– the required return (k)– the expected growth rate of dividends (g)
* 26
High vs. Low P/Es
• A high P/E ratio:– indicates positive expectations for the future of the
company
– means the stock is more expensive relative to earnings
– typically represents a successful and fast-growing company
• A low P/E ratio:– indicates negative expectations for the future of the
company
– may suggest that the stock is a better value or buy
28 27
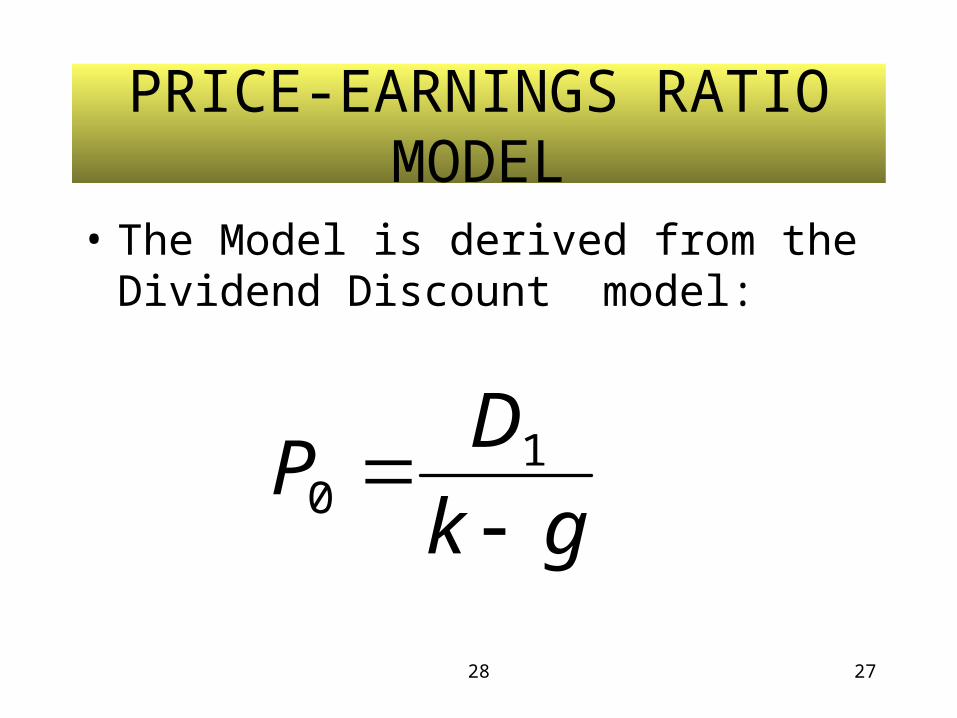
PRICE-EARNINGS RATIO MODEL
• The Model is derived from the Dividend Discount model:
gk
DP
1
0
29 28
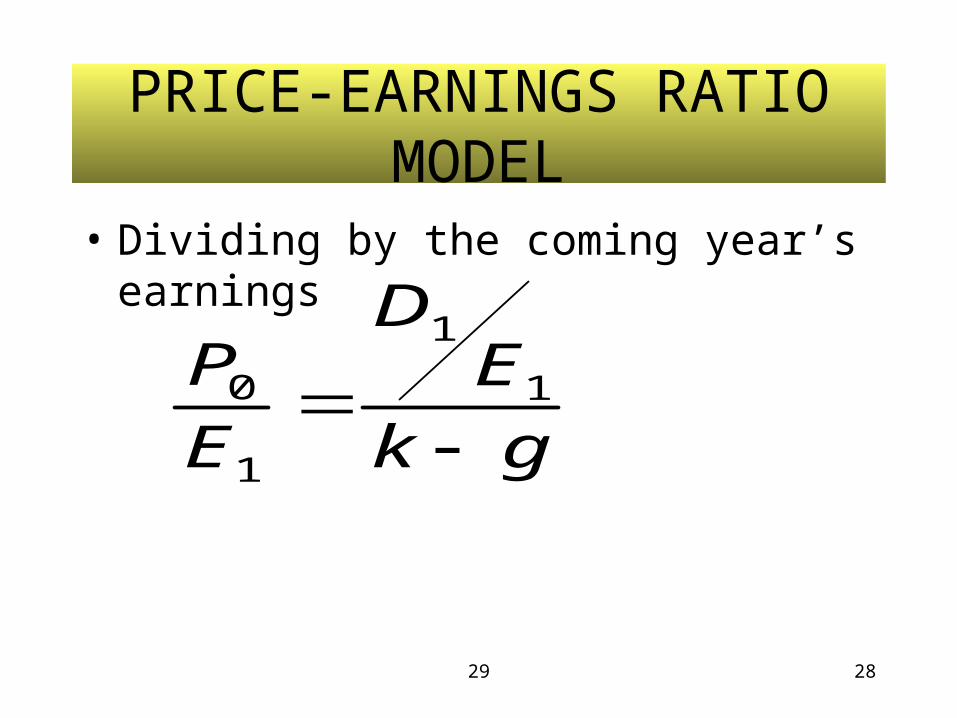
PRICE-EARNINGS RATIO MODEL
• Dividing by the coming year’s earnings
gk
ED
E
P
1
1
1
0
35 29
SOURCES OF EARNINGS GROWTH
• What causes growth?• assume no new capital added
• retained earnings used to pay firm’s new investment
• If pt = the payout ratio in year t
• 1-pt = the retention ratio
42 30
SOURCES OF EARNINGS GROWTH
• Growth rate depends on
– the retention ratio
– average return on equity
* 31
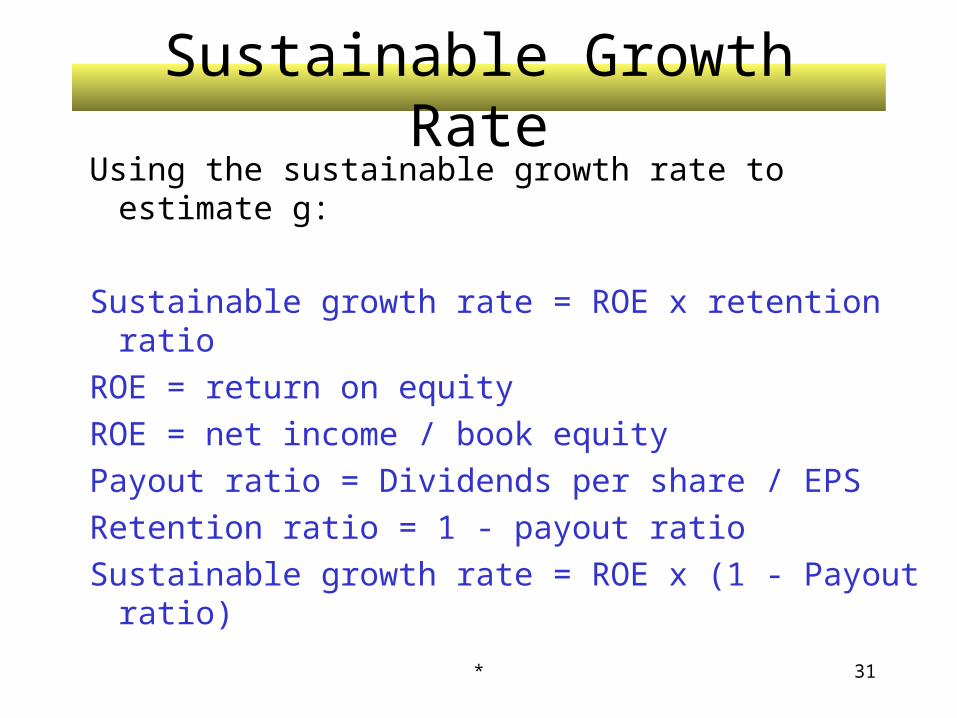
Sustainable Growth RateUsing the sustainable growth rate to estimate g:
Sustainable growth rate = ROE x retention ratio
ROE = return on equity
ROE = net income / book equity
Payout ratio = Dividends per share / EPS
Retention ratio = 1 - payout ratio
Sustainable growth rate = ROE x (1 - Payout ratio)
* 32
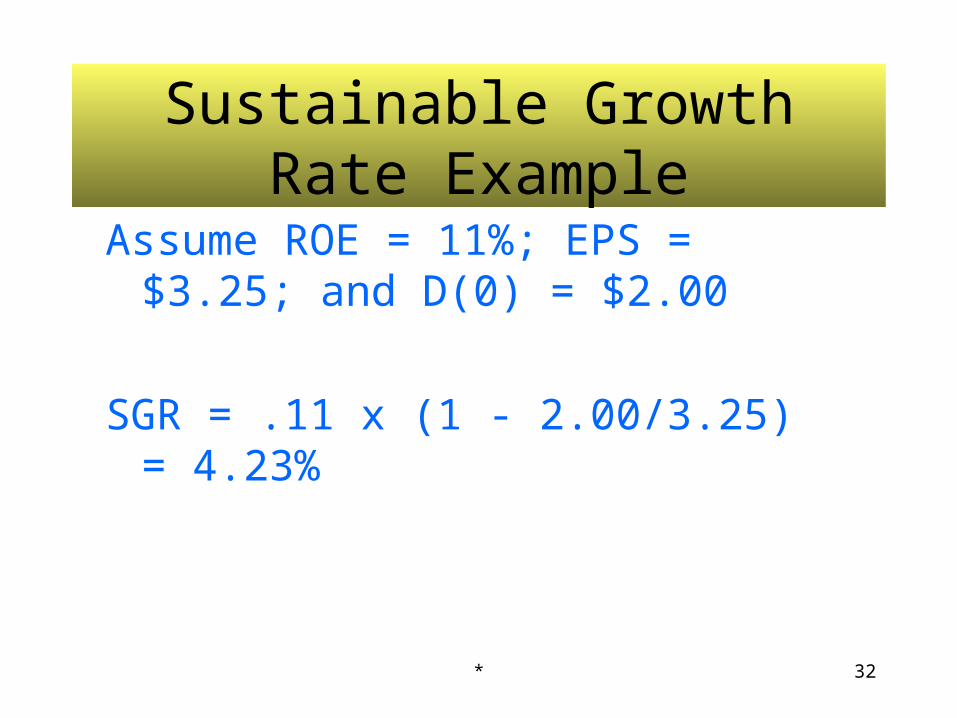
Sustainable Growth Rate Example
Assume ROE = 11%; EPS = $3.25; and D(0) = $2.00
SGR = .11 x (1 - 2.00/3.25) = 4.23%
* 33
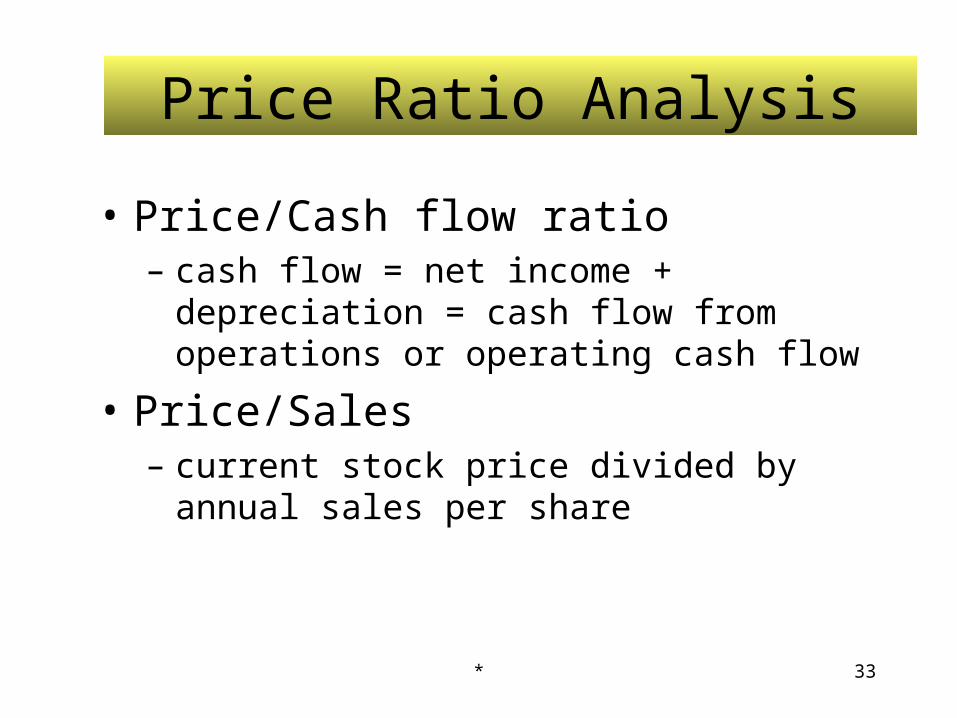
Price Ratio Analysis
• Price/Cash flow ratio– cash flow = net income + depreciation = cash flow
from operations or operating cash flow
• Price/Sales– current stock price divided by annual sales per
share