Embed Size (px)
Citation preview

11
Chapter 5
The Research Process –
Hypothesis Development – (Stage 4 in Research Process)
© 2009 John Wiley & Sons Ltd.www.wileyeurope.com/college/sekaran

Recall the Research process:
1) Broad problem area
2) Problem statement
3) Theoretical Framework
4) Generation of hypotheses
5) Data collection:
6) Data analysis:
7) Report Writing( Interpretation of results)
2© 2009 John Wiley & Sons Ltd.www.wileyeurope.com/college/sekaran

Stage 4 : Hypothesis
A proposition that is empirically testable. It is an empirical statement concerned with the relationship among variables.
Good hypothesis:– Must be adequate for its purpose– Must be testable– Must be better than its rivals
3© 2009 John Wiley & Sons Ltd.www.wileyeurope.com/college/sekaran

The Simple Regression Model
Regression analysis is a statistical tool for the investigation of relationships between variables.
Usually, the investigator seeks to determine the causal effect of one variable upon another.
To explore such issues, the investigator assembles data on the underlying variables of interest and employs regression to estimate the quantitative effect of the causal variables upon the variable that they influence. The investigator also typically assesses the “statistical significance” of

The Simple Regression Model
The investigator also typically assesses the “statistical significance” of the estimated relationships, that is, the degree of confidence that the true relationship is close to the estimated relationship.
Regression techniques have long been central to the field of economic statistics (“econometrics”).

Definition of the simple linear regression model
Dependent variable,explained variable,response variable,…
Independent variable,explanatory variable,regressor,…
Error term,disturbance,unobservables,…
Intercept Slope parameter
"Explains variable in terms of variable "
The Simple Regression Model

Example: Soybean yield and fertilizer
Example: A simple wage equation
Measures the effect of fertilizer on yield, holding all other factors fixed
Rainfall,land quality, presence of parasites, …
Measures the change in hourly wagegiven another year of education, holding all other factors fixed
Labor force experience,tenure with current employer, work ethic, intelligence …
The Simple Regression Model

In order to estimate the regression model one needs data
A random sample of observations
First observation
Second observation
Third observation
n-th observation
Value of the explanatory variable of the i-th observation
Value of dependentvariable of the i-th observation
The Simple Regression Model

Fit as good as possible a regression line through the data points:
Fitted regression lineFor example, the i-th
data point
The Simple Regression Model
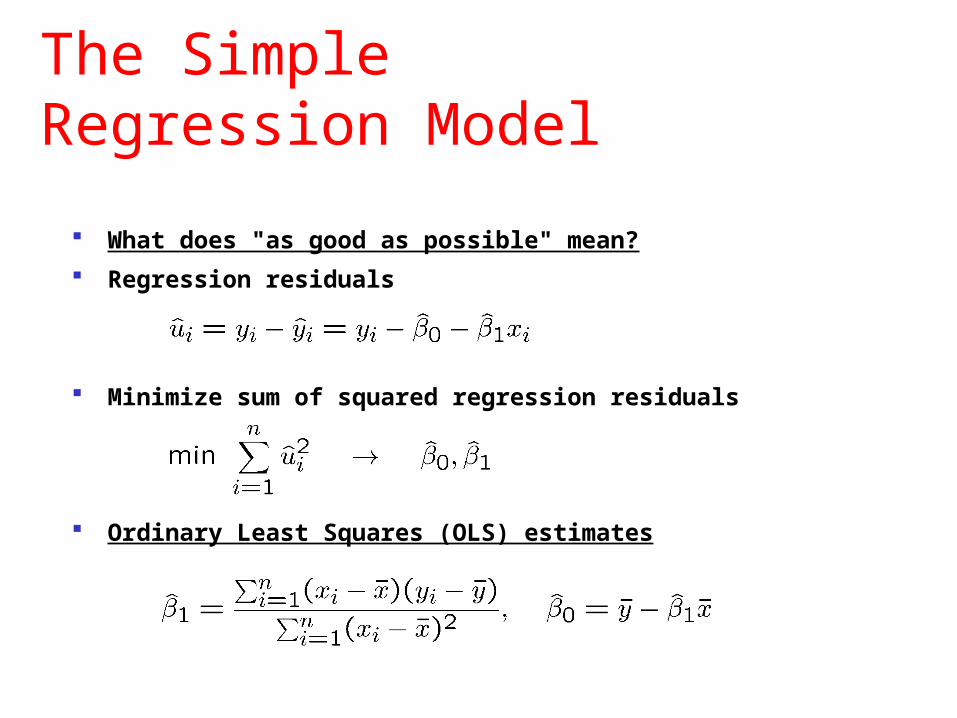
What does "as good as possible" mean?
Regression residuals
Minimize sum of squared regression residuals
Ordinary Least Squares (OLS) estimates
The Simple Regression Model

CEO Salary and return on equity
Fitted regression
Causal interpretation?
Salary in thousands of dollars Return on equity of the CEO‘s firm
InterceptIf the return on equity increases by 1 percent,then salary is predicted to change by 18,501 $
The Simple Regression Model

Wage and education
Fitted regression
Hourly wage in dollars Years of education
InterceptIn the sample, one more year of education wasassociated with an increase in hourly wage by 0.54 $
The Simple Regression Model
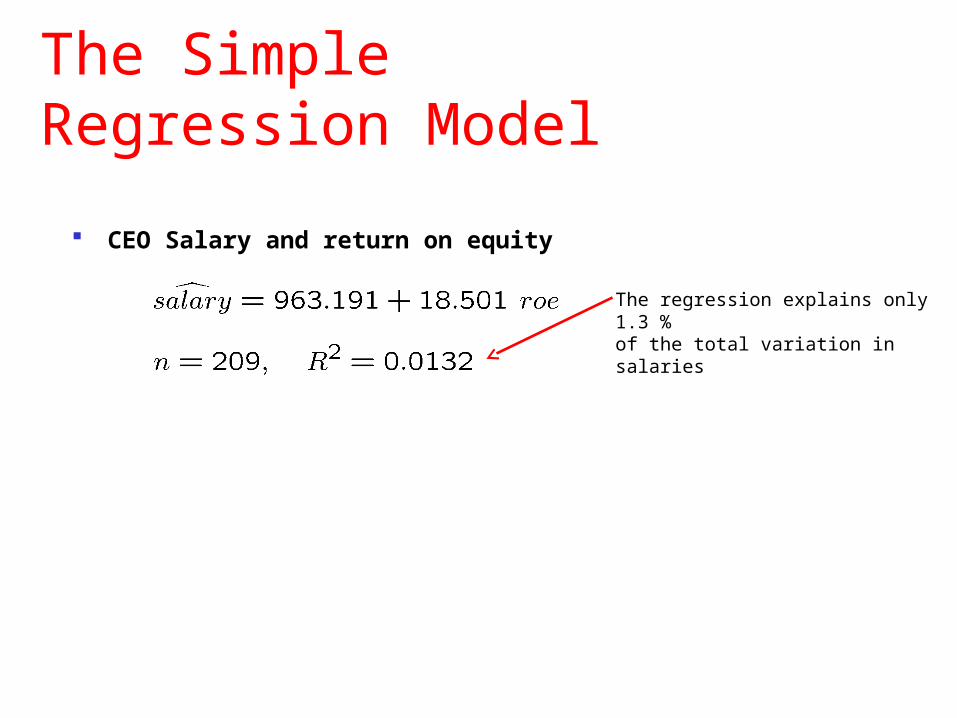
CEO Salary and return on equity
The regression explains only 1.3 %of the total variation in salaries
The Simple Regression Model

Multiple RegressionAnalysis: Estimation
Definition of the multiple linear regression model
Dependent variable,explained variable,response variable,…
Independent variables,explanatory variables,regressors,…
Error term,disturbance,unobservables,…
Intercept Slope parameters
"Explains variable in terms of variables "

Motivation for multiple regression
– Incorporate more explanatory factors into the model
– Explicitly hold fixed other factors that otherwise would be in
– Allow for more flexible functional forms
Example: Wage equation
Hourly wage Years of education Labor market experience
All other factors…
Now measures effect of education explicitly holding experience fixed
Multiple RegressionAnalysis: Estimation

Example: Wage equation
– Test whether, after controlling for education and tenure, higher work experience leads
to higher hourly wages
Standard errors
Test against .
One would either expect a positive effect of experience on hourly wage or no effect at all.
Multiple RegressionAnalysis: Inference

Example: Wage equation (cont.)
"The effect of experience on hourly wage is statistically greater than zero at the 5% (and even at the 1%) significance level."
t-statistic
Degrees of freedom;here the standard normal approximation applies
Critical values for the 5% and the 1% significance level (these are conventional significance levels).
The null hypothesis is rejected because the t-statistic exceeds the critical value.
Multiple RegressionAnalysis: Inference

Testing against two-sided alternatives
Test agai nst .
Reject the null hypothesis in favour of the alternative hypothesis if the absolute value of the estimated coefficient is too large.
Construct the critical value so that, if the null hypothesis is true, it is rejected in,for example, 5% of the cases.
In the given example, these are the points of the t-distribution so that 5% of the caseslie in the two tails.
! Reject if absolute value of t-statistic is less than -2.06 or greater than 2.06
Multiple RegressionAnalysis: Inference

Guidelines for discussing economic and statistical significance
– If a variable is statistically significant, discuss the magnitude of the coefficient to get an idea of its
economic or practical importance
– The fact that a coefficient is statistically significant does not necessa-rily mean it is economically or
practically significant!
– If a variable is statistically and economically important but has the "wrong“ sign, the regression model
might be misspecified
– If a variable is statistically insignificant at the usual levels (10%, 5%, 1%), one may think of dropping it
from the regression
– If the sample size is small, effects might be imprecisely estimated so that the case for dropping
insignificant variables is less strong
Multiple RegressionAnalysis: Inference

Computing p-values for t-tests
– If the significance level is made smaller and smaller, there will be a point where the null hypothesis cannot be rejected
anymore
– The reason is that, by lowering the significance level, one wants to avoid more and more to make the error of rejecting a
correct H0
– The smallest significance level at which the null hypothesis is still rejected, is called the p-value of the hypothesis test
– A small p-value is evidence against the null hypothesis because one would reject the null hypothesis even at small
significance levels
– A large p-value is evidence in favor of the null hypothesis
– P-values are more informative than tests at fixed significance levels
Multiple RegressionAnalysis: Inference