Embed Size (px)
Citation preview
1 State of Water Environment
1.1 Availability of Water Resources
Nature has endowed Gujarat with limited fresh water. The total renewable fresh water available, including the annual runoff from within the state and that allocated from the neighbouring states, and all the natural recharge of groundwater, is 54,593 MCM (IRMA, 2001). This gives a per capita renewable fresh water availability of 1137 m3 per annum for the year 2001 (IRMA 2001) and 830 m3 per annum for the year 2011 (Nawlawala 2011). Therefore, as per water stress index1, the state reached the status of “water stressed” in the year 2001 itself and over the decade per capita availability has decreased significantly. It is also predicted that the availability will be 738 M3 in 2015 and 601 M3 in 2025. But it need to be noted that the availability of water is heavily skewed towards south and central Gujarat, which has 69.5% of the total renewable fresh water.
Figure 3-1 Changing Per Capita Availability of Water (in M3 per Annum)
1 The Falkenmark water stress index measures per capita water availability and considers that a per capita water availability of between 1000 and 1600 m3 indicates water stress, 500–1000 m3 indicates chronic water scarcity, while a per capita water availability below 500 m3 indicates a country or region beyond the ‘water barrier’ of manageable capability (Falkenmark and Widstrand, 1992)
876 734
427
1932
1137
526 465 247
1839
830
0
500
1000
1500
2000
Kutch Saurashtra North Gujarat South Gujarta Total
2001 2011

The study by Amarasinghe et.al.(2005) confirms these observations. The study has used disaggregated data at the river basin level to assess the water supply and demand across the river basins of India. According to the study, Saurashtra, Kachchh and North Gujarat falls under the river basin named as westerly flowing river group 1 (WFR 1), which is the only basin of the country having physical water scarcity with an highest degree of development (132%) and Ground water abstraction ratio (194%), with a depleted fractions of 92 percent. A broad picture of the distribution of the arid and semi-arid blocks support the above mentioned water scarcity, as 17 blocks in the state are arid and 79 blocks are semi-arid bringing the total to 96 blocks of the total 192 blocks. The annual replenishable ground water resource of the state for 2008-09 has been estimated as 18.43 billion cubic metres (BCM). (GoI, 2010). Net Annual Ground Water Availability is 17.35 bcm and the Annual Ground Water Draft is 12.99 bcm. Agriculture sector remains the predominant consumer of ground water resources by drafting about 92% of total annual ground water draft i.e. 11.93 bcm while only 1.05 bcm is for Domestic & Industrial use which is about 8% of the total draft. The figure for net draft of groundwater considering the present utilization indicates that a substantial portion of the total potential (about 23 per cent) still remains untapped. There has been an increase of 36 percent in the net utilizable groundwater in 2009 as compared to 1997 (17.35 BCM to 12.8 BCM). Studies conducted by the State Ground Water Board in several regions of the state also draw attention to the severe water scarcity. In Ahmedabad district for example the ground water level was 63 meters in 1997, and it went to 100 meters in 2011. The rising demand from the urban population as well as from the rapidly growing industries was seen to be responsible for this. Again, the report of the Ground Water Management Investigation Centre of the Government of Gujarat (2011) has revealed that water tables in Gujarat are declining rapidly even from “confined” water tables. The average water table form the confined water tables was 51.86 meters in 2001, and it want to 65.89 meters in 2011. This trend was observed in Central Gujarat, North Gujarat as well as in the Eastern Gujarat. Uncontrolled withdrawal of ground water by farmers has been responsible for this trend (CGWB 2011).
1.2 Stage of Ground Water Development
The level of Ground Water Development for the entire state is 75%. According to the assessment of Central Ground Water Board as on March 2009, in 5 out of 26 districts all belonging to North Gujarat, the gross annual drafts has exceeded the available groundwater resources and they are categorized as “over-exploited” districts. Kachchh is the only district where groundwater development is greater than 90 percent and is categorized as critical districts. Sabarkantha and Porbandar are categorized as semi-critical while the remaining 17 districts are considered safe as the level of development is less than 70 percent and there is scope for further exploitation in these districts. CGWB has also assessed 223 talukas/units for computing the stage of ground water development. Out of the 223 assessment units (Taluka), 27 have been categorized as “Over-exploited”, 6 as Critical, 20 as Semi- critical, 14 as Saline and 156 as safe.

Map 3-1 Stage of Groundwater Development in 1997
Map 3-2 Stage of Groundwater Development in 2009
Table 3-1and Figure 3-2 show the comparison of the level of ground water development in 1997 and 2009. The major changes in the status of groundwater resources are: Prominent Change in the level of groundwater development mostly in Southern Hills
especially in Dangs (22%), North West arid (6%) and North Gujarat (5%)
The number of districts falling in ‘over-exploited category’ with more than 100 percent groundwater development increased from 3 in 1997 to 5 in 2009. However taluka level data; shows that the total number of safe/white blocks has increased from 52 percent in 1997 to 70 percent in 2009. That is, the problem talukas have decreased from 45 percent to 24 percent over the same period, whereas the saline talukas have increased twice from 7 in 1997 to 14 in 2004 and continued to remain saline till date (Table 6).
It has been observed that in Vadodara, Kheda and Bharuch districts of central Gujarat
especially coming under Narmada command, the talukas which were coming under over-exploited category in 1997 has now shifted to either semi-critical or safe category in 2009. A similar trend has been followed by Amreli and Junagadh districts of Saurashtra region. The worst affected region is Kachchh where 70 percent of talukas are problem talukas (more than one-third of which are OE), followed by North Gujarat, which has 56 percent problem talukas (with more than 70 percent OE talukas) (Chart 15). For taluka wise distribution of this data, please refer to annexure.
Figure 3-2 Comparison of 1997 and 2009 Level of Development of Ground Water in Gujarat
9 18
6
2 1
1 3
5
1997 2009
Over-exploited Critical Semi-critical Safe
42 20
8
6
31
27
0
20
40
60
80
100
1997 2009
Over-Exploited Critical Semi Critical
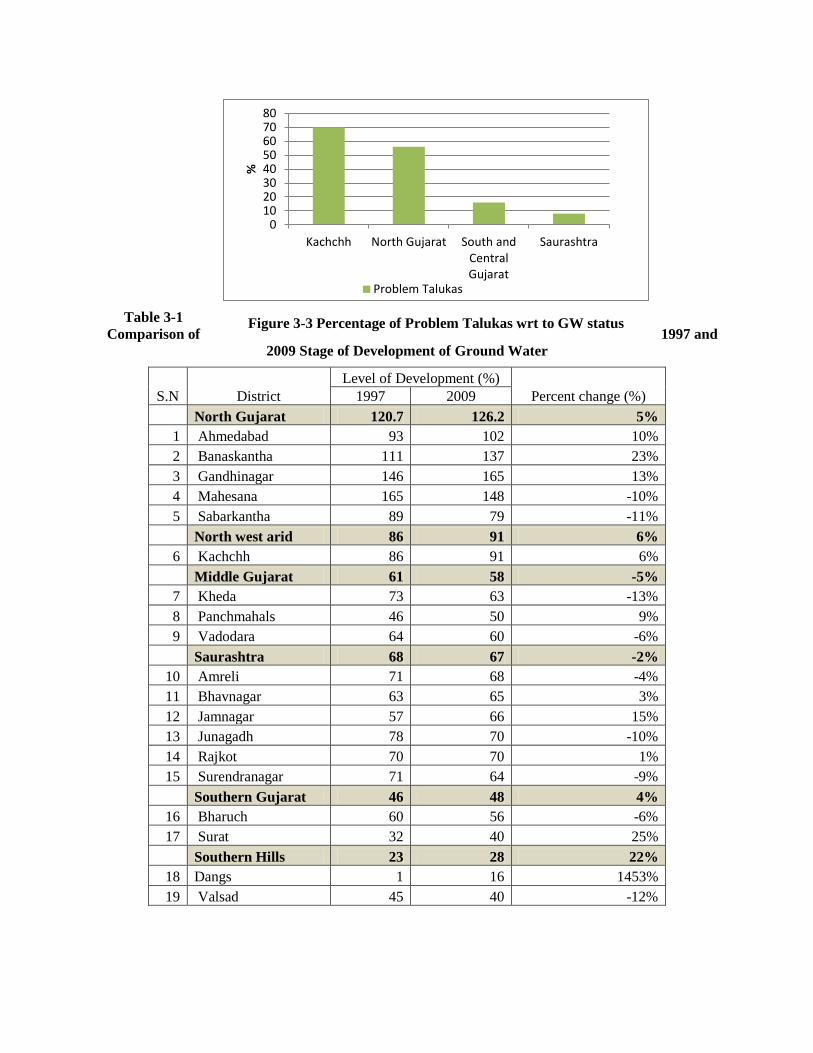
Table 3-1 Comparison of 1997 and
2009 Stage of Development of Ground Water
S.N District Level of Development (%)
Percent change (%) 1997 2009 North Gujarat 120.7 126.2 5%
1 Ahmedabad 93 102 10% 2 Banaskantha 111 137 23% 3 Gandhinagar 146 165 13% 4 Mahesana 165 148 -10% 5 Sabarkantha 89 79 -11%
North west arid 86 91 6% 6 Kachchh 86 91 6%
Middle Gujarat 61 58 -5% 7 Kheda 73 63 -13% 8 Panchmahals 46 50 9% 9 Vadodara 64 60 -6%
Saurashtra 68 67 -2% 10 Amreli 71 68 -4% 11 Bhavnagar 63 65 3% 12 Jamnagar 57 66 15% 13 Junagadh 78 70 -10% 14 Rajkot 70 70 1% 15 Surendranagar 71 64 -9%
Southern Gujarat 46 48 4% 16 Bharuch 60 56 -6% 17 Surat 32 40 25%
Southern Hills 23 28 22% 18 Dangs 1 16 1453% 19 Valsad 45 40 -12%
01020304050607080
Kachchh North Gujarat South andCentralGujarat
Saurashtra%
Problem Talukas
Figure 3-3 Percentage of Problem Talukas wrt to GW status

Table 3-2 Categorization of Talukas with Respect to Stage of Development of Groundwater across 12 years
Category 1997 2002 2004 2009 Over-Exploited 31 30 31 27 Critical/Dark 8 12 12 6 Semi-Critical/Grey 43 63 69 20 Saline 7 - 14 14 Safe/White 95 - 97 156 Total Assessment Units/Talukas 184 105 223 223
Source: Udiwal and Patel, 2010; GEC, 2005 & CGWB, 2009 1.2.1 Causes of Over-Exploitation
The prime cause of over-exploitation is the rising demand for groundwater from agriculture. In groundwater irrigated areas, decisions on cropping pattern and cropping intensity, which are the predominant determinants of agricultural demand for groundwater, are being taken largely independent of the ease of ground water availability. Thus, water intensive crops (which are perceived to be remunerative) have tended to be grown even in the face of scarcity of groundwater. The problem has been compounded by the availability of subsidized power in the state. Moreover, electric supply is not metered and a flat tariff is usually charged. The total availability of surface and ground water in the state is 50,000 MCM. However, the demand for agriculture is higher and is being met by over exploitation of ground water in water scarce regions of the State. Table 3-3 below shows net area irrigated by various sources of water in the State. Data shows that besides canal and wells, the rural population has been depending upon tanks and villages ponds also.
Table 3-3 Trends in Net Irrigated Area by Source
Year Net Irrigated Area by Source (Area in 00 hectares)
Total Govt. Canals (Incl. Panchayat Canals)
Tube wells & other wells Tanks Other
Sources 1990-91 4731 19301 314 30 24376 1991-92 4705 18679 265 66 23715 1992-93 5570 20565 256 34 26425 1993-94 5301 19709 307 88 25405 1994-95 5930 23656 353 82 30021 1995-96 5735 22665 417 105 28922 1996-97 6125 23863 292 138 30418 1997-98 6357 23687 298 243 30585 1998-99 6021 24305 253 245 30824 1999-00 4923 24517 178 177 29795 2000-01 3476 24347 153 84 28060 2001-02 3824 25901 132 87 29944 2002-03 3804 26373 135 149 30461
020000400006000080000
100000120000140000
2004 2009
2006-07 7892 33070 398 1016 42376 Source: Directorate of Agriculture, Gujarat State, Gandhinagar
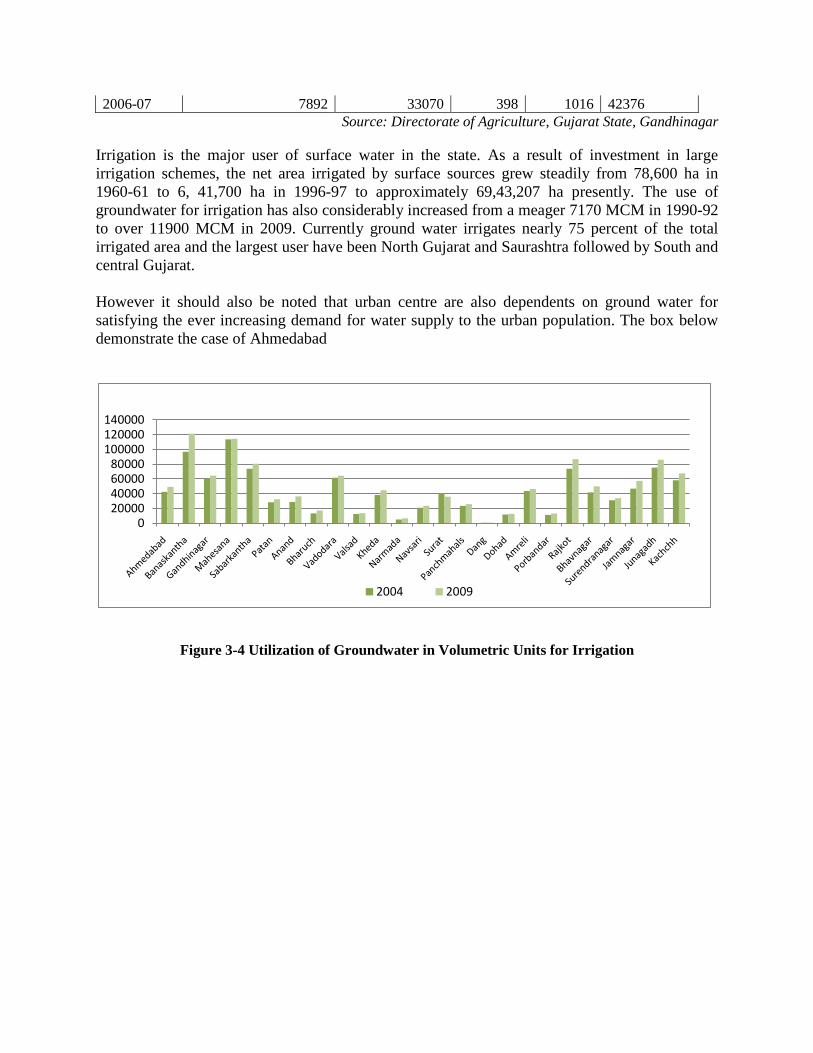
Irrigation is the major user of surface water in the state. As a result of investment in large irrigation schemes, the net area irrigated by surface sources grew steadily from 78,600 ha in 1960-61 to 6, 41,700 ha in 1996-97 to approximately 69,43,207 ha presently. The use of groundwater for irrigation has also considerably increased from a meager 7170 MCM in 1990-92 to over 11900 MCM in 2009. Currently ground water irrigates nearly 75 percent of the total irrigated area and the largest user have been North Gujarat and Saurashtra followed by South and central Gujarat. However it should also be noted that urban centre are also dependents on ground water for satisfying the ever increasing demand for water supply to the urban population. The box below demonstrate the case of Ahmedabad
Figure 3-4 Utilization of Groundwater in Volumetric Units for Irrigation

1.2.2 Impacts of Overexploitation
Overexploitation leads to increase in pumping depths, reduction in well/tube well yields and rise in the cost of pumping ground water. Another fallout of ground water overexploitation has been contamination of ground water due to geogenic factors (i.e. because of particular geological formation at deeper levels), resulting in increasing levels of fluoride, arsenic and iron. Since 85% of rural water supply programme depends on ground water as the source, impact on health of rural population due to such contamination is a matter of concern. Further, overexploitation in coastal areas leads to salinity ingress, which results in fresh water turning saline.
Status of Groundwater in the City of Ahmedabad
Of the 11 talukas of Ahmedabad District, Ahmedabad City and Daskroi have continued to be the over-exploited talukas. They have the highest level of groundwater development, which has increased from 148.63% in 2002 to 150.86% in 2005. Continuous pumping of groundwater by Ahmedabad Municipal Corporation (AMC) as well as numerous private tube wells has resulted in rapid depletion of the water table to about 100 m in the year 1975. Receding at 3 to 4 meters per year, the table touched 300 meters in the year 2000. As per data available from CGWB, the natural recharge in this area is only 13% of the total precipitation received. It is evident that there is almost no impact on the groundwater levels in the city even after the monsoon because of the low rate of natural recharge. The graph below shows the average groundwater levels in the AMC tubewells and their variation in last 45 years.
Figure 3-5 Pumping Water Levels in AMC Tubewells (in mbgl)
Source: AMC, 2006
The increasing dependency on groundwater in the city has a twofold direct impact. With decreasing groundwater level, the cost of pumping it is increasing. The frequent deepening of tubewells and borewells is another component of incremental expenditure. On the other hand due to inadequate surface water many citizens are forced to consume groundwater with TDS content as high as 2500 mg/l. Many studies have also recorded large expenditure on the purchase of water purifying equipment at the household level.
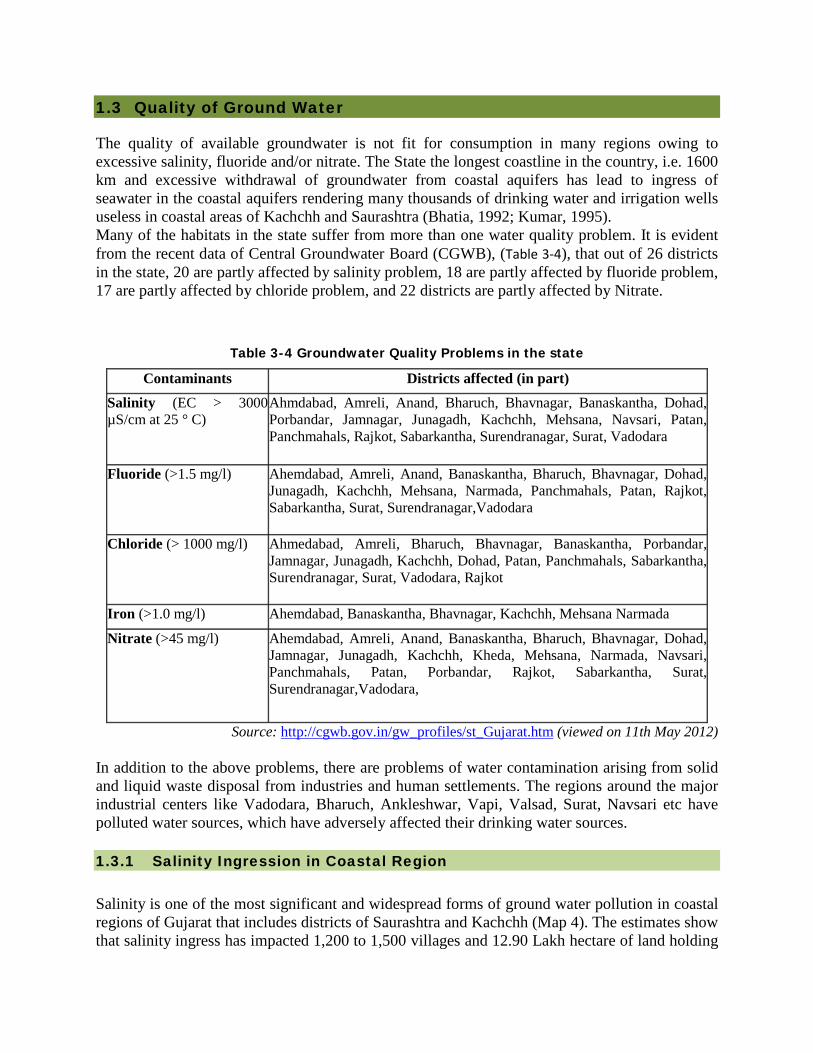
1.3 Quality of Ground Water
The quality of available groundwater is not fit for consumption in many regions owing to excessive salinity, fluoride and/or nitrate. The State the longest coastline in the country, i.e. 1600 km and excessive withdrawal of groundwater from coastal aquifers has lead to ingress of seawater in the coastal aquifers rendering many thousands of drinking water and irrigation wells useless in coastal areas of Kachchh and Saurashtra (Bhatia, 1992; Kumar, 1995). Many of the habitats in the state suffer from more than one water quality problem. It is evident from the recent data of Central Groundwater Board (CGWB), (Table 3-4), that out of 26 districts in the state, 20 are partly affected by salinity problem, 18 are partly affected by fluoride problem, 17 are partly affected by chloride problem, and 22 districts are partly affected by Nitrate.
Table 3-4 Groundwater Quality Problems in the state
Contaminants Districts affected (in part) Salinity (EC > 3000 µS/cm at 25 ° C)
Ahmdabad, Amreli, Anand, Bharuch, Bhavnagar, Banaskantha, Dohad, Porbandar, Jamnagar, Junagadh, Kachchh, Mehsana, Navsari, Patan, Panchmahals, Rajkot, Sabarkantha, Surendranagar, Surat, Vadodara
Fluoride (>1.5 mg/l) Ahemdabad, Amreli, Anand, Banaskantha, Bharuch, Bhavnagar, Dohad, Junagadh, Kachchh, Mehsana, Narmada, Panchmahals, Patan, Rajkot, Sabarkantha, Surat, Surendranagar,Vadodara
Chloride (> 1000 mg/l) Ahmedabad, Amreli, Bharuch, Bhavnagar, Banaskantha, Porbandar, Jamnagar, Junagadh, Kachchh, Dohad, Patan, Panchmahals, Sabarkantha, Surendranagar, Surat, Vadodara, Rajkot
Iron (>1.0 mg/l) Ahemdabad, Banaskantha, Bhavnagar, Kachchh, Mehsana Narmada
Nitrate (>45 mg/l) Ahemdabad, Amreli, Anand, Banaskantha, Bharuch, Bhavnagar, Dohad, Jamnagar, Junagadh, Kachchh, Kheda, Mehsana, Narmada, Navsari, Panchmahals, Patan, Porbandar, Rajkot, Sabarkantha, Surat, Surendranagar,Vadodara,
Source: http://cgwb.gov.in/gw_profiles/st_Gujarat.htm (viewed on 11th May 2012) In addition to the above problems, there are problems of water contamination arising from solid and liquid waste disposal from industries and human settlements. The regions around the major industrial centers like Vadodara, Bharuch, Ankleshwar, Vapi, Valsad, Surat, Navsari etc have polluted water sources, which have adversely affected their drinking water sources. 1.3.1 Salinity Ingression in Coastal Region
Salinity is one of the most significant and widespread forms of ground water pollution in coastal regions of Gujarat that includes districts of Saurashtra and Kachchh (Map 4). The estimates show that salinity ingress has impacted 1,200 to 1,500 villages and 12.90 Lakh hectare of land holding
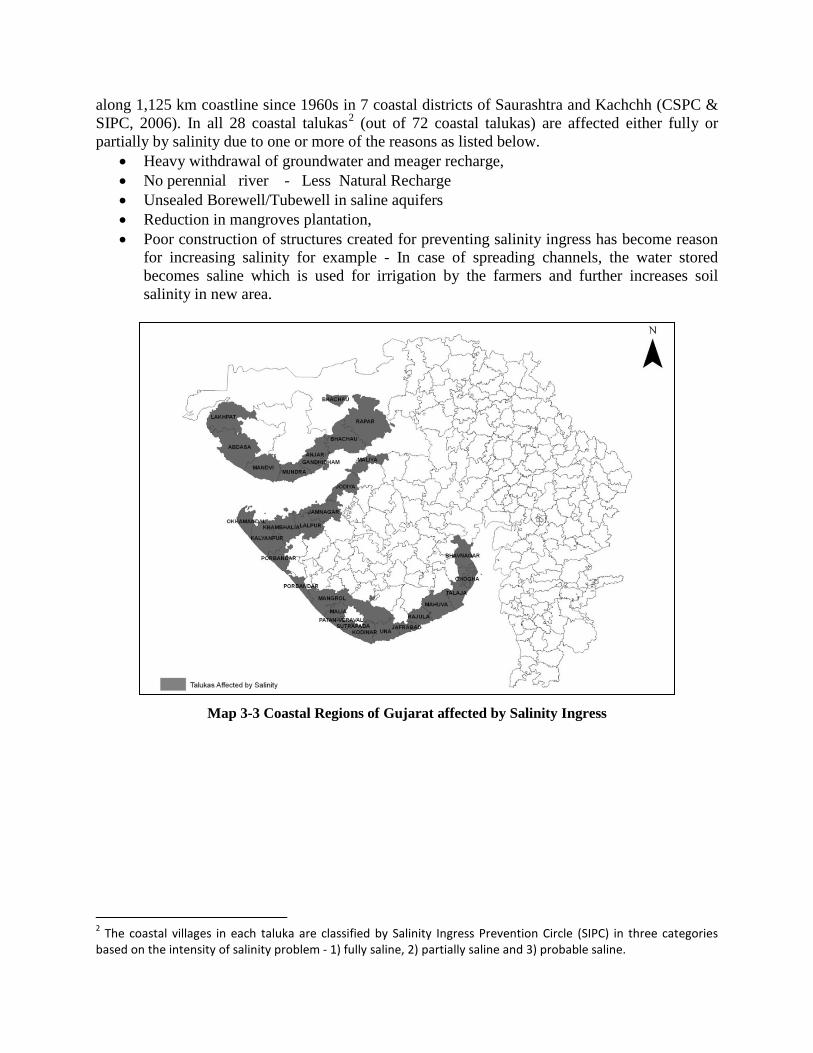
along 1,125 km coastline since 1960s in 7 coastal districts of Saurashtra and Kachchh (CSPC & SIPC, 2006). In all 28 coastal talukas2 (out of 72 coastal talukas) are affected either fully or partially by salinity due to one or more of the reasons as listed below.
• Heavy withdrawal of groundwater and meager recharge, • No perennial river - Less Natural Recharge • Unsealed Borewell/Tubewell in saline aquifers • Reduction in mangroves plantation, • Poor construction of structures created for preventing salinity ingress has become reason
for increasing salinity for example - In case of spreading channels, the water stored becomes saline which is used for irrigation by the farmers and further increases soil salinity in new area.
Map 3-3 Coastal Regions of Gujarat affected by Salinity Ingress
2 The coastal villages in each taluka are classified by Salinity Ingress Prevention Circle (SIPC) in three categories based on the intensity of salinity problem - 1) fully saline, 2) partially saline and 3) probable saline.
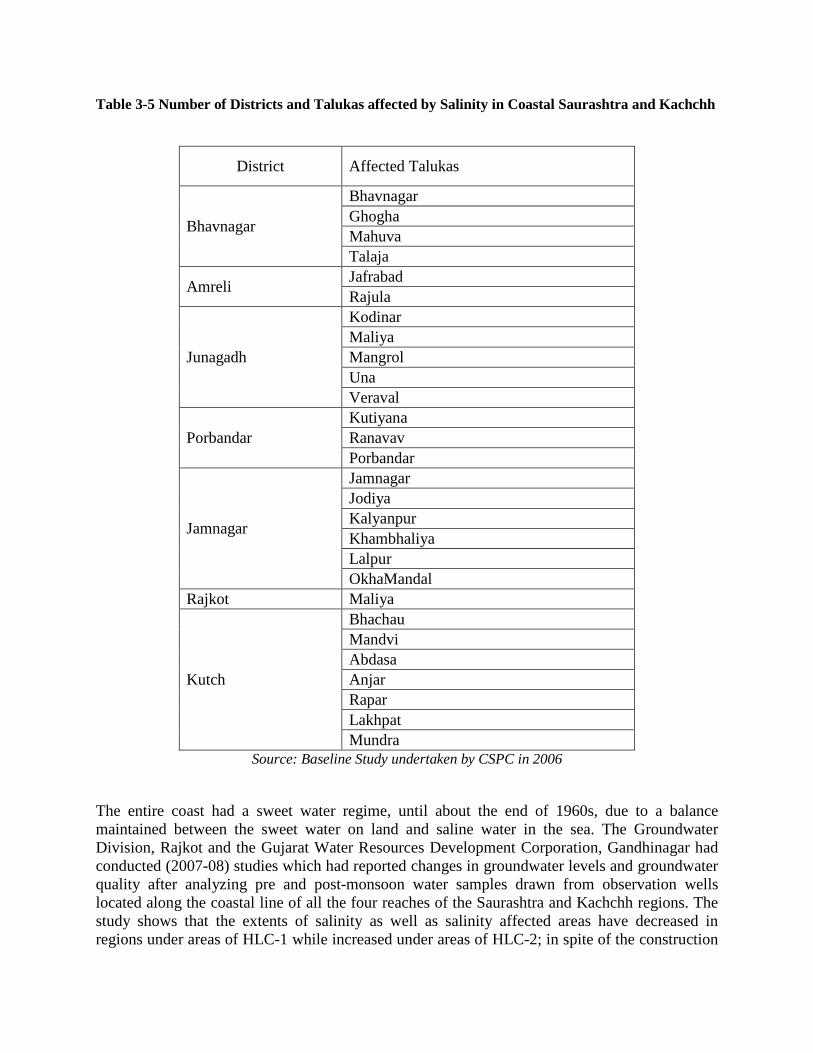
Table 3-5 Number of Districts and Talukas affected by Salinity in Coastal Saurashtra and Kachchh
District Affected Talukas
Bhavnagar
Bhavnagar Ghogha Mahuva Talaja
Amreli Jafrabad Rajula
Junagadh
Kodinar Maliya Mangrol Una Veraval
Porbandar Kutiyana Ranavav Porbandar
Jamnagar
Jamnagar Jodiya Kalyanpur Khambhaliya Lalpur OkhaMandal
Rajkot Maliya
Kutch
Bhachau Mandvi Abdasa Anjar Rapar Lakhpat Mundra
Source: Baseline Study undertaken by CSPC in 2006
The entire coast had a sweet water regime, until about the end of 1960s, due to a balance maintained between the sweet water on land and saline water in the sea. The Groundwater Division, Rajkot and the Gujarat Water Resources Development Corporation, Gandhinagar had conducted (2007-08) studies which had reported changes in groundwater levels and groundwater quality after analyzing pre and post-monsoon water samples drawn from observation wells located along the coastal line of all the four reaches of the Saurashtra and Kachchh regions. The study shows that the extents of salinity as well as salinity affected areas have decreased in regions under areas of HLC-1 while increased under areas of HLC-2; in spite of the construction

of salinity control structures undertaken in HLC-2 area. Details of changes in the areas affected by salinity ingression are as reflected in Chart 17 below. There is a decrease in the area affected by salinity ingression in the Bhavnagar-Una reach by 1, 36, 00 hectares, and Una- Madhavpur reach by 14994 hectares. Increase took place in the reaches of Madhavpur-Maliya by 3936 hectares and Maliya- Lakhpat by 6587 hectares. Areas affected by Salinity ingression have decreased by 18071 hectares.
Figure 3-6 Changes in the Areas Affected by Salinity Ingression (in Hectare)
Source: SIPC, 2008
050000
100000150000200000250000300000350000400000450000500000
1977-84 2007-08
Map 3-4 Area Affected by Salinity in Four Coastal Reaches
1.3.2 Extent of Salinity in Coastal Villages:
The latest data on the intent of salinity in the ground water of the coastal villages show that 379 villages our of the total of 954 villages (about 40 percent villages) are fully saline, i.e. the ground water has the TDS above 2000 mg per liter through the year; 177 villages (about 19 percent) are partially saline. i.e. their ground water becomes saline (> 2000 mg per liter) during the summer months; and 398 villages (about 41 percent have ground water which has less than 2000 mg per liter TDS throughout the year. Table 3-6 shows that almost 60 percent villages in the region do not have potable source of drinking water throughout the year. In the case of the rest of the villages, it needs to be noted that though the level of salinity here is below the maximum permissible limits’, the salinity level here is frequently above the ‘desirable’ levels of 500 mg/liter as per the WHO Guidelines. The limits have been raised in India because the overall salinity levels are too high in the region. (CSPC, 2007-08) Table 3-6 Villages Affected by Salinity across Saurashtra and Kachchh Districts in Gujarat
District Fully saline
Partial Saline
Prone to saline Total
Amreli 26 23 43 92
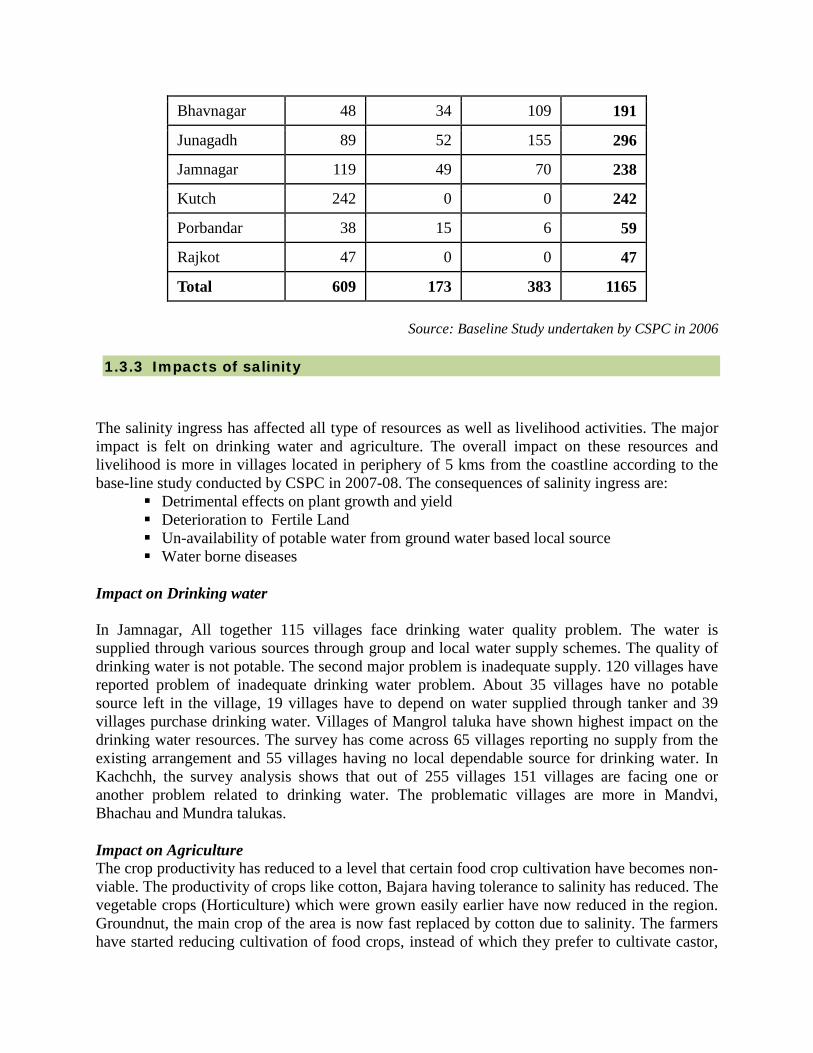
Bhavnagar 48 34 109 191
Junagadh 89 52 155 296
Jamnagar 119 49 70 238
Kutch 242 0 0 242
Porbandar 38 15 6 59
Rajkot 47 0 0 47
Total 609 173 383 1165
Source: Baseline Study undertaken by CSPC in 2006
1.3.3 Impacts of salinity
The salinity ingress has affected all type of resources as well as livelihood activities. The major impact is felt on drinking water and agriculture. The overall impact on these resources and livelihood is more in villages located in periphery of 5 kms from the coastline according to the base-line study conducted by CSPC in 2007-08. The consequences of salinity ingress are:
Detrimental effects on plant growth and yield Deterioration to Fertile Land Un-availability of potable water from ground water based local source Water borne diseases
Impact on Drinking water In Jamnagar, All together 115 villages face drinking water quality problem. The water is supplied through various sources through group and local water supply schemes. The quality of drinking water is not potable. The second major problem is inadequate supply. 120 villages have reported problem of inadequate drinking water problem. About 35 villages have no potable source left in the village, 19 villages have to depend on water supplied through tanker and 39 villages purchase drinking water. Villages of Mangrol taluka have shown highest impact on the drinking water resources. The survey has come across 65 villages reporting no supply from the existing arrangement and 55 villages having no local dependable source for drinking water. In Kachchh, the survey analysis shows that out of 255 villages 151 villages are facing one or another problem related to drinking water. The problematic villages are more in Mandvi, Bhachau and Mundra talukas. Impact on Agriculture The crop productivity has reduced to a level that certain food crop cultivation have becomes non-viable. The productivity of crops like cotton, Bajara having tolerance to salinity has reduced. The vegetable crops (Horticulture) which were grown easily earlier have now reduced in the region. Groundnut, the main crop of the area is now fast replaced by cotton due to salinity. The farmers have started reducing cultivation of food crops, instead of which they prefer to cultivate castor,

Jiru and cotton. Apart from salinity, the industrial pollution is also causing decline of agriculture in Khambhaliya, Lalpur, Okhamandal and Kalyanpur taluka. Overall, the agriculture in the coastal talukas is reducing. The agriculture land which remains uncultivated for 2-3 years eventually becomes wasteland. The change in agriculture pattern has reduced availability of fodder for animals from the agriculture produce. This has reduced animal husbandry in the area as well. Impact on Health The diseases like kidney stone, skin and gastric diseases are common in all the coastal villages. These diseases were found across all the villages covered under the base-line study of CSPC. The kidney stone problem is prevailing highest among all diseases across all salinity categories and is faced equally in saline and partially saline villages. The village survey analysis shows that Talaja, Mahuva, Ghogha, Una and Mangrol taluka are the most affected talukas from the point of view health issues. A study done by Rajnarayan Indu & Alka Rawal explains this between Mangrol and Maliya talukas of Junagadh district. The people of Mangrol taluka in its salinity-affected area are required to buy potable water for their daily use. The families affected by kidney stone have to incur high medical expenses and also have to lose wages during the time of the surgery to remove the stone. Besides all these there are other impacts on social aspects. There is typical resistance to marital alliances between the families of “salinity affected” villages and those not affected. This is not only due to poor water quality and fear of kidney stone but also to apprehensions about fetching drinking water from long distances, which the brides would like to avoid. This social impact is difficult to quantify (Indu and Rawal, 2007). 1.3.4 Major initiatives
Some of the important initiatives taken up to address salinity are described below.
Table 3-7 The details of works carried out in HLC-I and II reaches (As on 30-09-2011) S N
Particulars HLC-I Area HLC-II Area Total completed structures (HLC I &
II)
Benefited area
Direct/In Direct in
Ha.
Storage Capacity in Mcum
Recomm ended
Completed Recomm ended
Completed
1 2 3 4 5 6 7 8 9
1 Tidal Regulators 7 6 31 6 12 17170 174.815
2 Bandharas 10 12 77 14 26 13717 65.23
3 Recharge Reservoirs 4 2 43 11 13 6790 45.05
4 Checkdam 75 181 763 468 649 7435 22.96 5 Recharge 7 5 55 13 18 1993 1.32
Tanks
6 Recharge Wells 200 198 1130 199 397 0 0
7 Afforestation (Hact.) 10,000 5867 40750 - 5867 0 0
8 Nalla Plugs - 4487 65400 - 4487 0 0
9 Spreading Channel (Kms)
60 65 300 60 125 17529 1.21
Total 64634 310.585
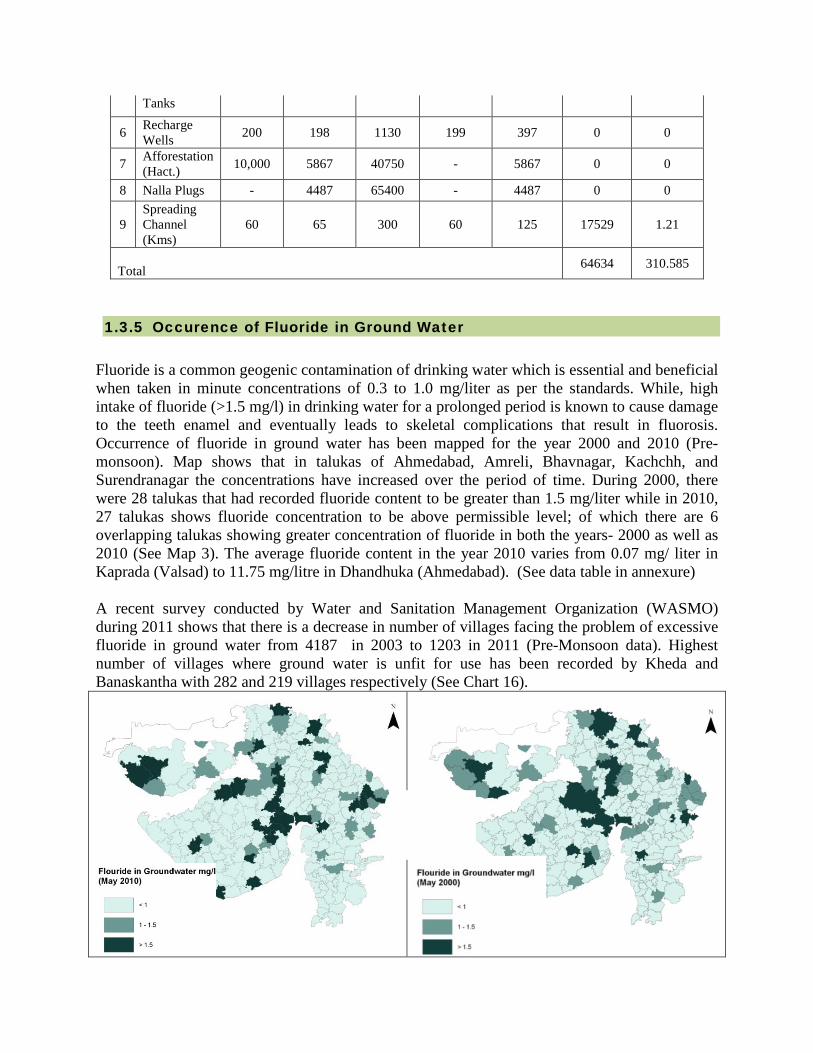
1.3.5 Occurence of Fluoride in Ground Water
Fluoride is a common geogenic contamination of drinking water which is essential and beneficial when taken in minute concentrations of 0.3 to 1.0 mg/liter as per the standards. While, high intake of fluoride (>1.5 mg/l) in drinking water for a prolonged period is known to cause damage to the teeth enamel and eventually leads to skeletal complications that result in fluorosis. Occurrence of fluoride in ground water has been mapped for the year 2000 and 2010 (Pre-monsoon). Map shows that in talukas of Ahmedabad, Amreli, Bhavnagar, Kachchh, and Surendranagar the concentrations have increased over the period of time. During 2000, there were 28 talukas that had recorded fluoride content to be greater than 1.5 mg/liter while in 2010, 27 talukas shows fluoride concentration to be above permissible level; of which there are 6 overlapping talukas showing greater concentration of fluoride in both the years- 2000 as well as 2010 (See Map 3). The average fluoride content in the year 2010 varies from 0.07 mg/ liter in Kaprada (Valsad) to 11.75 mg/litre in Dhandhuka (Ahmedabad). (See data table in annexure) A recent survey conducted by Water and Sanitation Management Organization (WASMO) during 2011 shows that there is a decrease in number of villages facing the problem of excessive fluoride in ground water from 4187 in 2003 to 1203 in 2011 (Pre-Monsoon data). Highest number of villages where ground water is unfit for use has been recorded by Kheda and Banaskantha with 282 and 219 villages respectively (See Chart 16).

Pre-Monsoon 2000 Pre-Monsoon 2010
Map 3-5 Occurrence of Fluoride Concentration in Ground Water (Comparison -May 2000 & May 2010)
Map 3-6 Taluqas showing fluoride content higher than permissible limits
Source: CGWB, 2010
Source: WASMO, 2011
0100200300400500600
Ahm
edab
adAm
reli
Anan
dBa
nask
anth
aBh
aruc
hBh
avna
gar
Daho
dDa
ngG
andh
inag
arJa
mna
gar
Juna
gadh
Khed
aKu
tch
Meh
sana
Nar
mad
aN
avsa
riPa
nchm
ahal
Pata
nPo
rban
dar
Rajk
otSa
bark
anth
aSu
rat
Sure
ndra
naga
rTa
piVa
doda
raVa
lsad
Fluoride Unfit Villages2003
Fluoride Unfit Villages2010
Figure 3-7 Fluoride Unfit Villages in Districts of Gujarat In many areas, fluoride content is more than three times the permissible limit. This causes fluorosis, which weakens the bones. Excessive draft of groundwater is associated with falling water tables, ecological disturbance and water pollution such as excess fluoride. The Case of North Gujarat In districts of North Gujarat especially in Ahmedabad, Banaskantha and Sabarkantha the fluoride content has reached an alarming proportion. It is only during the last 3-4 decades that high concentrations of fluoride in groundwater have been noticed in North Gujarat and assigned to health problems (Gupta et. al. 2005). The occurrence and development of endemic fluorosis has its roots to the high fluoride content in air, soil and water of which ground water is the major contributor. The concentration of fluoride in the ground water varies from 0.6 to 11.75 mg/l in Ahmedabad district, 0.17 to 2.00 mg/l in Banaskantha, 0.29 to 3.24 mg/l in Sabarkantha district. In 100 percent of the groundwater samples from Ahmedabad district contain fluoride above the permissible limit. 1.3.6 Initiatives for Fluoride Mitigation
Over the years, the Government of Gujarat has made considerable efforts to provide safe and assured drinking water to people. With a view to provide safe water to control and mitigate the Fluoride problem in the state, short-term and long-term measures are being implemented by the state government since 1985. Some of these measures are: 1. Regional village water supply schemes based on surface water for group of villages 2. Creation of 'Statewide Drinking Water Grid' based on surface sources, mainly Sardar Sarovar Canal Based water 3. Defluoridation based Nalgonda technique at community level 4. Defluoridation based on Nalgonda technique at household level 5. Fluorosis Surveillance system regular medical check-up and food grain analysis 6. Defluoridation by membrane separation and installation of Reverse Osmosis plant on trial basis Fluorosis Control Programme Gujarat is the first state to introduce fluorosis diagnostic facilities in medical college and district hospitals. In order to prevent and control Fluorosis, 32 units have been established for fluorine testing in water, urine and serum (Health and Family Welfare Department, GoG).
1.4 Status of Urban Water Supply
It is a great challenge on the part of the urban managers to focus on achieving sustainable access to water source and improved sanitation to meet the millennium development goals (MDG)

targets set for India. Achievement of the two important MDGs by India related to MDG 4 (reduced child mortality) and MDG 7 (ensure environmental sustainability) has more bearing on the capacity of adequate and safe water supplied to our citizens in the urban area. Access to safe water supply in the urban centre of the state has been discussed in the following section with respect to coverage, per capita supply, reliability of supply , and quality of water supply. Water supply data for 166 urban centers of the state with population above 15000 have been analyzed in the following section. 1.4.1 Coverage of Water Supply
The benchmark value, for coverage of water supply connection as per the guideline of Ministry of Urban Development (Handbook on Service level benchmarking, MoUD, GoI), is 100 Percent. It’s evident from the graph below, that, the coverage of water supply connection is 100% in merely 18 urban centres of Gujarat, which is about 11 % of the total number of urban centres in the state with population more than 15000. There are 40 urban centres which have coverage of less than 50%. Within this category maximum urban centre are from Class D.
Figure 3-8 Coverage of Water Supply Connection
Figure 3-9 Urban Centers with water supply coverage less than 50 Percent
40
63
45
18
0
10
20
30
40
50
60
70
< 50% Coverage 51 to 75 % Coverage 76 to 99 % Coverage 100% Coverage
Num
ber o
f Urb
an C
entr
es
10
3
10
17
0
5
10
15
20
Class A Class B Class C Class D
Num
ber o
f Urb
an C
entr
es
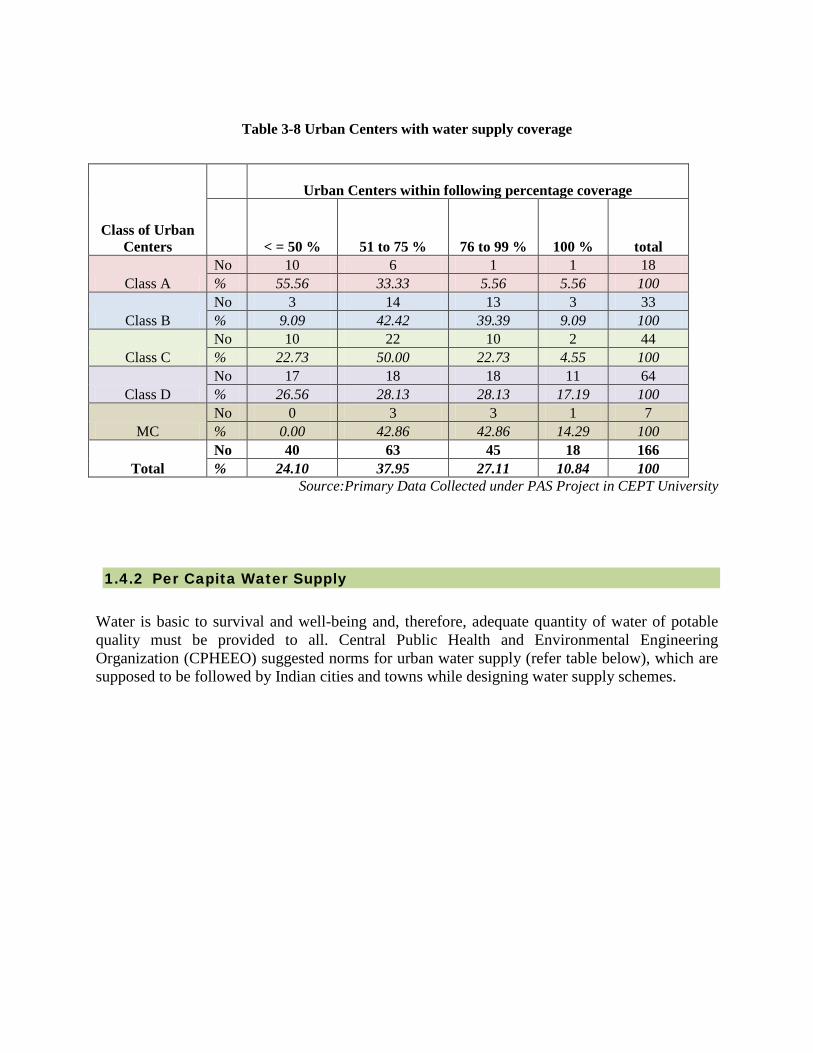
Table 3-8 Urban Centers with water supply coverage
Source:Primary Data Collected under PAS Project in CEPT University 1.4.2 Per Capita Water Supply
Water is basic to survival and well-being and, therefore, adequate quantity of water of potable quality must be provided to all. Central Public Health and Environmental Engineering Organization (CPHEEO) suggested norms for urban water supply (refer table below), which are supposed to be followed by Indian cities and towns while designing water supply schemes.
Class of Urban Centers
Urban Centers within following percentage coverage
< = 50 % 51 to 75 % 76 to 99 % 100 % total
Class A No 10 6 1 1 18 % 55.56 33.33 5.56 5.56 100
Class B No 3 14 13 3 33 % 9.09 42.42 39.39 9.09 100
Class C No 10 22 10 2 44 % 22.73 50.00 22.73 4.55 100
Class D No 17 18 18 11 64 % 26.56 28.13 28.13 17.19 100
MC No 0 3 3 1 7 % 0.00 42.86 42.86 14.29 100
Total No 40 63 45 18 166 % 24.10 37.95 27.11 10.84 100
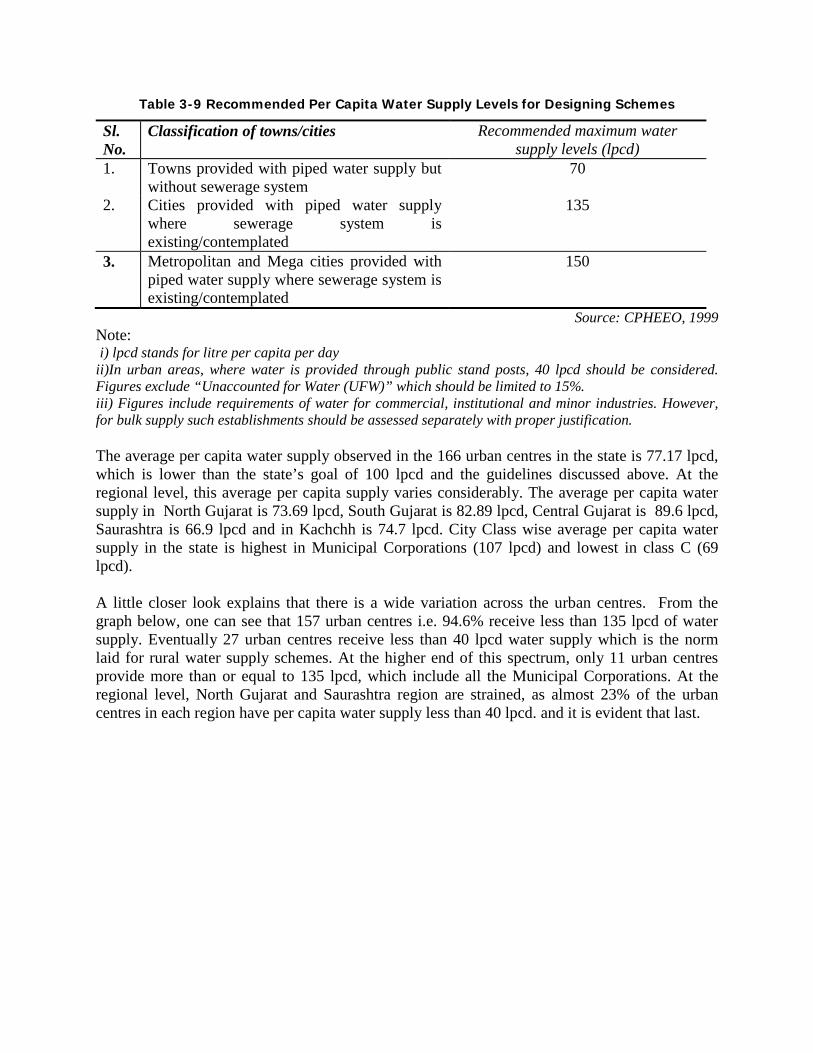
Table 3-9 Recommended Per Capita Water Supply Levels for Designing Schemes
Sl. No.
Classification of towns/cities Recommended maximum water supply levels (lpcd)
1. Towns provided with piped water supply but without sewerage system
70
2. Cities provided with piped water supply where sewerage system is existing/contemplated
135
3. Metropolitan and Mega cities provided with piped water supply where sewerage system is existing/contemplated
150
Source: CPHEEO, 1999 Note: i) lpcd stands for litre per capita per day ii)In urban areas, where water is provided through public stand posts, 40 lpcd should be considered. Figures exclude “Unaccounted for Water (UFW)” which should be limited to 15%. iii) Figures include requirements of water for commercial, institutional and minor industries. However, for bulk supply such establishments should be assessed separately with proper justification. The average per capita water supply observed in the 166 urban centres in the state is 77.17 lpcd, which is lower than the state’s goal of 100 lpcd and the guidelines discussed above. At the regional level, this average per capita supply varies considerably. The average per capita water supply in North Gujarat is 73.69 lpcd, South Gujarat is 82.89 lpcd, Central Gujarat is 89.6 lpcd, Saurashtra is 66.9 lpcd and in Kachchh is 74.7 lpcd. City Class wise average per capita water supply in the state is highest in Municipal Corporations (107 lpcd) and lowest in class C (69 lpcd). A little closer look explains that there is a wide variation across the urban centres. From the graph below, one can see that 157 urban centres i.e. 94.6% receive less than 135 lpcd of water supply. Eventually 27 urban centres receive less than 40 lpcd water supply which is the norm laid for rural water supply schemes. At the higher end of this spectrum, only 11 urban centres provide more than or equal to 135 lpcd, which include all the Municipal Corporations. At the regional level, North Gujarat and Saurashtra region are strained, as almost 23% of the urban centres in each region have per capita water supply less than 40 lpcd. and it is evident that last.

Figure 3-10 Per Capita Water Supply
Table 3-10 Class wise Per Capita Water Supply
Class of Urban
Centers
Urban Centers within following percentage Supply
< 40 lpcd 40 to 70 lpcd
71 to 134 lpcd
> = 135 lpcd total
Class A No 1 8 9 0 18 % 5.56 44.44 50 0 100
Class B No 7 7 19 0 33 % 21.21 21.21 57 0 100
Class C No 9 13 20 2 44 % 20.45 29.55 45.45 4.55 100
Class D No 10 22 28 4 64 % 15.63 34.38 43.57 6.25 100
MC No 0 1 2 4 7 % 0 14.29 28.57 57.14 100
Total No 27 51 18 10 166 % 16.27 30.72 46.99 6.02 100.00
Source:Primary Data Collected under PAS Project in CEPT University
Figure 3-11 Region Wise Per Capita Water Supply
27
51
77
11
0
20
40
60
80
100
< 40 lpcd 40 to 70 lpcd 71 to 134 lpcd > = 135 lpcdNum
ber o
f Urb
an C
entr
es
6 3 3 15 8
3 16
21 11
8
29
26
3 0
10
20
30
40
50
60
70
North Gujarat South Gujarat Central Gujarat Saurashtra Kachchh
< 40 lpcd 40 to 70 lpcd 71 to 134 lpcd > = 135 lpcd
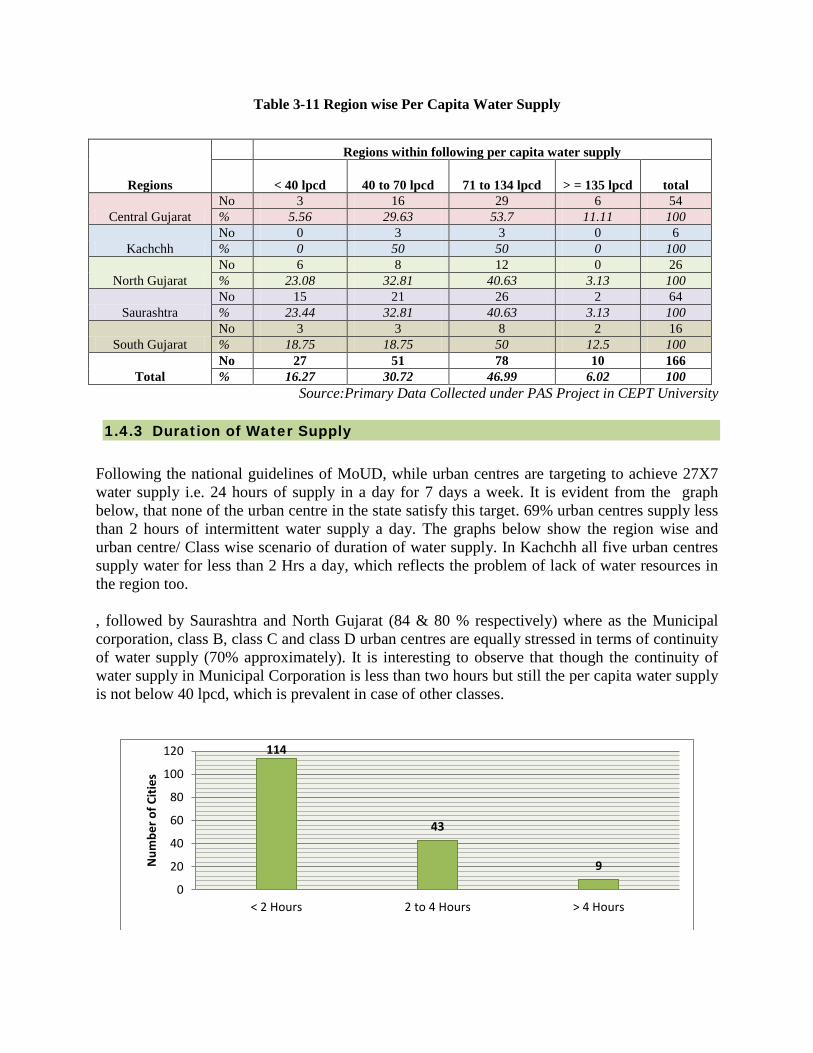
Table 3-11 Region wise Per Capita Water Supply
Source:Primary Data Collected under PAS Project in CEPT University 1.4.3 Duration of Water Supply
Following the national guidelines of MoUD, while urban centres are targeting to achieve 27X7 water supply i.e. 24 hours of supply in a day for 7 days a week. It is evident from the graph below, that none of the urban centre in the state satisfy this target. 69% urban centres supply less than 2 hours of intermittent water supply a day. The graphs below show the region wise and urban centre/ Class wise scenario of duration of water supply. In Kachchh all five urban centres supply water for less than 2 Hrs a day, which reflects the problem of lack of water resources in the region too. , followed by Saurashtra and North Gujarat (84 & 80 % respectively) where as the Municipal corporation, class B, class C and class D urban centres are equally stressed in terms of continuity of water supply (70% approximately). It is interesting to observe that though the continuity of water supply in Municipal Corporation is less than two hours but still the per capita water supply is not below 40 lpcd, which is prevalent in case of other classes.
114
43
9
0
20
40
60
80
100
120
< 2 Hours 2 to 4 Hours > 4 Hours
Num
ber o
f Citi
es
Regions
Regions within following per capita water supply
< 40 lpcd 40 to 70 lpcd 71 to 134 lpcd > = 135 lpcd total
Central Gujarat No 3 16 29 6 54 % 5.56 29.63 53.7 11.11 100
Kachchh No 0 3 3 0 6 % 0 50 50 0 100
North Gujarat No 6 8 12 0 26 % 23.08 32.81 40.63 3.13 100
Saurashtra No 15 21 26 2 64 % 23.44 32.81 40.63 3.13 100
South Gujarat No 3 3 8 2 16 % 18.75 18.75 50 12.5 100
Total No 27 51 78 10 166 % 16.27 30.72 46.99 6.02 100
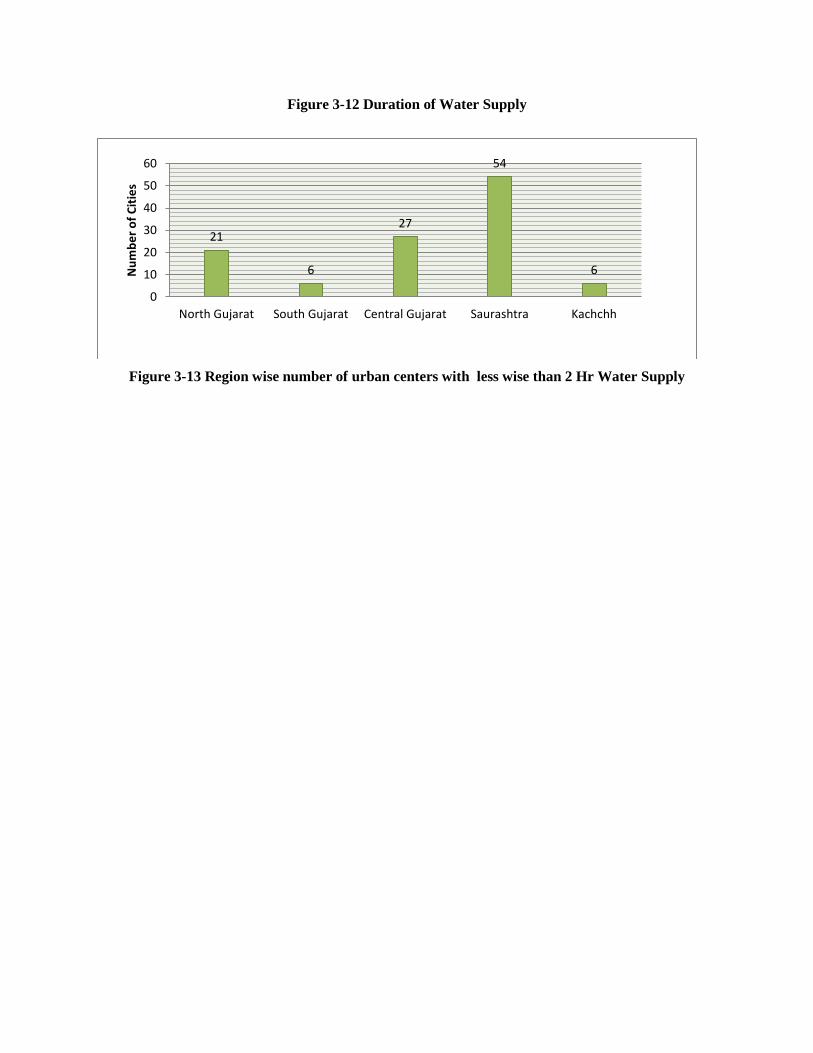
Figure 3-12 Duration of Water Supply
Figure 3-13 Region wise number of urban centers with less wise than 2 Hr Water Supply
21
6
27
54
6
0
10
20
30
40
50
60
North Gujarat South Gujarat Central Gujarat Saurashtra Kachchh
Num
ber o
f Citi
es

Table 3-12 Region wise Duration of Water Supply
Table 3-13 City Class wise Duration of Water Supply
1.4.4 Extent of Non Revenue Water (NRW)
It should be noted that actual supply of water reaching the consumer is however less due to the losses, which is commonly termed as Unaccounted for Water (UFW) or Non Revenue Water (NRW). One of the major problems in the water supply sector today is the high level of NRW.
Regions
Regions within following continuity of water supply
<2 Hours 2 to 4 Hours
> 4 Hours total
North Gujarat No 21 5 0 26 % 80.77 19.23 0 100
South Gujarat No 6 8 2 16 % 37.5 50 12.5 100
Central Gujarat No 27 20 7 54 % 50 37.04 12.96 100
Saurashtra No 54 10 0 64 % 84.38 15.63 0 100
Kachchh No 6 0 0 6 % 100 0 0 100
Total No 114 43 9 166 % 68.67 25.9 5.42 100
Source:Primary Data Collected under PAS Project in CEPT University
Class of Urban Centers
Urban Centers within following Continuity of Supply
<2 Hours 2 to 4 Hours
> 4 Hours Total
Class A No 9 6 3 18 % 50 33.33 16.67 100
Class B No 23 9 1 33 % 70 27.27 3.03 100
Class C No 32 10 2 44 % 73 22.73 4.55 100
Class D No 45 16 3 64 % 70 25 4.69 100
MC No 5 2 0 7 % 71 28.57 0 100
Total No 114 43 9 166 % 68.7 25.9 5.42 100.00
Source:Primary Data Collected under PAS Project in CEPT University

NRW includes both physical losses as well as revenue losses (which include theft of water and illegal connections). While the acceptable level is about 15 per cent (according to CPHEEO norms), many Indian cities experience NRW as high as 50 to 60 percent. NRW is also influenced by factors outside the control of the water utility such as the topography of the city, age of the network, length of the network per connection and water use per capita. It should be noted that the reduction in NRW to acceptable levels is vital for the financial sustainability of the water utility. From the graph below it is evident that in the state only 15 urban centres (9% approximately) achieve the norms. While about 79 urban centres (47.5%) have NRW value ranging from 16% to 50% which is the in the order of average of the country. But the most critical situation is of 72 cities (43.5%) where the data/ records are not available for NRW, which makes the situation dicey that weather the revenue is being collected or not.
Figure 3-14 Extent of Non Revenue Water (NRW)
Table 3-14 Non Revenue Water - Region wise
15
37
22 20
72
01020304050607080
<15 % 15 to 30% 30 to 40% 40 to 50% NA
Num
ber o
f Citi
es
Extent of Non - Revenue Water
Regions
Regions within following NRW
< 15 % 15 to 30 % 30 to 40 %
40 to 50 % > 50% total
Central Gujarat No 6 9 10 4 25 54 % 11 16 18.53 7.41 46.5 100
Kachchh No 0 2 2 0 2 6 % 0 33.33 33.33 0 33.33 100
North Gujarat No 4 8 4 3 7 26 % 15.38 30.7 15.38 11.54 26.92 100
Saurashtra No 3 14 5 9 33 64 % 4.7 21.87 7.81 14.06 51.56 100
South Gujarat No 2 4 1 4 5 16 % 12.5 25 6.25 25 31.25 100
Total No 15 37 22 20 72 166

Source:Primary Data Collected under PAS Project in CEPT University
% 9.03 22.28 13.25 12.05 43.37 100
Table 3-15 Non Revenue Water - Class wise
1.5 Over all Response of the State Government in Water Sector
1.5.1 Augmentation of Supply
The number of regional schemes managed by state government was very small until about 1980 (nine in 1970 and 43 in 1980, each covering three to seven villages). It jumped to 209 in 1990 and to 444 in 2000. The chart below shows that most of the schemes (60%) were implemented in Saurashtra and Kachchh, which corresponds to the problem of local water sources in these regions in terms of quantity and quality.
Class of Urban
Centers
Urban Centers within following Water Supply Connections in Slum Settlements (%)
< 20 %
20 to 30 %
30 to 40 %
40 to 50 % > 50% total
Class A
No 2 3 2 7 4 18 % 11.11 16.66 11.11 38.89 22.22 100.00
Class B
No 5 12 1 5 10 33 % 15.15 36.36 3.03 15.15 30.30 100.00
Class C
No 4 9 5 3 23 44 % 9.09 20.45 11.36 6.82 52.27 100
Class D
No 4 12 10 5 33 64 % 6.25 18.75 15.63 7.81 51.56 100.00
MC
No 0 1 4 0 2 7 % 0 14.85 57.14 0 28.57 100.0
Total No 15 37 22 20 72 166 % 9.03 22.28 13.25 12.05 43.37 100.00

Figure 3-15 Regionwise commissioning of RWSS over the time
Figure 3-16 Regionwise Percentage Share of RWSS
Source: Goswami Subhrangsu, 2011 1.5.2 Emergence of Narmada Water as a Long Term Solution
Looking to the severe depletion and degradation of water resources in the state, it was decided in the year 1990-91 (9th Plan) to use water from Narmada (i.e. Sardar Sarovar) to provide dependable water supply to the regions of Kachchh, Saurashtra and North Gujarat, covering 4,000 villages. The number increased to 8,215 villages and 135 towns in the late 1990s. In 2005 a revised Master plan for the project was prepared, which covers 9,633 villages and 131 towns from 17 districts. The main objectives of the project are as follows: To supply adequate and safe drinking water to the areas suffering from severe shortage of
water supply. To feed the regional water supply schemes, which are not providing adequate water supply
due to failure of their sources. To provide water supply to those regional schemes and individual (village) schemes which
provide poor quality of water supply due to various reasons. To supply potable water to those towns and villages which have excess salinity, excess
fluoride or excess nitrates in their water supply. To reduce out migration of people by ensuring drinking water and by promoting employment
in the areas suffering from water shortages.
Project Coverage: The Sardar Sarovar Canal based Drinking Water Pipeline Project is perhaps the biggest drinking water project in the world. As per the revised master plan this project will cover the whole of Saurashtra and Kachchh as well as parts of North Gujarat (Ahmedabad, Mehsana, Banaskantha, Sabarkantha, and Panchmahal). The capital cost of the project has been estimated to be Rs. 103.7 billion (2010 prices), which includes investments in trunk mains, water treatment plants, pumping machinery, civil works and water distribution. The project includes 48 bulk schemes, 123 distribution groups and a 3,250 km long pipeline network.
-101030507090
110130150
North Gujarat
South Gujarat
Saurashtra
Kachch
Upto 2000
Upto 1990
Upto 1980
Upto 1970
North Gujarat21%
South Gujarat19%
Saurashtra32%
Kachch28%

The project is extremely important for Gujarat, as it will cover 53.3% villages and 54% urban centers of the state. It will cover 100% villages in Ahmedabad, Amreli, Bhavnagar, Gandhinagar, Jamnagar, Junagadh, Kachchh, Porbandar and Surendranagar districts. Similarly all towns are proposed to be covered in Ahmedabad, Amreli, Bhavnagar, Jamnagar, Junagadh, Kachchh, Patan, Porbandar, Rajkot and Surendranagar.
Table 3-16 Districtwise Coverage of Villages Master Plan / Towns in Revised
Sr. No. Districts
Number of Villages in the district
Villages covered in the Master Plan Number
of Towns in the district
Towns covered in the Master Plan
Number of villages
Percentage of Villages
Number of towns
Percentage of Towns
1 Ahmedabad 546 546 100.0 25 25 100.0 2 Amreli 615 615 100.0 8 8 100.0 3 Anand 350 0 0.0 12 0 0.0 4 Banaskantha 1,244 816 65.6 6 2 33.3 5 Bharuch 657 0 0.0 8 0 0.0 6 Bhavnagar 790 790 100.0 13 13 100.0 7 Dahod 693 0 0.0 4 0 0.0 8 Dangs 311 0 0.0 0 0 0.0 9 Gandhinagar 291 291 100.0 10 4 40.0 10 Jamnagar 698 698 100.0 16 16 100.0 11 Junagadh 923 923 100.0 12 12 100.0 12 Kachchh 886 886 100.0 8 8 100.0 13 Kheda 612 65 10.6 8 0 0.0 14 Mehsana 593 464 78.2 8 7 87.5 15 Narmada 552 78 14.1 3 0 0.0 16 Navsari 374 0 0.0 9 0 0.0 17 Panchmahal 1,201 408 34.0 6 3 50.0 18 Patan 517 421 81.4 5 5 100.0 19 Porbander 182 182 100.0 5 5 100.0 20 Rajkot 844 844 100.0 10 10 100.0 21 Sabarkantha 1,372 956 69.7 8 6 75.0 22 Surat 722 0 0.0 15 0 0.0 23 Tapi 445 0 0.0 3 0 0.0 24 Surendranagar 650 650 100.0 7 7 100.0 25 Vadodara 1,548 0 0.0 16 0 0.0 26 Valsad 450 0 0.0 17 0 0.0 Total 18,066 9,633 53.3 242 131 54.1
Source: GWSSB, 2011
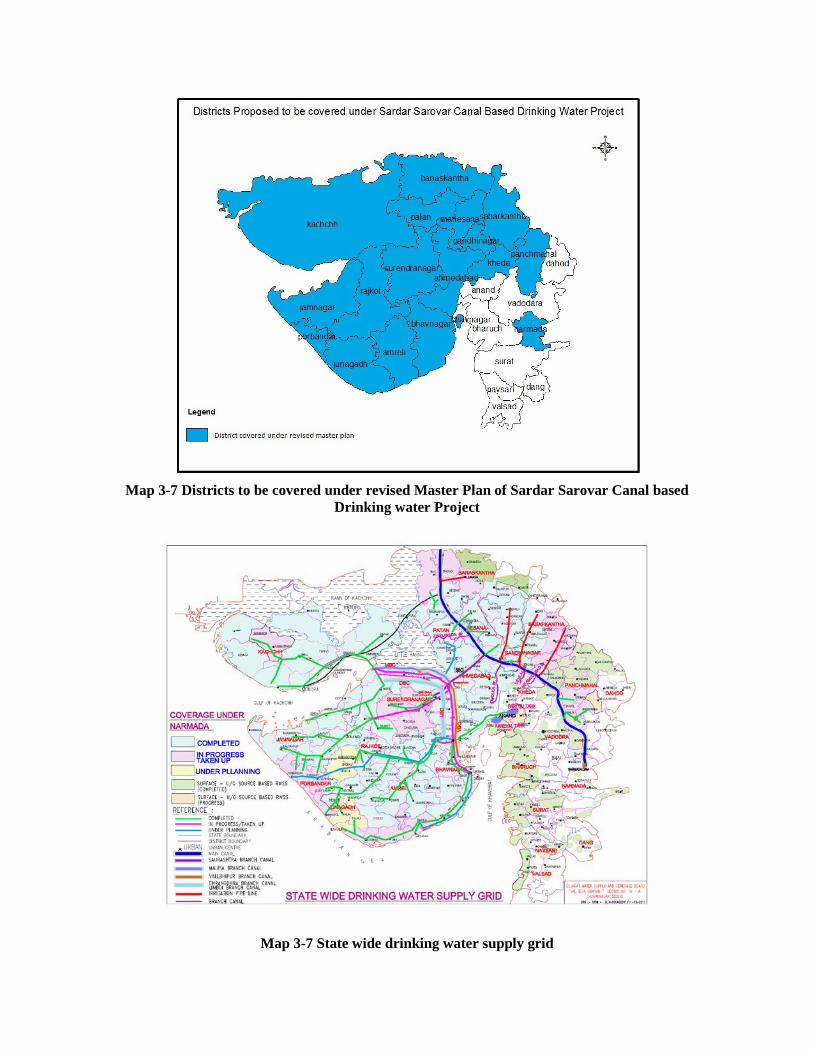
Map 3-7 Districts to be covered under revised Master Plan of Sardar Sarovar Canal based
Drinking water Project
Map 3-7 State wide drinking water supply grid

Progress so far: By the end of February 2012 it has covered 7,071 villages, i.e. 73.4 % villages against proposed coverage, and 114 towns i.e. 87% towns against the proposed coverage. This is a commendable achievement. 2,170 km pipeline has also been laid (which is about 67% of the proposed 3,250 km pipeline). The following graph shows the district wise coverage achieved till October 2010. It is evident that 100% towns are already covered in Ahmedabad, Amreli, Banaskantha, Bhavnagar, Gandhinagar, Jamnagar, Kachchh, Mehsana and Patan district. On the other hand 100% villages have been covered in Bhavnagar, Gandhinagar, Kheda, Mehsana and Patan.
Figure 3-17 Actual coverage against proposed coverage as on February 2012
Table 3-17 Actual Coverage of Towns and Villages till February 2012
District Number of villages to be covered under Narmada water supply
Number of Villages already covered
Percentage of Villages already covered
Number of Towns to be covered under Narmada water supply
Number of Towns already covered
Percentage of towns covered under Narmada water supply
Ahmedabad 546 524 96.0 25 25 100.0 Amreli 615 502 81.6 8 8 100.0 Banaskantha 816 659 80.8 2 2 100.0 Bhavnager 790 790 100.0 13 13 100.0 Gandhinager 291 291 100.0 4 4 100.0 Jamnager 698 668 95.7 16 16 100.0 Junagadh 923 360 39.0 12 9 75.0 Kachchh 886 821 92.7 8 8 100.0 Kheda 65 65 100.0 0 0 0.0
0.0
25.0
50.0
75.0
100.0
Percentage of Villages covered Percentage of towns covered
Mehsana 464 464 100.0 7 7 100.0 Narmada 78 78 100.0 0 0 0.0 Panchmal 408 136 33.3 3 2 66.7 Patan 421 421 100.0 5 5 100.0 Porbander 182 11 6.0 5 0 0.0 Rajkot 844 541 64.1 10 6 60.0 Saberkantha 956 271 28.3 6 3 50.0 Surendranager 650 469 72.2 7 6 85.7 Total 9633 7071 73.4 131 114 87.0
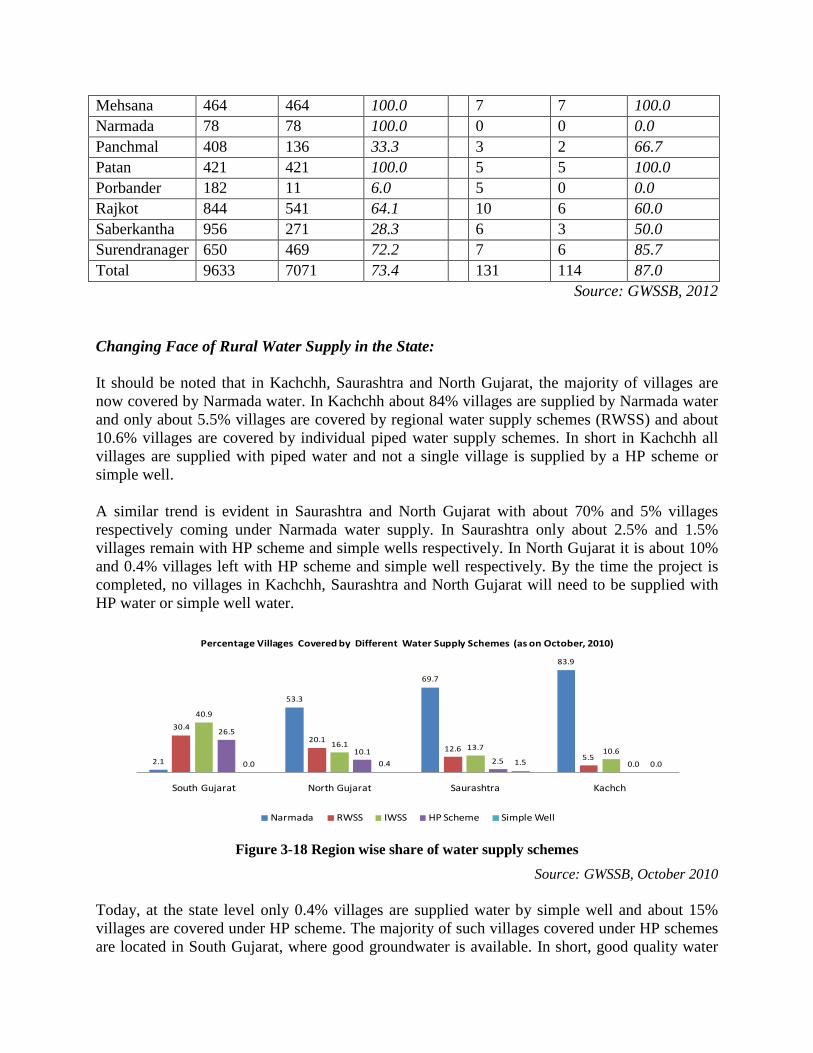
Source: GWSSB, 2012 Changing Face of Rural Water Supply in the State: It should be noted that in Kachchh, Saurashtra and North Gujarat, the majority of villages are now covered by Narmada water. In Kachchh about 84% villages are supplied by Narmada water and only about 5.5% villages are covered by regional water supply schemes (RWSS) and about 10.6% villages are covered by individual piped water supply schemes. In short in Kachchh all villages are supplied with piped water and not a single village is supplied by a HP scheme or simple well. A similar trend is evident in Saurashtra and North Gujarat with about 70% and 5% villages respectively coming under Narmada water supply. In Saurashtra only about 2.5% and 1.5% villages remain with HP scheme and simple wells respectively. In North Gujarat it is about 10% and 0.4% villages left with HP scheme and simple well respectively. By the time the project is completed, no villages in Kachchh, Saurashtra and North Gujarat will need to be supplied with HP water or simple well water.
Figure 3-18 Region wise share of water supply schemes
Source: GWSSB, October 2010 Today, at the state level only 0.4% villages are supplied water by simple well and about 15% villages are covered under HP scheme. The majority of such villages covered under HP schemes are located in South Gujarat, where good groundwater is available. In short, good quality water
2.1
53.3
69.7
83.9
30.420.1
12.65.5
40.9
16.1 13.7 10.6
26.5
10.12.5 0.00.0 0.4 1.5 0.0
South Gujarat North Gujarat Saurashtra Kachch
Percentage Villages Covered by Different Water Supply Schemes (as on October, 2010)
Narmada RWSS IWSS HP Scheme Simple Well
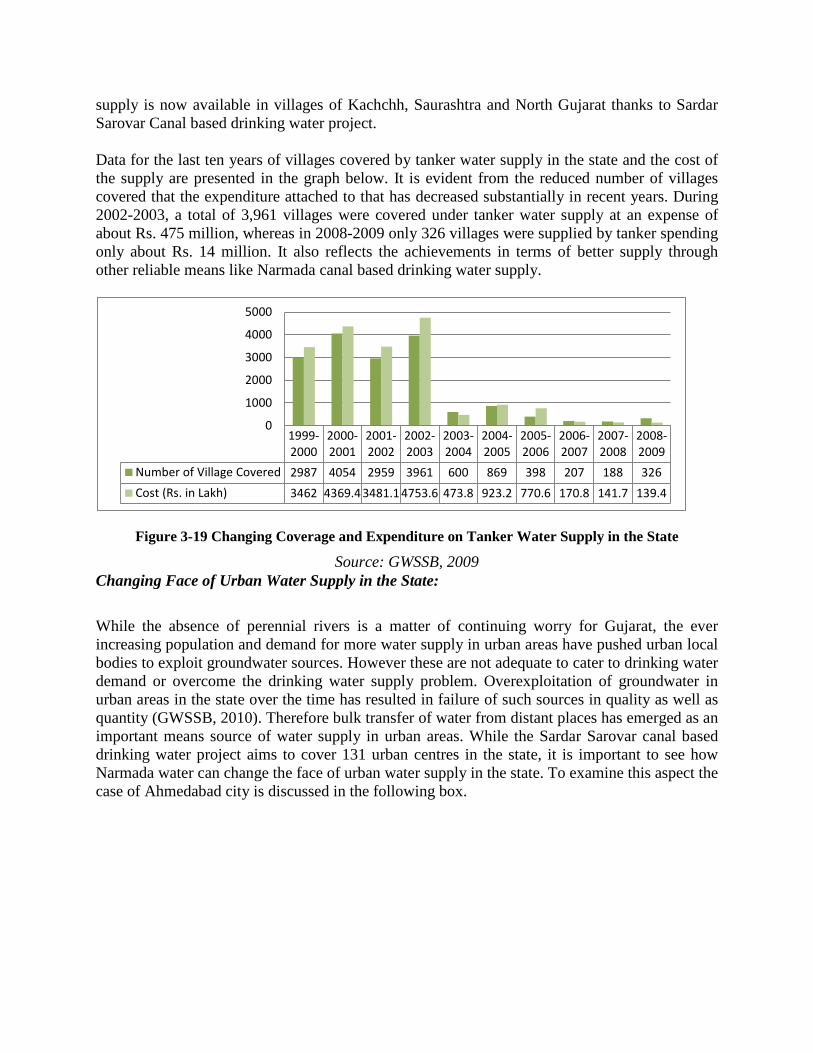
supply is now available in villages of Kachchh, Saurashtra and North Gujarat thanks to Sardar Sarovar Canal based drinking water project. Data for the last ten years of villages covered by tanker water supply in the state and the cost of the supply are presented in the graph below. It is evident from the reduced number of villages covered that the expenditure attached to that has decreased substantially in recent years. During 2002-2003, a total of 3,961 villages were covered under tanker water supply at an expense of about Rs. 475 million, whereas in 2008-2009 only 326 villages were supplied by tanker spending only about Rs. 14 million. It also reflects the achievements in terms of better supply through other reliable means like Narmada canal based drinking water supply.
Figure 3-19 Changing Coverage and Expenditure on Tanker Water Supply in the State
Source: GWSSB, 2009 Changing Face of Urban Water Supply in the State:
While the absence of perennial rivers is a matter of continuing worry for Gujarat, the ever increasing population and demand for more water supply in urban areas have pushed urban local bodies to exploit groundwater sources. However these are not adequate to cater to drinking water demand or overcome the drinking water supply problem. Overexploitation of groundwater in urban areas in the state over the time has resulted in failure of such sources in quality as well as quantity (GWSSB, 2010). Therefore bulk transfer of water from distant places has emerged as an important means source of water supply in urban areas. While the Sardar Sarovar canal based drinking water project aims to cover 131 urban centres in the state, it is important to see how Narmada water can change the face of urban water supply in the state. To examine this aspect the case of Ahmedabad city is discussed in the following box.
1999-2000
2000-2001
2001-2002
2002-2003
2003-2004
2004-2005
2005-2006
2006-2007
2007-2008
2008-2009
Number of Village Covered 2987 4054 2959 3961 600 869 398 207 188 326Cost (Rs. in Lakh) 3462 4369.4 3481.1 4753.6 473.8 923.2 770.6 170.8 141.7 139.4
0
1000
2000
3000
4000
5000

1.5.3 Scarcity Master Plans
At times the increased frequency and intensity of droughts, which were accompanied by shortages of drinking water, pushed the state to look for quick solutions to the problem. Preparation of scarcity master plan is one such approach adopted by the state. In the scarcity
Changing Scenario of Water Supply in the City of Ahmedabad:
As can be seen in the graph below, During the period 1970-1980 the consumption of groundwater in the city reached 87% of its total water supply. This was because the surface water from the river was rapidly diminishing. However, with concrete steps taken by AMC to harness surface water sources (Mahi and Narmada Water), the utilisation of groundwater has been substantially reduced. Over the last 5 years dependency on groundwater has drastically reduced with only 5-10% groundwater utilised. This has directly impacted the health of citizens in terms of decreasing water borne diseases in the city.
Figure 3-20 Decreasing Share of Groundwater Supply in the City
Source: AMC, 2010
It is expected that by 2010-11 AMC will completely stop the use of groundwater. The multifold benefits of this transformation are already visible: • The existing groundwater quality indicates presence of TDS of 1300 mg/l. Hence, by stopping
the groundwater resources, the population will get water with TDS of about only 180 mg/l. This will prevent various diseases related to digestive system, kidneystone, heart problems, blood pressures etc.
• Electrical energy will be saved by stopping the pumping of groundwater • Groundwater table in this area will rise and hence the quality of groundwater will improve. Thus,
groundwater sources can be utilised in case of emergencies, water scarcity, breakdown in present supply etc (AMC, 2010)
years many surface water sources in the state become dry. Even some of the small and medium dams start drying up from September. Slowly the larger dams also dry up in between December and January. Thus in almost every scarcity year the state government prepared a scarcity master plan. The major components of the crisis management are as follows: Feeding new and old pipelines (where sources have dried up) by drilling emergency bores
and tube wells, whenever possible Transferring water to problem areas by water tankers, water trains3 Drilling bores, tube wells etc. to access water from deeper aquifers for local population,
whenever possible.
1.5.4 Technological Interventions
The state government has launched several quality improvement programmes to improve quality of drinking water in problem areas. The major programmes are desalinisation and defluoridation. Recently Gujarat government is encouraging investments by large corporations such as Welspun, Adani Group etc in big desalination plants in Kacchh, Jamnagar, Pipavav so as to meet water industrial as well as municipal water demand.
1.5.5 Legal Interventions
Enactment of Ground Water Bill to regulate and control the development of ground water: 3 In May 2000, to cope with the severe scarcity in the Jamnagar district, the state government decided to provide water through Water Train from Kodinar to Hapa about (400 km). About 600,000 gallons of water was supplied everyday from the month of May 2000 for two months. The cost of the water train was 80 million and the maintenance cost was about 7 million per month.
Dew Harvesting The prevailing view among the scientists in India (hydrologists, engineers, meteorologists) is that the dew is not of any utility to humans because of low quantity and infrequent occurrence. This view may not be as true for areas near coasts as for the hinterland (Girja Sharan, 2007). Study done by Prof. Girja Sharan, at three locations along the Gujarat coast - Panandhro, Kothara and Mithapur - have shown that (a) dew occurs over a season of eight months - October to May, the quantity and frequency of occurrence are higher in summer than in winter months (b) number of dew nights are large, varying from 95 to 105 (c) the amount of dew water collected by specially made plastic condensers was equivalent of 20 mm, which in arid areas is appreciable. It is also argued that, dew is less in quantity than the rainfall but it is more uniformly distributed over the season which is twice as long as the rainy season in Kutch. In short, If suitable devices are deployed, as has been demonstrated by Prof. Girja Sharan, dew water can become a significant supplementary source for human use, in the coastal villages of Saurashtra and Kachchh.

Gujarat Ground Water Authority (GGWA) has been constituted vide Government of Gujarat, notification No. GWR/1095/61/I-1/J-1 dated 19.09.2001 for control and regulation of ground water resources. The draft Bill is under process of finalization and suitable legislation will be enacted shortly. Inclusion of Roof Top Rain Water Harvesting (RTRWH) in building by laws: Metropolitan Areas have notified rules under which no new building plan is approved without corresponding rainwater harvesting structure. The Department of Roads & Buildings, Government of Gujarat, has been directed to ensure that all major Govt. constructions including educational institutions had adequate rainwater harvesting facilities. The Urban Development and Urban Housing Department has issued necessary orders under Gujarat Town Planning Act, 1976 to incorporate the rules for RWH. 1.5.6 Other Statelevel Initiatives
Following the mission of the Board, to ensure sustainable water supply and sanitation services in rural areas of Gujarat state, GWSSB has implemented several schemes over the time. These initiatives show the response of state government towards better services in terms of quality and quantity of water supply and also to accomplish basic health and hygiene levels leading to socio – economic development, community harmony and peace in the state as a whole. Couple of such initiatives are discussed in this section below. Minimum Needs Programme: The Minimum Needs Programme is implemented by State Government to meet with the drinking water requirement. Earlier water was supplied at the rate of 40 LPCD. Now it is enhanced to 70 LPCD. Rural water supply schemes are being framed, formulated and implemented by state government through Gujarat Water Supply and Sewerage Board (GWSSB), Gujarat Water Infrastructure Limited (GWIL) and Water And Sanitation Management Organization (WASMO). Under MNP, Rural Water Supply Scheme comprises of drinking water source, pumping main, pumping machinery, storage in the form of underground sump, elevated service reservoir, distribution mains, stand post and cattle trough. National Rural Drinking Water Programme: The Rural Water Supply (RWS) sector has now entered the fourth phase with major emphasis on ensuring sustainability of water availability in terms of potability, adequacy, convenience, affordability and equity while also adopting decentralized approach involving PRIs and community organizations. Adoption of appropriate technology, revival of traditional systems, conjunctive use of surface and ground water, conservation, rain water harvesting and recharging of drinking water sources have been emphasised in the new approach.
Sagar Khedu Development Programme: This scheme started in the year 2007 and still is being implemented. Under this scheme, coastal villages of Gujarat were to be provided with pure and drinkable water. Tribal Area Sub Plan: The programme under the water supply sub-sector envisages the provision of the safe drinking water facilities to population from tribal areas in the state. Under Rural Water Supply Programme, various programmes like Hand pumps, Mini pipe, Piped water supply schemes (Individual or multi villages) are being taken up according to the technical feasibility of drinking water source. Various activities under rural water supply programme are being taken up under tribal area are briefed below.
a) Hand Pump: A total number of 1,11,543 hand pumps are installed in tribal areas as on 12/2007 ending .
b) Mini Pipe: By end of December, 2007, 1186 mini pipe schemes are completed. c) Regional Water Supply Scheme: 54 Rural Regional Water Supply Schemes covering
872 habitations are completed. Completed rural regional water supply schemes are operated and maintained by GWSSB. and 21 schemes covering 2740 habitations are under progress.
d) Sujalam Suphalam Yojana: The State government has identified 10 worst water scare
districts of North Gujarat, Central Gujarat, Saurashtra and Kutch which are being covered under the Sujalam Suphalam Yojana (SSY). These districts are Ahmedabad, Patan, Banaskantha, Gandhinagar, Mehsana, Sabarkantha, Dahod, Panchmahals, Surendranagar and Kutch. Sujalam Suphalam Yojana is under implementation, in which 506 tribal habitations are planned to be covered with sustainable drinking water source. Out of which 188 habitations are covered.
e) Integrated Tribal Development Programme: Under this programme, backward areas
of tribal like, 25 villages of Vansada taluka( Dist : Navsari ) and 30 villages of Dharampur taluka , 45 villages of Kaparada taluka (Dist : Valsad ) aggregating to 100 villages are taken up under community managed water supply and sanitation programme.
f) Swajaldhara/Sector Reform Programme: It is planned to provide water through piped
infrastructure in tribal areas. The in-village water supply facilities are provided through WASMO under the principles of Swajaldhara and Sector Reform, in which 90% of estimated cost is borne by Government of India/ Government of Gujarat and rest 10% is taken from local body. The schemes are planned, implemented and maintained and operated by Pani Samities.
Scheduled Caste Sub Plan: The schedule caste sub plan (SCSP) for the sub sector of water supply envisages providing drinking water facilities to schedule caste localities in rural areas. Under the SCSP, the water supply facilities are provided in the form of hand pump and piped water supply scheme, according to the requirement from village water supply scheme, pipeline is extended and water supply components like underground sump, stand post, cattle trough are
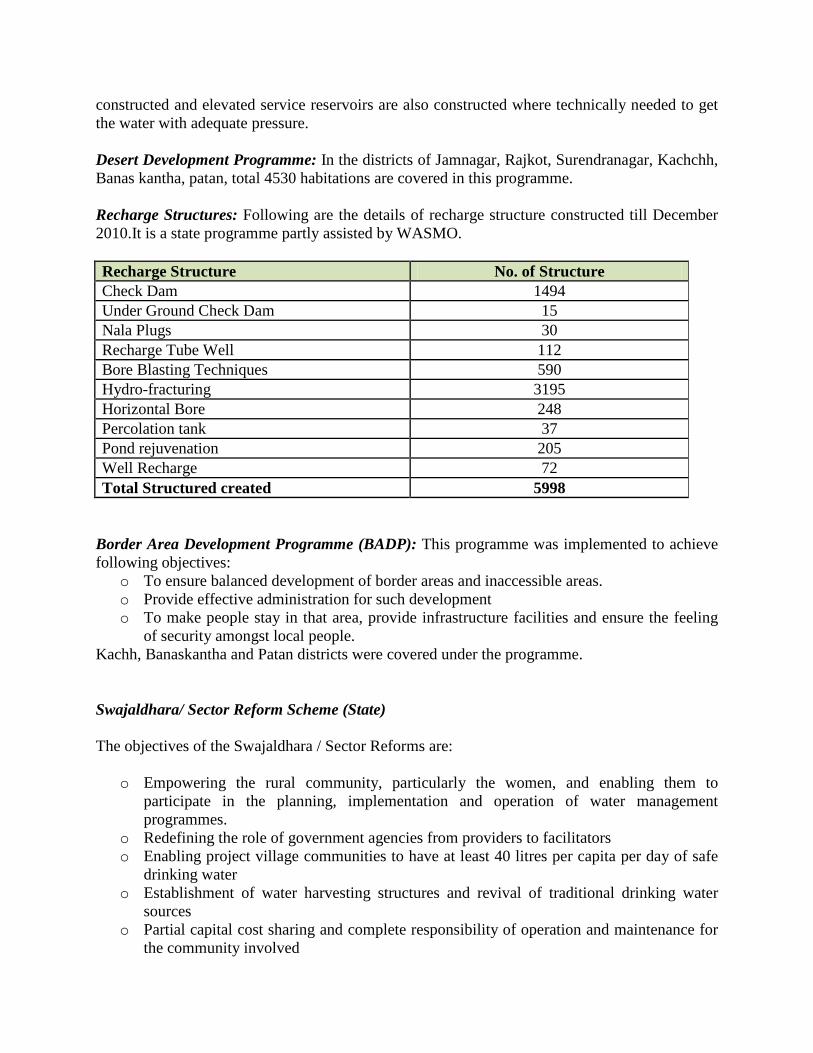
constructed and elevated service reservoirs are also constructed where technically needed to get the water with adequate pressure. Desert Development Programme: In the districts of Jamnagar, Rajkot, Surendranagar, Kachchh, Banas kantha, patan, total 4530 habitations are covered in this programme. Recharge Structures: Following are the details of recharge structure constructed till December 2010.It is a state programme partly assisted by WASMO. Recharge Structure No. of Structure Check Dam 1494 Under Ground Check Dam 15 Nala Plugs 30 Recharge Tube Well 112 Bore Blasting Techniques 590 Hydro-fracturing 3195 Horizontal Bore 248 Percolation tank 37 Pond rejuvenation 205 Well Recharge 72 Total Structured created 5998
Border Area Development Programme (BADP): This programme was implemented to achieve following objectives:
o To ensure balanced development of border areas and inaccessible areas. o Provide effective administration for such development o To make people stay in that area, provide infrastructure facilities and ensure the feeling
of security amongst local people. Kachh, Banaskantha and Patan districts were covered under the programme. Swajaldhara/ Sector Reform Scheme (State) The objectives of the Swajaldhara / Sector Reforms are:
o Empowering the rural community, particularly the women, and enabling them to participate in the planning, implementation and operation of water management programmes.
o Redefining the role of government agencies from providers to facilitators o Enabling project village communities to have at least 40 litres per capita per day of safe
drinking water o Establishment of water harvesting structures and revival of traditional drinking water
sources o Partial capital cost sharing and complete responsibility of operation and maintenance for
the community involved
The reform process started as a pilot project in 67 districts of the country, including three in Gujarat - Surat, Rajkot and Mehsana. After seeing the public response and the success of the sector reform, the Swajaldhara programme was introduced on December 25, 2002. In June 2003 revised guidelines were issued taking into account the experiences obtained from the pilot districts. From then the Swajaldhara programme has two dharas or streams. The first, Swajaldhara - I, is directed at gram panchayats, groups of gram panchayats and intermediate panchayats at block or taluka level. Swajaldhara - II is directed at districts. In Gujarat, WASMO became the State Water and sanitation Mission (SWSM) charged with coordination and monitoring of the Swajaldhara programme. At present 13 Gujarat districts are parts of the national Swajaldhara programme, while 11 others are covered under Sector Reforms Programme (State). Kutch district is exclusively covered by the ERR Project.