Embed Size (px)
Citation preview

1
11 April 2018
ASOS plc
Global Online Fashion Destination
Interim Results for the six months to 28 February 2018
Summary financial results
£m1
Six months to 28 February
2018
Six months to 28 February
2017
Change
CCY2 Change
Group revenues3 1,158.1 911.5 27% 25% Retail sales 1,131.3 889.2 27% 26% UK retail sales 414.5 340.8 22% 22% International retail sales 716.8 548.4 31% 28% Gross profit 569.4 440.1 29% Retail gross margin 48.0% 47.0% 100bps Gross margin 49.2% 48.3% 90bps Profit before tax 29.9 27.3 10% Diluted earnings per share 29.2p 26.3p 11% Cash and cash equivalents 37.7 154.3 (76%)
1All numbers subject to rounding throughout this document, 2Constant currency is calculated to take account of hedged rate movements on hedged sales and spot rate movements on unhedged sales, 3Includes retail sales, delivery receipts and third party revenues
Results summary • Retail sales grew at +27% on a reported basis and +26% on a constant currency basis • Strong growth across both UK, +22%, and international territories, +31%, (constant currency +28%) • Retail gross margin up 100bps • PBT up 10% at £29.9m in line with guided H1:H2 split • Continued strong customer engagement: active customers4 +17%, average basket value +2%, order frequency5 +8% • Total orders placed 29.9m, +28% year on year. First half site visits exceeded 1 billion for the first time • Euro hub phase two progressing well, US hub phase one opening early: building towards £4 billion of net sales
• Cash balance of £37.7m reflecting working capital and capex investment
Guidance and medium term outlook
• No change to FY18 reported sales or EBIT guidance; c.25-30% and c.4% margin respectively • Capex guidance increased to £230-£250m in FY18 supporting strong momentum in business • Medium term reported sales growth guidance remains unchanged at c.20-25% p.a. with a c.4% EBIT margin Nick Beighton, CEO, commented:
“These results show strong trading at the same time as we are making substantial investment in our future. Our customer
engagement is going from strength to strength and we’ve achieved more than a billion site visits for the first time.
Alongside our investment in our people and our technology, we are accelerating investment in our distribution and
logistics, laying the foundation for £4 billion of net sales, a further step in building ASOS into the world’s number one
destination for fashion loving 20-somethings.”
4Defined as having shopped in the last twelve months as at 28 February 2018, 5Calculated as last twelve months’ total orders divided by active customers

2
Investor and analyst meeting:
There will be a meeting for analysts that will take place at 9.30am today, 11 April 2018, at Numis Securities, 10
Paternoster Row, London EC4M 7LT. Photo ID and security checks will be required so please ensure prompt arrival. A
webcast of the meeting will be available both live and following the meeting at www.asosplc.com. Please register your
attendance in advance with Tom Berger at Instinctif Partners on either 020 7457 2834 or [email protected].
For further information:
ASOS plc Tel: 020 7756 1000 Nick Beighton, Chief Executive Officer
Greg Feehely, Director of Investor Relations Website: www.asosplc.com/investors
Instinctif Partners
Tel: 020 7457 2020
Matthew Smallwood / Justine Warren / Tom Berger JPMorgan Cazenove (Nominated Advisor)
Tel: 020 7742 4000
Michael Wentworth-Stanley / Bill Hutchings
Numis Securities
Tel: 020 7260 1000
Alex Ham / Luke Bordewich
Forward looking statements:
This announcement may include statements that are, or may be deemed to be, "forward-looking statements" (including words such as "believe", "expect", "estimate", "intend", "anticipate" and words of similar meaning). By their nature, forward-looking statements involve risk and uncertainty since they relate to future events and circumstances, and actual results may, and often do, differ materially from any forward-looking statements. Any forward-looking statements in this announcement reflect management's view with respect to future events as at the date of this announcement. Save as required by applicable law, the Company undertakes no obligation to publicly revise any forward-looking statements in this announcement, whether following any change in its expectations or to reflect events or circumstances after the date of this announcement.
Background note
ASOS is a global fashion destination for 20-somethings, selling cutting-edge fashion and offering a wide variety of fashion-related content, making ASOS.com the hub of a thriving fashion community. ASOS sells over 87,000 branded and ‘ASOS Design’ products through localised app and mobile/ desktop web experiences, delivering from fulfilment centres in the UK, US and Europe. ASOS tailors the mix of ASOS design (our in house designed label), global and local brands sold through our own channels to deliver a locally relevant product offer. Our global propositions help bring our amazing product to nearly every country in the world and we serve customers globally with increasingly tailored local experiences: Relevant languages, payment methods and delivery and return options. You can currently shop ASOS in over 200 markets, in 6 major global languages, using an ever greater number of different global payment methods, with hundreds of local delivery and returns options from pick and drop off networks in Italy to Next Day delivery to home in the Netherlands. We aim to offer all our global customers a truly frictionless experience.
ASOS’s websites attracted 156.9m visits during February 2018 (February 2017: 127 million) and as at 28 February 2018
had 16.5m active customers1 (28 February 2017: 14.1m), of which 5.5m were located in the UK and 11.0m were located
in international territories (28 February 2017: 5.0m in the UK and 9.1m internationally).
1Defined as having shopped in the last twelve months as at 28 February 2018

3
ASOS plc (“the Group”)
Global Online Fashion Destination
Interim Results for the six months to 28 February 2018
Summary
ASOS reports further progress with a strong trading performance for the six months to 28 February 2018. The Group
delivered retail sales growth of 27% to £1,131.3m (H1 2017: £889.2m), once again driven by strong product and
proposition improvements. Profit before tax grew by 10% to £29.9m (H1 2017: £27.3m). Retail gross margin increased
by 100bps to 48.0% (H1 2017: 47.0%).
Performance continued to be strong in the UK at 22% sales growth with active customer growth of 10% to 5.5m. EU
retail sales grew 32% in constant currency with active customers growing 26% to over 6.3m. US sales grew 27% in
constant currency with active customers growing 10% to 2.2m. ROW sales grew 24% in constant currency with active
customers growing 19% to 2.5m. For the first time, ASOS had over 1 billion site visits during the first half year.
The level of growth over the recent years remains at the top of our medium term planning assumptions and we need to
invest more quickly in our business to support this momentum. We are accelerating some of our capital investment
projects – notably in our distribution and logistics – around the world. Having invested just over £95m of capex in the
first half, total capex is set to increase to between £230m to £250m in both this financial year (FY18) and next (FY19)
as we build towards £4 billion of net sales capacity. Our banking facilities were put in place five years ago and we are
currently finalising a £150m revolving credit facility during this period of intense investment.
During the half we also made significant working capital investment of £82.5m, largely in inventory and trade payables.
The former (£46.7m, +14.4%) reflects the growth in our business, improved product availability, and inventory in
multiple distribution centres to fulfil our global customer service promise. The decrease in trade and other payables
broadly reflects the position last August which was approximately £40m higher than normal due to slower payments
ahead of the planned introduction of our new finance system.
Our capital investment and these movements in working capital resulted in our cash balance of £37.7m at the half year
end. Taking into account our capital investment plans and free cash generation through the second half, cash balances
at the full year are expected to be at a broadly similar level to that at the half year.
Improvements to the customer proposition continued at pace, with almost 100 delivery solutions improvements and
1,200 tech releases made in the last six months. Our continuous product evolution saw 115 new brands added, whilst a
similar number were edited out. We created a more localised site experience for over 200 countries with the build of
new ‘Rest of Europe’, ‘Rest of World’ and UK sites. The next six months will see the addition of two new language specific
sites as we maintain momentum in localising experiences globally.
There is no change to either sales or EBIT guidance for both the financial year and the medium term. Our mission
remains to be the world’s number one destination for fashion loving 20-somethings. The apparel market continues to
undergo significant channel shift and ASOS market shares remain relatively modest around the world, offering significant
opportunities for continuing growth in the years to come.
In pursuing our mission to be the favourite destination for the world’s fashion conscious 20-somethings, we continue to
focus on our four defendable pillars through which we differentiate our brand: our Purpose, our Product, our Proposition
and our People.
Our Purpose
The ASOS Purpose is to ‘give you the confidence to be whoever you want to be’. This underpins the product and
proposition we present, the way we do business, as well as the way we interact and engage with our customers.
Continued investments are enabling strong engagement levels across our customer base. Site visits increased by 25%
year-on-year; average order frequency improved by 8%; average basket value increased by 2% alongside a 10bps
improvement in conversion. Active customers are now at 16.5m, representing a 17% increase since last year. We now
have twice as many customers outside the UK as in our home market.

4
We continue to engage with our customer demographic in a range of ways, such as a focus on students with a specific
discount proposition, as well as an increasing share across expanding category segments such as Activewear and Face
+ Body, supported by highly visible brand campaigns.
We maintained investment in relevant, emerging content formats including Instagram Stories and cross-channel video.
Our Instagram Stories were viewed over 30 million times and videos were viewed more than 52 million times, up from
40 million in the previous half. ASOS continues to experiment with pioneering advertising betas across key international
markets, including the Snapchat Promoted Stories, testing utilisation of the platforms that matter most to fashion loving
20-somethings. This has meant increasing reach and more immersive experiences for our customers.
This season saw further collaborations in support of charities, including the sale of ‘Choose Love T-shirts’ in aid of the
Help Refugees charity with 100% of the profits helping to raise funds and awareness for refugees across Europe and
the Middle East. We continue to sell product in support of numerous inclusive movements, accelerating awareness and
creating meaningful change.
Sustainability remains a key focus and an integral part of the ASOS Purpose. We are therefore firmly committed to
achieving ambitious targets. 70% of our cotton is now sustainably sourced and expectations are to achieve our
commitment of 100% by 2025 ahead of time.
Additionally, we have successfully utilised the mapping of our viscose supply chain to support the commitment to
responsible sourcing of forestry products. We have also published 2020 targets on circular fashion including a
commitment to take back used clothing from customers, training the design team on circular fashion design, and
increasing use of post-consumer used textiles. Environmental benchmarking of 30% of ASOS suppliers has enabled
identification of environmental risks and enhancement of best practice in garment and fabric manufacture.
ASOS views its commitment to ‘Fashion with Integrity’ as a critical investment in the future of our business.
Our Product
ASOS offers customers the greatest, most relevant edit of great value fashion to an inclusive 20-something audience.
The architecture of the ASOS portfolio of brands has been simplified during the first half, for example with “Own Brand”
now known as ASOS Design. Our ASOS portfolio of brands continues to grow, complementing our curated edit of the
best third party brands from across the globe. Sales of ASOS Brand accounted for c.39% of sales in H1 2018. ASOS
continues to delight customers with a constant flow of new styles landing on site, a key differentiator of the ASOS
offering. Each week 4,000-5,000 new styles are launched with c.87,000 products in stock at any one point in time.
This season, as always, saw the introduction of a significant number of new brands, including Tommy Jeans, Morgan
and Ivy Park, whilst a similar number were edited out to ensure our proposition remains relevant and exciting. The
combination of ASOS Brand and exclusive collaborations with third party brands leads to 55-60% of ASOS product only
being available to customers through the ASOS sites, an additional important point of differentiation.
Building on the success of the branded activewear offering that launched last year, the ASOS 4505 activewear range
successfully debuted in January 2018 alongside the #ReasonsToMove campaign. The range covers a variety of end use
activity and 90% of the product has high performance, technical properties. As part of ASOS’s mission to help young
people look, feel and be their best, we designed and created the outfits for team Paralympics GB to wear at the
Pyeongchang Winter Games in March 2018.
The highly acclaimed ASOS Face + Body “go play” campaign that launched in September marked our entry into this
segment, a market that is predicted to be worth £450bn per annum globally by 2020. We are excited to announce a new
relationship with the Estee Lauder Group. MAC launched on site last month and will be followed by many more brands
from Estee Lauder. Other exciting launches in this category include House of 99 by David Beckham and an exclusive
range with Crayola – an extension of the playful approach we have taken to this category.

5
Our Proposition
ASOS continue to invest in improvements to our ‘best in class proposition’, aiming for a friction free experience at every
stage of the customer journey.
The business had another productive six months driving our agenda of technology change and innovation. 1,200 digital
platform releases have already been made since the start of the financial year, further demonstrating the flexibility and
pace of change being delivered.
These releases provided a number of new customer features and changes to the shopping experience. Highlights from
the first six months include design improvements to apps including enhancements for visual search and product
recommendations, the launch of GooglePay on Android app and the full roll out of refreshed site navigation for web and
mobile web. The refreshed navigation has been the largest design change to the ASOS shopping experience for many
years and significantly improves how customers search, browse and explore products, further improving page download
speeds.
ASOS’s ‘Customer Privacy Programme’ has also progressed, with new customer marketing and communication consent
journeys going live at the end of February. This programme is focussed on delivering an open and transparent way for
our customers to manage their privacy needs, ahead of GDPR regulation coming into effect on 25 May.
A new returns ‘portal’ was piloted for Australian customers, improving the returns experience and allowing sight and
status tracking of returned orders. This feature, integrated within the ‘My Account’ section of our website and app, will
soon be extended to other markets.
During the last six months changes have also been made to further drive localisation as part of our international growth
strategy. Two new local foreign sites and apps have been added - one to serve our ‘Rest of World’ customers and another
to cover those in the ‘Rest of Europe’. These new sites allow tailoring of the experience for these specific markets, giving
different content, visual merchandising and price zones. Further flexibility will be driven by the ability to control stock
and fulfilment logic for these sites independently from the UK.
The launch of these two new sites followed the release of a UK specific site and app. This has for the first time allowed
direct merchandising and tailoring of the experience for UK customers, rather than a global proposition shopped by a
global customer base. This functionality was utilised with the launch of ‘Try Before You Buy’ in the UK, showing banners
within the UK app, which would not have been possible previously. Further progress was also made in improving the
proposition and experience globally with the launch of ASOS Premier into six new countries (Sweden, Austria, Belgium,
Ireland, Denmark and the Netherlands). This followed the release of technology changes which will allow roll out of
ASOS Premier to any country going forward.
Our technology team have continued to make progress supporting traffic and order volume growth. This was
demonstrated with a very successful peak trading period during which record sales levels were processed without any
customer issues.
Progress continues on our major transformation programmes including the new end-to-end merchandising and planning
system, Truly Global Retail (TGR), which will support the ability to buy, sell and account for stock in multiple locations
and currencies. The last six months saw the implementation of both the new people and finance systems.
Over the next six months we will continue to improve the customer experience in many ways. This will include speeding
up the refund process, offering online gift vouchers to international customers as well as launching new payment
methods, new language sites and new delivery propositions.
We have been driving growth and profitability by optimising customer experience through AI over a number of years
now and we are aiming to establish AI development capability in every area of the business, from customer experience,
customer care, supply chain and retail in pursuit of being a truly data driven organisation. Visual search, product
recommendation, fit analytics and shopping through Facebook Messenger are all examples of how AI can delight
customers. We are therefore investing heavily in the technology, processes and people needed to make a step change
in the productivity of AI development processes.
Within warehousing, the Euro hub phase two extension is progressing at pace and to plan. Within the first half, handover
of the site was completed along with delivery and commencement of installation for the automated storage system. This
automated storage system is currently 50% complete and on track for completion before peak trading. Good progress
is also being made on the new warehouse management system which will be installed at the start of FY19.

6
The new US warehouse has also made significant progress since the start of the financial year. A variety of improvements
have been made to the site in addition to the installation of a storage mezzanine and parcel despatch sorter, both of
which are on track to being operational by the end of the year.
Within our UK hub at Barnsley, work is currently underway to increase the stockholding capacity through the construction
of an additional mezzanine. This will increase capacity by a further 10% to 22 million units and is scheduled to complete
by the end of April. All of these investments will combine to deliver future capacity for £4 billion of net sales.
Once again, both the Euro hub and the UK hub saw record volumes processed over the Black Friday period. Euro hub
despatched 1.9 million units in the peak seven days on a manual solution whilst the UK hub processed 4 million units in
the same period.
The first six months of the year saw a continued focus on improving delivery and returns for customers, with 92
improvements to proposition made globally. The ramp up of fulfilment from the Euro hub has allowed ASOS to begin
deploying improvements to the European proposition. Saturday delivery for both Next Day and Standard was launched
into Germany along with an extension of the Saturday ordering cut off times across the EU for Next Day delivery. Click
and Collect launched into Germany and Austria, adding almost 20,000 locations to the global offering. March also saw
the launch of Click and Collect into Russia.
Within the UK, Next Day delivery launched into the Channel Islands and Next Day delivery cut off was improved to
midnight on Sunday, in line with weekdays. New Click and Collect providers were also added, taking total coverage up
to 18,000 UK locations.
We moved in to our new 80,000 square feet Customer Care site in Leavesden, North Watford completing the project
ahead of peak trading. This has allowed the in-sourcing of a higher proportion of Customer Care work that has driven
increased quality of service and reduced costs.
Our People
Supporting our customers, our own teams and our partners to realise their potential is our fourth pillar in ensuring our
brand remains defendable, differentiated and desirable.
At the end of February 2018, ASOS employed 4,277 people with the majority based at our headquarters in Camden,
North London and our Customer Care site in Leavesden, with smaller teams in Paris, Birmingham, Barnsley, Berlin, New
York and Sydney. Over the past six months, we have strengthened our teams in business critical areas, with the most
positions being added in Retail, Technology and Customer Care.
Attracting, retaining and helping the best talent to thrive at ASOS remains a number one priority and in the last year, we
have put an increased focus on Emerging Talent Development. In September 2017, we initiated our first ever graduate
programme which welcomed 31 graduates across the business. Our intern programme continues to grow and we have
also designed and delivered our first ever apprenticeship programme for Buying and Merchandising.
Over the past six months, we have continued to invest in supporting the development needs of our people. September
2017 saw the launch of the ASOS Academy, with the overarching mission of instilling the confidence to be their best
selves in our teams.
We continue to view ethical trade as a core business responsibility. A two-pronged Ethical Trade Strategy focusses on
improving business practices to protect human rights in the supply chain from the top down, while empowering workers
to realise their fundamental rights from the bottom up. Our focus centres on transparency, purchasing practices, freedom
of association, living wage, gender equality, health and safety, child labour, modern slavery and third party brands.
ASOS has made significant progress towards furthering respect for human rights in the supply chain. Most recently, we
partnered with the British High Commission in Mauritius to host an event on modern slavery, labour migration and
workers’ rights. In late March, ASOS co-hosted an event at the House of Lords with the All Party Parliamentary Group on
Ethics and Sustainability in Fashion and Anti-Slavery International to address risks in the apparel sector supplier base.

7
Investment
We invested just over £95m of capex in the first half, across technology and transformation programmes (c.50% of total
capex) and the balance in physical infrastructure across supply chain infrastructure as well as the investment in our head
office. These infrastructure programmes included further optimisation of Barnsley, automating and extending Euro hub
and fitting out the US. Total capex will be between £230m to £250m in both the current and the following two financial
years. We expect to be free cash flow negative this year, extending into the next financial year, returning to free cash
flow positive in FY2020.
During the half we also made significant working capital investment of £82.5m, largely in inventory and payables. The
former (£46.7m, +14.4%) reflects additional stock cover to improve availability as we enter the new season, holding
stock across multiple distribution centres as well as fulfilling the sales growth trajectory of the business. The decrease in
trade and other payables broadly reflects the position last August which was approximately £40m higher as a
consequence of slower payments, ahead of the planned introduction of our new finance system. This is approximately
£15m higher than we had previously anticipated.
Our capital investment and these movements in working capital resulted in our cash balance of £37.7m at the half year
end. Taking into account our capital investment plans and free cash generation through the second half, cash balances
at the full year are expected to be at a broadly similar level to that at the half year. Our banking facilities were put in
place five years ago and we are currently finalising a £150m revolving credit facility during this period of intense
investment.
The extension and refit of the head office in Camden will continue, increasing space from 180,000 ft2 to 243,000 ft2
which, when combined with the very latest technology, will provide sufficient flexibility to accommodate significant future
headcount growth.
Outlook
We remain in a period of high investment, pursuing the considerable opportunity we see ahead for ASOS. We are
confident that by concentrating on successfully executing our investments, we are positioning ASOS to be the world’s
number one destination for fashion loving 20-somethings. Whilst we concentrate on investing in our future, we remain
equally focussed on our core financial disciplines and are pleased that both our current year and our medium term sales
and EBIT margin guidance remain unchanged.
Nick Beighton
Chief Executive Officer

8
Financial review
Revenue
Six months to 28 February 2018
Group International £m total UK US EU RoW total
Retail sales 1,131.3 414.5 149.0 349.1 218.7 716.8 Growth 27% 22% 20% 40% 25% 31% Growth at constant exchange rate 26% 22% 27% 32% 24% 28%
Delivery receipts 23.9 9.2 3.7 7.1 3.9 14.7 Growth 24% 21% 28% 45% – 26%
Third party revenues 2.9 2.8 0.1 – – 0.1 Growth (3%) (3%) – – – –
Total revenues 1,158.1 426.5 152.8 356.2 222.6 731.6
Growth Growth at constant exchange rate
27% 25%
21% 21%
20% 27%
40% 32%
24% 23%
31% 28%
The Group generated retail sales growth of 27% during the period, with UK growth of 22% and strong international
growth of 31% (28% constant currency). International retail sales accounted for 63% (H1 2017: 62%) of total retail
sales.
UK retail sales grew by 22% despite a challenging market, aided by new category expansion and proposition
enhancements such as ‘Try Before You Buy’. ASOS retained its first place position for unique visitors to apparel retailers
in the 15-34 age range (Comscore, February 2018).
US retail sales grew by 20% (27% in constant currency) driven by average basket value and conversion improvements.
The USD became a headwind in H1 from a sales perspective as the pound strengthened against the dollar. As our USD
sales are largely naturally hedged across the Group, movements in the exchange rate will impact reported sales growth
in the US territory.
EU retail sales grew significantly at 40% (32% in constant currency) driven by strong growth in France and Germany in
particular, alongside further proposition improvements, and ASOS Premier launching in new countries (Austria, Ireland,
the Netherlands, Belgium, Denmark and Sweden). Key engagement has driven conversion up 20bps and average basket
values up 3%.
Rest of World retail sales grew by 25% (24% in constant currency), augmented by an enhanced customer proposition
in certain territories. Exceptional retail growth last year has created 84% growth over the last two years (77% constant
currency).
Delivery receipts increased by 24% which marginally lagged retail sales growth as customers increasingly took advantage
of more extensive free shipping options. The number of premier customers increased by 55%.
Customer engagement ASOS has seen a significant increase in active customers1, finishing February with 16.5m, up 17% compared to last year.
Engaging content and investments in the technology platform have helped drive this growth as well as a 25% increase
in the number of visits. The compelling nature of the ASOS proposition drove increases in average basket value of 2%,
conversion2 increased by 10bps and average order frequency3 increased by 8%. Average selling price is down 2% driven
by a change in product mix since the launch of the ‘Face + Body’ campaign and success of new lower price point brands.
Six months to 28 February 2018
Six months to 28 February 2017
Change
Active customers1 (m) 16.5 14.1 17%
Average basket value (including VAT) £72.35 £70.86 2%
Average units per basket 2.86 2.76 4%
Average selling price per unit (including VAT)
Average order frequency3
£25.28
3.41
£25.69
3.15
(2%)
8%
Total orders (m) 29.9 23.3 28%
Total visits (m) 1,005.0 804.8 25%
Conversion2 3.0% 2.9% +10bps
Mobile device visits 76.0% 68.4% +760bps 1Defined as having shopped during the last twelve months as at 28 February 2018 2Calculated as total orders divided by total visits 3Calculated as last twelve months’ total orders divided by active customers

9
Gross profitability
Six months to 28 February 2018
Group International total UK US EU RoW Total
Gross profit (£m) 569.4 190.3 89.8 173.4 115.9 379.1 Growth 29% 22% 17% 51% 25% 33%
Retail gross margin 48.0% 43.0% 57.7% 47.6% 51.2% 50.8%
Growth 100bps 40bps (180bps) 330bps 70bps 110bps
Gross margin 49.2% 44.6% 58.8% 48.7% 52.1% 51.8% Growth 90bps 30bps (160bps) 330bps 50bps 100bps
Group retail gross margin increased by 100bps to 48.0% compared to last year (H1 2017: 47.0%) due to a positive net
FX position and improved buying margin partially offset by clearance depth and third party/ASOS Design mix. Gross
margin (including delivery receipts and third-party revenues) increased by 90bps to 49.2% (H1 2017: 48.3%) due to the
growth in retail margin offset by delivery receipts growing at a marginally slower rate to retail sales.
Operating expenses The Group increased its investment in operating resources by 31% to £539.7m, with the total operating costs to revenue
ratio increasing by 130bps to 46.6% (H1 2017: 45.3%).
£m
Six months to 28 February
2018
% of sales
Six months to 28 February
2017
% of sales Change Distribution costs (178.5) 15.4% (140.2) 15.4% (27%) Payroll and staff costs1 (92.8) 8.0% (74.1) 8.1% (25%) Warehousing (113.5) 9.8% (74.3) 8.2% (53%) Marketing (57.3) 5.0% (48.1) 5.3% (19%) Production (3.6) 0.3% (3.6) 0.4% Technology costs (21.3) 1.8% (16.4) 1.8% (30%) Other operating costs (47.8) 4.1% (34.8) 3.8% (37%) Depreciation and amortisation (24.9) 2.2% (21.5) 2.3% (16%) Total operating costs (539.7) 46.6% (413.0) 45.3% (31%) 1Inclusive of non-cash share-based payment charges
Distribution costs remained flat at 15.4% of revenue, driven by improved standard delivery services offset by investment
into free return propositions in new territories.
Payroll and staff costs decreased by 10bps to 8.0% of sales as a result of cost leveraging. Headcount has increased 36%
(H1 2018: 4,277; H1 2017: 3,146). Non-cash share-based payment charges amounted to £4.8m (H1 2017: £3.4m)
relating to a new Long-Term Incentive Scheme granted during the year and a higher uptake in our Save As You Earn
scheme launched last year.
Warehousing costs increased by 160bps to 9.8% of revenue due to increased fulfilment mix from Euro hub which is
currently a more manual operation, partly offset by efficiencies achieved at Barnsley from automation investments.
Marketing costs decreased by 30bps to 5.0% of sales driven by digital marketing efficiencies and a higher return on
advertising spend.
Technology costs remained flat at 1.8% of revenue.
Other operating costs increased by 30bps to 4.1% of revenue.
Depreciation and amortisation decreased by 10bps to 2.2% of revenue. Given the increase in capital expenditure over
recent periods this charge will increase moving forward as a percentage of revenue as the major projects come on
stream.

10
Income statement
The Group generated profit before tax of £29.9m, up 10% compared to last year. This was behind sales growth due to
gross margin improvements of 90bps being offset by increased investment in operating costs.
£m
Six months to
28 February 2018
Six months to
28 February 2017
Revenue 1,158.1 911.5
Cost of sales (588.7) (471.4)
Gross profit 569.4 440.1
Distribution expenses (178.5) (140.2)
Administrative expenses (361.2) (272.8)
Operating profit 29.7 27.1
Net finance income 0.2 0.2
Profit before tax 29.9 27.3
Income tax expense (5.4) (5.4)
Profit after tax 24.5 21.9
Effective tax rate 18.1% 19.8%
Taxation The effective tax rate decreased by 170bps to 18.1% (H1 2017: 19.8%). This arose mainly from the effect of the
substantively enacted UK corporation tax rate being reduced to 17% after 1 April 2020 on the deferred tax on accelerated
capital allowances and Research and Development expenditure credits.
Going forward, ASOS expects the effective tax rate to be approximately 100bps higher than the prevailing rate of UK
corporation tax due to permanently disallowable items.
Earnings per share
Basic and diluted earnings per share increased by 11% and 11% to 29.4p and 29.2p respectively (H1 2017: 26.4p and
26.3p). This was driven by the increase in profit before tax during the year.

11
Statement of financial position
The Group’s financial position remains robust with movements reflecting the current accelerated level of investment
underway. The increase in net assets of £86.9m to £374.0m during the period (31 August 2017: £287.1m) was largely
seen in higher capital expenditure and an increase in inventory. The closing stock position was up 14% versus the year
end as we continue to improve availability across two distribution hubs. Inventory was up 49% against last year which
reflects annualisation of a tightly managed stock position and improved availability in the current financial year. As a
result of the capital expenditure, the higher inventory position and the trade payables carryover, the cash balance
decreased to £37.7m (detailed more fully on page 12).
There was a reduction of £70.1m in the fair value of the net position of outstanding forward contracts since 31 August
2017 as hedges, which were entered into at adverse pre-Brexit rates, settled during the period and exchange rates
relating to the remaining forward contracts have improved. The deferred tax movement of £13.1m is a result of moving
from a net derivative financial liability as at 31 August 2017 to a net derivative financial asset position as at 28 February
2018. The summary statement of financial position is shown below:
£m At
28 February 2018 At
31 August 2017
Goodwill and other intangible assets 205.5 178.0
Property, plant and equipment 192.3 137.4
Derivative financial assets 8.0 1.3
Deferred tax asset - 9.2
Non-current assets 405.8 325.9
Inventories 370.0 323.3
Net current payables (432.2) (452.1)
Cash and cash equivalents 37.7 160.3
Derivative financial liabilities (1.1) (64.5)
Current tax liability (2.3) (5.8)
Deferred tax liability (3.9) -
Net assets 374.0 287.1

12
Statement of cash flows The Group’s cash balance decreased by £122.6m to £37.7m during the period (31 August 2017: £160.3m) as a result of
capital expenditure of £95.4m, alongside a cash outflow from operating activities of £27.8m, driven principally by EBITDA
of £54.6m offset by a movement in working capital of £82.5m. The year on year rise in working capital outflow to £82.5m
has been driven by two factors. Firstly, the movement in trade payables was caused by the timing of payments at the
year end as we transitioned to the new Finance system. Secondly, the movement in inventory year on year is caused by
the annualisation of a tightly managed stock position, and an improvement to stock availability to meet new season
demand.
£m Six months to 28
February 2018 Six months to 28
February 2017
Operating profit 29.7 27.1
Depreciation and amortisation 24.9 21.5
Losses on disposal of non-current assets 0.4 0.1
Investment write off 0.1 -
Working capital (82.5) (7.7)
Share-based payments charge 4.8 3.4
Other non-cash items 1.3 (1.0)
Tax paid (6.5) (1.2)
Cash (outflow)/inflow from operating activities (27.8) 42.2
Capital expenditure (95.4) (62.4)
Net finance income received 0.2 0.6
Net cash inflow relating to Employee Benefit Trust1 0.9 0.2
Total cash outflow (122.1) (19.4)
Opening cash and cash equivalents 160.3 173.3
Effect of exchange rates on cash and cash equivalents (0.5) 0.4
Closing cash and cash equivalents 37.7 154.3 1Employee Benefit Trust and Capita Trust
Fixed asset additions
£m Six months to 28
February 2018 Six months to 28
February 2017
Technology 57.1 44.9
Warehouse 41.9 18.9
Office fixtures and fit out 8.7 1.3
Total 107.7 65.1
ASOS continues to invest in warehousing and technology infrastructure to support future growth ambitions. The majority
of technology spend is related to development of new and existing platforms, and the TGR programme. Our warehouse
spend relates to the development of our US Hub in Atlanta, Euro hub automation and some further automation in
Barnsley. The office fixtures and fit out spend related to the new customer care site at Leavesden and the continued
extension and fit out of the Head Office in Camden.

13
CONSOLIDATED UNAUDITED STATEMENT OF TOTAL COMPREHENSIVE INCOME Interim Results for the six months to 28 February 2018
Six months to
28 February 2018
(unaudited)
Six months to
28 February 2017
(unaudited)
Year to
31 August 2017
(audited)
£m £m £m
Revenue 1,158.1 911.5 1,923.6
Cost of sales (588.7) (471.4) (965.3)
Gross profit 569.4 440.1 958.3
Distribution expenses (178.5) (140.2) (299.2)
Administrative expenses (361.2) (272.8) (579.5)
Operating profit 29.7 27.1 79.6
Net finance income 0.2 0.2 0.4
Profit before tax 29.9 27.3 80.0
Income tax expense (5.4) (5.4) (15.9)
Profit for the period 24.5 21.9 64.1
Profit for the period attributable to owners of the parent company
24.5 21.9 64.1
Net translation movements offset in reserves
1.1 (0.9) (0.3)
Net fair value gains on derivative financial assets 67.8 27.4 15.8
Income tax relating to these items (13.2) (5.6) (3.3)
Other comprehensive income for the period1 55.7 20.9 12.2
Total comprehensive income for the period
attributable to owners of the parent company 80.2 42.8 76.3
Earnings per share (Note 4)
Basic 29.4p 26.4p 77.2p
Diluted 29.2p 26.3p 76.6p
1All items of other comprehensive income may be reclassified to profit or loss

14
CONSOLIDATED UNAUDITED STATEMENT OF CHANGES IN EQUITY Interim Results for the six months to 28 February 2018
1Retained earnings includes the share-based payments reserve 2Employee Benefit Trust and Capita Trust
Called up share
capital Share
premium Retained earnings1
Employee Benefit
Trust reserve2
Hedging reserve
Translation reserve
Total equity
£m £m £m £m £m £m £m At 1 September 2017
2.9 6.9 327.2 (0.6) (47.5) (1.8) 287.1
Profit for the period
– – 24.5 – – – 24.5
Other comprehensive income for the period
– – – – 54.9 0.8 55.7
Total comprehensive income for the period
– – 24.5 – 54.9 0.8 80.2
Net cash received on exercise of shares from EBT2
– – – 0.9 – – 0.9
Share-based payments charge
– – 4.8 – – – 4.8
Deferred tax on share options
– – 1.0 – – – 1.0
Balance as at 28 February 2018
2.9 6.9 357.5 0.3 7.4 (1.0) 374.0
Called up
share capital
Share premium
Retained earnings1
Employee Benefit
Trust reserve2
Hedging reserve
Translation reserve
Total equity
£m £m £m £m £m £m £m
At 1 September 2016 2.9 6.9 254.7 (2.6) (60.0) (1.5) 200.4
Profit for the period
– – 21.9 – – – 21.9
Other comprehensive income for the period
– – – – 21.8 (0.9) 20.9
Total comprehensive income/(loss) for the period
– – 21.9 – 21.8 (0.9) 42.8
Net cash received on exercise of shares from EBT2
– – – 0.6 – – 0.6
Transfer of shares from EBT2 on
exercise – – (0.3) 0.3 – – –
Share-based payments charge
– – 3.4 – – – 3.4
Deferred tax on share options
– – 0.6 – – – 0.6
Balance as at 28 February 2017 2.9 6.9 280.3 (1.7) (38.2) (2.4) 247.8
15
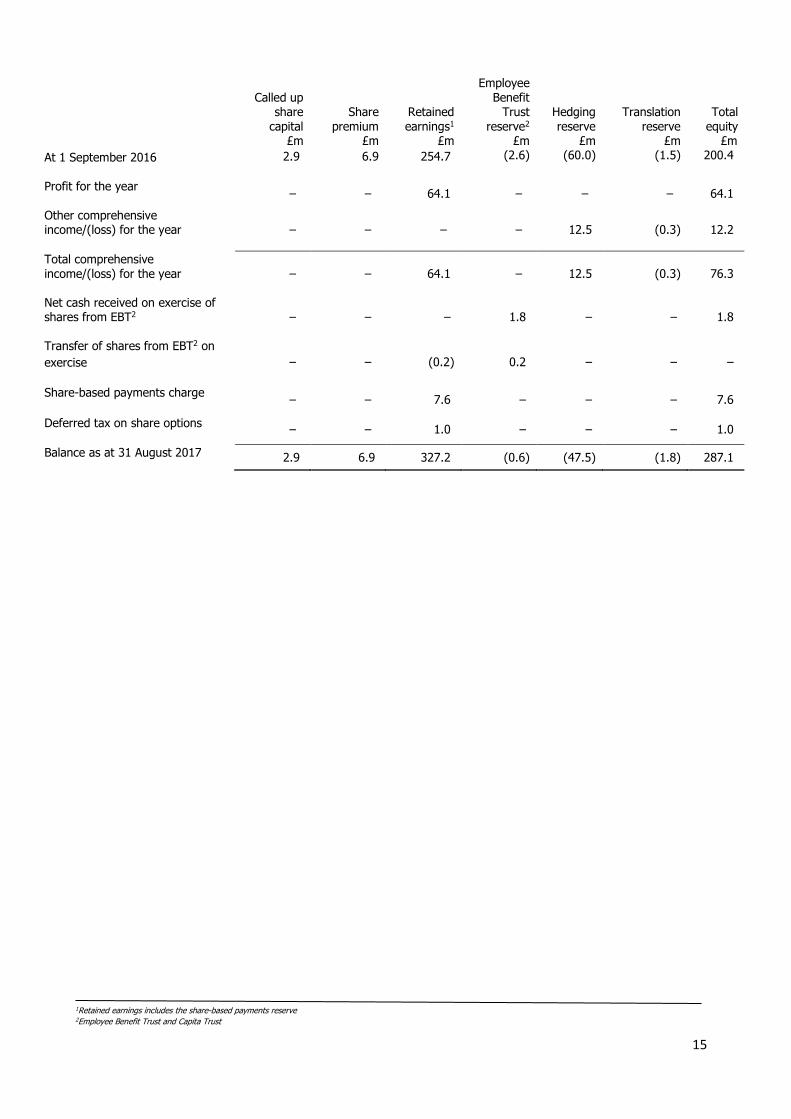
1Retained earnings includes the share-based payments reserve 2Employee Benefit Trust and Capita Trust
Called up
share capital
Share premium
Retained earnings1
Employee Benefit
Trust reserve2
Hedging reserve
Translation reserve
Total equity
£m £m £m £m £m £m £m
At 1 September 2016 2.9 6.9 254.7 (2.6) (60.0) (1.5) 200.4
Profit for the year
– – 64.1 – – – 64.1
Other comprehensive income/(loss) for the year
– – – – 12.5 (0.3) 12.2
Total comprehensive income/(loss) for the year
– – 64.1 – 12.5 (0.3) 76.3
Net cash received on exercise of shares from EBT2
– – – 1.8 – – 1.8
Transfer of shares from EBT2 on
exercise – – (0.2) 0.2 – – –
Share-based payments charge
– – 7.6 – – – 7.6
Deferred tax on share options
– – 1.0 – – – 1.0
Balance as at 31 August 2017 2.9 6.9 327.2 (0.6) (47.5) (1.8) 287.1

16
CONSOLIDATED UNAUDITED STATEMENT OF FINANCIAL POSITION
Interim Results for the six months to 28 February 2018 At
28 February 2018 (unaudited)
At 28 February 2017
(unaudited)
At 31 August 2017
(audited) £m £m £m
Non-current assets
Goodwill 1.1 1.1 1.1
Other intangible assets 204.4 142.6 176.9
Property, plant and equipment 192.3 90.5 137.4
Derivative financial assets 8.0 – 1.3
Deferred tax asset – 7.9 9.2
405.8 242.1 325.9
Current assets
Inventories 370.0 249.0 323.3
Trade and other receivables 25.2 24.9 28.6
Derivative financial assets 12.5 – 2.3
Cash and cash equivalents 37.7 154.3 160.3
445.4 428.2 514.5
Current liabilities
Trade and other payables (457.4) (367.0) (480.7)
Derivative financial liabilities (12.4) (44.8) (57.7)
Current tax liability (2.3) (6.9) (5.8)
Deferred tax liability (3.9) – –
(476.0) (418.7) (544.2)
Net current (liabilities)/assets (30.6) 9.5 (29.7)
Non-current liabilities
Derivative financial liabilities (1.2) (3.8) (9.1)
(1.2) (3.8) (9.1)
Net assets 374.0 247.8 287.1
Equity attributable to owners of the parent
Called up share capital 2.9 2.9 2.9
Share premium 6.9 6.9 6.9
Employee Benefit Trust reserve 0.3 (1.7) (0.6)
Hedging reserve 7.4 (38.2) (47.5)
Translation reserve (1.0) (2.4) (1.8)
Retained earnings 357.5 280.3 327.2
Total equity 374.0 247.8 287.1

17
CONSOLIDATED UNAUDITED STATEMENT OF CASH FLOWS Interim Results for the six months to 28 February 2018 Six months to
28 February 2018 (unaudited)
Six months to 28 February 2017
(unaudited)
Year to 31 August 2017
(audited) £m £m £m Operating profit 29.7 27.1 79.6
Adjusted for:
Depreciation of property, plant and equipment 7.8 5.7 13.7 Amortisation of other intangible assets 17.1 15.8 28.6 Loss on disposal of non-current assets 0.4 0.1 0.5 Investment write off 0.1 – – (Increase)/decrease in inventories (46.7) 8.7 (65.6) Decrease/(increase) in trade and other receivables 3.5 (10.3) (13.6)
(Decrease)/increase in trade and other payables (39.3) (6.1) 103.3 Share based payments charge 4.8 3.4 7.6 Other non-cash items 1.3 (1.0) (0.6) Income tax paid (6.5) (1.2) (7.6)
Net cash (outflow)/inflow from operating activities
(27.8) 42.2 145.9
Investing activities Payments to acquire other intangible assets (48.8) (46.1) (89.5) Payments to acquire property, plant and equipment (46.6) (16.3) (72.0) Finance income 0.2 0.2 0.5
Net cash used in investing activities (95.2) (62.2) (161.0) Financing activities Net cash inflow relating to EBT1 0.9 0.6 1.8
Net cash generated in financing activities 0.9 0.6 1.8
Net decrease in cash and cash equivalents (122.1) (19.4) (13.3)
Opening cash and cash equivalents 160.3 173.3 173.3
Effect of exchange rates on cash and cash equivalents (0.5) 0.4 0.3
Closing cash and cash equivalents 37.7 154.3 160.3
1Employee Benefit Trust and Capita Trust

18
NOTES TO THE FINANCIAL INFORMATION Interim Results for the six months to 28 February 2018
1. Preparation of the consolidated financial information
a) General information
ASOS plc (‘the Company’) and its subsidiaries (together, ‘the Group’) is a global fashion retailer. The Group sells products
across the world and has websites targeting the UK, US, Australia, France, Germany, Spain, Italy and Russia. The
Company is a public limited company which is listed on the Alternative Investment Market (AIM) and is incorporated and
domiciled in the UK. The address of its registered office is Greater London House, Hampstead Road, London, NW1 7FB.
The interim financial statements have been reviewed, not audited, and were approved by the Board of Directors on
9 April 2018.
b) Basis of preparation
The interim financial statements for the six months ended 28 February 2018 have been prepared in accordance with IAS
34, “Interim Financial Reporting” as adopted by the European Union and the AIM Rules for Companies. The interim
financial statements should be read in conjunction with the Group’s Annual Report and Accounts for the year ended
31 August 2017, which was prepared in accordance with IFRSs as adopted by the European Union.
The interim financial statements have been reviewed, not audited, and do not constitute statutory accounts within the
meaning of section 434 of the Companies Act 2006. The Annual Report and Accounts for the year ended 31 August 2017
have been filed with the Registrar of Companies. The auditors’ report on those accounts was unqualified, did not include
a reference to any matters to which the auditors drew attention by way of emphasis without qualifying the report and
did not contain statements under s498 of the Companies Act 2006.
The Group’s business activities together with the factors that are likely to affect its future developments, performance
and position are set out on pages 3 to 7. The Financial Review on pages 8 to 12 describes the Group’s financial position
and cash flows.
Going concern
The Directors have reviewed current performance and cash flow forecasts, and are satisfied that the Group’s forecasts
and projections, taking account of potential changes in trading performance, show that the Group will be able to operate
within the level of its current facilities for the foreseeable future. The Directors have therefore continued to adopt the
going concern basis in preparing the Group’s financial statements.
Changes to accounting standards
There have been no significant changes under IFRS which have affected the Group’s results in the six months to 28
February 2018. Changes to IFRS which have been issued, but that are not yet effective, have been disclosed in the
Group’s Annual Report and Accounts for the year ended 31 August 2017.
Statement of Directors’ responsibilities
The Directors confirm that, to the best of their knowledge, the interim financial statements have been prepared in
accordance with IAS 34 “Interim Financial Reporting” as adopted by the European Union and the AIM Rules for
Companies, and that the interim management report includes a fair review of the information required.
Accounting policies
The interim financial statements have been prepared in accordance with the accounting policies set out in the Annual
Report and Accounts for the year ended 31 August 2017.
Taxes on income in the interim periods are accrued using the tax rate that would be applicable to the expected total
annual earnings.
19
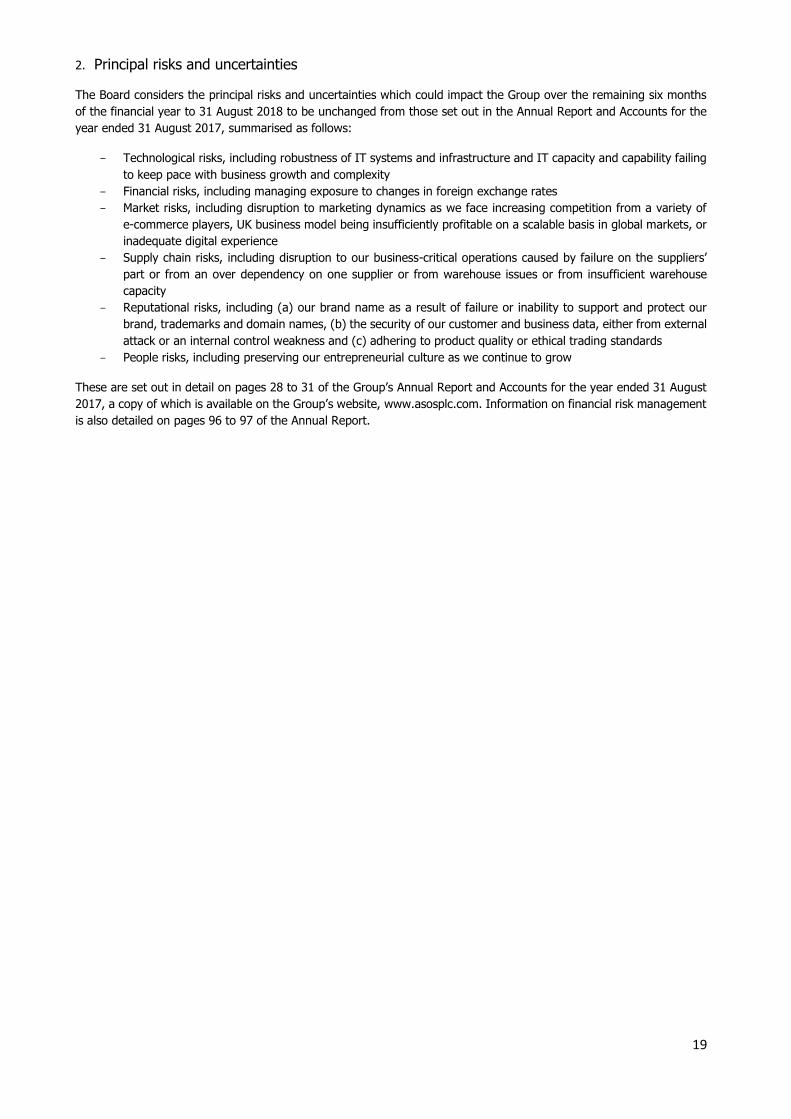
2. Principal risks and uncertainties
The Board considers the principal risks and uncertainties which could impact the Group over the remaining six months
of the financial year to 31 August 2018 to be unchanged from those set out in the Annual Report and Accounts for the
year ended 31 August 2017, summarised as follows:
- Technological risks, including robustness of IT systems and infrastructure and IT capacity and capability failing
to keep pace with business growth and complexity
- Financial risks, including managing exposure to changes in foreign exchange rates
- Market risks, including disruption to marketing dynamics as we face increasing competition from a variety of
e-commerce players, UK business model being insufficiently profitable on a scalable basis in global markets, or
inadequate digital experience
- Supply chain risks, including disruption to our business-critical operations caused by failure on the suppliers’
part or from an over dependency on one supplier or from warehouse issues or from insufficient warehouse
capacity
- Reputational risks, including (a) our brand name as a result of failure or inability to support and protect our
brand, trademarks and domain names, (b) the security of our customer and business data, either from external
attack or an internal control weakness and (c) adhering to product quality or ethical trading standards
- People risks, including preserving our entrepreneurial culture as we continue to grow
These are set out in detail on pages 28 to 31 of the Group’s Annual Report and Accounts for the year ended 31 August
2017, a copy of which is available on the Group’s website, www.asosplc.com. Information on financial risk management
is also detailed on pages 96 to 97 of the Annual Report.

20
3. Segmental analysis
IFRS 8 ‘Operating Segments’ requires operating segments to be determined based on the Group’s internal reporting to
the Chief Operating Decision Maker. The Chief Operating Decision Maker has been determined to be the Executive Board
who receive information on the basis of the Group’s operations in key geographical territories, based on the Group’s
management and internal reporting structure. The Executive Board assesses the performance of each segment based
on revenue and gross profit after distribution expenses, which excludes administrative expenses.
Six months to 28 February 2018 (unaudited)
UK US EU RoW Total
£m £m £m £m £m
Retail sales 414.5 149.0 349.1 218.7 1,131.3 Delivery receipts 9.2 3.7 7.1 3.9 23.9 Third party revenues 2.8 0.1 – – 2.9 Total revenue 426.5 152.8 356.2 222.6 1,158.1 Cost of sales (236.2) (63.0) (182.8) (106.7) (588.7)
Gross profit 190.3 89.8 173.4 115.9 569.4
Distribution expenses (50.6) (37.9) (47.8) (42.2) (178.5)
Segment result 139.7 51.9 125.6 73.7 390.9
Administrative expenses (361.2)
Operating profit 29.7
Finance income 0.2
Profit before tax 29.9
Six months to 28 February 2017 (unaudited)
UK US EU RoW Total
£m £m £m £m £m
Retail sales 340.8 124.3 248.9 175.2 889.2 Delivery receipts 7.6 2.9 4.9 3.9 19.3 Third party revenues 2.9 0.1 – – 3.0 Total revenue 351.3 127.3 253.8 179.1 911.5 Cost of sales (195.7) (50.4) (138.6) (86.7) (471.4)
Gross profit 155.6 76.9 115.2 92.4 440.1
Distribution expenses (38.7) (33.1) (39.3) (29.1) (140.2)
Segment result 116.9 43.8 75.9 63.3 299.9
Administrative expenses (272.8)
Operating profit 27.1
Finance income 0.2
Profit before tax 27.3
Year to 31 August 2017 (audited)
UK US EU RoW Total
£m £m £m £m £m
Retail sales 698.2 261.6 544.1 372.6 1,876.5 Delivery receipts 16.1 6.3 10.8 7.6 40.8 Third party revenues 6.0 0.2 0.1 – 6.3 Total revenue 720.3 268.1 555.0 380.2 1,923.6 Cost of sales (389.7) (103.5) (292.4) (179.7) (965.3)
Gross profit 330.6 164.6 262.6 200.5 958.3
Distribution expenses (81.9) (69.2) (89.8) (58.3) (299.2)
Segment result 248.7 95.4 172.8 142.2 659.1
Administrative expenses (579.5)
Operating profit 79.6
Finance income 0.4
Profit before tax 80.0
21
Due to the nature of its activities, the Group is not reliant on any individual major customers. No analysis of the assets
and liabilities of each operating segment is provided to the Chief Operating Decision Maker in the monthly management
accounts. Therefore no measure of segments assets or liabilities is disclosed in this note. The total amount of non-current
assets located in the EU is £65.2m (31 August 2017: £46.1m).
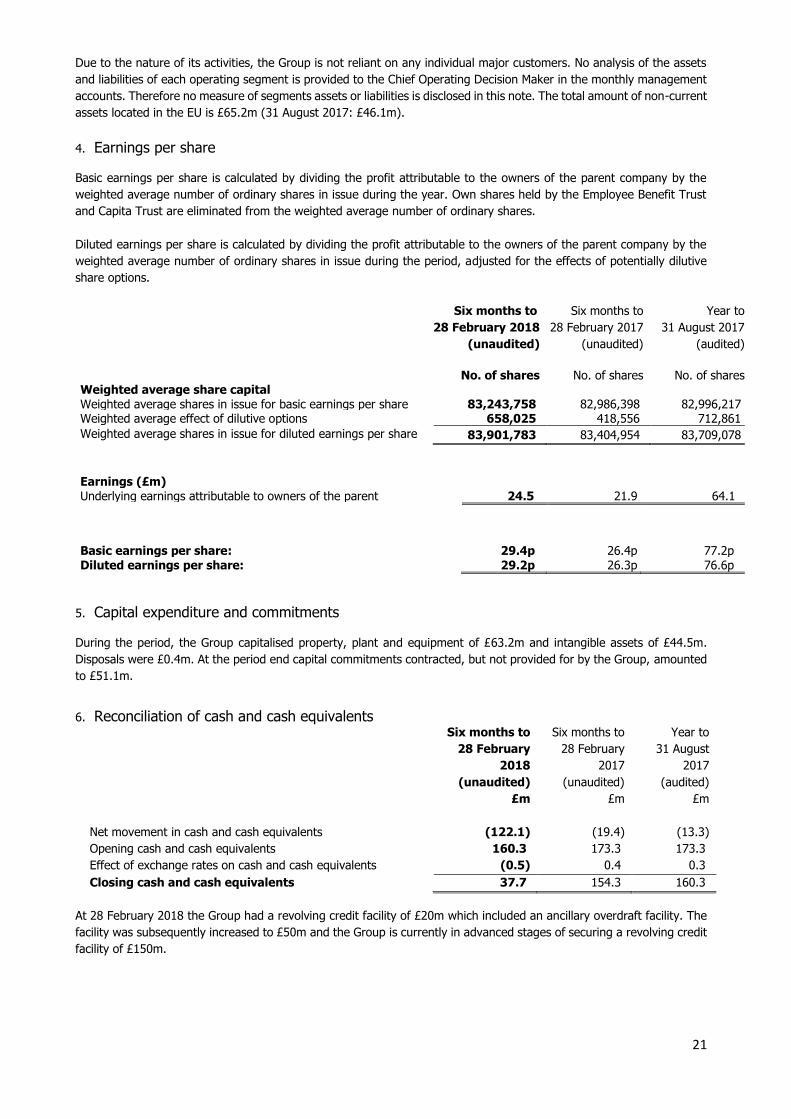
4. Earnings per share
Basic earnings per share is calculated by dividing the profit attributable to the owners of the parent company by the
weighted average number of ordinary shares in issue during the year. Own shares held by the Employee Benefit Trust
and Capita Trust are eliminated from the weighted average number of ordinary shares.
Diluted earnings per share is calculated by dividing the profit attributable to the owners of the parent company by the
weighted average number of ordinary shares in issue during the period, adjusted for the effects of potentially dilutive
share options.
Six months to
28 February 2018
(unaudited)
Six months to
28 February 2017
(unaudited)
Year to
31 August 2017
(audited)
No. of shares No. of shares No. of shares
Weighted average share capital Weighted average shares in issue for basic earnings per share 83,243,758 82,986,398 82,996,217 Weighted average effect of dilutive options 658,025 418,556 712,861
Weighted average shares in issue for diluted earnings per share 83,901,783 83,404,954 83,709,078
Earnings (£m) Underlying earnings attributable to owners of the parent 24.5 21.9 64.1
Basic earnings per share:
29.4p
26.4p
77.2p
Diluted earnings per share: 29.2p 26.3p 76.6p
5. Capital expenditure and commitments
During the period, the Group capitalised property, plant and equipment of £63.2m and intangible assets of £44.5m.
Disposals were £0.4m. At the period end capital commitments contracted, but not provided for by the Group, amounted
to £51.1m.
6. Reconciliation of cash and cash equivalents
Six months to
28 February
2018
(unaudited)
Six months to
28 February
2017
(unaudited)
Year to
31 August
2017
(audited)
£m £m £m
Net movement in cash and cash equivalents (122.1) (19.4) (13.3)
Opening cash and cash equivalents 160.3 173.3 173.3
Effect of exchange rates on cash and cash equivalents (0.5) 0.4 0.3
Closing cash and cash equivalents 37.7 154.3 160.3
At 28 February 2018 the Group had a revolving credit facility of £20m which included an ancillary overdraft facility. The
facility was subsequently increased to £50m and the Group is currently in advanced stages of securing a revolving credit
facility of £150m.

22
7. Contingent liabilities
From time to time, the Group is subject to various legal proceedings and claims that arise in the ordinary course of
business, which due to the fast-growing nature of the Group and its e-commerce base, may concern the Group’s brand
and trading name or its product designs. All such cases brought against the Group are robustly defended and a liability
is recorded only when it is probable that the case will result in a future economic outflow which can be reliably measured.
At 28 February 2018, there were no other pending claims or proceedings against the Group which were expected to
have a material adverse effect on its liquidity or operations. The Group had contingent liabilities of £18.1m (H1 2017:
£6.4m) in relation to supplier standby letters of credit, rent deposit deeds and other bank guarantees. The likelihood of
a cash outflow in relation to these contingent liabilities is considered to be low.
8. Financial instruments
There are no changes to the categories of financial instruments held by the Group.
Six months to
28 February
2018
(unaudited)
Six months to
28 February
2017
(unaudited)
Year to
31 August
2017
(audited)
£m £m £m
Financial assets
Derivative assets used for hedging at fair value 20.5 – 3.6
Loans and receivables1 49.6 167.0 176.3
Financial liabilities
Derivative liabilities used for hedging at fair value (13.6) (48.6) (66.8)
Amortised cost2 (444.8) (360.8) (474.2) 1Loans and receivables include trade and other receivables and cash and cash equivalents, and excludes prepayments 2Included in financial liabilities at amortised cost are trade payables, accruals and other payables
The Group operates internationally and is therefore exposed to foreign currency transaction risk, primarily on sales
denominated in US dollars, Euros and Australian dollars. The Group’s policy is to mitigate foreign currency transaction
exposures where possible and the Group uses financial instruments in the form of forward foreign exchange contracts
to hedge future highly probable foreign currency cash flows.
These forward foreign exchange contracts are classified above as derivative financial assets and are classified as
Level 2 financial instruments under IFRS 13, “Fair Value Measurement.” They have been fair valued at 28 February 2018
with reference to forward exchange rates that are quoted in an active market, with the resulting value discounted back
to present value. All forward foreign exchange contracts were assessed to be highly effective during the period to
28 February 2018 and a net unrealised gain of £67.8m (H1 2017: gain of £27.4m) was recognised in equity. All derivative
financial liabilities at 28 February 2018 mature within two years based on the related contractual arrangements.
9. Related parties
The Group’s related party transactions are with the Employee Benefit Trust, Capita Trust, key management personnel
and other related parties as disclosed in the Group’s Annual Report and Accounts for the year ended 31 August 2017.
There have been no material changes to the Group’s related party transactions during the six months to 28 February
2018.

23
INDEPENDENT REVIEW REPORT TO ASOS PLC
REPORT ON THE INTERIM FINANCIAL STATEMENTS
Our conclusion
We have reviewed ASOS plc's interim financial statements (the "interim financial statements") in the interim results of
ASOS plc for the six month period ended 28 February 2018. Based on our review, nothing has come to our attention that
causes us to believe that the interim financial statements are not prepared, in all material respects, in accordance with
International Accounting Standard 34, ‘Interim Financial Reporting’, as adopted by the European Union and the AIM
Rules for Companies.
What we have reviewed
The interim financial statements comprise:
• the consolidated unaudited statement of total comprehensive income for the period ended 28 February 2018; • the consolidated unaudited statement of changes in equity for the period then ended; • the consolidated unaudited statement of financial position as at 28 February 2018; • the consolidated unaudited statement of cash flows for the period then ended; and • the explanatory notes to the interim financial statements.
The interim financial statements included in the interim results have been prepared in accordance with International
Accounting Standard 34, ‘Interim Financial Reporting’, as adopted by the European Union and the AIM Rules for
Companies.
As disclosed in note 1 to the interim financial statements, the financial reporting framework that has been applied in the
preparation of the full annual financial statements of the Group is applicable law and International Financial Reporting
Standards (IFRSs) as adopted by the European Union.
RESPONSIBILITIES FOR THE INTERIM FINANCIAL STATEMENTS AND THE REVIEW
Our responsibilities and those of the directors
The interim results, including the interim financial statements, is the responsibility of, and has been approved by, the
directors. The directors are responsible for preparing the interim results in accordance with the AIM Rules for Companies
which require that the financial information must be presented and prepared in a form consistent with that which will be
adopted in the company’s annual financial statements.
Our responsibility is to express a conclusion on the interim financial statements in the interim results based on our review.
This report, including the conclusion, has been prepared for and only for the company for the purpose of complying with
the AIM Rules for Companies and for no other purpose. We do not, in giving this conclusion, accept or assume
responsibility for any other purpose or to any other person to whom this report is shown or into whose hands it may
come save where expressly agreed by our prior consent in writing.
What a review of interim financial statements involves
We conducted our review in accordance with International Standard on Review Engagements (UK and Ireland) 2410,
‘Review of Interim Financial Information Performed by the Independent Auditor of the Entity’ issued by the Auditing
Practices Board for use in the United Kingdom. A review of interim financial information consists of making enquiries,
primarily of persons responsible for financial and accounting matters, and applying analytical and other review
procedures.
A review is substantially less in scope than an audit conducted in accordance with International Standards on Auditing
(UK) and, consequently, does not enable us to obtain assurance that we would become aware of all significant matters
that might be identified in an audit. Accordingly, we do not express an audit opinion.
We have read the other information contained in the interim results and considered whether it contains any apparent
misstatements or material inconsistencies with the information in the interim financial statements.
PricewaterhouseCoopers LLP Chartered Accountants St Albans 10 April 2018