Embed Size (px)
DESCRIPTION
Graphing Linear Equations. 11-1. Warm Up. Problem of the Day. Lesson Presentation. Pre-Algebra. Graphing Linear Equations. 11-1. 5. 2. y = x + 8. Pre-Algebra. Warm Up Solve each equation for y. 1. 6 y – 12 x = 24 2. – 2 y – 4 x = 20 3. 2 y – 5 x = 16 - PowerPoint PPT Presentation
Citation preview

Pre-Algebra
11-1 Graphing Linear Equations11-1 Graphing Linear Equations
Pre-Algebra
Warm UpWarm Up
Problem of the DayProblem of the Day
Lesson PresentationLesson Presentation

Pre-Algebra
11-1 Graphing Linear Equations
Warm UpSolve each equation for y.
1. 6y – 12x = 24
2. –2y – 4x = 20
3. 2y – 5x = 16
4. 3y + 6x = 18
y = 2x + 4
y = -2x - 10
Pre-Algebra
11-1 Graphing Linear Equations
y = -2x + 6
y = x + 852

Pre-Algebra
11-1 Graphing Linear Equations
Problem of the Day
The same photo book of Niagara Falls costs $5.95 in the United States and $8.25 in Canada. If the exchange rate is $1.49 in Canadian dollars for each U.S. dollar, in which country is the book a better deal? Canada

Pre-Algebra
11-1 Graphing Linear Equations
Learn to identify and graph linear equations.

Pre-Algebra
11-1 Graphing Linear Equations
Vocabulary
linear equation

Pre-Algebra
11-1 Graphing Linear Equations
A linear equation is an equation whose solutions fall on a line on the coordinate plane. All solutions of a particular linear equation fall on the line, and all the points on the line are solutions of the equation. To find a solution that lies between two points (x1, y1) and (x2, y2), choose an x-value between x1 and x2 and find the corresponding y-value.

Pre-Algebra
11-1 Graphing Linear Equations
Read x1 as “x sub one” or “x one.”
Reading Math
Pre-Algebra
11-1 Graphing Linear Equations
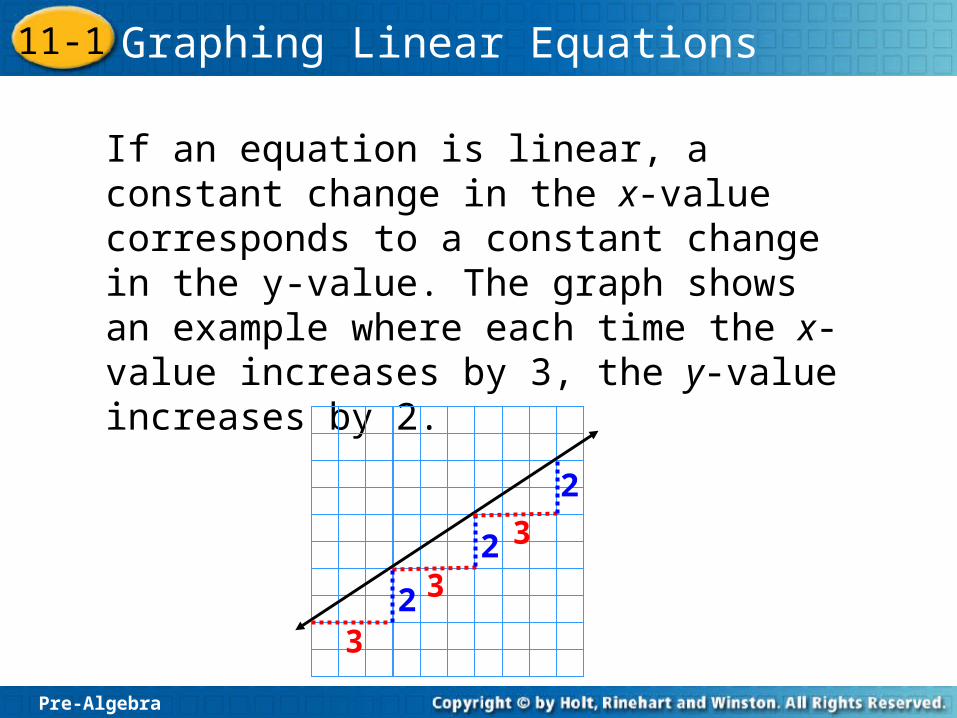
If an equation is linear, a constant change in the x-value corresponds to a constant change in the y-value. The graph shows an example where each time the x-value increases by 3, the y-value increases by 2.
3
3
3
2
2
2

Pre-Algebra
11-1 Graphing Linear Equations
Graph the equation and tell whether it is linear.
A. y = 3x – 1
Additional Example 1A: Graphing Equations
x 3x – 1 y (x, y)
–2
–1
0
1
2
–73(–2) – 13(–1) – 1
3(0) – 13(1) – 1
3(2) – 1
–4
–1
2
5
(–2, –7)
(–1, –4)(0, –1)
(1, 2)(2, 5)

Pre-Algebra
11-1 Graphing Linear Equations
Additional Example 1A Continued
The equation y = 3x – 1 is a linear equation because it is the graph of a straight line and each time x increases by 1 unit, y increases by 3 units.

Pre-Algebra
11-1 Graphing Linear Equations
Graph the equation and tell whether it is linear.
B. y = x3
Additional Example 1B: Graphing Equations
x x3 y (x, y)
–2
–1
0
1
2
–8(–2)3
(–1)3
(0)3
(1)3
(2)3
–1
0
1
8
(–2, –8)
(–1, –1)(0, 0)
(1, 1)(2, 8)

Pre-Algebra
11-1 Graphing Linear Equations
Additional Example 1B Continued
The equation y = x3 is not a linear equation because its graph is not a straight line. Also notice that as x increases by a constant of 1 unit, the change in y is not constant.
x –2 –1 0 1 2
y –8 –1 0 1 8
+7 +1 +1 +7

Pre-Algebra
11-1 Graphing Linear Equations
Additional Example 1C: Graphing EquationsGraph the equation and tell whether it is linear.
C. y = – 3x4

Pre-Algebra
11-1 Graphing Linear Equations
Additional Example 1 Continued
The equation y = –
is a linear equation
because the points
form a straight line.
Each time the value of
x increases by 1, the
value of y decreases by
or y decreases by 3
each time x increases
by 4.
3x4
34

Pre-Algebra
11-1 Graphing Linear Equations
Graph the equation and tell whether it is linear.
D. y = 2
Additional Example 1D: Graphing Equations
For any value of x, y = 2.
x 2 y (x, y)
–2
–1
0
1
2
222
2
2
2
2
2
2
2
(–2, 2)
(–1, 2)(0, 2)
(1, 2)(2, 2)

Pre-Algebra
11-1 Graphing Linear Equations
Additional Example 1D Continued
The equation y = 2 is a linear equation because the points form a straight line. As the value of x increases, the value of y has a constant change of 0.

Pre-Algebra
11-1 Graphing Linear Equations
Graph the equation and tell whether it is linear.
A. y = 2x + 1
Try This: Example 1A
x 2x + 1 y (x, y)
–2
–1
0
1
2
–32(–2) + 12(–1) + 1
2(0) + 12(1) + 1
2(2) + 1
–1
1
3
5
(–3, –3)
(–2, –1)(–1, 1)
(0, 3)(2, 5)

Pre-Algebra
11-1 Graphing Linear Equations
Try This: Example 1A Continued
The equation y = 2x + 1is linear equation because it is the graph of a straight line and each time x increase by 1 unit, y increases by 2 units.

Pre-Algebra
11-1 Graphing Linear Equations
Graphing the equation and tell whether it is linear.
B. y = x2
Try This: Example 1B
x x2 y (x, y)
–2
–1
0
1
2
4(–2)2
1
0
1
4
(–2, 4)
(–1, 1)(0, 0)
(1, 1)(2, 4)
(–1)2
(0)2
(1)2
(2)2

Pre-Algebra
11-1 Graphing Linear Equations
Try This: Example 1B Continued
The equation y = x2 is not a linear equation because its graph is not a straight line.

Pre-Algebra
11-1 Graphing Linear Equations
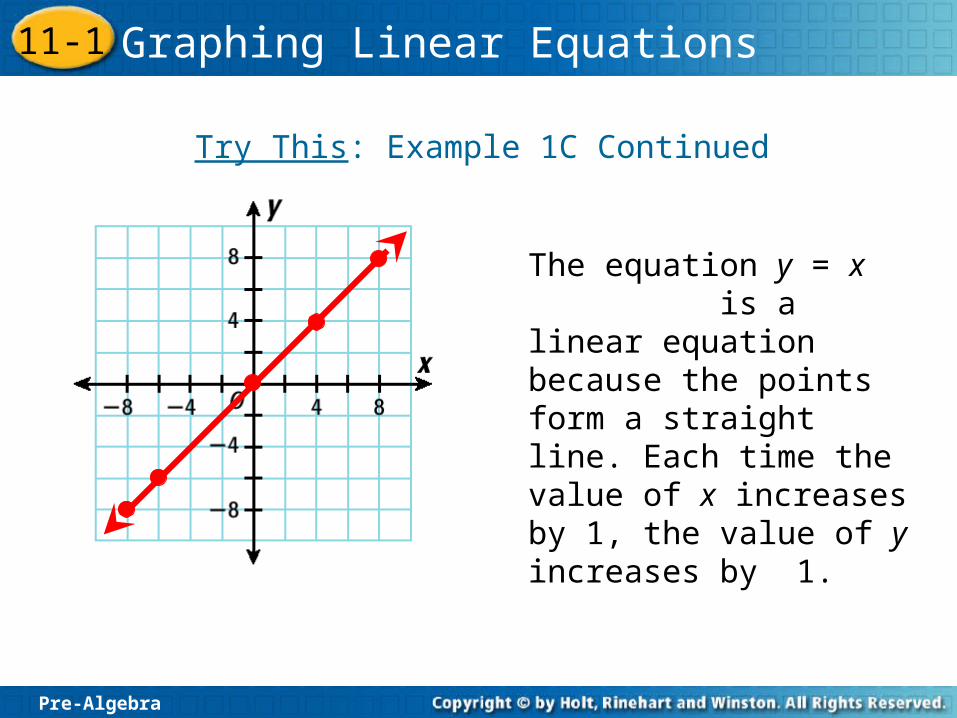
Try This: Example 1CGraph the equation and tell whether it is linear.
C. y = x
x y (x, y)
–8
–6
0
4
8
–8
–6
0
4
8
(–8, –8)
(–6, –6)(0, 0)
(4, 4)(8, 8)
Pre-Algebra
11-1 Graphing Linear Equations
Try This: Example 1C Continued
The equation y = x is a linear equation because the points form a straight line. Each time the value of x increases by 1, the value of y increases by 1.

Pre-Algebra
11-1 Graphing Linear Equations
Try This: Example 1D
For any value of x, y = 7.
Graph the equation and tell whether it is linear.
D. y = 7
x 7 y (x, y)
–8
–4
0
4
8
777
7
7
7
7
7
7
7
(–8, 7)
(–4, 7)(0, 7)
(4, 7)(8, 7)

Pre-Algebra
11-1 Graphing Linear Equations
Try This: Example 1D Continued
The equation y = 7 is a linear equation because the points form a straight line. As the value of x increases, the value of y has a constant change of 0.

Pre-Algebra
11-1 Graphing Linear Equations
Additional Example 2: Sports Application
A lift on a ski slope rises according to the equation a = 130t + 6250, where a is the altitude in feet and t is the number of minutes that a skier has been on the lift. Five friends are on the lift. What is the altitude of each person if they have been on the ski lift for the times listed in the table? Draw a graph that represents the relationship between the time on the lift and the altitude.

Pre-Algebra
11-1 Graphing Linear Equations
Additional Example 2 Continued

Pre-Algebra
11-1 Graphing Linear Equations
Additional Example 2 Continued

Pre-Algebra
11-1 Graphing Linear Equations
The altitudes are: Anna, 6770 feet; Tracy, 6640 feet; Kwani, 6510 feet; Tony, 6445 feet; George, 6380 feet. This is a linear equation because when t increases by 1 unit, a increases by 130 units. Note that a skier with 0 time on the lift implies that the bottom of the lift is at an altitude of 6250 feet.
Additional Example 2 Continued

Pre-Algebra
11-1 Graphing Linear Equations
Try This: Example 2In an amusement park ride, a car travels according to the equation D = 1250t where t is time in minutes and D is the distance in feet the car travels. Below is a chart of the time that three people have been in the cars. Graph the relationship between time and distance. How far has each person traveled?
Rider Time
Ryan 1 min
Greg 2 min
Colette 3 min

Pre-Algebra
11-1 Graphing Linear Equations
Try This: Example 2 Continued
t D =1250t D (t, D)
1 1250(1) 1250 (1, 1250)
2 1250(2) 2500 (2, 2500)
3 1250(3) 3750 (3, 3750)
The distances are: Ryan, 1250 ft; Greg, 2500 ft; and Collette, 3750 ft.

Pre-Algebra
11-1 Graphing Linear Equations
Try This: Example 2 Continued
x
y
This is a linear equation because when t increases by 1 unit, D increases by 1250 units.
1250
2500
1 2
3750
5000
3 4Time (min)
Dis
tan
ce (
ft)

Pre-Algebra
11-1 Graphing Linear Equations
Lesson Quiz
Graph each equation and tell whether it is linear.
1. y = 3x – 1
2. y = x
3. y = x2 – 3
yes
yes
no
14