Embed Size (px)
Citation preview

7/27/2019 10.Transient
http://slidepdf.com/reader/full/10transient 1/6
10 Transient two-phase flow
Objectives: Quantitative insights into transient mechanisms and phenomena
Until now we have assumed the same mass flow in and out and constant mass flow along the
pipe. For given gas and liquid flow out, can we find the gas and liquid flow, speed, density
and pressure gradient along the pipe, and so estimate the pressure drop and flow capacity.
But if the inflow is changed, it takes time before the mass flow again becomes stationary.
During this period, the outflow is quite different from before, and also quite different from the
outflow after the transient period is over. In the transient period the liquid in the pipe may
flow and fill the inlet separators at the process facility. In a gas lift system, transient
fluctuations affect the inflow so that the changes may be sustained and reinforced so that thesystem becomes dynamically unstable, Asheim/1988 /. Thus, we can not ignore transient
effects.
To calculate transient two-phase flow, we must include continuity equations for gas and
liquid. In the flow equation, we must include the acceleration during time. This is done in
numerical simulators widely used in the oil industry, Bendiksen oa/1991 /. But since numeric
simulators are large and their source code often confidential, we will here focus on analytical
methods. This enables simple estimates and provide insight into transient mechanisms that
also may enable more efficient use of numerical simulators.
10.1 Pressure waves
10.1.1 Wave velocityThe relationship between pressure, velocity and density can be expressed by the Bernoulli
equation: 0dpdpvdvdp f h . If mass flow is constant: vAm and density depends
on the pressure we get the acceleration term: d vvdv 2 so that the pressure gradient is
dpd v1
dxdpdxdp
dx
dp2
f h
(10-1)
We see that if the denominator in (10-1) is zero, the pressure gradient approaches infinity.
This implies a critical speed related to the density and pressure
dp / d
1v*
(10-2)
This velocity is the largest that can occur in a pipes of constant cross section. It also quantifies
how fast a change in pressure propagates. If the outflow from a well increases, the velocity
will first increase at the top of the well. It will then propagate down the pipe as a pressure
wave at velocity given above.

7/27/2019 10.Transient
http://slidepdf.com/reader/full/10transient 2/6
Equation (10-2) is valid for all compressible fluids (gas, liquid, and mixtures), but the
density/pressure relation varies. For single-phase gas, this can be estimated reasonably
accurately with the adiabatic state equation. For two-phase flow density changes can be
related to the compressibility of the mixture: TP TP TP cdpd . Compressibility must
correspond to the average for gas and liquid
l l g g TP yc ycc (10-3)
Average density is: l l g g TP y y . Putting this into (10-2) the wave speed in
homogeneous two-phase mixtures may be estimated
l l l TP TP
*
y1 y
p
c
1v
(10-4)
The approximation indicated above is obtained by neglecting liquid compressibility: cl = 0,and assuming isothermal compressibility and constant z-factor to express gas compressibility:
p1c g , and neglecting the gas density. In total this assumes that the gas provides the
compressibility of the mixture and the liquid the mass, which is reasonably accurate at modest
pressure.
Figure 10.1 shows the critical speed calculated from (10-4), for a mixture of gas and liquid
with specific densities g = 0.7 , and: l = 1, temperature 288 K, z = 0.9, and: cl = 10-9. We see
that at low pressure and liquid fraction around: 0.5, the wave speed is close to 30 m/s.
Figure 10.1 Speed of pressure waves in two phase mixture
While the wave velocities in pure gases and liquids are reasonably constant, the velocity in
mixtures depends on the fraction. Mixtures can thus behave quite differently from the pure
substances they are made up of. The sometimes dramatic effects of powder snow avalanches
may be attributed to this: If the avalanche approaches the critical velocity of the snow/air

7/27/2019 10.Transient
http://slidepdf.com/reader/full/10transient 3/6
mixture, it will have little ability to flow around obstacles, but to hit with full weight.
10.1.2 Pressure Change Speed change propagates as a pressure wave propagates along the pipe. Figure 10.2 illustrates
a control volume that encloses the pressure wave and follows this
Ahead of the control volume a fluid mixture of density:1TP
enters with speed: 1m
* vv . In
the rear a fluid mixture leaves with density:2TP and speed: 1m
*vv . A momentum balance
then gives for when pressure drop:
2
1m
*
1TP
2
2m
*
2TP a vvvv p
. Density changescan be estimated as: a1TP TP 1TP 2TP pc . This gives the pressure drop estimate
1m2m
*
1TP
1TP TP
1m2m
*
1TP a vvv2
c1
vvv2 p
(10-5)
10.2 Wave equation
Changes of speed and pressure will then propagate along the pipe with speed v*, so that that
changes at distance: x along the pipe, will occur at time: t = L / v*. This and similar
phenomena, we can express the general wave equation
t v x f z f k (10-6)
The equation describes a form: f (z) moves with speed: vk . The form can be a single wave, or
periodic fluctuations and may change with time and place, but must be recognizable. Figure
10.3 illustrates a wave front, shock: y z f . We may imagine a tsunami approaching land
with speed: vk = 10 m / s, the front initially being : xo. Five seconds later: t-to = 5s, the front
have reached: m50t t v x x ok o , that is 50 meter closer to shore.
Figure 10.3: Wave propagation

7/27/2019 10.Transient
http://slidepdf.com/reader/full/10transient 4/6
Periodic waves usually expressed as: t kxcos A y , or: t kxi Ae y
, where denotes
the angular frequency and k is the wave number. The speed then corresponds to the ratio
between angular frequency and wave number: k vk . Periodic waves are thus consistent
with the general wave equation (6.10).
10.3 Kinematic waves
Kinematic waves denote waves that occur related to concentration. It often called continuity
waves. Such wave phenomena can occur in many contexts.
An entertaining example is traffic jams: Most people have probably experienced that heavy
traffic seldom flows smoothly and that the congestions can form and dissolve for no apparent
reason. If one considers the flow of cars, it will obviously be small at low car density, but also
small at high car density. (Drivers will slow down when the distance to the car in front
becomes uncomfortably short). The flow thus depends on density. Speed adjustment from asingle driver will change the local density and the change can propagate backward to form
congestions.
10.3.1 Kinematic waves in two-phase flow In two-phase flow, changes in liquid fraction may propagate along the pipe. Since mass can
not disappear, such changes must satisfy the continuity equation
0 x
v
t
mmTP
(10-7)
The sum of gas and liquid fraction is unity, so it is sufficient to look at the liquid fraction. The
gas fraction will follow as: y g = 1-yl . When we neglect the changes of density, the continuity
equation can be written
0 x
yv
t
y l k
l
(10-8)
mvl
sl k
dy
dvv (10-9)
Equation (10-8) is in accordance with the general wave equation (10-1). We see this byexpressing a change in liquid fraction as a wave: t v x y y z f k l l and verify that this
fulfills (10-8). Thus fraction changes may propagate as waves, with speed: l sl k dydvv .
10.3.2 Fluid flow and wave speedWe have previously assumed that the gas speed can be related to the fluid speed and slip
parameters: ,.v ,C ,vv ool g and calculated stationary liquid fraction: ,...v ,C ,v ,v y oo sl sg l . If the
liquid fraction and the total flow is known, we can find liquid flow similarly:
,.v ,C , y ,vv ool m sl . Assuming the linearization of the slip relationship: ol o g vvC v we get
7/27/2019 10.Transient
http://slidepdf.com/reader/full/10transient 5/6
l l o
2
l ol oml m sl
y y1C
yv yvv y ,vv
(10-10)
When the liquid fraction is: yl and the total flow is: vm, the flow liquid may thus be estimated.
The flow of gas : vsg = vm-vsl. Wave speed is found then by differentiating (10-10)
2l l o
2
l ool ooooml mk
y y1C
yv1C yvC 2C vv y ,vv
(10-11)
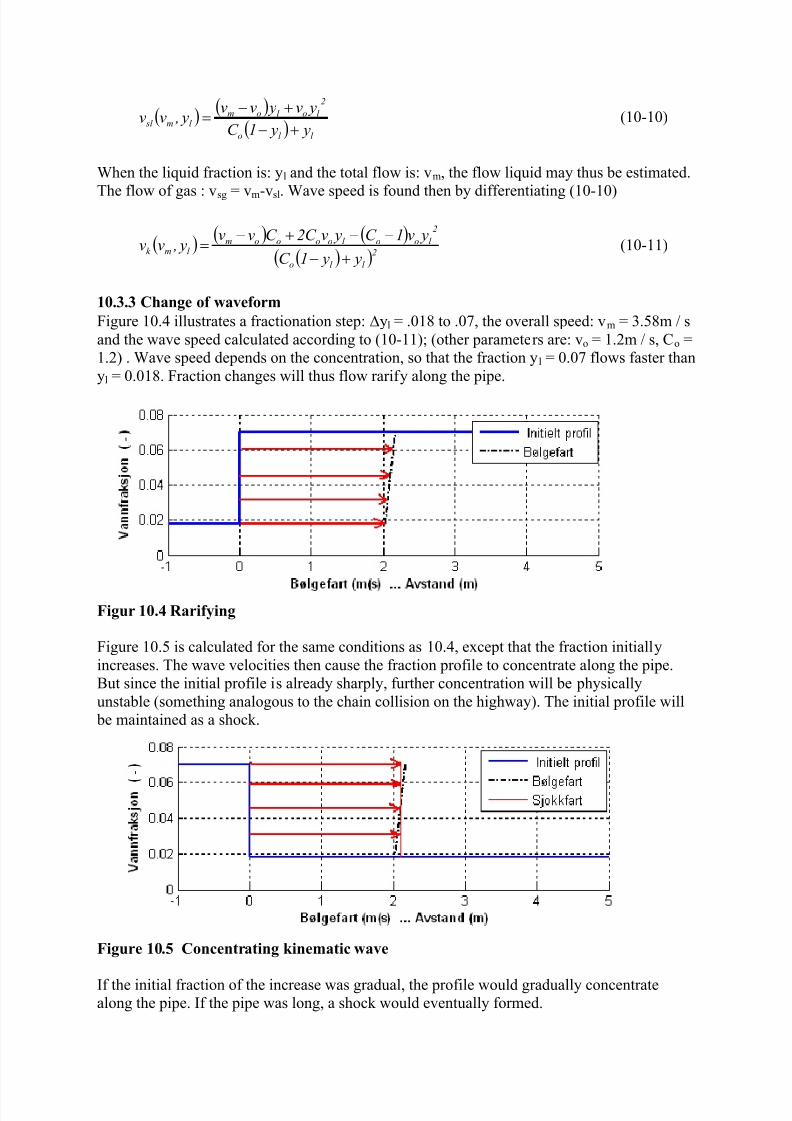
10.3.3 Change of waveform
Figure 10.4 illustrates a fractionation step: yl = .018 to .07, the overall speed: vm = 3.58m / s
and the wave speed calculated according to (10-11); (other parameters are: vo = 1.2m / s, Co =
1.2) . Wave speed depends on the concentration, so that the fraction yl = 0.07 flows faster than
yl = 0.018. Fraction changes will thus flow rarify along the pipe.
Figur 10.4 Rarifying
Figure 10.5 is calculated for the same conditions as 10.4, except that the fraction initially
increases. The wave velocities then cause the fraction profile to concentrate along the pipe.
But since the initial profile is already sharply, further concentration will be physically
unstable (something analogous to the chain collision on the highway). The initial profile will
be maintained as a shock.
Figure 10.5 Concentrating kinematic wave
If the initial fraction of the increase was gradual, the profile would gradually concentratealong the pipe. If the pipe was long, a shock would eventually formed.

7/27/2019 10.Transient
http://slidepdf.com/reader/full/10transient 6/6
10.4.3 Shock Mathematically we approximate an abrupt change in concentration by a shock. Figure 10.6
shows a shock enclosed in a control volume. We disregard the details inside the control
volume, but require that mass and may be also momentum is conserved through the shock
Figure 10.6 Shock
If the shock moves with speed vf , as illustrated above, and we let the control volume follow
the shock, the fluid flow into the control volume becomes: 2 ,l 2 ,l f i yvvQ , and fluid flow
out 1 ,l 1 ,l f u yvvQ . Liquid speed depends superficial velocity and fraction: l sl l yvv . To
maintain mass balance, the inlet and outlet streams should be equal: Qu = Qi. This gives the
shock speed
1 ,l 2 ,l
1 , sl 2 , sl
f y y
vvv
(10-12)
Similar momentum balance will provide an estimate of the pressure drop across the shock.
Since the shock speed usually will not deviate much from the average flow speed, the
momentum change will be small and may usually be neglected.
References
1973 Whitham, G. B.: Linear and nonlinear waves
John Wiley & sons, NY, 1973
1988 Asheim, H.: "Criteria for Gas-Lift Stability".
J. of Petroleum Technology, Nov. 1988, pp. 1452-1456
1991 Bendiksen, K.H., Malnes, D., Moe, R., Nuland, S.:
“The Dynamic Two-Fluid Model OLGA: Theory and Application”
SPE Prod. Engr., May 1991
1998 Asheim, H., and Grødal, E.:
"Holdup propagation predicted by steady-state drift flux models",
Int. Journal of Multiphase Flow, vol. 24, no. 5, August 1998, 757