Embed Size (px)
Citation preview
10th CMAS Conference
Special Session on AQ Modeling Applications
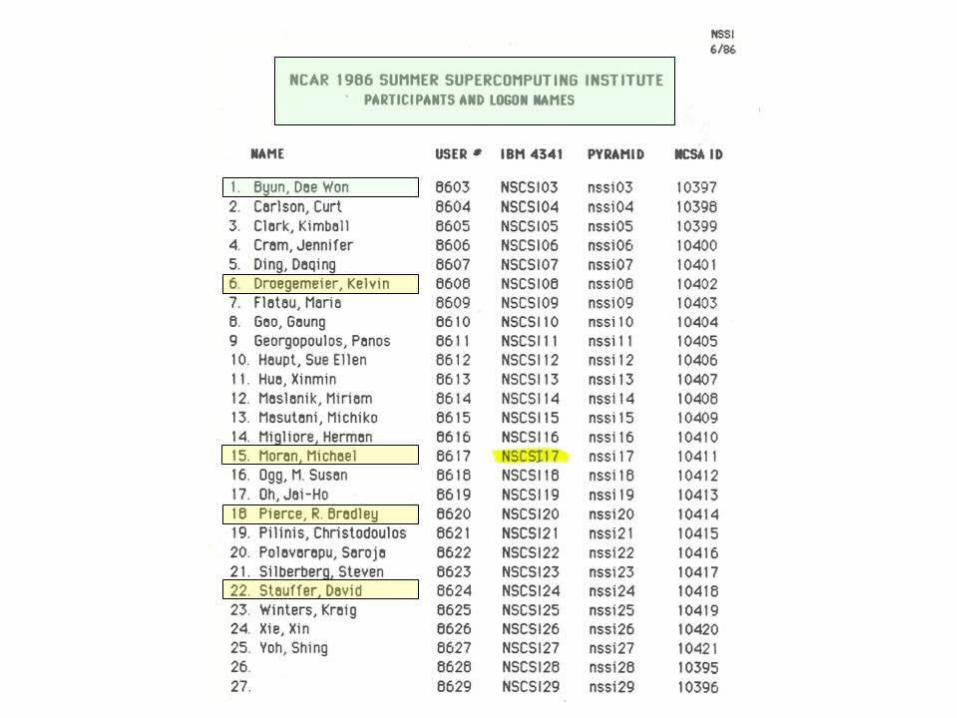
In Memory of Dr. Daewon Byun
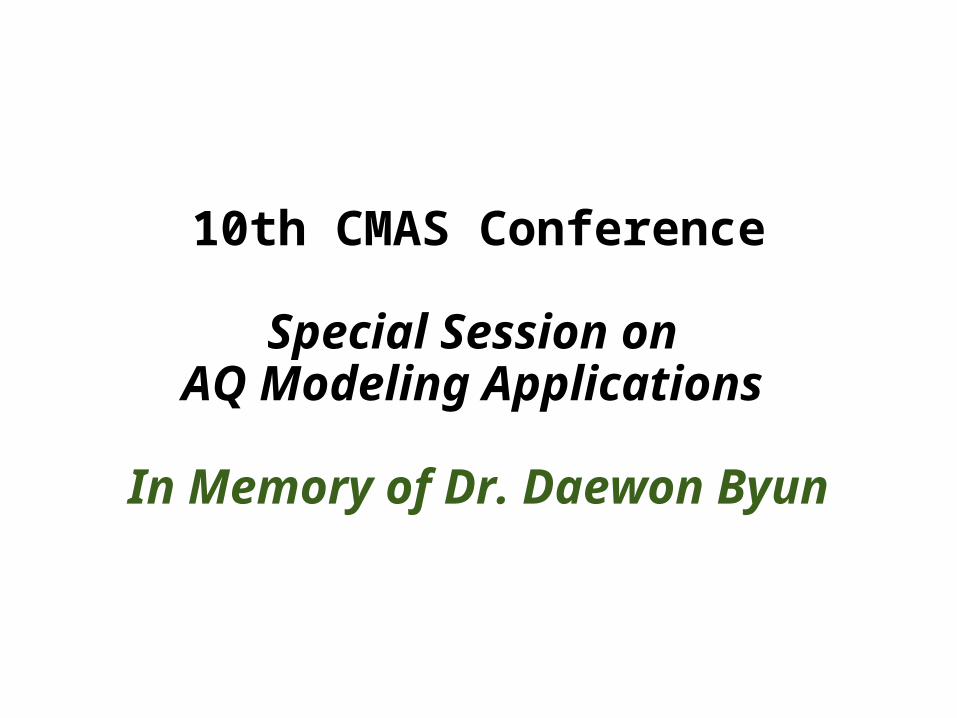
View of NCAR Mesa Lab, Boulder, Colorado
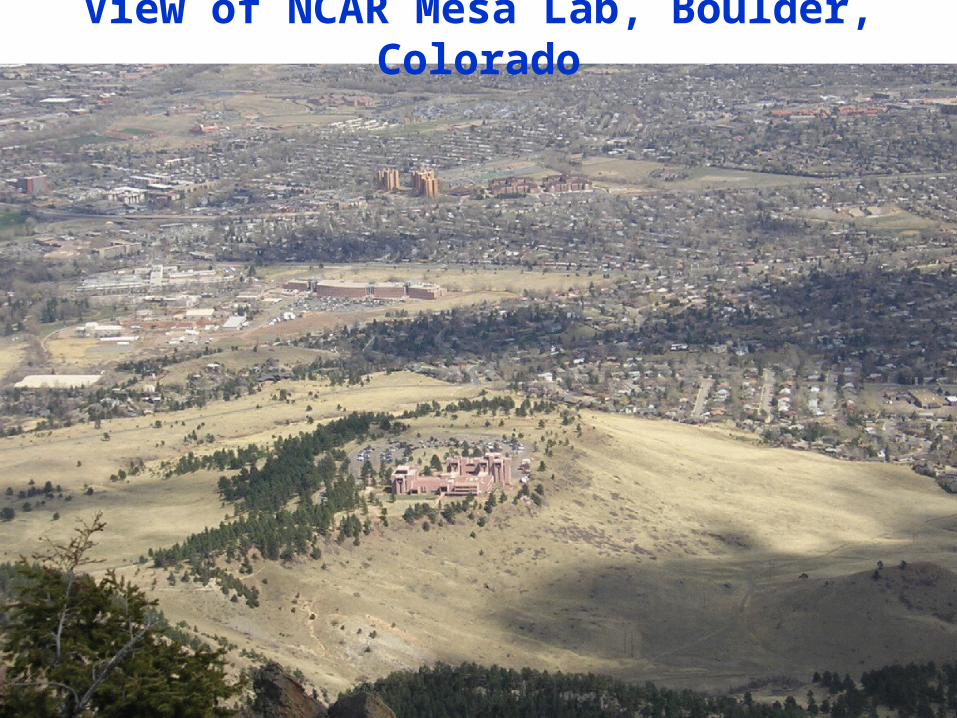
1986 NCAR Summer Supercomputing Institute
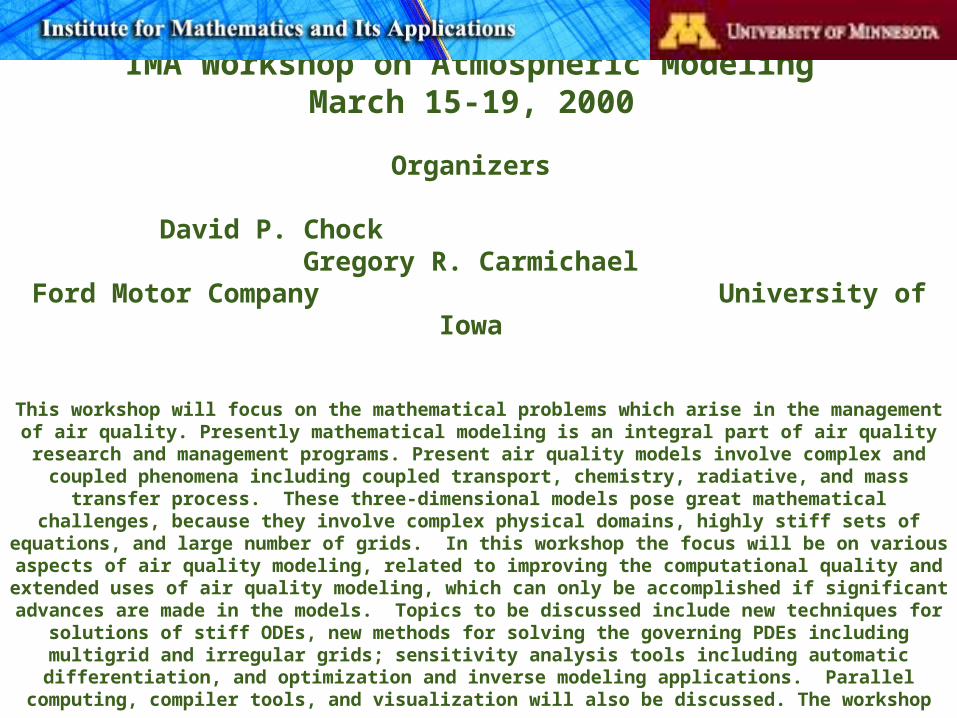
IMA Workshop on Atmospheric Modeling March 15-19, 2000
Organizers
David P. Chock Gregory R. Carmichael Ford Motor Company University of Iowa
This workshop will focus on the mathematical problems which arise in the management of air quality. Presently mathematical modeling is an integral part of air quality research and management programs.
Present air quality models involve complex and coupled phenomena including coupled transport, chemistry, radiative, and mass transfer process. These three-dimensional models pose great
mathematical challenges, because they involve complex physical domains, highly stiff sets of equations, and large number of grids. In this workshop the focus will be on various aspects of air quality modeling, related to improving the computational quality and extended uses of air quality modeling, which can only
be accomplished if significant advances are made in the models. Topics to be discussed include new techniques for solutions of stiff ODEs, new methods for solving the governing PDEs including multigrid and irregular grids; sensitivity analysis tools including automatic differentiation, and optimization and
inverse modeling applications. Parallel computing, compiler tools, and visualization will also be
discussed. The workshop will bring together experts in modeling, analysis, and numerical analysis.
Two Years of Operational AQ Forecasting with GEM-MACH15: A Look Back and a Look Ahead
M.D. Moran1, J. Chen2, S. Ménard2, R. Pavlovic2, H. Landry2, P.-A. Beaulieu2, S. Gilbert2, P.A. Makar1, W. Gong1, C. Stroud1, A. Kallaur3, A. Robichaud3, S. Gong1, and D. Anselmo2
1Air Quality Research Division, Environment Canada, Toronto, Ontario, Canada 2Air Quality Modelling Applications Section, Environment Canada, Montreal, Quebec, Canada3Air Quality Research Division, Environment Canada, Montreal, Quebec, Canada
10th CMAS Conference, 24-26 October 2011, Chapel Hill, North Carolina
• AQHI + Canadian AQ Forecasting System
• Short GEM-MACH15 Overview
• Selected 2-Year Evaluation Results– more results in extended abstract
• Next Steps and Future Plans
Talk Outline
• Follows example of Canadian national UV index
• Year-round, health-based, additive, no-threshold, hourly AQ index
• Developed from daily time-series analysis of air pollutant concentrations and mortality data (Stieb et al., 2008)
• Weighted sum of NO2, O3, & PM2.5 concentrations
• 0 to 10+ range
AQHI: Canada’s National Air Quality Health Index
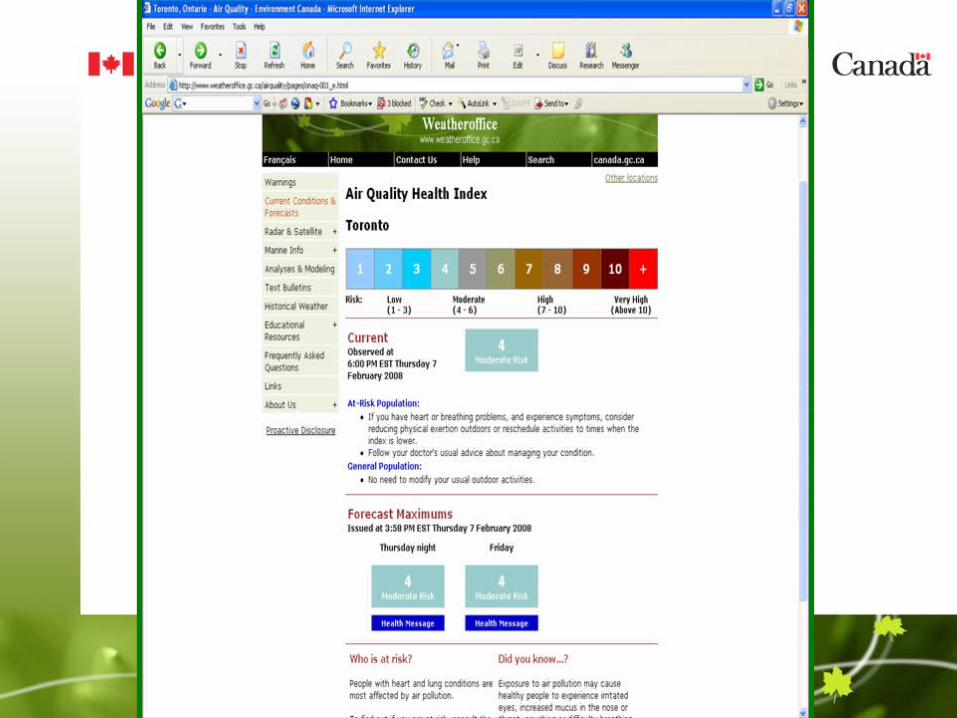
• Primary messaging tool is the AQHI
• Main target is urban areas > 100,000 population
• GEM-MACH15 coupled AQ / Wx forecast model provides guidance on AQHI component values (NO2, O3, PM2.5) and met fields
• UMOS-AQ/MIST statistical post-processing package combines GEM-MACH15 predicted AQ and met fields with previous day’s measured AQHI component values to forecast hourly AQHI component values ( large reduction in bias)
Canadian AQ Forecasting System
Acronym “GEM-MACH” Stands For
modèle Global Environnemental Multi-échelle –Modélisation de la qualité de l'Air et de la CHimie
et / and
Global Environmental Multiscale model – Modelling Air quality and CHemistry
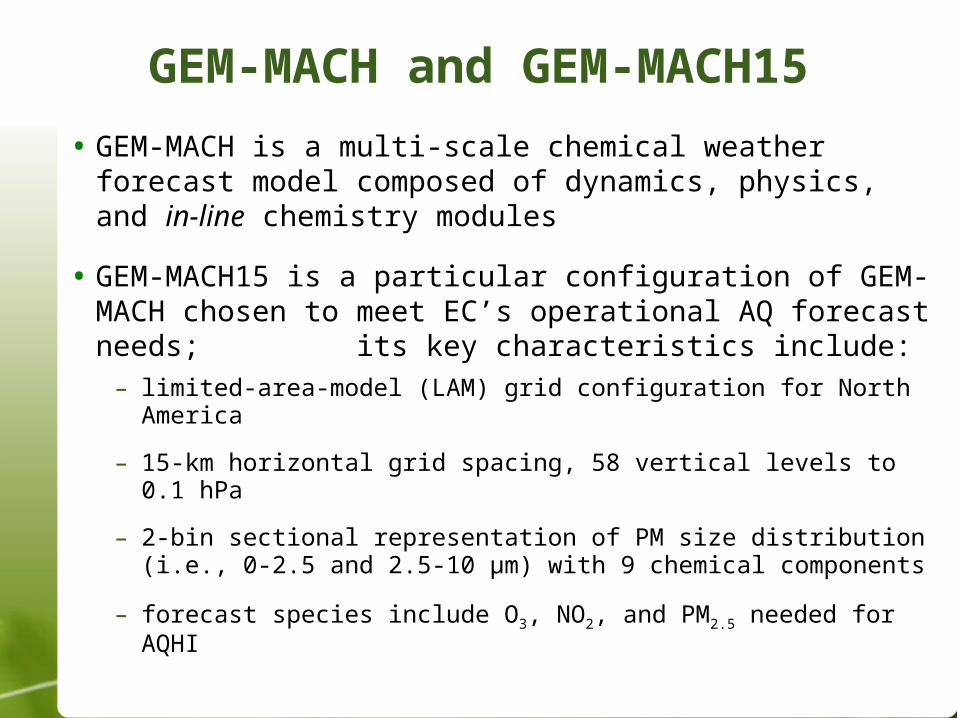
• GEM-MACH is a multi-scale chemical weather forecast model composed of dynamics, physics, and in-line chemistry modules
• GEM-MACH15 is a particular configuration of GEM-MACH chosen to meet EC’s operational AQ forecast needs; its key characteristics include:
– limited-area-model (LAM) grid configuration for North America
– 15-km horizontal grid spacing, 58 vertical levels to 0.1 hPa
– 2-bin sectional representation of PM size distribution (i.e., 0-2.5 and 2.5-10 μm) with 9 chemical components
– forecast species include O3, NO2, and PM2.5 needed for AQHI
GEM-MACH and GEM-MACH15
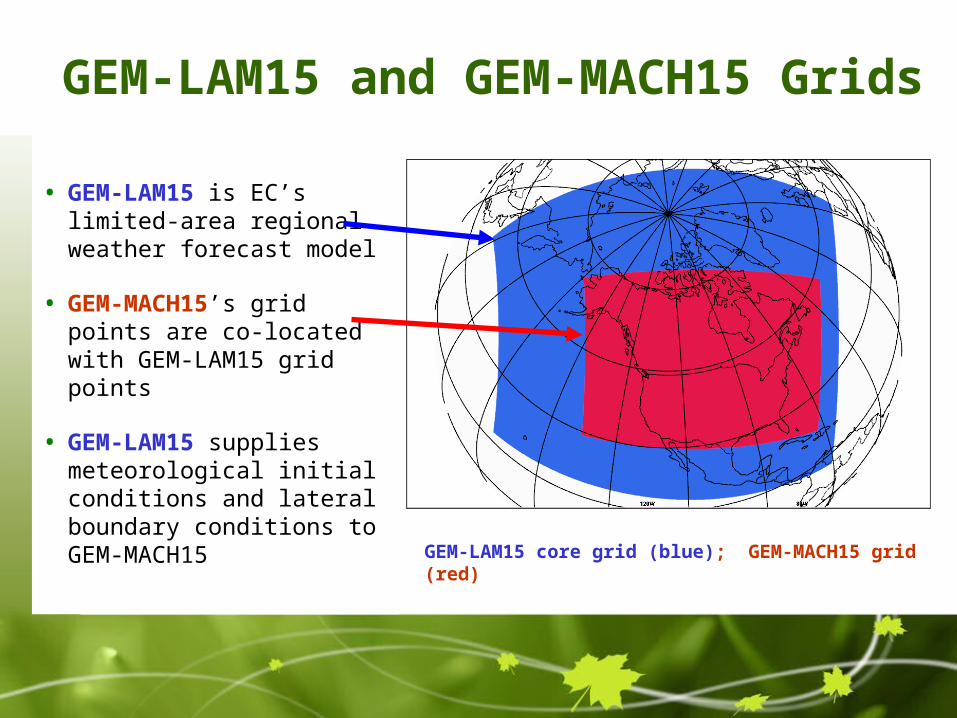
• GEM-LAM15 is EC’s limited-area regional weather forecast model
• GEM-MACH15’s grid points are co-located with GEM-LAM15 grid points
• GEM-LAM15 supplies meteorological initial conditions and lateral boundary conditions to GEM-MACH15
GEM-LAM15 and GEM-MACH15 Grids
GEM-LAM15 core grid (blue); GEM-MACH15 grid (red)
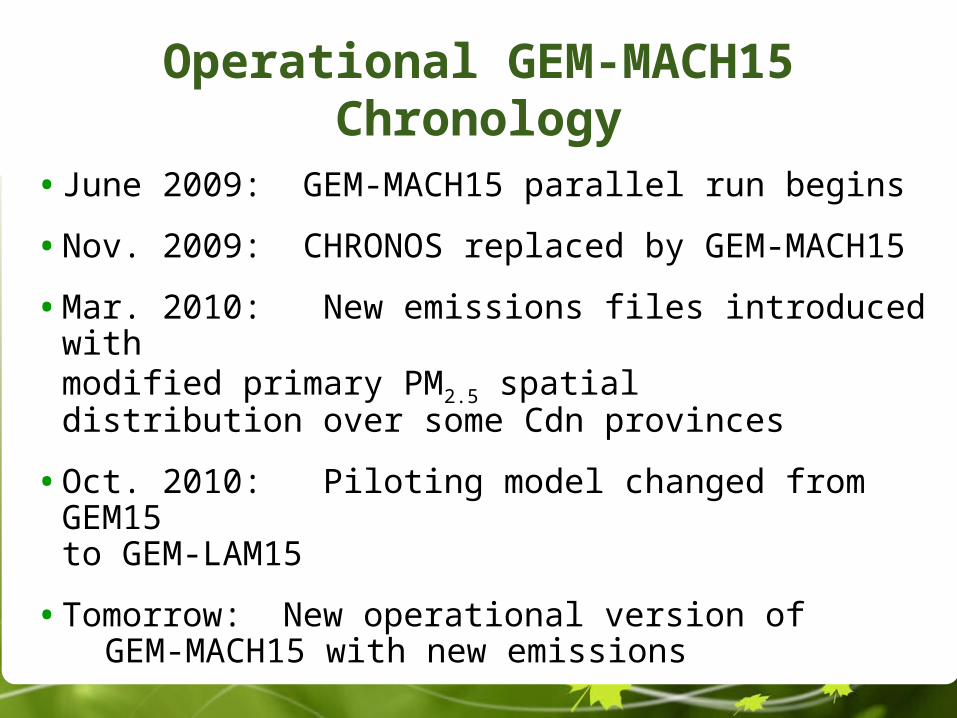
Operational GEM-MACH15 Chronology
• June 2009: GEM-MACH15 parallel run begins
• Nov. 2009: CHRONOS replaced by GEM-MACH15
• Mar. 2010: New emissions files introduced with modified primary PM2.5 spatialdistribution over some Cdn provinces
• Oct. 2010: Piloting model changed from GEM15 to GEM-LAM15
• Tomorrow: New operational version of GEM-MACH15 with new emissions
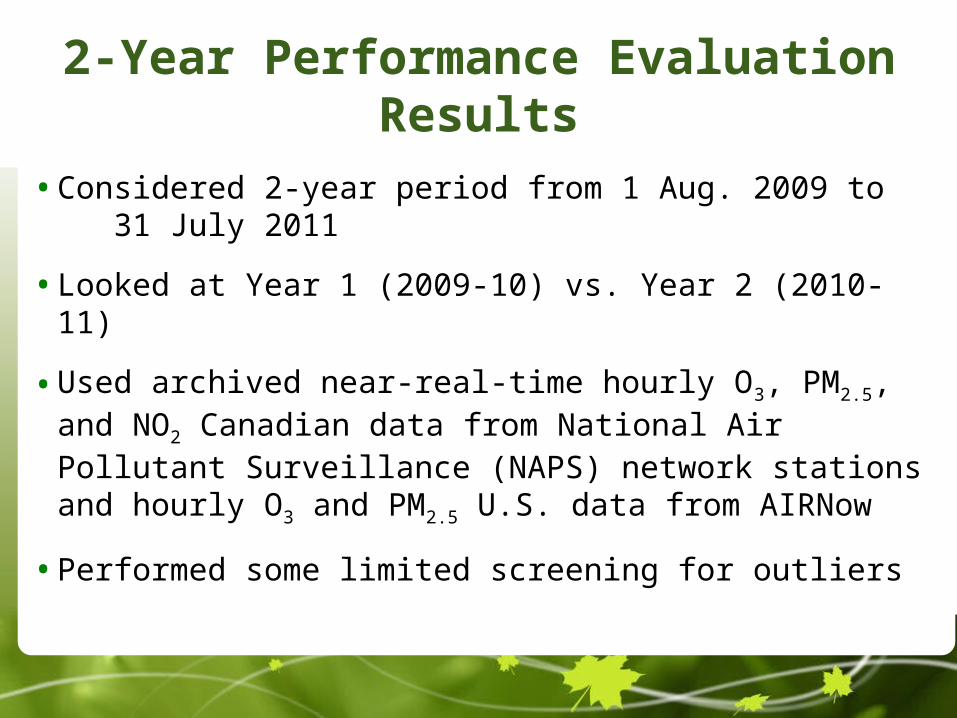
• Considered 2-year period from 1 Aug. 2009 to 31 July 2011
• Looked at Year 1 (2009-10) vs. Year 2 (2010-11)
• Used archived near-real-time hourly O3, PM2.5, and NO2 Canadian data from National Air Pollutant Surveillance (NAPS) network stations and hourly O3 and PM2.5 U.S. data from AIRNow
• Performed some limited screening for outliers
2-Year Performance Evaluation Results
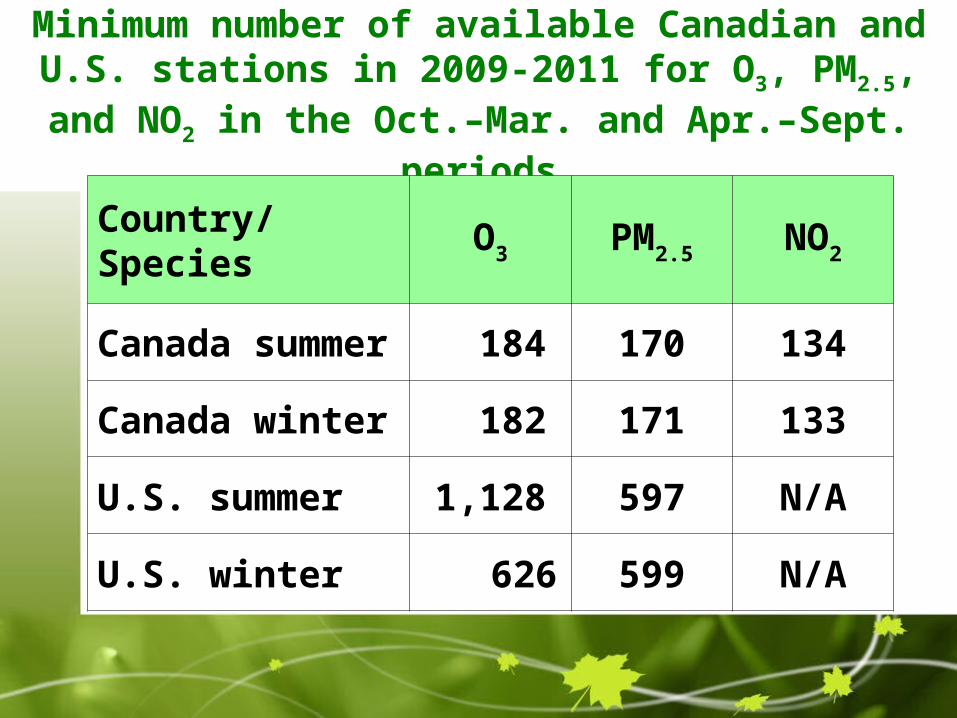
Minimum number of available Canadian and U.S. stations in 2009-2011 for O3, PM2.5, and NO2 in the
Oct.–Mar. and Apr.–Sept. periods
Country/Species O3 PM2.5 NO2
Canada summer 184 170 134
Canada winter 182 171 133
U.S. summer 1,128 597 N/A
U.S. winter 626 599 N/A
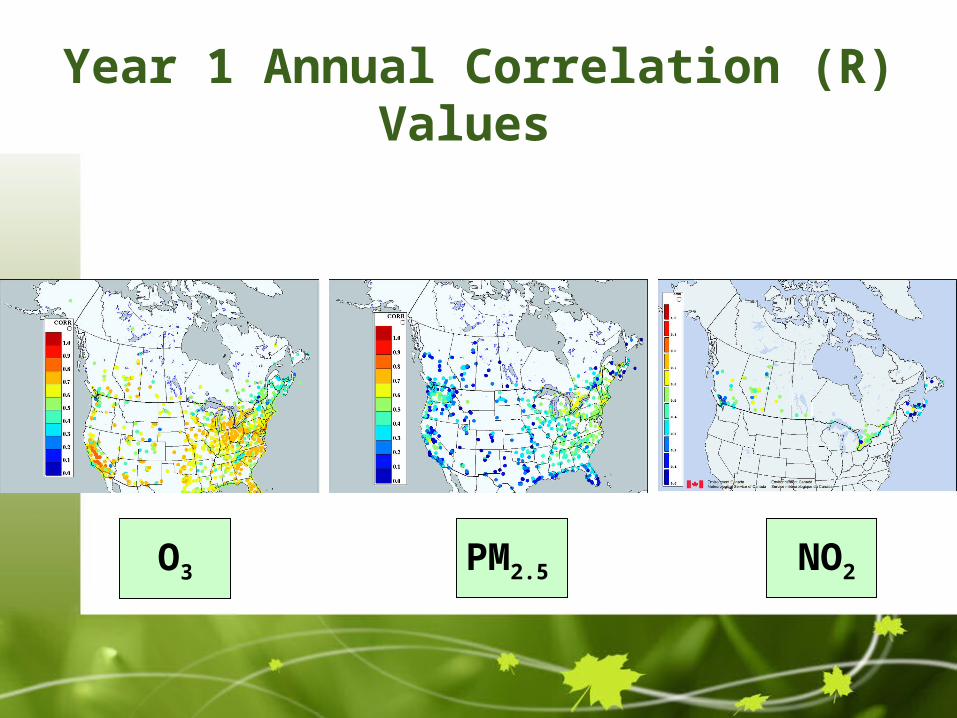
Year 1 Annual Correlation (R) Values
O3 PM2.5 NO2
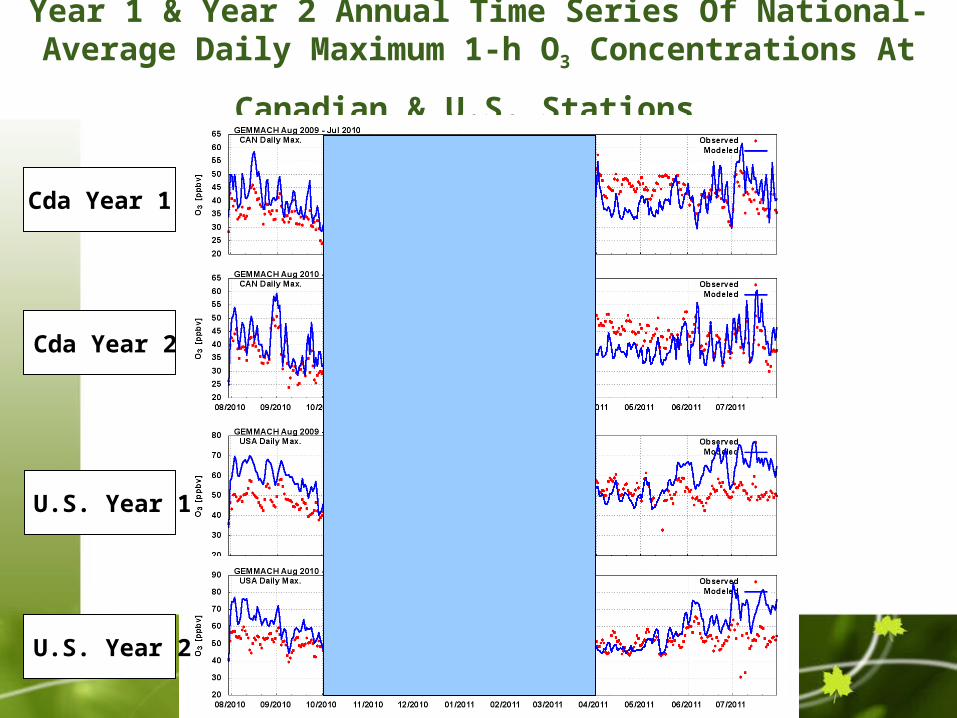
Year 1 & Year 2 Annual Time Series Of National-Average Daily
Maximum 1-h O3 Concentrations At Canadian & U.S. Stations
Cda Year 1
U.S. Year 2
U.S. Year 1
Cda Year 2
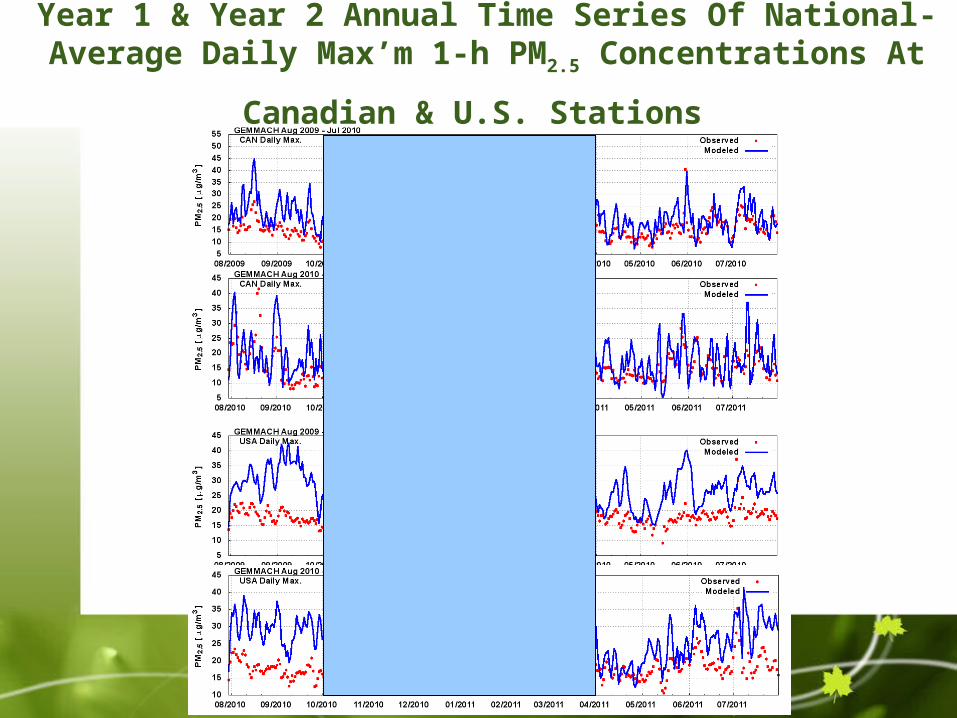
Year 1 & Year 2 Annual Time Series Of National-Average Daily
Max’m 1-h PM2.5 Concentrations At Canadian & U.S. Stations
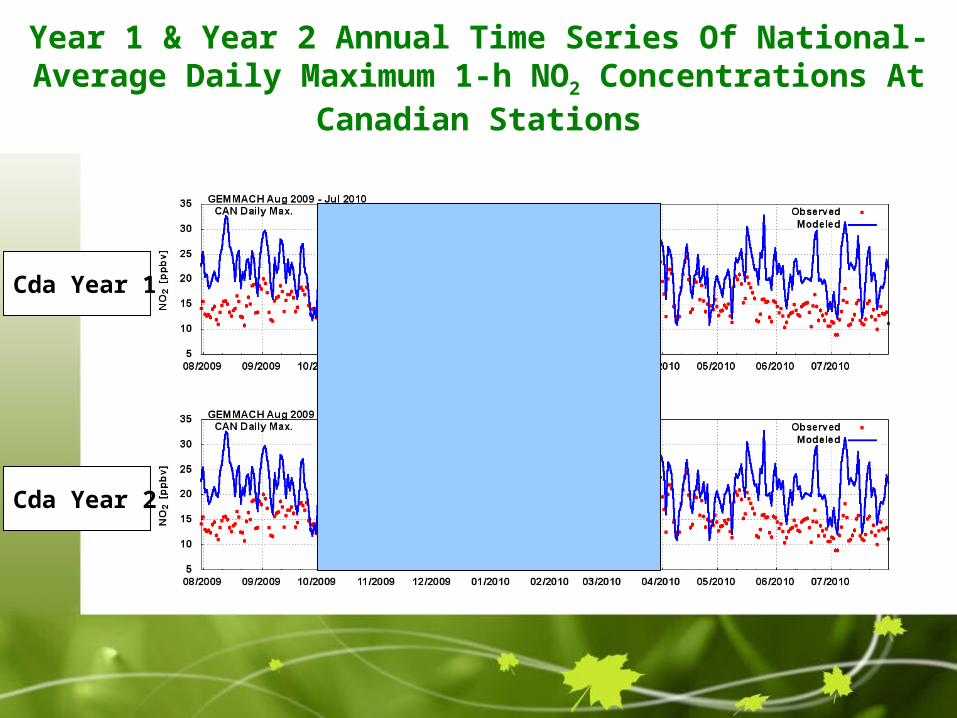
Year 1 & Year 2 Annual Time Series Of National-Average Daily Maximum 1-h NO2 Concentrations At Canadian Stations
Cda Year 1
Cda Year 2
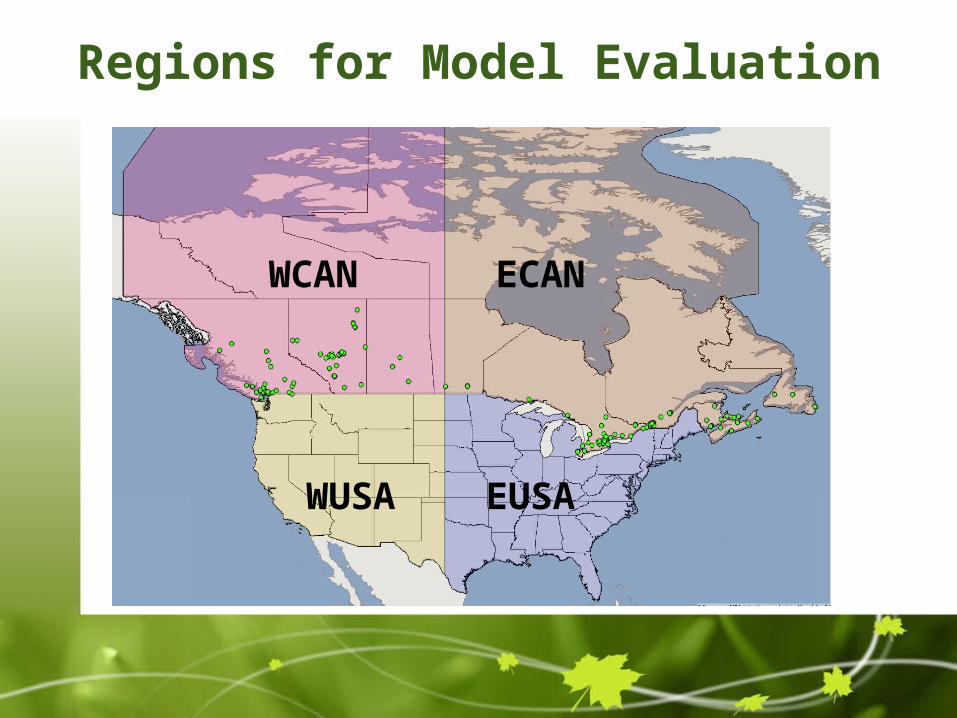
Regions for Model Evaluation
EUSA
ECANWCAN
WUSA
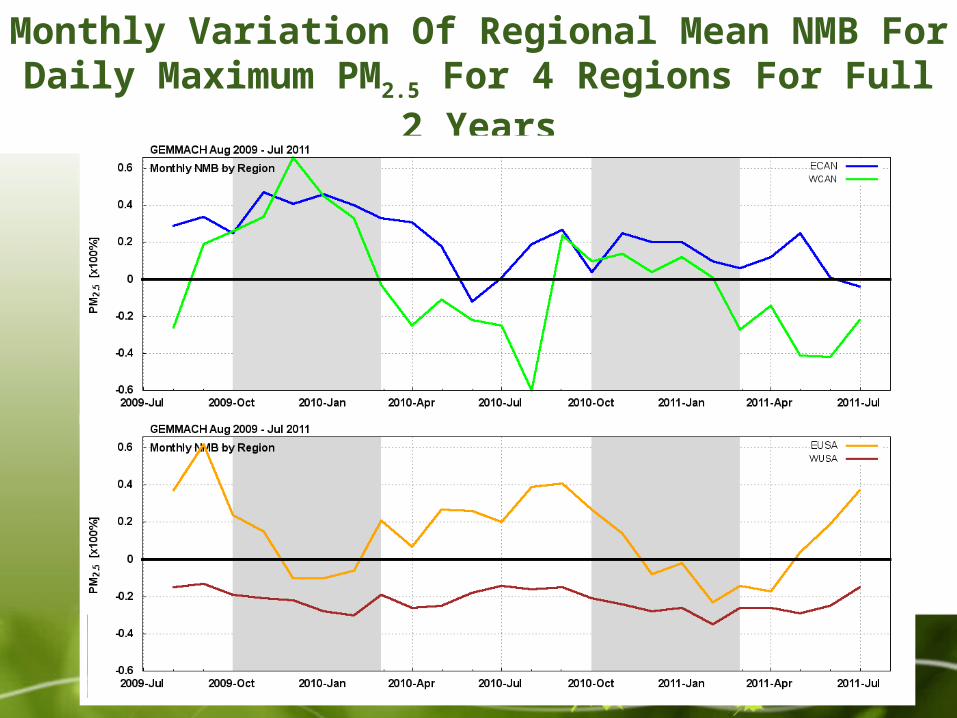
Monthly Variation Of Regional Mean NMB For Daily Maximum PM2.5 For 4 Regions For Full 2 Years
Other statistics can be found in extended abstract
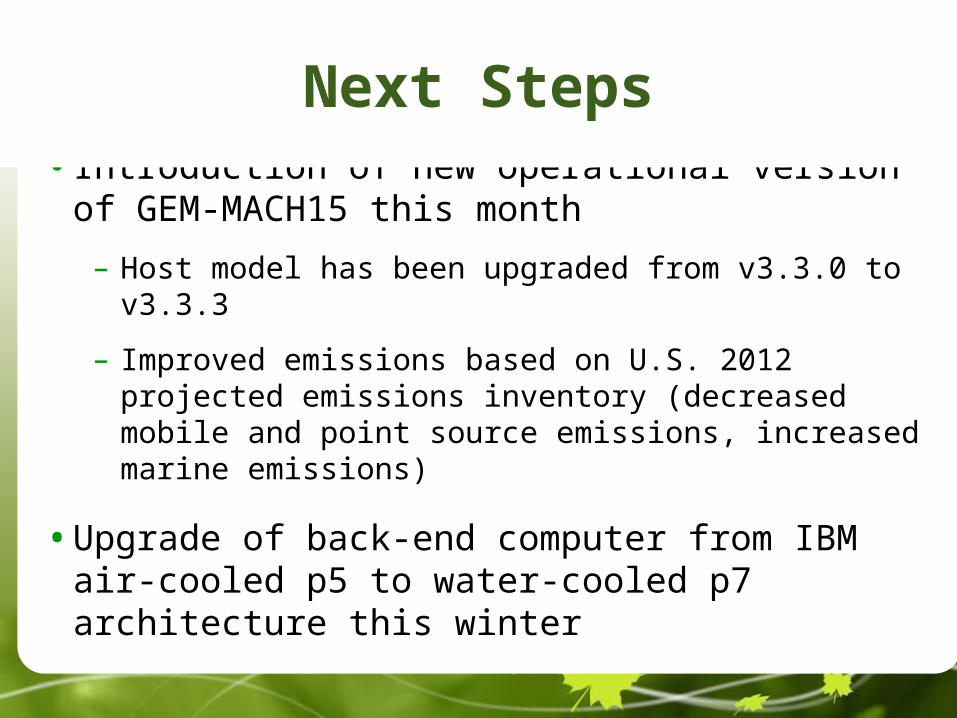
• Introduction of new operational version of GEM-MACH15 this month
– Host model has been upgraded from v3.3.0 to v3.3.3
– Improved emissions based on U.S. 2012 projected emissions inventory (decreased mobile and point source emissions, increased marine emissions)
• Upgrade of back-end computer from IBM air-cooled p5 to water-cooled p7 architecture this winter
Next Steps
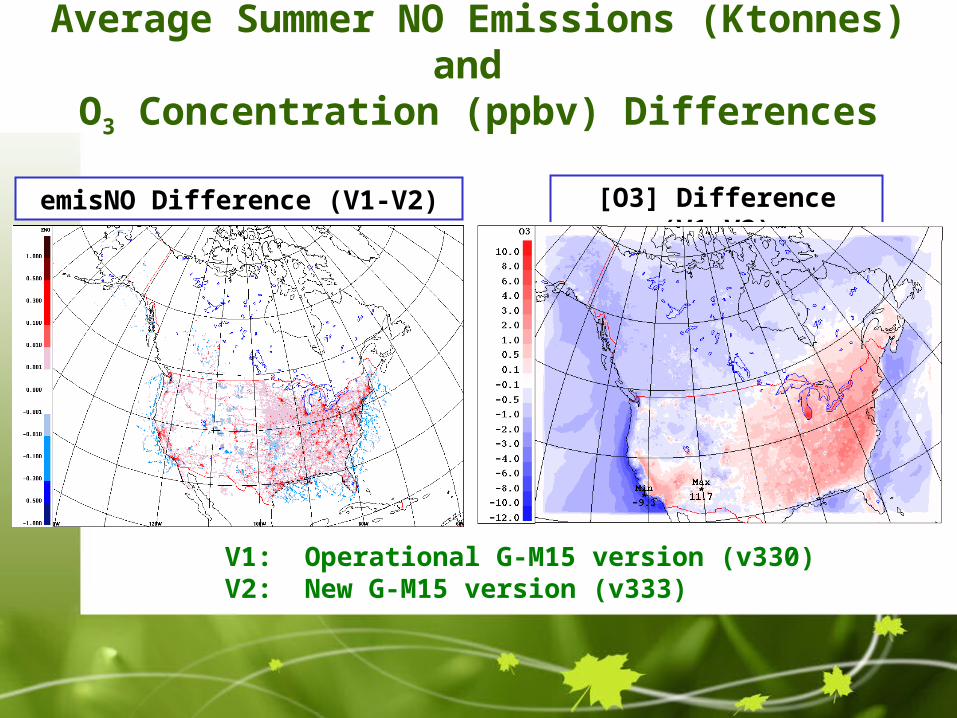
Average Summer NO Emissions (Ktonnes) and O3 Concentration (ppbv) Differences
emisNO Difference (V1-V2) [O3] Difference (V1-V2)
V1: Operational G-M15 version (v330)V2: New G-M15 version (v333)
• Migration to GEMv4 (new staggered vertical discretization, updated chemistry bus, piloting at top of limited-area grid)
• Further improvements to emissions files
• Improved process representations
• Improved initialization using objectively-analyzed model-measurement fields
• Longer forecasts (48 72+ h)
• Reduced grid spacing (15 ? km)
Future Plans
• GEM-MACH15 has been running operationally in Canada for more than two years
• Year-to-year performance is quite similar except for improved PM2.5 performance in Canada due to use of improved primary PM2.5 emissions in Year 2
• New operational version being introduced this month uses 2012 projected U.S. inventory
• Further improvements are expected next year related to improvements in model emissions, initialization, and process representations
Conclusions

Thank you for your attention