Embed Size (px)
Citation preview

2010–2011 Financial Report
CLAREMONT MCKENNA COLLEGEANNUAL FINANCIAL REPORT
2011 and 2010
CONTENTS
Financial Highlights
Treasurer's Report
Report of Independent Auditors
Statements of Financial Position
Statements of Activities
Statements of Cash Flows
Notes to Financial Statements
Page
14
9
10
11
13
5
1

Financial Highlights
●
●
●
Fall 2010 FTE undergraduate enrollment in Claremont reflects a planned increase from prior years. The average FTE undergraduate enrollment for the year (Fall and Spring) was 1,156. FTE undergraduate enrollment for the 2010-11 fiscal year, including the Washington program and study-abroad programs, was 1,243.
Freshman applications for admission in the Fall of 2011 were 4,481, a marked increase over prior years. Applications for the last five years have averaged 4,268—fourteen times more applications than openings in the entering class.
The yield rate increased to 49% for the Fall
1,050 1,042
1,089
1,1281,155
1,000
1,050
1,100
1,150
1,200
2006 2007 2008 2009 2010
Fall Undergraduate Enrollment
4,1404,178
4,276 4,264
4,481
4,100
4,200
4,300
4,400
4,500
4,600
2007 2008 2009 2010 2011
Applications
Admission Yield Rate
●
of 2011. The total number of new freshmen entering the College in Fall of 2011 was 305 students.
Total net assets increased by 13% to $812 million due primarily to realized and unrealized gains on investments.
40% 40% 40%43%
49%
35%
40%
45%
50%
55%
2007 2008 2009 2010 2011
$633
$808
$656 $716
$812
$500
$600
$700
$800
$900
$1,000
2007 2008 2009 2010 2011
Mill
ions
Total Net Assets
1
Financial Highlights
●
●
●
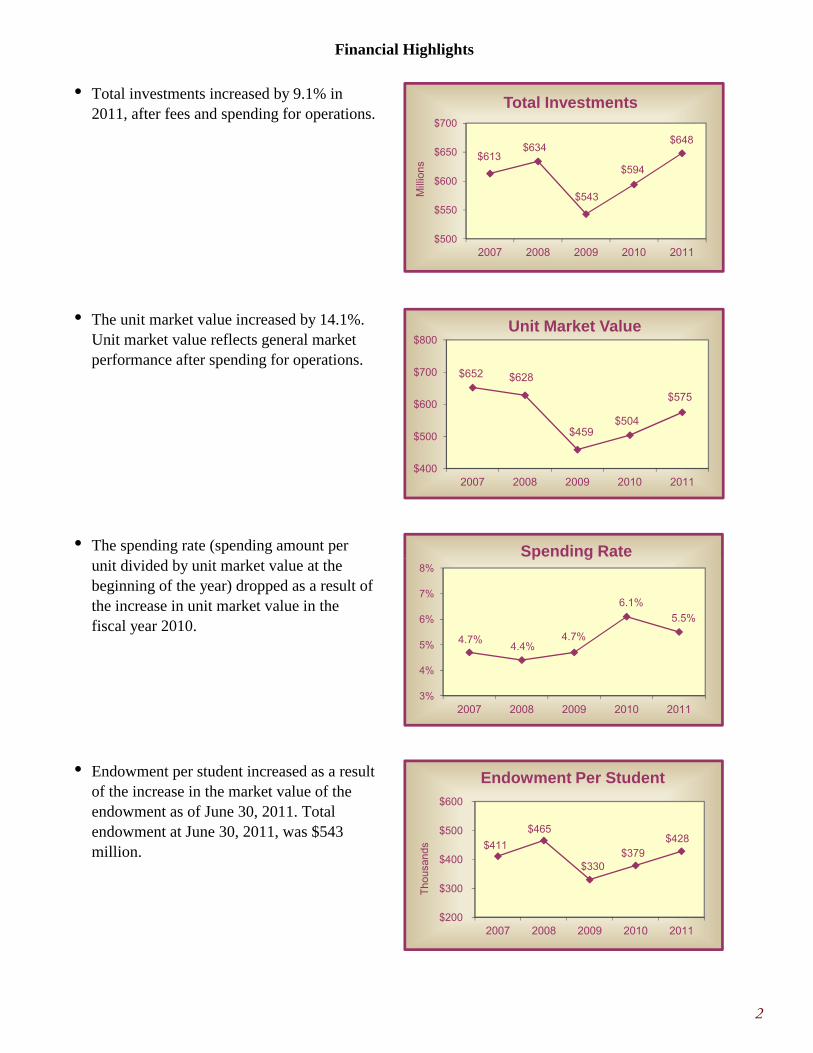
Total investments increased by 9.1% in 2011, after fees and spending for operations.
The unit market value increased by 14.1%. Unit market value reflects general market performance after spending for operations.
The spending rate (spending amount per
$613$634
$543
$594
$648
$500
$550
$600
$650
$700
2007 2008 2009 2010 2011
Mill
ions
Total Investments
$652 $628
$459$504
$575
$400
$500
$600
$700
$800
2007 2008 2009 2010 2011
Unit Market Value
Spending Rate
●
unit divided by unit market value at the beginning of the year) dropped as a result of the increase in unit market value in the fiscal year 2010.
Endowment per student increased as a result of the increase in the market value of the endowment as of June 30, 2011. Total endowment at June 30, 2011, was $543 million. $411
$465
$330 $379
$428
$200
$300
$400
$500
$600
2007 2008 2009 2010 2011
Tho
usan
ds
Endowment Per Student
4.7%4.4%
4.7%
6.1%
5.5%
3%
4%
5%
6%
7%
8%
2007 2008 2009 2010 2011
p g
2

Financial Highlights
●
●
●
Total resources to debt decreased in 2009 as a result of new bonds issued by the College and increased in 2010 and 2011 due to an increase in net assets. CMC’s ratio of 5.4 is consistent with the 2010 median value of 5.5 for Moody’s Aa small institutions (enrollments typically under 3,000 FTE).
CMC experienced growth in net tuition per student at a rate slightly lower than the rate of increase in total tuition, a direct result of an increase in the tuition discount. This dollar level places CMC higher than the 2010 median net tuition per student of $23,866 for Moody's Aa small institutions.
Total tuition discount (financial aid divided
9.6
12.5
4.3 4.85.4
0
5
10
15
20
2007 2008 2009 2010 2011
Total Resources to Debt
$21.9
$23.0 $23.0
$24.5
$26.3
$20
$22
$24
$26
$28
2007 2008 2009 2010 2011
Tho
usan
ds
Net Tuition Per Student
Total Tuition Discount
●
by tuition and fees revenues) increased due to a rise in total financial aid costs in 2011. CMC's discount is consistent with the median discount of 37.7% for Moody’s Aa small institutions.
CMC’s endowment and a prudent spending policy produce sufficient investment income to make a significant contribution toward covering the operational costs of a CMC education. The investment income contribution ratio has remained consistent over the past five years.
33.1%
34.1%
37.1%36.5%
37.1%
32%
34%
36%
38%
40%
2007 2008 2009 2010 2011
31%
34%
31% 31% 31%
25%
30%
35%
40%
2007 2008 2009 2010 2011
Investment IncomeContribution Ratio
3
Financial Highlights
●
●
● CMC continues its policy of fully funding
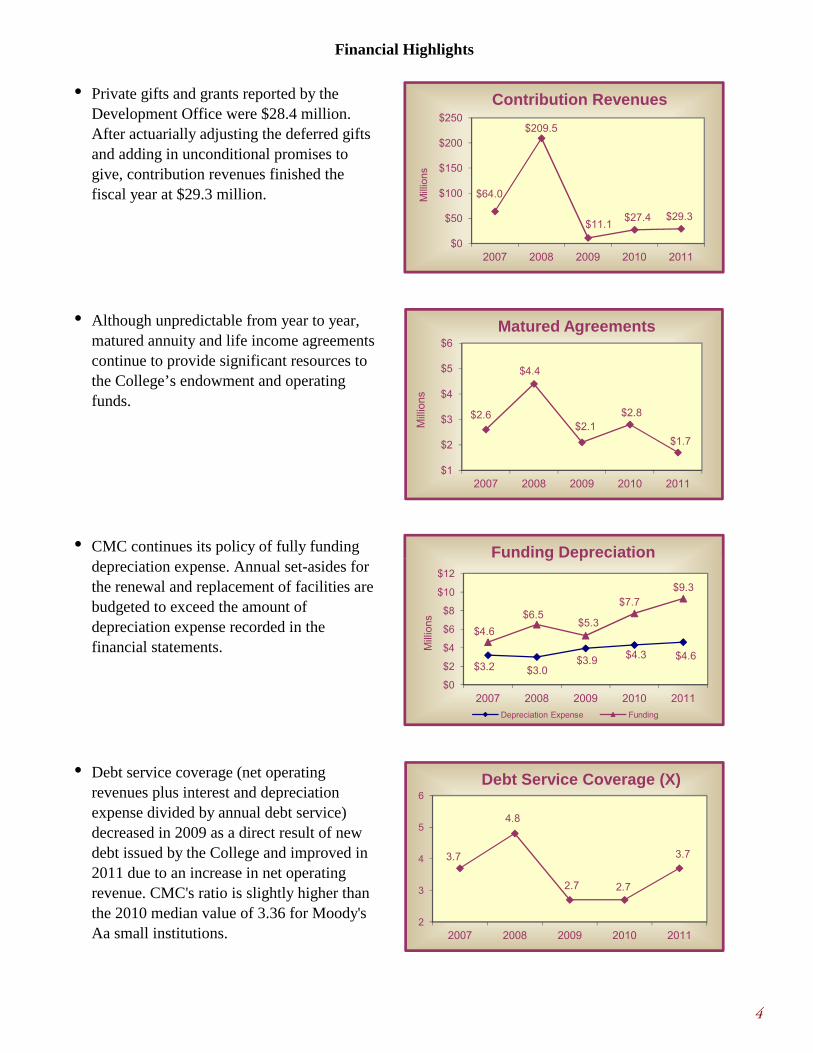
Private gifts and grants reported by the Development Office were $28.4 million. After actuarially adjusting the deferred gifts and adding in unconditional promises to give, contribution revenues finished the fiscal year at $29.3 million.
Although unpredictable from year to year, matured annuity and life income agreements continue to provide significant resources to the College’s endowment and operating funds.
$64.0
$209.5
$11.1$27.4 $29.3
$0
$50
$100
$150
$200
$250
2007 2008 2009 2010 2011
Mill
ions
Contribution Revenues
$2.6
$4.4
$2.1$2.8
$1.7
$1
$2
$3
$4
$5
$6
2007 2008 2009 2010 2011
Mill
ions
Matured Agreements
Funding Depreciation
●
depreciation expense. Annual set-asides for the renewal and replacement of facilities are budgeted to exceed the amount of depreciation expense recorded in the financial statements.
Debt service coverage (net operating revenues plus interest and depreciation expense divided by annual debt service) decreased in 2009 as a direct result of new debt issued by the College and improved in 2011 due to an increase in net operating revenue. CMC's ratio is slightly higher than the 2010 median value of 3.36 for Moody's Aa small institutions.
$3.2 $3.0$3.9 $4.3 $4.6
$4.6
$6.5$5.3
$7.7$9.3
$0
$2
$4
$6
$8
$10
$12
2007 2008 2009 2010 2011
Mill
ions
g p
Depreciation Expense Funding
3.7
4.8
2.7 2.7
3.7
2
3
4
5
6
2007 2008 2009 2010 2011
Debt Service Coverage (X)
4
Office of the Treasurer
Bauer Center, 500 E. Ninth Street, Claremont, California 91711-6400 Tel: 909.621.8116 Fax: 909.607.7655 www.cmc.edu
Member of The Claremont Colleges
October 10, 2011 Members of the Board of Trustees Claremont McKenna College Claremont, California Ladies and Gentlemen: The fiscal year closed on June 30, 2011, with positive momentum at Claremont McKenna College as we look to the future. After almost two full years of adjusting to the global financial setback experienced in the fall of 2008, and after extensive long-term forecasting exercises, Claremont McKenna College has been able to confirm its financial stability demonstrated through many positive highlights, both financially and operationally, in this most recent year. The return on CMC’s endowment for the year, net of fees, was 20.3%. CMC’s one-year return is tracking slightly above the reported median value in the Cambridge Associates database of preliminary returns for college and university investment pools and is in the top 5% of the same database over the trailing five-year period. Actual returns have significantly outpaced internal targets over the past two years and, when combined with new contributions from donors, resulted in an all-time-high value for CMC’s endowment investments on June 30, 2011. While this is exciting news to report, the endowment value remains behind expectations that were in place prior to 2008, and global economic concerns have again pushed public markets noticeably lower thus far in the new fiscal year. Management continues to incorporate conservative endowment return projections in the operating budget and is closely monitoring the potential effects of a further economic pullback. A significant factor in generating the positive momentum of the College is the continued strength of recruiting and admission of new students. The average FTE undergraduate enrollment in Claremont for the fiscal year of 1,156 students slightly exceeded the budgeted target of 1,150 students. The number of applications for the newly admitted class of 2015, which completed the application process in 2010-11, significantly exceeded the prior record set in 2008-09 for the College. Of the 4,481 applications received, 13.9% were accepted (admission rate), and 49% were enrolled (yield rate), once again confirming CMC’s position as one of the most selective liberal arts colleges in the country. The median SAT score was 1420, excluding the writing section. The newly-admitted freshmen represent 35 states and 13 foreign countries. Net tuition per student continued to increase even though the total tuition discount also increased slightly. The College continues to maintain its need-blind admission policy and meet-all-need financial aid policy, and confirmed the continuation of its policy adopted in 2008-09 to provide need-based financial aid packages with no student loans. The current Campaign for Claremont McKenna College has provided several new gifts for both need-based and merit scholarships, which are reflected in the calculation for the total tuition discount.
5
Members of the Board of Trustees October 10, 2011
The College expects to complete the campus master-planning process in the current year. Moore Ruble Yudell Architects & Planners were hired in the Spring of 2009 to lead the College through development of this new campus master plan, which was submitted to the City of Claremont to begin the formal review process at the end of the 2011 fiscal year. The entitlement process is expected to be completed in the spring of 2012. This process has actively included trustees, faculty, staff, special focus groups for students and alumni, and special outreach meetings for community members. Following completion of the Kravis Center in July 2011, the highest priority noted in the master plan is the replacement of Ducey Gym with a new Fitness and Athletic Center to accommodate the needs of the current student body for fitness and recreational uses, as well as for varsity competition. This project is also a high priority in the current capital campaign. Statements of Financial Position The most significant changes in the statements of financial position are the increases in total assets directly attributed to changes in the value of investments and in plant facilities. The investment values were driven by increases in valuations of the underlying securities, while the increase in plant facilities was driven by the capital investment in the Kravis Center, as well as other smaller capital projects on the campus. Construction of the Kravis Center was completed over the summer of 2011, and the new facility was opened to the public in July. The Kravis Center is home to four academic departments, five research institutes, the admission and financial aid offices, and several new classrooms and meeting spaces. Designed by Rafael Vinoly Architects, the Kravis Center makes a significant architectural statement and is referred to as CMC’s Gateway to Leadership at the west entrance of the campus. The dedication event celebrating the most significant building project undertaken to date on CMC’s campus will take place at the end of October 2011, and will honor the generosity of Mr. and Mrs. Henry Kravis. The Kravis Center was recently named the region’s best overall project and the best higher education/research project by Engineering News Record (ENR) California. ENR is a well-known and highly regarded international commercial construction industry publication. The College also undertook a major renovation of the first floor of the Marian Miner Cook Athenaeum during the summer of 2011. The Athenaeum serves as an informal meeting place for students as well as the official site for more formal gatherings for distinguished speakers who join students and faculty for dinner or lunch prior to their featured lectures. The renovation was completed in time for the start of Fall 2011 classes, and has been well received by the entire CMC community. The College is completing plans this fall for improvements to the north mall, which will provide a more beautiful and thoughtful connection from the east end of campus to the Kravis Center. The improvements to the north mall will begin in the summer of 2012. Several smaller capital projects were undertaken during the 2011 fiscal year and over the summer of 2011. The College purchased the modular units, used as temporary relocation space during construction of the Kravis Center, to provide surge space for future renovation projects and for temporary office and storage space. In conjunction with Scripps and Pitzer Colleges, additional modular units were purchased to provide surge space for the W.M. Keck Science Department. These modular units are housed on the Pitzer College campus and costs were
6

Members of the Board of Trustees October 10, 2011
shared among the three colleges participating in the Keck Science Department program. Landscape improvements were made throughout the campus over the summer to update the appearance and provide more efficient use of outdoor spaces. Statement of Activities The statement of activities provides greater detail of the changes in net assets during the fiscal year. Net assets increased 13.4% from the prior year, primarily driven by realized and unrealized gains, net of the approved spending allocation, on investments. Total revenues increased 5.7% from the prior year, primarily driven by net student revenues and private gifts and grants. These increases were in line with budget expectations. The Campaign for Claremont McKenna College, which was formally launched in 2008, crossed the $500 million mark at the end of August 2011, representing another milestone toward its $600 million goal. This high point in CMC’s capital campaign represents the largest amount raised in a campaign to date compared to all other liberal arts colleges. Student revenues, net of scholarships and grants, increased $3 million as a result of tuition, room and board charge increases and an increase in the number of full-time equivalent undergraduate students from 1,215 in 2009-10 to 1,243 in 2010-11. Spending policy income increased by $1.3 million from 2009-10 to 2010-11, due primarily to new endowment gifts. The spending per unit in the pooled investments fund was held flat for another year by action of the Board of Trustees, as part of the fiscal response to the investment market downturn in 2008, and as reductions in the operating budget were implemented in the prior fiscal year. Total operating expenses increased by 3.3% from the prior year, driven primarily by an increase in instructional expenses. This increase was due to an expansion of the College’s summer session program, initially launched in the summer of 2010, as well as continued growth in the Robert Day Master’s program in finance, which opened in fiscal year 2008-09. The College also launched several new global education initiatives and activities during the spring and summer of 2011, coinciding with the establishment of a new Center for Global Education. These exciting new initiatives included an intensive summer school course on the topic of Jerusalem, followed by a faculty-led trip to Jerusalem; a faculty-led spring break study visit to Kuwait; a summer program in Jordan, featuring Arabic language instruction and student internships; and a joint program with Yonsei University in Seoul, South Korea, focusing on global economic challenges facing the United States and East Asia. The College continues to designate annually an amount of unrestricted net assets equal to or greater than the calculated amount of depreciation expense to fund a reserve for future campus renovations and replacements. In fiscal year 2011, the trustees adopted a Guideline for Funding Capital Projects, and established a second reserve for new capital projects through this process. The College was able to add $4.7 million to the designated reserves in addition to the amount of depreciation expense of $4.6 million, for a total transfer of $9.3 million to the renewal and replacement reserve for existing facilities and the reserve for new projects. Statements of Cash Flows Net cash flows decreased $43,000 for fiscal year 2011. The net cash used in operating activities of $11.2 million was offset by the net cash provided by investing activities of $2.7 million and
7
Members of the Board of Trustees October 10, 2011
by financing activities of almost $8.5 million, primarily from contributions restricted for the endowment. The trustees adopted a multi-tiered structure of managing cash investments based on the timeline of the expected use of cash, particularly as reserves for capital projects increase. Summary The positive ending to the 2011 fiscal year was a welcome result after dealing with the economic fallout of the prior two years. Planning and budgeting efforts continue to be conservative and the College was able to stay on target with its operating expenses. Investment returns exceeded earlier estimates, though we are cautious with future expectations. Contribution revenues were close to the internal targets, and the College continues to track on the final fundraising target over the remainder of the Campaign for Claremont McKenna College. Enrollment and applications remain strong, the College remains committed to its recently adopted policy for no packaged loans to need-based students, and recent investments in the physical campus are now providing eagerly anticipated new spaces benefitting the entire campus community. The College implemented several new academic programs, including a summer session on the CMC campus, in addition to academic programs in Jordan, Kuwait, South Korea, and Jerusalem. The College’s trustees and administration will carefully monitor and assess the recent downturns in the financial markets as we continue to plan for the future, keeping the forward momentum going with an eye on continued improvement in all aspects of life at Claremont McKenna College. Respectfully submitted, Robin J. Aspinall Vice President for Business and Administration and Treasurer
8
REPORT OF INDEPENDENT AUDITORS
To the Board of Trustees Claremont McKenna College Claremont, California
We have audited the accompanying statements of financial position of Claremont McKenna College (the “College”) as of June 30, 2011 and 2010, and the related statements of activities and cash flows for the years then ended. These financial statements are the responsibility of the College’s management. Our responsibility is to express an opinion on these financial statements based on our audits.
We conducted our audits in accordance with auditing standards generally accepted in the United States of America. Those standards require that we plan and perform the audits to obtain reasonable assurance about whether the financial statements are free of material misstatement. An audit includes consideration of internal control over financial reporting as a basis for designing audit procedures that are appropriate in the circumstances, but not for the purpose of expressing an opinion on the effectiveness of the College’s internal control over financial reporting. Accordingly we express no such opinion. An audit also includes examining, on a test basis, evidence supporting the amounts and disclosures in the financial statements, assessing the accounting principles used and significant estimates made by management, as well as evaluating the overall financial statement presentation. We believe that our audits provide a reasonable basis for our opinion.
In our opinion, the financial statements referred to above present fairly, in all material respects, the financial position of Claremont McKenna College as of June 30, 2011 and 2010, and the changes in its net assets and its cash flows for the years then ended in conformity with accounting principles generally accepted in the United States of America.
Los Angeles, California October 20, 2011
9
CLAREMONT MCKENNA COLLEGESTATEMENTS OF FINANCIAL POSITION
June 30, 2011 and 2010(in thousands)
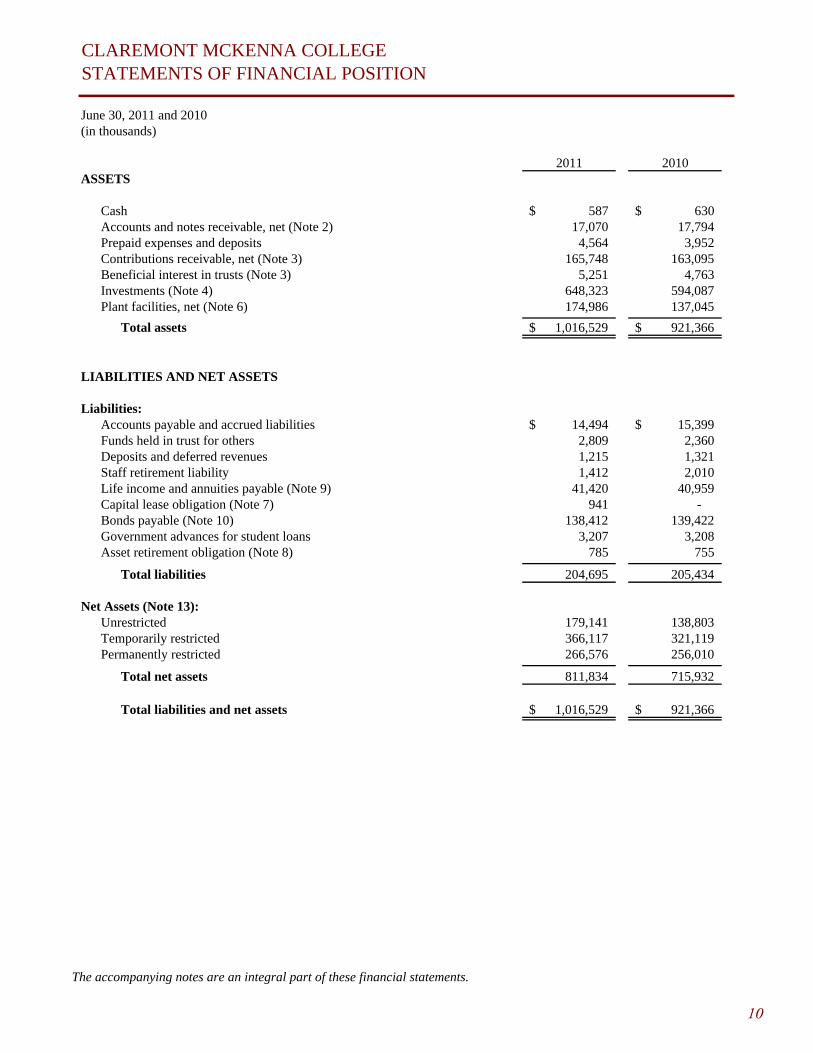
2011 2010ASSETS
Cash 587$ 630$ Accounts and notes receivable, net (Note 2) 17,070 17,794 Prepaid expenses and deposits 4,564 3,952 Contributions receivable, net (Note 3) 165,748 163,095 Beneficial interest in trusts (Note 3) 5,251 4,763 Investments (Note 4) 648,323 594,087 Plant facilities, net (Note 6) 174,986 137,045
Total assets 1,016,529$ 921,366$
LIABILITIES AND NET ASSETS
Liabilities:Accounts payable and accrued liabilities 14,494$ 15,399$ Funds held in trust for others 2,809 2,360 Deposits and deferred revenues 1,215 1,321 Staff retirement liability 1,412 2,010 Life income and annuities payable (Note 9) 41,420 40,959 Capital lease obligation (Note 7) 941 - Bonds payable (Note 10) 138,412 139,422 Government advances for student loans 3,207 3,208 Asset retirement obligation (Note 8) 785 755
Total liabilities 204,695 205,434
Net Assets (Note 13):Unrestricted 179,141 138,803 Temporarily restricted 366,117 321,119 Permanently restricted 266,576 256,010
Total net assets 811,834 715,932
Total liabilities and net assets 1,016,529$ 921,366$
The accompanying notes are an integral part of these financial statements.
10

CLAREMONT MCKENNA COLLEGESTATEMENT OF ACTIVITIES
For the year ended June 30, 2011(in thousands)
Temporarily PermanentlyUnrestricted Restricted Restricted Total
Revenues:Student revenues 65,714$ -$ -$ 65,714$
Less: Financial aid (19,351) - - (19,351)
Net student revenues (Note 15) 46,363 - - 46,363
Private gifts and grants 3,966 17,663 7,661 29,290 Federal grants 1,477 - - 1,477 Private contracts 667 - - 667 Spending policy income 7,294 18,362 391 26,047 Other investment income 2,081 2 8 2,091 Other revenues 2,252 - - 2,252 Release of net assets
Restricted gifts 12,419 (12,419) - - Restricted spending policy income 16,234 (16,234) - - Annuity and life income 617 (617) - -
Total revenues 93,370 6,757 8,060 108,187
Expenses:Instruction 28,992 - - 28,992 Research 5,504 - - 5,504 Academic support 7,299 - - 7,299 Student services 12,567 - - 12,567 Institutional support 13,937 - - 13,937 Auxiliary enterprises 14,487 - - 14,487
Total expenses 82,786 - - 82,786
Excess of revenues over expenses 10,584 6,757 8,060 25,401
Other changes in net assets:Realized and unrealized gains (losses),
net of spending allocation 28,610 35,775 (155) 64,230 Release of net assets
Plant facilities 244 (244) - - Actuarial adjustment - 2,994 2,548 5,542 Staff retirement plan comprehensive gain 729 - - 729 Donor redesignations between net
asset categories 171 (284) 113 -
Change in net assets 40,338 44,998 10,566 95,902
Net assets at beginning of year 138,803 321,119 256,010 715,932
Net assets at end of year 179,141$ 366,117$ 266,576$ 811,834$
The accompanying notes are an integral part of these financial statements.
11
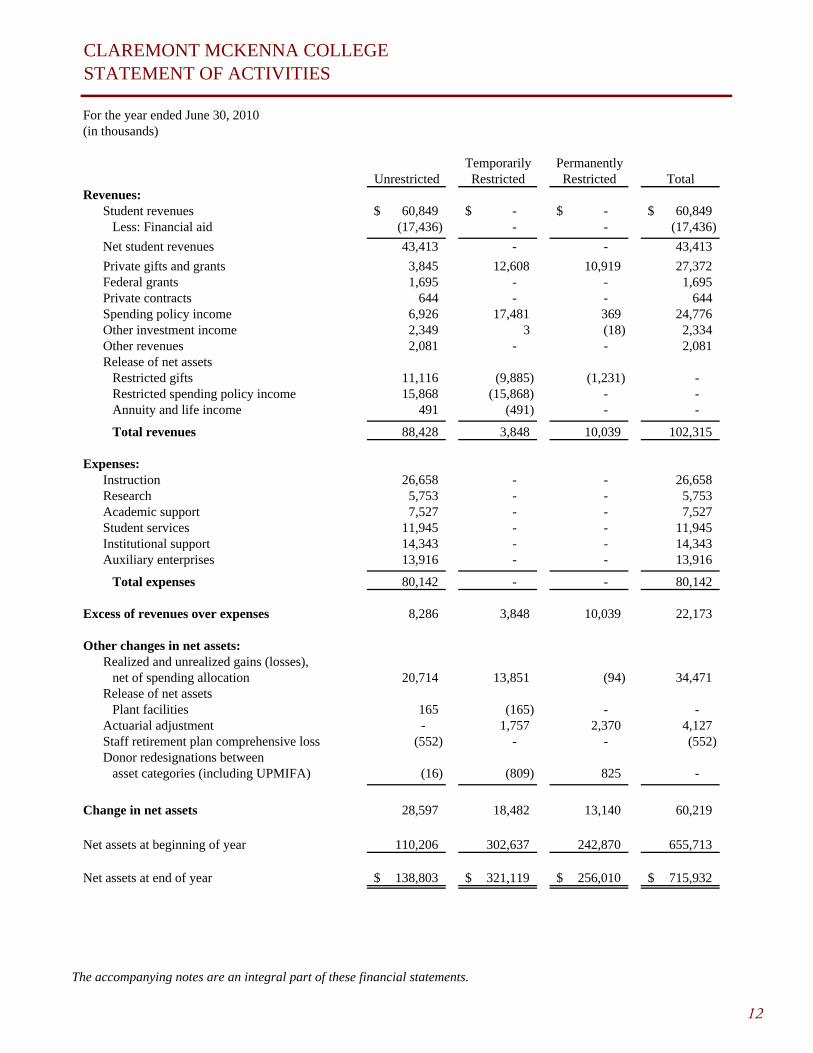
CLAREMONT MCKENNA COLLEGESTATEMENT OF ACTIVITIES
For the year ended June 30, 2010(in thousands)
Temporarily PermanentlyUnrestricted Restricted Restricted Total
Revenues:Student revenues 60,849$ -$ -$ 60,849$
Less: Financial aid (17,436) - - (17,436)
Net student revenues 43,413 - - 43,413
Private gifts and grants 3,845 12,608 10,919 27,372 Federal grants 1,695 - - 1,695 Private contracts 644 - - 644 Spending policy income 6,926 17,481 369 24,776 Other investment income 2,349 3 (18) 2,334 Other revenues 2,081 - - 2,081 Release of net assets
Restricted gifts 11,116 (9,885) (1,231) - Restricted spending policy income 15,868 (15,868) - - Annuity and life income 491 (491) - -
Total revenues 88,428 3,848 10,039 102,315
Expenses:Instruction 26,658 - - 26,658 Research 5,753 - - 5,753 Academic support 7,527 - - 7,527 Student services 11,945 - - 11,945 Institutional support 14,343 - - 14,343 Auxiliary enterprises 13,916 - - 13,916
Total expenses 80,142 - - 80,142
Excess of revenues over expenses 8,286 3,848 10,039 22,173
Other changes in net assets:Realized and unrealized gains (losses),
net of spending allocation 20,714 13,851 (94) 34,471 Release of net assets
Plant facilities 165 (165) - - Actuarial adjustment - 1,757 2,370 4,127 Staff retirement plan comprehensive loss (552) - - (552) Donor redesignations between
asset categories (including UPMIFA) (16) (809) 825 -
Change in net assets 28,597 18,482 13,140 60,219
Net assets at beginning of year 110,206 302,637 242,870 655,713
Net assets at end of year 138,803$ 321,119$ 256,010$ 715,932$
The accompanying notes are an integral part of these financial statements.
12

CLAREMONT MCKENNA COLLEGESTATEMENTS OF CASH FLOWS
For the years ended June 30, 2011 and June 30, 2010(in thousands)
2011 2010Cash flows from operating activities:
Change in net assets 95,902$ 60,219$ Adjustments to reconcile change in net assets to net cash used in operating activities:
Depreciation expense 4,649 4,267 Amortization and accretion expense 40 44 Loss on disposal of plant facilities 460 120 Allowance for doubtful student loan accounts 26 12 Comprehensive (gain)/loss on staff retirement plan (729) 552 Discount on life income contract gifts (1,354) (1,492) Realized and unrealized (gain)/loss on investments (97,191) (68,003) Non-cash gifts (2,581) (11,593) Adjustment of actuarial liability for annuities payable 3,674 3,242 Decrease/(increase) in accounts and contributions receivable (1,968) 12,788 Decrease/(increase) in beneficial interest in trusts (488) (20) Decrease/(increase) in prepaid expenses and deposits (612) (618) (Decrease)/increase in accounts payable and accrued liabilities (905) 5,471 (Decrease)/increase in funds held in trust for others 449 285 (Decrease)/increase in deposits and deferred revenues (106) (63) Contributions restricted for long-term investments (10,630) (13,063) Defined benefit plan contributions over expense 131 26
Net cash (used in)/provided by operating activities (11,233) (7,826)
Cash flows from investing activities:Purchase of plant facilities (42,109) (29,635) Purchases of investments (546,646) (539,342) Proceeds from sales of investments 591,463 566,838 Loans made to students and employees (1,996) (1,603) Collection of student and employee loans 2,010 1,909
Net cash (used in)/provided by investing activities 2,722 (1,833)
Cash flows from financing activities:Payments to annuity and life income beneficiaries (2,406) (2,789) Investment income for annuity and life income investments 1,265 624 Principal payments for borrowings (1,020) (985) Contributions restricted for life income contracts 1,623 2,129 Contributions restricted for endowment 8,300 9,481 Contributions restricted for plant expenditures and student loans 707 1,454 Increase/(decrease) in government advances for student loans (1) (23)
Net cash (used in)/provided by financing activities 8,468 9,891
Net (decrease)/increase in cash (43) 232
Cash at beginning of year 630 398
Cash at end of year 587$ 630$
Supplemental disclosure of cash flows:Interest paid 6,899$ 6,691$
Supplemental disclosure of noncash financing activity:Capital lease obligation 941$ -$
The accompanying notes are an integral part of these financial statements.
13

CLAREMONT MCKENNA COLLEGENOTES TO THE FINANCIAL STATEMENTS
June 30, 2011 and 2010
NOTE 1 – SUMMARY OF SIGNIFICANT ACCOUNTING POLICIES:
Basis of Presentation:
Reclassifications:
Net Asset Categories:
Tuition and Fees:
Contributions:
The accompanying financial statements present information regarding the College’s financial position and activities according tothree categories of net assets: unrestricted, temporarily restricted, and permanently restricted. The three categories are differentiatedby donor restrictions. Unrestricted net assets are not subject to donor-imposed restrictions. Temporarily restricted net assets aresubject to donor-imposed restrictions that either lapse or can be satisfied. Permanently restricted net assets are resources that adonor has required the College to retain in perpetuity. Generally, the donor of these assets permits the College to use all or a part ofthe income and gains earned on the gifted assets.
Student tuition and fees are recorded as revenues in the year during which the related academic services are rendered.
Collectability of student accounts, notes receivable, and contributions receivable is reviewed both individually and in the aggregate.Allowances have been established based on experience, and balances deemed uncollectible are written off through a charge to baddebt expense or the provision for doubtful accounts and a credit to accounts receivable. The College follows federal guidelines fordetermining when student loans are delinquent or past due for both federal and institutional loans.
Contributions, including unconditional promises to give, are recognized as revenue in the period pledged or received and arereported as increases in the appropriate category of net assets. Conditional promises to give are not recognized until they becomeunconditional, that is when the conditions on which they depend are substantially met. Contributions of assets other than cash arerecorded at their estimated fair value at the date of gift. Contributions to be received are discounted at an appropriate discount rate.
Established in 1946, Claremont McKenna College (the “College”) is a highly selective, independent, coeducational, residential,liberal arts college. The College’s mission, within the mutually supportive framework of The Claremont Colleges (Note 17), is toeducate students for thoughtful and productive lives and responsible leadership in business, government, and the professions, and tosupport faculty and student scholarship that contributes to intellectual vitality and the understanding of public policy issues. TheCollege pursues this mission by providing a liberal arts education that emphasizes economics and political science, a professoriatethat is dedicated to effective teaching, a close student-teacher relationship that fosters critical inquiry, an active residential andintellectual environment that promotes responsible citizenship, and a program of research institutes and scholarly support that makespossible a faculty of teacher-scholars.
The College is a nonprofit corporation exempt from federal income tax under Section 501(c)(3) of the Internal Revenue Code andcorresponding California provisions. The objective of the College is to maintain and conduct a nonprofit educational institution.The primary purpose of the accounting and reporting is the recording of resources received and applied rather than the determinationof net income.
The following accounting policies of the College are in accordance with those generally accepted for colleges and universities:
The accompanying financial statements are prepared on the accrual basis of accounting in accordance with accounting principlesgenerally accepted in the United States of America (U.S.).
Certain prior year amounts have been reclassified for consistency with current year presentation.
14
CLAREMONT MCKENNA COLLEGENOTES TO THE FINANCIAL STATEMENTS
June 30, 2011 and 2010
NOTE 1 – SUMMARY OF SIGNIFICANT ACCOUNTING POLICIES: Continued
Release of Donor-Imposed Restrictions:
Grants and Contracts:
Allocation of Certain Expenses:
Cash:
Cash Held in Separate Accounts:
Concentration of Credit Risk:
Investments:
Expenses are generally reported as decreases in unrestricted net assets. The Statements of Activities present expenses by functionalclassification. Depreciation and the cost of operation and maintenance of plant facilities are allocated to functional categories basedon building square footage dedicated to that specific function. Interest expense is allocated based on the use of the relatedborrowings.
For the purposes of reporting cash flows, cash includes demand deposit bank accounts. Resources invested in money market fundsare classified as cash equivalents, except that any such investments managed as part of the investment pool are classified asinvestments.
The California Student Aid Commission requires institutions participating in the Cal Grant program to maintain funds advanced in aseparate interest bearing account to properly handle and manage the funds. The funds are the property of the State, and unspentfunds are to be returned according to the State's required timelines along with interest earned.
Financial instruments that potentially subject the College to concentrations of credit risk consist principally of cash deposits atfinancial institutions and investments in marketable securities. At times, balances in the College’s cash and investment accountsexceed the Federal Deposit Insurance Corporation (FDIC) or Securities Investors Protection Corporation (SIPC) insured limits.
Where permitted by law, the College pools investments for management purposes. The remainder of investments are managed asseparate investments. Marketable securities are reported at fair market value. Non-marketable investments are carried at estimatedfair value provided by the management of the non-marketable investment partnerships or funds at June 30, 2011 and 2010. TheCollege reviews and evaluates the values provided by the investment managers and agrees with the valuation methods andassumptions used in determining the fair value of the investments. Because non-marketable investments are not readily marketable,the estimated value is subject to uncertainty and such differences could be material.
Revenues from grants and contracts are reported as increases in unrestricted net assets, as allowable expenditures under suchagreements are incurred.
The expiration of a donor-imposed restriction on a contribution or on endowment income is recognized in the period in which therestriction substantially expires. At that time, the related resources are reclassified to unrestricted net assets. A restriction expireswhen the stipulated time period has elapsed, when the stipulated purpose for which the resource was restricted has been fulfilled, orwhen unexpended endowment earnings are appropriated by the Board of Trustees. It is the College’s policy to release therestrictions on contributions of cash or other assets received for the acquisition of long-lived assets when the long-lived assets areplaced into service.
Certain amounts previously received from donors have been transferred among net asset categories due to changes in donordesignations.
15
CLAREMONT MCKENNA COLLEGENOTES TO THE FINANCIAL STATEMENTS
June 30, 2011 and 2010
NOTE 1 – SUMMARY OF SIGNIFICANT ACCOUNTING POLICIES: Continued
Investments: Continued
Derivatives:
Management of Pooled Investments:
Endowment Funds:
(4) Possible effects of inflation and deflation
(5) Expected total return from income and appreciation of investments
(6) Other resources of the College
(7) Investment policy of the College.
Certain investments held by the College may include derivative instruments as part of their investment strategy, but the College doesnot invest directly in derivatives.
The College follows an investment policy which anticipates a greater long-range return through investing for capital appreciation,and accepts lower current yields from dividends and interest. In order to offset the effect of lower current yields for currentoperations, the Board of Trustees has adopted a spending policy for pooled investments. The amount of investment return availablefor current operations is determined by applying an increase of 4.0% to the prior year unit spending rate, provided that the resultingcalculation falls within a collar of 4.5% to 5.5% of a twelve quarter average unit market value. If the ordinary income portion ofpooled investments return is insufficient to provide the full amount of investment return specified, the balance may be appropriatedfrom realized gains of the pooled investments. Cumulative net realized gains and transfers of ordinary income in excess of thespending policy (“cumulative gains”) are held in their respective net asset categories and are available for appropriation under theCollege’s spending policy. At June 30, 2011 and 2010, these cumulative gains totaled approximately $83,698,000 and $78,989,000,respectively. The Board of Trustees may, at its discretion, approve additional spending for special projects.
The Board of Trustees of the College interpreted the California Uniform Prudent Management of Institutional Funds Act (UPMIFA)to state that the College, in the absence of explicit donor stipulations to the contrary, may appropriate for expenditure or accumulateso much of an endowment fund as the College determines prudent for the uses, benefits, purposes, and duration for which theendowment fund is established. As a result of this interpretation, the College classifies as permanently restricted net assets theoriginal value of gifts donated to the endowment, original value of subsequent gifts to the endowment, and accumulations to theendowment made in accordance with the direction of the applicable donor gift instrument. The remaining portion of the donor-restricted endowment fund that is not classified in permanently restricted net assets is classified as temporarily restricted net assetsuntil those amounts are appropriated for expenditure by the College in a manner consistent with the standard of prudence prescribedby UPMIFA which includes the:
(1) Duration and preservation of the fund
(2) Mission of the College and the donor-restricted endowment fund
(3) General economic conditions
The cost of securities sold is determined by the average cost method and is used to compute realized gains and losses. Unrealizedgains and losses reflect the changes in the market values of investments from the prior year. Investment income and gains and losseson investments are reported as increases or decreases in unrestricted net assets unless their use is temporarily or permanentlyrestricted by explicit donor stipulation or by law. The date of record for investments is the trade date.
16

CLAREMONT MCKENNA COLLEGENOTES TO THE FINANCIAL STATEMENTS
June 30, 2011 and 2010
NOTE 1 – SUMMARY OF SIGNIFICANT ACCOUNTING POLICIES: Continued
Plant Facilities:
Annuity and Life Income Contracts and Agreements:
Income Taxes:
Use Of Estimates:
The College had no unrecognized tax benefits and/or obligations at June 30, 2011 and 2010.
The preparation of financial statements in conformity with accounting principles generally accepted in the U.S. requires managementto make estimates and assumptions that affect the reported amounts of assets and liabilities and disclosure of contingent assets andliabilities at the date of the financial statements and the reported amounts of revenues and expenses during the reporting period.Actual results could differ from those estimates.
Plant facilities consist of property, plant, and equipment which are stated at cost, representing the original purchase price or the fairmarket value at the date of the gift, less accumulated depreciation computed on a straight-line basis over the estimated useful lives ofbuildings, permanent improvements, and equipment. Plant purchases with a useful life of five years or more and a cost equal to orgreater than $100,000 for land improvements and buildings and $25,000 for equipment are capitalized. Estimated useful lives aregenerally 7 years for equipment, 50 years for buildings and 25 years for permanent improvements. Building improvements thatextend the remaining useful life of the building will be depreciated over a period not to exceed 20 years. Assets are retired at theircost less accumulated depreciation at the time they are sold, impaired, or no longer in use. Each year the College funds its annualdepreciation charge by transferring an amount equal to or greater than its annual depreciation charge from its operating fund into itsunrestricted capital project reserves. Asset retirement obligations are recorded based on estimated settlement dates and methods.
No significant property or equipment has been pledged as collateral or otherwise subject to lien for the years ended June 30, 2011and 2010. Proceeds from the disposal of equipment acquired with federal funds will be transferred to the federal awarding agency.No property or equipment has been acquired with restricted assets where title may revert to another party.
The College has legal title to annuity and life income contracts and agreements subject to life interests of beneficiaries. Nosignificant financial benefit is now being or can be realized until the contractual obligations are released. However, the costs ofmanaging these contracts and agreements are included in unrestricted expenses.
The College uses the actuarial method of recording annuity and life income contracts and agreements. Under this method, the assetis recorded at fair value when a gift is received. The present value of the aggregate annuity payable is recorded as a liability, basedupon life expectancy tables, and the remainder is recorded as a contribution in the appropriate net asset category. The liabilityaccount is credited with investment income and gains and is charged with investment losses and payments to beneficiaries. Periodicadjustments are made between the liability account and the net asset account for actuarial gains and losses. The actuarial liability isbased on the present value of future payments discounted at rates ranging from 4.0% to 7.5% and over estimated lives according tothe Annuity 2000 Mortality Tables.
The College is subject to additional legally mandated annuity reserve requirements by the State of California on its California giftannuity contracts. On December 2, 1998, the Insurance Commission Chief Counsel granted the College permission to invest itsreserves for California annuities pursuant to Insurance Code Section 11521.2(b). This approval is subject to the followingconditions: (1) maintain a nationally recognized statistical organization bond rating of “A” or better and (2) maintain an endowmentto gift annuity ratio of at least 10:1.
17

CLAREMONT MCKENNA COLLEGENOTES TO THE FINANCIAL STATEMENTS
June 30, 2011 and 2010
NOTE 1 – SUMMARY OF SIGNIFICANT ACCOUNTING POLICIES: Continued
Fair Value of Financial Instruments:A financial instrument is defined as a contractual obligation that ultimately ends with the delivery of cash or an ownership interest inan entity. Disclosures included in these notes regarding the fair value of financial instruments have been derived using externalmarket sources, estimates using present value or other valuation techniques. Determination of the fair value of notes receivables,which are primarily federally sponsored student loans with the U.S. government, mandated interest rates and repayment terms aresubject to significant restrictions as to their transfer or disposition, and is not practical because such a determination cannot be madewithout incurring excessive costs.
The College carries most investments at fair value in accordance with generally accepted accounting principles. Fair value isdefined as the price that would be received to sell an asset (i.e. the "exit price") in an orderly transaction between market participantsat the measurement date. Accounting standards have established a fair value hierarchy that prioritizes the inputs to valuationtechniques used to measure fair value.
The hierarchy gives the highest priority to unadjusted quoted prices in active markets for identical assets or liabilities (Level 1 measurements) and the lowest priority to unobservable inputs (Level 3 measurements).
The three levels of the fair value hierarchy are as follows:
Level 1 – Inputs that reflect unadjusted quoted prices in active markets for identical assets or liabilities that the College has theability to access at the measurement date;Level 2 – Inputs other than quoted prices that are observable for the asset either directly or indirectly, including inputs in marketsthat are not considered to be active;Level 3 – Inputs that are unobservable.
Investments in cash equivalents, mutual funds, and certain domestic and international equities are valued based on quoted marketprices, and are therefore typically classified within Level 1.
Investments in fixed income and other investment funds valued using net asset value per share (NAV) or its equivalent as reportedby investment managers, which are audited under AICPA guidelines and that have trading activity and the ability to redeem at NAVon or near the reporting date, are included within Level 2.
Certain investments in hedge funds, private equity funds, or other private investments, and the College's beneficial interest in trustsvalued utilizing unobservable inputs, and which have had no trading activity or cannot be redeemed at NAV or its equivalent on ornear the reporting date are therefore classified within Level 3. These assets are presented in the accompanying financial statements atfair value. The College’s determination of fair value is based upon the best available information provided by the investmentmanager and may incorporate management assumptions and best estimates after considering a variety of internal and externalfactors. Such value generally represents the College’s proportionate share of the partner’s capital of the investment partnerships asreported by their general partners. For these investments, the College, through its monitoring activities, agrees with the fair marketvalue as determined by the investment managers.
Inputs are used in applying the valuation techniques and broadly refer to the assumptions that the College uses to make valuationdecisions, including assumptions about risk. Inputs may include quoted market prices, recent transactions, manager statements,periodicals, newspapers, provisions within agreements with investment managers and other factors. An investment’s level within thefair value hierarchy is based on the lowest level of any input that is significant to the fair value measurement. The categorization ofan investment within the hierarchy is based upon the pricing transparency of the investment and does not necessarily correspond tothe College’s perceived risk of that investment.
18
CLAREMONT MCKENNA COLLEGENOTES TO THE FINANCIAL STATEMENTS
June 30, 2011 and 2010(in thousands)
NOTE 1 – SUMMARY OF SIGNIFICANT ACCOUNTING POLICIES: Continued
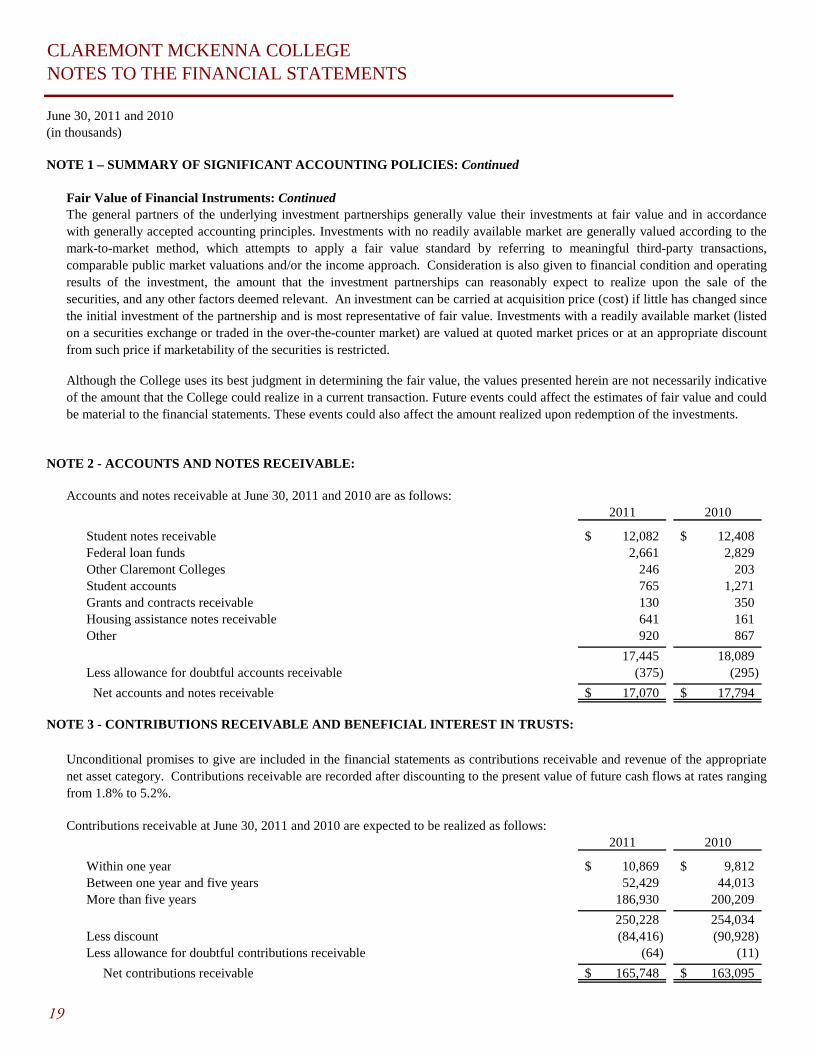
Fair Value of Financial Instruments: Continued
NOTE 2 - ACCOUNTS AND NOTES RECEIVABLE:
2011 2010
Student notes receivable 12,082$ 12,408$ Federal loan funds 2,661 2,829 Other Claremont Colleges 246 203 Student accounts 765 1,271 Grants and contracts receivable 130 350 Housing assistance notes receivable 641 161 Other 920 867
17,445 18,089 Less allowance for doubtful accounts receivable (375) (295)
Net accounts and notes receivable 17,070$ 17,794$
NOTE 3 - CONTRIBUTIONS RECEIVABLE AND BENEFICIAL INTEREST IN TRUSTS:
2011 2010
Within one year 10,869$ 9,812$ Between one year and five years 52,429 44,013 More than five years 186,930 200,209
250,228 254,034 Less discount (84,416) (90,928) Less allowance for doubtful contributions receivable (64) (11)
Net contributions receivable 165,748$ 163,095$
The general partners of the underlying investment partnerships generally value their investments at fair value and in accordancewith generally accepted accounting principles. Investments with no readily available market are generally valued according to themark-to-market method, which attempts to apply a fair value standard by referring to meaningful third-party transactions,comparable public market valuations and/or the income approach. Consideration is also given to financial condition and operatingresults of the investment, the amount that the investment partnerships can reasonably expect to realize upon the sale of thesecurities, and any other factors deemed relevant. An investment can be carried at acquisition price (cost) if little has changed sincethe initial investment of the partnership and is most representative of fair value. Investments with a readily available market (listedon a securities exchange or traded in the over-the-counter market) are valued at quoted market prices or at an appropriate discountfrom such price if marketability of the securities is restricted.
Although the College uses its best judgment in determining the fair value, the values presented herein are not necessarily indicativeof the amount that the College could realize in a current transaction. Future events could affect the estimates of fair value and couldbe material to the financial statements. These events could also affect the amount realized upon redemption of the investments.
Accounts and notes receivable at June 30, 2011 and 2010 are as follows:
Unconditional promises to give are included in the financial statements as contributions receivable and revenue of the appropriatenet asset category. Contributions receivable are recorded after discounting to the present value of future cash flows at rates rangingfrom 1.8% to 5.2%.
Contributions receivable at June 30, 2011 and 2010 are expected to be realized as follows:
19
CLAREMONT MCKENNA COLLEGENOTES TO THE FINANCIAL STATEMENTS
June 30, 2011 and 2010(in thousands)
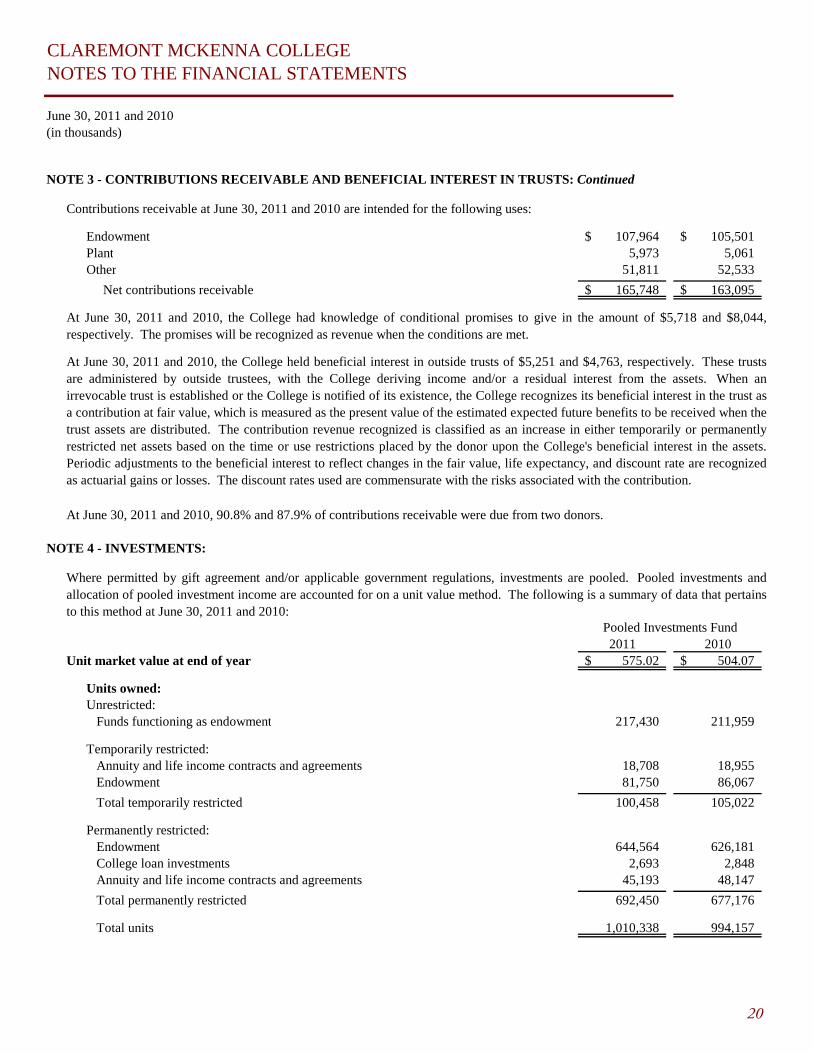
NOTE 3 - CONTRIBUTIONS RECEIVABLE AND BENEFICIAL INTEREST IN TRUSTS: Continued
Endowment 107,964$ 105,501$ Plant 5,973 5,061 Other 51,811 52,533
Net contributions receivable 165,748$ 163,095$
NOTE 4 - INVESTMENTS:
2011 2010Unit market value at end of year 575.02$ 504.07$
Units owned:Unrestricted: Funds functioning as endowment 217,430 211,959
Temporarily restricted: Annuity and life income contracts and agreements 18,708 18,955 Endowment 81,750 86,067
Total temporarily restricted 100,458 105,022
Permanently restricted: Endowment 644,564 626,181 College loan investments 2,693 2,848 Annuity and life income contracts and agreements 45,193 48,147
Total permanently restricted 692,450 677,176
Total units 1,010,338 994,157
Where permitted by gift agreement and/or applicable government regulations, investments are pooled. Pooled investments andallocation of pooled investment income are accounted for on a unit value method. The following is a summary of data that pertainsto this method at June 30, 2011 and 2010:
Contributions receivable at June 30, 2011 and 2010 are intended for the following uses:
Pooled Investments Fund
At June 30, 2011 and 2010, the College held beneficial interest in outside trusts of $5,251 and $4,763, respectively. These trustsare administered by outside trustees, with the College deriving income and/or a residual interest from the assets. When anirrevocable trust is established or the College is notified of its existence, the College recognizes its beneficial interest in the trust asa contribution at fair value, which is measured as the present value of the estimated expected future benefits to be received when thetrust assets are distributed. The contribution revenue recognized is classified as an increase in either temporarily or permanentlyrestricted net assets based on the time or use restrictions placed by the donor upon the College's beneficial interest in the assets.Periodic adjustments to the beneficial interest to reflect changes in the fair value, life expectancy, and discount rate are recognizedas actuarial gains or losses. The discount rates used are commensurate with the risks associated with the contribution.
At June 30, 2011 and 2010, 90.8% and 87.9% of contributions receivable were due from two donors.
At June 30, 2011 and 2010, the College had knowledge of conditional promises to give in the amount of $5,718 and $8,044,respectively. The promises will be recognized as revenue when the conditions are met.
20

CLAREMONT MCKENNA COLLEGENOTES TO THE FINANCIAL STATEMENTS
June 30, 2011 and 2010(in thousands)
NOTE 4 - INVESTMENTS: Continued
Amounts allocated in accordance with spending policy for pooled investments: 2011 2010Net pooled investment income 5,169$ 4,260$ Pooled investment gains appropriated 22,718 22,396
Total spending policy income and gains 27,887 26,656
Other investment income 2,091 2,334 Less amounts allocated to annuity and life income contracts and agreements (1,840) (1,880)
Total investment income 28,138$ 27,110$
Realized and unrealized gains/(losses), net of spending allocation 64,230 34,471
Total investment returns 92,368$ 61,581$
2011 2010Cash equivalents 33,213$ 43,158$ Domestic equities 169,913 130,999 International equities 136,605 92,958 Domestic treasuries 16,740 21,443 Global fixed income 47,102 69,658 High yield and bank loans 30,426 7,139 Assets whose use is limited (Note 11) 4,547 46,281 Private investments: Long/short equity 27,353 27,339 Absolute return funds 74,377 61,930 Private equity and venture capital 74,380 68,394 Real estate, energy, and timber 33,667 24,788
Total investments 648,323$ 594,087$
By category: 2011 2010Endowment and funds functioning as endowment: Pooled investments 542,670$ 465,863$ Separately invested 566 584
Total endowment and funds functioning as endowment 543,236 466,447
Annuity and life income contracts: Pooled investments 36,745$ 33,824$ Separately invested 16,307 13,928
Total annuity and life income contracts and agreements 53,052 47,752
Investment income related to College investments for the years ended June 30, 2011 and 2010, net of management and custody feesof $3,880 and $3,936, respectively, is as follows:
It is the College's policy to establish and maintain a diversified investment portfolio. The carrying value of investments are basedon the quoted market prices, analytical pricing methods for investments for which there is no market, and the carrying value oflimited partnership net assets in proportion to the College's interest. The carrying values are considered fair values, except for realestate and other investments. The following schedule summarizes the assets in pooled investments and the assets held as separateinvestments at June 30, 2011 and 2010:
21
CLAREMONT MCKENNA COLLEGENOTES TO THE FINANCIAL STATEMENTS
June 30, 2011 and 2010(in thousands)
NOTE 4 - INVESTMENTS: Continued
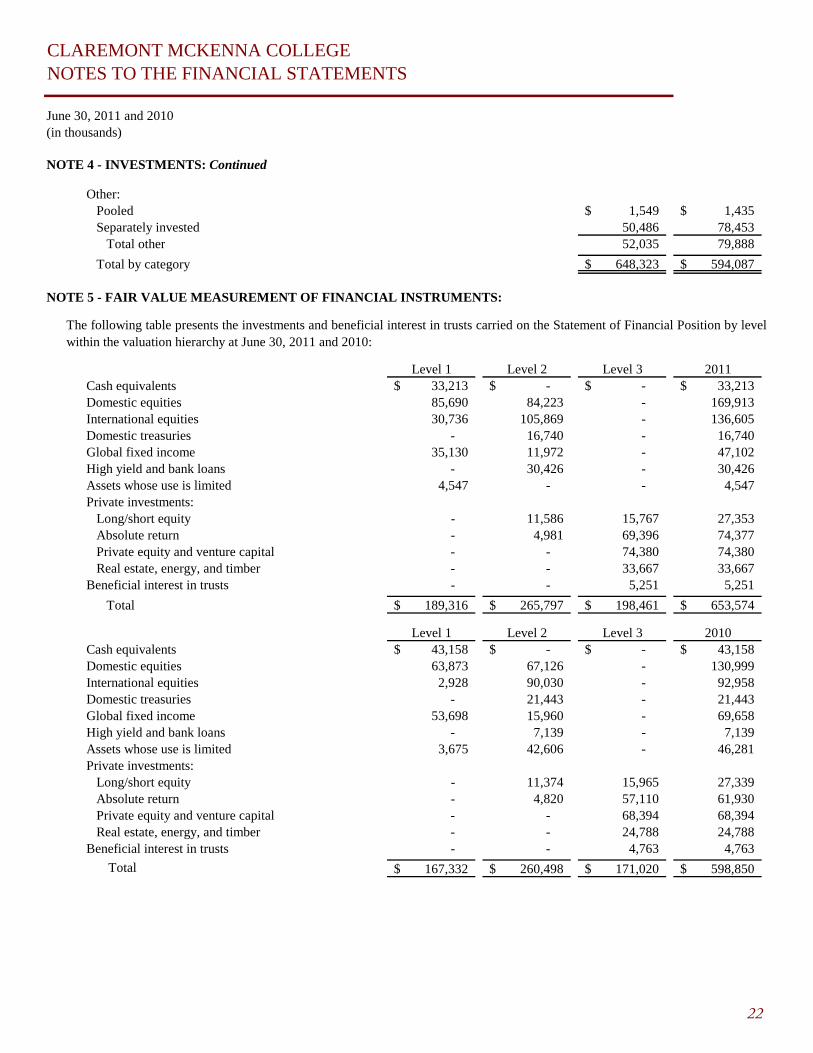
Other: Pooled 1,549$ 1,435$ Separately invested 50,486 78,453 Total other 52,035 79,888
Total by category 648,323$ 594,087$
NOTE 5 - FAIR VALUE MEASUREMENT OF FINANCIAL INSTRUMENTS:
Level 1 Level 2 Level 3 2011Cash equivalents 33,213$ -$ -$ 33,213$ Domestic equities 85,690 84,223 - 169,913 International equities 30,736 105,869 - 136,605 Domestic treasuries - 16,740 - 16,740 Global fixed income 35,130 11,972 - 47,102 High yield and bank loans - 30,426 - 30,426 Assets whose use is limited 4,547 - - 4,547 Private investments: Long/short equity - 11,586 15,767 27,353 Absolute return - 4,981 69,396 74,377 Private equity and venture capital - - 74,380 74,380 Real estate, energy, and timber - - 33,667 33,667 Beneficial interest in trusts - - 5,251 5,251
Total 189,316$ 265,797$ 198,461$ 653,574$
Level 1 Level 2 Level 3 2010Cash equivalents 43,158$ -$ -$ 43,158$ Domestic equities 63,873 67,126 - 130,999 International equities 2,928 90,030 - 92,958 Domestic treasuries - 21,443 - 21,443 Global fixed income 53,698 15,960 - 69,658 High yield and bank loans - 7,139 - 7,139 Assets whose use is limited 3,675 42,606 - 46,281 Private investments: Long/short equity - 11,374 15,965 27,339 Absolute return - 4,820 57,110 61,930 Private equity and venture capital - - 68,394 68,394 Real estate, energy, and timber - - 24,788 24,788 Beneficial interest in trusts - - 4,763 4,763
Total 167,332$ 260,498$ 171,020$ 598,850$
The following table presents the investments and beneficial interest in trusts carried on the Statement of Financial Position by levelwithin the valuation hierarchy at June 30, 2011 and 2010:
22
CLAREMONT MCKENNA COLLEGENOTES TO THE FINANCIAL STATEMENTS
June 30, 2011 and 2010(in thousands)
NOTE 5 - FAIR VALUE MEASUREMENT OF FINANCIAL INSTRUMENTS: Continued
Real estate, BeneficialLong/short Absolute Private equity & energy, and Interest
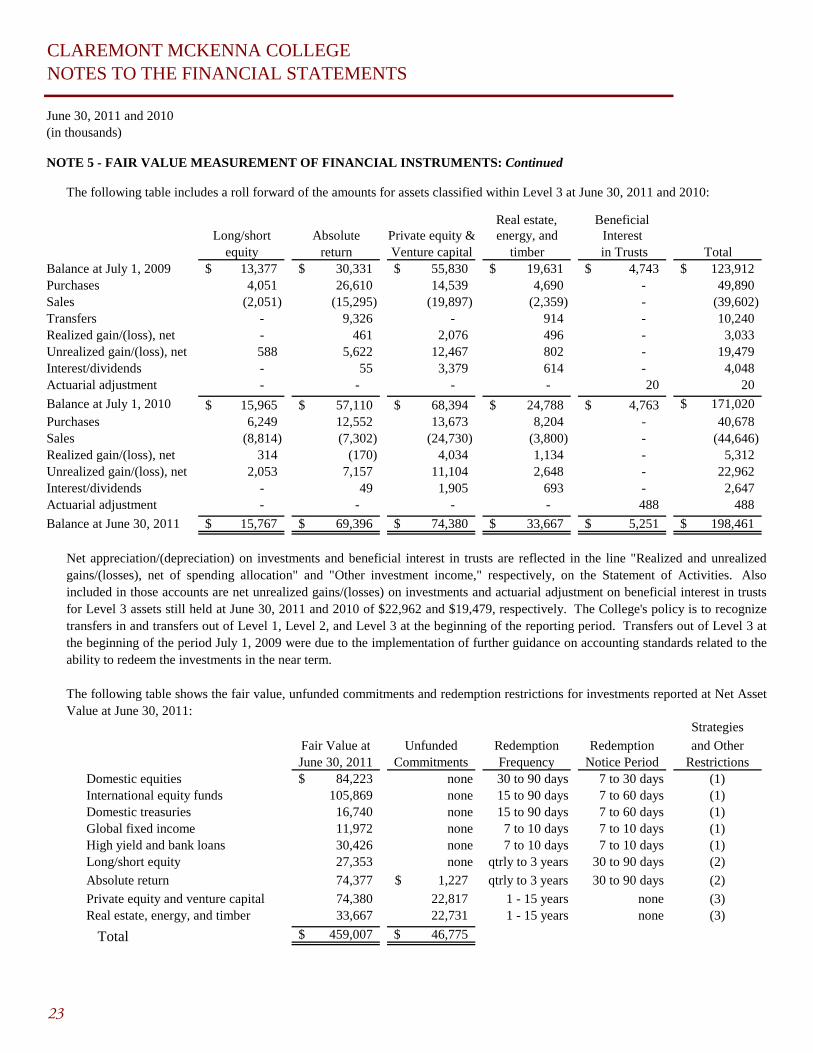
equity return Venture capital timber in Trusts TotalBalance at July 1, 2009 13,377$ 30,331$ 55,830$ 19,631$ 4,743$ 123,912$ Purchases 4,051 26,610 14,539 4,690 - 49,890 Sales (2,051) (15,295) (19,897) (2,359) - (39,602) Transfers - 9,326 - 914 - 10,240 Realized gain/(loss), net - 461 2,076 496 - 3,033 Unrealized gain/(loss), net 588 5,622 12,467 802 - 19,479 Interest/dividends - 55 3,379 614 - 4,048 Actuarial adjustment - - - - 20 20
Balance at July 1, 2010 15,965$ 57,110$ 68,394$ 24,788$ 4,763$ 171,020$ Purchases 6,249 12,552 13,673 8,204 - 40,678 Sales (8,814) (7,302) (24,730) (3,800) - (44,646) Realized gain/(loss), net 314 (170) 4,034 1,134 - 5,312 Unrealized gain/(loss), net 2,053 7,157 11,104 2,648 - 22,962 Interest/dividends - 49 1,905 693 - 2,647 Actuarial adjustment - - - - 488 488
Balance at June 30, 2011 15,767$ 69,396$ 74,380$ 33,667$ 5,251$ 198,461$
Strategies
Fair Value at Unfunded Redemption Redemption and OtherJune 30, 2011 Commitments Frequency Notice Period Restrictions
Domestic equities 84,223$ none 30 to 90 days 7 to 30 days (1)International equity funds 105,869 none 15 to 90 days 7 to 60 days (1)Domestic treasuries 16,740 none 15 to 90 days 7 to 60 days (1)Global fixed income 11,972 none 7 to 10 days 7 to 10 days (1)High yield and bank loans 30,426 none 7 to 10 days 7 to 10 days (1)Long/short equity 27,353 none qtrly to 3 years 30 to 90 days (2)
Absolute return 74,377 1,227$ qtrly to 3 years 30 to 90 days (2)
Private equity and venture capital 74,380 22,817 1 - 15 years none (3)Real estate, energy, and timber 33,667 22,731 1 - 15 years none (3)
Total 459,007$ 46,775$
Net appreciation/(depreciation) on investments and beneficial interest in trusts are reflected in the line "Realized and unrealizedgains/(losses), net of spending allocation" and "Other investment income," respectively, on the Statement of Activities. Alsoincluded in those accounts are net unrealized gains/(losses) on investments and actuarial adjustment on beneficial interest in trustsfor Level 3 assets still held at June 30, 2011 and 2010 of $22,962 and $19,479, respectively. The College's policy is to recognizetransfers in and transfers out of Level 1, Level 2, and Level 3 at the beginning of the reporting period. Transfers out of Level 3 atthe beginning of the period July 1, 2009 were due to the implementation of further guidance on accounting standards related to theability to redeem the investments in the near term.
The following table includes a roll forward of the amounts for assets classified within Level 3 at June 30, 2011 and 2010:
The following table shows the fair value, unfunded commitments and redemption restrictions for investments reported at Net AssetValue at June 30, 2011:
23

CLAREMONT MCKENNA COLLEGENOTES TO THE FINANCIAL STATEMENTS
June 30, 2011 and 2010(in thousands)
NOTE 5 - FAIR VALUE MEASUREMENT OF FINANCIAL INSTRUMENTS: Continued
NOTE 6 - PLANT FACILITIES:
2011 2010 Land and land improvements 14,539$ 13,533$ Buildings 103,679 103,679 Equipment 15,775 14,138 Equipment under capital lease 1,024 - Property held for future use 12,276 12,676 Construction in progress 85,994 46,671
233,287 190,697 Less accumulated depreciation (58,301) (53,652)
Net plant facilities 174,986$ 137,045$
(3) These categories include investments in leveraged buyout, distressed securities, venture capital, real estate, and energy privatelimited partnership funds. The real estate and energy funds serve as an inflation hedge for the portfolio and the other privatecategories are included for total return enhancement. The fair values of the investments in these categories have been estimatedusing the College's ownership percentage of the total net asset value for each underlying fund. The contractual life of these fundsranges from ten to fifteen years and distributions will be received as the underlying investments are realized.
(1) These categories include investments in commingled fund vehicles that invest in debt and equity securities. The debt fundsserve as a deflation hedge for the portfolio, while the equity allocation seeks total return and growth. The fair values of theinvestments in these categories have been estimated using the net asset value per share as reported by each underlying fund. Thereare no significant redemption restrictions in place for these funds.
(2) This category includes investments in global long/short, event driven, diversified arbitrage, distressed securities, and other multi-strategy hedge fund vehicles. The hedge fund allocation is intended to reduce risk by mitigating volatility of the equity markets andtargets positive and stable absolute returns. The fair values of the investments in this category have been estimated using the netasset value per share as reported by each underlying fund.
Plant facilities are recorded at cost or estimated fair value at the date of donation, and at June 30, 2011 and 2010 consists of thefollowing:
At June 30, 2011 and 2010 the amount of capitalized interest included in construction in progress was $4,421 and $1,615,respectively.
24

CLAREMONT MCKENNA COLLEGENOTES TO THE FINANCIAL STATEMENTS
June 30, 2011 and 2010(in thousands)
NOTE 7 - CAPITAL LEASE OBLIGATION:
LeaseFiscal Years Ending June 30, Payments
2012 226$ 2013 226 2014 226 2015 226 2016 123
Total payments 1,027 Less interest (86)
$ 941
NOTE 8 - ASSET RETIREMENT OBLIGATION:
2011 2010 Obligations incurred -$ -$ Obligations settled - - Accretion expense 30 29 Revisions in estimated cash flows - -
30 29 Beginning balance 755 726
Ending balance 785$ 755$
NOTE 9 - LIFE INCOME AND ANNUITIES PAYABLE:
The College has recorded asset retirement obligations related to certain fixed assets, primarily for disposal of regulated materialsupon eventual retirement of the assets.
Life income and annuities payable of $41,420 and $40,959 at June 30, 2011 and 2010, respectively, represent actuariallydetermined liabilities for contractual obligations under gift annuities, unitrusts, and pooled income funds.
Matured annuity and life income agreements for the years ended June 30, 2011 and 2010 also include $1,061 and $2,341,respectively, of releases to endowment within permanently restricted net assets.
The College entered into capital lease commitments to finance the acquisition of computer equipment. The correspondingobligations are due in monthly and quarterly installments with maturities through June 2016.
The annual lease obligation at June 30, 2011 was as follows:
Total capital lease obligation
The following schedule summarizes asset retirement obligation activity for the years ended June 30, 2011 and 2010:
25
CLAREMONT MCKENNA COLLEGENOTES TO THE FINANCIAL STATEMENTS
June 30, 2011 and 2010(in thousands)
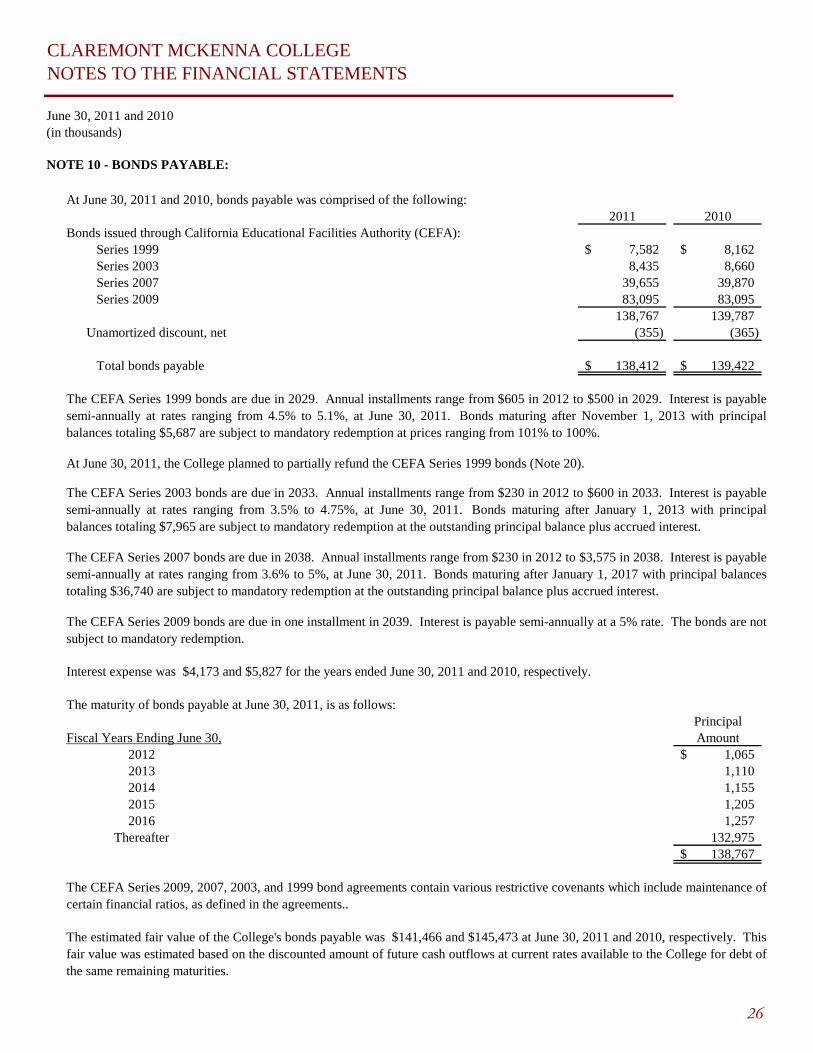
NOTE 10 - BONDS PAYABLE:
2011 2010Bonds issued through California Educational Facilities Authority (CEFA):
Series 1999 7,582$ 8,162$ Series 2003 8,435 8,660 Series 2007 39,655 39,870 Series 2009 83,095 83,095
138,767 139,787 Unamortized discount, net (355) (365)
Total bonds payable 138,412$ 139,422$
The maturity of bonds payable at June 30, 2011, is as follows:Principal
Fiscal Years Ending June 30, Amount2012 1,065$ 2013 1,110 2014 1,155 2015 1,205 2016 1,257
Thereafter 132,975 138,767$
At June 30, 2011, the College planned to partially refund the CEFA Series 1999 bonds (Note 20).
The CEFA Series 2009 bonds are due in one installment in 2039. Interest is payable semi-annually at a 5% rate. The bonds are notsubject to mandatory redemption.
The CEFA Series 2003 bonds are due in 2033. Annual installments range from $230 in 2012 to $600 in 2033. Interest is payablesemi-annually at rates ranging from 3.5% to 4.75%, at June 30, 2011. Bonds maturing after January 1, 2013 with principalbalances totaling $7,965 are subject to mandatory redemption at the outstanding principal balance plus accrued interest.
The CEFA Series 2007 bonds are due in 2038. Annual installments range from $230 in 2012 to $3,575 in 2038. Interest is payablesemi-annually at rates ranging from 3.6% to 5%, at June 30, 2011. Bonds maturing after January 1, 2017 with principal balancestotaling $36,740 are subject to mandatory redemption at the outstanding principal balance plus accrued interest.
At June 30, 2011 and 2010, bonds payable was comprised of the following:
Interest expense was $4,173 and $5,827 for the years ended June 30, 2011 and 2010, respectively.
The CEFA Series 2009, 2007, 2003, and 1999 bond agreements contain various restrictive covenants which include maintenance ofcertain financial ratios, as defined in the agreements..
The estimated fair value of the College's bonds payable was $141,466 and $145,473 at June 30, 2011 and 2010, respectively. Thisfair value was estimated based on the discounted amount of future cash outflows at current rates available to the College for debt ofthe same remaining maturities.
The CEFA Series 1999 bonds are due in 2029. Annual installments range from $605 in 2012 to $500 in 2029. Interest is payablesemi-annually at rates ranging from 4.5% to 5.1%, at June 30, 2011. Bonds maturing after November 1, 2013 with principalbalances totaling $5,687 are subject to mandatory redemption at prices ranging from 101% to 100%.
26
CLAREMONT MCKENNA COLLEGENOTES TO THE FINANCIAL STATEMENTS
June 30, 2011 and 2010(in thousands)
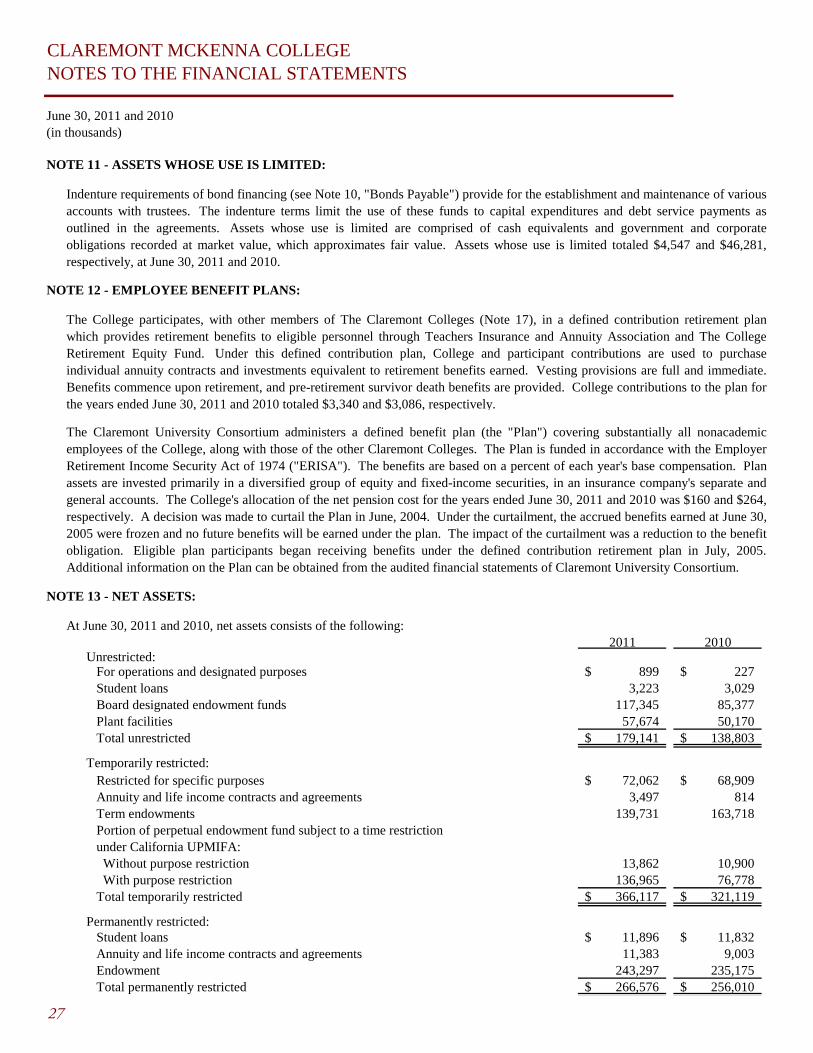
NOTE 11 - ASSETS WHOSE USE IS LIMITED:
NOTE 12 - EMPLOYEE BENEFIT PLANS:
NOTE 13 - NET ASSETS:
At June 30, 2011 and 2010, net assets consists of the following:2011 2010
Unrestricted: For operations and designated purposes 899$ 227$ Student loans 3,223 3,029 Board designated endowment funds 117,345 85,377 Plant facilities 57,674 50,170 Total unrestricted 179,141$ 138,803$
Temporarily restricted: Restricted for specific purposes 72,062$ 68,909$ Annuity and life income contracts and agreements 3,497 814 Term endowments 139,731 163,718 Portion of perpetual endowment fund subject to a time restriction under California UPMIFA: Without purpose restriction 13,862 10,900 With purpose restriction 136,965 76,778 Total temporarily restricted 366,117$ 321,119$
Permanently restricted: Student loans 11,896$ 11,832$ Annuity and life income contracts and agreements 11,383 9,003 Endowment 243,297 235,175 Total permanently restricted 266,576$ 256,010$
Indenture requirements of bond financing (see Note 10, "Bonds Payable") provide for the establishment and maintenance of variousaccounts with trustees. The indenture terms limit the use of these funds to capital expenditures and debt service payments asoutlined in the agreements. Assets whose use is limited are comprised of cash equivalents and government and corporateobligations recorded at market value, which approximates fair value. Assets whose use is limited totaled $4,547 and $46,281,respectively, at June 30, 2011 and 2010.
The Claremont University Consortium administers a defined benefit plan (the "Plan") covering substantially all nonacademicemployees of the College, along with those of the other Claremont Colleges. The Plan is funded in accordance with the EmployerRetirement Income Security Act of 1974 ("ERISA"). The benefits are based on a percent of each year's base compensation. Planassets are invested primarily in a diversified group of equity and fixed-income securities, in an insurance company's separate andgeneral accounts. The College's allocation of the net pension cost for the years ended June 30, 2011 and 2010 was $160 and $264,respectively. A decision was made to curtail the Plan in June, 2004. Under the curtailment, the accrued benefits earned at June 30,2005 were frozen and no future benefits will be earned under the plan. The impact of the curtailment was a reduction to the benefitobligation. Eligible plan participants began receiving benefits under the defined contribution retirement plan in July, 2005.Additional information on the Plan can be obtained from the audited financial statements of Claremont University Consortium.
The College participates, with other members of The Claremont Colleges (Note 17), in a defined contribution retirement planwhich provides retirement benefits to eligible personnel through Teachers Insurance and Annuity Association and The CollegeRetirement Equity Fund. Under this defined contribution plan, College and participant contributions are used to purchaseindividual annuity contracts and investments equivalent to retirement benefits earned. Vesting provisions are full and immediate.Benefits commence upon retirement, and pre-retirement survivor death benefits are provided. College contributions to the plan forthe years ended June 30, 2011 and 2010 totaled $3,340 and $3,086, respectively.
27

CLAREMONT MCKENNA COLLEGENOTES TO THE FINANCIAL STATEMENTS
June 30, 2011 and 2010(in thousands)
NOTE 14 - ENDOWMENT:
Changes in the College's endowment for the year ended June 30, 2011 were as follows:
Temporarily PermanentlyUnrestricted Restricted Restricted 2011
Investment returns: Earned income 5,169$ -$ 23$ 5,192$ Change in realized and unrealized net appreciation (depreciation) of investments 51,657 37,105 (168) 88,594
Net investment return 56,826 37,105 (145) 93,786
Endowment returns reinvested (or distributed for operations) (26,896) 1,547 318 (25,031)
Net investment returns 29,930 38,652 173 68,755
Other changes in endowed equity: Gifts - 4,381 7,405 11,786 Other additions, net 2,038 (3,871) 544 (1,289)
Total other changes in endowed equity 2,038 510 7,949 10,497
Net change in endowed equity 31,968 39,162 8,122 79,252
Endowed equity, beginning of year 85,377 251,396 235,175 571,948
Endowed equity, end of year 117,345$ 290,558$ 243,297$ 651,200$
At June 30, 2011, endowed equity consists of the following assets:
Contributions receivable, net of discount -$ 103,252$ 4,712$ 107,964$ Investments 117,345 187,306 238,585 543,236
Total endowed equity 117,345$ 290,558$ 243,297$ 651,200$
The net assets of the College include permanent endowments and funds functioning as endowments. Permanent endowments aresubject to the restrictions of gift instruments requiring in perpetuity that the principal be invested and the income only be utilized asprovided under UPMIFA. While funds have been established by the Board of Trustees to function as endowment, any portion ofsuch funds may be expended.
28
CLAREMONT MCKENNA COLLEGENOTES TO THE FINANCIAL STATEMENTS
June 30, 2011 and 2010(in thousands)
NOTE 14 - ENDOWMENT: Continued
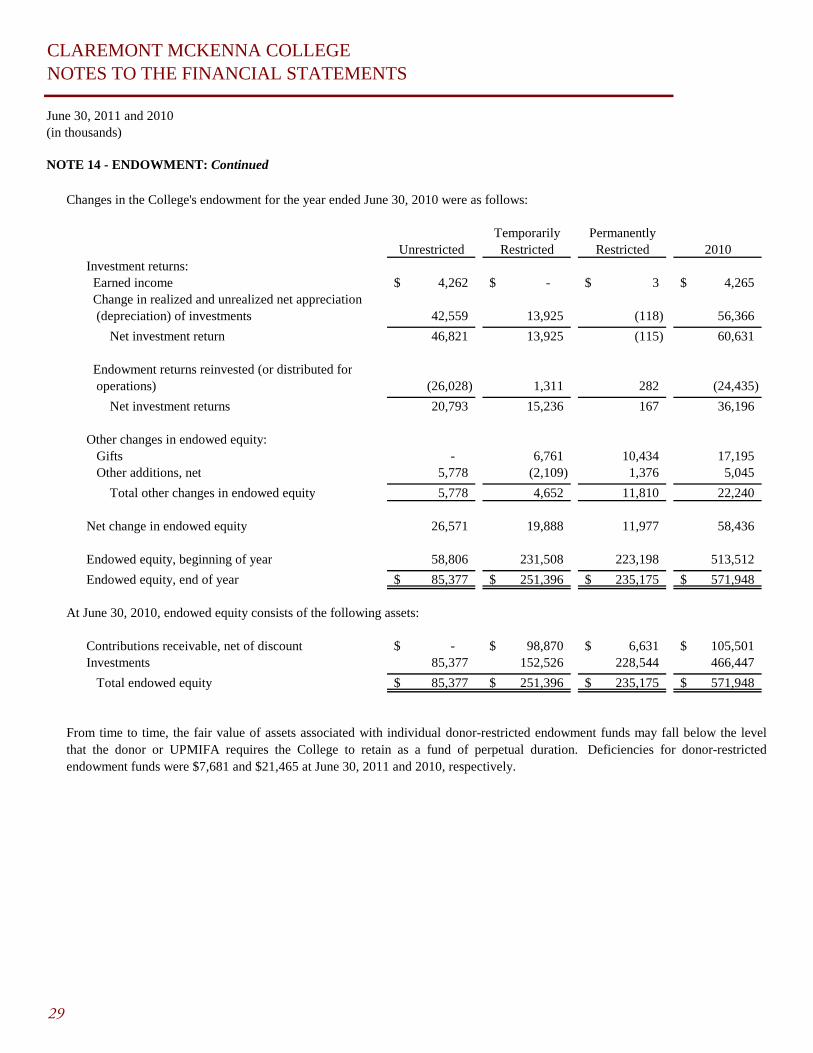
Changes in the College's endowment for the year ended June 30, 2010 were as follows:
Temporarily PermanentlyUnrestricted Restricted Restricted 2010
Investment returns: Earned income 4,262$ -$ 3$ 4,265$ Change in realized and unrealized net appreciation (depreciation) of investments 42,559 13,925 (118) 56,366
Net investment return 46,821 13,925 (115) 60,631
Endowment returns reinvested (or distributed for operations) (26,028) 1,311 282 (24,435)
Net investment returns 20,793 15,236 167 36,196
Other changes in endowed equity: Gifts - 6,761 10,434 17,195 Other additions, net 5,778 (2,109) 1,376 5,045
Total other changes in endowed equity 5,778 4,652 11,810 22,240
Net change in endowed equity 26,571 19,888 11,977 58,436
Endowed equity, beginning of year 58,806 231,508 223,198 513,512
Endowed equity, end of year 85,377$ 251,396$ 235,175$ 571,948$
At June 30, 2010, endowed equity consists of the following assets:
Contributions receivable, net of discount -$ 98,870$ 6,631$ 105,501$ Investments 85,377 152,526 228,544 466,447
Total endowed equity 85,377$ 251,396$ 235,175$ 571,948$
From time to time, the fair value of assets associated with individual donor-restricted endowment funds may fall below the levelthat the donor or UPMIFA requires the College to retain as a fund of perpetual duration. Deficiencies for donor-restrictedendowment funds were $7,681 and $21,465 at June 30, 2011 and 2010, respectively.
29
CLAREMONT MCKENNA COLLEGENOTES TO THE FINANCIAL STATEMENTS
June 30, 2011 and 2010(in thousands)
NOTE 15 - NET STUDENT REVENUES:
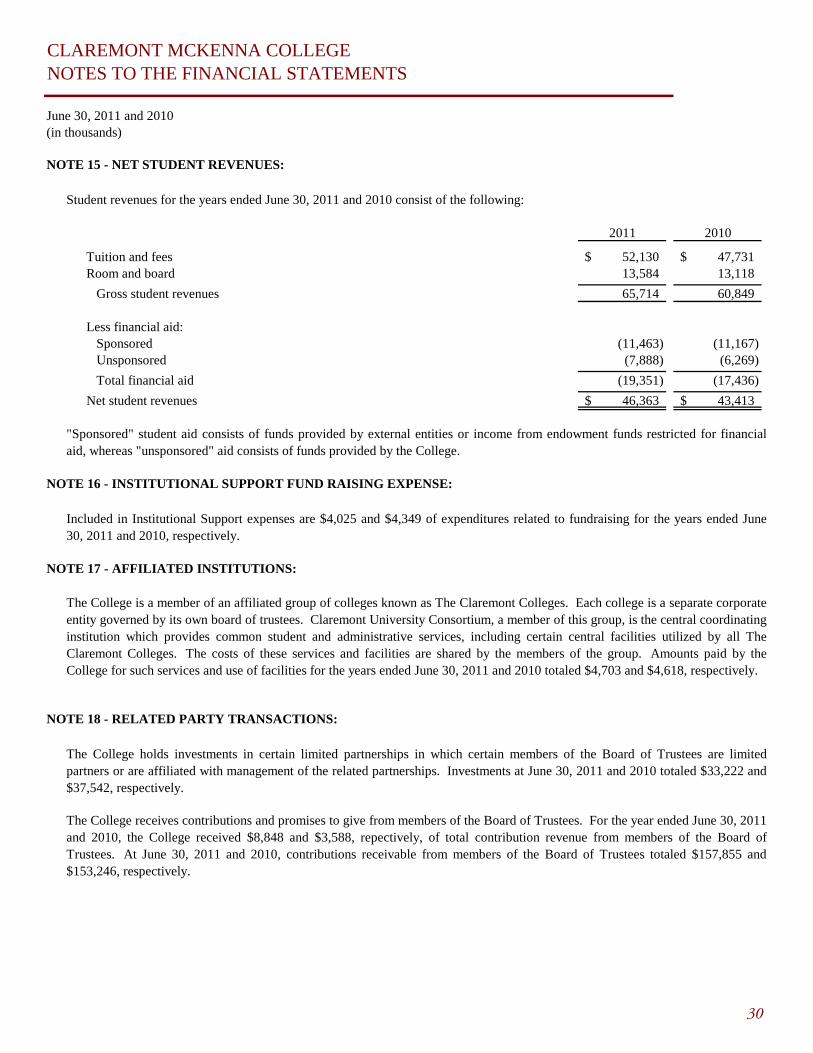
Student revenues for the years ended June 30, 2011 and 2010 consist of the following:
2011 2010
Tuition and fees 52,130$ 47,731$ Room and board 13,584 13,118
Gross student revenues 65,714 60,849
Less financial aid: Sponsored (11,463) (11,167) Unsponsored (7,888) (6,269)
Total financial aid (19,351) (17,436)
Net student revenues 46,363$ 43,413$
NOTE 16 - INSTITUTIONAL SUPPORT FUND RAISING EXPENSE:
NOTE 17 - AFFILIATED INSTITUTIONS:
NOTE 18 - RELATED PARTY TRANSACTIONS:
"Sponsored" student aid consists of funds provided by external entities or income from endowment funds restricted for financialaid, whereas "unsponsored" aid consists of funds provided by the College.
Included in Institutional Support expenses are $4,025 and $4,349 of expenditures related to fundraising for the years ended June30, 2011 and 2010, respectively.
The College is a member of an affiliated group of colleges known as The Claremont Colleges. Each college is a separate corporateentity governed by its own board of trustees. Claremont University Consortium, a member of this group, is the central coordinatinginstitution which provides common student and administrative services, including certain central facilities utilized by all TheClaremont Colleges. The costs of these services and facilities are shared by the members of the group. Amounts paid by theCollege for such services and use of facilities for the years ended June 30, 2011 and 2010 totaled $4,703 and $4,618, respectively.
The College holds investments in certain limited partnerships in which certain members of the Board of Trustees are limitedpartners or are affiliated with management of the related partnerships. Investments at June 30, 2011 and 2010 totaled $33,222 and$37,542, respectively.
The College receives contributions and promises to give from members of the Board of Trustees. For the year ended June 30, 2011and 2010, the College received $8,848 and $3,588, repectively, of total contribution revenue from members of the Board ofTrustees. At June 30, 2011 and 2010, contributions receivable from members of the Board of Trustees totaled $157,855 and$153,246, respectively.
30

CLAREMONT MCKENNA COLLEGENOTES TO THE FINANCIAL STATEMENTS
June 30, 2011 and 2010(in thousands)
NOTE 19 - COMMITMENTS AND CONTINGENCIES:
NOTE 20 - SUBSEQUENT EVENTS:
Subsequent events are events or transactions that occur after the statement of financial position date but before financial statementsare available to be issued. The College recognizes in the financial statements the effects of all subsequent events that provideadditional evidence about conditions that existed at the date of the statement of financial position, including the estimates inherentin the process of preparing the financial statements. The College’s financial statements do not recognize subsequent events thatprovide evidence about conditions that did not exist at the date of the statement of financial position but arose after the statement offinancial position date and before financial statements are available to be issued.
In July 2011, the College completed a new municipal bond financing through the California Educational Facilities Authority(CEFA) in the par amount of $5,480. Proceeds from the bonds will be placed in an irrevocable trust to provide for the partialrefunding of $5,690 par value of CEFA 1999 Series bonds and to pay costs associated with the bond issuance.
Subsequent events have been evaluated through October 20, 2011 which corresponds to the date when the financial statements areavailable for issuance.
Certain federal grants, including financial aid which the College administers and for which it receives reimbursements, are subjectto audit and final acceptance by federal granting agencies. Current and prior year costs of such grants are subject to adjustmentupon audit. The amount of expenditures that may be disallowed by the grantor, if any, cannot be determined at this time, althoughthe College expects such amounts, if any, would not have a significant impact on the financial position of the College.
Occasionally, the College is involved in lawsuits arising in the ordinary course of its operations. The College's management doesnot expect the ultimate resolution of pending legal actions to have a material effect on the financial position or results of operationof the College.
31

For additional copies, please contactRobin J. Aspinall
Vice President for Business and Administration and Treasurer
Bauer Center, 500 East Ninth StreetClaremont, California 91711-6400
(909) [email protected]