Embed Size (px)
Citation preview
LOGISTICS 2009•February 8-11, 2009 ∙ Gaylord Texan ∙ Dallas, Texas
Steve WegleitnerDirector, Vendor Operations – Target Corporation
Ian RickettsDirector, Operational Excellence – Unilever US
Leveraging Fact-Based Decision Making for Continuous Improvement
Driving Supply Chain Performance
“Let’s work the problem people.Let’s not make things worse by guessing.”
Gene Kranz Apollo 13 Flight Director
• DMAI2C Approach• CAPDo Approach• Key Phases
— Objectives
— Methodology/Tools/Concepts
• ASN Match Improvement Project• Results• Key Messages
Agenda
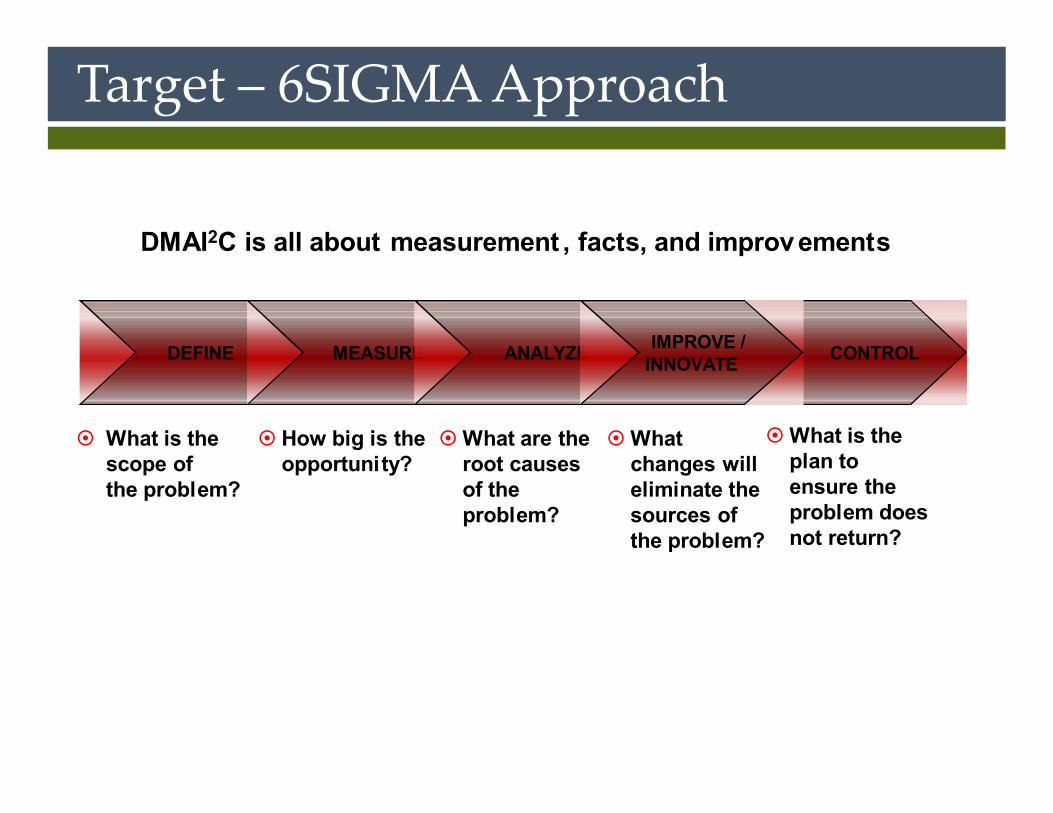
DMAI2C is all about measurement , facts, and improv ements
DEFINE
¤ What is the scope of the problem?
MEASURE
¤ How big is the opportunity?
ANALYZE
¤What are the root causes of the problem?
¤What changes will eliminate the sources of the problem?
CONTROL
¤What is the plan to ensure the problem does not return?
IMPROVE / INNOVATE
Target – 6SIGMA Approach
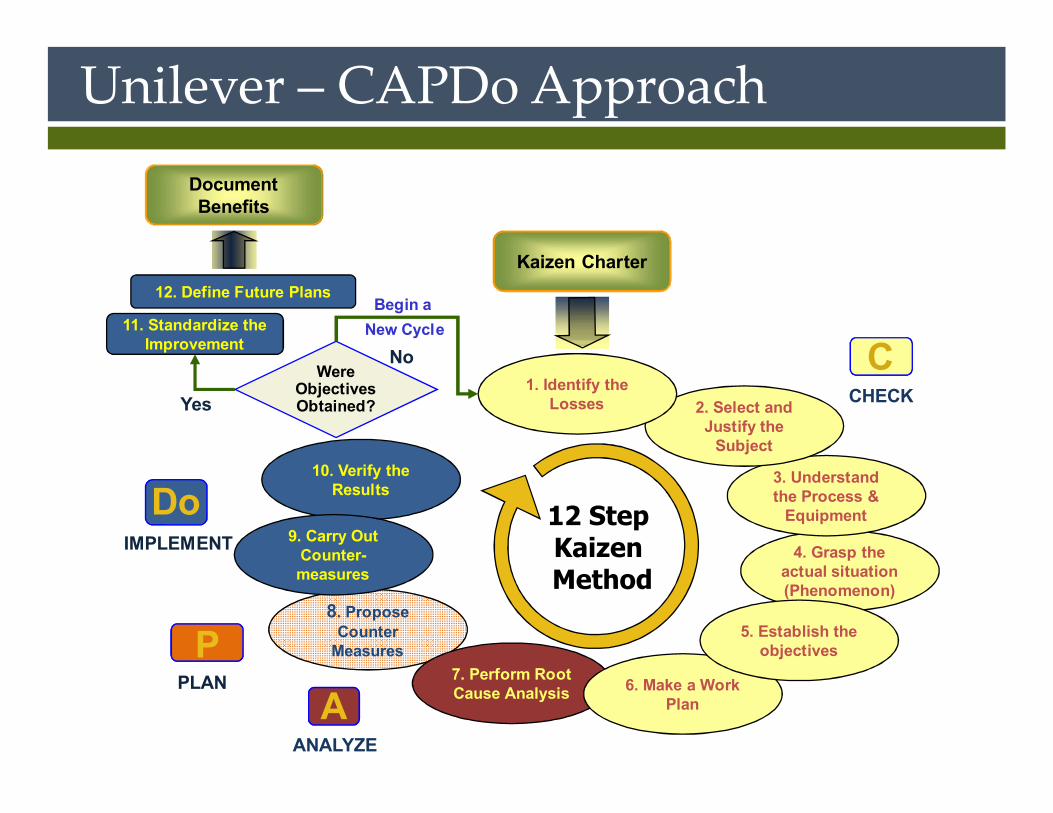
4. Grasp the actual situation(Phenomenon)
3. Understand the Process &
Equipment
CCHECK2. Select and
Justify the Subject
1. Identify the Losses
12 Step Kaizen Method
8. Propose Counter
Measures7. Perform Root Cause Analysis
PPLAN
10. Verify the Results
9. Carry OutCounter-measures
DoIMPLEMENT
6. Make a Work Plan
5. Establish the objectives
ANALYZE
A
Were Objectives Obtained?
11. Standardize the Improvement
Begin aNew Cycle
Yes
12. Define Future Plans
Kaizen Charter
No
Unilever – CAPDo ApproachDocument Benefits
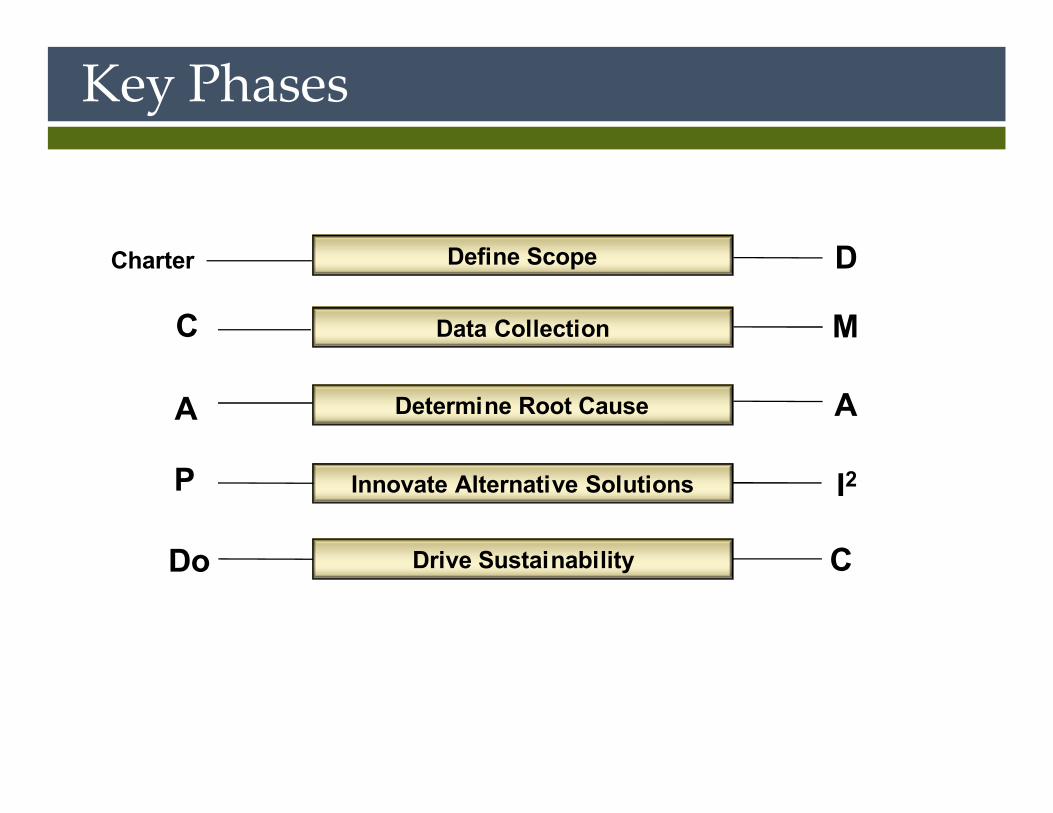
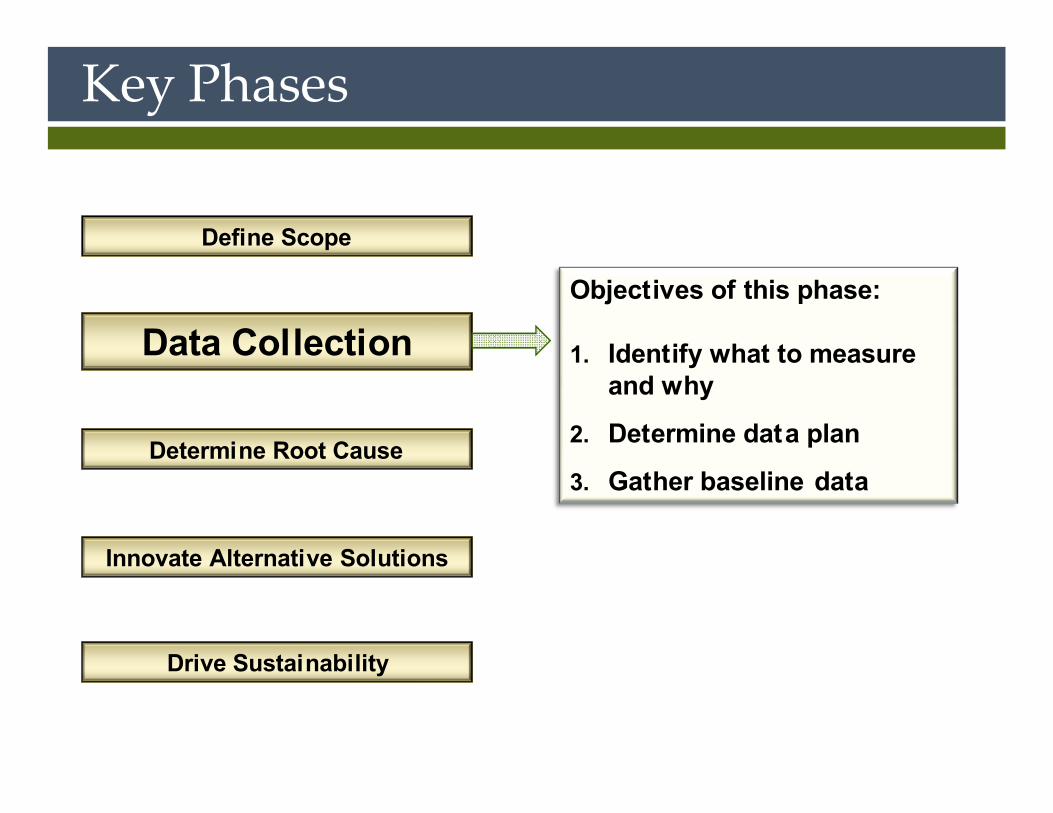
Key Phases
Define Scope
Data Collection
Determine Root Cause
Innovate Alternative Solutions
Drive Sustainability
Charter
A
P
Do
D
M
A
I2
C
C
ASN Match Improvement Project
Phenomenon: Unilever is not consistently compliant with Target 95% ASN match requirement
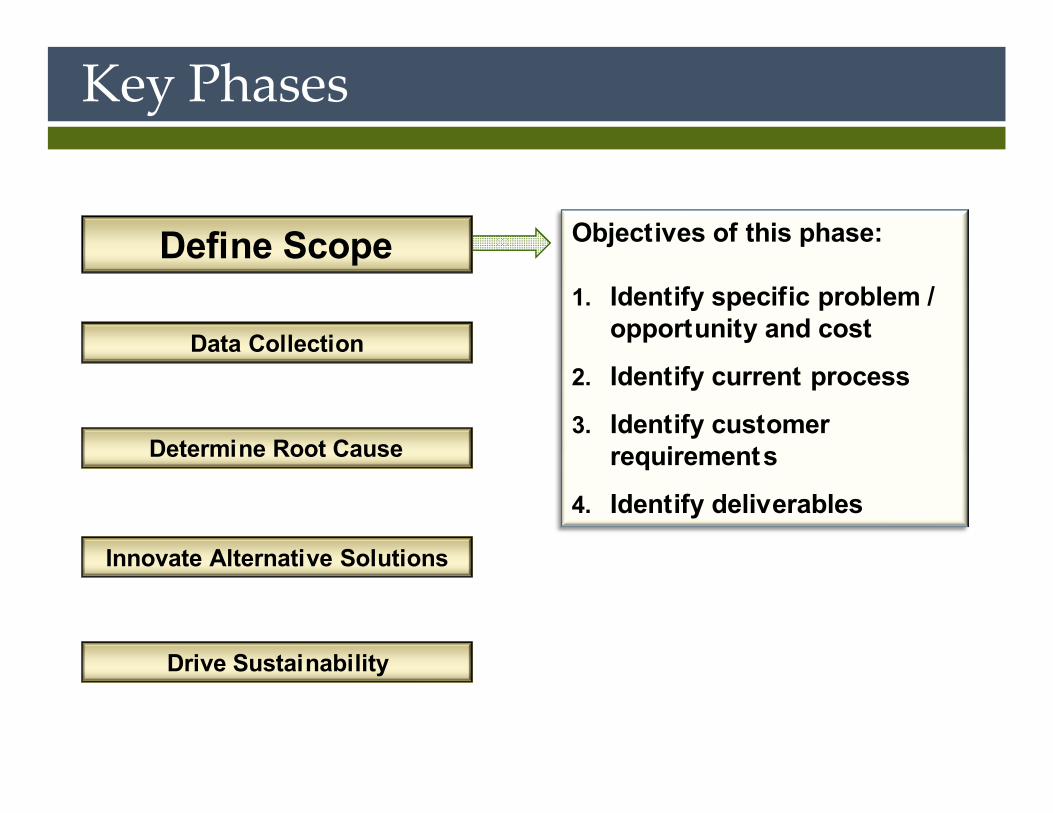
Key Phases
Data Collection
Determine Root Cause
Innovate Alternative Solutions
Drive Sustainability
Objectives of this phase:
1. Identify specific problem / opportunity and cost
2. Identify current process
3. Identify customer requirements
4. Identify deliverables
Define Scope
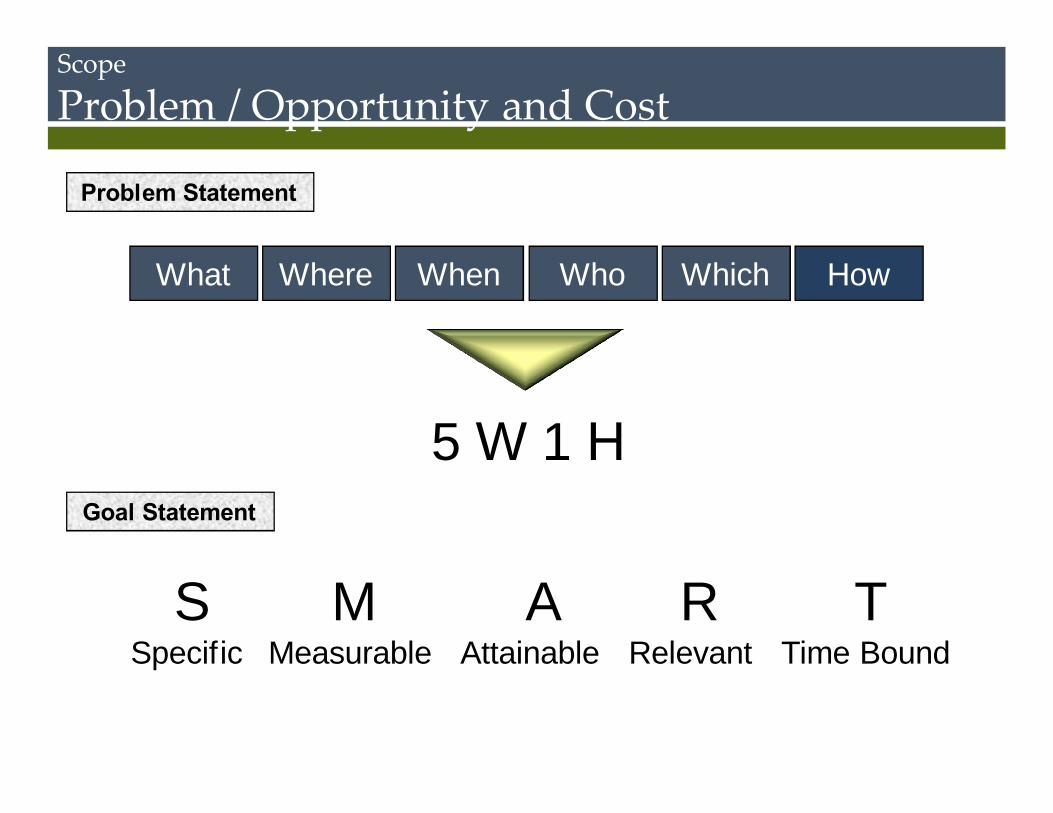
Goal Statement
Problem Statement
Scope
Problem / Opportunity and Cost
S M A R TSpecific Measurable Attainable Relevant Time Bound
What WhoWhenWhere Which How
5 W 1 H
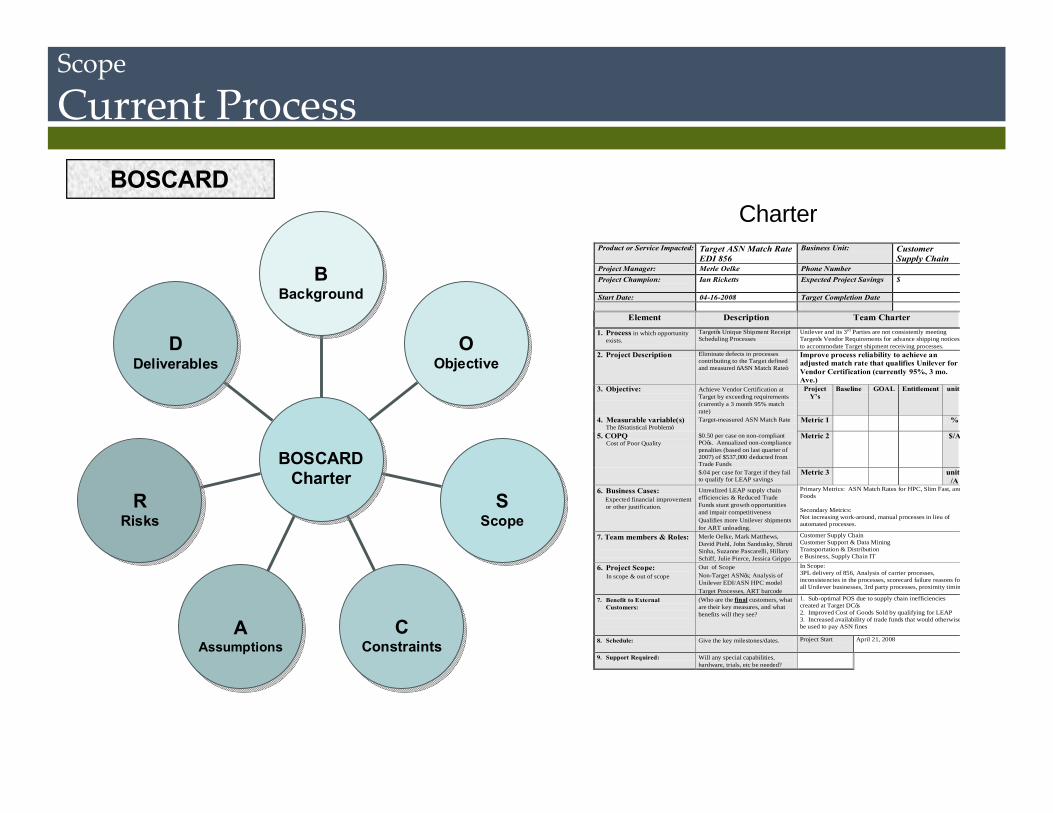
Product or Service Impacted: Target ASN Match Rate EDI 856
Business Unit: Customer Supply Chain
Project Manager: Merle Oelke Phone Number Project Champion:
Ian Ricketts Expected Project Savings $
Start Date: 04-16-2008 Target Completion Date
Element Description Team Charter
1. Process in which opportunity exists.
Target’s Unique Shipment Receipt Scheduling Processes
Unilever and its 3rd Parties are not consistently meeting Target’s Vendor Requirements for advance shipping notices to accommodate Target shipment receiving processes.
2. Project Description Eliminate defects in processes contributing to the Target defined and measured “ASN Match Rate”
Improve process reliability to achieve an adjusted match rate that qualifies Unilever for Vendor Certification (currently 95%, 3 mo. Ave.)
3. Objective:
Achieve Vendor Certification at Target by exceeding requirements (currently a 3 month 95% match rate)
Project Y’s
Baseline GOAL Entitlement units
4. Measurable variable(s) The “Statistical Problem”
Target-measured ASN Match Rate Metric 1 %
5. COPQ Cost of Poor Quality
$0.50 per case on non-compliant PO’s. Annualized non-compliance penalties (based on last quarter of 2007) of $537,000 deducted from Trade Funds
Metric 2 $/A
$.04 per case for Target if they fail to qualify for LEAP savings
Metric 3 units/A
6. Business Cases: Expected financial improvement
or other justification.
Unrealized LEAP supply chain efficiencies & Reduced Trade Funds stunt growth opportunities and impair competitiveness Qualifies more Unilever shipments for ART unloading.
Primary Metrics: ASN Match Rates for HPC, Slim Fast, and Foods Secondary Metrics: Not increasing work-around, manual processes in lieu of automated processes.
7. Team members & Roles:
Merle Oelke, Mark Matthews, David Piehl, John Sandusky, Shruti Sinha, Suzanne Pascarelli, Hillary Schiff, Julie Pierce, Jessica Grippo
Customer Supply Chain Customer Support & Data Mining Transportation & Distribution e Business, Supply Chain IT
6. Project Scope: In scope & out of scope
Out of Scope Non-Target ASN’s; Analysis of Unilever EDI/ASN HPC model Target Processes, ART barcode
In Scope: 3PL delivery of 856, Analysis of carrier processes, inconsistencies in the processes, scorecard failure reasons for all Unilever businesses, 3rd party processes, proximity timing
7. Benefit to External Customers:
(Who are the final customers, what are their key measures, and what benefits will they see?
1. Sub-optimal POS due to supply chain inefficiencies created at Target DC’s 2. Improved Cost of Goods Sold by qualifying for LEAP 3. Increased availability of trade funds that would otherwise be used to pay ASN fines
8. Schedule: Give the key milestones/dates.
Project Start April 21, 2008
9. Support Required: Will any special capabilities, hardware, trials, etc be needed?
Charter
Scope
Current ProcessBOSCARD
D
Deliverables
R
Risks
A
Assumptions
C
Constraints
S
Scope
O
Objective
B
Background
BOSCARD
Charter
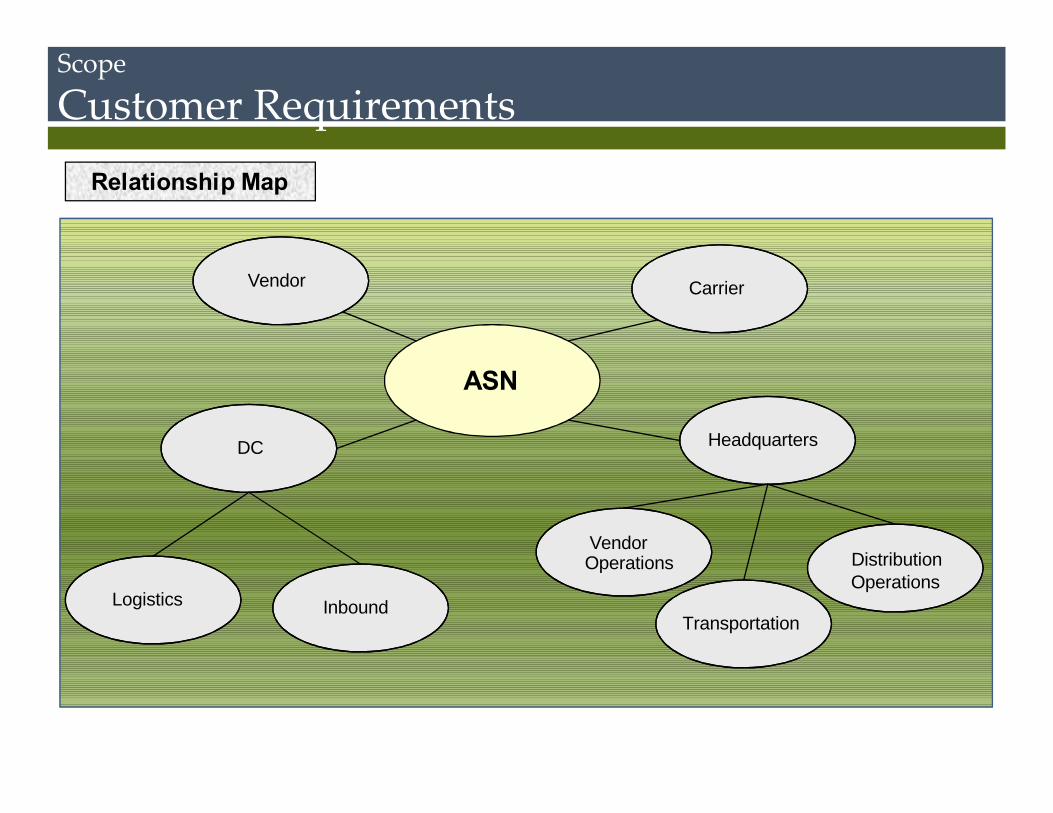
ASN
Vendor
HeadquartersDC
Carrier
Logistics Inbound
Vendor
Transportation
OperationsDistributionOperations
Scope
Customer RequirementsRelationship Map

Scope
DeliverablesVoice Of Customer
• Potential for sub-optimal POS due to supply chain inefficiencies created at Target DC’s when ASN’s fail.
• Improved Cost of Goods Sold by qualifying for Unilever efficiency incentives.
• Gain visibility / understanding of currentASN match
• Identify potential avenues to increase ASN match score
External
Internal
Key Phases
Define Scope
Data Collection
Determine Root Cause
Innovate Alternative Solutions
Drive Sustainability
Objectives of this phase:
1. Identify what to measureand why
2. Determine data plan
3. Gather baseline data
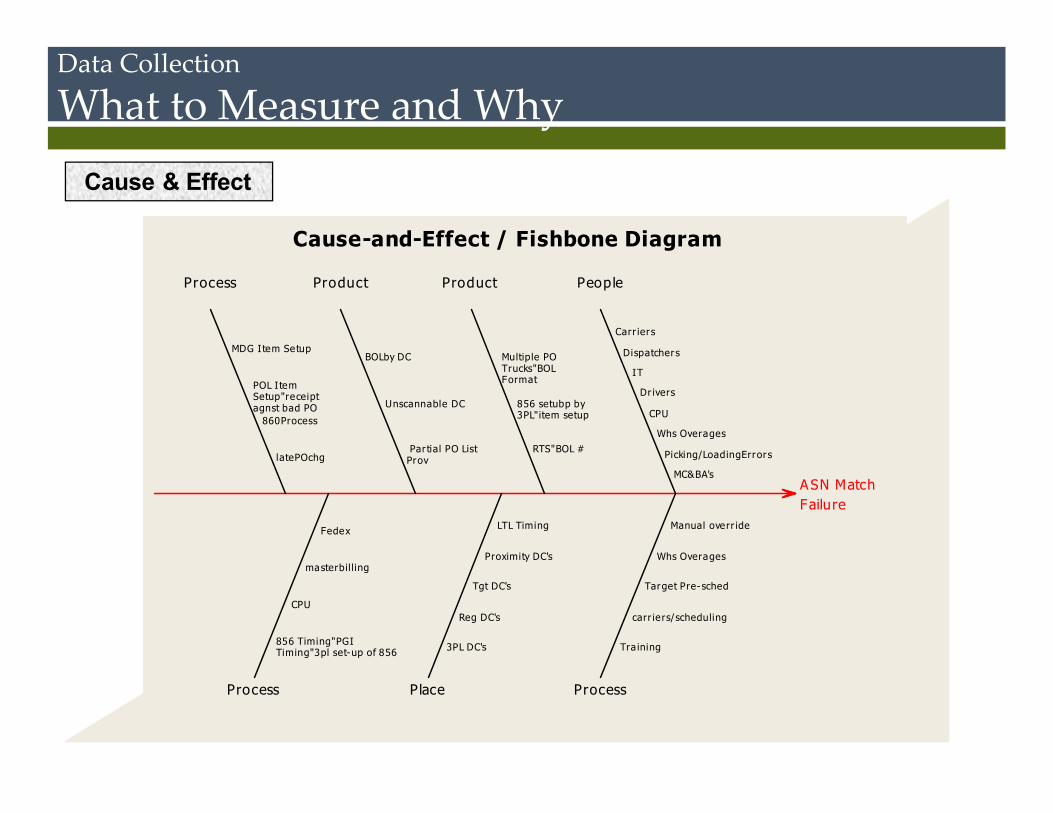
Data Collection
What to Measure and WhyCause & Effect
ASN MatchFailure
Process
Process
Product
Place
Product
Process
People
MC&BA's
Picking/LoadingErrors
Whs Overages
CPU
Dr ivers
IT
Dispatchers
Carr iers
Manual overr ide
Whs Overages
Target Pre-sched
carr ie rs/scheduling
Tra ining
RTS"BOL #
856 setubp by3PL"item setup
Multiple POTrucks"BOLFormat
LTL Timing
Proximity DC's
Tgt DC's
Reg DC's
3PL DC's
Par tial PO ListProv
Unscannable DC
BOLby DC
Fedex
masterbil ling
CPU
856 Timing"PGITiming"3pl set-up of 856
latePOchg
860Process
POL I temSetup"receiptagnst bad PO
MDG Item Setup
Cause-and-Effect / Fishbone Diagram
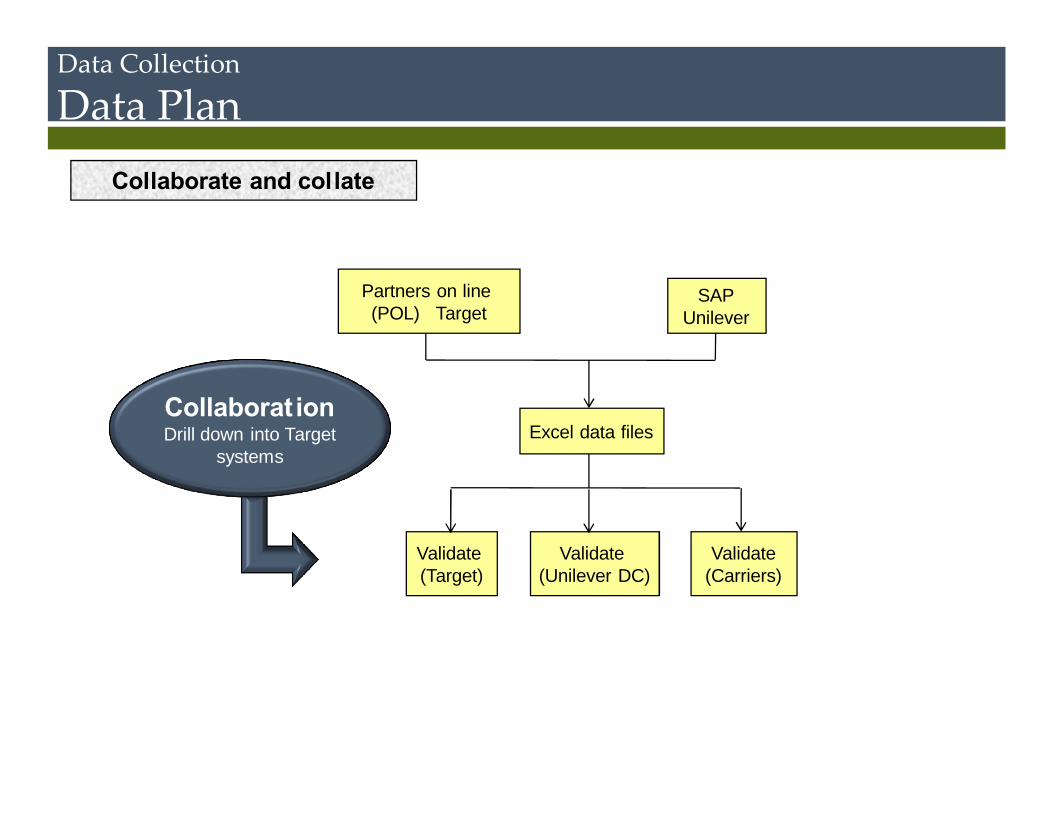
Partners on line (POL) Target
SAPUnilever
Excel data files
Validate (Target)
Validate (Unilever DC)
Validate(Carriers)
Data Collection
Data PlanCollaborate and collate
Collaborat ionDrill down into Target
systems
Data Collection
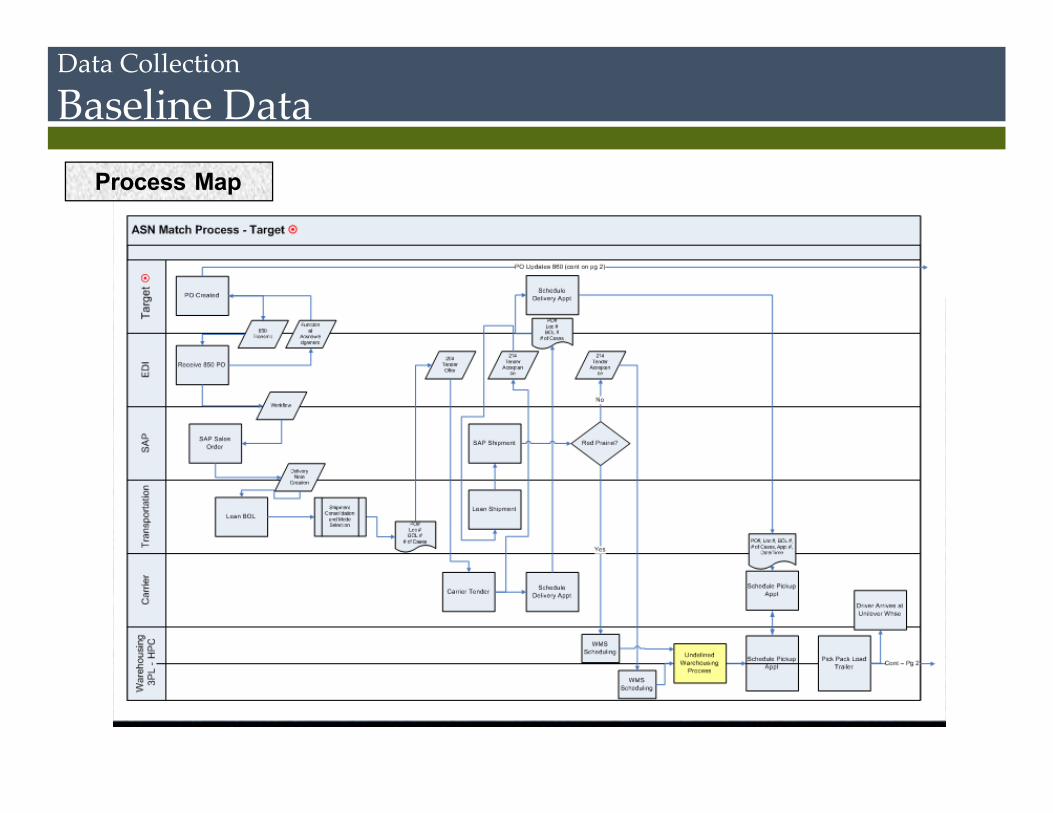
Baseline DataProcess Map
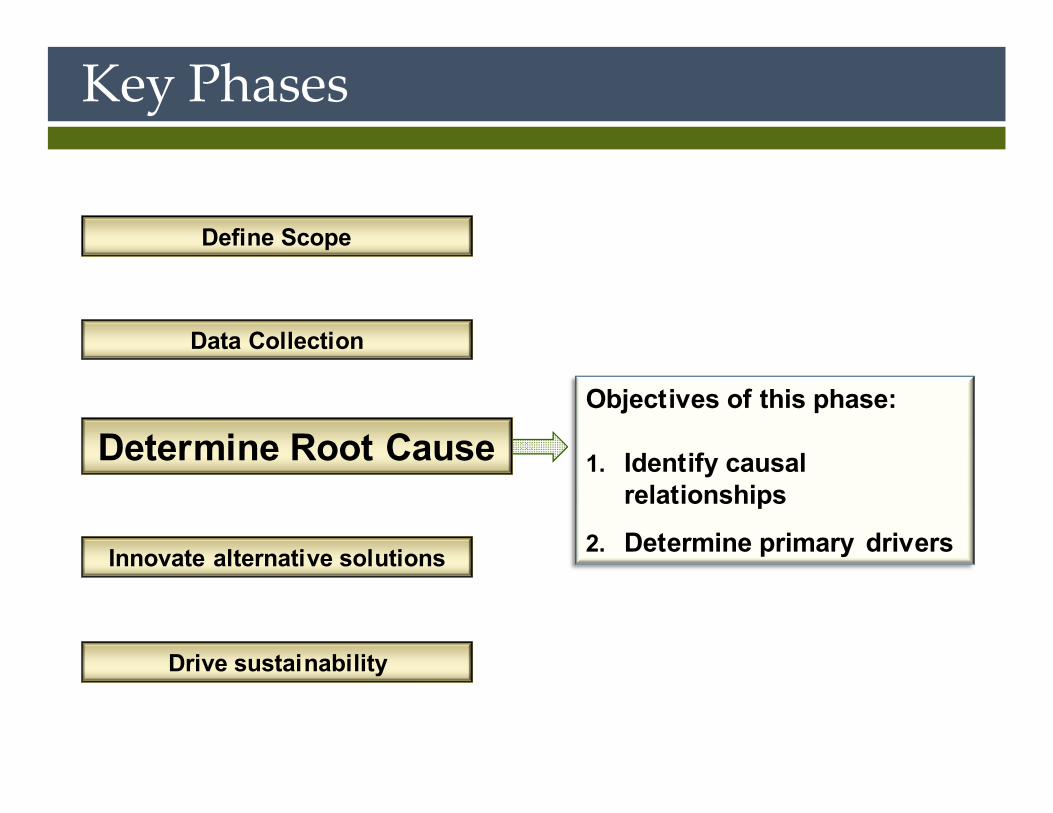
Key Phases
Define Scope
Data Collection
Determine Root Cause
Innovate alternative solutions
Drive sustainability
Objectives of this phase:
1. Identify causal relationships
2. Determine primary drivers
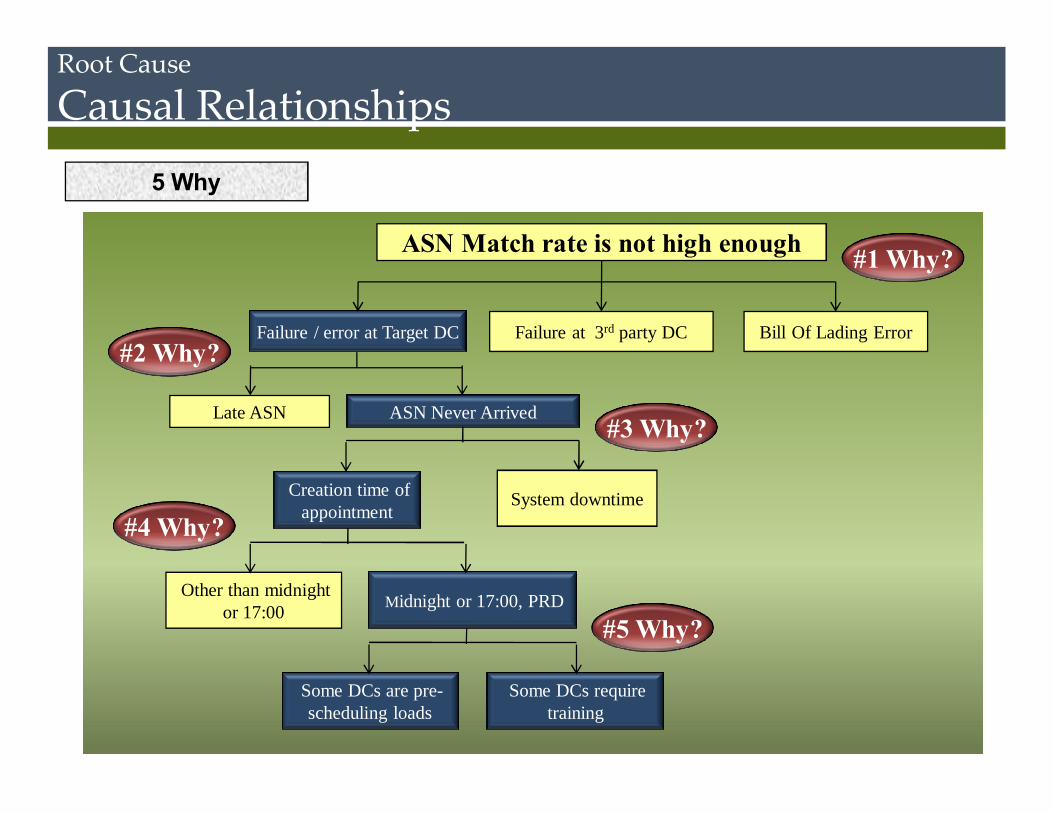
ASN Match rate is not high enough
Failure at 3rd party DC
ASN Never Arrived
Creation time of appointment
Other than midnight or 17:00
#4 Why?
Failure / error at Target DC Bill Of Lading Error
Late ASN
System downtime
Midnight or 17:00, PRD
Some DCs are pre-scheduling loads
Some DCs require training
Root Cause
Causal Relationships5 Why
#3 Why?
#2 Why?
#5 Why?
#1 Why?
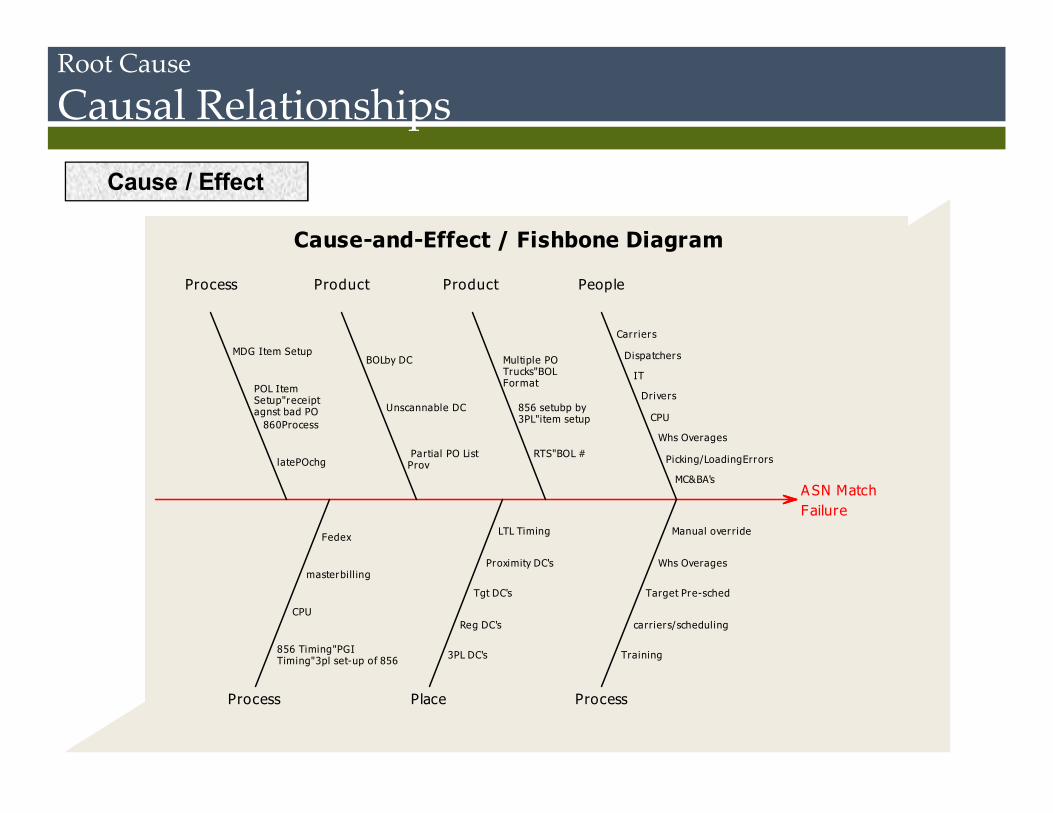
Root Cause
Causal RelationshipsCause / Effect
ASN MatchFailure
Process
Process
Product
Place
Product
Process
People
MC&BA's
Picking/LoadingErrors
Whs Overages
CPU
Drivers
IT
Dispatchers
Carriers
Manual override
Whs Overages
Target Pre-sched
carriers/scheduling
Training
RTS"BOL #
856 setubp by3PL"item setup
Multiple POTrucks"BOLFormat
LTL Timing
Proximity DC's
Tgt DC's
Reg DC's
3PL DC's
Partial PO ListProv
Unscannable DC
BOLby DC
Fedex
masterbi ll ing
CPU
856 Timing"PGITiming"3pl set-up of 856
latePOchg
860Process
POL ItemSetup"receiptagnst bad PO
MDG Item Setup
Cause-and-Effect / Fishbone Diagram
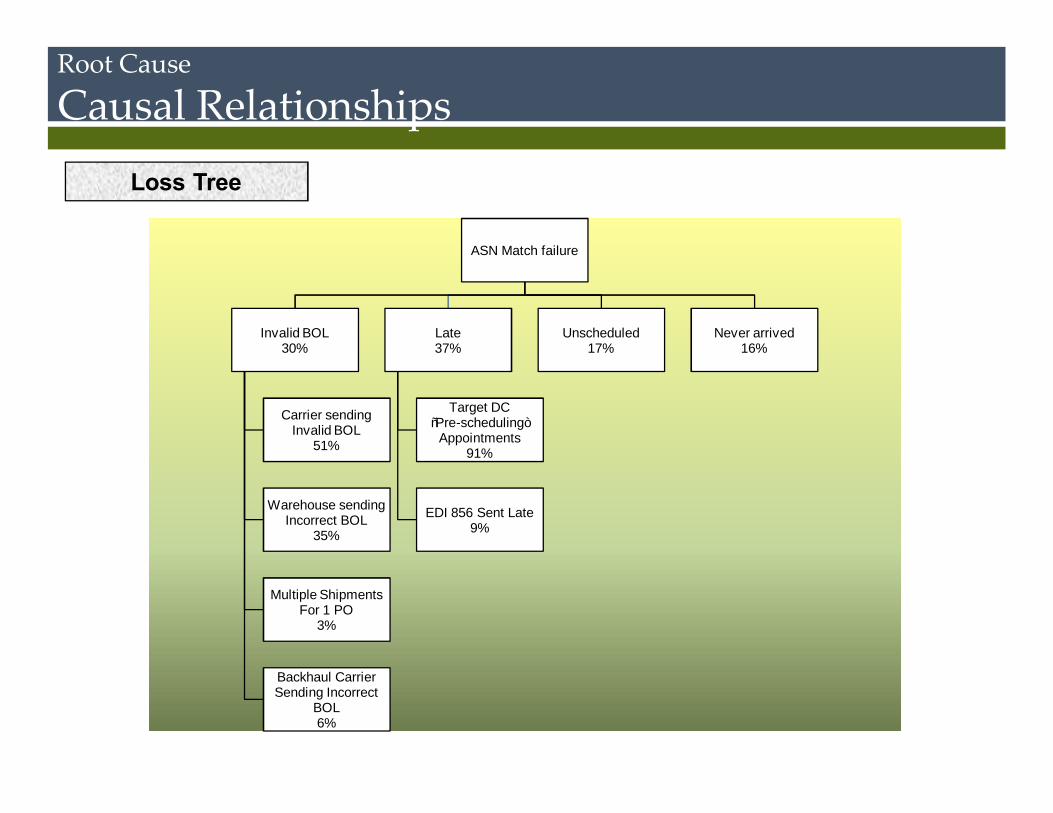
Loss Tree
ASN Match failure
Invalid BOL30%
Carrier sending Invalid BOL
51%
Warehouse sending Incorrect BOL
35%
Multiple ShipmentsFor 1 PO
3%
Backhaul Carrier Sending Incorrect
BOL6%
Late37%
Target DC “Pre-scheduling”
Appointments91%
EDI 856 Sent Late9%
Unscheduled17%
Never arrived16%
Root Cause
Causal Relationships
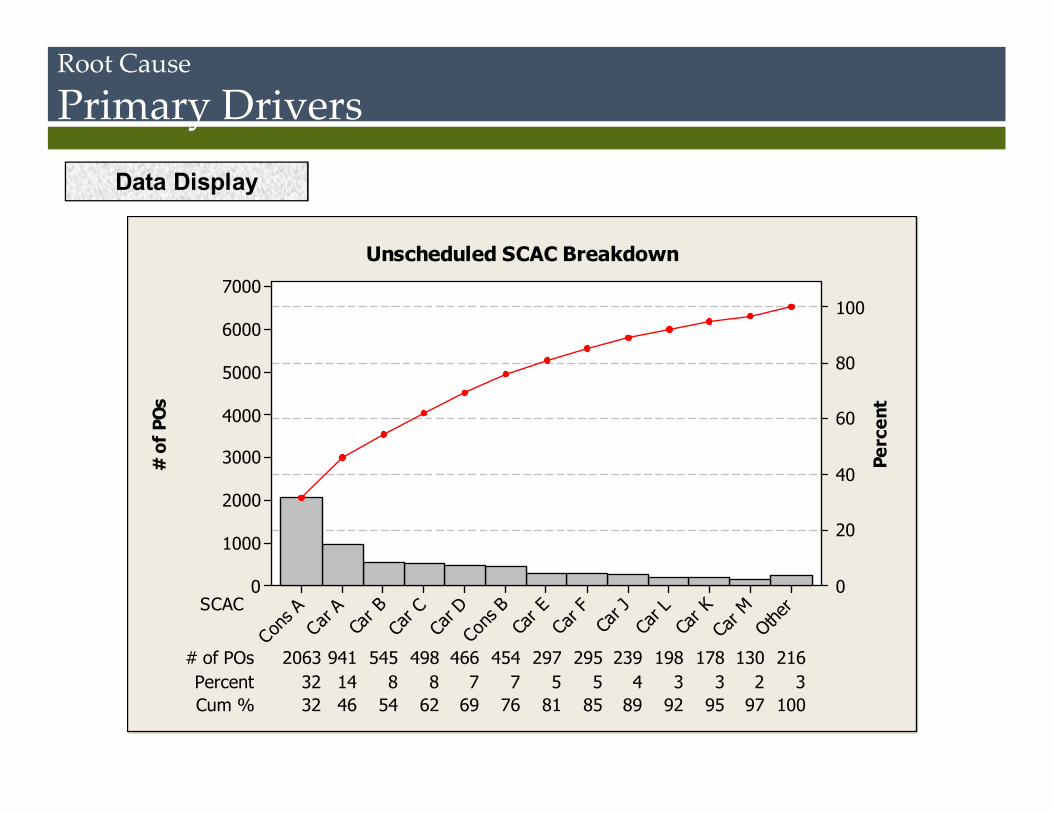
# of POs 239 198 178 130 2162063 941 545 498 466 454 297 295Percent 4 3 3 2 332 14 8 8 7 7 5 5Cum % 89 92 95 97 10032 46 54 62 69 76 81 85
SCACOthe
rCar
MCa
r KCa
r LCa
r JCar
FCa
r E
Cons
BCa
r DCa
r CCa
r BCar
A
Cons A
7000
6000
5000
4000
3000
2000
1000
0
100
80
60
40
20
0
# o
f PO
s
Perc
ent
Unscheduled SCAC Breakdown
Root Cause
Primary DriversData Display
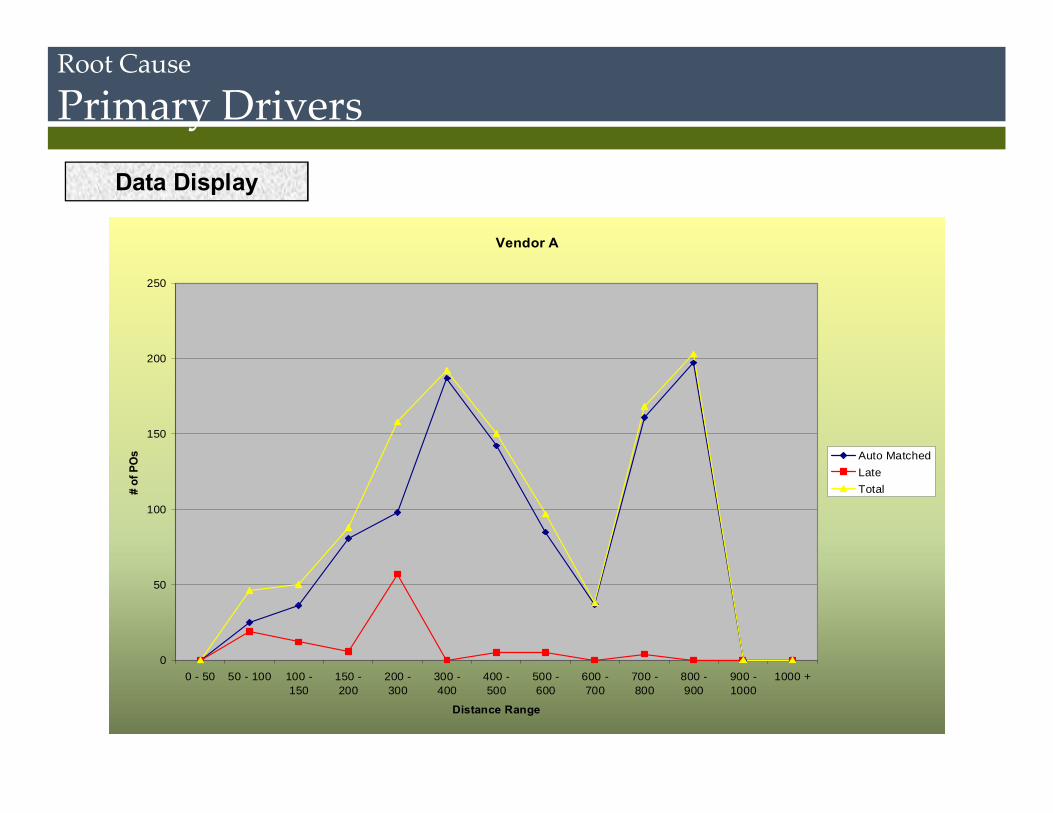
Vendor A
0
50
100
150
200
250
0 - 50 50 - 100 100 -150
150 -200
200 -300
300 -400
400 -500
500 -600
600 -700
700 -800
800 -900
900 -1000
1000 +
Distance Range
# of
PO
s Auto MatchedLateTotal
Root Cause
Primary DriversData Display
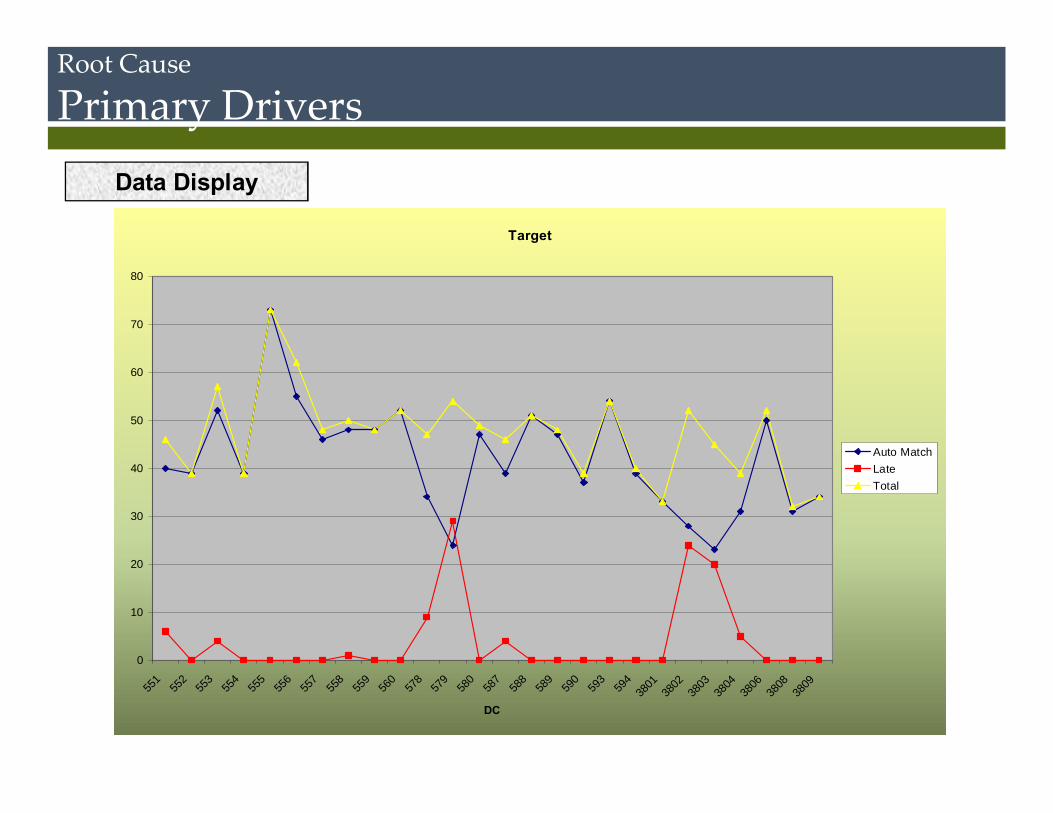
Target
0
10
20
30
40
50
60
70
80
551
552
553
554
555
556
557
558
559
560
578
579
580
587
588
589
590
593
594
3801
3802
3803
3804
3806
3808
3809
DC
Auto MatchLateTotal
Root Cause
Primary DriversData Display
Root Cause
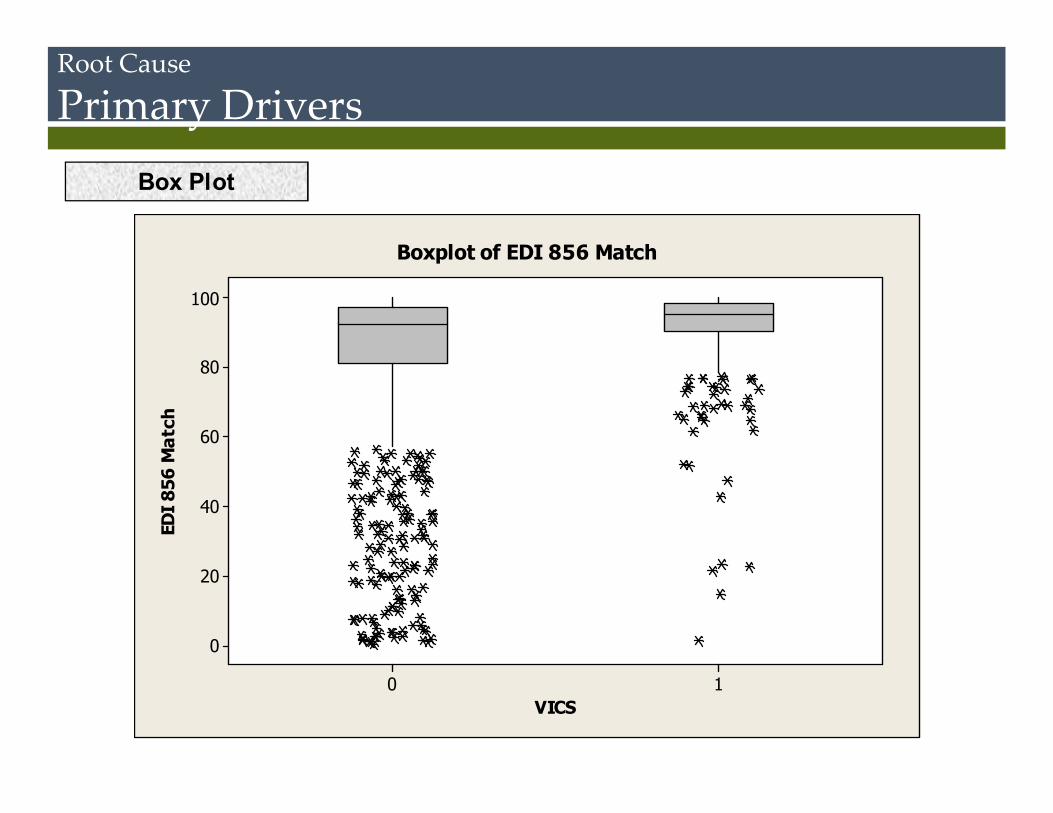
Primary DriversBox Plot
10
100
80
60
40
20
0
VICS
EDI
856
Mat
ch
Boxplot of EDI 856 Match
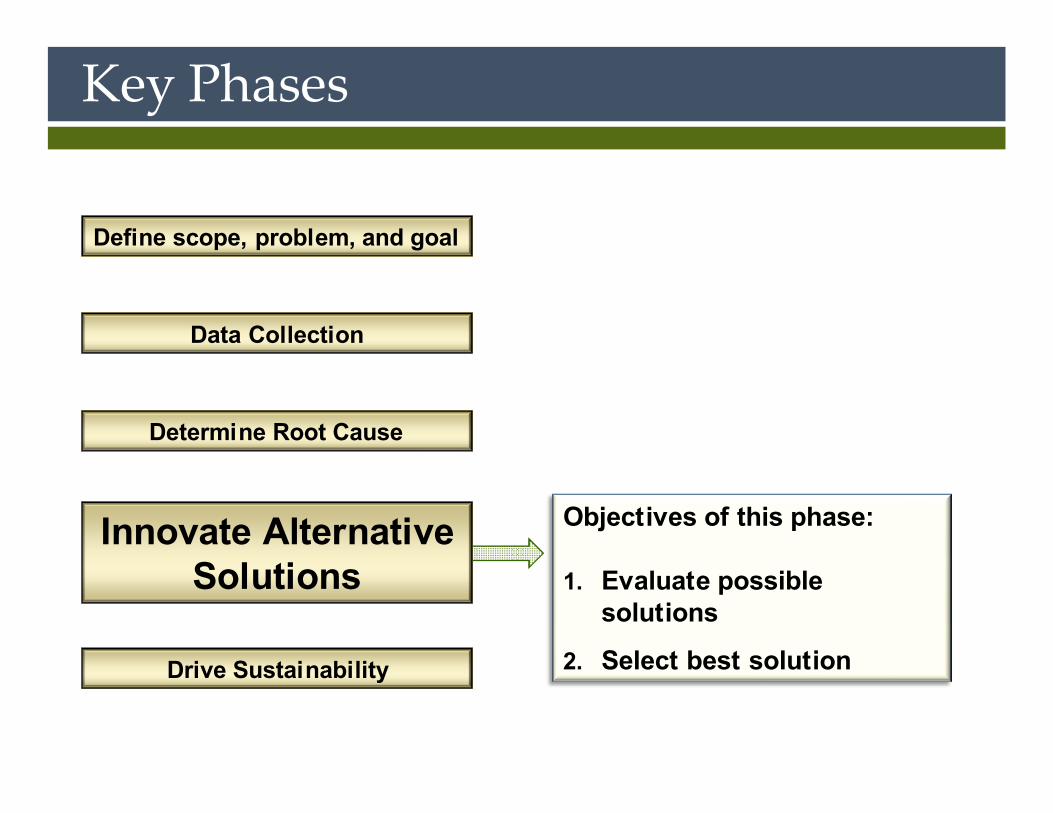
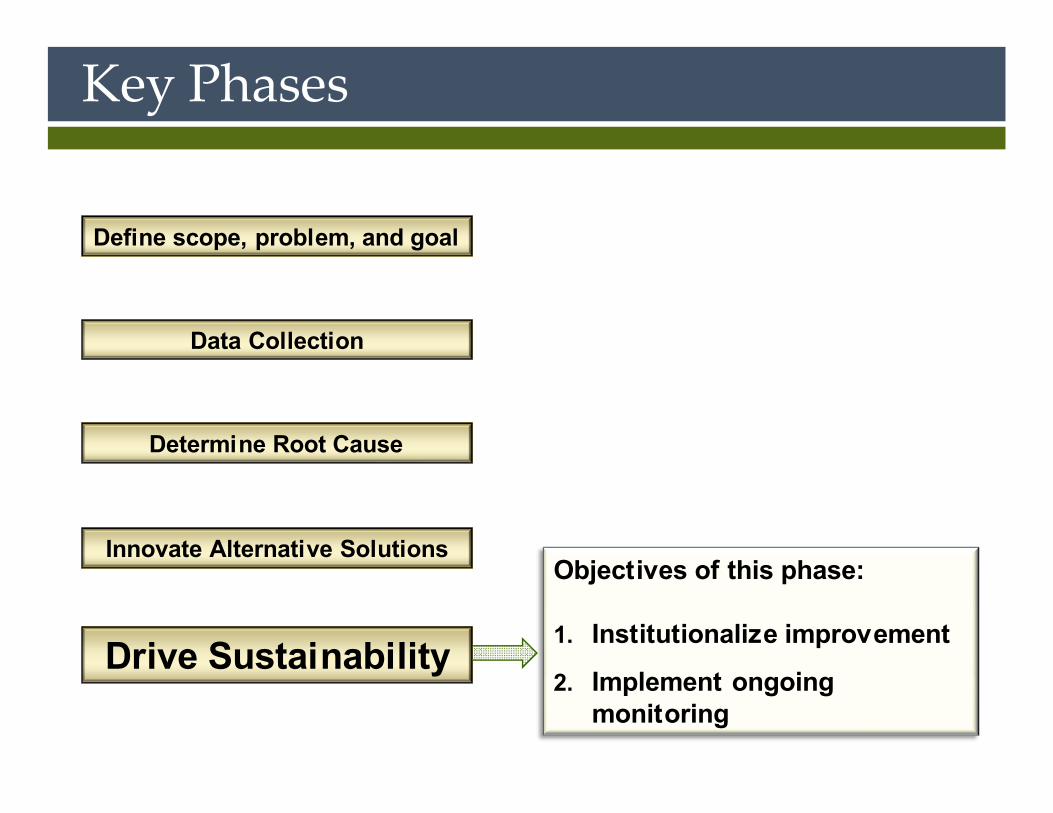
Key Phases
Define scope, problem, and goal
Data Collection
Determine Root Cause
Drive Sustainability
Objectives of this phase:
1. Evaluate possible solutions
2. Select best solution
Innovate Alternative Solutions
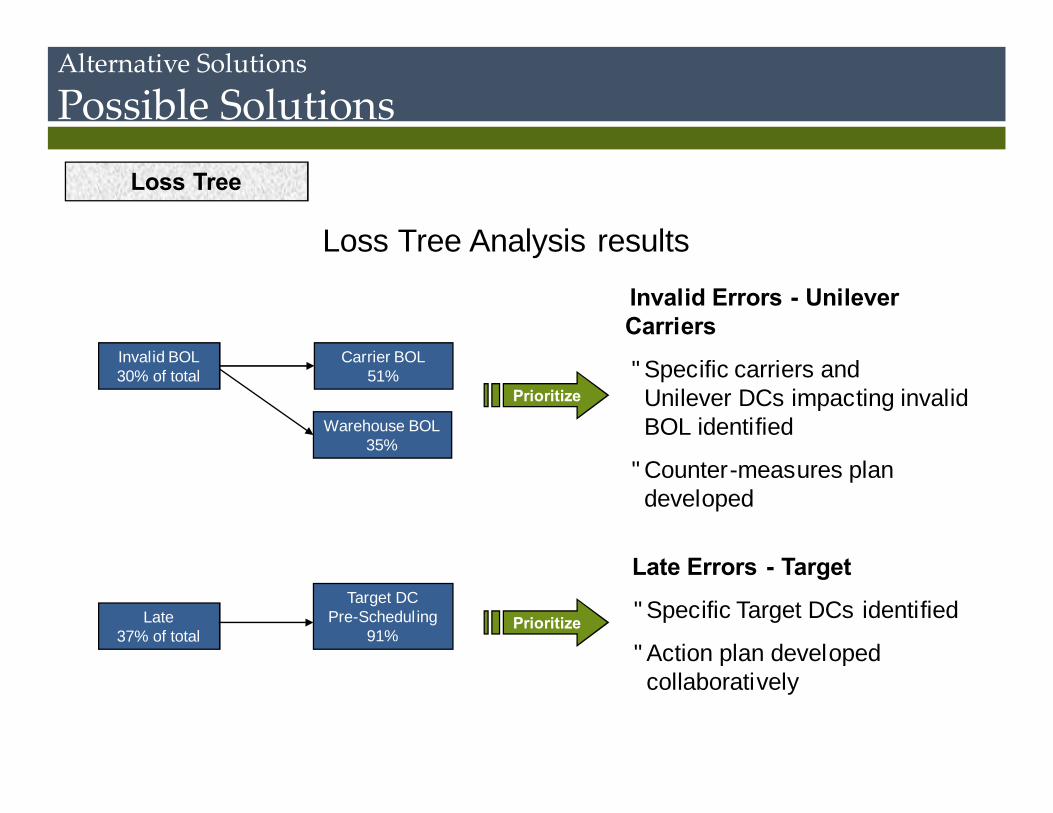
Invalid Errors - Unilever Carriers
• Specific carriers andUnilever DCs impacting invalidBOL identified
• Counter-measures plan developed
Late Errors - Target
• Specific Target DCs identified
• Action plan developed collaboratively
Invalid BOL30% of total
Late37% of total
Carrier BOL51%
Warehouse BOL35%
Target DC Pre-Schedul ing
91%Prioritize
Loss Tree Analysis results
Alternative Solutions
Possible SolutionsLoss Tree
Prioritize
Alternative Solutions
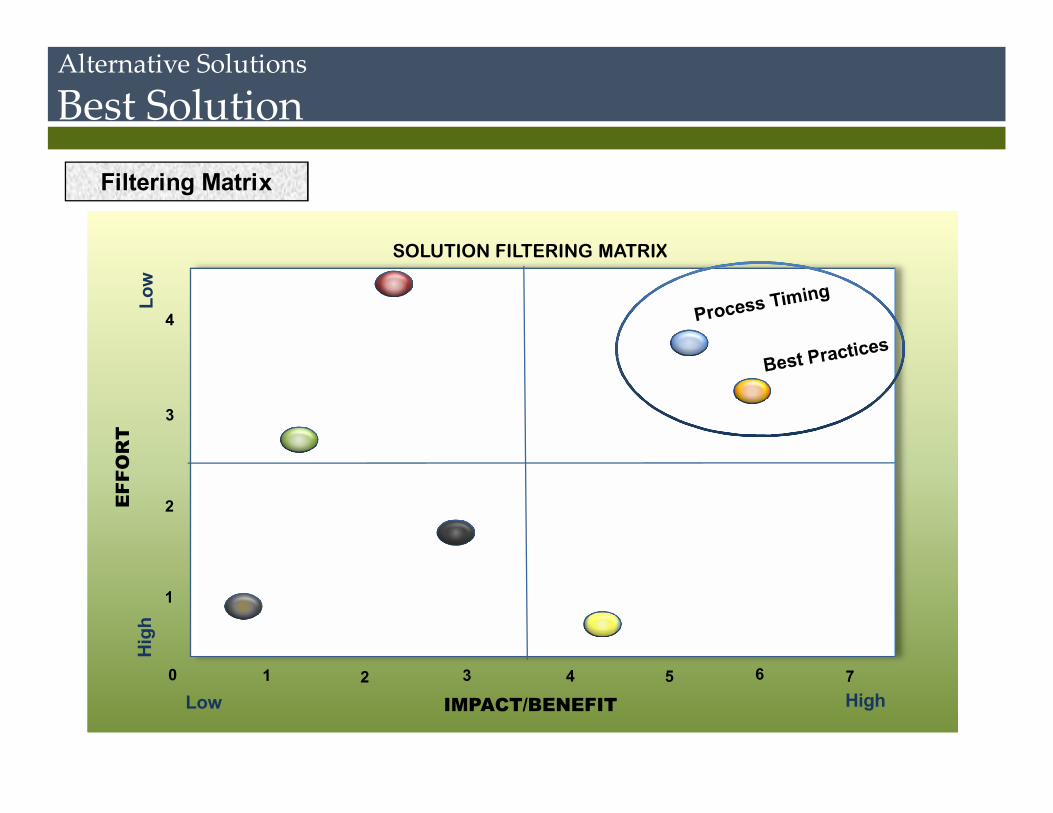
Best SolutionFiltering Matrix
IMPACT/BENEFIT
EFF
OR
TH
igh
High
Low
Low10 2 43 5 6
1
2
3
4
7
SOLUTION FILTERING MATRIX
Key Phases
Define scope, problem, and goal
Data Collection
Determine Root Cause
Innovate Alternative SolutionsObjectives of this phase:
1. Institutionalize improvement
2. Implement ongoing monitoring
Drive Sustainability
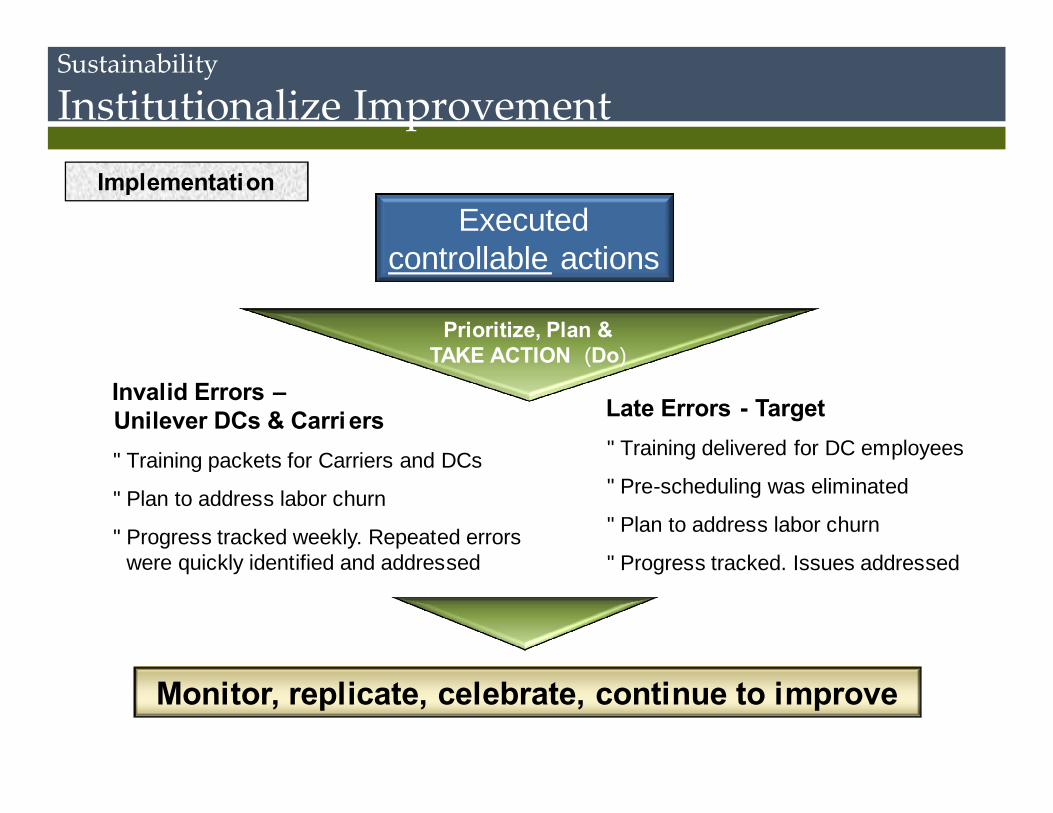
Sustainability
Institutionalize ImprovementImplementation
Executed controllable actions
Invalid Errors –Unilever DCs & Carri ers
• Training packets for Carriers and DCs
• Plan to address labor churn
• Progress tracked weekly. Repeated errors were quickly identified and addressed
Late Errors - Target• Training delivered for DC employees
• Pre-scheduling was eliminated
• Plan to address labor churn
• Progress tracked. Issues addressed
Monitor, replicate, celebrate, continue to improve
Prioritize, Plan…TAKE ACTION (Do)
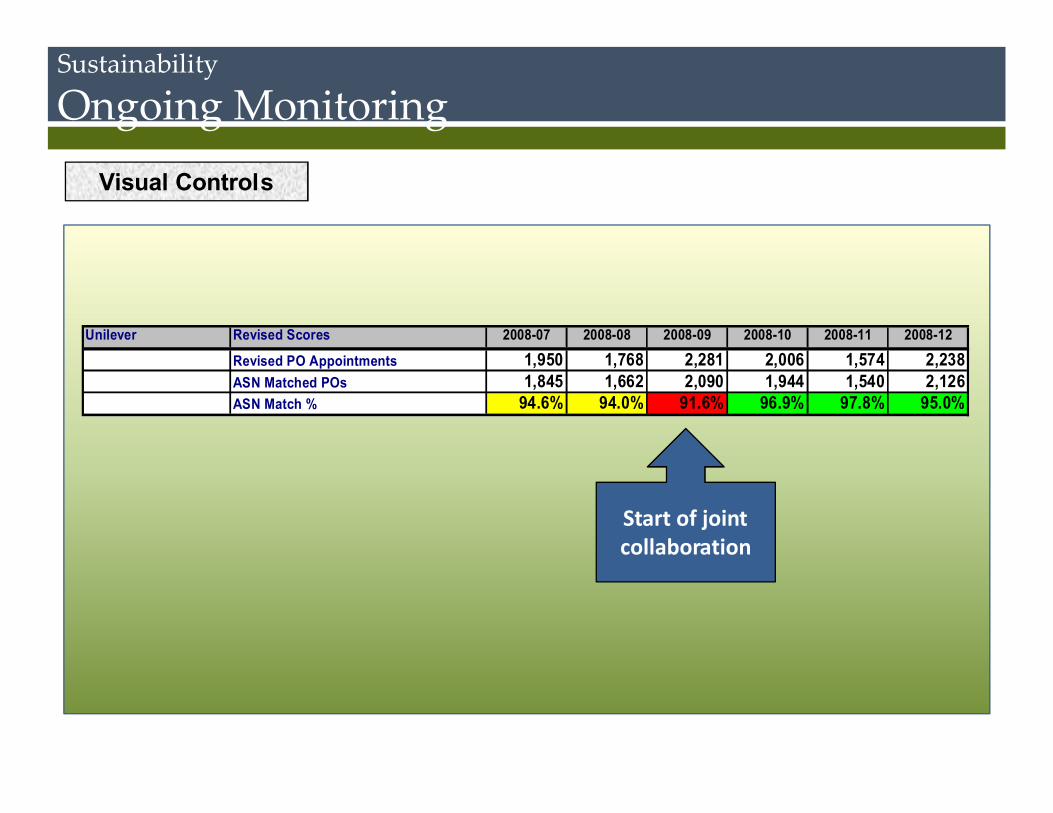
Sustainability
Ongoing MonitoringVisual Controls
Start of joint collaboration
Unilever Revised Scores 2008-07 2008-08 2008-09 2008-10 2008-11 2008-12
Revised PO Appointments 1,950 1,768 2,281 2,006 1,574 2,238ASN Matched POs 1,845 1,662 2,090 1,944 1,540 2,126ASN Match % 94.6% 94.0% 91.6% 96.9% 97.8% 95.0%
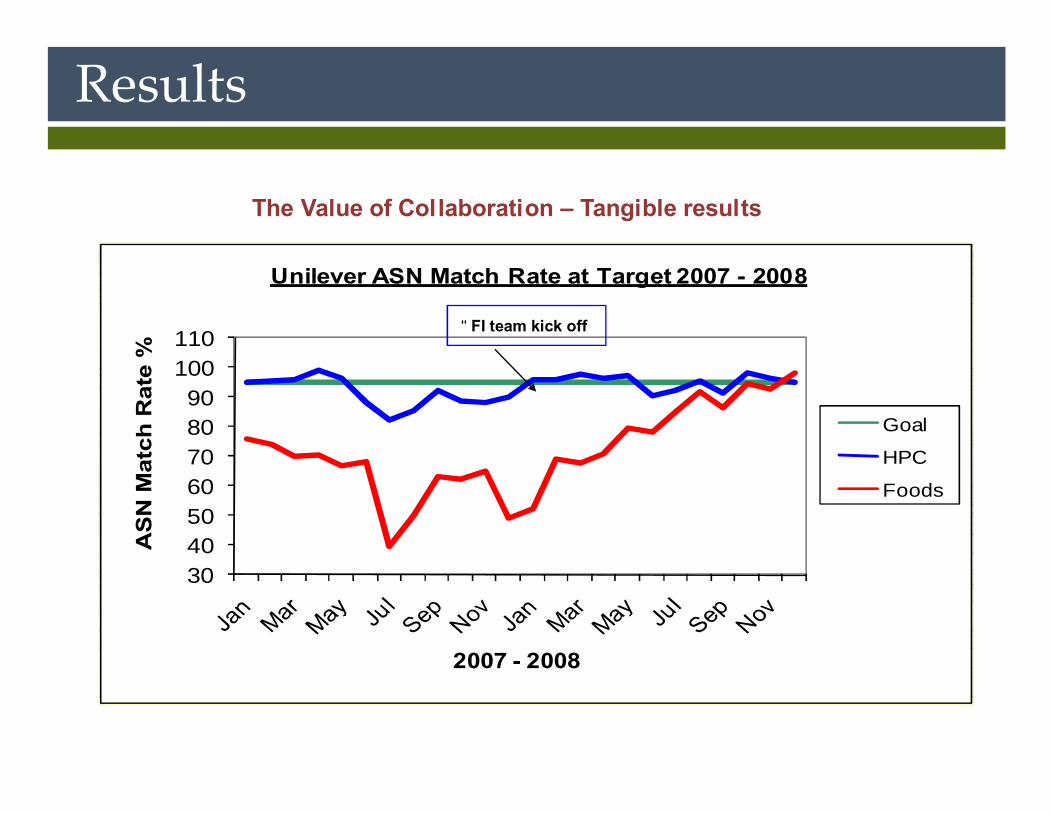
30405060708090
100110
AS
N M
atch
Rat
e %
2007 - 2008
Unilever ASN Match Rate at Target 2007 - 2008
Goal
HPC
Foods
The Value of Collaboration – Tangible results
• FI team kick off
Results
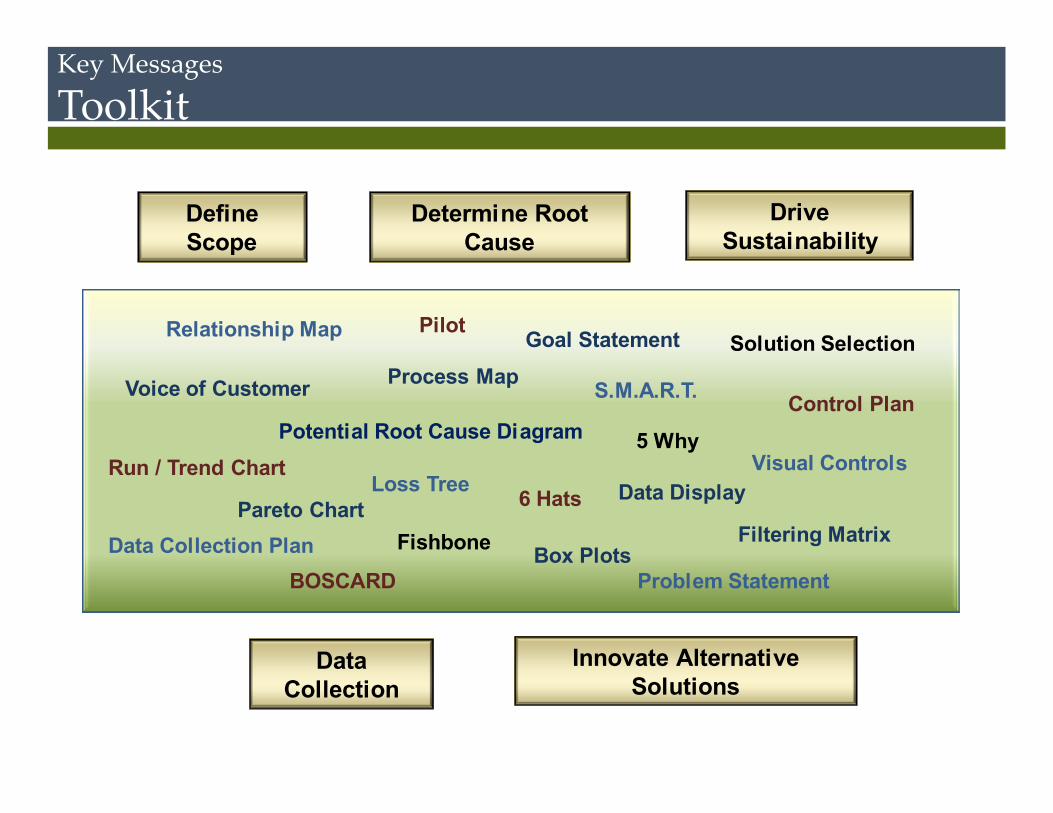
Define Scope
Data Collection
Determine Root Cause
Innovate Alternative Solutions
Drive Sustainability
Voice of Customer
Pareto Chart
Process Map
6 Hats
Solution Selection
Filtering MatrixData Collection Plan
Potential Root Cause DiagramControl Plan
Fishbone
PilotRelationship Map
Data DisplayVisual Controls
Box Plots
5 Why
Loss TreeRun / Trend Chart
BOSCARD
Goal Statement
Problem Statement
S.M.A.R.T.
Key Messages
Toolkit
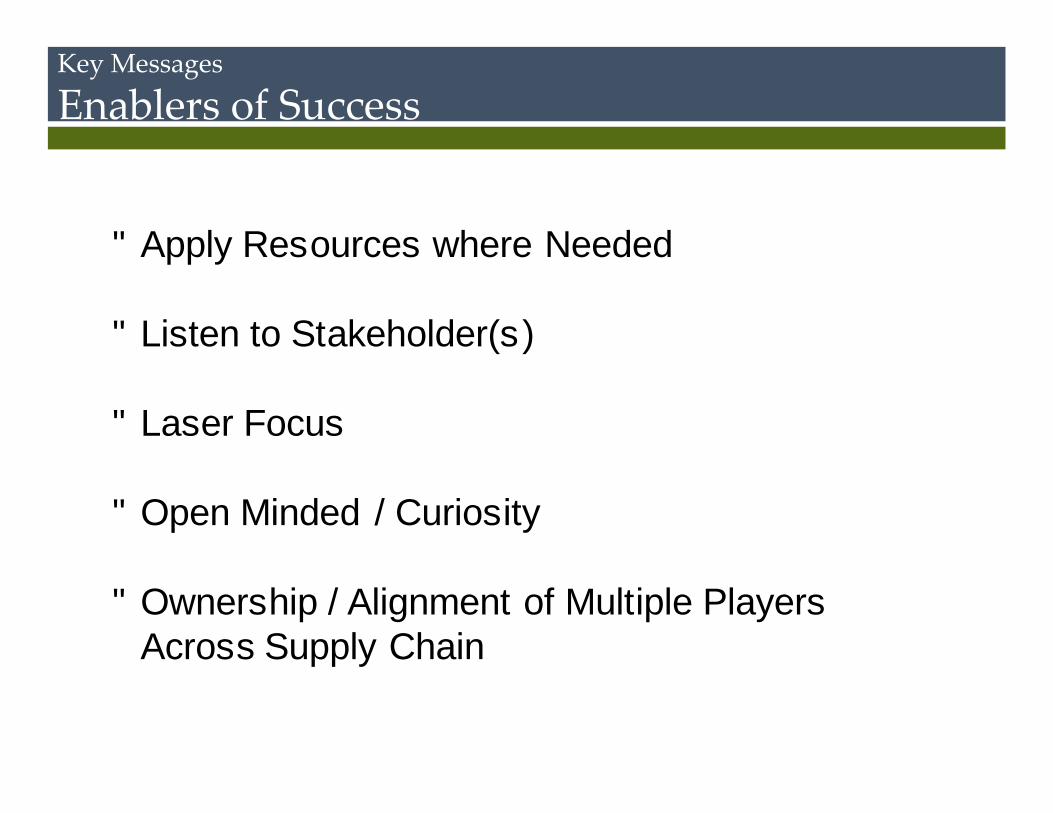
• Apply Resources where Needed
• Listen to Stakeholder(s)
• Laser Focus
• Open Minded / Curiosity
• Ownership / Alignment of Multiple PlayersAcross Supply Chain
Key Messages
Enablers of Success
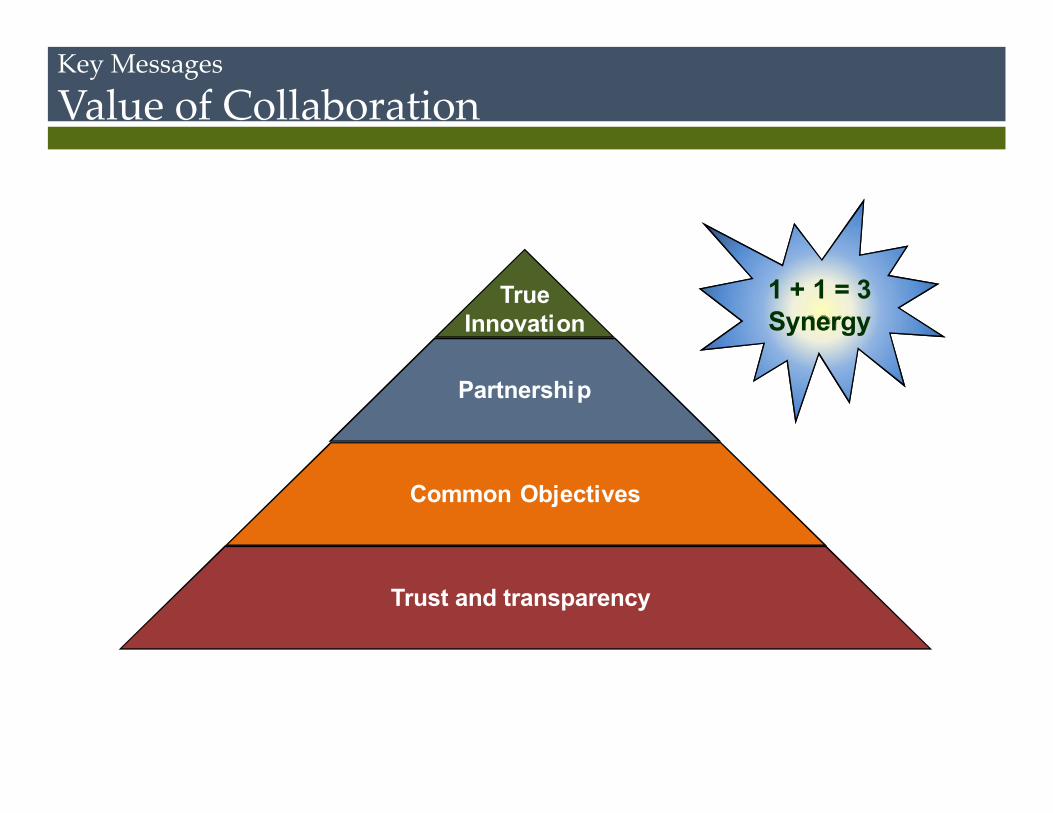
Partnership
Common Objectives
Trust and transparency
TrueInnovation
1 + 1 = 3Synergy1 + 1 = 3Synergy
Key Messages
Value of Collaboration

Questions