Embed Size (px)
Citation preview
Nicolas Randazzo
1056910
Email: [email protected]
Phone: 905-578-5035
Thesis
Carbon and Oxygen Isotope Effects in Synthesized Carbonates at 25 oC
By Nicolas Randazzo
A Thesis
Submitted to the School of Geography and Earth Sciences
In Partial Fulfilment of the Requirements
for the Degree
Master of Science
McMaster University
© Copyright by Nicolas Randazzo, November 2016

M.Sc. Nicolas Randazzo; McMaster University- School of Geography and Earth Sciences
I
Descriptive Note
MASTER OF SCIENCE (2016) McMaster University
School of Geography and Earth Sciences Hamilton, Ontario
TITLE: Carbon and Oxygen Isotope Effects in Synthesized Calcite at 25 oC
AUTHOR: Nicolas Randazzo
SUPERVISOR: Professor Sang-Tae Kim
NUMBER OF PAGES: VII, 84
M.Sc. Nicolas Randazzo; McMaster University- School of Geography and Earth Sciences
II
Acknowledgments
First I would like to thank God, for nothing is possible without Him. I cannot stress
enough the role that faith has had as a source of comfort and guidance during my academic
career.
Special thanks go to Dr. Sang-Tae Kim for granting me the opportunity to complete this
thesis research and for the numerous conversations we had discussing the data and how to best
present it to the public. I also appreciate the effort and time he put towards helping advance my
career as a scientist and for inviting me to co-author additional research with him. While my six
year McMaster journey has come to a close, I cannot look forward without the knowledge that he
helped me to achieve whatever lies ahead. You started out as my supervisor and are now a
friend. Thanks also go to my committee members, Dr. Gregory Slater and Dr. Henry Schwarcz
for their input into this manuscript
I am also grateful to Mohammed El-Shenawy for breathing new life into my project and
for greatly assisting in my understanding of the stable isotope systematics of my system. These
projects would not exist if it weren’t for him. Though life has taken us in separate directions for
the time being, I will never forget the conversations and time we spent together in the lab. God
bless. I would also like to thank Martin Knyf for his valuable assistance and guidance
throughout this project. He is a valuable asset to the lab and to the School of Geography and
Earth Sciences. His patience, humour, selflessness, and hard-work did not go unnoticed and his
love of science is truly an inspiration. I wish him all the best in his well-deserved retirement! I
am also thankful to the Government of Ontario and McMaster University for funding me during
the past two years and those who donated to the McMaster Research Group for Stable
Isotopologues (MRSI), namely the American Chemical Society, the Petroleum Research Fund
(ACS-PRF), Natural Science and Engineering Research Council (NSERC) Discovery Grant,
Ontario Ministry of Research and Innovation, the Ontario Research Fund (MRI-ORF), and
Canada Foundation for Innovation- Leaders Opportunity Fund (CFI-LOF) .
I also extend my gratitude to all of my family, especially my mother, father, and Dio, for
their encouragement, support, motivation, patience, and willingness to do whatever they could to
provide for me and help me succeed. I could not have done any of this without them all. I am
who I am only because of them. Thanks also go out to my fellow MRSI lab mates Jillian
Wyman, Chris Spencer, and Kesia Ie who have all completed their graduate career. The time we
spent together both in the lab and out will always be remembered with fondness. I would also
like to express my gratitude to all of my friends in the School of Geography and Earth Sciences.
I am honoured to have had a role in your educational career and look forward to seeing how all
of you will make the world a better place. Thank you also goes out to Dr. Maureen Padden,
Salome Santos-Blaguski, Deane Maynard, Victoria Jarvis, Cassandra Lo, Alex Poulin and all
other members of the SGES department who assisted me during the past two years. You are all
remarkable people!
Finally, I thank everyone who played a role in my time at McMaster, both as a graduate
and undergraduate student. My time here has truly expanded my mind and made an already
curious boy more interested in the world around him. I also thank the numerous scientists and
thinkers who have come before me, but still continue to inspire my academic life.

M.Sc. Nicolas Randazzo; McMaster University- School of Geography and Earth Sciences
III
Abstract
Carbonate minerals have been abundant throughout Earth’s geological history and the
carbon and oxygen isotope ratios of carbonates can be used for paleoclimate reconstruction
based upon the recognized stable isotopic relationship with the environmental factors. However,
their accuracy is obscured by “non-equilibrium isotope effects” caused by physicochemical
factors, such as solution chemistry, pH and precipitation rate. This study aimed to better
understand these factors to improve the robustness of isotope-based paleotemperature proxy and
assist in providing a reference frame for future research. Carbonates were synthesized using
passive CO2(g) degassing at two different pH levels (~8.2 and ~11.07) through the dissolution of
5, 15 and 25 mmolal sodium bicarbonate (NaHCO3) or sodium carbonate (NA2CO3) and calcium
chloride dihydrate (CaCl2•2H2O) at 25 ± 0.1 oC. The 1000ln18α(CaCO3-H2O) and 1000ln13α(CaCO3-DIC)
values were then compared with established isotopic equilibrium values for oxygen and carbon.
Samples were also synthesized in the presence of various concentrations of carbonic anhydrase
(CA) and it was found that this enzyme may not influence kinetic isotope effects at higher
precipitation rates. A positive, concentration based trend was found for the mid-pH solutions
between 1000ln13α(CaCO3-DIC) and 1000ln18α(CaCO3-H2O) values which began at the oxygen isotopic
equilibrium value proposed by Kim and O’Neil (1997). This trend deviated upwards towards
that of Coplen (2007) due to the kinetic influence of precipitation rate and degassing caused by
the production of CO2(aq) as a by-product of the aforementioned reaction. The high pH solutions
followed an opposite trend, with 1000ln13α(CaCO3-DIC) continuing the enrichment trend but
1000ln18α(CaCO3-H2O) values declining and may have been caused by CO2(aq) not being produced in
the high pH reactions. The DIC equilibration time at this pH took 7 days as shown by Kim et al.
(2006) and not 45 days as discussed in Beck et al. (2005).

M.Sc. Nicolas Randazzo; McMaster University- School of Geography and Earth Sciences
IV
Table of Contents
Acknowledgments........................................................................................................................... ii
Abstract .......................................................................................................................................... iii
List of Tables ................................................................................................................................. vi
List of Figures ............................................................................................................................... vii
Introduction and Background Information ..................................................................................... 1
1.1 Environmental Reconstruction of Paleoclimates using Stable Isotopes .......................... 2
1.1.1 The Influence of Kinetic Effects ................................................................................ 4
1.2 Defining Isotopic Equilibrium .............................................................................................. 7
1.2.1 Isotopic Equilibrium Value between Calcite and Water ................................................ 7
1.2.2 Controversy Regarding True Isotopic Equilibrium between Calcite and Water ........... 7
1.2.3- The Impact of Carbonic Anhydrase (CA) on Kinetic Isotope Effects ......................... 15
1.5 Thesis structure ................................................................................................................... 16
Appendix ................................................................................................................................... 18
References ................................................................................................................................. 19
Carbon and Oxygen Isotope Effects in Synthesized Calcite at 25 oC ........................................... 22
2.1 Introduction ......................................................................................................................... 23
2.2 Methods............................................................................................................................... 24
2.2.1 Preparation of Solution ............................................................................................... 24
2.2.2 Storage of Solution in Constant Temperature ............................................................. 28
2.2.3 Filtration of Solution and Collection of Samples ........................................................ 28
2.2.4 Stable Isotope Analysis ................................................................................................ 29
2.3 Results ................................................................................................................................. 30
2.3.1 XRD Analysis and Decline in pH ................................................................................. 30
2.3.2 Uncatalyzed, Mid-pH Experiments .............................................................................. 31
2.3.3 Catalyzed Experiments................................................................................................. 32
2.4 Discussion ........................................................................................................................... 33
2.4.1 Why pH Declined ......................................................................................................... 33
2.4.3 Duration in the Uncatalyzed, Mid-pH Experiments .................................................... 34
2.4.4 The Effect of Concentration and Precipitation Rate.................................................... 35
2.4.5 Comparing the Data to Previous Research ................................................................. 36
2.4.6 Isotopic Enrichment Due to Saturation Induced CaCO3 Precipitation ....................... 37
2.4.7 Rayleigh Distillation and Carbon Isotopic Enrichment in these Experiments ............ 40

M.Sc. Nicolas Randazzo; McMaster University- School of Geography and Earth Sciences
V
2.4.8 Catalyzed mid-pH Experiments ................................................................................... 43
2.4.9 Precipitation Amount and Percent Yield ..................................................................... 46
2.4.10 Kinetic Effects in the High pH Experiments .............................................................. 46
2.4.11 Equilibration Time in the High pH System ................................................................ 48
2.5 Conclusion .......................................................................................................................... 49
Appendix ................................................................................................................................... 51
References ................................................................................................................................. 71
Conclusions, Contributions, and Future Research ........................................................................ 76
3.1 Summary of Findings .......................................................................................................... 77
3.2 The Candidate’s Contributions to this Research ................................................................. 81
3.3 Future Research .................................................................................................................. 81
References ................................................................................................................................. 84
M.Sc. Nicolas Randazzo; McMaster University- School of Geography and Earth Sciences
VI
List of Tables
2.1 Abbreviated terms used in this manuscript
2.2 Typical speciation data for the initial conditions of experiments.
2.3 Typical speciation data for the final conditions of experiments.
2.4 Oxygen Isotope Fractionation Factor Data from Calcite Experiments
2.5 Carbon Isotope Fractionation Factor Data from Calcite Experiments
2.6 A Summary of the analyzed catalyzed data compared to some of the uncatalyzed data.
2.7 Percent composition of DIC consumed in mid-pH experiments
2.8 Percent composition of DIC consumed in high pH experiments

M.Sc. Nicolas Randazzo; McMaster University- School of Geography and Earth Sciences
VII
List of Figures
1.1 Figure 6 from Dietzel et al. (2009) after the missing points from Kim et al. (2006) were
added.
2.1 A basic outline of the three precipitation methods utilized in these experiments.
2.2 Relationship between oxygen isotope fractionation factor (A) and carbon isotope
fractionation factor (B) with final pH.
2.3 A comparison of the 1000ln18α(CaCO3-H2O) versus the duration of time which elapsed after the
addition of CaCl2.
2.4 A comparison of the oxygen and carbon isotope fractionation factors of all of samples
precipitated in this study at different concentrations.
2.5 A comparison of the isotopic fractionation factor of oxygen (A) and carbon (B) with
concentration.
2.6 A comparison of the oxygen and carbon isotope fractionation factor of the calcite samples
precipitated at the surface, side and bottom of the bottle in which they were synthesized.
2.7 Rayleigh distillation curve for the PSA and LLM samples.
2.8 A comparison of the data from the CA experiments with all of data from the mid-pH,
uncatalyzed experiments.
2.9 A comparison of the oxygen and carbon isotope fractionation factors of the high pH samples
precipitated in this study at different concentrations.
2.10 A comparison of the oxygen and carbon isotope fractionation factors of the high pH
samples precipitated in this study at different concentrations.
2.11 The intersection of the trend lines from all three experiments.

Chapter 1: Introduction and Background Information

M.Sc. Nicolas Randazzo; McMaster University- School of Geography and Earth Sciences
2
Chapter 1 1
“If I have seen further than others, 2
it is by standing upon the shoulders of giants”. 3
-Isaac Newton 4
5
1.1 Environmental Reconstruction of Paleoclimates using Stable Isotopes 6
In the last five decades, oxygen isotope fractionation factor between calcite and water has 7
been used extensively to estimate paleotemperature in marine and continental carbonates which 8
are precipitated under isotopic equilibrium (Epstein et al, 1953). Isotopic equilibrium describes 9
the point where two substances (i.e. calcite and water) cease the exchange of stable isotopes. 10
This can only be determined once chemical equilibrium has been established. However, the 11
utilization of isotopes, such as those from oxygen, to determine paleotemperatures are obscured 12
by factors such as kinetic effects from pH, growth rate and solution chemistry. Kim and O’Neil 13
(1997) noted some non-equilibrium isotope effects which impacted the oxygen isotope 14
fractionation factor of their system and theorized about a system responsible for the observed 15
isotope effects, which Zeebe (1999) proposed to be caused by the effect of pH on the solution 16
chemistry. The total amount of inorganic carbon species within a solution is known as the 17
dissolved inorganic carbon (DIC) and is composed of CO2* (i.e. the sum of aqueous carbon 18
dioxide (CO2(aq)) and carbonic acid (H2CO3) within the system), bicarbonate ion (HCO3), and 19
carbonate ion (CO32-). The concentration and domination of these species is dependent on the 20
pH of the solution. At low pH (≤6) , CO2* is the most dominant, however, HCO3 becomes the 21
most abundant at mid-pH (6 to 9.5) and CO32- is predominant at high pH (≥ 9.5) (Beck et al., 22
2005; Kim et al., 2006). 23
The level of CO2(aq) within ocean water is related to the amount of CO2(g) within the 24
atmosphere due to gas exchange caused by partial pressure gradients (Henry, 1803). For 25
instance, if the pCO2 over a body of water increases, due to factors such as anthropogenic CO2(g) 26

M.Sc. Nicolas Randazzo; McMaster University- School of Geography and Earth Sciences
3
emissions, the gas will diffuse into the water until equilibrium is established at the air-water 27
interface. Upon the absorption of CO2(g) within the water, chemical reactions occur which 28
reduce seawater pH and carbonate ion concentration as the CO2(aq) is converted into the other 29
DIC species. These species interconvert to maintain chemical equilibrium. The conversion 30
chemical equations are: 31
CO2(aq) + H2O ⇌ H2CO3 32
H2CO3 ⇌ HCO3- + H+ 33
HCO3− ⇌ CO3
2− + H+ 34
The two apparent equilibrium constants exist because there are two dissociating 35
reactions. These constants can be calculated using the following equations: 36
K1 = ([HCO3-] + [H+])/ H2CO3 37
K2 = ([CO32−] + [H+])/ HCO3
- 38
The constants established, constant values which are temperature, salinity, and pressure 39
dependent (Drever, 1988). The constant value illustrates the relative amount of dissociation 40
within the system. These equations can then be re-arranged so that the concentration of each 41
individual DIC species can be calculated. 42
CO2 = DIC/ (1+( K1/ H+) + K1 K2/ (H
+)2) 43
HCO3- = DIC/ ((H+/ K1) + 1 + (K2/ H
+)) 44
CO32− = DIC/ ((1 + (H+)2/ K1 K2) + (H
+/ K2)) 45
46
The pKa is calculated using the following equation: 47
pKa = -log10(K) 48
For example if K1 is equal to 10-6.3 and K2 is equal to 10-10.3, then pK1 is 6.3 and pK2 is 10.3. 49
If the pH of the system is below 6.3, then CO2(aq) will be the dominant ion. If it is between 6.3 50
and 10.3, most of the DIC will be composed of HCO3-, and finally, if the pH is above 10.3, 51
CO32− will be present in the largest quantities. 52

M.Sc. Nicolas Randazzo; McMaster University- School of Geography and Earth Sciences
4
The solubility of calcium carbonate is defined by its solubility product (Ksp), which 53
describes how much dissolved ions can exist within a solution (i.e. water) before precipitation 54
begins. The Ksp is calculated through the following equation: 55
Ksp = [Ca2+][CO32−] 56
The solubility product is constant for a given temperature and is unique to different minerals. 57
The Ksp for CaCO3 is a little uncertain, ranging from 3.7×10⁻⁹ to 8.7×10⁻⁹ at 25 °C, depending 58
upon the literature source. If the molar concentration of Ca2+ and CO32− exceed the Ksp, 59
precipitation of CaCO3 will commence. This concept will be briefly expanded upon in Chapter 2. 60
The presence of CO2* is important since the isotopic exchange between the DIC species 61
and water occurs through carbonic acid. Kim et al. (2006) found that CO3- ions are preferentially 62
incorporated into the precipitating CaCO3 and that the other species will only be integrated after 63
deprotonation. However, each species has a unique isotopic composition which can be reflected 64
in the isotopic signature of the CO32- if insufficient time is given for re-equilibration. As 65
observed in their studies of planktonic foraminifera, both Sparo et al. (1997) and Zeebe (1999) 66
illustrate that the δ18O in calcite decreases as CO32- concentration (or pH) increases, however 67
these studies described biogenic carbonates and their precipitation mechanism differs from 68
abiotic precipitation. This is because the dominant DIC species at higher pH values become 69
isotopically lighter as pH rises (for instance, CO32- is lighter than HCO3). However, Deines et al. 70
(2005) reported that pH had no influence of the isotopic composition if the carbonate precipitates 71
slowly. It is only through rapid precipitation that pH can influence the isotopic composition of 72
the carbonate. 73
1.1.1 The Influence of Kinetic Effects 74
Given and Wilkinson (1985) noted that composition of precipitated calcite is controlled 75
by the kinetics of surface nucleation and the amount of reactants, primarily carbonate ions, at 76
M.Sc. Nicolas Randazzo; McMaster University- School of Geography and Earth Sciences
5
growth areas. Kim et al. (2006) found that CO32-is preferentially incorporated into the crystal 77
lattice and that, HCO3- can gradually deprotonate into CO3
2-. This is due to the preferential 78
dissociation of the lighter isotopologues of HCO3-. The newly formed CO3
2- will carry the 79
isotopic signature of the HCO3- until it has re-equilibrated with the water. The isotopic 80
fractionation factor of the DIC is influenced by which species is present at a given pH. 81
Beck et al. (2005) examined the oxygen isotope fractionation factor and exchange 82
between DIC species (HCO3-, CO3
2-, and CO2*) and water at 15, 25 and 40 °C. The study found 83
that pH has a significant effect on the δ18ODIC and that this value can vary by 17 ‰, regardless of 84
temperature. Beck et al. (2005) established that, at 25 o C, the 1000ln18α(CO32-
H2O) and 85
1000ln18α(HCO3-H2O) values were 31.00 ± 0.15 ‰ and 24.19 ± 0.26 ‰ respectively. These values 86
are similar to those found by Kim et al. (2006) which reported a 1000ln18α(CO32-
H2O) value of 87
30.53 ± 0.08 ‰ and a 1000ln18α(HCO3-H2O) value of 23.71 ± 0.08 ‰ at the same temperature. 88
Therefore, a CaCO3 precipitate, which forms at 25 oC, will usually have a fractionation factor 89
somewhere between these two values. It is also worth mentioning that, like the BaCO3 from 90
Beck et al. (2005), some of the carbonates from the thesis experiments precipitated so quickly 91
during the initial stage of their precipitation that they retained the oxygen isotope composition of 92
the DIC, which had been enriched due to the production of CO2(aq) as a result of CaCO3 93
precipitation. This is because the system was not given enough time to equilibrate with the water 94
before the crystals formed. 95
As proposed by Zuddas and Mucci (1994) and Kim et al. (2006), the precipitation rate is 96
another factor which can influence the δ18O value of a carbonate precipitate. High precipitation 97
rates result in kinetic effects (which are a function of solution chemistry, pH and/or precipitation 98
rate) primarily determining the isotopic composition, causing disequilibrium. In nature, the 99

M.Sc. Nicolas Randazzo; McMaster University- School of Geography and Earth Sciences
6
influence of these factors depends on the level of CO2(g) degassing and evaporation within the 100
system and whether the carbonates precipitate in an open or closed environment. If the 101
precipitate forms slowly, it isotopically exchanges with the water over a period of time until it 102
reaches isotopic equilibrium. For instance, as shown in Kim and O’Neil (1997), the isotopic 103
composition of calcite at equilibrium between carbonate and water occurs at 28.3 ‰ (using the 104
acid fractionation factor presented in Kim et al. (2007)). Therefore, if given enough time, the 105
calcite will gradually change its isotopic composition until it reaches this oxygen isotope 106
equilibrium value. However, if a precipitate forms quickly and is not given sufficient time to 107
achieve isotopic equilibrium with its environment; it attains an isotopic composition which can 108
vary depending on the carbonate species located closest to the area of nucleation. Gabitov et al. 109
(2012) found that a high growth rate causes depletion in 18O within calcite, whereas a slow 110
growth produced a δ18O value of calcite which was closer to the isotopic equilibrium value. It 111
should also be noted that in addition to changes in pH, a change in temperature will also directly 112
impact isotope exchange kinetics and thus the time required to achieve isotopic equilibrium. 113
Under mid- pH conditions, rapidly precipitating carbonates will yield a calcite-water oxygen 114
isotope fractionation factor closer to the oxygen isotope equilibrium value between bicarbonate 115
and water of 31.00 ± 0.15 ‰. In this situation, the bicarbonate ions, which have been 116
deprotonated into carbonate ions, were given insufficient time to attain oxygen isotope 117
equilibrium between HCO3 and CO32- and therefore still carry the isotopic signature of HCO3
-, 118
despite being CO32- ions. Similarly, a rapidly precipitated carbonate could have a permil 119
fractionation factor (1000ln18calcite-water) closer to that between CO32-and H2O of 24.19 ± 0.26 ‰ 120
if it forms under higher pH conditions because more CO32- is available for incorporation into the 121
crystal lattice (versus that at lower pH). 122

M.Sc. Nicolas Randazzo; McMaster University- School of Geography and Earth Sciences
7
1.2 Defining Isotopic Equilibrium 123
1.2.1 Isotopic Equilibrium Value between Calcite and Water 124
One of the first studies to assess the oxygen isotope fractionation factor between 125
carbonate and water was O’Neil et al. (1969), which examined the oxygen equilibrium 126
fractionation factors between alkaline-earth carbonates, including calcium carbonate, and water 127
between 0 to 500oC. The curve generated from this study is in general agreement with the 128
findings of Kim and O’Neil (1997) for temperatures of 25oC or above, however the oxygen 129
fractionation factors begin to considerably deviate below this point. Kim and O’Neil (1997) 130
contended that their fractionation factor curve is more reliable, citing numerous reasons 131
including their certainty that only calcite precipitated and there was no influence from on the 132
calcium carbonate polymorphs and the similarity of their curve to biogenic carbonates. The 133
1000ln18calcite-water proposed by Kim and O’Neil (1997) can be determined by an expression 134
(Equation 1) which encompasses the variables of calcite formation for low temperatures of 10 – 135
40°C. The equation is shown below: 136
1000ln18calcite-water = 18.03 (103 /T) + 32.42 (Equation 1) 137
Kim et al. (2007) reported that, at 25 oC, a positive oxygen isotope fractionation factor of 138
approximately 0.8 ‰ can be obtained between aragonite and calcite. 139
1.2.2 Controversy Regarding True Isotopic Equilibrium between Calcite and Water 140
The technique used by Kim and O’Neil (1997) to determine oxygen isotope equilibrium 141
is widely used in other studies, including Romanek et al. (1992). However, in its study of Devil’s 142
Hole cave in Nevada, Coplen (2007) discovered natural samples which were known to be near 143
oxygen isotope equilibrium. Unexpectedly, the oxygen isotope fractionation factor between the 144
cave calcite and water at 33.7 oC was found to be 29.8 ± 0.13 ‰, which corresponds to a 145
1000ln18αcalcite–water value of 29.80 at 25 C. This value is significantly larger than the equilibrium 146

M.Sc. Nicolas Randazzo; McMaster University- School of Geography and Earth Sciences
8
value of 28.3 ‰ reported by Kim and O’Neil (1997). Since the geochemical environment within 147
the cave was deemed to be consistent for the last 10,000 years, Coplen (2007) concluded that the 148
equilibrium fractionation factor proposed by Kim and O’Neil (1997) must be underestimated for 149
temperatures between 5 and 40 oC. The experiments of Dietzel et al. (2009) support the claim of 150
Coplen (2007) and state that kinetic effects had influenced the results of previous studies. 151
However, it is worth mentioning that Dietzel et al. (2009) did not allow the establishment of 152
equilibrium between DIC and water prior to their experiment. Additionally, using clumped 153
isotope thermometry, Kluge et al. (2014) found that, the mean temperature at Devil’s Hole was 154
30.6 ± 2.6 oC, which could explain ~0.6 ‰ of the variation between Kim and O’Neil (1997) and 155
Coplen (2007). The study then concluded that the main reason for this difference is due to the 156
relatively fast precipitation rate of the laboratory experiments compared to that of the Devil’s 157
Hole sample. However, the current status of clumped isotope thermometry is imperfect due to 158
factors such as poor analytical resolution and a large standard deviation which may affect the 159
sensitivity of Δ47 measurements. Thus, the debate continues and more thorough studies to need 160
to be completed to evaluate each of these kinetic effects systematically. 161
Dietzel et al. (2009) studied the oxygen isotope fractionation factor of inorganic calcite 162
precipitation at pH between 8.3 and 10.5, precipitation rates between 1.8 and 4.4 µmol m-2h-1, 163
and temperatures of 5, 25, and 40 oC using a CO2 diffusion technique (Figure 1.1). They stated 164
that precipitation rate is influenced by pH and temperature. It was found that there is a linear 165
relationship between apparent 1000ln18αcalcite-water and the precipitation rate when temperature and 166
pH are held constant. Additionally, the trends showed a negative relationship, with 167
1000ln18αcalcite-water decreasing with increasing precipitation rate and, under disequilibrium 168
conditions, elevated pH. The article described the accepted belief that the δ18O values may not 169
M.Sc. Nicolas Randazzo; McMaster University- School of Geography and Earth Sciences
9
truly reflect formation temperature since it can be influenced by non-equilibrium isotope effects 170
caused by factors like solution chemistry, pH and/or the precipitation rate, as mentioned in Kim 171
and O’Neil (1997) and Kim et al. (2006). The study noted the presence of kinetic effects even at 172
slow precipitation rates within the lab and thus supports the claim of Coplen (2007). Dietzel et 173
al. (2009) also stated that there are discrepancies regarding the interpretation of non-equilibrium 174
isotope effects and which equilibrium values should be accepted. For instance, in natural 175
carbonate samples, the δ18O value can be influenced by growth rate, with rapid growth resulting 176
in a lower δ18O value. The article specified the measured oxygen isotope fractionation factors 177
given in articles, such as Kim and O’Neil (1997), for precipitates growth at slow rates were 178
incorrectly assumed to be at equilibrium and that surface entrapment of CO32- is a valid model 179
for isotopic fractionation factor during inorganic calcite precipitation. However, since the 180
samples produced by Dietzel et al. (2009) did not allow the time for initial equilibrium between 181
DIC and water and are thereby in a state of disequilibrium, it is difficult to truly determine the 182
contributing factors. 183
Dietzel et al. (2009) stated that 184
“Although Kim et al. (2006) claimed that the measured oxygen isotopic fractionation 185
factors in the slow precipitation experiments were statistically indistinguishable; the 186
precipitation rate effect might be actually noticeable in their experiments. In spontaneous 187
precipitation, initial supersaturation is usually relatively high, then decreases with time, 188
and finally reaches a constant value if the injection rate was constant. Therefore, the 189
average precipitation rate of each experiment generally decreases with the experimental 190
duration time. As shown in Fig. 6, the measured oxygen isotopic fractionation factors 191
increase with the experimental duration time (h) in the slow aragonite precipitation 192

M.Sc. Nicolas Randazzo; McMaster University- School of Geography and Earth Sciences
10
experiments of Kim et al. (2006) done at the same (Fig. 6a) or almost the same 193
experimental condition (Fig. 6b). This indicates that even in the slow precipitation 194
experiments of Kim et al. (2006), the measured oxygen isotopic fractionation factors 195
might still be influenced by the precipitation rate”. 196
However, upon comparing the data from the three samples mentioned in Dietzel et al. 197
(2006) from Kim et al. (2006), the points only vary by a maximum difference of 0.35 ‰ 198
(calculated by subtracting the lowest possible value for the first point from the highest possible 199
value from the final point presented). Therefore, while a trend could be suggested using the 200
aforementioned Figure 6 from Dietzel et al. (2009), the difference between the maximum and 201
minimum values is too small to truly infer one. It is more likely that the difference is caused by 202
simple human error than the influence of any known mechanism. Additionally, it is worth 203
mentioning that Dietzel et al. (2009) excluded two samples provided in Kim et al. (2006) which 204
precipitated under the same trend as the three that were included in Figure 6a. Before the 205
addition of these two neglected points, a linear trend could be suggested based on the evidence 206
presented in Dietzel et al. (2009) (as illustrated by the dotted line in the figure below). However, 207
once these two points are included, a new trend arises (as shown by the solid line). At 100 hours, 208
the 1000ln18αaragonite-water is at 28.95 ‰. The slope then increase at a constant rate until 216 hours 209
passed, at which point the 1000ln18αaragonite-water is 29.01 ‰. The slope then suddenly increases 210
for the next 189 hours as the 1000ln18αaragonite-water rises to 29.15 ‰. The slope then sharply 211
declines from 405 to 451 hours as the 1000ln18αaragonite-water then increases by 6 ‰ to 29.21 ‰ 212
(which is near the suggested equilibrium value for aragonite). The sudden changes in the slope 213
for this new pattern cannot be explained by any known mechanism and thus is most likely not 214
caused by a continued influence from precipitation rate. Instead, as mentioned above, it is more 215
M.Sc. Nicolas Randazzo; McMaster University- School of Geography and Earth Sciences
11
plausible that this strange trend is caused by human error and that all five points are statistically 216
indistinguishable. The trend illustrated in Figure 6 in Dietzel et al. (2009) also becomes less 217
clear as points from similar experiments are added that were also neglected in the paper. Since 218
some of these points occur outside of the range presented in Figure 6, the graph was recreated 219
(Figure 1.1). 220
Gabitov et al. (2012) aimed to determine the effects of growth rate on oxygen isotope 221
fractionation factor between calcite and water in high ionic strength solutions. They monitored 222
the growth rate of calcite crystals by injecting different rare earth elements (REE) spikes at 223
various periods during growth, which were incorporated into the crystals. This allowed for direct 224
examination of individual growth intervals in their samples as well as determination of growth 225
rates. The precipitates were then subjected to Secondary Ion Mass Spectrometry (SIMS) for δ18O 226
analysis. It was found that oxygen isotope fractionation factor between calcite and water 227
increased from the center of the crystals towards the edge of the crystal, with growth rates 228
showing an opposite trend. The study concluded that δ18O decreases with increasing growth rate 229
since the rapidly-growth centers were depleted in 18O relative to the slowly-growth edges. This is 230
consistent with the growth entrapment model (GEM), which states that disequilibrium 231
fractionation factor between elements is a result of elements and isotopes between a crystal and a 232
growth medium, which is due to “capture” of a chemically and isotopically anomalous near-233
surface region during crystal growth. Capture, whether partial or complete is determined by the 234
trade-off between diffusion and growth rate. The results found that the near-surface regions 235
were depleted in 18O relative to the lattice at equilibrium and that the slow growth of the δ18O 236
value is close to the predicted value of Zeebe (2007) and those found by Coplen (2007). This 237
lead them to conclude that CO32- is one of the main sources of δ18O in calcite and that faster 238

M.Sc. Nicolas Randazzo; McMaster University- School of Geography and Earth Sciences
12
precipitation rates result in a greater amount of CO32- being captured. However, the capture rate 239
of CO32- from this study was slower than that of Dietzel et al. (2009). This could be due to three 240
possible explanations: rapid consumption of CO32-, the insufficient time given to achieve 241
equilibrium, or that the growth rate was not high enough for 100% capture of 18O from CO32-. 242
Kluge et al. (2014) used clumped isotope thermometry to test the alternate equilibrium 243
value proposed by Coplen (2007). This proxy was used since it is uninfluenced by the water 244
composition and thus gives independent temperature estimates when carbonates form at 245
thermodynamic and isotopic equilibrium. The study analyzed eight mammillary calcite samples 246
from Devil’s Hole and took four to eight measurements which found that the study period had a 247
constant Δ47 value. Moreover, the study found that the paleotemperatures for water in Devil’s 248
Hole were constant at 30.6 ± 2.6 oC between 27 to180 thousand years ago, despite the occurrence 249
of glacial and interglacial cycles. Kluge et al. (2014) also stated that it is unlikely, though 250
possible, that temperatures changed significantly since the last mammillary calcite precipitated 251
4,500 years ago and that δ18O values were unaffected by growth rate effects. The offset between 252
the temperature derived from the Δ47 and the temperature of 33.7 oC directly measured by 253
Plummer et al. (2000) and used by Coplen (2007) could explain only ~0.6 ‰ of the 1.5 ‰ offset 254
between the oxygen isotope fractionation factor determined by Kim and O’Neil (1997) and 255
Coplen (2007). The groundwater temperature also remained constant at 32.8-34.3 oC. The study 256
concluded that the similarity to expected calibration data between clumped isotope data and 257
values from modern groundwater temperatures show that the calcite in Devil’s Hole precipitated 258
in equilibrium. Deviations from the commonly used equilibrium calibrations were not only 259
detected in natural samples, but also in those precipitated in laboratory experiments (Dietzel et 260
al., 2009; Gabitov et al., 2012; Watkins et al. 2013). It was argued that laboratory experiments 261

M.Sc. Nicolas Randazzo; McMaster University- School of Geography and Earth Sciences
13
show a growth-rate dependence of the fractionation factor, with a lower oxygen isotope 262
fractionation factor between water and calcite at high growth rates (this is observed in Gabitov et 263
al. (2012) where a δ18O difference of 1.5 ‰ was observed between the samples grown close to 264
equilibrium and the quickly precipitated ones). Therefore, this study concluded that laboratory 265
time scales are too fast (~2 orders of magnitude faster than Devil’s Hole of ~0.7µm/a) to truly 266
reflect equilibrium and that this fast growth results in the preferential incorporation of 16O into 267
the calcite. 268
Affek and Zaarur (2014) precipitated CaCO3 using the passive CO2(g) degassing 269
technique and examined the oxygen and clumped isotope effects. They bubbled 100% CO2(g) 270
into 1 L of deionized water for ~1 hour and added an undisclosed amount of reagent grade 271
CaCO3, with continuous stirring and bubbling for another hour. The remaining undissolved 272
solids were then filtered and the remaining solution (200 mL) was placed into an Erlenmeyer 273
flask. Most of the experiments were performed in pairs, with one flask containing solution being 274
“loosely covered” by a watch glass to reduce evaporation and one being open to atmosphere. 275
The precipitation and subsequent CO2(g) degassing at the solution surface mimics the processes 276
involved in thin films that is characteristic of stalagmites. The authors found that the precipitates 277
collected at the water’s surface were 18O enriched by approximately 1 ‰ compared to δ18O of 278
the carbonates found at the bottom of the solution. The surface CaCO3 had precipitated in 279
disequilibrium due to kinetic effects caused by CO2(g) degassing and was found to have a higher 280
δ 18O and lower ∆47 relative to their calibration values. The study discovered that these offsets 281
varied with temperature, with ∆47 values increasing and δ18O decreasing as temperature rose. 282
Contrary to theoretical predictions, this finding illustrates that there is a strong temperature 283
dependent co-variance between δ18O and ∆47 which suggests another mechanism which causes 284

M.Sc. Nicolas Randazzo; McMaster University- School of Geography and Earth Sciences
14
additional fractionation factor between DIC and calcite in fast growing crystals. The study 285
proposed that the observed trend may be the net result of processes with different isotopic effects 286
that vary with temperature. These processes may be 18O-enrichment in the DIC due to CO2(g) 287
degassing which is countered by 18O-depletion in the crystal relative to the DIC. CO2(g) 288
degassing removes the lighter isotopes through the production of CO2(g), which causes the 289
boundary layer between water and air to become supersaturated. Fractionation factor between 290
calcite and DIC may be related to the growth rate which impacts the balance between attachment 291
and detachment of carbonate ions to the mineral surface or the concentration of 16O on the 292
carbonate surface that is then incorporated into the bulk crystal. Regardless, the authors argue 293
that the isotopic fractionation factor between DIC and calcite must be greater at lower 294
temperatures to explain the observed 18O trend. 295
The experiments of Affek and Zaarur (2014), despite being loosely fitted with a watch 296
glass, can be considered open when compared to unpublished data from the McMaster Research 297
Group for Stable Isotopologues (MRSI), which was sealed with a lid and tightly closed. The 298
experiments performed by Affek and Zaarur (2014) with the watch glass fall along the same 299
trend line as those performed without the watch glass, showing that the "loosely fit" watch glass 300
had little to no effect on δ18O or ∆47. The open system conditions enhanced the CO2(g) degassing 301
in the starting solution, leading to fast degassing at the surface and slow degassing at the bottom 302
as the thickness of the solution increases, which drove carbonate precipitation at the surface and 303
would have caused there to be a greater deviation from equilibrium and a greater loss in DIC. 304
This trend would have been prominent at the water-air boundary and would have decreased 305
towards the bottom of the flask until it plateaued at a certain depth. It is worth noting that the 306
CO2(g) gradient for the experiments of Affek and Zaarur (2014) were unknown due to a lack of 307

M.Sc. Nicolas Randazzo; McMaster University- School of Geography and Earth Sciences
15
information provided. The article mentioned that the growth rate for the carbonates which 308
formed at the bottom of the flask was controlled by mass transport from the supersaturated 309
surface layer and requires a lot of time, depending on the temperature of the solution (Beck et al., 310
2005). 311
1.2.3- The Impact of Carbonic Anhydrase (CA) on Kinetic Isotope Effects 312
Carbonic anhydrase (CA) is an enzyme which acts as a catalyst for the reversible CO2 313
hydration and HCO3- dehydration reactions (CO2(aq) + H2O ⇌ HCO3
- + H+) (Lindskog et al., 314
1971; Pocker and Bjorkquist, 1977; Pocker and Sarkanen, 1978; Silverman and Vincent, 1984; 315
Paneth and O'Leary, 1985), which the main pathway in which oxygen isotope exchange between 316
the DIC and water occurs (Zeebe and Wolf-Gladow, 2001). CA works through metal ion 317
catalysis, with the active site of this enzyme containing a zinc ion which bonds with the oxygen 318
atom within a water molecule and lowers the pKa of water from 15.7 to 6.6 (Berg et al., 2002). 319
This newly formed bond causes one H+ proton to dissociate from the water molecule, causing it 320
to form a hydroxide ion, which then allows for a nucleophilic attack on a carbon dioxide 321
molecule, forming HCO3- (Berg et al., 2002). The instability of this molecule causes the enzyme 322
to then displace the bicarbonate ion in favour of another water molecule, continuing this process. 323
This cycle can be repeated up to a million times per second (Lindskog et al., 1997; Berg et al., 324
2002). This enzyme is utilized in a variety of natural processes which are vital for the metabolic 325
processes of mammals, plants, and prokaryotes (Pocker and Sarkanen, 1978; Reed and Graham, 326
1981) and is contained within many calcifying organisms. The presence of this enzyme within 327
the system greatly enhances the conversion of CO2(aq) and water to HCO3- and a liberated H+ 328
proton, a process which in the absence of the catalyst is considered rather slow. The reaction 329
with the enzyme takes place typically ten thousand to one million (104 to106) times per second 330
(Berg et al., 2002). Previous studies such as Uchikawa and Zeebe (2012), Watkins et al. (2013), 331
M.Sc. Nicolas Randazzo; McMaster University- School of Geography and Earth Sciences
16
and Watkins et al. (2014) have shown that the presence of CA significantly reduces the oxygen 332
isotope equilibration time between DIC and water and should thereby eliminate or reduce any 333
kinetic effects within the CO2-H2O system, depending on the solution’s pH and the quantity of 334
CA used. This experiment aimed to utilize CA to examine the influence of kinetic effects within 335
the studied system and possibly assist in discerning the value for oxygen isotopic equilibrium 336
between carbonate and water. 337
1.4 Conclusion 338
The use of stable isotopes in carbonate minerals can help unlock our understanding of 339
Earth’s climate change since the establishment of isotopic equilibrium can reflect the formation 340
environment. However, physicochemical factors such as kinetic effects cause the measured 341
oxygen and carbon isotope fractionation factor to differ from true equilibrium between the 342
carbonate and water. This reduces the resolution of current paleoclimate reconstruction. It is 343
only through a thorough understanding of the climate history that current and future climate 344
change can be predicted. The study of kinetic effects can also provide a better understanding of 345
how various processes influence the isotopic fractionation factor within the carbonate system so 346
that the magnitude of deviation from equilibrium can be better understood. Therefore, it is vital 347
that oxygen isotope equilibrium between carbonates and water be studied so that the isotopic 348
composition within carbonates can be accurately utilized by future researchers to better 349
comprehend, appreciate, and model the fluidity of climate change and the interconnected 350
influence these changes have on ecosystems, organisms, and humans alike. 351
1.5 Thesis structure 352
Chapter 1 of this manuscript provides a review of the necessary background literature in 353
which this project builds upon. Chapter 2 describes the results of a kinetic isotope study which 354
examines the influence of concentration, precipitation rate, and CO2 degassing/production and 355

M.Sc. Nicolas Randazzo; McMaster University- School of Geography and Earth Sciences
17
provides evidence in support the isotopic equilibrium between calcite and water as described in 356
Kim and O’Neil (1997). The chapter also discusses the utilization of varying concentrations of 357
carbonic anhydrase (CA) and its lack of influence on the oxygen and carbon isotope fractionation 358
factor, suggesting that the carbonates precipitated so quickly that it prevented the system from 359
attaining equilibrium even when CA was present. The conclusions of this thesis are presented in 360
Chapter 4 and include both a summary of the research conducted as well as the candidate’s 361
specific contributions to our understanding of carbonate environments. The relevance and 362
applicability of this research to the field geochemistry will be discussed, in addition to 363
suggestions for future work, aimed at the new graduate student who wishes to continue in the 364
field. 365

M.Sc. Nicolas Randazzo; McMaster University- School of Geography and Earth Sciences
18
Appendix
Figure 1.1. Figure 6 from Dietzel et al. (2009) after the missing points from Kim et al. (2006)
were added.
28.9
28.95
29
29.05
29.1
29.15
29.2
0 100 200 300 400 500 600 700 800
10
00
l18
αA
rag
on
ite-D
IC
Experimental Duration (h)
Data points presented in Dietzel et
al. (2009)
Neglected points from Kim et al.
(2006)

M.Sc. Nicolas Randazzo; McMaster University- School of Geography and Earth Sciences
19
References
Affek H. P. and Zaarur S. (2014) Kinetic isotope effect in CO2 degassing: Insight from clumped
and oxygen isotopes in laboratory precipitation experiments. Geochim. Cosmochim. Acta
143, 319–330.
Beck W.C., Grossman E.L. and Morse J.W. (2005) Experimental studies of oxygen isotope
fractionation factor in the carbonic acid system at 15 oC, 25 oC, and 40 oC. Geochimica et
Cosmochimica Acta 69(14), 3493–3503.
Coplen T. B. (2007) Calibration of the Calcite-Water Oxygen-Isotope Geothermometer at Devils
Hole, Nevada, a natural laboratory. Geochimica et Cosmochimica Acta 71(16), 3948-3957.
Deines P. (2005). Comment on An explanation of the effect of seawater carbonate concentration
on foraminiferal oxygen isotopes, by RE Zeebe (1999). Geochimica et Cosmochimica Acta
69(3), 787-790.
Dietzel M., Tang J., Leis A. and Köhler S. J. (2009) Oxygen isotopic fractionation factor during
inorganic calcite precipitation ― Effects of temperature, precipitation rate and pH. Chem.
Geol. 268, 107–115.
Drever, James I. (1988) The Geochemistry of Natural Waters, Second Edition. Englewood Cliffs,
NJ: Prentice Hall. pp. 51–58.
Epstein S., Buchsbaum R., Lowenstam H., and Urey H. (1953). Revised CarbonateWater
Isotopic Temperature Scale. Geological Society of America Bulletin, 11, 1315–1326.
Gabitov R. I., Watson E. B. and Sadekov A. (2012) Oxygen isotope fractionation factor between
calcite and fluid as a function of growth rate and temperature: An in situ study. Chem. Geol.
306-307, 92–102.
Given R. K. and Wilkinson, B. H (1985) Kinetic control of morphology, composition, and
mineralogy of abiotic sedimentary carbonates. Journal of Sedimentary Petrology 55, 109-
119.
Henry W. (1803) Experiments on the quantity of gases absorbed by water, at different
temperatures, and under different pressures. Phil. Trans. R. Soc. Lond. 93: 29–274.
Kim S. and O’Neil J. (1997) Equilibrium and nonequilibrium oxygen isotope effects in
synthetic carbonates. Geochimica et Cosmochimica Acta 61(16), 3461–3475.
Kim S., Hillaire-Marcel C. and Mucci A. (2006) Mechanisms of equilibrium and kinetic oxygen
isotope effects in synthetic aragonite at 25ºC. Geochimica et Cosmochimica Acta 70, 5790-
5801.
M.Sc. Nicolas Randazzo; McMaster University- School of Geography and Earth Sciences
20
Kim S.-T., O’Neil J. R., Hillaire-Marcel C. and Mucci A. (2007) Oxygen isotope fractionation
factor between synthetic aragonite and water: Influence of temperature and Mg2+
concentration. Geochim. Cosmochim. Acta 71, 4704–4715.
Kluge T., Affek H. P., Dublyansky Y. and Spötl C. (2014) Devils Hole paleotemperatures and
implications for oxygen isotope equilibrium fractionation factor. Earth Planet. Sci. Lett.
400, 251–260.
Jimenez-Lopez C., Caballero E., Huertas F. J. and Romanek, C. S. (2001) Chemical,
mineralogical and isotope behavior, and phase transformation during the precipitation of
calcium carbonate minerals from intermediate ionic solution at 25 ° C. Geochimica et
Cosmochimica Acta 65(19), 3219–3231.
Lindskog S. (1997). "Structure and mechanism of carbonic anhydrase". Pharmacol. Ther. 74 (1):
1–20.
Lindskog S. and Coleman J. E. (1973) The catalytic mechanism of carbonic anhydrase. Proc.
Natl. Acad. Sci. U. S. A. 70, 2505–2508.
McCrea J. M. (1950) On the isotopic chemistry of carbonates and a paleotemperature scale.
Journal of Chemical Physics 18(6), 849–857.
Paneth P. and O’Leary H. (1985) Carbon isotope effect on dehydration of bicarbonate ion
catalyzed by carbonic anhydrase. Biochemistry 24, 5143–5147.
Pocker Y. and Bjorkquist D. W. (1977) Stopped-flow studies of carbon dioxide hydration and
bicarbonate dehydration in water and water-d2. Acid-base and metal ion catalysis. J. Am.
Chem. Soc. 99, 6537–6543.
Pocker Y. and Sarkanen S. (1978) Oxonase and esterase activities of erythrocyte carbonic
anhydrase. Biochemistry 17(6), 1110-1118.
Silverman D. N. and Vincent S. H. (1983) Proton transfer in the catalytic mechanism of carbonic
anhydrase. CRC Crit. Rev. Biochem. 14,207-255.
Spero H. J., Bijma J., Lea D. W. and Bemis, B. E. (1997). Effect of seawater carbonate
concentration on foraminiferal carbon and oxygen isotopes. Nature 390, 497–500.
Tarutani T., Clayton R. N. and Mayeda, T. K. (1969). The effect of polymorphism and
magnesium substitution on oxygen isotope fractionation factor between calcium carbonate
and water. Geochimica et Cosmochimica Acta 33, 987–996.
Uchikawa J. and Zeebe R. E. (2012) The effect of carbonic anhydrase on the kinetics and
equilibrium of the oxygen isotope exchange in the CO2-H2O system: Implications for δ18O
vital effects in biogenic carbonates. Geochim. Cosmochim. Acta 95, 15–34.

M.Sc. Nicolas Randazzo; McMaster University- School of Geography and Earth Sciences
21
Urey, H. C. (1947). The Thermodynamic Properties of Isotopic Substances. Journal of the
Chemical Society, 562-581.
Watkins J. M., Nielsen L. C., Ryerson F. J. and DePaolo D. J. (2013) The influence of kinetics
on the oxygen isotope composition of calcium carbonate. Earth Planet. Sci. Lett. 375, 349–
360.
Watkins J. M., Hunt J. D., Ryerson F. J. and DePaolo D. J. (2014) The influence of temperature,
pH, and growth rate on the δ18O composition of inorganically precipitated calcite. Earth
Planet. Sci. Lett. 404, 332–343.
Zeebe R. E. (1999) An explanation of the effect of seawater carbonate concentration on
foraminiferal oxygen isotopes. Geochimica et Cosmochimica Acta 63, 2001-2007.
Zeebe R. E. and Wolf-Gladrow D. A. (2001) CO2 in seawater: equilibrium, kinetics, isotopes.
Elsevier Oceanogr. Ser. 65, 346.
Chapter 2:
Carbon and Oxygen Isotope Effects
in Synthesized Calcite
at 25 oC
M.Sc. Nicolas Randazzo; McMaster University- School of Geography and Earth Sciences
23
Chapter 2 1
2
“To raise new questions, new possibilities, to regard old problems from a new angle, 3
requires creative imagination and marks real advance in science”. 4
-Albert Einstein 5 6
2.1 Introduction 7
Carbonate environments have been abundant throughout Earth’s history and the isotopic 8
ratios of oxygen (18O/16O) and carbon (13C/12C) within carbonates can be utilized to deduce 9
information about past environments, including temperature (Urey, 1947; Epstein et al., 1953; 10
Broecker, 1986; Lea et al., 2000) and types of vegetation (Wickman, 1952; O'Leary, 1981; 11
O'Leary, 1988; Dawson et al. 2002; Staddon, 2004). This is because, under ideal conditions, the 12
precipitating carbonates exchange isotopes with their formation environment until isotopic 13
equilibrium is attained. Isotopic equilibrium describes the point where the attachment of 14
isotopes between two substances (i.e. calcite and water) equals the rate in which they are leaving. 15
However the true oxygen isotope equilibrium fractionation factor which represents this point is 16
currently debated upon, with Kim and O’Neil (1997) proposing 28.3 ‰ (using the acid 17
fractionation factor from Kim et al. (2007)) at 25 oC and Coplen (2007) arguing 29.8 ‰. This 18
information is important since it allows scientists to gain a better understanding of ocean 19
temperatures and has broader implications regarding Earth’s climate system and thus global 20
warming. However, utilization of both oxygen and carbon isotopes in carbonate minerals and the 21
aforementioned climatic information is obscured by “non-equilibrium isotope effects” in 22
carbonates which are often affected by factors, such as solution chemistry, vital effects and 23
precipitation rate (McCrea, 1950; Tarutani et al., 1969; De Villiers et al., 1995; Kim and O'Neil, 24
1997; Spero et al., 1997; Zeebe, 1999; Jiménez-López et al., 2001; Kim et al., 2006). Any sudden 25
change in any of these factors will impact the isotopic exchange kinetics and thus the time 26
M.Sc. Nicolas Randazzo; McMaster University- School of Geography and Earth Sciences
24
required to reach isotopic equilibrium. The isotope exchange between carbonates and water 27
could further be influenced by the presence of dissolved aqueous carbonate species (Mills and 28
Urey, 1940; McCrea, 1950; McConnaughey, 1989; Zeebe 1999; Kim et al. 2006; Zeebe, 2007) 29
as well as the surface entrapment of CO32- ions, which have varying impacts depending on pH 30
and precipitation rate as found by Kim et al. (2006) and predicted by Deines (2005). Therefore, 31
the goal of this research is to gain a better understanding of the influence of kinetic effects within 32
the carbonate system. This will help to attain a greater understanding of oxygen isotope 33
equilibrium and possibly help to determine which of the two proposed oxygen isotope 34
fractionation factors truly represents isotopic equilibrium between calcite and water. This will 35
assist in improving the use of carbonate minerals as paleotemperature proxies to help provide a 36
stronger reference frame for future research about paleoclimate and the current observed changes 37
in the global climate. 38
2.2 Methods 39
2.2.1 Preparation of Solution 40
Solutions were prepared by measuring the weights of varying concentrations of NaHCO3 41
using a Sartorius® weighting scale. The solutes were then added to 1 liter of 18Ω deionized 42
water, which was accurately determined through the use of a volumetric flask. Any surplus 43
water was removed using a 100-1000 µm pipette and the remaining water was transferred into 44
the glass Pyrex® media bottle. The caps of the bottles were then tightly sealed and covered with 45
Parafilm® wax. All closed systems experiments conducted in this study were given this same 46
treatment. Before each use, the bottles were placed within an acid bath containing approximately 47
5% hydrochloric acid (HCl) for a minimum of two days (depending on whether the bottles had 48
been used before). The bottles were then rinsed twice using diluted water and twice using 49
deionized water. The exterior of the bottles were then hand dried and the bottles were placed 50

M.Sc. Nicolas Randazzo; McMaster University- School of Geography and Earth Sciences
25
within a 70 oC dryer for at least one day to remove any remaining water. Once prepared, the 51
solutions were kept within a temperature chamber at 25 ± 0.1 oC for 7 days, a period which is 52
significantly larger than 9 hour recommendation of Beck et al. (2005). Upon equilibration, the 53
initial pH was then measured using an Oakton® pH electrode. The corresponding concentration 54
of CaCl2 was then added by dissolving CaCl2.2H2O. 55
2.2.1.1 Normal Mixing Experiments (NM) 56
The definitions for all terms used in this manuscript can be found in Table 2.1. Three 57
different closed bottle tests were performed to control the precipitation rate of the carbonates 58
(Figure 2.1). The first, referred to as Normal Mixing Experiments (NM), added sufficient 59
NaHCO3 to produce solutions with concentrations of 5, 15, 25, and 50 mmolal to the deionized 60
water and subsequently added an equimolar amount of CaCl2.2H2O after oxygen isotope 61
equilibration between DIC and water had been established. Due to the hydrophilic nature of 62
CaCl2, all aliquots of the salt were weighed as quickly as possible and were discarded if the 63
weighing time exceeded approximately one minute or water droplets were visible within the 64
weighing dish. While this is potential source of error within this study due to the potential 65
weighing offset caused the inclusion of water, it is not likely that this significantly influenced of 66
the samples. This procedure was also replicated at 25 mmolal, but was left open to the 67
atmosphere without the cap of the bottle. These experiments shall be referred to as the open, low 68
ionic strength experiment. 69
2.2.1.2 Normal Mixing Experiments- Precipitation under an Open System 70
Solutions were also produced using the NM technique described above at a concentration 71
of 25 mmolal under an open system and were given either six hours or one week to precipitate 72
after the addition of CaCl2.2H2O. The purpose of these experiments was to test the influence on 73
M.Sc. Nicolas Randazzo; McMaster University- School of Geography and Earth Sciences
26
the isotopic composition as well as the morphological impact the open system may have on the 74
crystal structure. The second set of samples were precipitated under saline conditions and were 75
comprised of 5 mmolal of NaHCO3, 10 mmolal of CaCl2.2H2O, and 680 mmolal of NaCl or 5 76
mmolal of NaHCO3, 67 mmolal of CaCl2.2H2O, and 557 mmolal of NaCl. These carbonates 77
were synthesized within a plastic container with dimensions of 41.4 cm length, 17.78 cm width, 78
and 15.54 cm height (16.25 x 7.00 x 6.12 inches) which did not have a lid. This left ~736 cm2 of 79
water surface exposed to the atmosphere. The container was filled with 4 liters of deionized 80
water and then stored in a growth chamber at 25 ± 0.1 oC with a humidity of 95% for 81
approximately one week. 82
2.2.1.3 Normal Mixing Experiments- High pH Solutions 83
Two groups of samples were also precipitated under high pH conditions (~11.07) through 84
the reaction of Na2CO3 and CaCl2.2H2O at concentrations of 5, 15, and 25 mmolal. These 85
solutions were prepared in the same manner as the Normal Mixing solutions precipitated under 86
lower pH conditions. Beck et al. (2005) found that, at 25 oC and at a pH of 11.7 and above, DIC 87
requires 45 days to equilibrate with water. In contrast, according to Kim et al. (2006), those 88
which form around ~10.7 require only 7 days. To test this, the first group was given one week to 89
equilibrate after the addition of Na2CO3, as recommended by Kim et al. (2006), and the second 90
group was given 50 days to equilibrate, in accordance with Beck et al. (2005). After the allotted 91
time, CaCl2.2H2O was added to the solution and the system was given one week to precipitate 92
before filtering. Solutions were always stored at 25 ± 0.1 oC. 93
2.2.1.4 Partial Solid Addition (PSA) Experiments and Liquid/Liquid Mixing (LLM) Experiments 94
To reduce the carbonate precipitation time and attempt to obtain samples closer to 95
isotopic equilibrium, a second set of samples, named the Partial Solid Addition (PSA) 96
experiments, were precipitated using only concentrations of 5, 15, and 25 mmolal by adding 97

M.Sc. Nicolas Randazzo; McMaster University- School of Geography and Earth Sciences
27
percentages of solid CaCl2.2H2O to a 1L solution of pre-dissolved NaHCO3, over the course of 98
three days (40% on the first day and 30% over the next two days) until the concentration of both 99
chemicals were identical. A third set of closed system samples, known as the Liquid/Liquid 100
Mixing (LLM) experiments, were prepared for the purpose of hastening the rate of precipitation. 101
These experiments were prepared by pre-dissolving 5, 7, 10, 15, and 25 mmolal of NaHCO3 and 102
CaCl2.2H2O in individual 500 mL bottles and equilibrating the DIC for 5 days and storing both 103
bottles at 25 oC. After the allotted time elapsed, both corresponding 500mL solutions were 104
subsequently poured into the same 1L bottle. 105
2.2.1.5 Experiments Catalyzed using Bovine Carbonic Anhydrase 106
Later experiments were then conducted using the NM and PSA experiments in the 107
presence of three concentrations of carbonic anhydrase (CA) (purchased from MP Biomedicals - 108
#153879). The first of these concentrations were based on the findings of Uchikawa and Zeebe 109
(2012), which precipitated carbonates at a concentration of 15 mmolal and found that 1.9x10⁻⁵ 110
mmolal was the most effective amount of CA used. To test the effects of CA in this study, CA 111
concentrations of 0.63x10⁻⁵ mmolal and 3.17x10⁻⁵ mmolal were also selected, representing 1/3 112
and 1 2/3 of the concentration used in Uchikawa and Zeebe (2012). All three of these 113
concentrations of CA were added to solutions containing 5, 15, and 25 mmolal of NaHCO3 and 114
eventually CaCl2.2H2O after equilibration at 25 oC. Additional experiments were then conducted 115
at a concentration of 38 micromolar, twice the amount used by Watkins et al. (2013), to further 116
test the influence of CA on the system examined in this study. These experiments were only 117
conducted at 15 and 25 mmolal due to the pH declining effect of CA which hindered significant 118
crystal growth at 5 mmolal. 119
M.Sc. Nicolas Randazzo; McMaster University- School of Geography and Earth Sciences
28
2.2.2 Storage of Solution in Constant Temperature 120
As mentioned above, after the addition of CaCl2.2H2O, the caps of the bottles were tightly 121
sealed by wrapping Parafilm® wax was around the cap and neck of the bottle. The first sets of 122
mid-pH, NM solutions at concentrations of 5, 15, and 25 mmolal were maintained at 25 ± 0.1 oC 123
within the temperature chamber for 1, 3, 5, and 7 weeks. Over the designated time, the solutions 124
were observed and the appearance of calcite rafts within each bottle was noted. All other 125
solutions used in this study were stored at 25 ± 0.1 oC for one week after the addition of 126
CaCl2.2H2O. In order to attain a greater accuracy, all of these experiments were performed three 127
times at each condition. After the allotted time, the pH of the solutions were measured and 128
compared to the initial pH (~8.2 for mid-pH experiments). Surface, or “raft”, carbonates 129
precipitated from most of the NM experiments were then collected using a hand-crafted 130
miniature ladle. 131
2.2.3 Filtration of Solution and Collection of Samples 132
A vacuum filter was used in order to collect precipitate samples from the solutions. It 133
was built by inserting a fritted glass funnel support with a silicone stopper into a 1 L Büchner 134
flask. Type HVLP Durapore® filter paper with a pore size of 0.45µm was placed over top the 135
membrane of the funnel support and moistened with deionized water. A 300 mL Büchner funnel 136
was then positioned over the funnel support and secured with a clamp. A rubber hose was fitted 137
over the hose barb of the Büchner funnel, which withdrew air from the flask, creating a vacuum. 138
A glass rod with a rubber policeman was then used to destabilize the precipitates from the 139
sides and bottom from both sets of solution. The solution was poured into the Büchner funnel 140
where the water filtered through the membrane into the flask, leaving only the precipitates on the 141
filter paper. Deionized water followed by methanol was then poured into the Büchner funnel to 142
ensure that all precipitates were deposited onto the filter paper. The filter paper was removed 143
M.Sc. Nicolas Randazzo; McMaster University- School of Geography and Earth Sciences
29
and placed within a Petri dish. Deionized water was added to the now emptied bottle and the stir 144
stick was then used to destabilize the precipitates from the bottom of the flask. The beaker with 145
calcite raft precipitates was filtered in this same fashion. Once collected, the Petri dishes were 146
placed into an oven at 70 oC for one day to remove any excess water. Afterwards, the samples 147
were weighed using a Sartorius® scale and placed within small vials. 148
2.2.4 Stable Isotope Analysis 149
Samples of the precipitates were weighed using a Mettler Toledo® weighing scale and 150
placed into small stainless steel sample cups. These cups were then placed into an ISOCARB 151
automated acid bath at 90 oC (precision of ± 0.08 ‰) attached to a Fisions Optima® dual-inlet 152
Isotope Ratio Mass Spectrometer (IRMS) to determine their isotopic composition. The carbonate 153
samples were run against the standards NBS-19, NBS-18 and LSVEC. The solution and DIC 154
samples were run using a Finnigan DELTAplusXP continuous flow stable isotope-ratio mass 155
spectrometer (precision of ± 0.05 ‰). The solution samples were run using the lab standards 156
MRSI W1 (0.58 ‰) and MRSI W2 (28.08 ‰) which had been previously calibrated against 157
SMOW and SLAP. The δ18O of the calcite was then calculated using the acid fractionation 158
factor of 1.01030 as described in (Kim et al., 2007). The carbon isotope composition of DIC 159
(13CDIC) was run against NBS 18, NBS 19, and LSVEC and the percent composition of the DIC 160
was attained by measuring lab DIC standards with known concentrations of 2, 5, and 8 mmolal, 161
examining the area under the curve of the mass 44 peak, and comparing them to the measured 162
samples. The data from both mass-spectrometers was then normalized to obtain the isotopic 163
compositions. All of the calculated carbon isotope fractionation factors were calculated using 164
the initial δ13C(DIC). 165

M.Sc. Nicolas Randazzo; McMaster University- School of Geography and Earth Sciences
30
Some of the samples representing each condition were then sent to McMaster Analytical 166
X-Ray Diffraction Facility (MAX) for X-ray diffraction (XRD) analysis. 167
2.3 Results 168
2.3.1 XRD Analysis and Decline in pH 169
The results of the XRD analysis showed that all samples precipitated under the closed 170
system were composed of 100% calcite, regardless of concentration, technique, pH or whether 171
CA was utilized. However, carbonates synthesized from low ionic strength solutions (i.e. without 172
NaCl) in the open experiments yielded ~75 % calcite and ~25 % vaterite (Figure 2.2). In 173
contrast, the carbonates precipitated from solutions of sea-water like ionic strength yielded 100% 174
calcite, similar to the closed system experiments. 175
A trend can also be observed when examining the change in pH between initial and final 176
conditions. It was found that pH always declined with increasing reactant concentration upon 177
the addition of CaCl2 (Figure 2.3). The addition of CaCl2 always caused the pH to decline. In 178
the mid-pH solutions, final pH was usually approximately 1, 1.6, 1.9, 2.3 units lower than under 179
initial conditions for samples precipitated at 5, 15, 25, and 50 mmolal, respectively. For the high 180
pH solutions, pH declined ~1.75 for 5 mmolal and ~2 for 25 mmolal samples. Speciation 181
calculations found that the percentage of the isotopically heavy CO2*, which increases with 182
acidity, grew with concentration from ~1.2 % under initial mid-pH conditions for all conditions 183
to ~10, ~34, ~45, or ~66 % of the total DIC at 5, 15, 25, or 50 mmolal, respectively, under final 184
pH conditions. Some of this available DIC was then incorporated into the synthesized CaCO3. 185
Similarly, the high pH samples increased from initial percent concentration of 0 % CO2* to 0.2 % 186
at 5 mmolal and 1 % at 25 mmolal. Table 2.2 and Table 2.3 outline the typical DIC 187
compositions of the samples synthesized in this study under initial and final conditions, 188
respectively. 189

M.Sc. Nicolas Randazzo; McMaster University- School of Geography and Earth Sciences
31
2.3.2 Uncatalyzed, Mid-pH Experiments 190
Approximately 83 individual experiments were conducted over the course of this study. 191
Of these samples, 17 NM solutions had precipitates collected from the surface, side and bottom 192
of the glass Pyrex® media bottle. All of the oxygen and carbon isotope compositions of the 193
carbonates formed in this study are listed in Table 2.4 and 2.5. The 1000ln18α(CaCO3-H2O) values 194
of all three closed, uncatalyzed, mid-pH experiments range from 28.43 to 29.8 ‰. In these 195
experiments, the 1000ln18α(CaCO3-H2O) values of the 5, 15, and 25 mmolal NM samples had an 196
average 1000ln18α(CaCO3-H2O) value of 28.88 ± 0.17, 29.17 ± 0.43, and 29.54 ± 0.22 ‰, 197
respectively. All of these 1000ln18α(CaCO3-H2O) ranges are similar (i.e. within analytical error). 198
The 50 mmolal samples had an average 1000ln18α(CaCO3-H2O) of 29.83 ± 0.03 ‰ and the 25 199
mmolal open bottle samples had an average value of 29.81 ± 0.03 ‰. Carbonates from the LLM 200
experiments had average 1000ln18α(CaCO3-H2O) values of 28.93 ± 0.07, 28.65 ± 0.03, 29.91 ± 0.24, 201
29.58 ± 0.13, and 29.71 ± 0.13 ‰ for 5, 7, 10, 15, and 25 mmolal, correspondingly. The PSA 202
experiments had 1000ln18α(CaCO3-H2O) values for the 5, 15, and 25 mmolal samples averaging 203
from 28.52 ± 0.01, 29.09 ± 0.01, and 29.26 ± 0.06 ‰. The samples obtained from the open 204
experiments had similar isotopic compositions to their closed system counterparts, with an 205
average 1000ln18α(CaCO3-H2O) value of 29.81 ± 0.03 ‰. Due to the similarity of these samples to 206
those which precipitated at the same concentration under a closed system, if any fractionation 207
factor between vaterite and calcite occurred, it would have been minimal. These carbonates are 208
the only ones in this entire study which precipitated vaterite. 209
Unfortunately the δ13C of both the initial and final DIC of the NM experiments were not 210
obtained and thereby no 1000ln13α(CaCO3-DIC) values for the 5, 15, and 25 mmolal samples could 211

M.Sc. Nicolas Randazzo; McMaster University- School of Geography and Earth Sciences
32
be accurately calculated. The 1000ln13α(CaCO3-DIC) value of the 50 mmolal and 25 mmolal open 212
system experiments averaged at 3.61 ± 0.38 and 3.62 ± 0.20 ‰, respectively. Samples from the 213
LLM experiments obtained isotopic fractionation factor values for 5, 7, 10, 15, and 25 mmolal of 214
1.17 ± 0.06, 1.49 ± 0.20, 1.76 ± 0.09, 2.44 ± 0.44, and 2.23 ± 0.02 ‰, correspondingly. The 215
carbonates from the PSA experiments attained values averaging from 0.62 ± 0.01, 2.71 ± 0.11, 216
and 2.47 ± 0.33 ‰ for 5, 15, 25 mmolal, respectively. 217
2.3.3 Catalyzed Experiments 218
The 1000ln18α(CaCO3-H2O) of the calcite from the catalyzed experiments were identical to 219
those of the uncatalyzed experiments, despite three different concentrations (i.e., 0.19, 0.57, and 220
0.95 mg/L) of carbonic anhydrase being used. The average oxygen isotope composition for all 5, 221
15, and 25 mmolal solutions were 28.51 ± 0.09 ‰, 29.22 ± 0.1 ‰, and 29.65 ± 0.02 ‰, 222
respectively. The average 1000ln13α(CaCO3-DIC) for each of the three concentrations using the PSA 223
technique ranged from 1.74 ± 0.11 ‰, 3.21 ± 0.08 ‰, and 3.71 ± 0.10 ‰. Samples precipitated 224
using the NM technique had compositions averaging from 1.91 ± 0.06 ‰ for 5 mmolal 225
experiments and 3.91± 0.08 ‰ for those completed at 25 mmolal. However, samples 226
precipitated in the presence of 0.38 μM (or 11.2 g/L) had a significantly lower 1000ln18α(CaCO3-227
H2O) and the 1000ln13α(CaCO3-DIC) when compared to the uncatalyzed experiments precipitated 228
using the same concentration of reactants (Table 5). The lower fractionation factor values of the 229
catalyzed experiments cannot be explained by analytical error. Samples from the catalyzed 15 230
mmolal experiments had an average 1000ln18α(CaCO3-H2O) and1000ln13α(CaCO3-DIC) value of 28.95 ± 231
0.03 ‰ and 3.02 ± 0.02 ‰, respectively. The calcite precipitated at 25 mmolal in the presence 232
of CA had an average 1000ln18α(CaCO3-H2O) value of 29.23 ± 0.07 ‰ and 3.75 ± 0.04 ‰ for 233
1000ln13α(CaCO3-DIC) value. The oxygen isotope fractionation factor of the uncatalyzed, mid-pH 234
M.Sc. Nicolas Randazzo; McMaster University- School of Geography and Earth Sciences
33
samples precipitated at the same concentration had a 1000ln18α(CaCO3-H2O) value of 29.59 ± 0.17 235
‰ (0.36 ‰ difference) and a 1000ln13α(CaCO3-DIC) value of 2.35 ± 0.24 ‰ (1.4 ‰ dissimilarity). 236
Catalyzed experiments were not undertaken in the high pH system since the effectiveness of CA 237
reduces with increasing pH (Roughton and Booth, 1946; Kernohan, 1964; Lindskog and 238
Coleman, 1973; Donaldson and Quinn, 1974; and Berg et al., 2002). Therefore, it would no 239
longer act as an effective catalyst and it is less likely to impact the isotopic fractionation factor 240
within the faster precipitating high pH experiments. 241
2.3.4 High pH Experiments 242
All of samples from high pH experiments, regardless of whether they were equilibrated at 243
7 or 50 days, showed a 1000ln18α(CaCO3-H2O) trend which ran in the opposite direction as those 244
precipitated at mid-pH, with 5 mmolal samples having a larger oxygen fractionation factor than 245
25 mmolal samples. The 5 mmolal samples had an average 1000ln18α(CaCO3-H2O) of 26.21 ± 0.06 246
‰ and an average 1000ln13α(CaCO3-DIC) of 0.23 ± 0.02 ‰ for the 7 and 50 day experiments, 247
respectively. The 25 mmolal samples had averaged 1000ln18α(CaCO3-H2O) of 25.10 ± 0.11 ‰ for 7 248
and 50 days. The average 1000ln13α(CaCO3-DIC) value was 0.19 ± 0.03 ‰. The pH of these 249
samples declined slightly after the addition of CaCl2.2H2O. 250
2.4 Discussion 251
2.4.1 The Influence of pH Declined 252
As the pH declined over the course of calcium carbonate formation, the DIC speciation 253
also changed and altered their carbon and oxygen isotope compositions within the DIC 254
components. Due to the rapid precipitation rate of this system, there would have been little time 255
available for isotopic re-equilibration of these DIC species after deprotonation into CO32-, which 256
is the species that is incorporated into the precipitating carbonate (Kim et al., 2006). Since the 257

M.Sc. Nicolas Randazzo; McMaster University- School of Geography and Earth Sciences
34
degree in which this process occurred varied with concentration of NaHCO3 and CaCl2, the 258
magnitude of this effect would have increased with the concentration of the reactants. The pH 259
also declined in the high pH system, however this was strictly due to the liberation of H+ protons 260
from the water. 261
2.4.2 The influence of NaCl on Calcium Carbonate Morphology 262
The open system solutions precipitated through passive CO2(g) degassing in the presence 263
of NaCl in this study always yielded 100 % calcite. This is due to the increased presence of ions 264
from the dissolved NaCl which increased the calcite’s solubility and delayed the precipitation of 265
CaCO3, causing the solution chemistry of the solution to prohibit the nucleation of vaterite 266
(Takia et al., 2007). These results conflict with the findings of Kluge and John (2015), who 267
precipitated 100 % vaterite at 23 oC in the presence of 6.4 M L-1 of NaCl (~10 times the amount 268
used in this study). However, the study pre-dissolved pure calcium carbonate and precipitated 269
samples by bubbling N2 through the solution. This may have negated the aforementioned effect 270
from sodium chloride since active CO2(g) degassing would have purged the system of CO2(aq) and 271
increased the saturation state, causing the CaCO3 to rapidly precipitate as vaterite. 272
2.4.3 Duration in the Uncatalyzed, Mid-pH Experiments 273
The duration the samples spent within the growth chamber after the addition of 274
CaCl2.2H2O before filtration was also examined for possible isotopic effects within the NM 275
experiments (Figure 2.4). It was found that there is no significant difference in the 276
1000ln18α(CaCO3-H2O) over the studied time periods, meaning that all of the carbonates formed 277
within a week and did not continue to participate after initial formation. 278

M.Sc. Nicolas Randazzo; McMaster University- School of Geography and Earth Sciences
35
2.4.4 The Effect of Concentration and Precipitation Rate 279
The quick reaction rate between the NaHCO3 and CaCl2.2H2O is a major process 280
governing the system since it would have introduced kinetic effects and prevented the isotopic 281
equilibrium between CaCO3 and water. This is because isotopic equilibrium requires both 282
precipitation rate and CO2 production to be slower than the time it takes for the carbonate-water 283
system to buffer the impacts of kinetic effects (Beck et al, 2005; Kim et al., 2006; Coplen 2007; 284
Dietzel et al., 2009; Gabitov et al, 2012; Watkins et al., 2013). The faster precipitation rate of 285
the experiments conducted a higher concentration of initial reactants would have, as briefly 286
discussed above, contained CO32- ions which reflected an elevated isotopic signature from the 287
HCO3- ions since they were not given enough time to isotopically re-equilibrate after 288
deprotonation into the CO32- ion. In contrast, the samples which precipitated at lower 289
concentrations had more to time equilibrate isotopically and thereby have a lower oxygen isotope 290
fractionation factor. 291
The higher concentrated solutions also precipitated a larger amount of CaCO3 due to the 292
solubility product (Ksp) of calcium carbonate, which ranges from 3.7×10⁻⁹ to 8.7×10⁻⁹ at a 293
constant temperature of 25 °C, depending on the data source (Lide, 2005). As described above, 294
the Ksp describes the amount of dissolved ions which can stay within the solution and that 295
precipitation will readily occur once the Ksp is surpassed. Thus, as the concentration of initial 296
reactants increases, more ions become available in the solution which cannot be remain in their 297
dissolved state, promoting further precipitation of the solid CaCO3. The rate in which this occurs 298
increases with the amount of dissolved Ca2+ and CO32- since the higher concentration creates a 299
higher likelihood that the atoms of the reactants will collide with each other and start to 300
precipitate (Chang and Goldsby, 2013). This influenced both carbon and oxygen in the system 301

M.Sc. Nicolas Randazzo; McMaster University- School of Geography and Earth Sciences
36
and resulted in an enrichment trend. This is enforced by Table 2.4 which shows that the 302
difference between the measured 1000ln18α(CaCO3-H2O) and 1000ln13α(CaCO3-DIC) increases with 303
concentration in all experiments. Therefore, it is certain that the 25 mmolal samples precipitated 304
at a faster rate than those synthesized at 15 mmolal and so forth. This coincides with a visual 305
inspection of when the carbonates first became visible to the naked eye. 306
2.4.5 Comparing the Data to Previous Research 307
The carbon and oxygen isotope fractionations in this study illustrate a positive linear 308
trend with increasing reactant concentration (and thus precipitation rate and kinetic effects), 309
which deviates away from the equilibrium oxygen isotope fractionation factor for 25 oC 310
suggested by Kim and O’Neil (1997) and moves towards the one reported by Coplen (2007) 311
(Figure 2.5). The strong correlation between δ13C and δ18O illustrates that the carbonates formed 312
within a finite system. Since all of the carbonate samples were aged for a week before the 313
addition of CaCl2, it is believed that all of the experiments achieved oxygen isotope equilibrium 314
between DIC and water and that the magnitude of deviation from this point is dependent on the 315
amount of kinetic effects introduced through their varying precipitation rates. As mentioned 316
above, all carbonates were fully formed within a short period of time (Figure 2.4). The 317
carbonate samples obtained from 25 and 50 mmolal concentrations precipitated the quickest and 318
all had 1000ln18α(CaCO3-H2O) values on or near the equilibrium fractionation factor proposed by 319
Coplen (2007). This suggests that this value does not represent equilibrium. This supports the 320
findings of Chacko and Deines (2008), who used theoretical calculations to obtain the oxygen 321
isotope fractionation factor between calcite and water and also found that the equilibrium 322
fractionation factor was “substantially larger” than what they had found. This study is further 323
reinforced by the findings of Chacko et al. (1991), Kieffer (1982), and Schauble et al. (2006). If 324

M.Sc. Nicolas Randazzo; McMaster University- School of Geography and Earth Sciences
37
the value proposed by Coplen (2007) truly represents equilibrium, then all contrasting empirical 325
and theoretical data are incorrect. However, Chacko and Deines (2008) also stated that it cannot 326
be unquestionably proven that the current water temperature and isotopic fractionations found in 327
Devil’s Hole remained the same since the sample analyzed by Coplen (2007) precipitated. 328
While this cannot be confirmed either way, the similarity between the 25 and 50 mmolal samples 329
precipitated in this study and the Devil’s Hole carbonate suggest that the value suggested by 330
Coplen (2007) is a natural barrier that the samples with the most kinetic effects could not 331
penetrate (Figure 2.5 and 2.6). Both of these figures also illustrates that a similar natural barrier 332
prevents the carbon isotopes from exceeding a certain point. 333
2.4.6 Isotopic Enrichment Due to Saturation Induced CaCO3 Precipitation 334
The isotopic composition of calcium carbonate in this system may have also been 335
influenced by CO2 related processes, which can be caused by two processes. One is through the 336
CO2(g) degassing induced precipitation caused by the pCO2 gradient between the atmosphere and 337
the water (which will be referred to as Type I carbonate precipitation mechanism from here 338
onwards (Type I CPM)). The other is a consequence of CO2(aq.) (and some CO2(g)) being 339
produced as a by-product of the chemical reaction required to precipitate calcium carbonate 340
(Type II CPM) in which CO2(aq) is produced by the dissociation of carbonic acid which formed 341
through the reaction between a liberated H+ proton and a free HCO32-. As discussed above, Ca2+ 342
reacts with HCO3- to produce CaCO3 and H+, these liberated H+ protons can the react with some 343
of the HCO3- in solution to form H2CO3 (carbonic acid). This molecule then dissociates in the 344
presence of water to become carbon dioxide and water. This is described in the following 345
reaction: 346
HCO3- + H+ ⇌ H2CO3 ⇌ CO2(aq) + H2O 347
M.Sc. Nicolas Randazzo; McMaster University- School of Geography and Earth Sciences
38
In general, both Type I and II cause an enrichment of the DIC layer due to the lighter 348
isotopes of both carbon and oxygen being expelled in the form of CO2 (either in gaseous or 349
aqueous form) (Hendy, 1971; Usdowski and Hoefs, 1990; Mickler, 2004). This can cause all of 350
the DIC species within the water to be 18O and 13C enriched (Kluge et al, 2014) and is why the 351
carbonates precipitated at the air-water boundary in Affek and Zaarur (2014) were isotopically 352
heavier than those which formed at the bottom of the flask. The high amount of CO2(g) degassing 353
at the surface caused the carbonates to rapidly precipitate and introduced kinetic effects. In 354
contrast, the bottom carbonates did not precipitate as quickly because the thick film of the 355
solution reduced the rate of CO2(g) degassing and caused the carbonates to form at a slower rate 356
through mass transport. This resulted in the carbonates being isotopically less heavy than the 357
surface carbonates and thereby closer to isotopic equilibrium. While the relative magnitude of 358
both enrichment processes in this study is unknown, it is likely that a similar process (Type II 359
CPM) influenced this system. 360
The experiments described in this study were conducted in a closed system and any 361
kinetic effects observed within the precipitated calcite due to Type II CPM would have prevented 362
the aforementioned dual precipitation rate between the surface and bottom carbonates seen in 363
Affek and Zaarur (2014). Since this study precipitated carbonates through chemical reaction, 364
and not the pCO2 gradient between atmosphere and water, all carbonates, regardless of location 365
within the bottle, were equally influenced by the production of CO2(aq). Therefore, the surface, 366
side and bottom samples all precipitated quickly and were isotopically influenced by CO2 367
production through a chemical reaction and an equal amount of kinetic effects. This caused them 368
to have an isotopic fractionation factor which was similar to the one observed in Affek and 369
Zaarur (2014). It is for this reason that the samples collected from the surface, side and bottom 370

M.Sc. Nicolas Randazzo; McMaster University- School of Geography and Earth Sciences
39
from this study had similar isotopic compositions (Figure 2.7). While no concentration 371
information was given in Affek and Zaarur (2014), there was a similarity in the isotopic 372
enrichment between the oxygen isotope fractionation factor of the surface samples at 25 oC 373
(28.54 and 28.84 ‰) and all of the carbonates precipitated at 5 mmolal in this study. This 374
suggests that the increase in the CO2(aq) reservoir through Type II CPM might mimic the effects 375
of CO2(g) leaving the solution through Type I CPM. 376
This process easily explains the carbon trend (since the DIC is the only carbon source in 377
the system) and is described in Turner (1982) and Zhang et al. (1995), which state that δ13C 378
values of carbonate precipitates are determined by the degassing of CO2(g). The chemical bonds 379
of these heavier isotopes are stronger compared to those composed of the lighter isotopes due to 380
the reduced vibrational energy (and thus the zero point energy). This higher level of stability 381
promotes the presence of isotopes with a higher atomic mass upon carbonate formation. Since 382
the amount of vibrational energy within a system determines the activation energy, the lighter 383
isotopes would have been incorporated into the initial CO2(g) created through Type I CPM and 384
the heavier, more stable isotopes became integrated into the denser CaCO3. Subsequent 385
enrichment during carbonate precipitation was then caused by Rayleigh distillation. This is the 386
only explanation that can be given at the current time which can explain the enrichment in 387
carbon isotopes. It is unlikely that the rapid precipitation rate observed in the system can 388
describe the carbon enrichment trend since the 1000ln13α(CaCO3-DIC) deviated from the carbon 389
isotopic fractionation between HCO3- and calcite (~1 ‰ as described by Romanek et al. (1992)) 390
as concentration of reactants (and the amount of DIC consumed) increased. If the faster 391
precipitating samples incorporated a greater isotopic signature from the DIC, they would have 392
approached 0 ‰ as the amount of consumed HCO3- grew, since there is only one carbon 393

M.Sc. Nicolas Randazzo; McMaster University- School of Geography and Earth Sciences
40
reservoir in the system. Therefore, the faster precipitating carbonates could not have been 394
incorporating the signature of the dominant DIC species at the pH in which it precipitated, 395
meaning the carbon trend could not have been significantly influenced by the DIC. 396
This effect from Type II CPM also explains, at least in part, the oxygen trend (whose 397
main reservoir is the formation water) in this particular system since the precipitation and CO2(aq) 398
production rates would have outpaced the time required for isotopes to exchange between two 399
phases. Therefore, the system was not given enough time to equilibrate with the water before the 400
carbonates precipitated and hence retained the signature of the enriched DIC species. This 401
process created the strong correlation of the aforementioned trend and can be great enough to 402
counter the attachment of lighter isotopes caused by the rapid precipitation rate. 403
The use of the passive CO2(g) degassing technique is the simplest and most elegant way to 404
precipitate calcium carbonates and most closely resembles the natural conditions in which 405
carbonates form. However, caution must be exercised under certain conditions such as this study 406
to precipitate CaCO3 with the aim of obtaining isotopic equilibrium to avoid any kinetic effects 407
over the course of CaCO3 precipitation. 408
2.4.7 Rayleigh Distillation and Carbon Isotope Enrichment in these Experiments 409
While the aforementioned processes describe why the amount of heavier isotopes under 410
initial conditions would have increased with concentration, the continued enrichment over the 411
time as the system continued to degas CO2 and form calcite can be explained through Rayleigh 412
distillation. While this process influenced both oxygen and carbon in this system, carbon was 413
the only isotope which was strictly affect by Rayleigh distillation. Figure 2.8 illustrates a 414
Rayleigh distillation curve which shows that the production of calcite produced an exponential 415
enrichment in the DIC reservoir as CaCO3 continued to precipitate and the residual fraction of 416
DIC declined. Guo et al. (2009) illustrated that kinetic isotope fractionation factors can result 417

M.Sc. Nicolas Randazzo; McMaster University- School of Geography and Earth Sciences
41
from changes in the amount of DIC within an aqueous solution associated with CO2 dehydration 418
and dihydroxylation and thereby influence the isotopic composition of the carbonates which 419
subsequently form. As stated in Guo et al. (2009) a Rayleigh distillation-based trend will occur 420
if the precipitation rate outpaces the time required for re-equilibration with the formation water, 421
which occurred in this system. This process is what caused the positive linear trend which was 422
observed in carbon and oxygen isotope fraction factors. The closed system of this study is an 423
ideal environment for Rayleigh distillation since the DIC reservoir was finite and the products 424
did not re-react with the reactants after formation. 425
Since carbonates grow gradually over a period of time, the portion of the crystal which 426
formed initially will have an isotopic composition that differs from those which precipitated 427
later. In the case of higher concentrated solutions, which precipitated CaCO3 more quickly, the 428
first carbonates to precipitate would have had elevated isotopic fractionation factors which were 429
further from equilibrium and those which formed later had fractionation factors which would 430
have been closer to the value suggested by Kim and O’Neil (1997) (i.e. the lower barrier of the 431
system). Thus, each individual isotopic fractionation factor presented in this study is not an 432
individual point, but an average of an entire spectrum of isotopic fractionation factors which 433
changed over the course of the experiment which is represented by an averaged value. The 434
magnitude of this effect could have increased with concentration and may explain why the 435
preliminary data at higher concentrations appear to suggest that the faster precipitating 436
carbonates of this study plateaued at a certain point. The same process would have occurred at 437
experiments synthesized using lower concentrations; however, this range would have been 438
smaller since they had less of an influence from CO2(aq) production and thereby experienced a 439
lower amount of kinetic effects during precipitation. 440

M.Sc. Nicolas Randazzo; McMaster University- School of Geography and Earth Sciences
42
While the data from the synthesized carbonates from this study reflect two processes 441
working in tandem with each other, the sample analyzed by Coplen (2007) grew at an extremely 442
slow rate and therefore cannot be affected by the incorporation of HCO3- ions which were not 443
given enough time to equilibrate with water after deprotonation. However, the secondary 444
enrichment process caused by CO2(g) degassing/CO2(aq) production could influence a slow 445
precipitating carbonate. As discussed above, the system described by Affek and Zaarur (2014) 446
was influenced by Type I CPM and had a similar oxygen isotope fractionation factor to the 5 447
mmolal samples of this study, which were influenced, at least in part, by Type II CPM. Thus 448
both Type I and II CPM have similar enrichment effects. The conditions observed at the air-449
water boundary in Affek and Zaarur (2014) are analogous to precipitation occurring within a thin 450
film in cave carbonates which form in the vadose zone (Kluge et al., 2014), however the calcite 451
sample analyzed by Coplen (2007) formed in phreatic conditions (Palmer, 2007) at a depth of 452
more than 5 m above the current level of ~ 30 m (Szabo et al., 1994). According to Kluge et al. 453
(2014), the Devil’s Hole sample precipitated through the following reaction: 454
Ca2+ + 2HCO3- ⇌ CaCO3 + CO2 + H2O 455
The production of CO2 as a by-product proves that it is possible that the mammillary calcite 456
studied by Coplen (2007) may have been influenced by Type II CPM. Given that Brown’s 457
Room, the chamber within Devil’s Hole where the sample analyzed by Coplen (2007) was taken 458
from, was isolated from the atmosphere and only had an air-filled area above the water’s surface, 459
the environment would have somewhat resembled the closed conditions in which this study 460
precipitated samples. Thus even a slow precipitating carbonate could be influenced by kinetic 461
effects introduced through Type II CPM due to the means in which it precipitated. If this is true, 462
then the rate in which these samples formed is irrelevant. Since the samples from this study 463
M.Sc. Nicolas Randazzo; McMaster University- School of Geography and Earth Sciences
43
which had been least affected by kinetic effects approached the value mentioned by Kim and 464
O’Neil (1997), it suggests that 28.3 ‰ represents the lowest limit attainable in this system (i.e. 465
equilibrium). Thus, it is not a question of whether laboratory timescales are sufficient to attain 466
equilibrium, but rather, if CO2(g) degassing or CO2(aq) production influenced the system. 467
2.4.8 Catalyzed mid-pH Experiments 468
The enzyme bovine carbonic anhydrase (CA) was utilized in this study to expedite 469
equilibration between DIC and water. It was believed that this may reduce the kinetic effects on 470
the precipitating carbonates by changing the isotopic signature of the DIC before it was 471
incorporated into the growing CaCO3. The CA would hasten the re-equilibration of CO32- ions 472
which had deprotonated from HCO3- and also potentially convert some of the isotopically light 473
CO2(aq) which was produced as a by-product from Type II CPM back into HCO3- via metal ion 474
catalysis, causing some light isotopes to have a second opportunity to become incorporated into 475
the carbonate. The presence of CA would have altered the signature of the DIC compared to the 476
uncatalyzed experiments and hence influenced the oxygen isotope fractionation of the calcium 477
carbonate. 478
A comparison of the oxygen and carbon isotope fractionation factors between the 479
uncatalyzed NM and PSA experiments to those synthesized using low concentrations of CA 480
illustrate that these samples all of the samples are approximately within analytical error of each 481
other (with the exception of the 25 mmolal samples for the PSA experiments). This similarity 482
could be because the precipitation rate and CO2(aq) production in this system always outpaced the 483
equilibration time between DIC and water (Table 2.6 and Figure 2.9). The 25 mmolal PSA 484
experiments which were catalyzed using low CA concentrations are close to the value suggested 485
by Coplen (2007), however given that these were the fastest experiments which utilized CA, it is 486
likely that this is merely coincidental and that some unknown factor is what caused this 487

M.Sc. Nicolas Randazzo; McMaster University- School of Geography and Earth Sciences
44
deviation. Most of these low CA samples were synthesized using the PSA technique, which was 488
deemed to have had the slowest precipitation rate of all the techniques used, as illustrated by the 489
distinctively low 1000ln18α(CaCO3-H2O) and 1000ln13α(CaCO3-DIC) values shown in Figure 2.6. 490
Therefore, while no absolute precipitation rate was determined in this study, the similarity 491
between the catalyzed and uncatalyzed PSA experiments suggests that even the slowest forming 492
carbonates in the system grew rapid enough to prevent CA from having any effect (Figure 2.9). 493
Additionally, the 25 mmolal samples which were precipitated in the presence of 38μM of 494
CA were closer to the equilibrium fractionation factor described by Kim and O’Neil (1997) and 495
had a similar oxygen isotope fractionation factor (i.e. within analytical error) to the uncatalyzed 496
experiments at the same concentration. This similarity further suggests that some kinetic effects 497
must have still occurred, even at these concentrations of CA, since the 1000ln18α(CaCO3
-H2
O) did not 498
further approach either of the values of Kim and O’Neil (19997) or Coplen (2007). This 499
suggests that the precipitation rate and the enrichment due to Type II CPM are occurring 500
extremely quickly and that, regardless of the concentration of CA used, it cannot establish 501
oxygen isotope equilibrium in this system. However, the large variability in the 15 mmolal data 502
may suggest the high CA concentration may start to influence the system as the precipitation rate 503
approached that of the 15 mmolal samples. 504
The higher concentration of CA did not affect the 1000ln13α(CaCO3-DIC) and cause the 505
system to approach the carbon isotope equilibrium reported by Romanek et al. (1992) and Mook 506
(2000). Interestingly, an isotopic analysis of the CA used in this study performed on a Costech 507
Elemental Combustion System (ECS) 4010 found that the enzyme has a carbon isotope signature 508
of ~ -13 ‰. However, given that the carbon atoms within this enzyme are only present within the 509

M.Sc. Nicolas Randazzo; McMaster University- School of Geography and Earth Sciences
45
inactive sites and not the portion which interacts with the water molecule, it is unlikely that this 510
secondary reservoir could influence the carbon reservoir. 511
While catalytic effects of CA are widely known to rapidly facilitate the interconversion 512
of CO2(aq) and water to HCO3- and a liberated H+ proton, it cannot establish equilibrium within 513
fast participating carbonates such as speleothems. The presence of CA in mammals, plants, and 514
prokaryotes are due to a family of at least five different genes believed to have been produced 515
through convergent evolution (Hewett-Emmett and Tashian, 1996; Liljas and Laurberg, 2000). 516
The enzyme is important for the metabolic processes of a variety of organisms, including 517
carbonaceous species such as some corals (Furla et al., 2000; Moya et al., 2008; Bertucci et al, 518
2011; Tambutté et al., 2011) and possibly foraminifera (ter Kuile.,1989), as well as other aquatic 519
organisms such as algae (Bowes, 1969; Badger, 1994; Raven, 1995; Sültemeyer, 1998; Aizawa 520
and Miyachi, 1986; Moroney et al., 2001; Soto et al., 2006) and sponges (Hatch, 1980, Jackson 521
et al., 2007; Voigt et al., 2014). It can therefore easily enter the carbonate system through a 522
variety of ways. CA is also found in all types of plants (Bradfield, 1947; Lamb, 1977; Badger, 523
1994; Moroney et al., 2001; Tripp et al. (2001)) meaning that drip water in caves which passed 524
through vegetation will also carry a signature from the enzyme. If either the precipitation rate or 525
the amount of CO2 degassing/production is slow enough and the concentration of CA is such that 526
it hastens the equilibration rate, then the carbonates may precipitate in or close to isotopic 527
equilibrium. However, similar to the surface samples of Affek and Zaarur (2014), the CO2(g) 528
degassing along the thin film of water over a speleothem occurs rapidly, subsequently causing 529
precipitation rate to also occur quickly. These processes then outpace the equilibration time and 530
introduce the kinetic effects similar to what was observed in this study. Given that this study 531

M.Sc. Nicolas Randazzo; McMaster University- School of Geography and Earth Sciences
46
utilized a large amount of CA and still observed these effects, it seems likely that the use of CA 532
to obtain equilibrium has its limits. 533
2.4.9 Precipitation Amount and Percent Yield 534
While the carbonates precipitated in this study did not precipitate 100% of the DIC, they 535
do help to point out the issues with identifying isotopic equilibrium between carbonate and water 536
(Table 6). These samples may also call into question whether the value proposed by Coplen 537
(2007) truly represents this elusive value or if it simply represents a natural barrier in which the 538
isotopic composition of carbonates in this system had difficulty penetrating. The similarity 539
between the 25 and 50 mmolal experiments further supports this claim since increasing the 540
amount of precipitated DIC resulted in virtually no difference in the oxygen isotope fractionation 541
factor. 542
2.4.10 Kinetic Effects in the High pH Experiments 543
Unlike the mid-pH conditions, CO2(aq) is not produced as a by-product under this system 544
because calcium carbonate is formed through the double displacement between Na2CO3 and 545
CaCl2: 546
Ca2+ + CO32- ⇌ CaCO3 547
Thus the 1000ln13α(CaCO3-DIC) values in these experiments did not show the aforementioned 548
enrichment trend observed with the mid-pH samples. Instead, each concentration had a relatively 549
similar carbon isotope fractionation factor (Figure 2.10). 550
In contrast, the 1000ln18α(CaCO3-H2O) values did not follow the trend seen in the mid-pH 551
experiments (Figure 2.10). Instead, the oxygen isotope fractionation factor values decreased 552
with increasing solution concentration, with 5 mmolal samples being close to the equilibrium 553
value proposed by Kim and O’Neil (1997) and higher concentration incorporating CO32- and 554

M.Sc. Nicolas Randazzo; McMaster University- School of Geography and Earth Sciences
47
having a smaller isotopic fractionation factor which approached the fractionation factor line 555
outlined by Beck et al. (2005) and Kim et al. (2006). This resulted in a negative linear 556
correlation between the 1000ln18α(CaCO3-H2O) and 1000ln13α(CaCO3-DIC) values. This observation is 557
similar to what was described by Zeebe et al. (1999); however, these samples precipitated under 558
the influence of kinetic effects and further build upon the conclusions of Deines (2005) and Kim 559
et al. (2006) that pH only influences isotopic fractionation factor under non-equilibrium 560
conditions. In this system, it is believed that the value suggested by Kim and O’Neil (1997) 561
represents the upper limit of the system and the CO3- the lowest. While the mechanisms causing 562
deviation from isotopic equilibrium between calcite and water may slightly vary from the mid-563
pH samples, the oxygen isotope fractionation factor of this system still illustrates that there is a 564
greater amount of kinetic effects introduced into the system as the samples deviate from the 565
value proposed by Kim and O’Neil (1997). 566
The increase in the saturation index from 2.83 to 3.59 observed with the rising 567
concentration resulted in a faster precipitation rate than those seen in the mid-pH solutions 568
(which did not exceed 2.49) (Table 2.2). Table 2.7 and 2.8, which illustrate the total amount of 569
DIC precipitated in the system, show that up to 98 % of the DIC reservoir was consumed during 570
the high pH, 25 mmolal experiments, an amount greater than any other experiment in this study. 571
This higher amount of the dominant DIC species would have been incorporated within the 572
growing carbonate. This prevented the isotopic composition from being limited by an isotopic 573
barrier like the mid-pH samples were and provided a similar effect to the BaCO3 experiments of 574
Beck et al. (2005) and Kim et al. (2006). However, the precipitation rate of BaCO3 is faster than 575
that of the high pH samples and precipitated the full amount of DIC possible. Therefore, the 576
oxygen isotope fractionation factor of those samples would have been closer to that of the CO32- 577

M.Sc. Nicolas Randazzo; McMaster University- School of Geography and Earth Sciences
48
ions than the samples precipitated in this study and thus had a 1000ln18α(CaCO3-H2O) value which 578
closer reflected the isotopic signature of this ion (24.19 ± 0.26 ‰ for Beck et al. (2005) and 579
23.71 ± 0.08 ‰ for Kim et al. (2006)). 580
2.4.11 Equilibration Time in the High pH System 581
The difference between the data collected from the 7 and 50 day experiments for carbon 582
as well as oxygen isotope fractionation factors are within analytical error (~0.2 ‰) and can 583
therefore be considered to be similar to each other (Figure 2.11). If the differences were larger, 584
then these experimental observations would imply that most of the oxygen isotope equilibration 585
between DIC and water at this pH could not be completed within 7 days. In other words, the 586
similarity between the 7 and 50 day data suggests that oxygen isotope equilibrium between DIC 587
and water at the pH of this system (~11.07) can be attained within one week. This supports the 588
equilibration time used in Kim et al. (2006), but contrasts that of Beck et al. (2005). Kim et al. 589
(2006) utilized pH levels of 10.08 to 10.75 in their experiments, resulting in CO32- being 590
composed of 41.85 to 76.94% of the total DIC. Since the pH was around 11.07 in this study, the 591
amount of CO32- ranged from approximately 89.6 to 93.14% of the total DIC. In contrast, Beck 592
et al. (2005) synthesized their carbonates at pH levels of 11.83, 11.87, and 12.20 in which CO32- 593
would have taken up a ~100% of the total DIC. This suggests that the time required for oxygen 594
isotope equilibration between DIC and water might change at an exponential rate as near 595
complete dominance of one carbon species over its counterparts is attained. This is due to the 596
effect of CO2 hydration and the facilitation of isotopic exchange between CO2(aq) and water, the 597
rate of which decreases as the amount of the proton containing DIC species declines. Once 598
CO32- becomes dominant, this carbon species has to overcome a high energy barrier to continue 599
isotopic exchange. The similarity in oxygen isotope equilibration time between this study and 600
M.Sc. Nicolas Randazzo; McMaster University- School of Geography and Earth Sciences
49
Kim et al. (2006), despite the differences in speciation, suggests that the oxygen isotope 601
equilibration time will remain somewhat stagnant as long as at least 10.4 to 6.86 % of the DIC is 602
HCO3-, allowing some degree of CO2 hydration to occur. Once CO3
2- attains complete 603
dominance, CO2 hydration is not as fast as it could be at lower pH levels. It is for this reason 604
that the effect of CA also decreases as pH rises (Watkins et al., 2013). 605
2.5 Conclusion 606
The findings of this research illustrate some of the processes which can influence the 607
isotopic fractionation of carbonates precipitated out of equilibrium. Samples believed to have 608
undergone the highest amount of kinetic effects have 1000ln18α(CaCO3-H2O) values which are close 609
to the one analyzed by Coplen (2007), suggesting that the value proposed by Kim and O’Neil 610
(1997) is closer to true equilibrium. These kinetic effects are believed to have been caused by a 611
combination of both the incorporation of CO32- ions which were not given enough to equilibrate 612
after deprotonation and Type II CPM caused by the production of isotopically light CO2(aq). 613
However, the magnitude of these effects in relation to each other is unknown. This study also 614
proposes that the utilization of NaHCO3 and CaCl2- H2O to precipitate carbonates in this system 615
cannot be used to precipitate carbonates in equilibrium since the resultant chemical reaction 616
naturally causes an isotopic enrichment of the DIC due to CO2 production caused by Type II 617
CPM. The amount of CO2(aq) production and precipitation rate under these conditions outpaced 618
the equilibration time even in the presence of varying concentrations of CA, meaning that this 619
catalyzing enzyme may not be able to establish equilibrium in fast growing carbonates such as 620
speleothems. 621
The experiments conducted at high pH (~11.07) achieved equilibrium between DIC and 622
water within 7 days as stated in Kim et al. (2006), which contrasts with the time found by Beck 623

M.Sc. Nicolas Randazzo; McMaster University- School of Geography and Earth Sciences
50
et al. (2005). This might be due to the varying presence of CO32- ions present at the differing pH 624
levels. It was also found that, unlike the mid-pH system, the 1000ln18α(CaCO3-H2O) increased with 625
decreasing concentration. It is unlikely that Type II CPM affected this system since CO2(aq) is 626
not formed as a by-product of the reaction which produced these carbonates. Thus the oxygen 627
isotope fractionation factors of the samples precipitated in these experiments were strictly due to 628
the fast precipitation rate and the incorporation of isotopically lighter CO32-, which was dominant 629
at this pH. This caused a deviation from initial isotopic equilibrium between carbonate and 630
water. The 1000ln13α(CaCO3-DIC) did not change in this system with increasing concentration due 631
to the lack of CO2(aq) production. 632
The findings of this study suggest that laboratory timescales are sufficient to establish 633
isotopic equilibrium and that a slow precipitation rate does not guarantee that no kinetic effects 634
occurred. The establishment of isotopic equilibrium is not strictly dependent on precipitation 635
rate alone, but a combination of equilibration time, amount of CO2 degassing/production, and 636
precipitation rate. It is not whether the precipitation rate is fast or not, but rather if the 637
precipitation rate and/or CO2 degassing/production are faster than the time required for 638
equilibration. If this is not the case, then any system, natural or artificial, can attain isotopic 639
equilibrium. 640
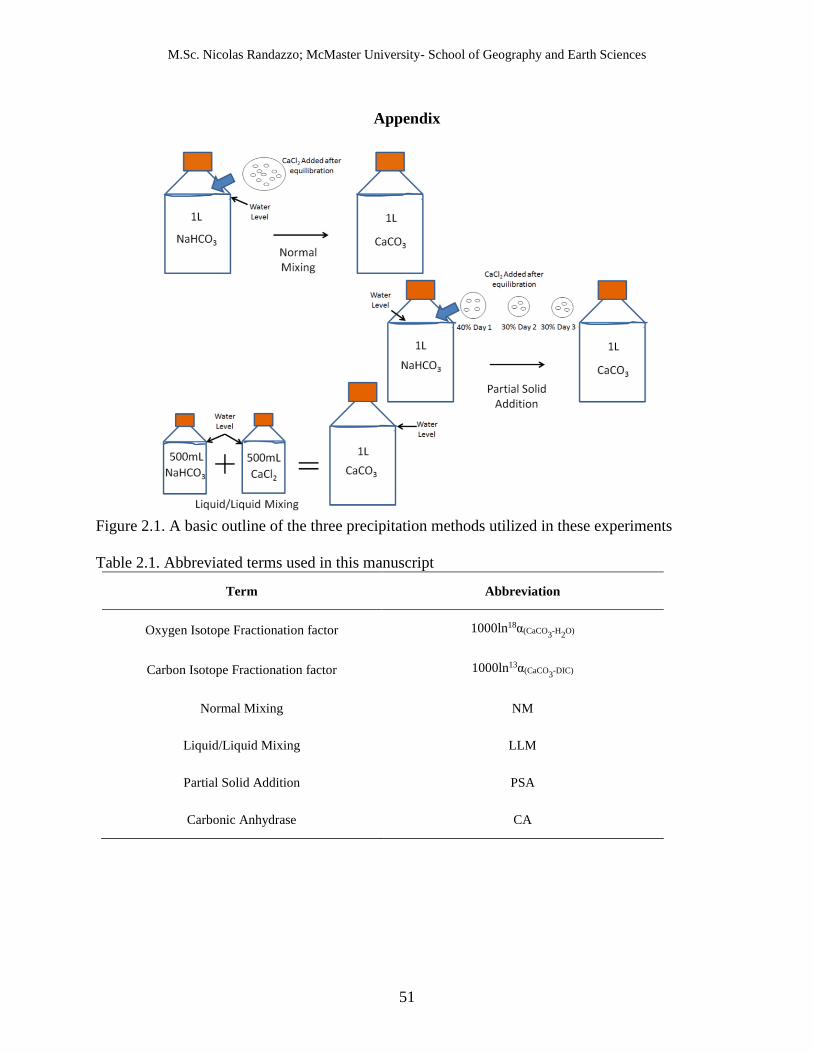
M.Sc. Nicolas Randazzo; McMaster University- School of Geography and Earth Sciences
51
Appendix
Figure 2.1. A basic outline of the three precipitation methods utilized in these experiments
Table 2.1. Abbreviated terms used in this manuscript
Term Abbreviation
Oxygen Isotope Fractionation factor 1000ln18α(CaCO3-H
2O)
Carbon Isotope Fractionation factor 1000ln13α(CaCO3-DIC)
Normal Mixing NM
Liquid/Liquid Mixing LLM
Partial Solid Addition PSA
Carbonic Anhydrase CA

M.Sc. Nicolas Randazzo; McMaster University- School of Geography and Earth Sciences
52
Figure 2.2. The results of the some of the XRD analyses performed in this study for the typical
results for all closed experiments (A), the open experiments conducted under high ionic strengths
(B), and the open experiments conducted under low ionic strengths without the presence of NaCl
(C). The green arrows in (C) illustrate some of the XRD peaks which show the presence of
vaterite within the system.
vaterite
C
B
A

M.Sc. Nicolas Randazzo; McMaster University- School of Geography and Earth Sciences
53
Figure 2.3. Relationship between oxygen isotope fractionation factor A) and carbon isotope
fractionation factor (B) with final pH. The dashed line indicates the starting pH. It was found
that pH declined as concentration increased.
y = -0.898x + 35.205R² = 0.7442
28.40
28.60
28.80
29.00
29.20
29.40
29.60
29.80
30.00
6 6.5 7 7.5 8 8.5
10
00
lnα
CaC
O3
-H2O
Final pH
5 mmol
15 mmol
25 mmol
Initial pH
y = -2.095x + 16.519R² = 0.7923
0.00
0.50
1.00
1.50
2.00
2.50
3.00
3.50
4.00
4.50
6 6.5 7 7.5 8 8.5
10
00
lnα
CaC
O3
-DIC
Final pH
5 mmol
15 mmol
25 mmol
Initial pH
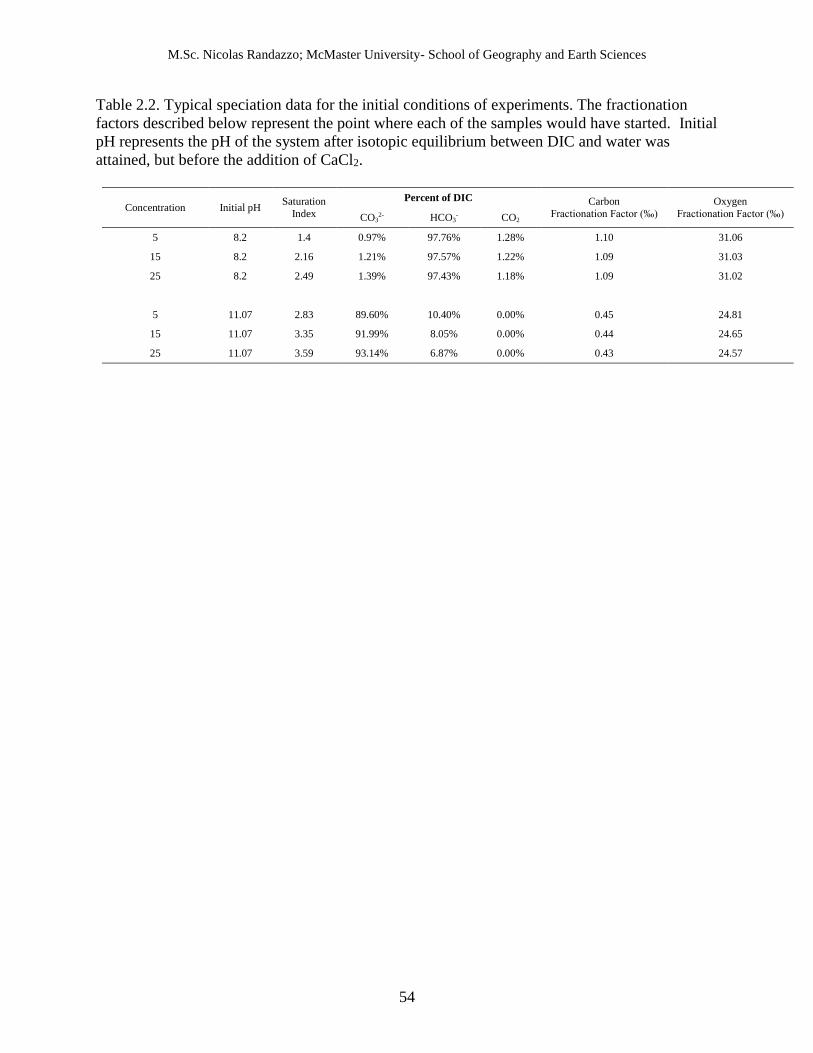
M.Sc. Nicolas Randazzo; McMaster University- School of Geography and Earth Sciences
54
Table 2.2. Typical speciation data for the initial conditions of experiments. The fractionation
factors described below represent the point where each of the samples would have started. Initial
pH represents the pH of the system after isotopic equilibrium between DIC and water was
attained, but before the addition of CaCl2.
Concentration Initial pH Saturation
Index
Percent of DIC Carbon
Fractionation Factor (‰)
Oxygen
Fractionation Factor (‰) CO32- HCO3
- CO2
5 8.2 1.4 0.97% 97.76% 1.28% 1.10 31.06
15 8.2 2.16 1.21% 97.57% 1.22% 1.09 31.03
25 8.2 2.49 1.39% 97.43% 1.18% 1.09 31.02
5 11.07 2.83 89.60% 10.40% 0.00% 0.45 24.81
15 11.07 3.35 91.99% 8.05% 0.00% 0.44 24.65
25 11.07 3.59 93.14% 6.87% 0.00% 0.43 24.57

M.Sc. Nicolas Randazzo; McMaster University- School of Geography and Earth Sciences
55
T Table 2.3. Typical speciation data for the final conditions of experiments. The increase in deviation for both carbon and oxygen for the mid-pH 1
experiments experiments illustrates the deviation from equilibrium with increasing concentration. 2
3
Experiment Type Sample ID Final pH Concentration
(mmolal) 1000ln13α(CaCO
3-DIC)
Diff. in δ13CDIC
(Initial and
Final)
1000ln18α(CaCO3-H
2O)
Diff. in δ18OH2O
(Initial and Final)
Normal Mixing
MRSI-NR-2-1w-5c NM 7.22 5 N/A N/A 28.82 0.03
MRSI-NR-2-7w-5c NM 6.52 15 N/A N/A 28.95 0.00
MRSI-NR-2-1w-15c NM 6.52 15 N/A N/A 29.25 0.01
MRSI-NR-1-3w-15c NM 6.53 15 N/A N/A 29.36 0.00
MRSI-NR-1-3w-25c NM 6.28 25 N/A N/A 29.82 0.02
MRSI-NR-2-3w-25c NM 6.29 25 N/A N/A 29.68 0.02
MRSI-NR-1-50C NM 5.86 50 3.34 0.39 29.81 -0.01
MRSI-NR-2-50C NM 5.91 50 3.88 0.21 29.85 -0.04
MRSI-NR-1-25C-OB NM 6.34 25 3.76 -1.45 29.80 0.01
MRSI-NR-2-25C-OB NM 6.37 25 3.48 -1.36 29.83 0.02
Partial Solid Addition
MRSI-NR-1-5C-PSA 7.25 5 0.63 -0.15 28.53 -0.03
MRSI-NR-2-5C-PSA 7.31 5 0.61 -0.20 28.52 -0.03
MRSI-NR-1-15C-PSA 6.48 15 2.79 -0.33 29.08 -0.04
MRSI-NR-2-15C-PSA 6.56 15 2.63 -0.33 29.09 -0.03
MRSI-NR-1-5c-LLM 7.19 5 1.22 -0.08 28.98 0.00
Liquid/Liquid Mixing
MRSI-NR-2-5c-LLM 7.12 5 1.13 0.18 28.88 -0.01
MRSI-NR-1-7c-LLM 6.99 7 1.34 -0.06 28.63 -0.02
MRSI-NR-2-7c-LLM 6.86 7 1.63 -0.45 28.67 0.01
MRSI-NR-1-10c-LLM 6.65 10 1.70 -0.29 29.08 -0.01
High pH MRSI-NR-1-5c-50d 10.32 5 0.23 1.40 26.20 -0.02
MRSI-NR-1-25c-50d 10.72 25 0.19 1.85 25.22 0.01

M.Sc. Nicolas Randazzo; McMaster University- School of Geography and Earth Sciences
56
Table 2.4. Experimental Data for Oxygen from Calcite.
Sample ID
Ca2+ and
DIC conc. pH CA
CaCO3
(mg) δ 18OCaCO3 δ18OH
2O
ini δ18OH
2O
fin αCaCO
3-H
2O 1000ln18α(CaCO
3-H
2O)
MRSI-NR-2-1w-5c NM 5 Mid No 2 22.69 -6.46 -6.49 1.03 28.95
MRSI-NR-2-3w-5c NM 5 Mid No 2 22.40 -6.45 -6.5 1.03 28.67
MRSI-NR-1-7w-5c NM 5 Mid No 2 22.61 -6.54 -6.56 1.03 28.94
MRSI-NR-2-7w-5c NM 5 Mid No 3 22.53 -6.64 -6.64 1.03 28.94
MRSI-NR-2-1w-15c NM 15 Mid No 96 22.90 -6.54 -6.55 1.03 29.21
MRSI-NR-1-3w-15c NM 15 Mid No 91 22.39 -6.53 -6.53 1.03 28.69
MRSI-NR-1-5w-15c NM 15 Mid No 94 23.48 -6.39 -6.4 1.03 29.63
MRSI-NR-2-5w-15c NM 15 Mid No 81 22.80 -6.51 -6.51 1.03 29.08
MRSI-NR-1-7w-15c NM 15 Mid No 74 23.02 -6.56 -6.57 1.03 29.35
MRSI-NR-2-7w-15c NM 15 Mid No 79 22.95 -6.47 -5.72 1.03 28.43
MRSI-NR-2-1w-25c NM 25 Mid No 180 23.23 -6.49 -6.48 1.03 29.46
MRSI-NR-1-3w-25c NM 25 Mid No 210 23.26 -6.52 -6.54 1.03 29.56
MRSI-NR-2-3w-25c NM 25 Mid No 230 23.36 -6.48 -6.5 1.03 29.61
MRSI-NR-1-5w-25c NM 25 Mid No 246 22.67 -6.45 -6.44 1.03 28.87
MRSI-NR-1-7w-25c NM 25 Mid No 312 23.16 -6.54 -6.58 1.03 29.50
MRSI-NR-2-7w-25c NM 25 Mid No 201 23.03 -6.46 -6.44 1.03 29.23
MRSI-NR-2-1w-5c NM 5 Mid No 2 22.59 -6.46 -6.49 1.03 28.85
MRSI-NR-2-3w-5c NM 5 Mid No 2 22.77 -6.45 -6.5 1.03 29.04
MRSI-NR-1-7w-5c NM 5 Mid No 4 22.45 -6.54 -6.56 1.03 28.78
MRSI-NR-2-7w-5c NM 5 Mid No 8 22.46 -6.64 -6.64 1.03 28.87
MRSI-NR-2-1w-15c NM 15 Mid No 187 23.47 -6.54 -6.55 1.03 29.77
MRSI-NR-1-3w-15c NM 15 Mid No 164 23.25 -6.53 -6.53 1.03 29.53
MRSI-NR-1-5w-15c NM 15 Mid No 182 22.18 -6.39 -6.4 1.03 28.36

M.Sc. Nicolas Randazzo; McMaster University- School of Geography and Earth Sciences
57
MRSI-NR-2-5w-15c NM 15 Mid No 152 22.98 -6.51 -6.51 1.03 29.25
MRSI-NR-1-7w-15c NM 15 Mid No 125 23.03 -6.56 -6.57 1.03 29.36
MRSI-NR-2-7w-15c NM 15 Mid No 123 23.03 -6.47 -5.72 1.03 28.51
MRSI-NR-2-1w-25c NM 25 Mid No 234 23.28 -6.49 -6.48 1.03 29.51
MRSI-NR-1-3w-25c NM 25 Mid No 265 23.19 -6.52 -6.54 1.03 29.49
MRSI-NR-2-3w-25c NM 25 Mid No 146 23.30 -6.48 -6.5 1.03 29.55
MRSI-NR-1-5w-25c NM 25 Mid No 238 23.31 -6.45 -6.44 1.03 29.50
MRSI-NR-1-7w-25c NM 25 Mid No 126 23.32 -6.54 -6.58 1.03 29.65
MRSI-NR-2-7w-25c NM 25 Mid No 241 23.18 -6.46 -6.44 1.03 29.38
MRSI-NR-2-1w-5c NM 5 Mid No 3 22.56 -6.46 -6.49 1.03 28.82
MRSI-NR-2-3w-5c NM 5 Mid No 6 23.01 -6.45 -6.5 1.03 29.27
MRSI-NR-2-5w-5c NM 5 Mid No 1 22.33 -6.54 -6.47 1.03 28.58
MRSI-NR-1-7w-5c NM 5 Mid No 5 22.45 -6.55 -6.56 1.03 28.78
MRSI-NR-2-7w-5c NM 5 Mid No 3 22.54 -6.64 -6.64 1.03 28.95
MRSI-NR-2-1w-15c NM 15 Mid No 180 23.21 -6.54 -6.55 1.03 29.52
MRSI-NR-1-3w-15c NM 15 Mid No 135 23.12 -6.53 -6.53 1.03 29.41
MRSI-NR-1-5w-15c NM 15 Mid No 143 23.27 -6.39 -6.4 1.03 29.42
MRSI-NR-2-5w-15c NM 15 Mid No 174 23.10 -6.51 -6.51 1.03 29.37
MRSI-NR-1-7w-15c NM 15 Mid No 172 23.15 -6.56 -6.57 1.03 29.48
MRSI-NR-2-7w-15c NM 15 Mid No 97 23.17 -6.47 -5.72 1.03 28.65
MRSI-NR-2-1w-25c NM 25 Mid No 246 23.53 -6.49 -6.48 1.03 29.76
MRSI-NR-1-3w-25c NM 25 Mid No 297 23.53 -6.52 -6.54 1.03 29.82
MRSI-NR-2-3w-25c NM 25 Mid No 314 23.43 -6.48 -6.5 1.03 29.68
MRSI-NR-1-5w-25c NM 25 Mid No 212 23.58 -6.45 -6.44 1.03 29.77
MRSI-NR-1-7w-25c NM 25 Mid No 289 23.52 -6.54 -6.58 1.03 29.85
MRSI-NR-2-7w-25c NM 25 Mid No 301 23.25 -6.46 -6.44 1.03 29.45
MRSI-NR 25 1-NM 25 Mid No 329 23.52 -6.45 -6.47 1.03 29.74
MRSI-NR 50MM 1-NM 50 Mid No 1432 23.88 -6.21 -6.2 1.03 29.81
MRSI-NR 50MM 2-NM 50 Mid No 1398 24.02 -6.14 -6.1 1.03 29.85
MRSI-NR 25 OB 1-NM 25 Mid No 328 23.29 -6.74 -6.75 1.03 29.80

M.Sc. Nicolas Randazzo; McMaster University- School of Geography and Earth Sciences
58
MRSI-NR 25 OB 2-NM 25 Mid No 391 23.37 -6.69 -6.71 1.03 29.83
MRSI-NR-1-5c-LLM 5 Mid No 3 22.76 -6.46 -6.46 1.03 28.98
MRSI-NR-2-5c-LLM 5 Mid No 3 22.66 -6.47 -6.46 1.03 28.88
MRSI-NR-1-7c-LLM 7 Mid No 7 22.46 -6.42 -6.40 1.03 28.63
MRSI-NR-2-7c-LLM 7 Mid No 6 22.48 -6.41 -6.42 1.03 28.67
MRSI-NR-1-10c-LLM 10 Mid No 98 22.86 -6.46 -6.45 1.03 29.08
MRSI-NR-2-10c-LLM 10 Mid No 111 22.56 -6.42 -6.42 1.03 28.74
MRSI-NR-1-15c-LLM 15 Mid No 110 23.32 -6.49 -6.49 1.03 29.56
MRSI-NR-2-15c-LLM 15 Mid No 90 23.38 -6.47 -6.47 1.03 29.60
MRSI-NR-1-25c-LLM 25 Mid No 260 23.43 -6.47 -6.51 1.03 29.70
MRSI-NR-2-25c-LLM 25 Mid No 300 23.43 -6.48 -6.54 1.03 29.72
MRSI-NR-1-5C-PSA 5 Mid No 4 22.29 -6.49 -6.46 1.03 28.53
MRSI-NR-2-5C-PSA 5 Mid No 43 22.30 -6.47 -6.44 1.03 28.52
MRSI-NR-1-15C-PSA 15 Mid No 86 22.91 -6.45 -6.41 1.03 29.08
MRSI-NR-2-15C-PSA 15 Mid No 94 22.93 -6.43 -6.40 1.03 29.09
MRSI-NR-1-25C-PSA 25 Mid No 140 23.02 -6.47 -6.43 1.03 29.21
MRSI-NR-2-25C-PSA 25 Mid No 97 23.09 -6.49 -6.45 1.03 29.30
MRSI-NR 5mmolal 5CA PSA2 5 Mid Yes 3 22.21 -6.46 -6.43 1.03 28.41
MRSI-NR 5mmolal 15CA PSA2 5 Mid Yes 2 22.32 -6.45 -6.41 1.03 28.51
MRSI-NR 5mmolal 25CA PSA2 5 Mid Yes 3 22.37 -6.47 -6.46 1.03 28.60
MRSI-NR 15mmolal 5CA PSA2 15 Mid Yes 190 23.11 -6.49 -6.46 1.03 29.33
MRSI-NR 15mmolal 15CA PSA2 15 Mid Yes 230 22.96 -6.47 -6.49 1.03 29.21
MRSI-NR 15mmolal 25CA PSA2 15 Mid Yes 215 22.89 -6.48 -6.47 1.03 29.13
MRSI-NR 25mmolal 5CA PSA2 25 Mid Yes 218 23.38 -6.46 -6.51 1.03 29.64
MRSI-NR 25mmolal 15CA PSA2 25 Mid Yes 245 23.42 -6.5 -6.48 1.03 29.65
MRSI-NR 25mmolal 25CA PSA2 25 Mid Yes 350 23.49 -6.46 -6.43 1.03 29.67
MRSI-NR 15mmolal 38μM PSA 1 15 Mid Yes 300 23.23 -6.46 -6.41 1.03 29.39
MRSI-NR 15mmolal 38μM PSA 2 15 Mid Yes 275 23.12 -6.45 -6.43 1.03 29.31
MRSI-NR 25mmolal 38μM PSA 1 25 Mid Yes 433 22.92 -6.43 -6.44 1.03 29.12
MRSI-NR 25mmolal 38μM PSA 2 25 Mid Yes 350 22.87 -6.46 -6.49 1.03 29.12
MRSI-NR 5mm 5CA 5 Mid Yes 3 22.54 -6.44 -6.46 1.03 28.77
MRSI-NR 5mm 15CA 5 Mid Yes 3 22.57 -6.44 -6.43 1.03 28.77
MRSI-NR 5mm 25CA 5 Mid Yes 2 22.76 -6.46 -6.48 1.03 29.01
MRSI-NR 25mm 5CA 25 Mid Yes 204 23.60 -6.43 -6.41 1.03 29.76
MRSI-NR 25mm 15CA 25 Mid Yes 251 23.40 -6.44 -6.43 1.03 29.59
NR 7d 10pH 5 -1 5 High No 480 20.04 -6.45 -6.42 1.03 26.28

M.Sc. Nicolas Randazzo; McMaster University- School of Geography and Earth Sciences
59
NR 7d 10pH 5 -2 5 High No 420 19.98 -6.43 -6.41 1.03 26.21
NR 50d 10pH 5- 1 5 High No 440 19.99 -6.41 -6.39 1.03 26.20
NR 50d 10pH 5- 2 5 High No 450 19.95 -6.41 -6.37 1.03 26.14
NR 7d 10pH 25- 1 25 High No 1900 18.76 -6.40 -6.38 1.03 24.99
NR 7d 10pH 25- 2 25 High No 1800 18.77 -6.40 -6.38 1.03 25.00
NR 7d 10pH 25- 3 25 High No 1600 18.76 -6.40 -6.4 1.03 25.01
NR 7d 10pH 25- 4 25 High No 1300 18.74 -6.41 -6.43 1.03 25.02
NR 50d 10pH 50 25- 3 25 High No 1500 18.94 -6.43 -6.44 1.03 25.22
NR 50d 10pH 50 25- 4 25 High No 1900 18.94 -6.40 -6.39 1.03 25.17
NR 50d 10pH 50 25- 5 25 High No 1800 19.01 -6.39 -6.36 1.03 25.21
NR 50d 10pH 50 25- 6 25 High No 2000 19.01 -6.40 -6.35 1.03 25.20
Table 2.5. Experimental Data of Carbon for Calcite
Sample ID
Ca2+ and
DIC conc. pH
CaCO3
(mg) δ13CCaCO3
δ13CNaHCO3
or Na2
CO3
DICini
(mmolal) δ13CDICini
DICfin
(mmolal) δ13CDICfin
αCaCO3-
DIC
1000ln13α(CaCO3-
DIC)
MRSI-NR-2-1w-5c NM 5 Mid 2 -24.01 -25.81 5.1 N/A 4.58 N/A N/A N/A
MRSI-NR-2-3w-5c NM 5 Mid 2 -24.32 -25.81 4.7 N/A 4.23 N/A N/A N/A
MRSI-NR-1-7w-5c NM 5 Mid 2 -23.90 -25.81 4.6 N/A 4.09 N/A N/A N/A
MRSI-NR-2-7w-5c NM 5 Mid 3 -24.25 -25.81 5 N/A 4.45 N/A N/A N/A
MRSI-NR-2-1w-15c NM 15 Mid 96 -22.99 -25.81 14.7 N/A 11.33 N/A N/A N/A
MRSI-NR-1-3w-15c NM 15 Mid 91 -24.31 -25.81 14.8 N/A 10.95 N/A N/A N/A
MRSI-NR-1-5w-15c NM 15 Mid 94 -22.45 -25.81 14.6 N/A 11.53 N/A N/A N/A
MRSI-NR-2-5w-15c NM 15 Mid 81 -22.83 -25.81 15.1 N/A 11.33 N/A N/A N/A
MRSI-NR-1-7w-15c NM 15 Mid 74 -22.86 -25.81 15 N/A 11.40 N/A N/A N/A
MRSI-NR-2-7w-15c NM 15 Mid 79 -22.13 -25.81 14.9 N/A 11.32 N/A N/A N/A
MRSI-NR-2-1w-25c NM 25 Mid 180 -22.51 -25.81 24.2 N/A 13.07 N/A N/A N/A
MRSI-NR-1-3w-25c NM 25 Mid 210 -23.05 -25.81 24.9 N/A 13.20 N/A N/A N/A

M.Sc. Nicolas Randazzo; McMaster University- School of Geography and Earth Sciences
60
MRSI-NR-2-3w-25c NM 25 Mid 230 -22.31 -25.81 24.7 N/A 14.57 N/A N/A N/A
MRSI-NR-1-5w-25c NM 25 Mid 246 -23.24 -25.81 24.8 N/A 14.19 N/A N/A N/A
MRSI-NR-1-7w-25c NM 25 Mid 312 -22.49 -25.81 24.9 N/A 13.94 N/A N/A N/A
MRSI-NR-2-7w-25c NM 25 Mid 201 -22.61 -25.81 24.6 N/A 13.28 N/A N/A N/A
MRSI-NR-2-1w-5c NM 5 Mid 2 -24.49 -25.81 5.1 N/A 4.58 N/A N/A N/A
MRSI-NR-2-3w-5c NM 5 Mid 2 -23.43 -25.81 4.7 N/A 4.23 N/A N/A N/A
MRSI-NR-1-7w-5c NM 5 Mid 4 -24.15 -25.81 4.6 N/A 4.09 N/A N/A N/A
MRSI-NR-2-7w-5c NM 5 Mid 8 -24.35 -25.81 5 N/A 4.45 N/A N/A N/A
MRSI-NR-2-1w-15c NM 15 Mid 187 -23.11 -25.81 14.7 N/A 11.33 N/A N/A N/A
MRSI-NR-1-3w-15c NM 15 Mid 164 -22.53 -25.81 14.8 N/A 10.95 N/A N/A N/A
MRSI-NR-1-5w-15c NM 15 Mid 182 -24.05 -25.81 14.6 N/A 11.53 N/A N/A N/A
MRSI-NR-2-5w-15c NM 15 Mid 152 -23.54 -25.81 15.1 N/A 11.33 N/A N/A N/A
MRSI-NR-1-7w-15c NM 15 Mid 125 -23.20 -25.81 15 N/A 11.40 N/A N/A N/A
MRSI-NR-2-7w-15c NM 15 Mid 123 -23.21 -25.81 14.9 N/A 11.32 N/A N/A N/A
MRSI-NR-2-1w-25c NM 25 Mid 234 -22.85 -25.81 24.2 N/A 13.07 N/A N/A N/A
MRSI-NR-1-3w-25c NM 25 Mid 265 -22.98 -25.81 24.9 N/A 13.20 N/A N/A N/A
MRSI-NR-2-3w-25c NM 25 Mid 146 -22.44 -25.81 24.7 N/A 14.57 N/A N/A N/A
MRSI-NR-1-5w-25c NM 25 Mid 238 -22.58 -25.81 24.8 N/A 14.19 N/A N/A N/A
MRSI-NR-1-7w-25c NM 25 Mid 126 -22.74 -25.81 24.9 N/A 13.94 N/A N/A N/A
MRSI-NR-2-7w-25c NM 25 Mid 241 -22.68 -25.81 24.6 N/A 13.28 N/A N/A N/A
MRSI-NR-2-1w-5c NM 5 Mid 3 -24.36 -25.81 5.1 N/A 4.58 N/A N/A N/A
MRSI-NR-2-3w-5c NM 5 Mid 6 -23.10 -25.81 4.7 N/A 4.23 N/A N/A N/A
MRSI-NR-2-5w-5c NM 5 Mid 1 -24.00 -25.81 4.6 N/A 4.23 N/A N/A N/A
MRSI-NR-1-7w-5c NM 5 Mid 5 -24.27 -25.81 5 N/A 4.09 N/A N/A N/A
MRSI-NR-2-7w-5c NM 5 Mid 3 -24.30 -25.81 4.7 N/A 4.45 N/A N/A N/A
MRSI-NR-2-1w-15c NM 15 Mid 180 -22.96 -25.81 14.8 N/A 11.41 N/A N/A N/A
MRSI-NR-1-3w-15c NM 15 Mid 135 -23.06 -25.81 14.6 N/A 10.80 N/A N/A N/A
MRSI-NR-1-5w-15c NM 15 Mid 143 -22.56 -25.81 15.1 N/A 11.93 N/A N/A N/A
MRSI-NR-2-5w-15c NM 15 Mid 174 -23.05 -25.81 14.9 N/A 11.18 N/A N/A N/A
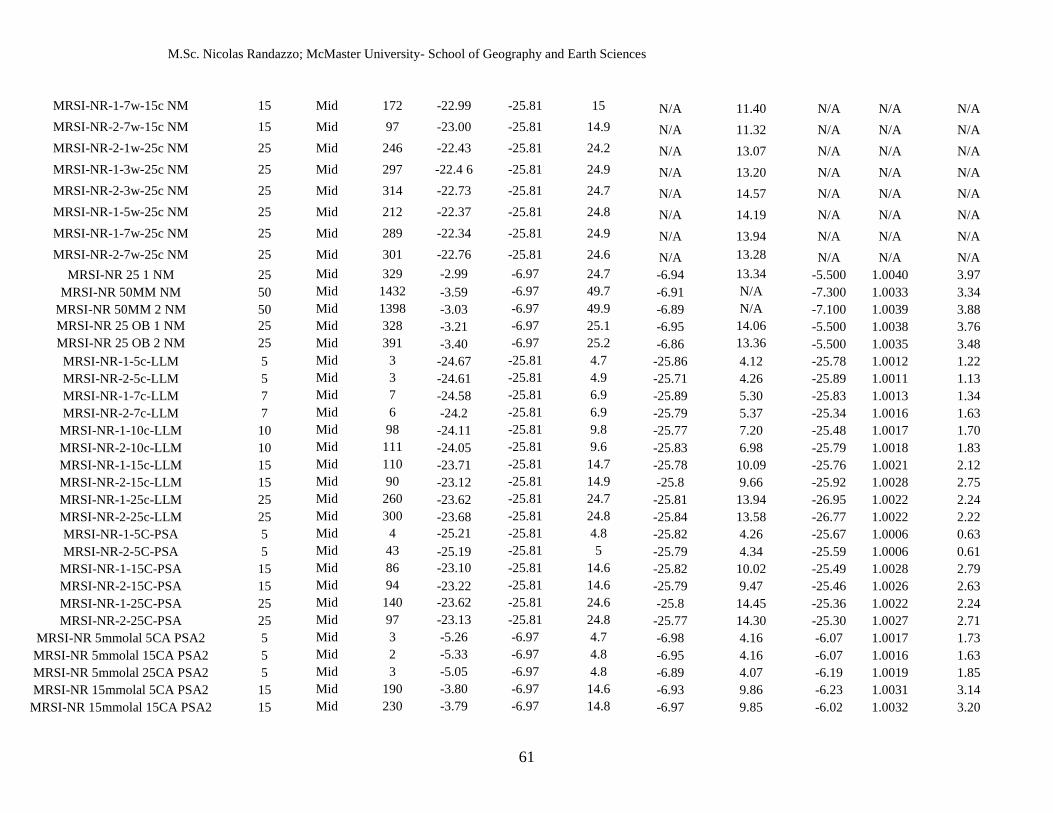
M.Sc. Nicolas Randazzo; McMaster University- School of Geography and Earth Sciences
61
MRSI-NR-1-7w-15c NM 15 Mid 172 -22.99 -25.81 15 N/A 11.40 N/A N/A N/A
MRSI-NR-2-7w-15c NM 15 Mid 97 -23.00 -25.81 14.9 N/A 11.32 N/A N/A N/A
MRSI-NR-2-1w-25c NM 25 Mid 246 -22.43 -25.81 24.2 N/A 13.07 N/A N/A N/A
MRSI-NR-1-3w-25c NM 25 Mid 297 -22.4 6 -25.81 24.9 N/A 13.20 N/A N/A N/A
MRSI-NR-2-3w-25c NM 25 Mid 314 -22.73 -25.81 24.7 N/A 14.57 N/A N/A N/A
MRSI-NR-1-5w-25c NM 25 Mid 212 -22.37 -25.81 24.8 N/A 14.19 N/A N/A N/A
MRSI-NR-1-7w-25c NM 25 Mid 289 -22.34 -25.81 24.9 N/A 13.94 N/A N/A N/A
MRSI-NR-2-7w-25c NM 25 Mid 301 -22.76 -25.81 24.6 N/A 13.28 N/A N/A N/A
MRSI-NR 25 1 NM 25 Mid 329 -2.99 -6.97 24.7 -6.94 13.34 -5.500 1.0040 3.97
MRSI-NR 50MM NM 50 Mid 1432 -3.59 -6.97 49.7 -6.91 N/A -7.300 1.0033 3.34
MRSI-NR 50MM 2 NM 50 Mid 1398 -3.03 -6.97 49.9 -6.89 N/A -7.100 1.0039 3.88
MRSI-NR 25 OB 1 NM 25 Mid 328 -3.21 -6.97 25.1 -6.95 14.06 -5.500 1.0038 3.76
MRSI-NR 25 OB 2 NM 25 Mid 391 -3.40 -6.97 25.2 -6.86 13.36 -5.500 1.0035 3.48
MRSI-NR-1-5c-LLM 5 Mid 3 -24.67 -25.81 4.7 -25.86 4.12 -25.78 1.0012 1.22
MRSI-NR-2-5c-LLM 5 Mid 3 -24.61 -25.81 4.9 -25.71 4.26 -25.89 1.0011 1.13
MRSI-NR-1-7c-LLM 7 Mid 7 -24.58 -25.81 6.9 -25.89 5.30 -25.83 1.0013 1.34
MRSI-NR-2-7c-LLM 7 Mid 6 -24.2 -25.81 6.9 -25.79 5.37 -25.34 1.0016 1.63
MRSI-NR-1-10c-LLM 10 Mid 98 -24.11 -25.81 9.8 -25.77 7.20 -25.48 1.0017 1.70
MRSI-NR-2-10c-LLM 10 Mid 111 -24.05 -25.81 9.6 -25.83 6.98 -25.79 1.0018 1.83
MRSI-NR-1-15c-LLM 15 Mid 110 -23.71 -25.81 14.7 -25.78 10.09 -25.76 1.0021 2.12
MRSI-NR-2-15c-LLM 15 Mid 90 -23.12 -25.81 14.9 -25.8 9.66 -25.92 1.0028 2.75
MRSI-NR-1-25c-LLM 25 Mid 260 -23.62 -25.81 24.7 -25.81 13.94 -26.95 1.0022 2.24
MRSI-NR-2-25c-LLM 25 Mid 300 -23.68 -25.81 24.8 -25.84 13.58 -26.77 1.0022 2.22
MRSI-NR-1-5C-PSA 5 Mid 4 -25.21 -25.81 4.8 -25.82 4.26 -25.67 1.0006 0.63
MRSI-NR-2-5C-PSA 5 Mid 43 -25.19 -25.81 5 -25.79 4.34 -25.59 1.0006 0.61
MRSI-NR-1-15C-PSA 15 Mid 86 -23.10 -25.81 14.6 -25.82 10.02 -25.49 1.0028 2.79
MRSI-NR-2-15C-PSA 15 Mid 94 -23.22 -25.81 14.6 -25.79 9.47 -25.46 1.0026 2.63
MRSI-NR-1-25C-PSA 25 Mid 140 -23.62 -25.81 24.6 -25.8 14.45 -25.36 1.0022 2.24
MRSI-NR-2-25C-PSA 25 Mid 97 -23.13 -25.81 24.8 -25.77 14.30 -25.30 1.0027 2.71
MRSI-NR 5mmolal 5CA PSA2 5 Mid 3 -5.26 -6.97 4.7 -6.98 4.16 -6.07 1.0017 1.73
MRSI-NR 5mmolal 15CA PSA2 5 Mid 2 -5.33 -6.97 4.8 -6.95 4.16 -6.07 1.0016 1.63
MRSI-NR 5mmolal 25CA PSA2 5 Mid 3 -5.05 -6.97 4.8 -6.89 4.07 -6.19 1.0019 1.85
MRSI-NR 15mmolal 5CA PSA2 15 Mid 190 -3.80 -6.97 14.6 -6.93 9.86 -6.23 1.0031 3.14
MRSI-NR 15mmolal 15CA PSA2 15 Mid 230 -3.79 -6.97 14.8 -6.97 9.85 -6.02 1.0032 3.20

M.Sc. Nicolas Randazzo; McMaster University- School of Geography and Earth Sciences
62
MRSI-NR 15mmolal 25CA PSA2 15 Mid 215 -3.67 -6.97 15.1 -6.95 10.20 -6.28 1.0033 3.30
MRSI-NR 25mmolal 5CA PSA2 25 Mid 218 -3.28 -6.97 24.9 -6.95 13.63 -6.42 1.0037 3.69
MRSI-NR 25mmolal 15CA PSA2 25 Mid 245 -3.34 -6.97 25.2 -6.94 14.51 -6.76 1.0036 3.62
MRSI-NR 25mmolal 25CA PSA2 25 Mid 350 -3.17 -6.97 25.4 -6.97 13.57 -6.42 1.0038 3.82
MRSI-NR 15mmolal 38μM PSA 1 15 Mid 300 -3.90 -6.97 14.8 -6.89 11.25 -5.88 1.0030 3.01
MRSI-NR 15mmolal 38μM PSA 2 15 Mid 275 -3.89 -6.97 15.2 -6.92 12.16 -5.52 1.0030 3.04
MRSI-NR 25mmolal 38μM PSA 1 25 Mid 433 -3.18 -6.97 25.4 -6.94 14.73 -5.66 1.0038 3.78
MRSI-NR 25mmolal 38μM PSA 2 25 Mid 350 -3.26 -6.97 25.6 -6.97 13.82 -5.74 1.0037 3.73
MRSI-NR 5mm 5CA 5 Mid 3 -5.00 -6.97 5.5 -6.91 5.01 -6.22 1.0019 1.92
MRSI-NR 5mm 15CA 5 Mid 3 -4.99 -6.97 5.2 -6.94 4.63 -6.28 1.0020 1.96
MRSI-NR 5mm 25CA 5 Mid 2 -5.14 -6.97 4.9 -6.98 4.26 -6.39 1.0019 1.85
MRSI-NR 25mm 5CA 25 Mid 204 -3.12 -6.97 25.3 -6.95 13.41 -6.27 1.0039 3.85
MRSI-NR 25mm 15CA 25 Mid 251 -3.04 -6.97 25.4 -6.99 13.72 -6.76 1.0040 3.97
NR 7d 10pH 5 -1 5 High 480 -1.80 -1.91 4.96 -2.05 0.39 -3.44 1.0002 0.25
NR 7d 10pH 5 -2 5 High 420 -1.75 -1.91 4.65 -1.96 0.39 -3.46 1.0002 0.21
NR 50d 10pH 5- 1 5 High 440 -1.72 -1.91 4.68 -1.95 0.38 -3.48 1.0002 0.23
NR 50d 10pH 5- 2 5 High 450 -1.72 -1.91 4.85 -1.94 0.39 -3.34 1.0002 0.22
NR 7d 10pH 25- 1 25 High 1900 -1.75 -1.91 24.34 -1.96 0.71 -3.81 1.0002 0.22
NR 7d 10pH 25- 2 25 High 1800 -1.73 -1.91 24.38 -1.94 0.60 -3.81 1.0002 0.21
NR 7d 10pH 25- 3 25 High 1600 -1.72 -1.91 23.43 -1.93 0.70 -3.85 1.0002 0.21
NR 7d 10pH 25- 4 25 High 1300 -1.73 -1.91 23.04 -1.93 0.58 -3.84 1.0002 0.20
NR 50d 10pH 50 25- 3 25 High 1500 -1.78 -1.91 24.87 -1.97 0.70 -3.82 1.0002 0.19
NR 50d 10pH 50 25- 4 25 High 1900 -1.79 -1.91 25.13 -1.92 0.70 -3.82 1.0001 0.13
NR 50d 10pH 50 25- 5 25 High 1800 -1.75 -1.91 25.49 -1.91 0.76 -3.87 1.0002 0.16
NR 50d 10pH 50 25- 6 25 High 2000 -1.73 -1.91 25.37 -1.96 0.76 -3.85 1.0002 0.23

M.Sc. Nicolas Randazzo; McMaster University- School of Geography and Earth Sciences
63
Figure 2.4. A comparison of the 1000ln18α(CaCO3-H2O) versus the duration of time which elapsed
after the addition of CaCl2. The overall similarity in the oxygen isotope fractionation factors
between CaCO3 and water of each concentration over the allotted time suggests that the
carbonates completely precipitated within a week and did not continue to precipitate afterwards.
The fast precipitation signifies that kinetic effects occurred within the system.
28.00
28.20
28.40
28.60
28.80
29.00
29.20
29.40
29.60
29.80
30.00
0 1 2 3 4 5 6 7 8
10
00
ln18α
(CaC
O3
-H2
O)
Duration (weeks)
Normal Mixing Experiments
5 mmol
15 mmol
25 mmol
25oC
Kim and O'Neil (1997)

M.Sc. Nicolas Randazzo; McMaster University- School of Geography and Earth Sciences
64
Table 2.6. A Summary of the analyzed catalyzed data compared to some of the uncatalyzed data.
Experiment Type Precipitation
Method Sample I.D. 1000ln18α(CaCO3-H2O) 1000ln13α(CaCO3-DIC)
CA Experiments
Partial Solid
Addition
MRSI-NR 5mmolal 5CA SA2 28.41 0.81
MRSI-NR 5mmolal 15CA SA2 28.51 0.75
MRSI-NR 5mmolal 25CA SA2 28.60 1.15
MRSI-NR 15mmolal 5CA SA2 29.33 2.44
MRSI-NR 15mmolal 15CA SA2 29.21 2.24
MRSI-NR 15mmolal 25CA SA2 29.13 2.62
MRSI-NR 15mmolal 38μM SA 1 29.66 1.99
MRSI-NR 15mmolal 38μM SA 2 29.87 1.63
MRSI-NR 25mmolal 5CA SA2 29.64 3.16
MRSI-NR 25mmolal 15CA SA2 29.65 3.44
MRSI-NR 25mmolal 25CA SA2 29.67 3.27
MRSI-NR 25mmolal 38μM SA 1 29.28 2.50
MRSI-NR 25mmolal 38μM SA 2 29.18 2.49
Normal Mixing
MRSI-NR 5mm 5CA 28.77 1.23
MRSI-NR 5mm 15CA 28.77 1.29
MRSI-NR 5mm 25CA 29.01 1.25
MRSI-NR 25mm 5CA 29.76 3.17
MRSI-NR 25mm 15CA 29.59 3.73
Uncatalyzed
Experiments
Normal
MRSI-NR-5mmolal 28.82 1.48
MRSI-NR-5mmolal 28.78 1.58
MRSI-NR-15mmolal 29.52 2.92
MRSI-NR-15mmolal 29.41 2.82
MRSI-NR-25mmolal 29.85 3.56
MRSI-NR-25mmolal 29.45 3.13
Partial Solid
Addition
MRSI-NR 5mmolal SA1 28.53 0.88
MRSI-NR 5mmolal SA2 28.52 0.91
MRSI-NR 15mmolal SA1 29.08 2.87
MRSI-NR 15mmolal SA2 29.09 2.73
MRSI-NR 25mmolal SA1 29.04 2.20
MRSI-NR 25mmolal SA2 29.30 2.65
Liquid/Liquid
MRSI-NR 5mmolal LL1 28.98 1.66
MRSI-NR 5mmolal LL2 28.19 1.15
MRSI-NR 15mmolal LL1 29.56 3.55
MRSI-NR 15mmolal LL2 29.20 2.90
MRSI-NR 25mmolal LL1 29.53 4.56
MRSI-NR 25mmolal LL2 29.58 3.76

M.Sc. Nicolas Randazzo; McMaster University- School of Geography and Earth Sciences
65
Figure 2.5. A comparison of the oxygen and carbon isotope fractionation factors of all of
samples precipitated in this study at different concentrations. Some samples exceed 29.8 ‰,
however this is within analytical error.
y = 0.3127x + 28.585
R² = 0.6604
28.00
28.50
29.00
29.50
30.00
30.50
31.00
0 1 2 3 4 5
10
00
ln18α
CaC
O3
-DIC
1000ln13αCaCO3-DIC
5 mmol-
Closed
15 mmol-
Closed
25 mmol-
Closed
50 mmol-
Closed
25 mmol-
Open
28.20
28.40
28.60
28.80
29.00
29.20
29.40
29.60
29.80
30.00
0 5 10 15 20 25 30 35 40 45 50 55
10
00
ln1
8α
(CaC
O3-H
2O
)
Concentration (mmolal)
NM- Closed
NM- Open
Low CA NM- Closed
PSA- Closed
Low CA PSA- Closed
High CA PSA- Closed
LLM- Closed
25 oC
A
25 oC
Coplen (2007)
Kim and O’Neil (1997)
Coplen (2007)
Kim and O’Neil (1997)
Analytical error (± 0.15)
Analytical error (± 0.15)
Analytical error (± 0.21)
1000ln18
α(HCO3--H2O)
Beck et al. (2005)
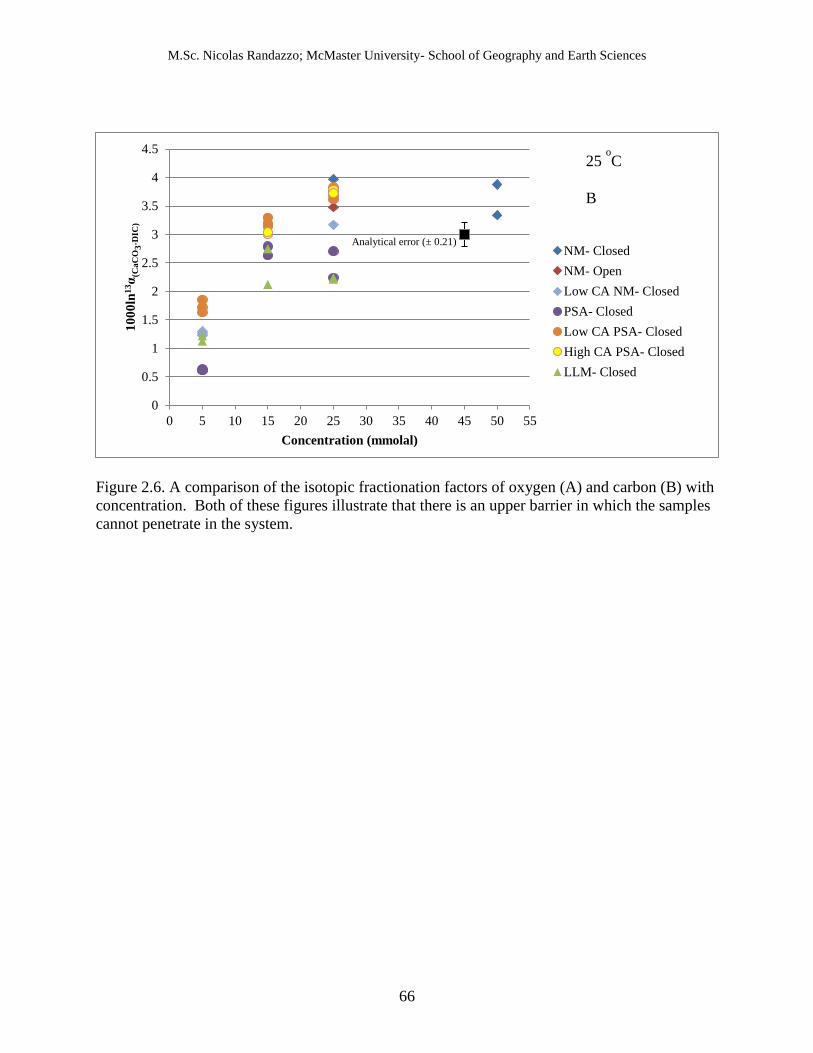
M.Sc. Nicolas Randazzo; McMaster University- School of Geography and Earth Sciences
66
Figure 2.6. A comparison of the isotopic fractionation factors of oxygen (A) and carbon (B) with
concentration. Both of these figures illustrate that there is an upper barrier in which the samples
cannot penetrate in the system.
0
0.5
1
1.5
2
2.5
3
3.5
4
4.5
0 5 10 15 20 25 30 35 40 45 50 55
10
00
ln13α
(CaC
O3-D
IC)
Concentration (mmolal)
NM- Closed
NM- Open
Low CA NM- Closed
PSA- Closed
Low CA PSA- Closed
High CA PSA- Closed
LLM- Closed
25 oC
B
Analytical error (± 0.21)

M.Sc. Nicolas Randazzo; McMaster University- School of Geography and Earth Sciences
67
Figure 2.7. A comparison of the oxygen and carbon isotope fractionation factor of the calcite
samples precipitated at the surface, side and bottom of the bottle in which they were synthesized.
The overall similarity in isotopic fractionation factor is strictly due to CO2(aq) production caused
by Type II CPM. The variation present within the data at higher fraction values is most likely
due to analytical error.
28.20
28.40
28.60
28.80
29.00
29.20
29.40
29.60
29.80
30.00
0 1 2 3 4 5 6
10
00
ln18α
CaC
O3-H
2O
Location within Bottle
5 mmolal
15 mmolal
25 mmolal
Surface Side BottomSurface Side Bottom
Analytical error (± 0.15)

M.Sc. Nicolas Randazzo; McMaster University- School of Geography and Earth Sciences
68
Figure 2.8. Rayleigh distillation curve for the PSA and LLM samples. All samples precipitated
in these experiments followed similar curve. The figure shows an exponential increase in
carbon-13 with increasing consumption of the DIC reservoir.
Figure 2.9. A comparison of the data from the CA experiments with all of data from the mid-pH,
uncatalyzed PSA experiments. All of the CA experiments presented here precipitated using the
0.00
2.00
4.00
6.00
8.00
10.00
12.00
14.00
16.00
0.00 0.20 0.40 0.60 0.80 1.00
δ13C
(‰
)
Residual Fraction, f
Liquid/Liquid
Solid Addition
28.00
28.50
29.00
29.50
30.00
30.50
31.00
31.50
0 5 10 15 20 25 30 35 40 45 50 55
1000ln
α(C
aC
O3
-H2
O)
Concentration (mmolal)
PSA- Closed
Low CA PSA-
Closed
High CA PSA-
Closed
Analytical error (± 0.15)
Coplen (2007)
Kim and O’Neil (1997)
1000ln18
α(HCO3--H2O)
Beck et al. (2005)

M.Sc. Nicolas Randazzo; McMaster University- School of Geography and Earth Sciences
69
PSA technique. The carbon and oxygen fractionation factor value of the experiments catalyzed
with relatively low concentrations of CA are all comparable to those of the PSA experiments,
which had the slowest precipitation rate. This signifies that precipitation rate always outpaced
the catalyzing effect of the enzyme. The samples precipitated in the presence of 38μM of CA
(double that used by Watkins et al (2013)) have lower carbon and oxygen isotopic fractionation
factors and are closer to the equilibrium values proposed by Kim and O’Neil (1997) and
Romanek et al. (1992). These experiments were not conducted at 5 mmolal since the acidifying
effect of CA prevented carbonate growth.
Table 2.7: Percent composition of DIC consumed in mid-pH experiments
Sample Concentration % of DIC Precipitated
5 mmolal 11-12 %
15 mmolal 32-33 %
25 mmolal 44-45 %
Table 2.8: Percent composition of DIC consumed in high pH experiments
Sample Concentration % of DIC Precipitated
5 mmolal 91-92 %
15 mmolal 94-95 %
25 mmolal 96-98 %
Figure 2.10: A comparison of the oxygen and carbon isotope fractionation factors of the high pH
samples precipitated in this study at different concentrations.
24.00
24.50
25.00
25.50
26.00
26.50
27.00
27.50
28.00
28.50
-0.20 -0.10 0.00 0.10 0.20 0.30
10
00
ln18α
CaC
O3
-H2O
1000ln13αCaCO3-DIC
5 mmolal
25 mmolal
Kim and O'Neil (1997)
1000ln18αCO3
2--H
2O
Analytical error (± 0.15)
Analytical error (± 0.21)

M.Sc. Nicolas Randazzo; McMaster University- School of Geography and Earth Sciences
70
Figure 2.11: A comparison of the oxygen isotope fractionation factor between the 7 and 50 day
samples.
y = -0.0494x + 26.4
R² = 0.9949
y = -0.062x + 26.54
R² = 0.9988
24.80
25.00
25.20
25.40
25.60
25.80
26.00
26.20
26.40
0 5 10 15 20 25 30
10
00
ln18α
(CaC
O3
-H2O
Concentration (mmolal )
High pH Normal Mixing Experiments
50 Days
7 Days
25 oC

M.Sc. Nicolas Randazzo; McMaster University- School of Geography and Earth Sciences
71
References
Affek H. P. and Zaarur S. (2014) Kinetic isotope effect in CO2 degassing: Insight from clumped
and oxygen isotopes in laboratory precipitation experiments. Geochim. Cosmochim. Acta
143, 319–330.
Aizawa K. and Miyachi S. (1984) Carbonic anhydrase located on cell surface increases the
affinity for inorganic carbon in photosynthesis of Dunaliella tertiolecta. FEBS Lett. 173, 41–
44.
Badger M. R. (1994) The Role of Carbonic Anhydrase in Photosynthesis. Annu. Rev. Plant
Physiol. Plant Mol. Biol. 45, 369–392.
Beck W.C., Grossman E.L. and Morse J.W. (2005) Experimental studies of oxygen isotope
fractionation factor in the carbonic acid system at 15 oC, 25 oC, and 40 oC. Geochimica et
Cosmochimica Acta 69(14), 3493–3503.
Berg J., Tymoczko J. and Stryer L. (2002) Making a Fast Reaction Faster: Carbonic Anhydrases.
In Biochemistry.
Bertucci A., Tambutté S., Supuran C. T., Allemand D. and Zoccola D. (2011) A New Coral
Carbonic Anhydrase in Stylophora pistillata. Mar. Biotechnol. 13, 992–1002.
Bradfield, J. R. G. (1947) Plant Carbonic Anhydrase. Nature 159, 467–468.
Broecker W. S. (1986). Oxygen isotope constraints on surface ocean temperatures. Quaternary
Research 26(1), 121–134.
Chacko T. and Deines P. (2008). Theoretical calculation of oxygen isotope fractionation factors
in carbonate systems. Geochimica et Cosmochimica Acta 72(15), 3642– 3660.
Chang R. and Goldsby K. A. (2013) Chemistry. McGraw-Hill Education. New York, NY. 11,
pp. 180.
Coplen T. B. (2007) Calibration of the Calcite-Water Oxygen-Isotope Geothermometer at Devils
Hole, Nevada, a natural laboratory. Geochimica et Cosmochimica Acta 71(16), 3948-3957.
Dawson T. E., Mambelli S., Plamboeck A. H., Templer P. H. and Tu K. P. (2002) Stable
isotopes in plant ecology. Annu. Rev. Ecol. Syst. 33, 507–559.
Deines P. (2005). Comment on An explanation of the effect of seawater carbonate concentration
on foraminiferal oxygen isotopes, by RE Zeebe (1999). Geochimica et cosmochimica acta
69(3), 787-790.
De Villiers S., Nelson B.K. and Chivas A.R. (1995) Biological controls on coral Sr/Ca and δ18O
reconstructions of sea surface temperatures. Science 269, 1247–1249.

M.Sc. Nicolas Randazzo; McMaster University- School of Geography and Earth Sciences
72
Donaldson T. and Quinn J. A. (1974) Kinetic constants determined from membrane transport
measurements: carbonic anhydrase activity at high concentrations. Proc. Natl. Acad. Sci. U.
S. A. 71, 4995–4999.
Dietzel M., Tang J., Leis A. and Köhler S. J. (2009) Oxygen isotopic fractionation factor during
inorganic calcite precipitation ― Effects of temperature, precipitation rate and pH. Chem.
Geol. 268, 107–115.
Epstein S., Buchsbaum R., Lowenstam H., and Urey H. (1953). Revised CarbonateWater
Isotopic Temperature Scale. Geological Society of America Bulletin, 11, 1315–1326.
Furla P., Allemand D. and Orsenigo M. N. (2000) Involvement of H(+)-ATPase and carbonic
anhydrase in inorganic carbon uptake for endosymbiont photosynthesis. Am. J. Physiol.
Regul. Integr. Comp. Physiol. 278, R870–R881.
Gabitov R. I., Watson E. B. and Sadekov A. (2012) Oxygen isotope fractionation factor between
calcite and fluid as a function of growth rate and temperature: An in situ study. Chem. Geol.
306-307, 92–102.
Guo W., Mosenfelder J. L., Goddard W. A. and Eiler J. M. (2009) Isotopic fractionation factors
associated with phosphoric acid digestion of carbonate minerals : Insights from first-
principles theoretical modeling and clumped isotope measurements. Geochim. Cosmochim.
Acta 73, 7203–7225.
Hatch M. D. and Burnell J. N. (1990) Carbonic anhydrase activity in leaves and its role in the
first step of c(4) photosynthesis. Plant Physiol. 93, 825–8.
Hendy C. (1971) The isotopic geochemistry of speleothems - I. The calculation of the effects of
different modes of formaion on the isotopic composition of speleothems and their
applicability as paleoclimatic indicators. Geochim. Cosmochim. Acta 35, 801–824.
Hewett-Emmett D. and Tashian R. E. (1996) Functional Diversity, Conservation, and
Convergence in the Evolution of the α-, β-, and γ-Carbonic Anhydrase Gene Families. Mol.
Phylogenet. Evol. 5, 50–77.
Jackson D. J., Macis L., Reitner J., Degnan B. M. and Wörheide G. (2007) Sponge
paleogenomics reveals an ancient role for carbonic anhydrase in skeletogenesis. Science
(80-. ). 316, 1893–1895.
Jimenez-Lopez C., Caballero E., Huertas F. J. and Romanek, C. S. (2001) Chemical,
mineralogical and isotope behavior, and phase transformation during the precipitation of
calcium carbonate minerals from intermediate ionic solution at 25 ° C. Geochimica et
Cosmochimica Acta 65(19), 3219–3231.
Kernohan J.C. (1964) The pH - activity curve of bovine carbonic anhydrase and its relationship
to the inhibition of the enzyme by anions. Biochim. Biophys. Acta 96, 304-317.

M.Sc. Nicolas Randazzo; McMaster University- School of Geography and Earth Sciences
73
Kieffer S.W. (1982) Thermodynamic and lattice vibrations of minerals: 4. Application tom phase
equilibria, isotope fractionation, and high pressure thermodynamics properties. Rev.
Geophys. Space Phys. 20, 827-849.
Kim S. and O’Neil J. (1997) Equilibrium and nonequilibrium oxygen isotope effects in
synthetic carbonates. Geochimica et Cosmochimica Acta 61(16), 3461–3475.
Kim S., Hillaire-Marcel C. and Mucci A. (2006) Mechanisms of equilibrium and kinetic oxygen
isotope effects in synthetic aragonite at 25ºC. Geochimica et Cosmochimica Acta 70, 5790-
5801.
Kim S.-T., O’Neil J. R., Hillaire-Marcel C. and Mucci A. (2007) Oxygen isotope fractionation
factor between synthetic aragonite and water: Influence of temperature and Mg2+
concentration. Geochim. Cosmochim. Acta 71, 4704–4715.
Kluge T. and John C. M. (2015) Technical Note: A simple method for vaterite precipitation for
isotopic studies: Implications for bulk and clumped isotope analysis. Biogeosciences 12,
3289–3299.
ter Kuile B., Erez J. and Padan E. (1989) Competition for inorganic carbon between
photosynthesis and calcification in the symbiont-bearing foraminifer Amphistegina lobifera.
Mar. Biol. 103, 253–259.
Lamb J. E. (1977) Plant carbonic anhydrase. Life Sci. 20, 393–406.
Lide D. R. (2005) CRC Handbook of Chemistry and Physics. Boca Raton (FL): CRC Press. 86,
90.
Liljas A. and Laurberg M. (2000) A Wheel Invented Three Times: The Molecular Structures of
the Three Carbonic Anhydrases. EMBO 1, 16–17.
Lindskog S. and Coleman J. E. (1973) The catalytic mechanism of carbonic anhydrase. Proc.
Natl. Acad. Sci. U. S. A. 70, 2505–2508.
McCrea J. M. (1950) On the isotopic chemistry of carbonates and a paleotemperature scale.
Journal of Chemical Physics 18(6), 849–857.
Mickler P. J., Banner J. L., Stern L., Asmerom Y., Edwards R. L. and Ito E. (2004) Stable
isotope variations in modern tropical speleothems: Evaluating equilibrium vs. kinetic
isotope effects. Geochim. Cosmochim. Acta 68, 4381–4393.
Mills G.A. and Urey H.C. (1940) The kinetics of isotopic exchange between carbon dioxide,
bicarbonate ion, carbonate ion, and water. J. Am. Chem. Soc. 62, 1019-1026.
Mook W. G. (2000) Environmental isotopes in the hydrological cycle Volume I.pdf. Tech. Doc.
Hydrol. 1, 1–291.

M.Sc. Nicolas Randazzo; McMaster University- School of Geography and Earth Sciences
74
Moroney J. V., Bartlett S. G. and Samuelsson G. (2001) Carbonic anhydrases in plants and
algae: Invited review. Plant, Cell Environ. 24, 141–153.
Moya A., Tambutté S., Bertucci A., Tambutté E., Lotto S., Vullo D., Supuran C. T., Allemand D.
and Zoccola D. (2008) Carbonic anhydrase in the scleractinian coral Stylophora pistillata:
characterization, localization, and role in biomineralization. J. Biol. Chem. 283, 25475–
25484.
O’Leary M. H. (1981) Carbon isotope fractionation factor in plants. Phytochemistry 20, 553–
567.
O’Leary M. H. (1988) Carbon isotopes in photosynthesis. Bioscience 38, 328–336.
Palmer A. N. (2007) Cave Geology. Cave Books. Dayton, OH. pp. 275.
Raven J. A. (1995) Photosynthetic and non-photosynthetic roles of carbonic anhydrase in algae
and cyanobacteria. Phycologia 34, 93–101.
Reed M.L. and Graham D. (1981). Carbonic anhydrase in plants: distribution, properties and
possible physiological roles. In: Reinhold L, Harborne JB, Swain T, editors. Progress in
Phytochemistry. Oxford, UK: Pergamon Press. 7, pp. 47–94.
Romanek C. S., Grossman E. L. and Morse J. W. (1992) Carbon isotopic fractionation factor in
syntetic aragonite and calcite: effects of temperature and precipitation rate. Geochim.
Cosmochim. Acta 56, 419–430.
Roughton F. J. and Booth V. H. (1946) The effect of substrate concentration, pH and other
factors upon the activity of carbonic anhydrase. Biochem. J. 40, 319–30.
Schauble E. a., Ghosh, P., and Eiler, J. M. (2006). Preferential formation of 13C–18O bonds in
carbonate minerals, estimated using first-principles lattice dynamics. Geochimica et
Cosmochimica Acta 70(10), 2510–2529.
Soto A. R., Zheng H., Shoemaker D., Rodriguez J., Read B. A. and Wahlund T. M. (2006)
Identification and preliminary characterization of two cDNAs encoding unique carbonic
anhydrases from the marine alga Emiliania huxleyi. Appl. Environ. Microbiol. 72, 5500–
5511.
Spero H. J., Bijma J., Lea D. W. and Bemis, B. E. (1997). Effect of seawater carbonate
concentration on foraminiferal carbon and oxygen isotopes. Nature 390, 497–500.
Staddon P. L. (2004) Carbon isotopes in functional soil ecology. Trends Ecol. Evol. 19, 148–154.
Sültemeyer D. (1998) Carbonic anhydrase in eukaryotic algae: characterization, regulation, and
possible function during photosynthesis. Can. J. Bot. 76, 962–972.
Takita Y., Eto M., Sugihara H. and Nagaoka K. (2007) Promotion mechanism of co-existing
NaCl in the synthesis of CaCO3. Mater. Lett. 61, 3083–3085.

M.Sc. Nicolas Randazzo; McMaster University- School of Geography and Earth Sciences
75
Tambutté S., Tambutté E., Zoccola D., Caminiti N., Lotto S., Moya A., Allemand D. and Adkins
J. (2007) Characterization and role of carbonic anhydrase in the calcification process of the
azooxanthellate coral Tubastrea aurea. Mar. Biol. 151, 71–83.
Tarutani T., Clayton R. N. and Mayeda, T. K. (1969). The effect of polymorphism and
magnesium substitution on oxygen isotope fractionation factor between calcium carbonate
and water. Geochimica et Cosmochimica Acta 33, 987–996.
Tripp B. C., Smith K. and Ferry J. G. (2001) Carbonic Anhydrase: New Insights for an Ancient
Enzyme. J. Biol. Chem. 276, 48615–48618.
Turner J. V. (1982). Kinetic fractionation factor of carbon-13 during calcium carbonate
precipitation. Geochimica et Cosmochimica Acta 46(7), 1183–1191.
Uchikawa J. and Zeebe R. E. (2012) The effect of carbonic anhydrase on the kinetics and
equilibrium of the oxygen isotope exchange in the CO2-H2O system: Implications for δ18O
vital effects in biogenic carbonates. Geochim. Cosmochim. Acta 95, 15–34.
Urey, H. C. (1947). The Thermodynamic Properties of Isotopic Substances. Journal of the
Chemical Society, 562-581.
Usdowski, E. and Hoefs, J. (1990). Kinetic 13C/12C and 18O/16O effects upon dissolution and
outgassing of CO2 in the system CO2-H2O. Chemical Geology (Isotope Geosciences
Edition), 80, 109–118.
Voigt O., Adamski M., Sluzek K. and Adamska M. (2014) Calcareous sponge genomes reveal
complex evolution of α -carbonic anhydrases and two key biomineralization enzymes
Calcareous sponge genomes reveal complex evolution of α -carbonic anhydrases and two
key biomineralization enzymes.
Watkins J. M., Nielsen L. C., Ryerson F. J. and DePaolo D. J. (2013) The influence of kinetics
on the oxygen isotope composition of calcium carbonate. Earth Planet. Sci. Lett. 375, 349–
360.
Wickman F. E. (1952) Variations in the relative abundance of the carbon isotopes in plants.
Geochim. Cosmochim. Acta 2, 243–254.
Zeebe R. E. (1999) An explanation of the effect of seawater carbonate concentration on
foraminiferal oxygen isotopes. Geochimica et Cosmochimica Acta 63, 2001-2007.
Zeebe R. (2007). An explanation of the effect of seawater carbonate concentration on
foraminiferal oxygen isotopes. Geochimica et Cosmochimica Acta 63(13), 2001– 2007.

Chapter 3:
Conclusions, Contributions, and Future
Research
M.Sc. Nicolas Randazzo; McMaster University- School of Geography and Earth Sciences
77
Chapter 3 1
“The man who moves a mountain begins by carrying away small stones”. 2
– Confucius 3
3.1 Summary of Findings 4
The results of these experiments will help to improve the effectiveness of carbonates as a 5
paleoclimate indicator. The measurement of the δ18O and δ13C values within the synthetic 6
calcite crystals stand to further assist researchers by providing a tool to correlate their measured 7
isotopic fractionation factors and provide a deeper understanding of the paleoclimate of their 8
studied area. This study also built upon the current knowledge and observations regarding how 9
environmental factors, such as temperature, influence the δ18O and δ13C values in natural calcite 10
raft samples. Calcite was synthesized through the reaction of sodium bicarbonate (NaHCO3) and 11
calcium chloride dihydrate (CaCl2 .2H2O(aq)) at 5, 15 and 25 mmolal concentrations using three 12
different synthesis techniques to control precipitation rate. Carbonate samples precipitated using 13
the Normal Mixing technique were taken from the surface, sides and bottom of the bottles in 14
which the carbonates precipitated. It was found that there was no difference in the 15
1000ln18α(CaCO3-H2O) for oxygen and 1000ln13α(CaCO3-DIC) for oxygen regardless of location within 16
the bottle. This trend is believed to have been caused by the production of CO2(aq) as a by-17
product of the reaction between NaHCO3 and CaCl2 (degassing from Type II CPM). This would 18
have caused an enrichment in the DIC since lighter isotopologues of CO2(aq) would preferentially 19
leave the water system since these isotopes would have been preferentially incorporated into the 20
carbon dioxide. This effect increased with concentration and it is for this reason that the 21
carbonate samples collected from 25 mmolal concentrations were heavier than the 5 or 15 22
mmolal samples in both oxygen and carbon. Unlike the CO2(g) degassing trend observed in 23
M.Sc. Nicolas Randazzo; McMaster University- School of Geography and Earth Sciences
78
Affek and Zaarur (2014), which strictly occurred at the air-water boundary (Type I CPM) and 24
enriched the surface carbonates more than those which formed at the bottom of the solution, 25
Type II CPM enriched all of the carbonates within the bottle equally. Additionally, samples 26
were stored in a growth chamber kept at 25 ± 0.1 oC for 1, 3, 5 and 7 weeks and were found to 27
remain consistent over time. This suggests that the samples precipitated in less than a week and 28
did not change its isotopic fractionation factor values afterwards. 29
Samples were also precipitated from NaCl containing solutions in an open system. The 30
morphology of these samples were then compared to the samples which had also been 31
precipitated from low ionic strength solutions under an open system. It was found that those 32
which precipitated from NaCl containing solutions always yielded 100% calcite, like the samples 33
precipitated under a closed system. However, the open, low ionic strength solutions were 34
composed of ~25 % vaterite. It is believed that the presence of the meta-stable vaterite signifies 35
that the precipitation rate of these samples was very fast and therefore precipitated as the most 36
unstable form of calcium carbonate, since there was not enough time for the crystal to 37
completely convert to the more stable polymorph, calcite. However, it is believed that the 38
presence of NaCl in the precipitating solutions increased the solubility of the carbonate and 39
slowed the precipitation rate enough to allow the more stable calcite to form (Takia et al., 2007). 40
This conflicts with the findings of Kluge and John (2014), who precipitated vaterite in the 41
presence of NaCl. However, that study utilized active CO2(g) degassing to precipitate carbonate, 42
which would have precipitated the carbonate quickly, regardless of the presence of NaCl and 43
negated its effect on the morphology. 44
Carbonates precipitated under these conditions also showed a positive linear trend in the 45
1000ln18α(CaCO3-H2O) and 1000ln13α(CaCO3-DIC) values with increasing reactant concentration, and 46

M.Sc. Nicolas Randazzo; McMaster University- School of Geography and Earth Sciences
79
thereby kinetic effects due to the faster precipitation rate which caused the precipitating 47
carbonates to incorporate CO32- which were not given enough time for re-equilibration after 48
deprotonation and thereby retain the isotopic signature of the HCO3-. The system was also 49
influenced CO2(aq) production caused by Type II CPM. Carbonate samples which precipitated at 50
5 mmolal concentration had permil oxygen isotope fractionation factor which were close to the 51
equilibrium value of 28.3 ‰ between calcite and water proposed by Kim and O’Neil (1997) and 52
the higher 25 and 50 mmolal experiments (as well as the open low ionic strength carbonates) 53
seemed to plateau at the value 29.8 ‰ suggested by Coplen (2007). In all experiments 54
conducted by this study, the initial carbonates precipitated in isotopic equilibrium with the parent 55
water and deviated with an increasing amount of kinetic effects, following a Rayleigh distillation 56
curve, causing the higher concentrated samples to deviate further from oxygen and carbon 57
isotopic equilibrium. This may imply that the measured isotopic fractionation factor of a 58
carbonate is actually an average of an entire spectrum of isotopic compositions which varied as 59
the carbonate continued to grow, with this range increasing with concentration. Thus, perhaps 60
29.8 ‰ does not represent oxygen isotope equilibrium between calcite and water, but rather the 61
average between 28.3 ‰ and the oxygen isotope fractionation factor between HCO3- and water 62
of 31 ‰ as suggested by Beck et al. (2005). 63
The enzyme, carbonic anhydrase (CA) was also used in this study in an attempt to hasten 64
the oxygen isotope equilibration time between DIC and water. Since the isotopic composition of 65
carbonates are due to the interaction of three different processes: CO2 degassing/production, 66
CaCO3 precipitation rate, and isotopic equilibration between two phases such as DIC and water. 67
Different CA concentrations were utilized using concentrations proposed by both Uchikawa and 68
Zeebe (2012) and Watkins et al. (2013) and it was found that none of the carbonate samples were 69

M.Sc. Nicolas Randazzo; McMaster University- School of Geography and Earth Sciences
80
able to attain oxygen isotope equilibrium with respect to parent solutions – despite a 70
concentration of CA being used which would have caused the DIC and water to equilibrate 71
almost immediately. This suggests that CA may not be able to significantly influence the isotopic 72
composition of fast growing carbonates such as speleothems. Thus, if the naturally produced CA 73
enzyme made it into the carbonate system, it may not be necessarily reflected in the isotopic 74
composition of the carbonate and shows that this fast-acting catalyst has some limitations. 75
High pH experiments were conducted by using Na2CO3 and CaCl2 at 5, 15, and 25 76
mmolal concentrations. Unlike the mid-pH experiments, the high pH experiments illustrated a 77
negative linear trend the 1000ln13α(CaCO3-DIC) values increased with concentration, but the 78
1000ln18α(CaCO3-H2O) decreased. Since CO2(aq) not forming as a by-product of Na2CO3 and CaCl2 79
in this system, no trend was observed in the carbon isotope fractionation observed within the 80
precipitating carbonate. In contrast, the oxygen isotope fractionation factor between carbonate 81
and water declined with increasing concentration of the reactants since the CO3- ions were 82
significantly dominant at the solution’s pH (~11.07). Thus the faster precipitating carbonates, 83
which formed under higher concentrations, would have incorporated a greater amount of the 84
CO3- ions and had an oxygen isotope fractionation factor which was closer to the CO3
2- oxygen 85
isotope fractionation line compared to those which precipitated slower. It was also found that the 86
trend line of the high pH solution intersects with those of the mid-pH experiments around 28.3 87
‰, further suggesting that this value represents isotopic equilibrium between calcite and water. 88
Finally, two different DIC-water equilibration times, 7 and 50 days, were utilized before 89
the addition of CaCl2 based on the findings of Beck et al. (2005) and Kim et al. (2006). The 90
results found that the 1000ln18α(CaCO3-H2O) and 1000ln13α(CaCO3-DIC) values between both sets of 91
samples were similar and suggests that equilibrium between DIC and water must have been 92

M.Sc. Nicolas Randazzo; McMaster University- School of Geography and Earth Sciences
81
attained at 7 days before the onset of carbonate growth. However, this finding conflicts with the 93
equilibration time of Beck et al. (2005) and may be related to the solutions of that study having 94
~100 % of DIC reservoir being composed of CO3- ions instead of the lower amounts observed in 95
Kim et al. (2006) or the experiments of this manuscript. 96
The findings of this study illustrate that while carbonates synthesized in the laboratory 97
precipitate faster than natural samples, it does not imply that they cannot attain isotopic 98
equilibrium. This is because kinetic effects are not strictly determined by precipitation rate 99
alone, but also the equilibration time and amount of CO2(g) degassing. If either the level of 100
CO2(g) degassing or precipitation rate exceed the equilibration time, then the carbonate will 101
precipitate in isotopic disequilibrium. 102
3.2 The Candidate’s Contributions to this Research 103
The candidate had conducted all of the necessary background research, compiled the 104
information, and provided a literature review. The candidate also conducted all of the 105
experiments outlined in this manuscript, analyzed all of the precipitated carbonate samples using 106
IRMS and solution samples through CF-IRMS to obtain and interpret carbon and oxygen isotope 107
data. The candidate then wrote this manuscript and created all of the figures and tables by 108
incorporating scientific and editorial feedback provided by the candidate’s supervisor, Dr. Sang-109
Tae Kim and selected reviewers. 110
3.3 Future Research 111
Future research could synthesize carbonates using the same synthesis techniques 112
described above and compare the results with those of this paper. These experiments should also 113
utilize varying concentrations of CA to determine whether its effect is enhanced at lower 114
temperatures. Sanyal and Maren (1981) found that the effect of CA in catalyzing the CO2 115
hydration is invariant between 0 and 37 oC. Therefore, it is possible that CA might allow the 116

M.Sc. Nicolas Randazzo; McMaster University- School of Geography and Earth Sciences
82
equilibration rate to outpace precipitation rate and CO2(g) degassing with declining temperature. 117
It would also be worth precipitating carbonates at different concentration rates using the constant 118
addition method in the presence of CA to determine the threshold in which this enzyme 119
influences the isotopic composition of carbonates. Similarly, carbonates could also be 120
precipitated using passive CO2(g) degassing under the open system under varying concentrations 121
of NaCl to determine the point in which the precipitation of vaterite is hindered. This 122
experiment could also vary the surface area of the air-water boundary to influence the rate of 123
Type II CPM. 124
Using the constant addition method, carbonates may also be conducted under a closed 125
system through the reaction of NaHCO3- and CaCl2 while examining the isotope fractionation 126
factor value at different growth intervals as per the techniques used in Gabitov et al. (2012). 127
This can provide direct evidence of whether the initial portion of the carbonate to precipitate was 128
close to the equilibrium value proposed by Coplen (2007). If the conclusion of this manuscript is 129
correct, then the fractionation factor of the sample should decrease from the center towards the 130
edges of the crystal and a higher concentration should provide a spectrum which averages around 131
the value proposed by Coplen (2007). 132
It would also be worth conducting clumped isotope analysis on the samples precipitated 133
in these experiments. Clumped isotope thermometry utilizes the fact that the relative abundance 134
of 13C18O16O in CO2(g) produced through carbonate acid digestion varies based on their formation 135
temperature, with a greater amount of “clumping” occurring at lower temperatures. Preliminary 136
tests on the samples have shown that there is no difference in the Δ47 of the samples, regardless 137
of concentration, pH, or whether CA was present. This suggests that the clumped isotope 138
M.Sc. Nicolas Randazzo; McMaster University- School of Geography and Earth Sciences
83
paleothermometer is unaffected by the aforementioned conditions under the studied system. 139
However, more analysis is required before this finding can be verified. 140
The results of this study can be further expanded upon by testing the oxygen and carbon 141
isotope effects in biogenic carbonates, such as foraminifera, at the same pH to test if the same 142
carbon and oxygen enrichment trend would be observed. Growth rate can be controlled by 143
varying factors such as light availability or salinity level. Since these experiments would 144
introduce vital effects as an additional source of kinetic fractionation, only one species should be 145
studied at a time. This would eliminate the need to consider vital effects as an additional factor 146
since this process shall influence all samples equally. Future experiments can then repeat these 147
experimental procedures using different species and comparing the results.148

M.Sc. Nicolas Randazzo; McMaster University- School of Geography and Earth Sciences
84
References
Affek H. P. and Zaarur S. (2014) Kinetic isotope effect in CO2 degassing: Insight from clumped
and oxygen isotopes in laboratory precipitation experiments. Geochim. Cosmochim. Acta
143, 319–330.
Beck W.C., Grossman E.L. and Morse J.W. (2005) Experimental studies of oxygen isotope
fractionation factor in the carbonic acid system at 15 oC, 25 oC, and 40 oC. Geochimica et
Cosmochimica Acta 69(14), 3493–3503.
Coplen T. B. (2007) Calibration of the Calcite-Water Oxygen-Isotope Geothermometer at Devils
Hole, Nevada, a natural laboratory. Geochimica et Cosmochimica Acta 71(16), 3948-3957.
Gabitov R. I., Watson E. B. and Sadekov A. (2012) Oxygen isotope fractionation factor between
calcite and fluid as a function of growth rate and temperature: An in situ study. Chem. Geol.
306-307, 92–102.
Kim S. and O’Neil J. (1997) Equilibrium and nonequilibrium oxygen isotope effects in
synthetic carbonates. Geochimica et Cosmochimica Acta 61(16), 3461–3475.
Kim S., Hillaire-Marcel C. and Mucci A. (2006) Mechanisms of equilibrium and kinetic oxygen
isotope effects in synthetic aragonite at 25ºC. Geochimica et Cosmochimica Acta 70, 5790-
5801.
Kluge T. and John C. M. (2015) Technical Note: A simple method for vaterite precipitation for
isotopic studies: Implications for bulk and clumped isotope analysis. Biogeosciences 12,
3289–3299.
Sanyal G. and Maren T. H. (1981) Thermodynamics of Carbonic Anhydrase Catalysis. J. Biol.
Chem. 256, 608–612.
Uchikawa J. and Zeebe R. E. (2012) The effect of carbonic anhydrase on the kinetics and
equilibrium of the oxygen isotope exchange in the CO2-H2O system: Implications for δ18O
vital effects in biogenic carbonates. Geochim. Cosmochim. Acta 95, 15–34.
Watkins J. M., Nielsen L. C., Ryerson F. J. and DePaolo D. J. (2013) The influence of kinetics
on the oxygen isotope composition of calcium carbonate. Earth Planet. Sci. Lett. 375, 349–
360.


![Sodium Phytate Presentation.pptx [Read-Only]formulatorsampleshop.com/v/reference/Sodium Phytate Presentation.pdfLaurate (Skin Conditioning Agent), Sodium Benzoate (Preservative), Sodium](https://img.pdfslide.us/doc/110x75/5eb52012fb0f3e0d55767ea6/sodium-phytate-read-onlyformulatorsampleshopcomvreferencesodium-phytate-presentationpdf.jpg)