Embed Size (px)
Citation preview
04/19/23 1
GraphsGraphs
2
Today we are going Today we are going to graphto graph. .
What are the parts of a graph?
3
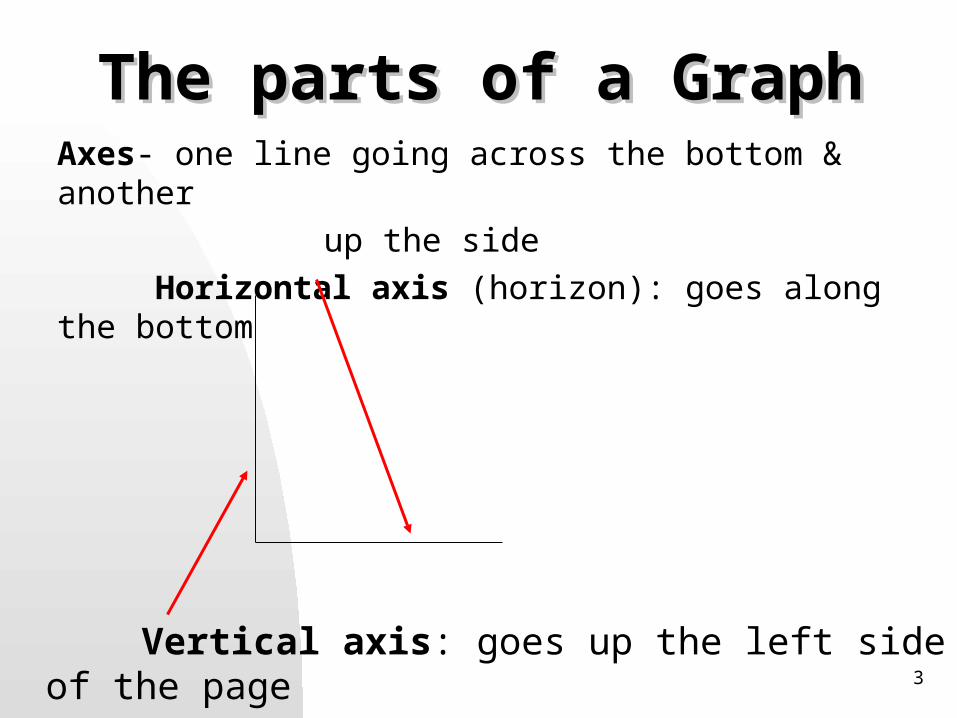
The parts of a GraphThe parts of a GraphAxes- one line going across the bottom & another
up the side
Horizontal axis (horizon): goes along the bottom
Vertical axis: goes up the left side of the page
4
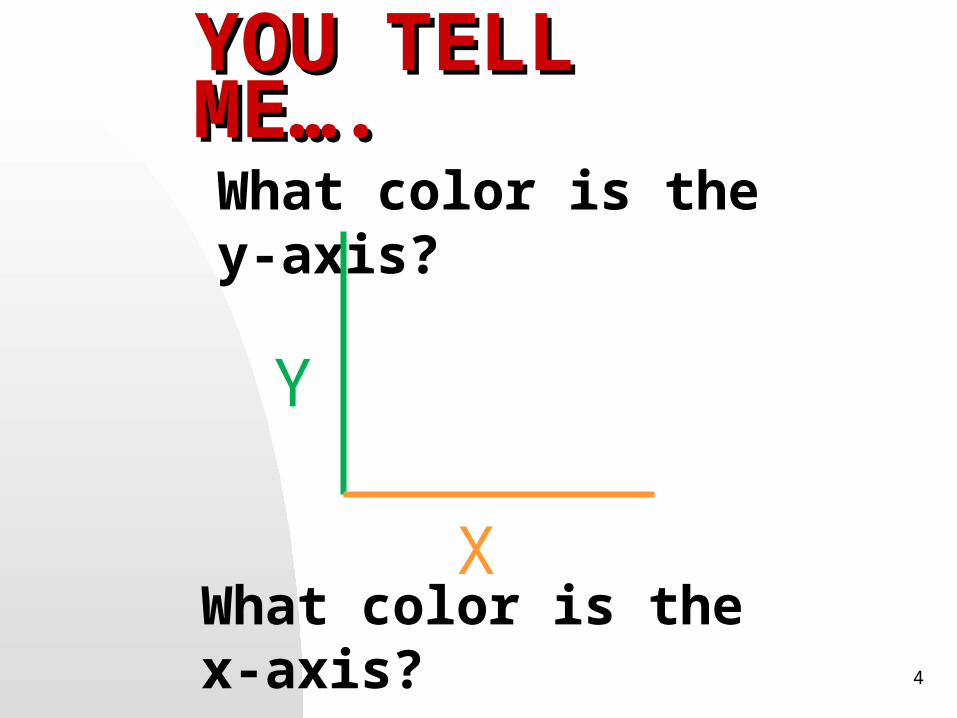
YOU TELL YOU TELL ME….ME….What color is the y-axis?
What color is the x-axis?
Y
X
5
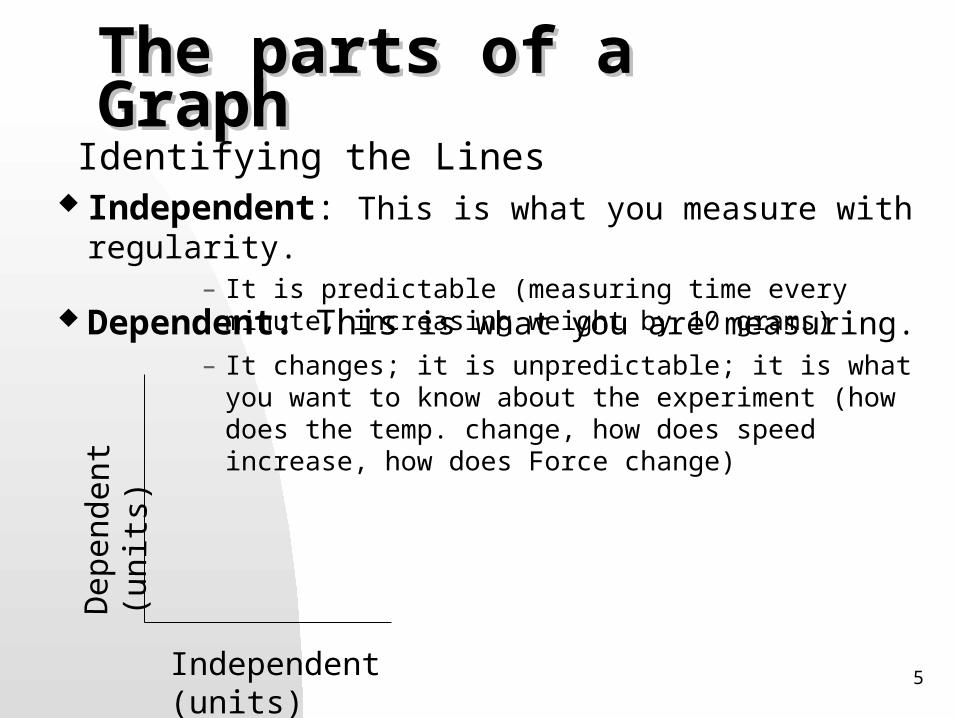
The parts of a GraphThe parts of a Graph Identifying the Lines
Independent: This is what you measure with regularity. – It is predictable (measuring time every minute, increasing
weight by 10 grams)
Independent (units)
Dep
ende
nt (
unit
s)
Dependent: This is what you are measuring.– It changes; it is unpredictable; it is what you want to know
about the experiment (how does the temp. change, how does speed increase, how does Force change)

04/19/23 6
The parts of a GraphThe parts of a Graph Units: How do you measure the independent &
dependent variables?-Meters ( m), seconds (s), millimeters (mm), minutes (min), Force (N)
Without units, you don’t know how the distance or time was measured, and the data is worthless to you
time (s)
Dis
tanc
e (m
)
7
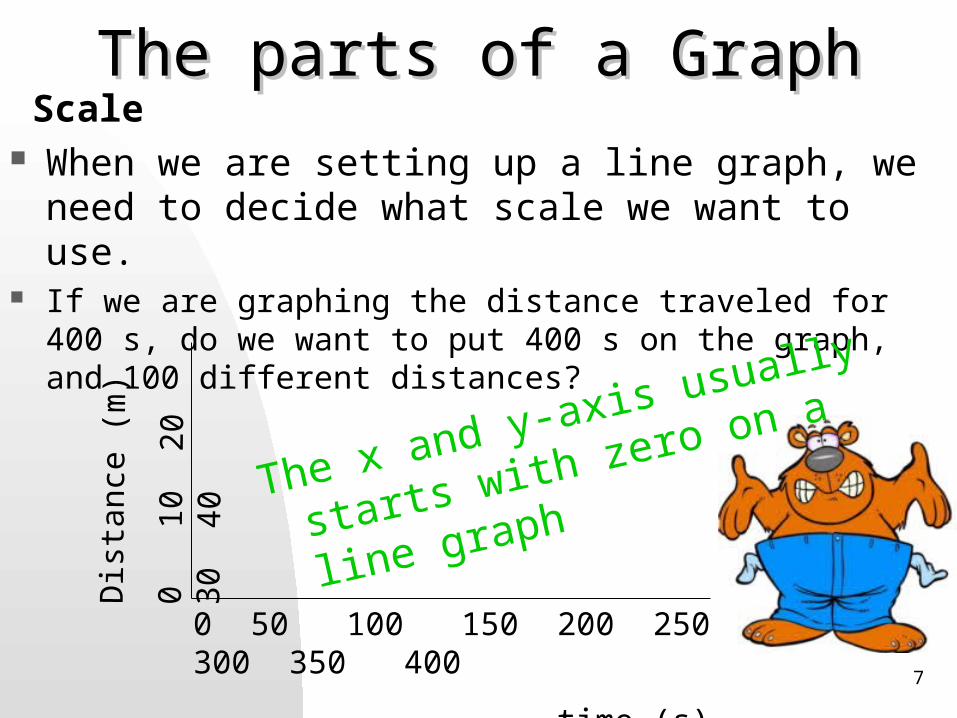
Scale When we are setting up a line graph, we need to
decide what scale we want to use. If we are graphing the distance traveled for 400 s, do we want
to put 400 s on the graph, and 100 different distances?
0 50 100 150 200 250 300 350 400
time (s)
Dis
tanc
e (m
)
0 1
0 2
0 3
0 4
0
The x and y-axis usually starts with
zero on a line graph
The parts of a GraphThe parts of a Graph
8
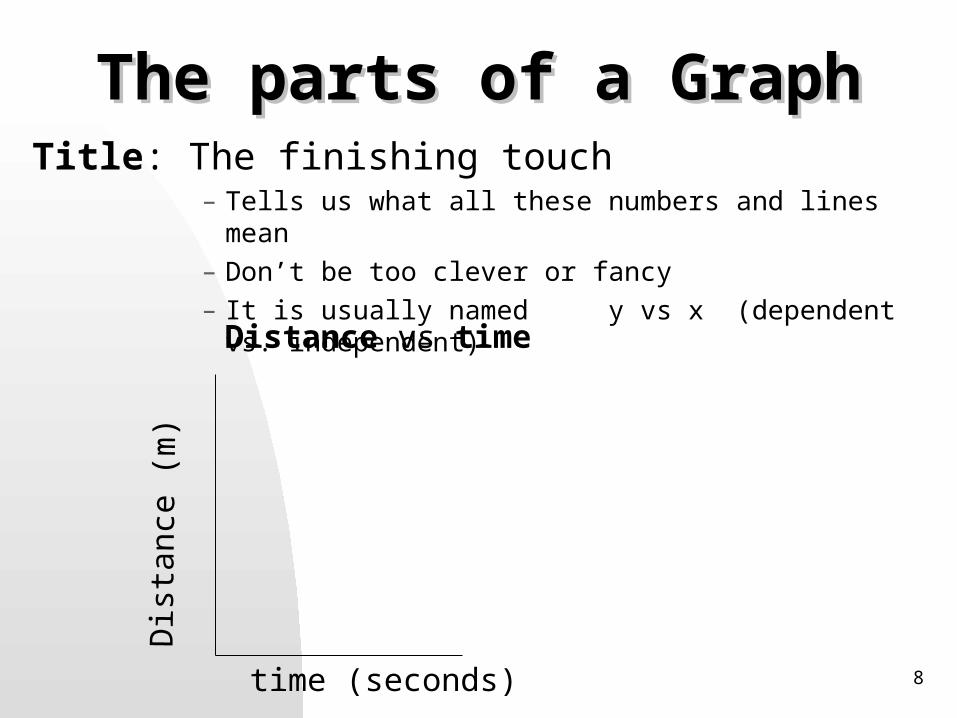
The parts of a GraphThe parts of a Graph Title: The finishing touch
– Tells us what all these numbers and lines mean– Don’t be too clever or fancy– It is usually named y vs x (dependent vs. independent)
time (seconds)
Dis
tanc
e (m
)
Distance vs time

04/19/23 9
Collecting Data
Make a chart of x and y: and fill in the information
time
(seconds)
(X)
Distance
(m)(Y)
Last But Not Least…Last But Not Least…

10
Make your own….. Make your own….. •Now that you have learned the parts of a graph, you will be making your own graph.
•You will graph distance vs time. Use the data given to you to do this.

Distance vs. TimeDistance vs. Time
04/19/23 11
04/19/23 12
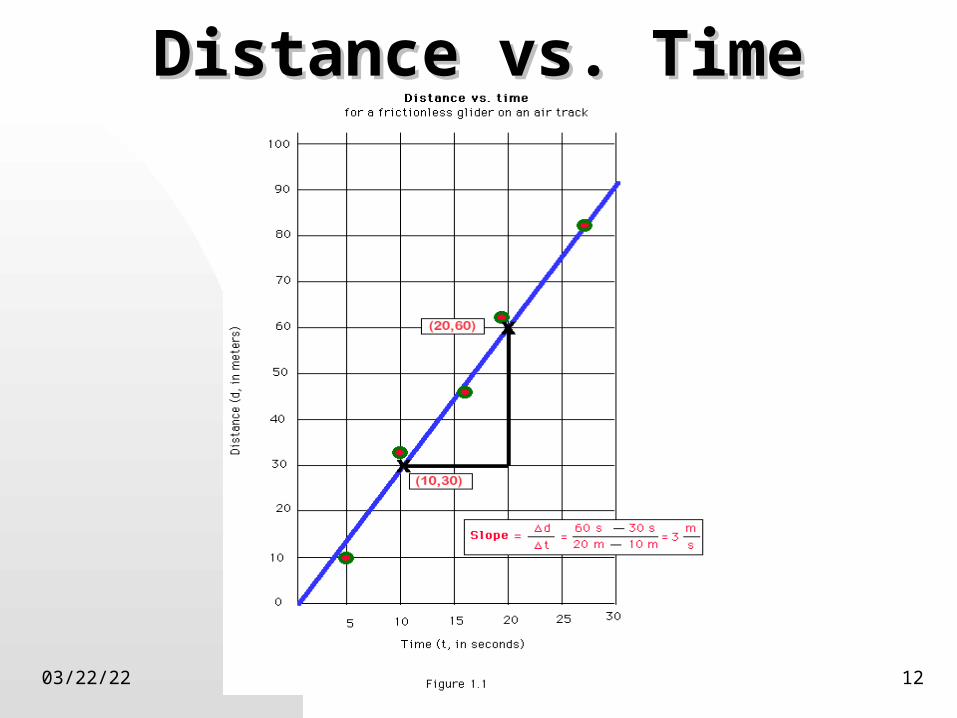
Distance vs. TimeDistance vs. Time
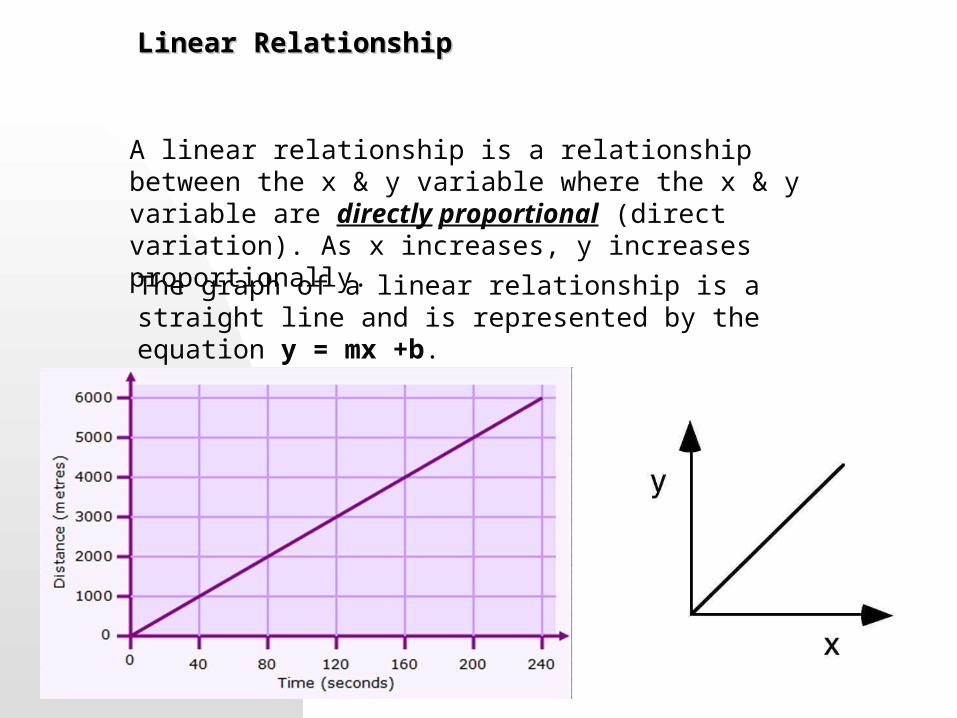
Linear RelationshipLinear Relationship
A linear relationship is a relationship between the x & y variable where the x & y variable are directly proportional (direct variation). As x increases, y increases proportionally.
The graph of a linear relationship is a straight line and is represented by the equation y = mx +b.

SlopeSlope
Slope is calculated using the formula to the right.
ALWAYS select 2 points on the line AS FAR APART AS POSSIBLE.
The y-intercept (b) is the point where the line crosses the y-axis when x is zero.

04/19/23 15
When constructing a graph, you must draw a line that best represents ALL of your data.
The Line of best fit is a line that best passes through or near graphed data.
It is used to describe data and predict where new data will appear on the graph.
Line of Best FitLine of Best Fit
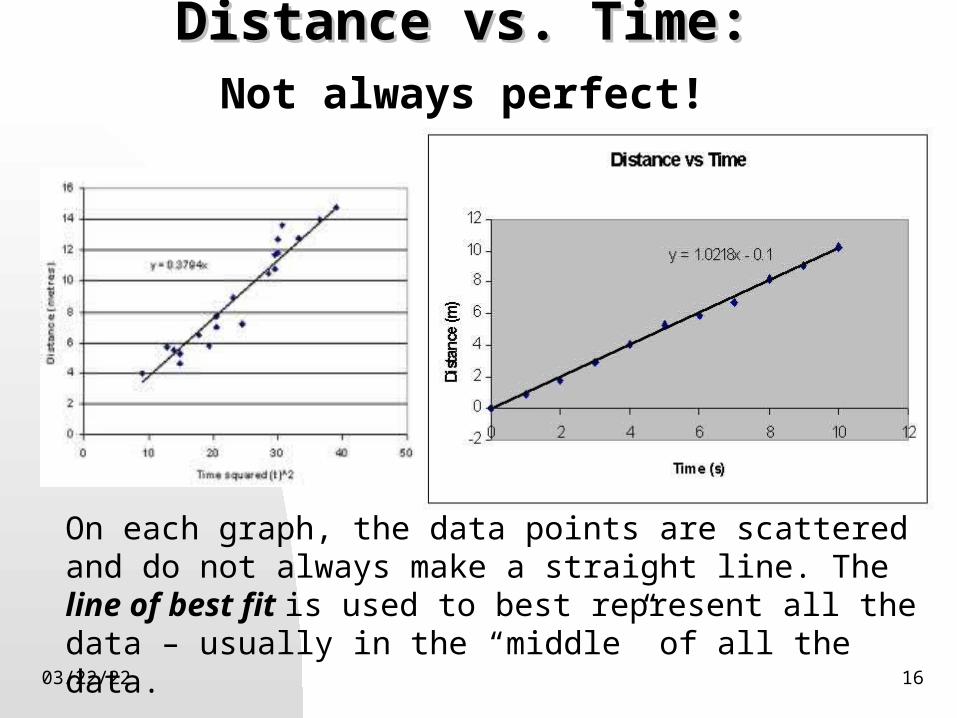
Distance vs. Time:Distance vs. Time:Not always perfect!
04/19/23 16
On each graph, the data points are scattered and do not always make a straight line. The line of best fit is used to best represent all the data – usually in the “middle” of all the data.

Distance vs. Time:Distance vs. Time:
04/19/23 17
NO MORE CONNECT-THE-DOT GAME!!!NO MORE CONNECT-THE-DOT GAME!!!
When making a line on a graph, you will NO LONGER connect the dots – you will make a LINE OF BEST FIT, as we discussed earlier… CONNECTING DATA POINTS IS NOT ALLOWED!!!CONNECTING DATA POINTS IS NOT ALLOWED!!!
04/19/23 18
Types of GraphsTypes of Graphs
Bar GraphLine Graph
04/19/23 19
Line GraphLine GraphA line graph is a graph used to
show change over time!!
What can time be measured in???
Seconds - Minutes - Hours – Days - Weeks - Months – Years - Decades -
Centuries - etc.
04/19/23 20
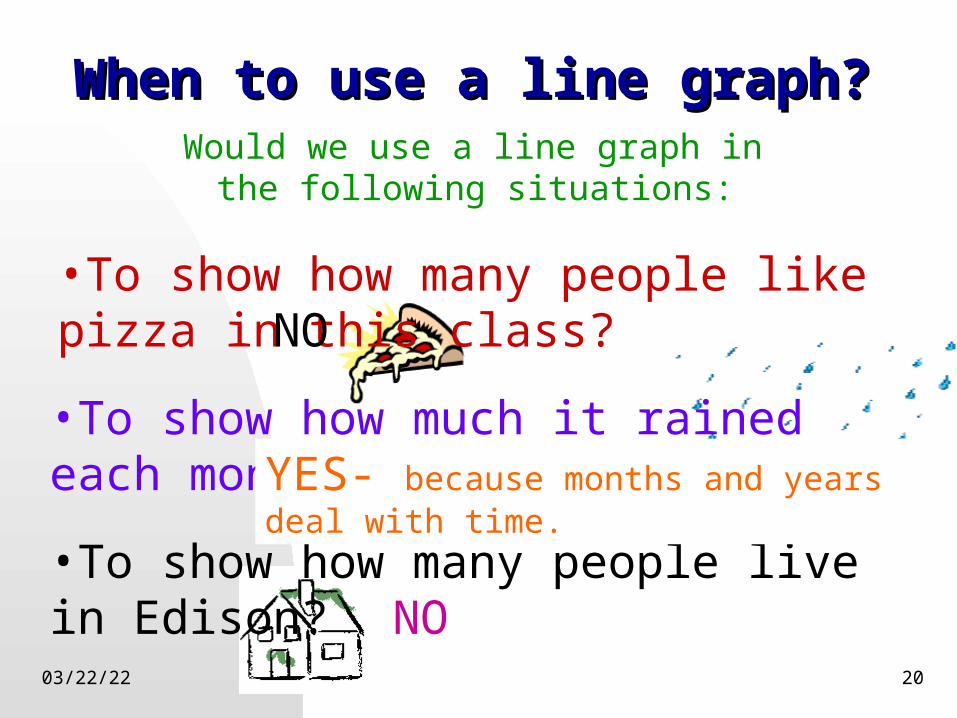
When to use a line graph?When to use a line graph? Would we use a line graph
in the following situations:•To show how many people like pizza in this class?NO
•To show how many people live in Edison? NO
•To show how much it rained each month this year? YES- because months and years deal with time.
04/19/23 21
Birthdays?Birthdays?
Our birthday does deal with time doesn’t it? (months/years)
But, our birthday is constant, meaning it never changes.
A line graph shows change in time, so we would not use it for this type of graph.
Would we use a line graph to show when our birthdays are?
04/19/23 22
Practice With GraphsPractice With Graphs
•Please study the graphs that you have and answer the questions.
•Then we will discuss the your answers.
04/19/23 23
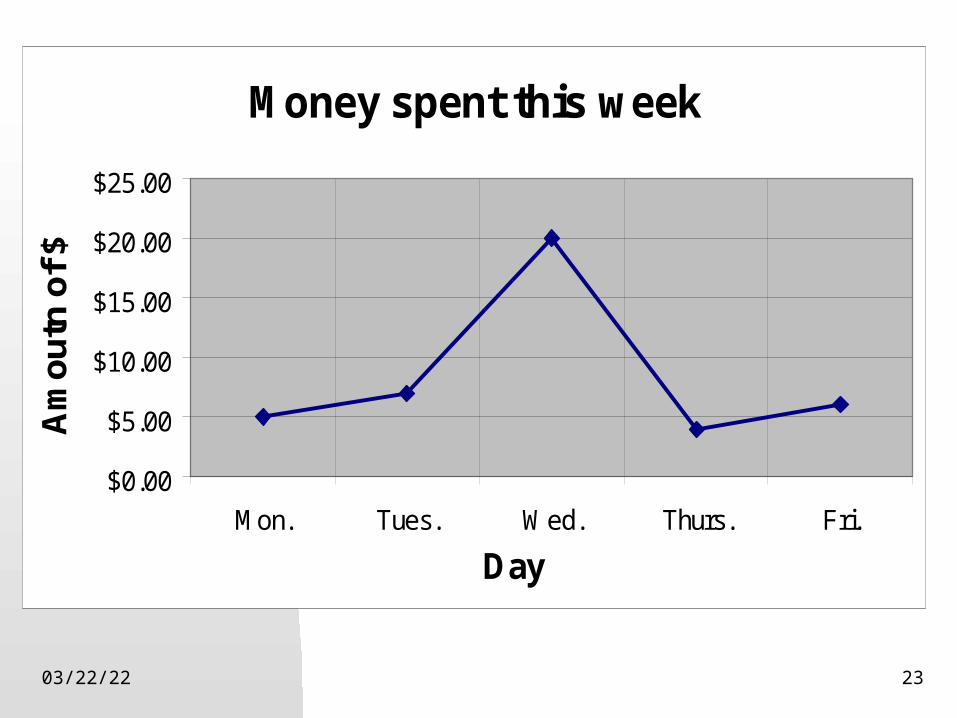
Money spent this week
$0.00
$5.00
$10.00
$15.00
$20.00
$25.00
Mon. Tues. Wed. Thurs. Fri.
Day
Am
ou
tn o
f $
04/19/23 24
Q & A
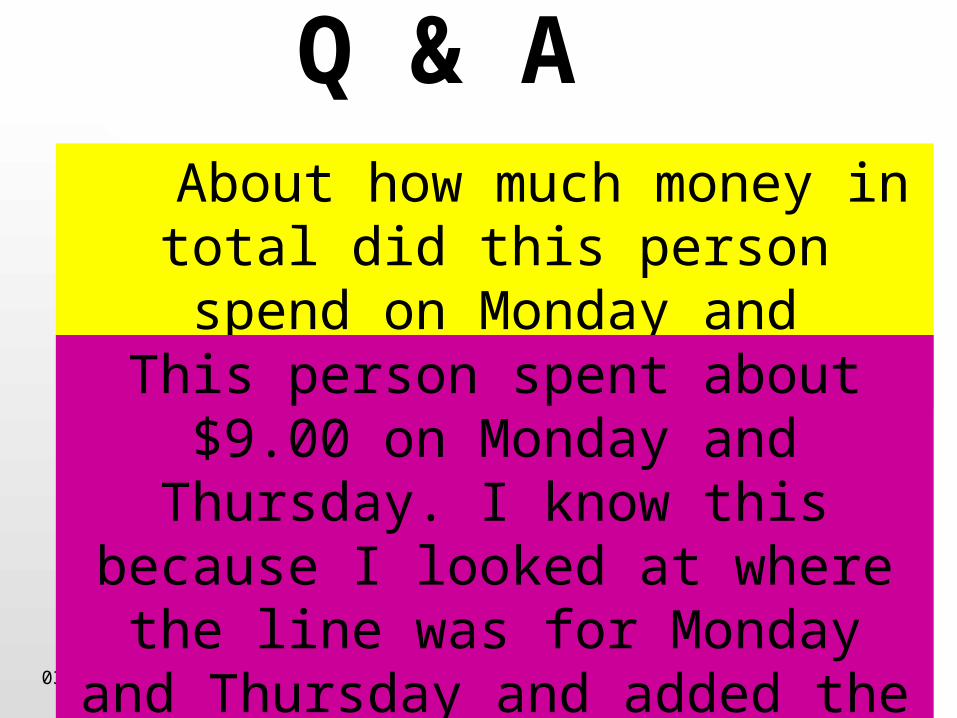
Which day did this person spend the most money? How do you know?
This person spent the most money on Wednesday. I know this because the graph is the highest on Wednesday.
About how much money in total did this person spend on Monday and
Thursday? How do you know?This person spent about $9.00 on
Monday and Thursday. I know this because I looked at where the line was for Monday and Thursday and added
the two amounts.
04/19/23 25
Miles traveled during the week
0
10
20
30
40
50
60
70
Mon. Tues. Wed. Thurs. Fri. Sat. Sun.
Days
Mile
s T
rav
ele
d

04/19/23 26
Q & A
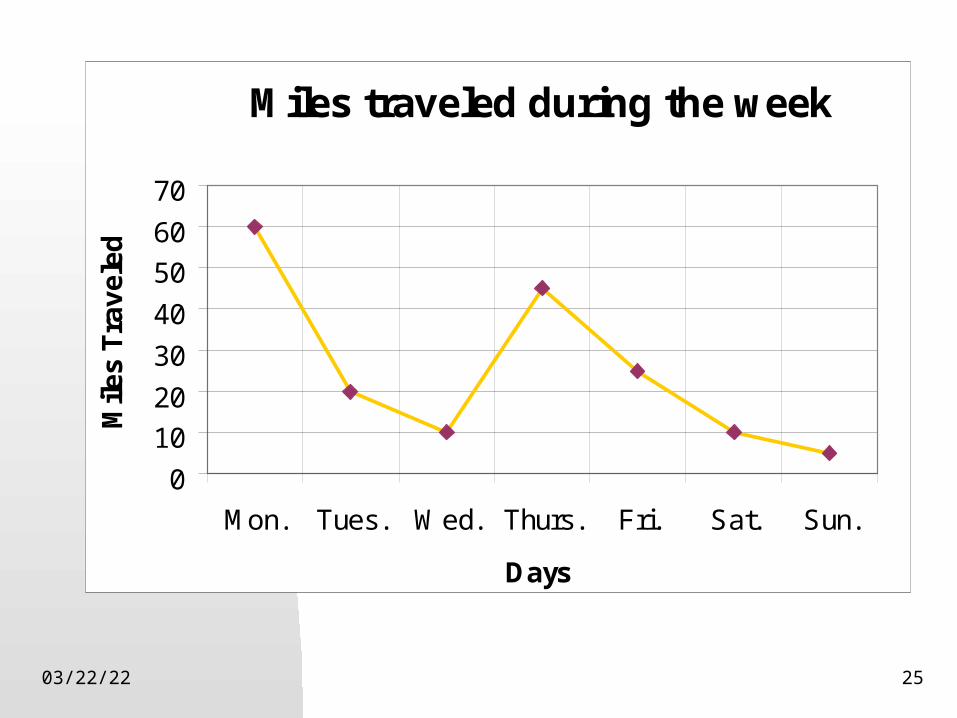
How many days did this person travel less than 30 miles?
Which day did the driver travel the least amount of miles?
Why might someone want to keep track of their miles for the week?
5 days
Sunday
To figure out how much gas they need a week.
04/19/23 27
U.S. Corn in Acres
55
60
65
70
75
80
85
Years
Acr
es o
f co
rn (
in m
illi
on
s)

04/19/23 28
Q & A
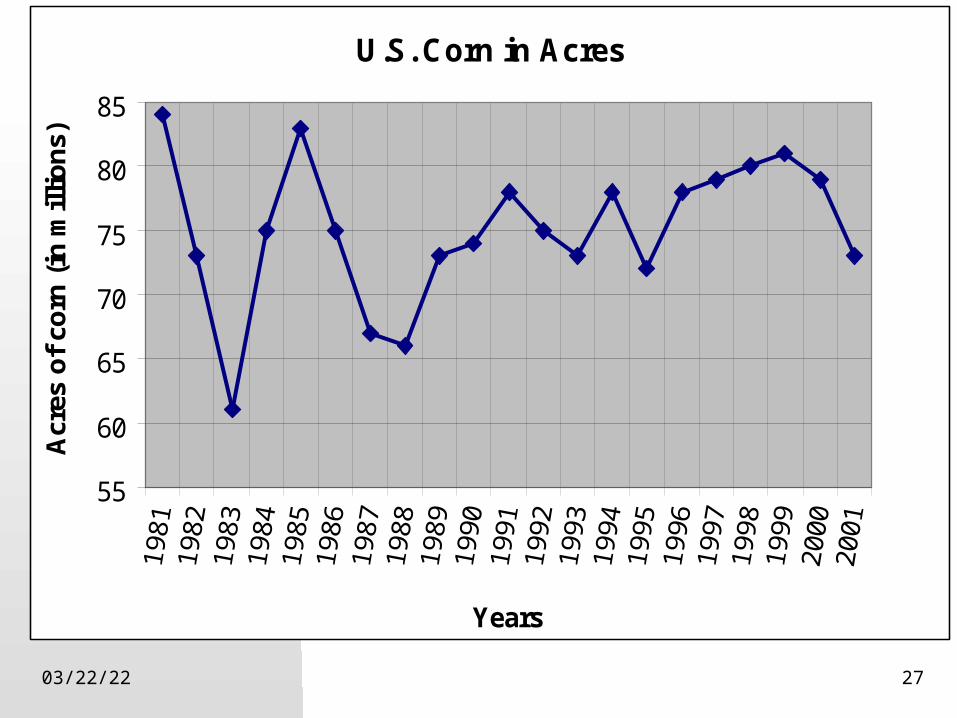
About how much corn did the U.S. have in 1991?
What does the y-axis represent in the graph?
Can you think of another title for this graph?
About 77 million acres
The rise and fall of corn in the U.S.
Acres of corn in millions.

04/19/23 29
Calories burned while running
0
20
40
60
80
100
120
140
160
180
200
220
240
Hours
Ca
lori
es
04/19/23 30
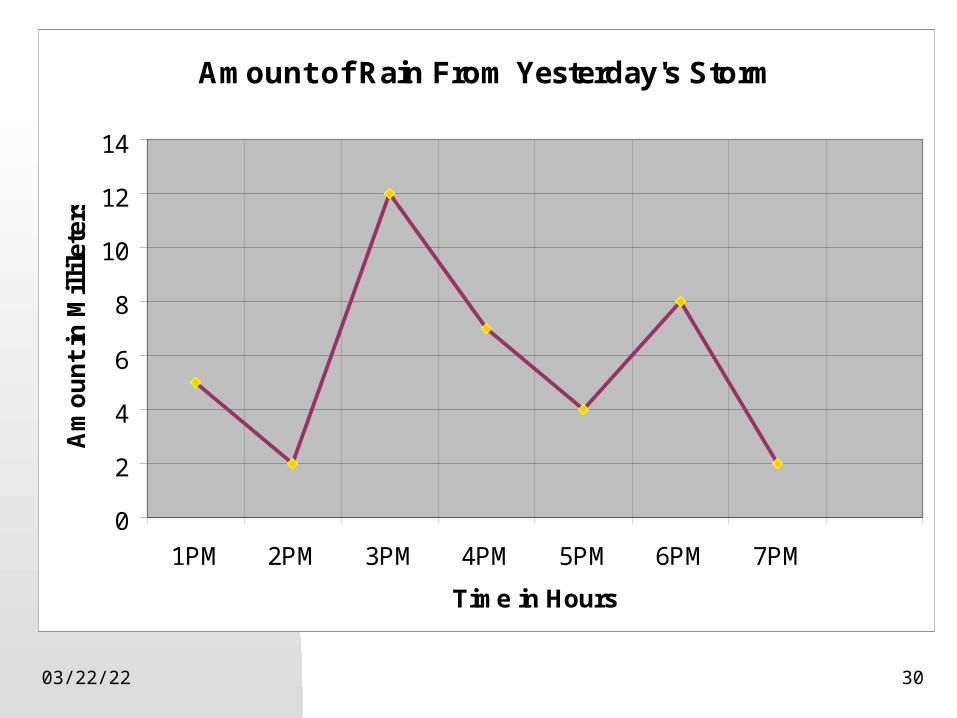
Amount of Rain From Yesterday's Storm
0
2
4
6
8
10
12
14
1PM 2PM 3PM 4PM 5PM 6PM 7PM
Time in Hours
Am
ou
nt
in M
illi
lete
rs

04/19/23 31
Calories burned while running
0
20
40
60
80
100
120
140
160
180
200
220
240
Hours
Calo
ries
04/19/23 32
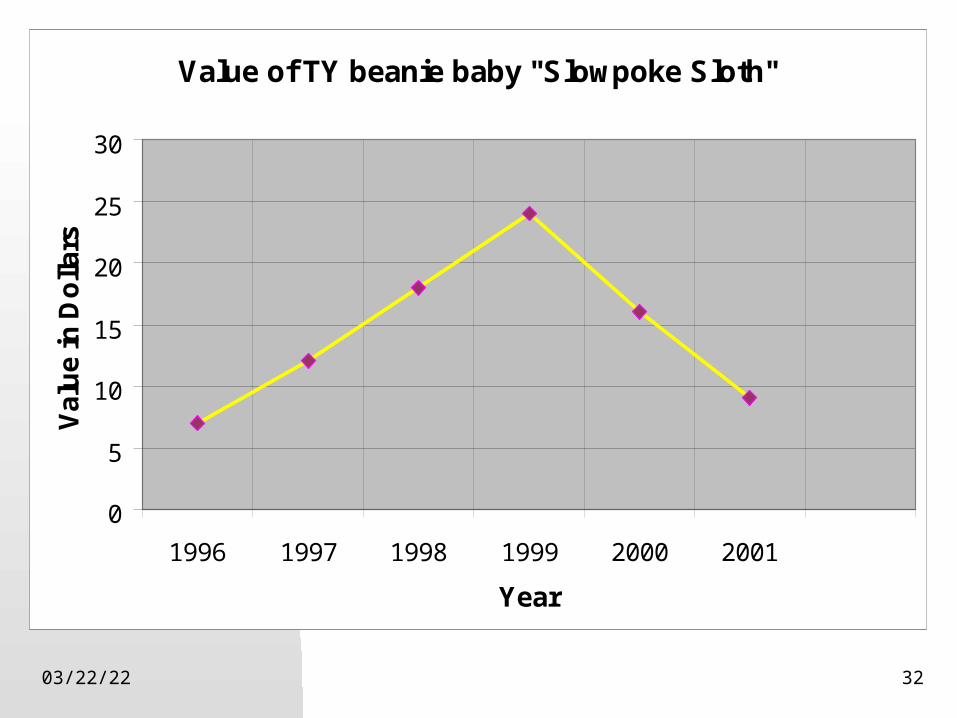
Value of TY beanie baby "Slowpoke Sloth"
0
5
10
15
20
25
30
1996 1997 1998 1999 2000 2001
Year
Va
lue
in D
olla
rs
04/19/23 33
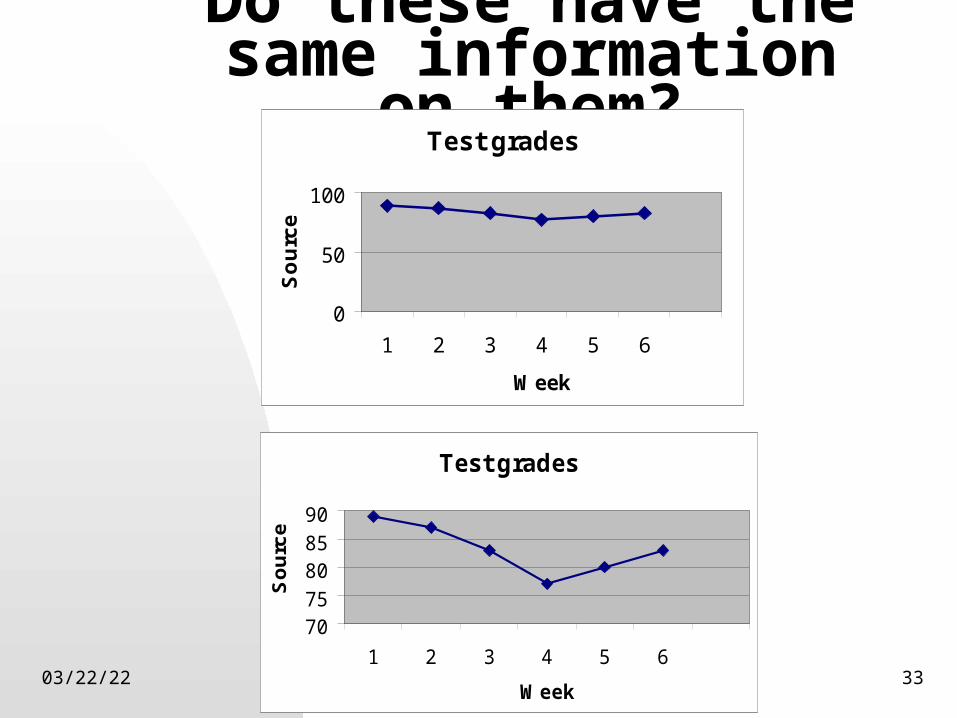
Do these have the same information on them?
Test grades
0
50
100
1 2 3 4 5 6
Week
So
urc
e
Test grades
7075
8085
90
1 2 3 4 5 6
Week
So
urc
e

04/19/23 34
Great Job!


![G-SPARQL: a hybrid engine for querying large attributed graphs · E.1 [Data Structures]: Graphs and networks Keywords Graphs, Graph Queries, SPARQL 1. INTRODUCTION Recently, graph](https://img.pdfslide.us/doc/110x75/5ed2510be0d2e942d71afe01/g-sparql-a-hybrid-engine-for-querying-large-attributed-graphs-e1-data-structures.jpg)