Embed Size (px)
Citation preview
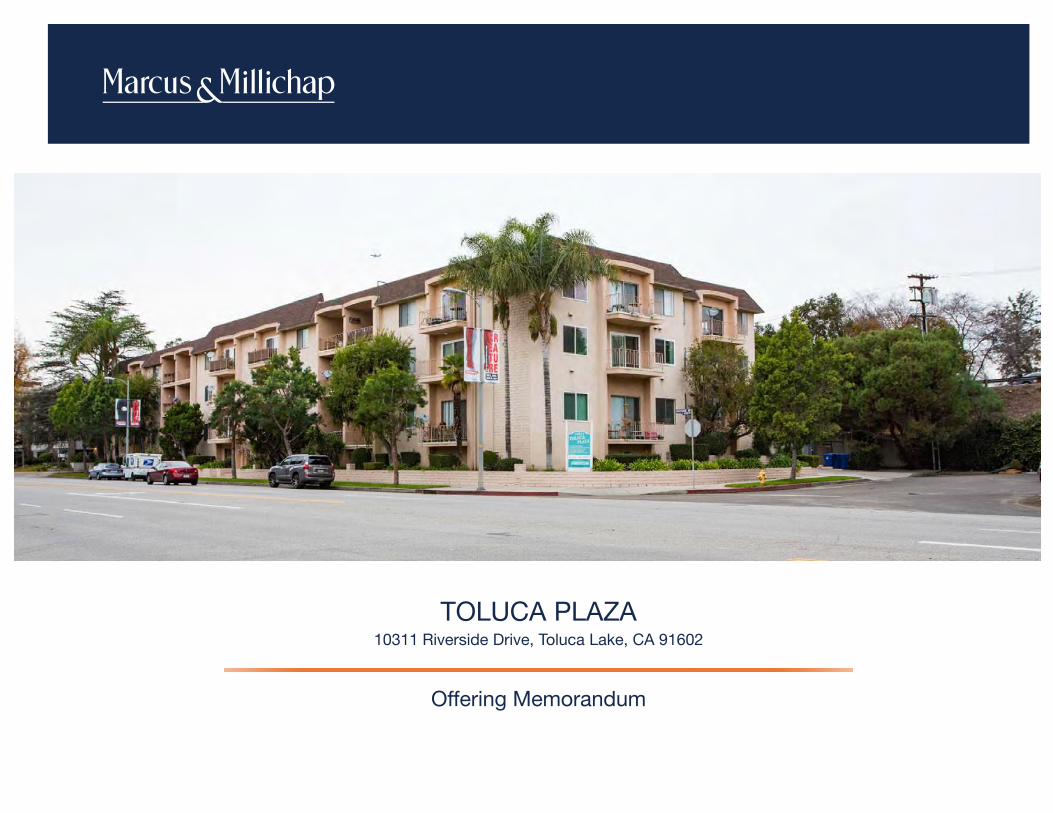
TOLUCA PLAZA
Offering Memorandum
10311 Riverside Drive, Toluca Lake, CA 91602
TOLUCA PLAZA
Toluca Lake, CA
ACT ID Y0120006
N O N - E N D O R S E M E N T A N D D I S C L A I M E R N O T I C E
Non-EndorsementsMarcus & Millichap is not affiliated with, sponsored by, or endorsed by any commercial tenant or lessee identified in
this marketing package. The presence of any corporation's logo or name is not intended to indicate or imply affiliation
with, or sponsorship or endorsement by, said corporation of Marcus & Millichap, its affiliates or subsidiaries, or any
agent, product, service, or commercial listing of Marcus & Millichap, and is solely included for the purpose of
providing tenant lessee information about this listing to prospective customers.
ALL PROPERTY SHOWINGS ARE BY APPOINTMENT ONLY.
PLEASE CONSULT YOUR MARCUS & MILLICHAP AGENT FOR MORE DETAILS.
DisclaimerTHIS IS A BROKER PRICE OPINION OR COMPARATIVE MARKET ANALYSIS OF VALUE AND SHOULD NOT BE
CONSIDERED AN APPRAISAL. This information has been secured from sources we believe to be reliable, but we
make no representations or warranties, express or implied, as to the accuracy of the information. References to
square footage or age are approximate. Buyer must verify the information and bears all risk for any inaccuracies.
Marcus & Millichap is a service mark of Marcus & Millichap Real Estate Investment Services, Inc. © 2016 Marcus &
Millichap. All rights reserved.
P R E S E N T E D B Y
Jeff Louks
Executive Vice President Investments
Senior Director - National Multi Housing
Group
Encino Office
Tel: (818) 212-2780
Fax: (818) 212-2710
License: CA 00908473
Brett Sanson
Vice President Investments
Director - National Multi Housing Group
Encino Office
Tel: (818) 212-2785
Fax: (818) 212-2710
License: CA 01387480
Gayle Factor
First Vice President Investments
Director - National Multi Housing Group
Encino Office
Tel: (818) 212-2756
Fax: (818) 212-2710
License: CA 01066258
TABLE OF CONTENTS
SECTION
FINANCIAL ANALYSIS 01Rent Roll Summary
Rent Roll Detail
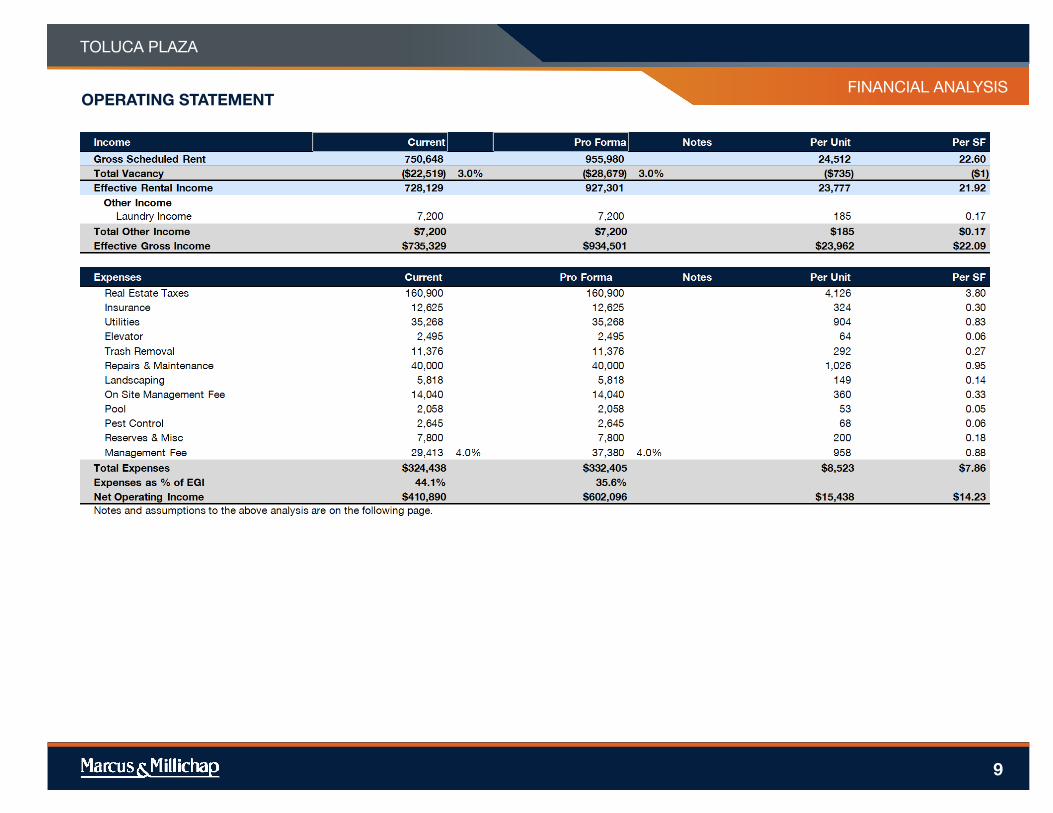
Operating Statement
Notes
Pricing Detail
INVESTMENT OVERVIEW 02Property Overview
Regional Map
Local Map
Aerial Photo
MARKET COMPARABLES 03Comparables
Rent Comparables
MARKET OVERVIEW 04
Market Analysis
Demographic Analysis
TOLUCA PLAZA
TOLUCA PLAZA
5
FINANCIAL
ANALYSIS
FINANCIAL ANALYSIS
TOLUCA PLAZA
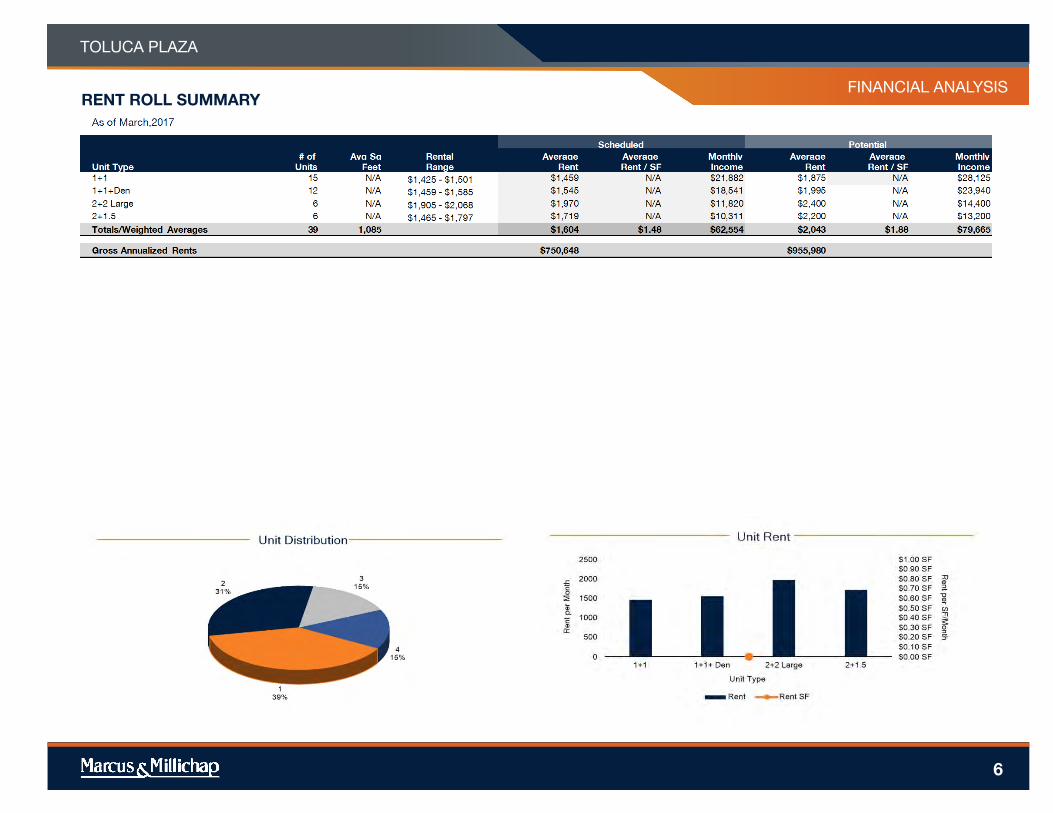
RENT ROLL SUMMARY
6
FINANCIAL ANALYSIS
TOLUCA PLAZA
7
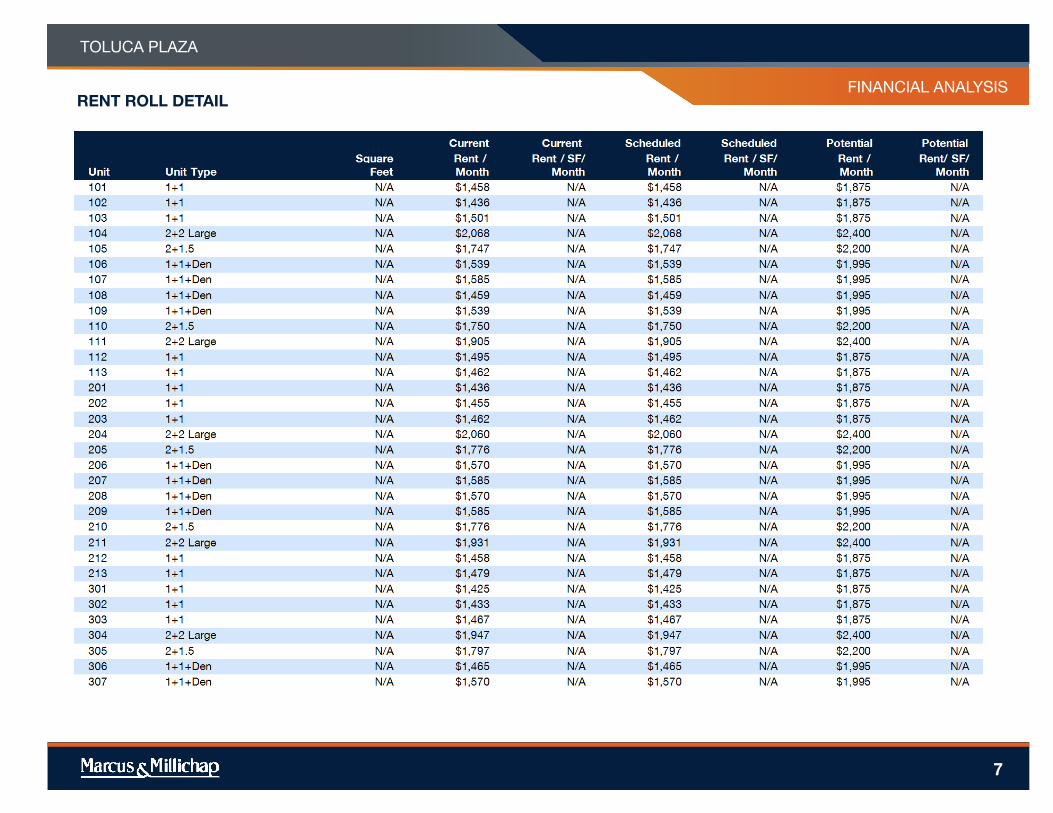
RENT ROLL DETAIL
FINANCIAL ANALYSIS
TOLUCA PLAZA
8
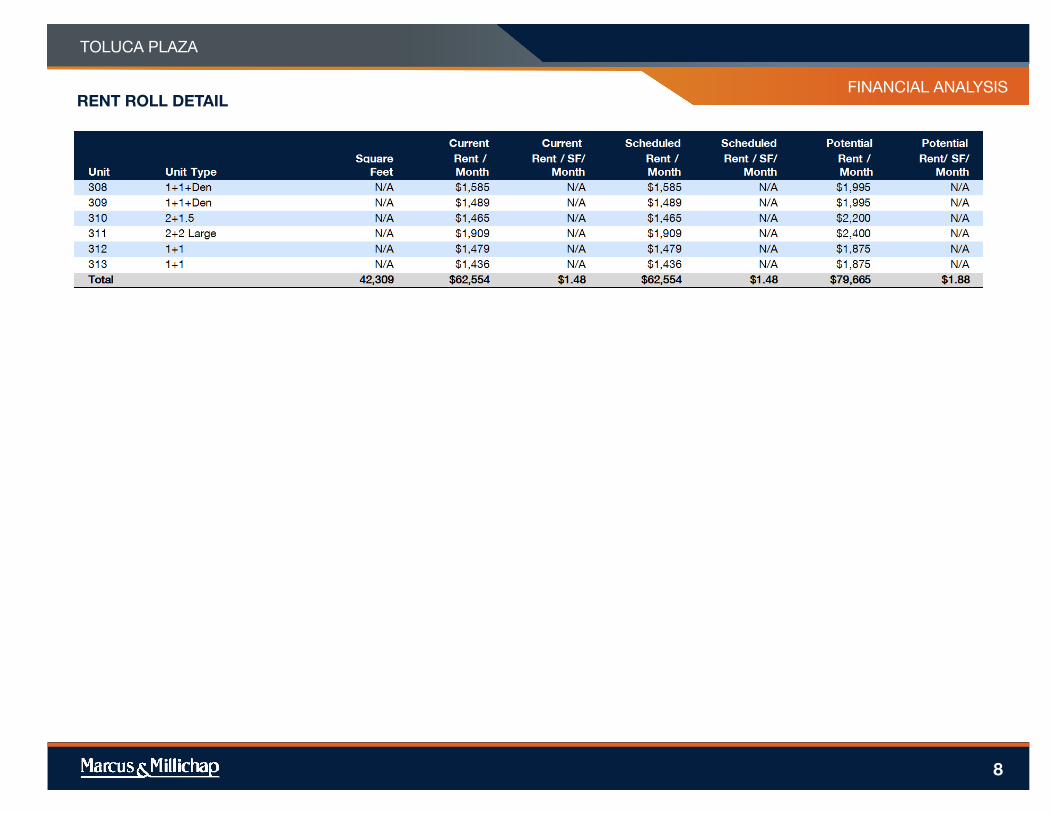
RENT ROLL DETAIL
FINANCIAL ANALYSIS
TOLUCA PLAZA
OPERATING STATEMENT
9
FINANCIAL ANALYSIS
TOLUCA PLAZA
NOTES
10
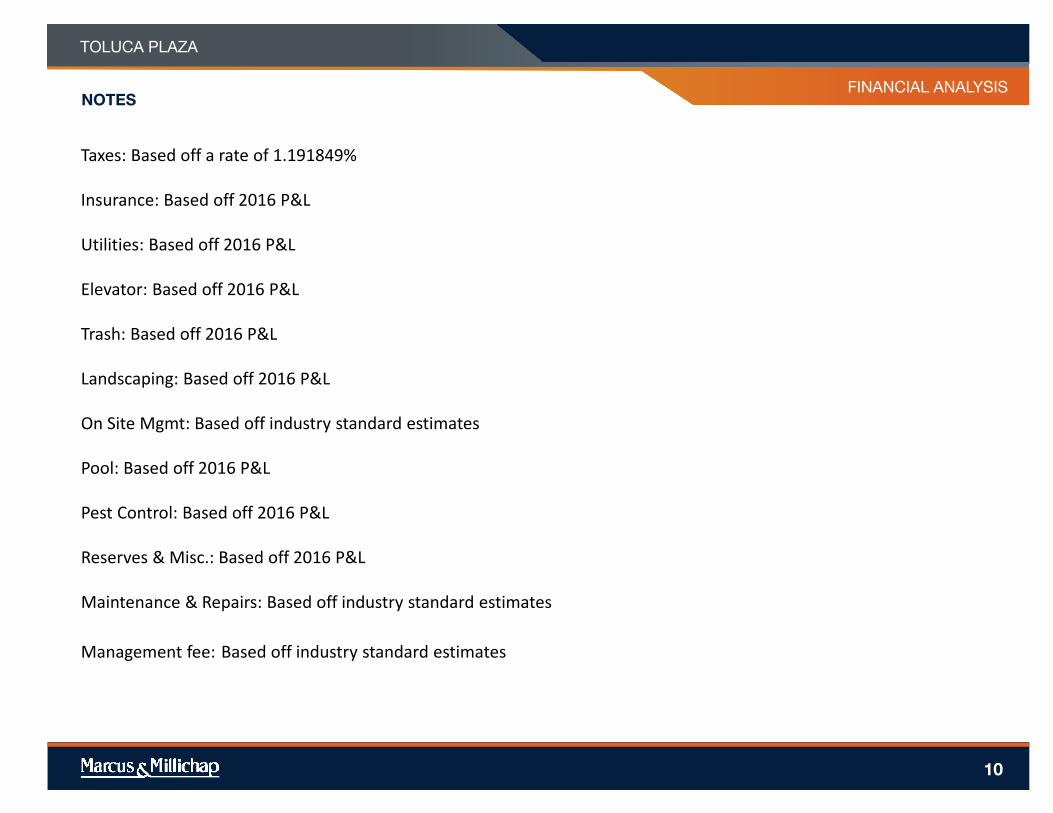
Taxes: Based off a rate of 1.191849%
Insurance: Based off 2016 P&L
Utilities: Based off 2016 P&L
Elevator: Based off 2016 P&L
Trash: Based off 2016 P&L
Landscaping: Based off 2016 P&L
On Site Mgmt: Based off industry standard estimates
Pool: Based off 2016 P&L
Pest Control: Based off 2016 P&L
Reserves & Misc.: Based off 2016 P&L
Maintenance & Repairs: Based off industry standard estimates
Management fee: Based off industry standard estimates
FINANCIAL ANALYSIS
TOLUCA PLAZA
PRICING DETAIL
11
TOLUCA PLAZA
12
INVESTMENT
OVERVIEW
PROPERTY OVERVIEW
TOLUCA PLAZA
PROPERTY OVERVIEW
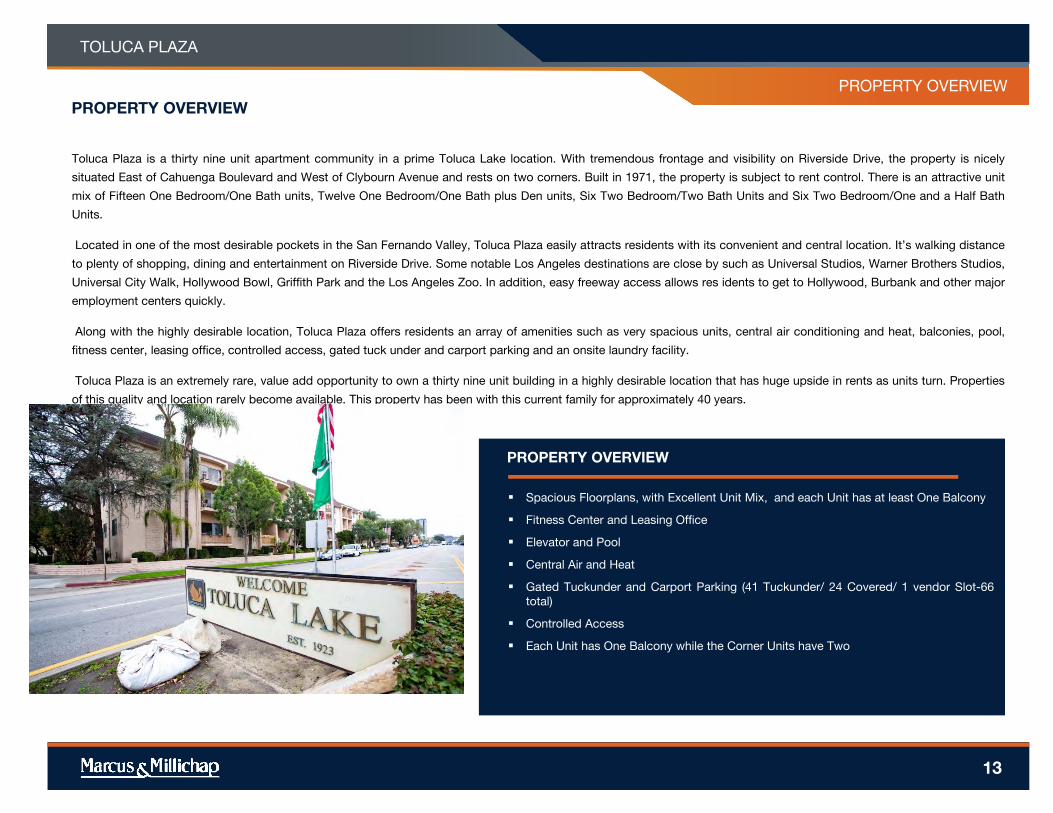
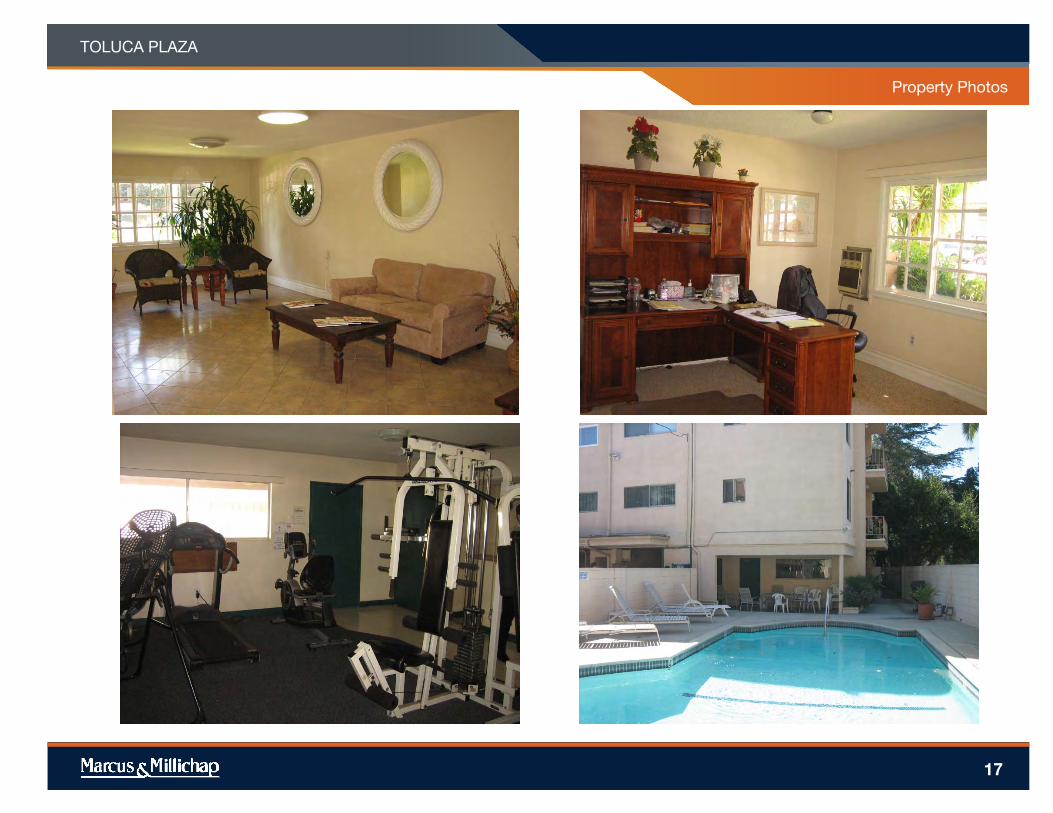
Toluca Plaza is a thirty nine unit apartment community in a prime Toluca Lake location. With tremendous frontage and visibility on Riverside Drive, the property is nicely
situated East of Cahuenga Boulevard and West of Clybourn Avenue and rests on two corners. Built in 1971, the property is subject to rent control. There is an attractive unit
mix of Fifteen One Bedroom/One Bath units, Twelve One Bedroom/One Bath plus Den units, Six Two Bedroom/Two Bath Units and Six Two Bedroom/One and a Half Bath
Units.
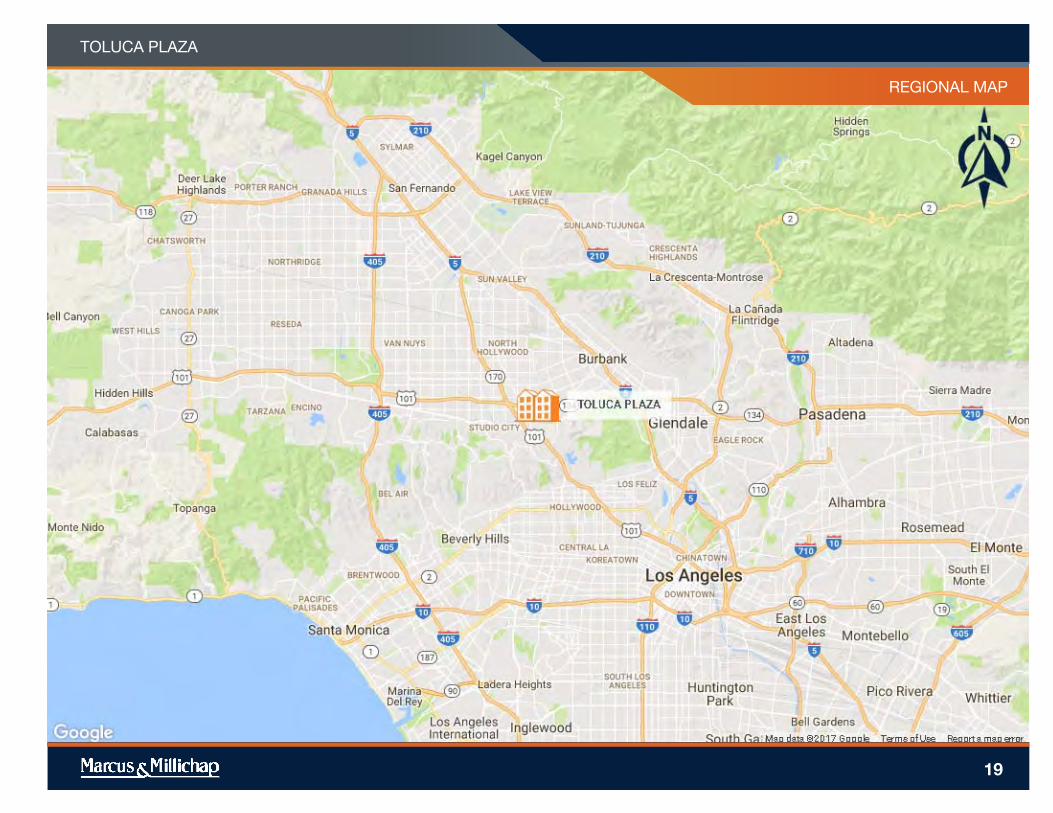
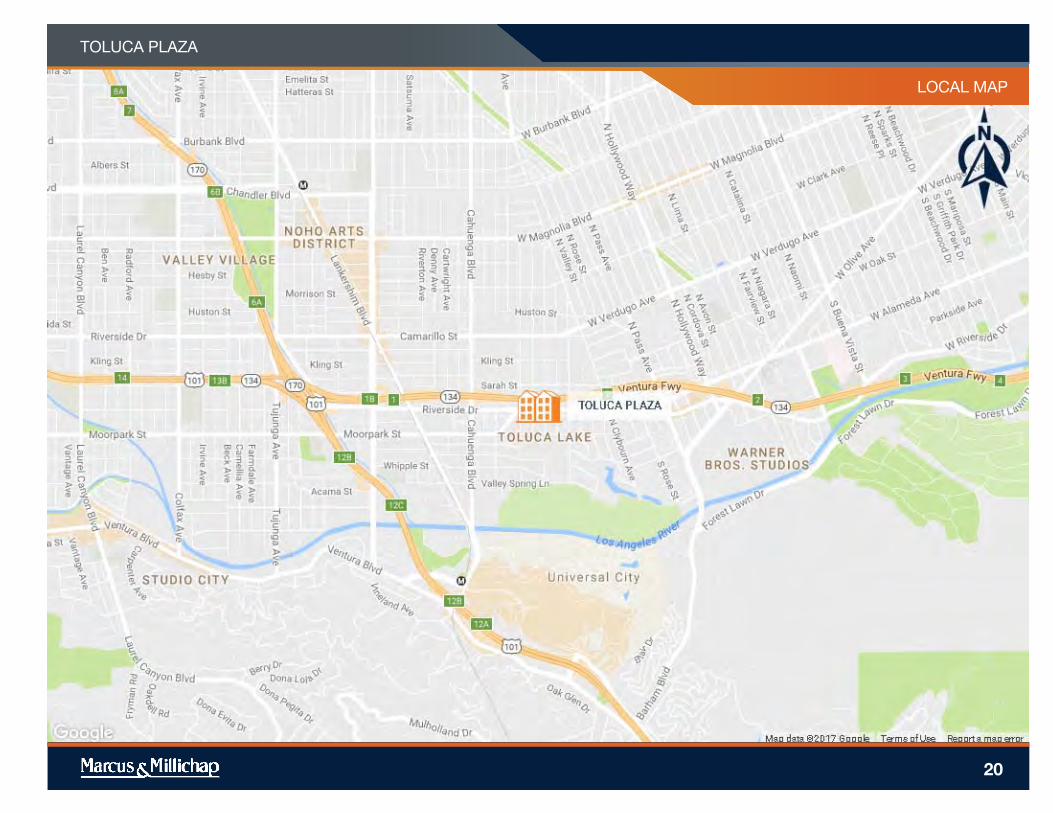
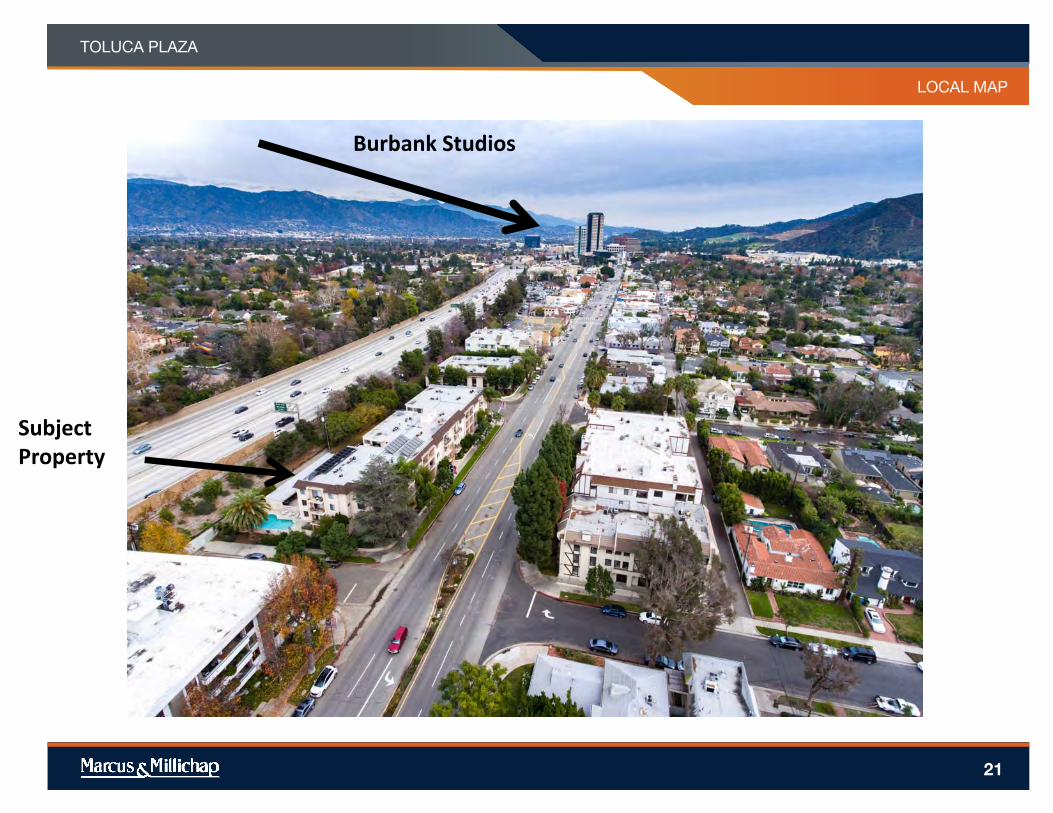
Located in one of the most desirable pockets in the San Fernando Valley, Toluca Plaza easily attracts residents with its convenient and central location. It’s walking distance
to plenty of shopping, dining and entertainment on Riverside Drive. Some notable Los Angeles destinations are close by such as Universal Studios, Warner Brothers Studios,
Universal City Walk, Hollywood Bowl, Griffith Park and the Los Angeles Zoo. In addition, easy freeway access allows res idents to get to Hollywood, Burbank and other major
employment centers quickly.
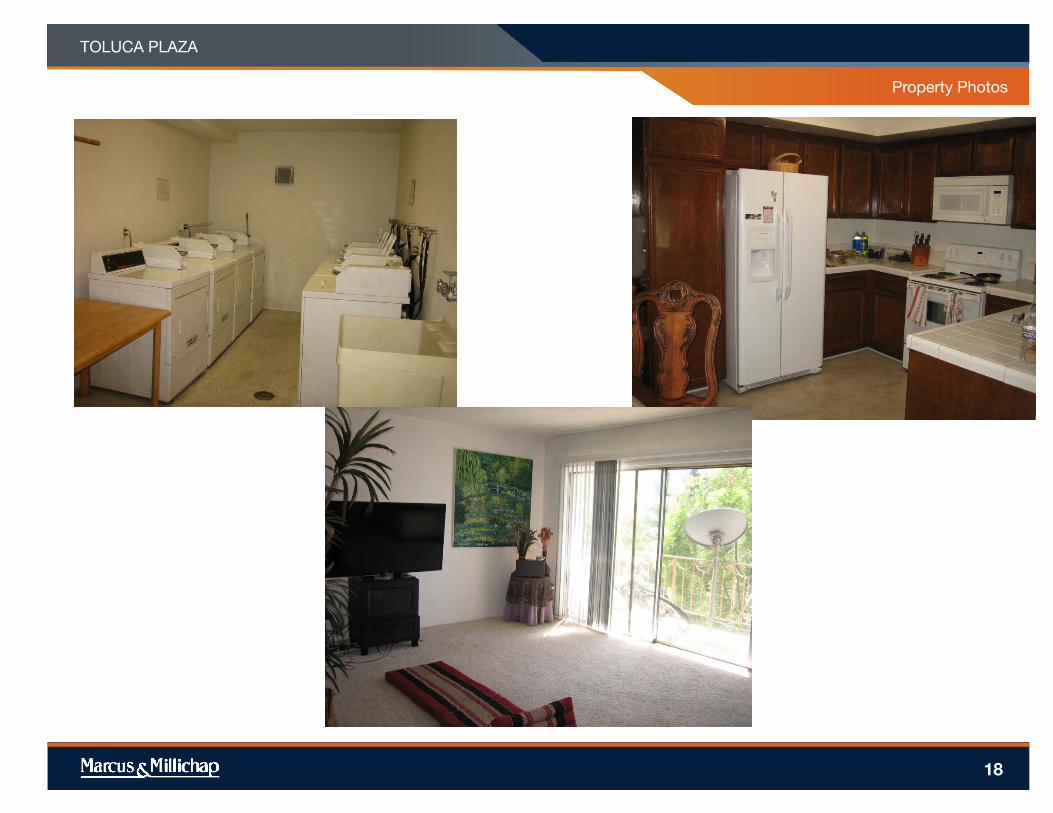
Along with the highly desirable location, Toluca Plaza offers residents an array of amenities such as very spacious units, central air conditioning and heat, balconies, pool,
fitness center, leasing office, controlled access, gated tuck under and carport parking and an onsite laundry facility.
Toluca Plaza is an extremely rare, value add opportunity to own a thirty nine unit building in a highly desirable location that has huge upside in rents as units turn. Properties
of this quality and location rarely become available. This property has been with this current family for approximately 40 years.
PROPERTY OVERVIEW
Spacious Floorplans, with Excellent Unit Mix, and each Unit has at least One Balcony
Fitness Center and Leasing Office
Elevator and Pool
Central Air and Heat
Gated Tuckunder and Carport Parking (41 Tuckunder/ 24 Covered/ 1 vendor Slot-66
total)
Controlled Access
Each Unit has One Balcony while the Corner Units have Two
13
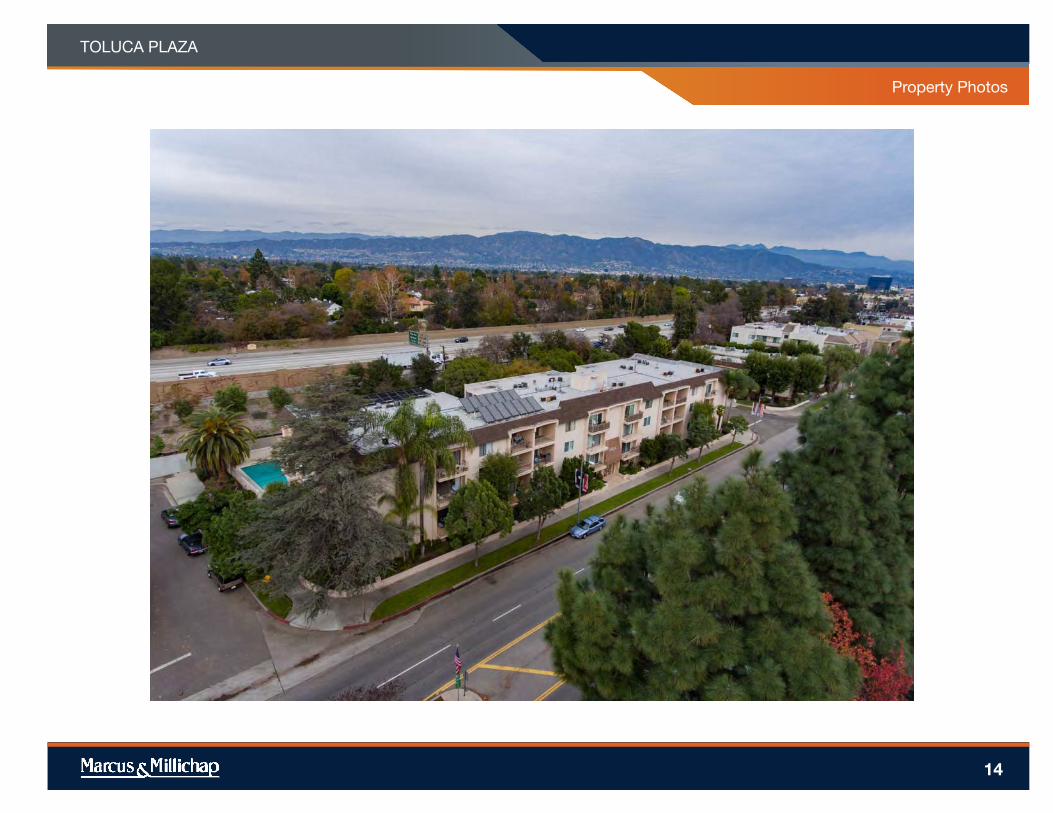
Property Photos
TOLUCA PLAZA
14
Property Photos
TOLUCA PLAZA
15
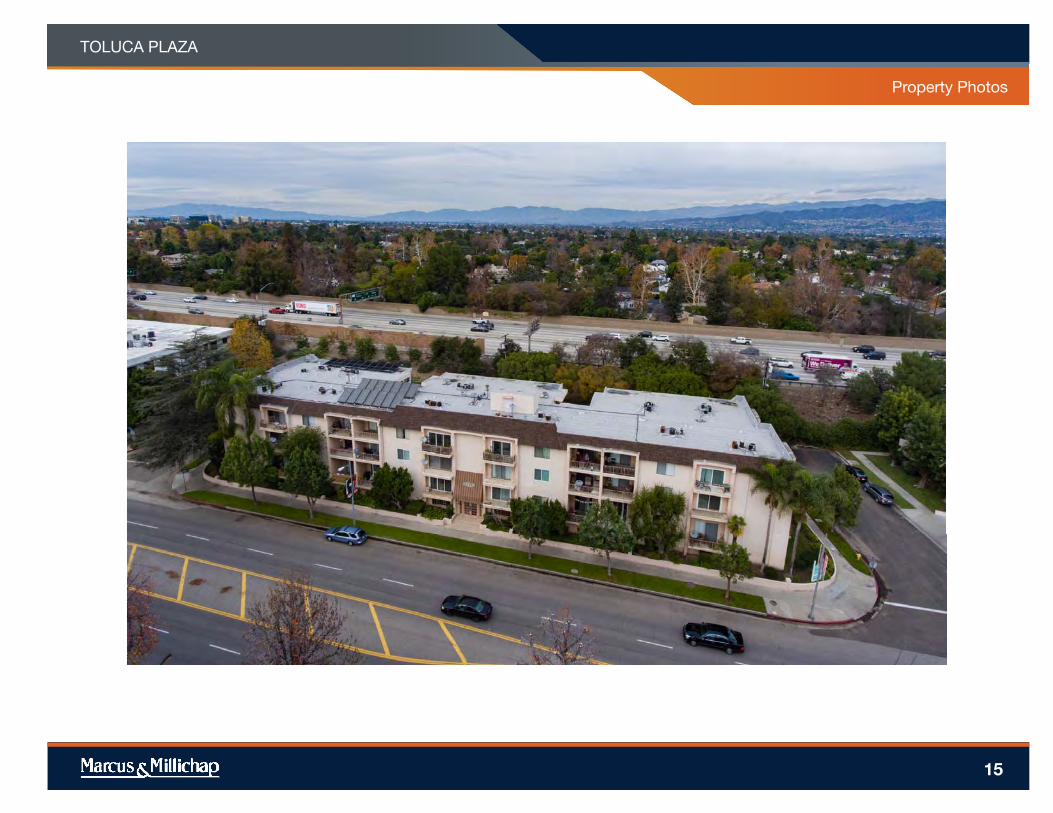
Property Photos
TOLUCA PLAZA
16
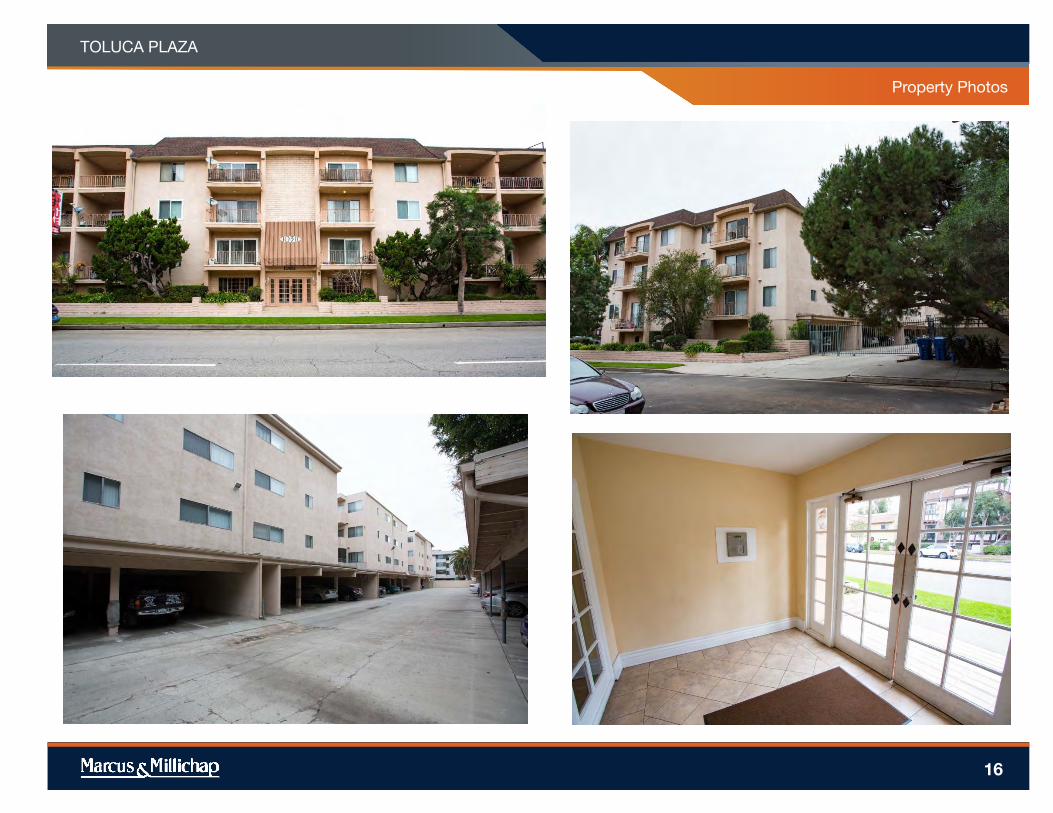
Property Photos
TOLUCA PLAZA
17
Property Photos
TOLUCA PLAZA
18
REGIONAL MAP
TOLUCA PLAZA
19
LOCAL MAP
TOLUCA PLAZA
20
LOCAL MAP
TOLUCA PLAZA
21
Burbank Studios
Subject Property
LOCAL MAP
TOLUCA PLAZA
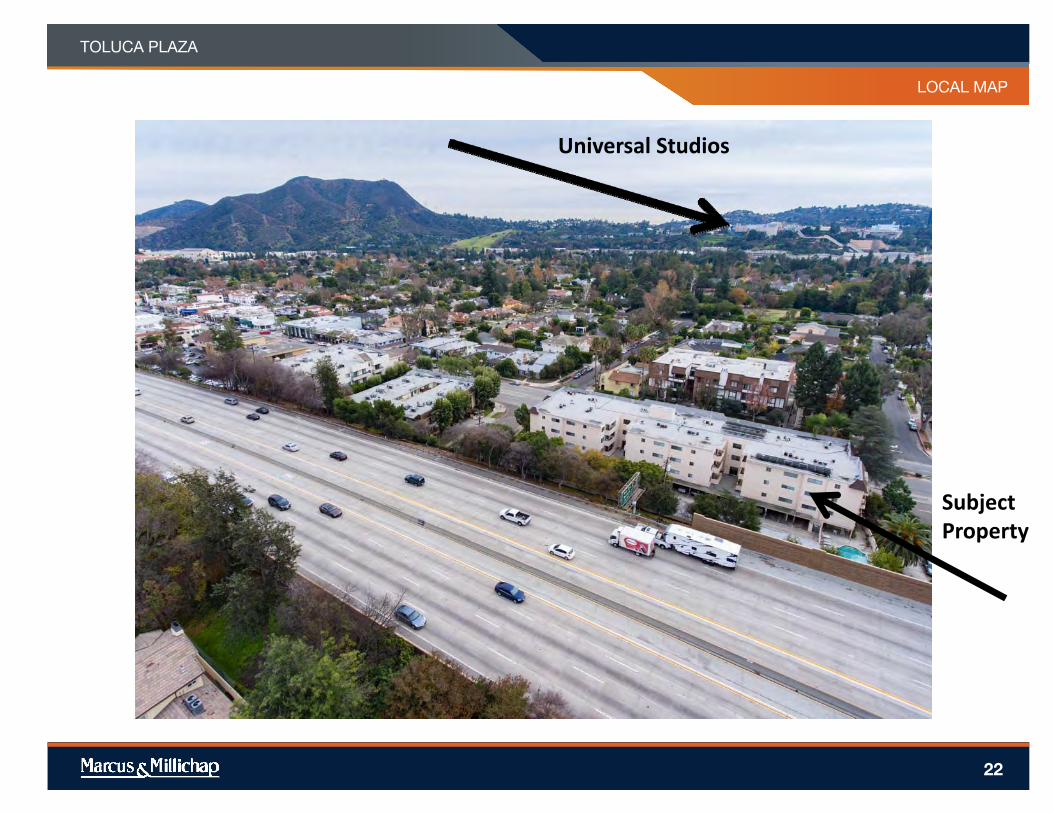
22
Universal Studios
Subject Property
LOCAL MAP
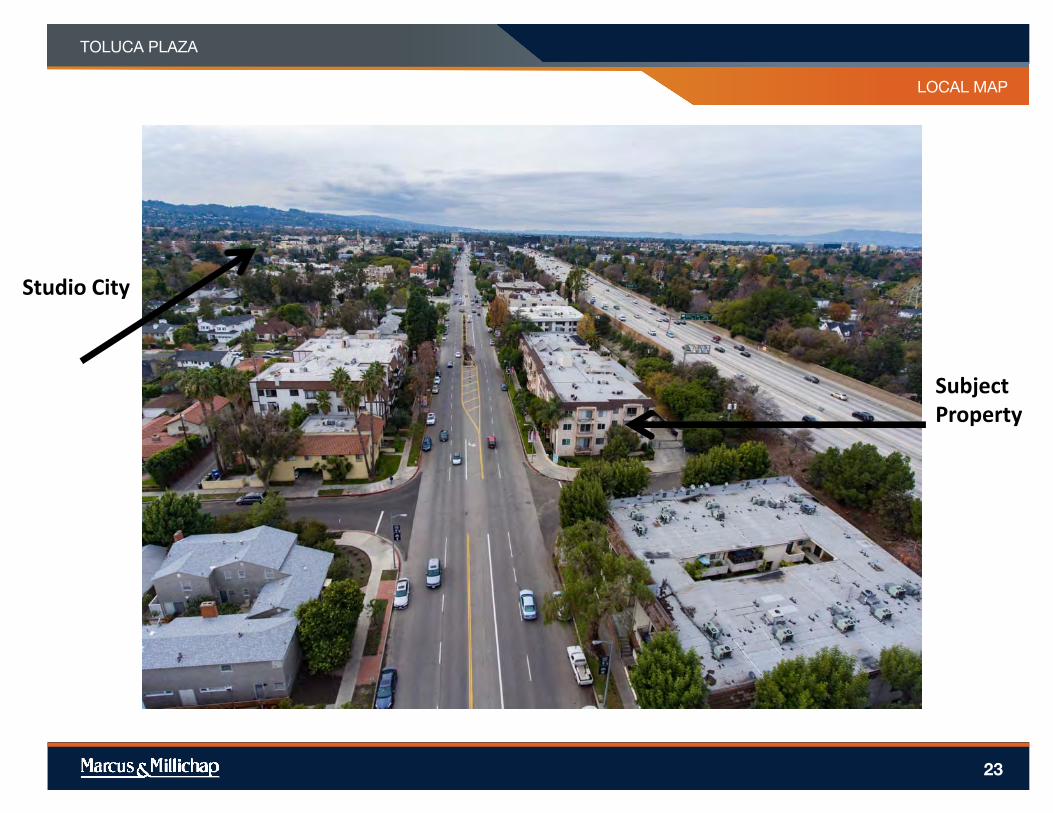
TOLUCA PLAZA
23
Studio City
SubjectProperty
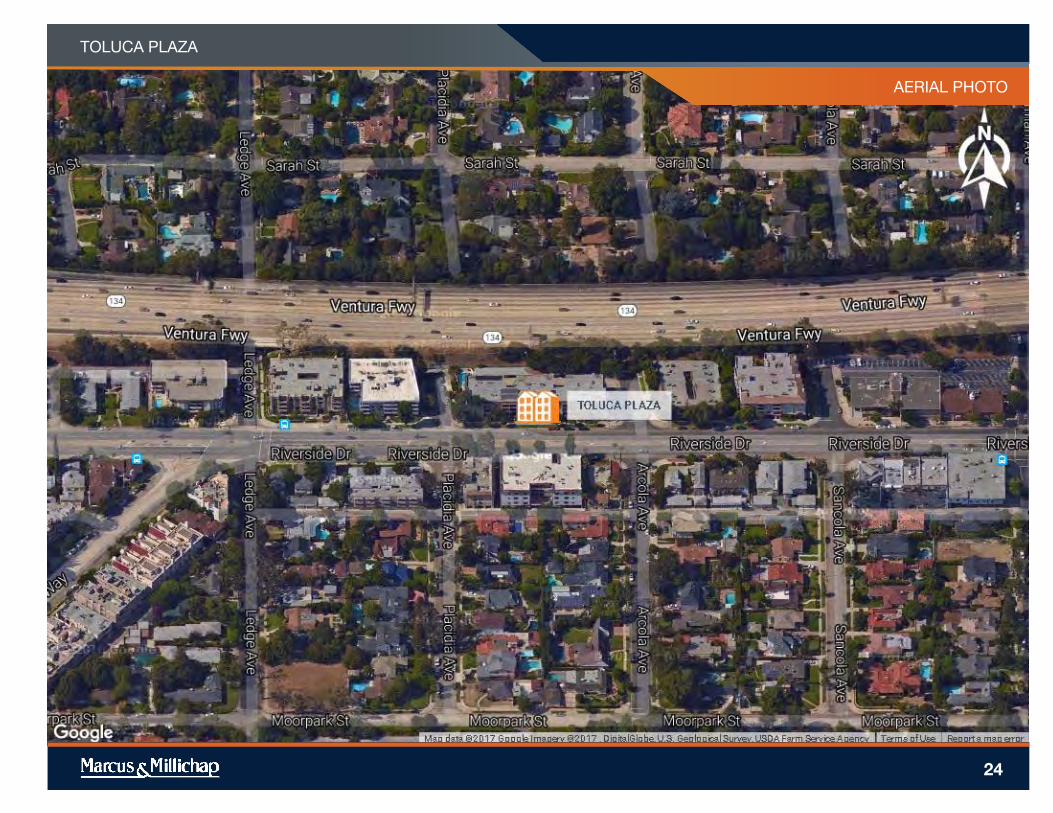
AERIAL PHOTO
TOLUCA PLAZA
24
TOLUCA PLAZA
25
MARKET
COMPARABLES
8
TOLUCA PLAZA
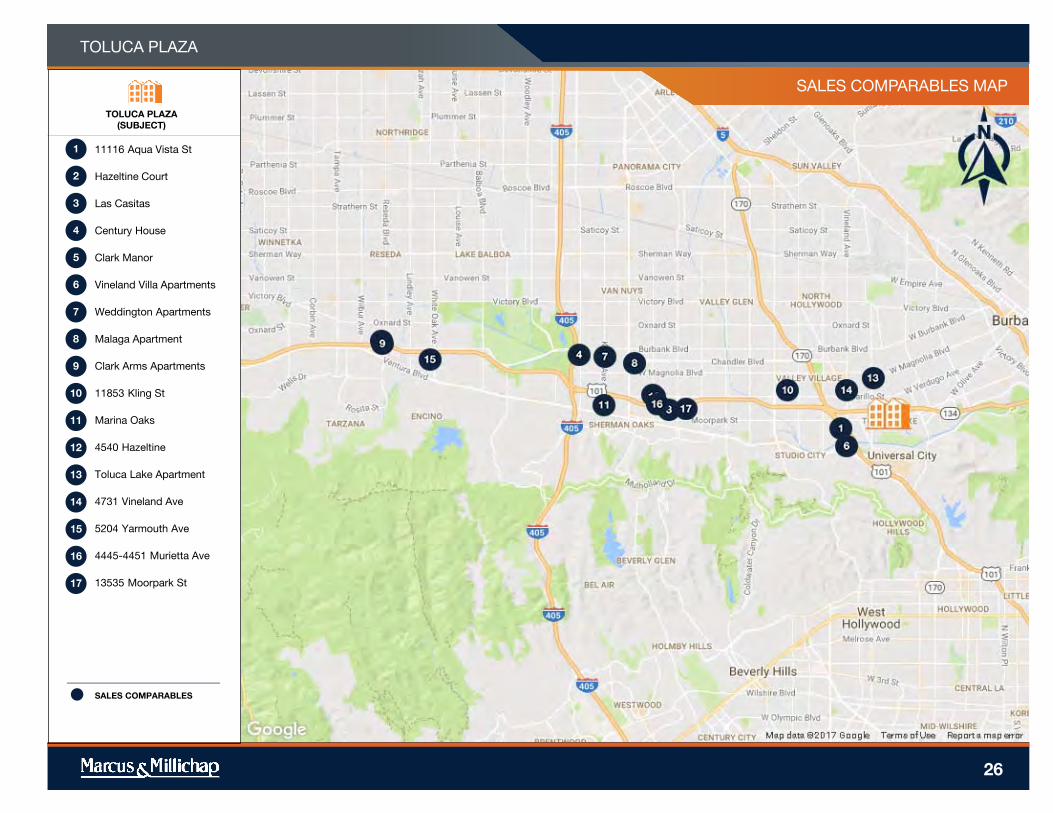
SALES COMPARABLES MAP
26
TOLUCA PLAZA
(SUBJECT)
11116 Aqua Vista St
Hazeltine Court
Las Casitas
Century House
Clark Manor
Vineland Villa Apartments
Weddington Apartments
Malaga Apartment
Clark Arms Apartments
11853 Kling St
Marina Oaks
4540 Hazeltine
Toluca Lake Apartment
4731 Vineland Ave
5204 Yarmouth Ave
4445-4451 Murietta Ave
13535 Moorpark St
SALES COMPARABLES
1
2
3
4
5
7
8
13
14
15
16
17
6
9
10
11
12
27
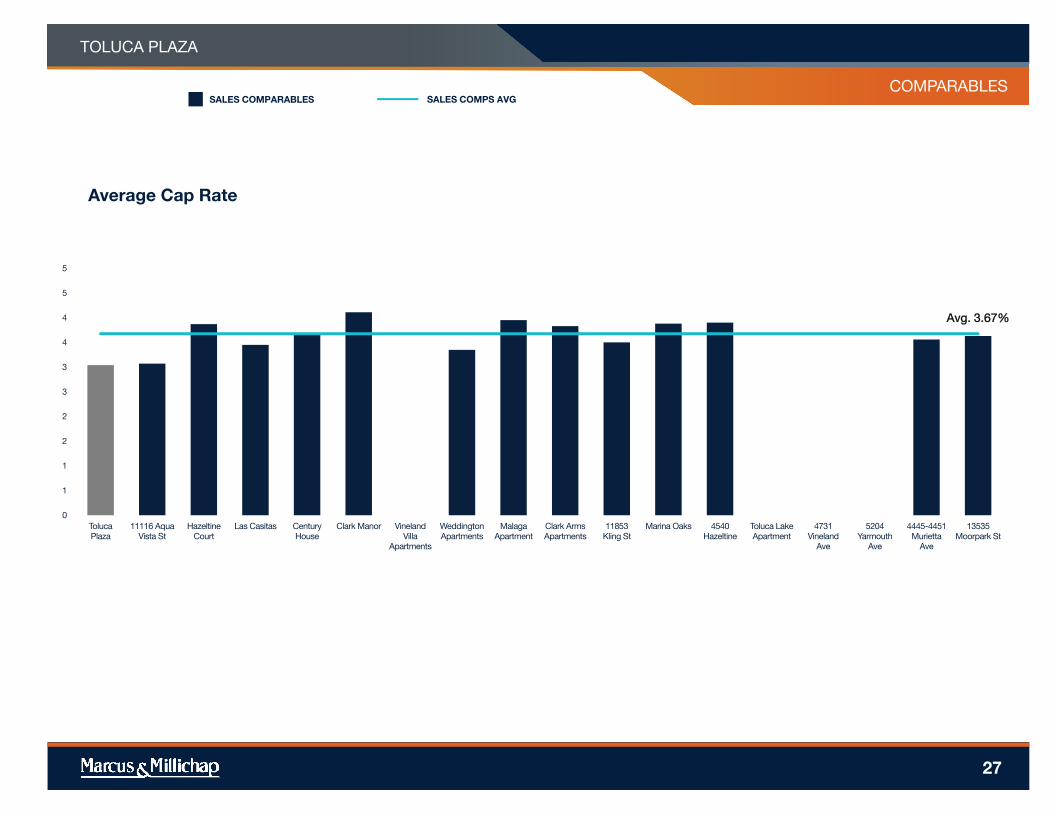
Avg. 3.67%
0
1
1
2
2
3
3
4
4
5
5
Toluca
Plaza
11116 Aqua
Vista St
Hazeltine
Court
Las Casitas Century
House
Clark Manor Vineland
Villa
Apartments
Weddington
Apartments
Malaga
Apartment
Clark Arms
Apartments
11853
Kling St
Marina Oaks 4540
Hazeltine
Toluca Lake
Apartment
4731
Vineland
Ave
5204
Yarmouth
Ave
4445-4451
Murietta
Ave
13535
Moorpark St
PROPERTY NAMETOLUCA PLAZA
COMPARABLES
Average Cap Rate
SALES COMPARABLES SALES COMPS AVG
28
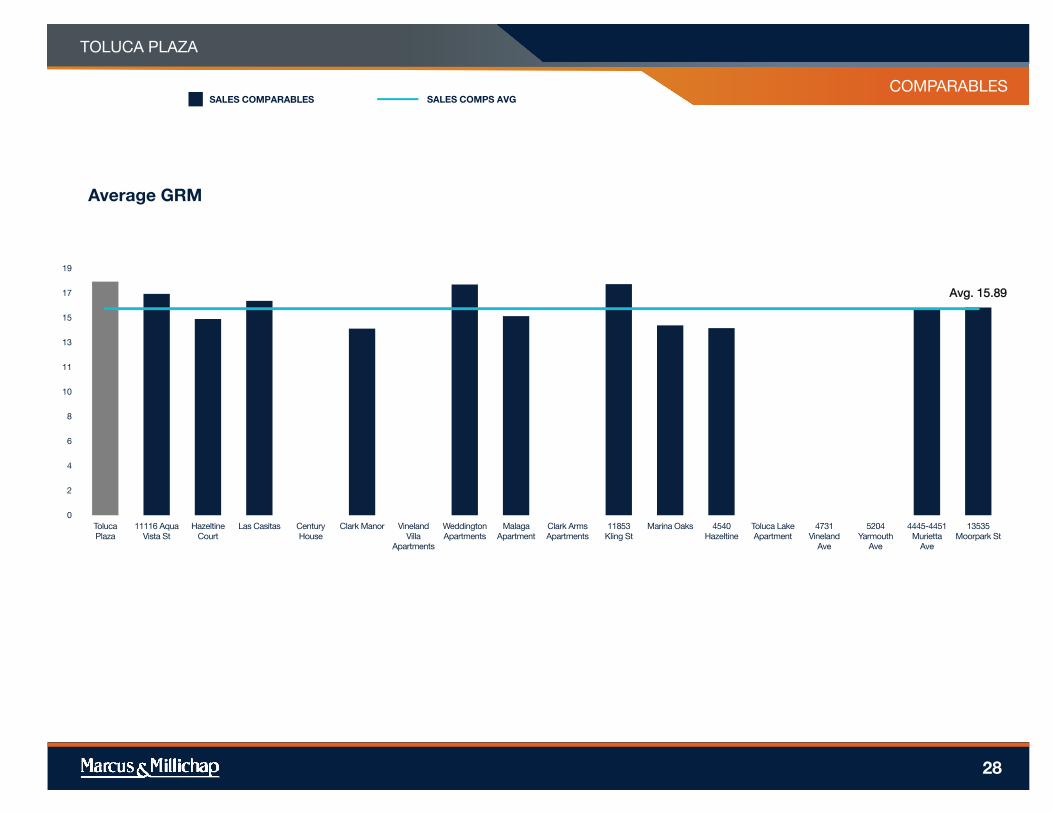
Avg. 15.89
0
2
4
6
8
10
11
13
15
17
19
Toluca
Plaza
11116 Aqua
Vista St
Hazeltine
Court
Las Casitas Century
House
Clark Manor Vineland
Villa
Apartments
Weddington
Apartments
Malaga
Apartment
Clark Arms
Apartments
11853
Kling St
Marina Oaks 4540
Hazeltine
Toluca Lake
Apartment
4731
Vineland
Ave
5204
Yarmouth
Ave
4445-4451
Murietta
Ave
13535
Moorpark St
PROPERTY NAMETOLUCA PLAZA
COMPARABLES
Average GRM
SALES COMPARABLES SALES COMPS AVG
29
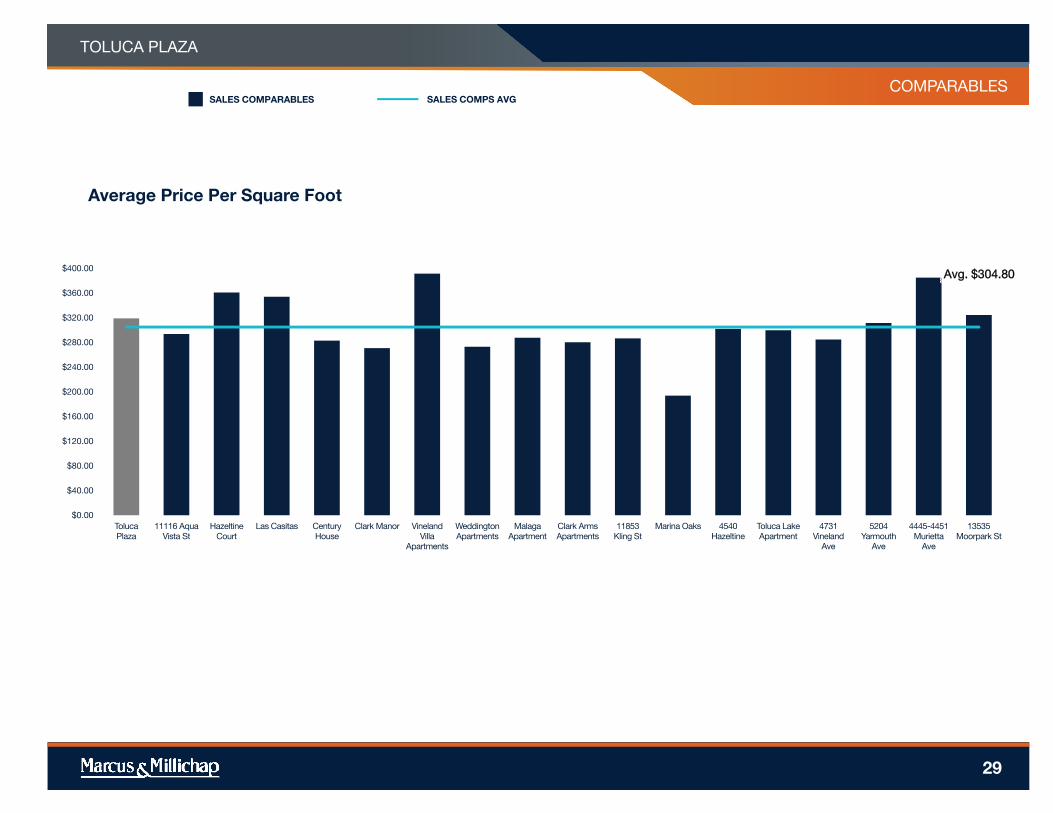
Avg. $304.80
$0.00
$40.00
$80.00
$120.00
$160.00
$200.00
$240.00
$280.00
$320.00
$360.00
$400.00
Toluca
Plaza
11116 Aqua
Vista St
Hazeltine
Court
Las Casitas Century
House
Clark Manor Vineland
Villa
Apartments
Weddington
Apartments
Malaga
Apartment
Clark Arms
Apartments
11853
Kling St
Marina Oaks 4540
Hazeltine
Toluca Lake
Apartment
4731
Vineland
Ave
5204
Yarmouth
Ave
4445-4451
Murietta
Ave
13535
Moorpark St
PROPERTY NAMETOLUCA PLAZA
COMPARABLES
Average Price Per Square Foot
SALES COMPARABLES SALES COMPS AVG
30
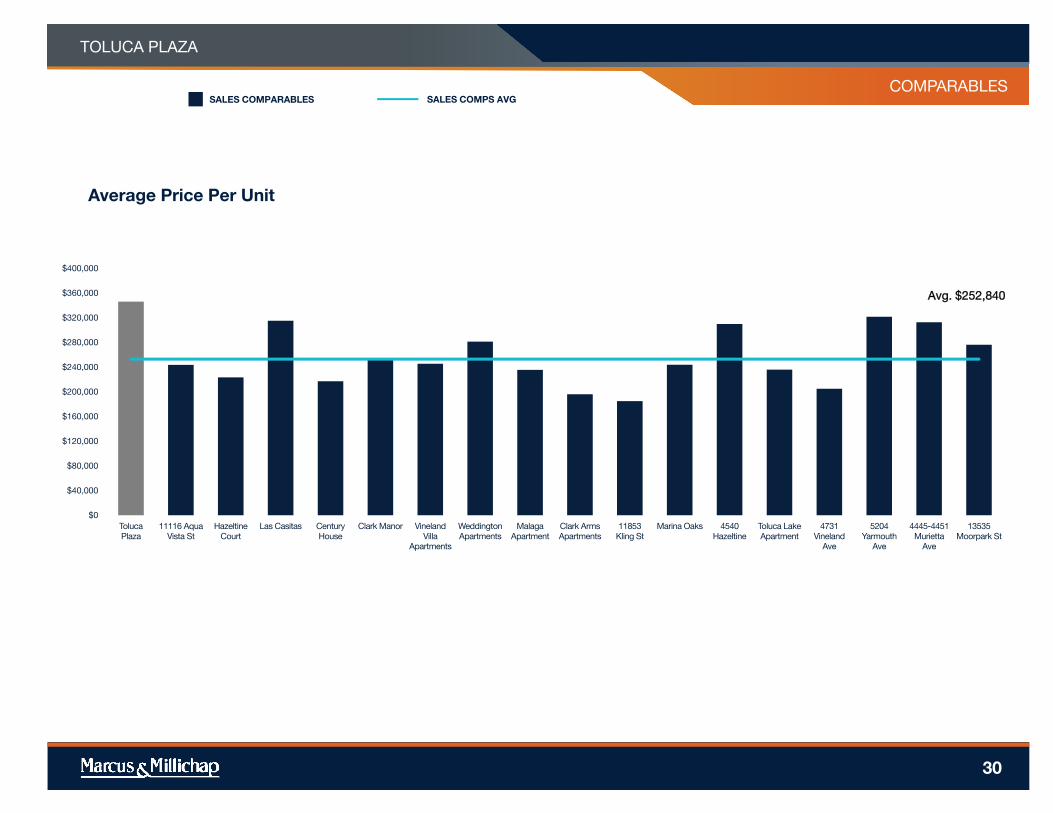
Avg. $252,840
$0
$40,000
$80,000
$120,000
$160,000
$200,000
$240,000
$280,000
$320,000
$360,000
$400,000
Toluca
Plaza
11116 Aqua
Vista St
Hazeltine
Court
Las Casitas Century
House
Clark Manor Vineland
Villa
Apartments
Weddington
Apartments
Malaga
Apartment
Clark Arms
Apartments
11853
Kling St
Marina Oaks 4540
Hazeltine
Toluca Lake
Apartment
4731
Vineland
Ave
5204
Yarmouth
Ave
4445-4451
Murietta
Ave
13535
Moorpark St
PROPERTY NAMETOLUCA PLAZA
COMPARABLES
Average Price Per Unit
SALES COMPARABLES SALES COMPS AVG
PROPERTY NAME
MARKETING TEAM
TOLUCA PLAZA
COMPARABLES
rentpropertyname1
rentpropertyaddress1
rentpropertyname1
rentpropertyaddress1
rentpropertyname1
rentpropertyaddress1
31
SALES COMPARABLES
rentpropertyaddress1
673 VISTA ISLE DRIVE
673 VISTA ISLE DRIVE, SUNRISE, FL, 33325
TOLUCA PLAZA
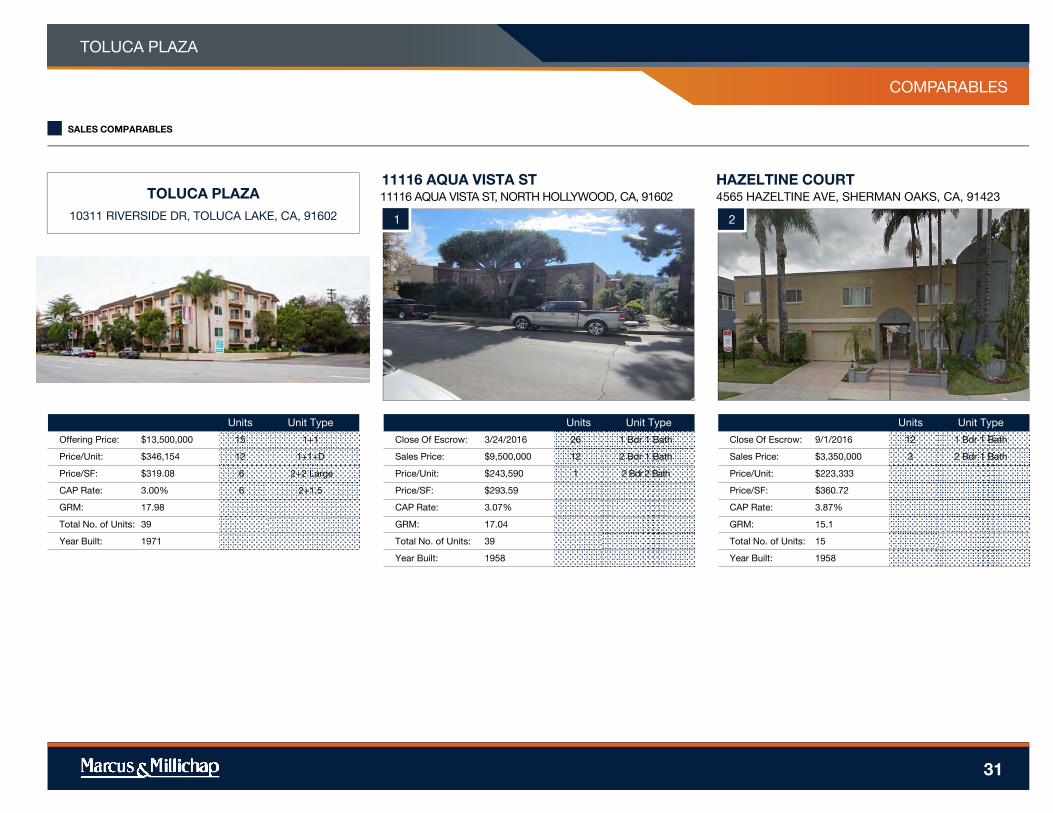
10311 RIVERSIDE DR, TOLUCA LAKE, CA, 91602
Units Unit Type
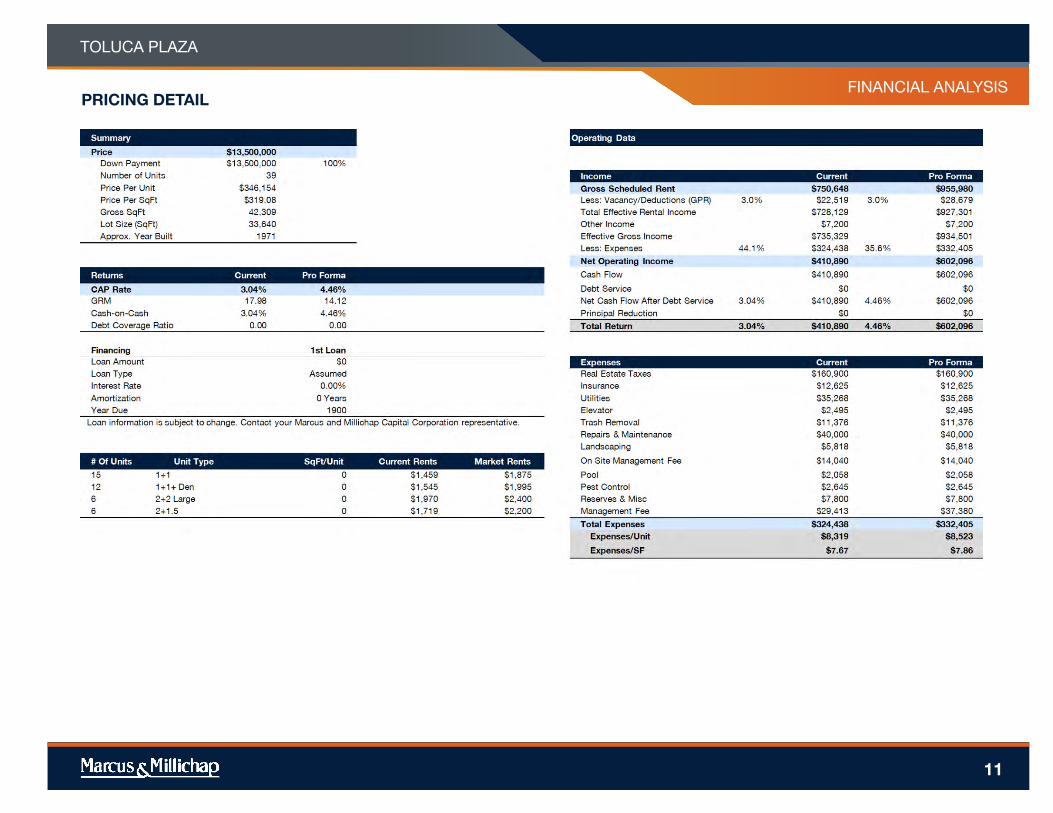
Offering Price: $13,500,000 15 1+1
Price/Unit: $346,154 12 1+1+D
Price/SF: $319.08 6 2+2 Large
CAP Rate: 3.00% 6 2+1.5
GRM: 17.98
Total No. of Units: 39
Year Built: 1971
11116 AQUA VISTA ST, NORTH HOLLYWOOD, CA, 91602
11116 AQUA VISTA ST
1
Units Unit Type
Close Of Escrow: 3/24/2016 26 1 Bdr 1 Bath
Sales Price: $9,500,000 12 2 Bdr 1 Bath
Price/Unit: $243,590 1 2 Bdr 2 Bath
Price/SF: $293.59
CAP Rate: 3.07%
GRM: 17.04
Total No. of Units: 39
Year Built: 1958
4565 HAZELTINE AVE, SHERMAN OAKS, CA, 91423
HAZELTINE COURT
Units Unit Type
Close Of Escrow: 9/1/2016 12 1 Bdr 1 Bath
Sales Price: $3,350,000 3 2 Bdr 1 Bath
Price/Unit: $223,333
Price/SF: $360.72
CAP Rate: 3.87%
GRM: 15.1
Total No. of Units: 15
Year Built: 1958
2
PROPERTY NAME
MARKETING TEAM
TOLUCA PLAZA
COMPARABLES
rentpropertyname1
rentpropertyaddress1
rentpropertyname1
rentpropertyaddress1
rentpropertyname1
rentpropertyaddress1
32
SALES COMPARABLES
Units Unit Type
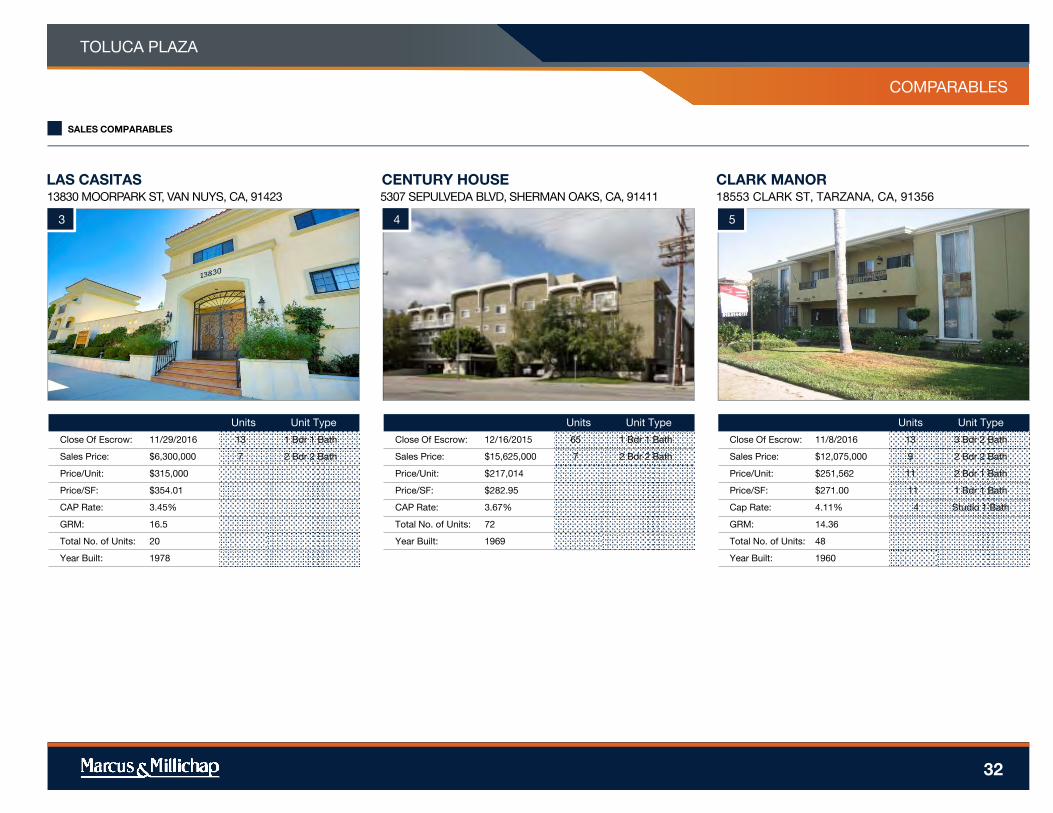
Close Of Escrow: 11/29/2016 13 1 Bdr 1 Bath
Sales Price: $6,300,000 7 2 Bdr 2 Bath
Price/Unit: $315,000
Price/SF: $354.01
CAP Rate: 3.45%
GRM: 16.5
Total No. of Units: 20
Year Built: 1978
LAS CASITAS
3
13830 MOORPARK ST, VAN NUYS, CA, 91423 5307 SEPULVEDA BLVD, SHERMAN OAKS, CA, 91411
CENTURY HOUSE
4
Units Unit Type
Close Of Escrow: 12/16/2015 65 1 Bdr 1 Bath
Sales Price: $15,625,000 7 2 Bdr 2 Bath
Price/Unit: $217,014
Price/SF: $282.95
CAP Rate: 3.67%
Total No. of Units: 72
Year Built: 1969
18553 CLARK ST, TARZANA, CA, 91356
CLARK MANOR
5
Units Unit Type
Close Of Escrow: 11/8/2016 13 3 Bdr 2 Bath
Sales Price: $12,075,000 9 2 Bdr 2 Bath
Price/Unit: $251,562 11 2 Bdr 1 Bath
Price/SF: $271.00 11 1 Bdr 1 Bath
Cap Rate: 4.11% 4 Studio 1 Bath
GRM: 14.36
Total No. of Units: 48
Year Built: 1960
PROPERTY NAME
MARKETING TEAM
TOLUCA PLAZA
COMPARABLES
rentpropertyname1
rentpropertyaddress1
rentpropertyname1
rentpropertyaddress1
rentpropertyname1
rentpropertyaddress1
33
SALES COMPARABLES
Units Unit Type
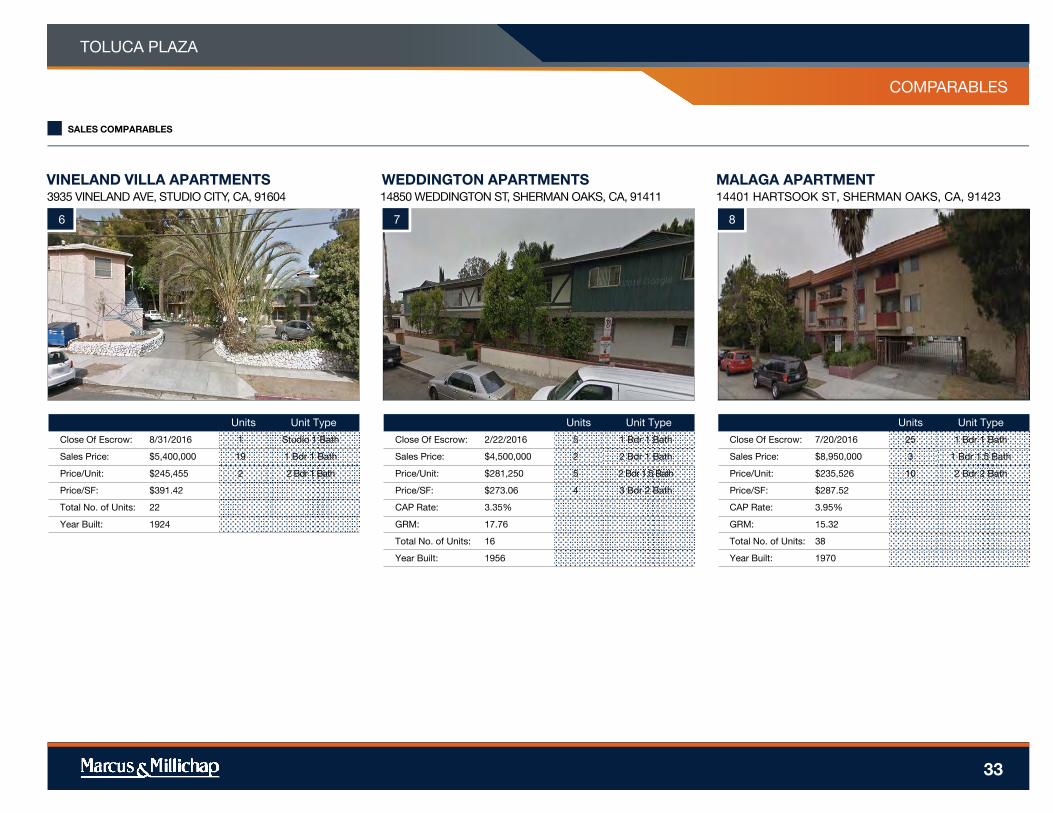
Close Of Escrow: 8/31/2016 1 Studio 1 Bath
Sales Price: $5,400,000 19 1 Bdr 1 Bath
Price/Unit: $245,455 2 2 Bdr 1 Bath
Price/SF: $391.42
Total No. of Units: 22
Year Built: 1924
VINELAND VILLA APARTMENTS
6
3935 VINELAND AVE, STUDIO CITY, CA, 91604 14850 WEDDINGTON ST, SHERMAN OAKS, CA, 91411
WEDDINGTON APARTMENTS
7
Units Unit Type
Close Of Escrow: 2/22/2016 5 1 Bdr 1 Bath
Sales Price: $4,500,000 2 2 Bdr 1 Bath
Price/Unit: $281,250 5 2 Bdr 1.5 Bath
Price/SF: $273.06 4 3 Bdr 2 Bath
CAP Rate: 3.35%
GRM: 17.76
Total No. of Units: 16
Year Built: 1956
14401 HARTSOOK ST, SHERMAN OAKS, CA, 91423
MALAGA APARTMENT
Units Unit Type
Close Of Escrow: 7/20/2016 25 1 Bdr 1 Bath
Sales Price: $8,950,000 3 1 Bdr 1.5 Bath
Price/Unit: $235,526 10 2 Bdr 2 Bath
Price/SF: $287.52
CAP Rate: 3.95%
GRM: 15.32
Total No. of Units: 38
Year Built: 1970
8
PROPERTY NAME
MARKETING TEAM
TOLUCA PLAZA
COMPARABLES
rentpropertyname1
rentpropertyaddress1
rentpropertyname1
rentpropertyaddress1
rentpropertyname1
rentpropertyaddress1
34
SALES COMPARABLES
Units Unit Type
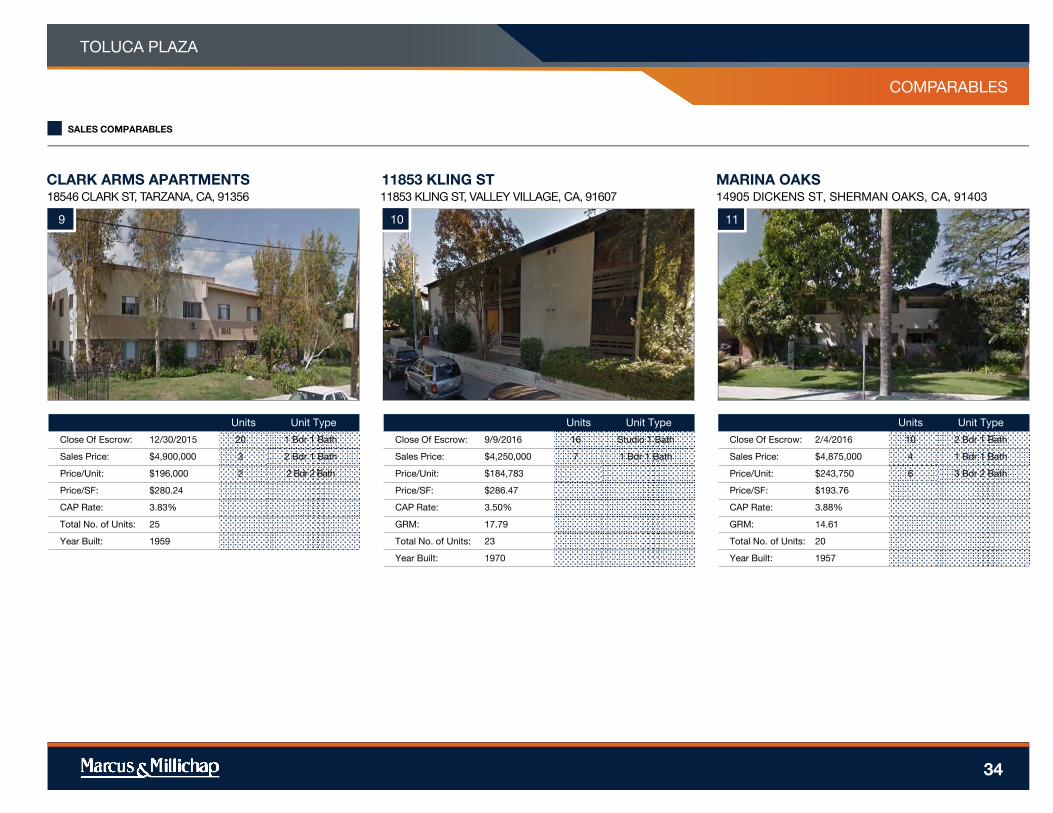
Close Of Escrow: 12/30/2015 20 1 Bdr 1 Bath
Sales Price: $4,900,000 3 2 Bdr 1 Bath
Price/Unit: $196,000 2 2 Bdr 2 Bath
Price/SF: $280.24
CAP Rate: 3.83%
Total No. of Units: 25
Year Built: 1959
CLARK ARMS APARTMENTS
9
18546 CLARK ST, TARZANA, CA, 91356 11853 KLING ST, VALLEY VILLAGE, CA, 91607
11853 KLING ST
10
Units Unit Type
Close Of Escrow: 9/9/2016 16 Studio 1 Bath
Sales Price: $4,250,000 7 1 Bdr 1 Bath
Price/Unit: $184,783
Price/SF: $286.47
CAP Rate: 3.50%
GRM: 17.79
Total No. of Units: 23
Year Built: 1970
14905 DICKENS ST, SHERMAN OAKS, CA, 91403
MARINA OAKS
Units Unit Type
Close Of Escrow: 2/4/2016 10 2 Bdr 1 Bath
Sales Price: $4,875,000 4 1 Bdr 1 Bath
Price/Unit: $243,750 6 3 Bdr 2 Bath
Price/SF: $193.76
CAP Rate: 3.88%
GRM: 14.61
Total No. of Units: 20
Year Built: 1957
11
PROPERTY NAME
MARKETING TEAM
TOLUCA PLAZA
COMPARABLES
rentpropertyname1
rentpropertyaddress1
rentpropertyname1
rentpropertyaddress1
rentpropertyname1
rentpropertyaddress1
35
SALES COMPARABLES
Units Unit Type
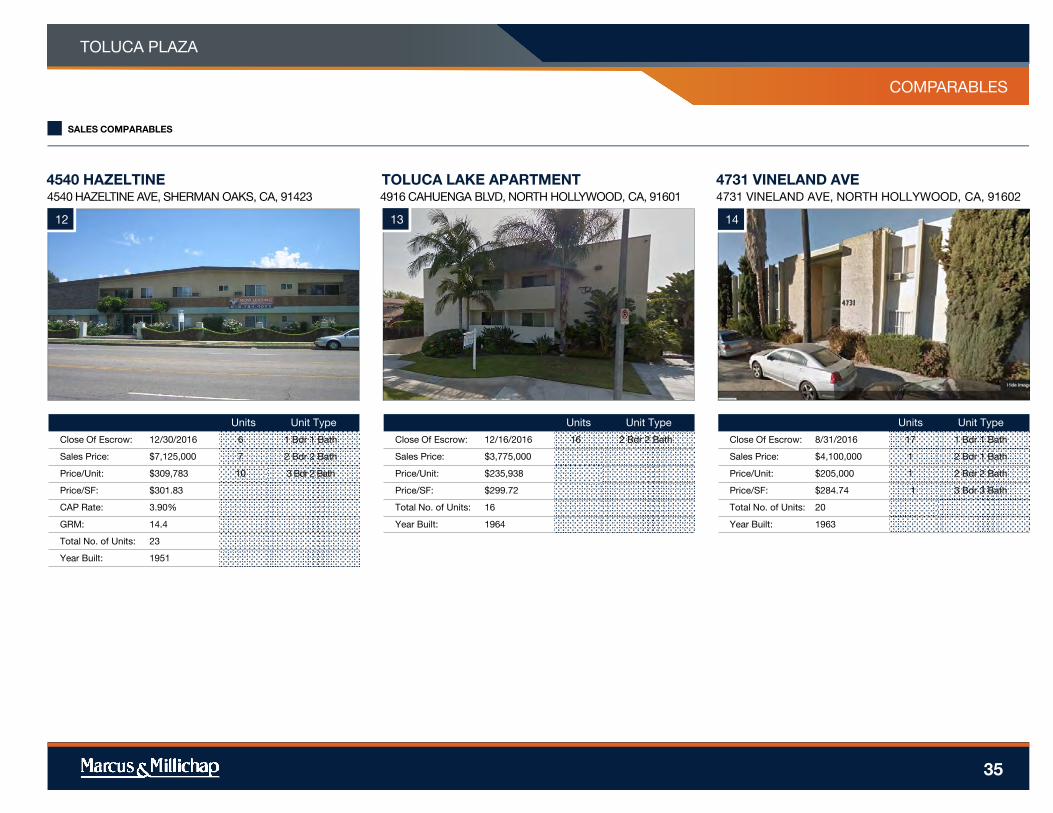
Close Of Escrow: 12/30/2016 6 1 Bdr 1 Bath
Sales Price: $7,125,000 7 2 Bdr 2 Bath
Price/Unit: $309,783 10 3 Bdr 2 Bath
Price/SF: $301.83
CAP Rate: 3.90%
GRM: 14.4
Total No. of Units: 23
Year Built: 1951
4540 HAZELTINE
12
4540 HAZELTINE AVE, SHERMAN OAKS, CA, 91423 4916 CAHUENGA BLVD, NORTH HOLLYWOOD, CA, 91601
TOLUCA LAKE APARTMENT
13
Units Unit Type
Close Of Escrow: 12/16/2016 16 2 Bdr 2 Bath
Sales Price: $3,775,000
Price/Unit: $235,938
Price/SF: $299.72
Total No. of Units: 16
Year Built: 1964
4731 VINELAND AVE, NORTH HOLLYWOOD, CA, 91602
4731 VINELAND AVE
Units Unit Type
Close Of Escrow: 8/31/2016 17 1 Bdr 1 Bath
Sales Price: $4,100,000 1 2 Bdr 1 Bath
Price/Unit: $205,000 1 2 Bdr 2 Bath
Price/SF: $284.74 1 3 Bdr 3 Bath
Total No. of Units: 20
Year Built: 1963
14
PROPERTY NAME
MARKETING TEAM
TOLUCA PLAZA
COMPARABLES
rentpropertyname1
rentpropertyaddress1
rentpropertyname1
rentpropertyaddress1
rentpropertyname1
rentpropertyaddress1
36
SALES COMPARABLES
Units Unit Type
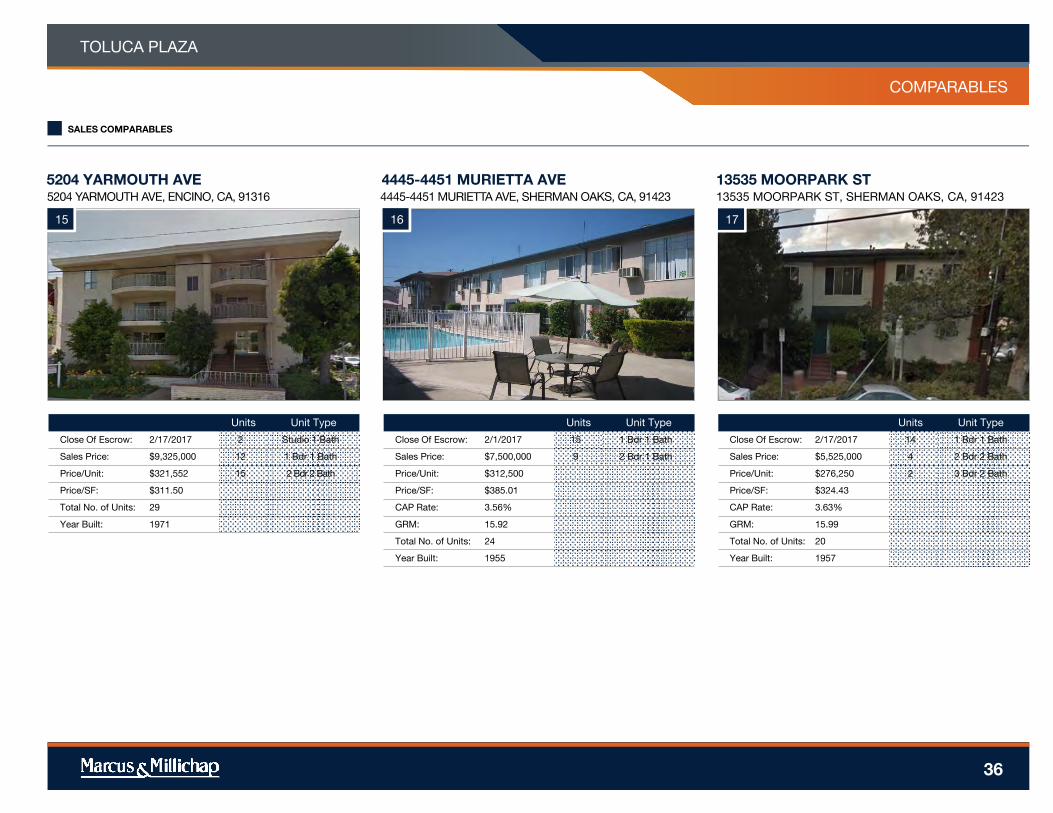
Close Of Escrow: 2/17/2017 2 Studio 1 Bath
Sales Price: $9,325,000 12 1 Bdr 1 Bath
Price/Unit: $321,552 15 2 Bdr 2 Bath
Price/SF: $311.50
Total No. of Units: 29
Year Built: 1971
5204 YARMOUTH AVE
15
5204 YARMOUTH AVE, ENCINO, CA, 91316 4445-4451 MURIETTA AVE, SHERMAN OAKS, CA, 91423
4445-4451 MURIETTA AVE
16
Units Unit Type
Close Of Escrow: 2/1/2017 15 1 Bdr 1 Bath
Sales Price: $7,500,000 9 2 Bdr 1 Bath
Price/Unit: $312,500
Price/SF: $385.01
CAP Rate: 3.56%
GRM: 15.92
Total No. of Units: 24
Year Built: 1955
13535 MOORPARK ST, SHERMAN OAKS, CA, 91423
13535 MOORPARK ST
Units Unit Type
Close Of Escrow: 2/17/2017 14 1 Bdr 1 Bath
Sales Price: $5,525,000 4 2 Bdr 2 Bath
Price/Unit: $276,250 2 3 Bdr 2 Bath
Price/SF: $324.43
CAP Rate: 3.63%
GRM: 15.99
Total No. of Units: 20
Year Built: 1957
17
8
TOLUCA PLAZA
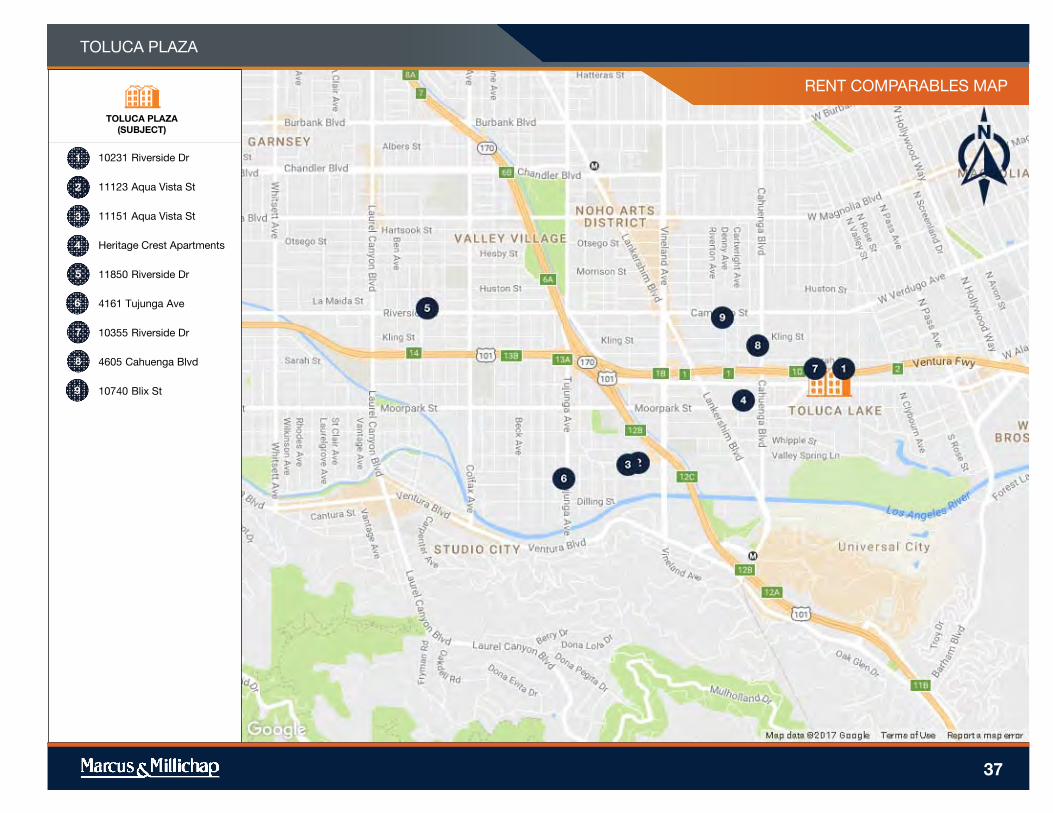
RENT COMPARABLES MAP
TOLUCA PLAZA
(SUBJECT)
10231 Riverside Dr
11123 Aqua Vista St
11151 Aqua Vista St
Heritage Crest Apartments
11850 Riverside Dr
4161 Tujunga Ave
10355 Riverside Dr
4605 Cahuenga Blvd
10740 Blix St
4
7
8
9
11
20
12
14
15
16
17
13
18
10
4
7
8
9
1
2
3
5
6
37
PROPERTY NAMETOLUCA PLAZA
COMPARABLES
38
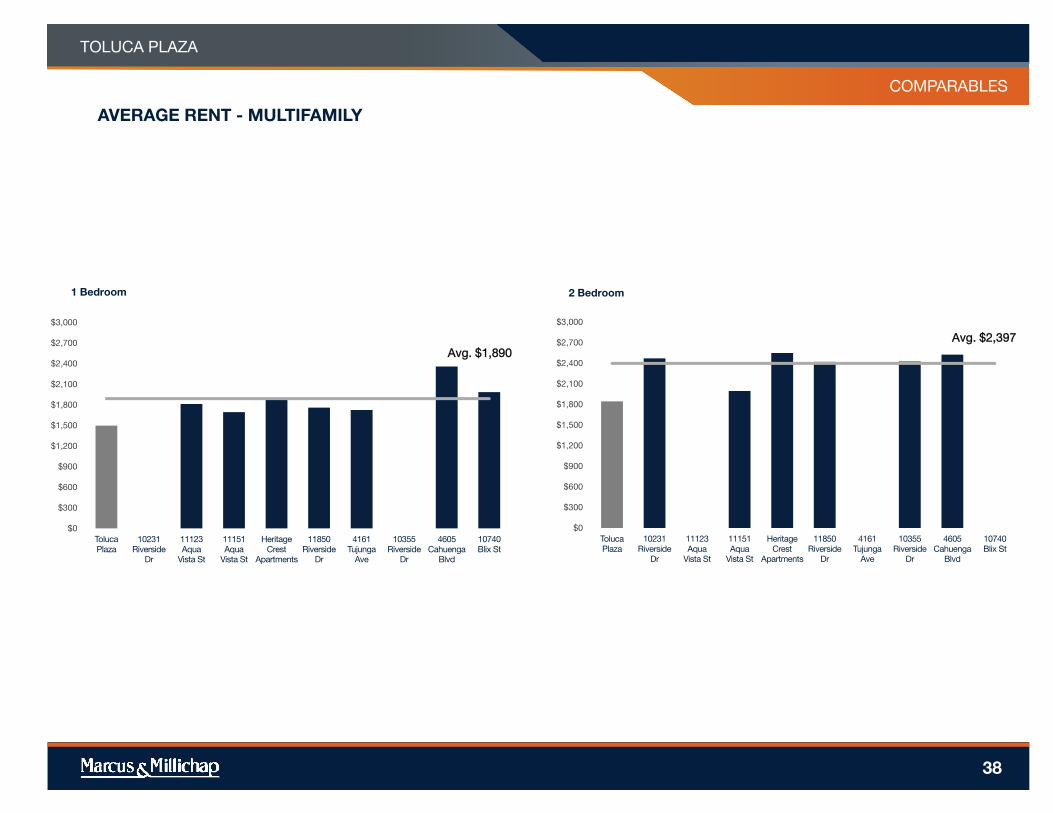
AVERAGE RENT - MULTIFAMILY
Avg. $1,890
$0
$300
$600
$900
$1,200
$1,500
$1,800
$2,100
$2,400
$2,700
$3,000
Toluca
Plaza
10231
Riverside
Dr
11123
Aqua
Vista St
11151
Aqua
Vista St
Heritage
Crest
Apartments
11850
Riverside
Dr
4161
Tujunga
Ave
10355
Riverside
Dr
4605
Cahuenga
Blvd
10740
Blix St
1 Bedroom
Avg. $2,397
$0
$300
$600
$900
$1,200
$1,500
$1,800
$2,100
$2,400
$2,700
$3,000
Toluca
Plaza
10231
Riverside
Dr
11123
Aqua
Vista St
11151
Aqua
Vista St
Heritage
Crest
Apartments
11850
Riverside
Dr
4161
Tujunga
Ave
10355
Riverside
Dr
4605
Cahuenga
Blvd
10740
Blix St
2 Bedroom
PROPERTY NAME
MARKETING TEAM
TOLUCA PLAZA
RENT COMPARABLES
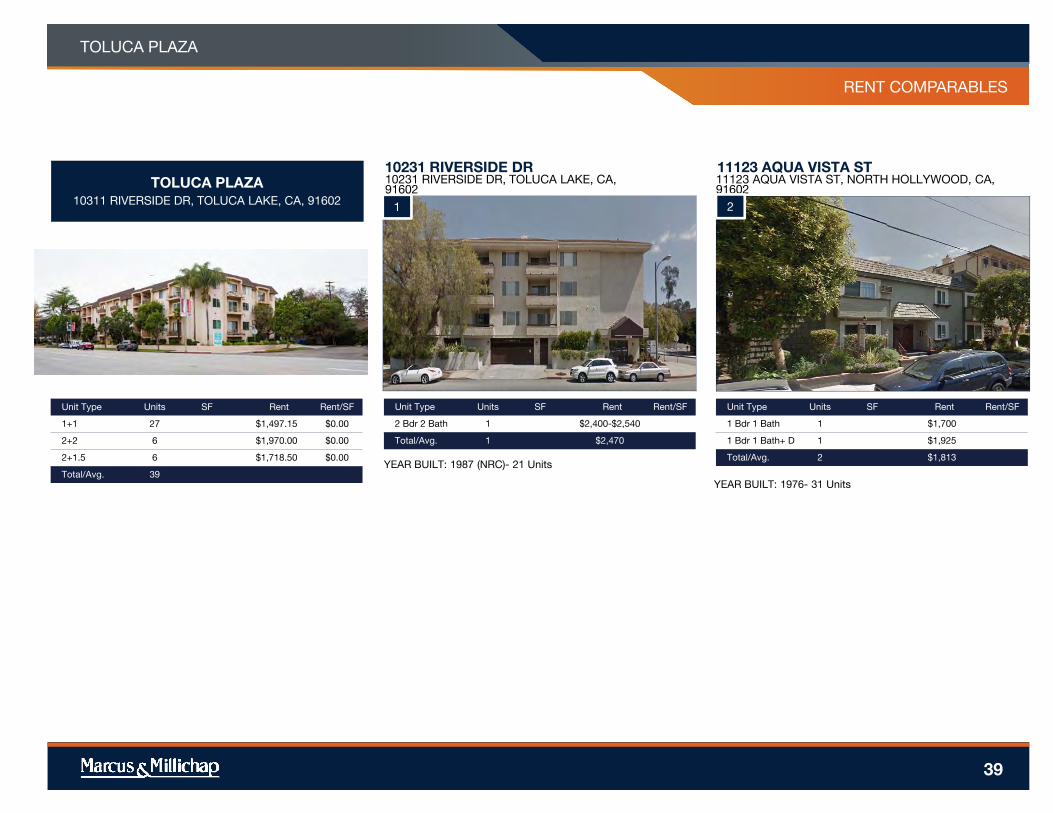
TOLUCA PLAZA
10311 RIVERSIDE DR, TOLUCA LAKE, CA, 91602
TOLUCA PLAZA
10311 RIVERSIDE DR, TOLUCA LAKE, CA, 91602
TOLUCA PLAZA
10311 RIVERSIDE DR, TOLUCA LAKE, CA, 91602
39
TOLUCA PLAZA
10311 RIVERSIDE DR, TOLUCA LAKE, CA, 91602
Unit Type Units SF Rent Rent/SF
1+1 27 $1,497.15 $0.00
2+2 6 $1,970.00 $0.00
2+1.5 6 $1,718.50 $0.00
Total/Avg. 39
10231 RIVERSIDE DR10231 RIVERSIDE DR, TOLUCA LAKE, CA, 91602
1
Unit Type Units SF Rent Rent/SF
2 Bdr 2 Bath 1 $2,400-$2,540
Total/Avg. 1 $2,470
11123 AQUA VISTA ST11123 AQUA VISTA ST, NORTH HOLLYWOOD, CA, 91602
2
Unit Type Units SF Rent Rent/SF
1 Bdr 1 Bath 1 $1,700
1 Bdr 1 Bath+ D 1 $1,925
Total/Avg. 2 $1,813YEAR BUILT: 1987 (NRC)- 21 Units
YEAR BUILT: 1976- 31 Units
PROPERTY NAME
MARKETING TEAM
TOLUCA PLAZA
RENT COMPARABLES
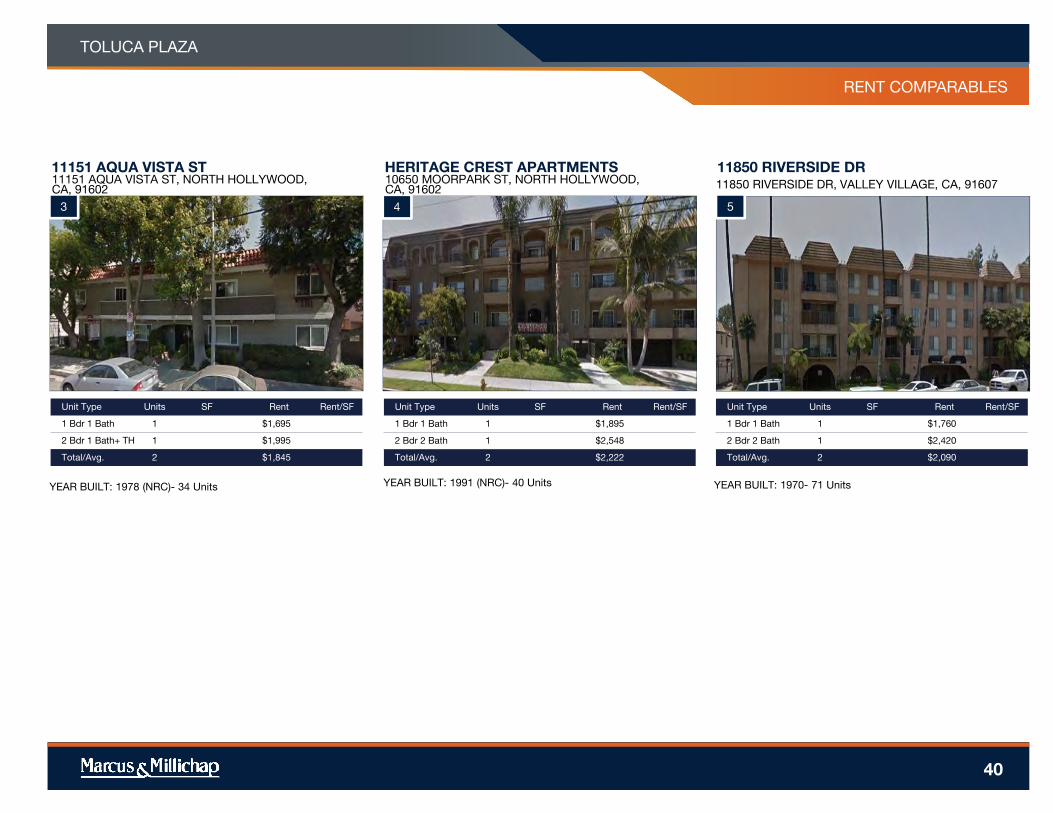
11151 AQUA VISTA ST
11151 AQUA VISTA ST, NORTH HOLLYWOOD, CA, 91602
11151 AQUA VISTA ST
11151 AQUA VISTA ST, NORTH HOLLYWOOD, CA, 91602
11151 AQUA VISTA ST
11151 AQUA VISTA ST, NORTH HOLLYWOOD, CA, 91602
40
11151 AQUA VISTA ST11151 AQUA VISTA ST, NORTH HOLLYWOOD, CA, 91602
3
Unit Type Units SF Rent Rent/SF
1 Bdr 1 Bath 1 $1,695
2 Bdr 1 Bath+ TH 1 $1,995
Total/Avg. 2 $1,845
HERITAGE CREST APARTMENTS10650 MOORPARK ST, NORTH HOLLYWOOD, CA, 91602
4
Unit Type Units SF Rent Rent/SF
1 Bdr 1 Bath 1 $1,895
2 Bdr 2 Bath 1 $2,548
Total/Avg. 2 $2,222
11850 RIVERSIDE DR11850 RIVERSIDE DR, VALLEY VILLAGE, CA, 91607
5
Unit Type Units SF Rent Rent/SF
1 Bdr 1 Bath 1 $1,760
2 Bdr 2 Bath 1 $2,420
Total/Avg. 2 $2,090
YEAR BUILT: 1978 (NRC)- 34 Units YEAR BUILT: 1991 (NRC)- 40 Units YEAR BUILT: 1970- 71 Units
PROPERTY NAME
MARKETING TEAM
TOLUCA PLAZA
RENT COMPARABLES
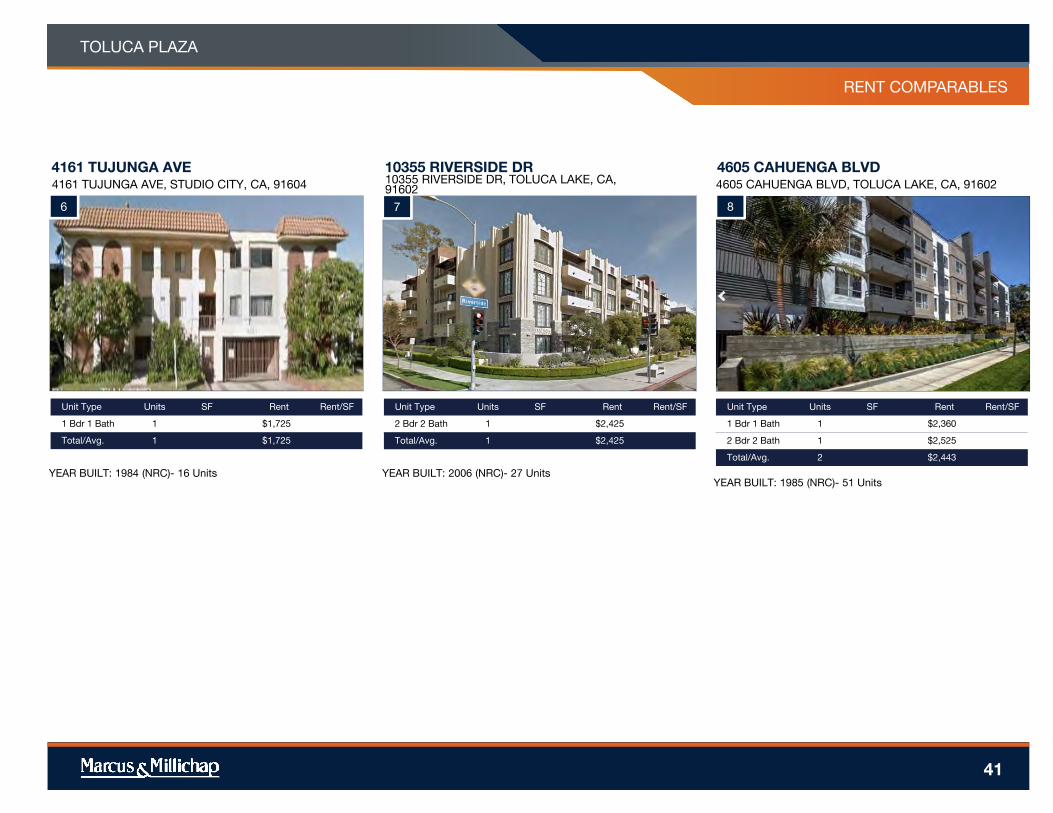
4161 TUJUNGA AVE
4161 TUJUNGA AVE, STUDIO CITY, CA, 91604
4161 TUJUNGA AVE
4161 TUJUNGA AVE, STUDIO CITY, CA, 91604
4161 TUJUNGA AVE
4161 TUJUNGA AVE, STUDIO CITY, CA, 91604
41
4161 TUJUNGA AVE4161 TUJUNGA AVE, STUDIO CITY, CA, 91604
6
Unit Type Units SF Rent Rent/SF
1 Bdr 1 Bath 1 $1,725
Total/Avg. 1 $1,725
10355 RIVERSIDE DR10355 RIVERSIDE DR, TOLUCA LAKE, CA, 91602
7
Unit Type Units SF Rent Rent/SF
2 Bdr 2 Bath 1 $2,425
Total/Avg. 1 $2,425
4605 CAHUENGA BLVD4605 CAHUENGA BLVD, TOLUCA LAKE, CA, 91602
8
Unit Type Units SF Rent Rent/SF
1 Bdr 1 Bath 1 $2,360
2 Bdr 2 Bath 1 $2,525
Total/Avg. 2 $2,443
YEAR BUILT: 1984 (NRC)- 16 UnitsYEAR BUILT: 1985 (NRC)- 51 Units
YEAR BUILT: 2006 (NRC)- 27 Units
PROPERTY NAME
MARKETING TEAM
TOLUCA PLAZA
RENT COMPARABLES
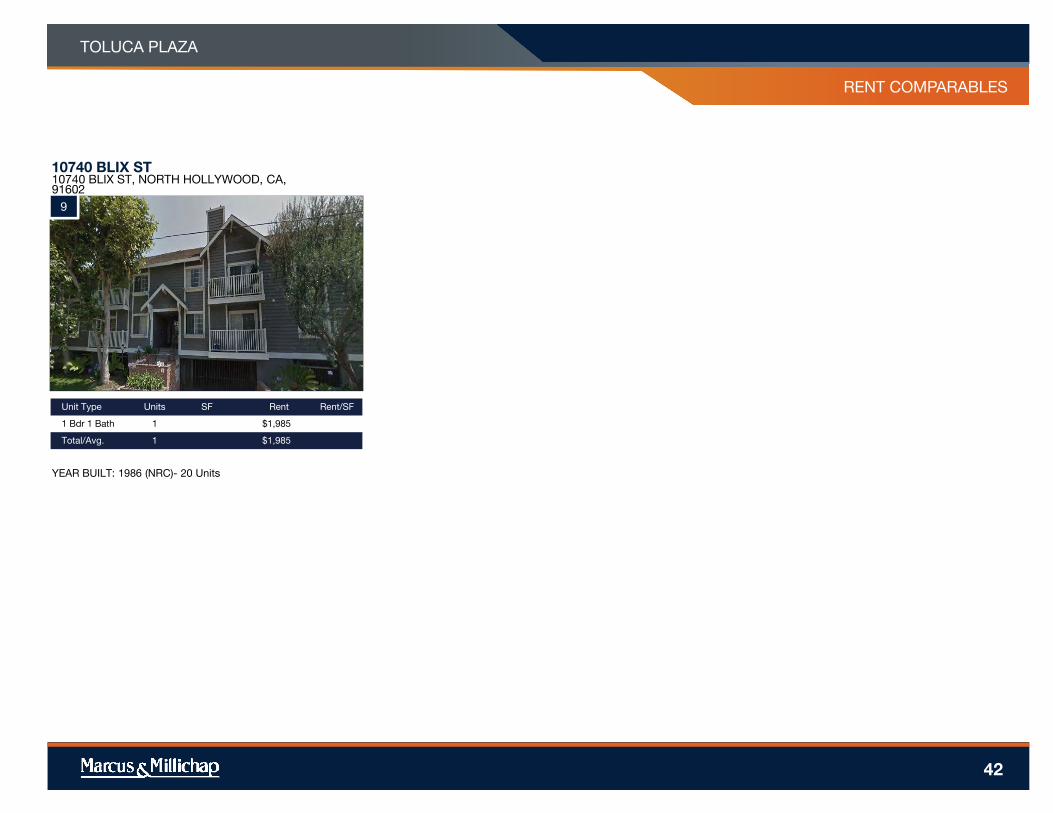
10740 BLIX ST
10740 BLIX ST, NORTH HOLLYWOOD, CA, 91602
10740 BLIX ST
10740 BLIX ST, NORTH HOLLYWOOD, CA, 91602
10740 BLIX ST
10740 BLIX ST, NORTH HOLLYWOOD, CA, 91602
42
10740 BLIX ST10740 BLIX ST, NORTH HOLLYWOOD, CA, 91602
9
Unit Type Units SF Rent Rent/SF
1 Bdr 1 Bath 1 $1,985
Total/Avg. 1 $1,985
YEAR BUILT: 1986 (NRC)- 20 Units

TOLUCA PLAZA
43
MARKET
OVERVIEW
MARKET OVERVIEW
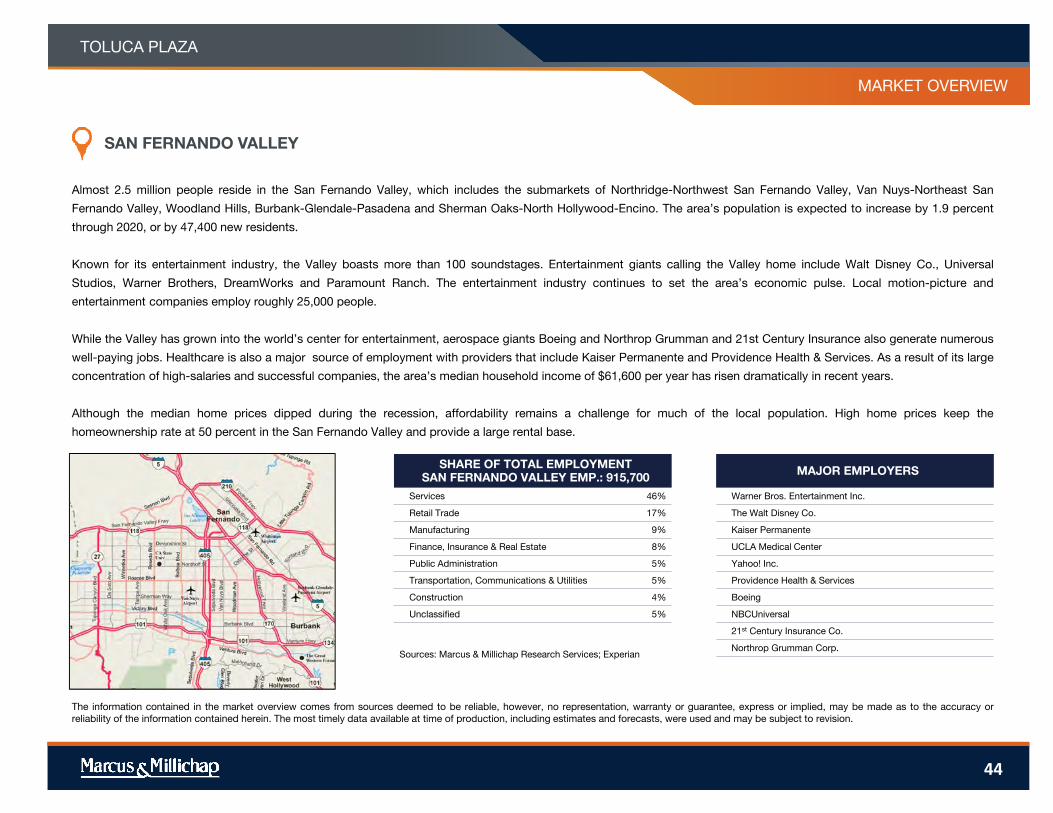
Almost 2.5 million people reside in the San Fernando Valley, which includes the submarkets of Northridge-Northwest San Fernando Valley, Van Nuys-Northeast San
Fernando Valley, Woodland Hills, Burbank-Glendale-Pasadena and Sherman Oaks-North Hollywood-Encino. The area’s population is expected to increase by 1.9 percent
through 2020, or by 47,400 new residents.
Known for its entertainment industry, the Valley boasts more than 100 soundstages. Entertainment giants calling the Valley home include Walt Disney Co., Universal
Studios, Warner Brothers, DreamWorks and Paramount Ranch. The entertainment industry continues to set the area’s economic pulse. Local motion-picture and
entertainment companies employ roughly 25,000 people.
While the Valley has grown into the world’s center for entertainment, aerospace giants Boeing and Northrop Grumman and 21st Century Insurance also generate numerous
well-paying jobs. Healthcare is also a major source of employment with providers that include Kaiser Permanente and Providence Health & Services. As a result of its large
concentration of high-salaries and successful companies, the area’s median household income of $61,600 per year has risen dramatically in recent years.
Although the median home prices dipped during the recession, affordability remains a challenge for much of the local population. High home prices keep the
homeownership rate at 50 percent in the San Fernando Valley and provide a large rental base.
MAJOR EMPLOYERS
Warner Bros. Entertainment Inc.
The Walt Disney Co.
Kaiser Permanente
UCLA Medical Center
Yahoo! Inc.
Providence Health & Services
Boeing
NBCUniversal
21st Century Insurance Co.
Northrop Grumman Corp.Sources: Marcus & Millichap Research Services; Experian
SAN FERNANDO VALLEY
TOLUCA PLAZA
SHARE OF TOTAL EMPLOYMENTSAN FERNANDO VALLEY EMP.: 915,700
Services 46%
Retail Trade 17%
Manufacturing 9%
Finance, Insurance & Real Estate 8%
Public Administration 5%
Transportation, Communications & Utilities 5%
Construction 4%
Unclassified 5%
The information contained in the market overview comes from sources deemed to be reliable, however, no representation, warranty or guarantee, express or implied, may be made as to the accuracy or
reliability of the information contained herein. The most timely data available at time of production, including estimates and forecasts, were used and may be subject to revision.
44
MARKET OVERVIEW
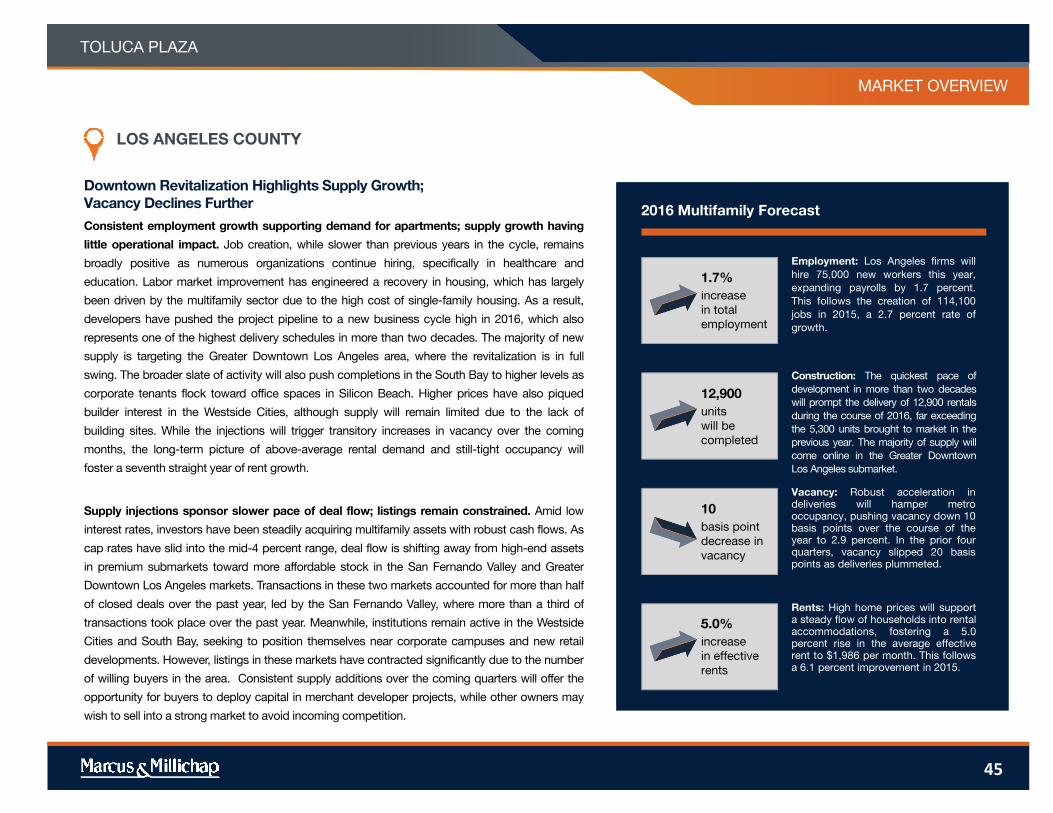
2016 Multifamily Forecast
Construction: The quickest pace of
development in more than two decades
will prompt the delivery of 12,900 rentals
during the course of 2016, far exceeding
the 5,300 units brought to market in the
previous year. The majority of supply will
come online in the Greater Downtown
Los Angeles submarket.
Vacancy: Robust acceleration indeliveries will hamper metrooccupancy, pushing vacancy down 10basis points over the course of theyear to 2.9 percent. In the prior fourquarters, vacancy slipped 20 basispoints as deliveries plummeted.
Rents: High home prices will supporta steady flow of households into rentalaccommodations, fostering a 5.0percent rise in the average effectiverent to $1,986 per month. This followsa 6.1 percent improvement in 2015.
Employment: Los Angeles firms will
hire 75,000 new workers this year,
expanding payrolls by 1.7 percent.
This follows the creation of 114,100
jobs in 2015, a 2.7 percent rate of
growth.
TOLUCA PLAZA
45
Downtown Revitalization Highlights Supply Growth;
Vacancy Declines Further
Consistent employment growth supporting demand for apartments; supply growth having
little operational impact. Job creation, while slower than previous years in the cycle, remains
broadly positive as numerous organizations continue hiring, specifically in healthcare and
education. Labor market improvement has engineered a recovery in housing, which has largely
been driven by the multifamily sector due to the high cost of single-family housing. As a result,
developers have pushed the project pipeline to a new business cycle high in 2016, which also
represents one of the highest delivery schedules in more than two decades. The majority of new
supply is targeting the Greater Downtown Los Angeles area, where the revitalization is in full
swing. The broader slate of activity will also push completions in the South Bay to higher levels as
corporate tenants flock toward office spaces in Silicon Beach. Higher prices have also piqued
builder interest in the Westside Cities, although supply will remain limited due to the lack of
building sites. While the injections will trigger transitory increases in vacancy over the coming
months, the long-term picture of above-average rental demand and still-tight occupancy will
foster a seventh straight year of rent growth.
Supply injections sponsor slower pace of deal flow; listings remain constrained. Amid low
interest rates, investors have been steadily acquiring multifamily assets with robust cash flows. As
cap rates have slid into the mid-4 percent range, deal flow is shifting away from high-end assets
in premium submarkets toward more affordable stock in the San Fernando Valley and Greater
Downtown Los Angeles markets. Transactions in these two markets accounted for more than half
of closed deals over the past year, led by the San Fernando Valley, where more than a third of
transactions took place over the past year. Meanwhile, institutions remain active in the Westside
Cities and South Bay, seeking to position themselves near corporate campuses and new retail
developments. However, listings in these markets have contracted significantly due to the number
of willing buyers in the area. Consistent supply additions over the coming quarters will offer the
opportunity for buyers to deploy capital in merchant developer projects, while other owners may
wish to sell into a strong market to avoid incoming competition.
1.7%
increase
in total
employment
12,900
units
will be
completed
10
basis point
decrease in
vacancy
increase
in effective
rents
5.0%
LOS ANGELES COUNTY
MARKET OVERVIEW
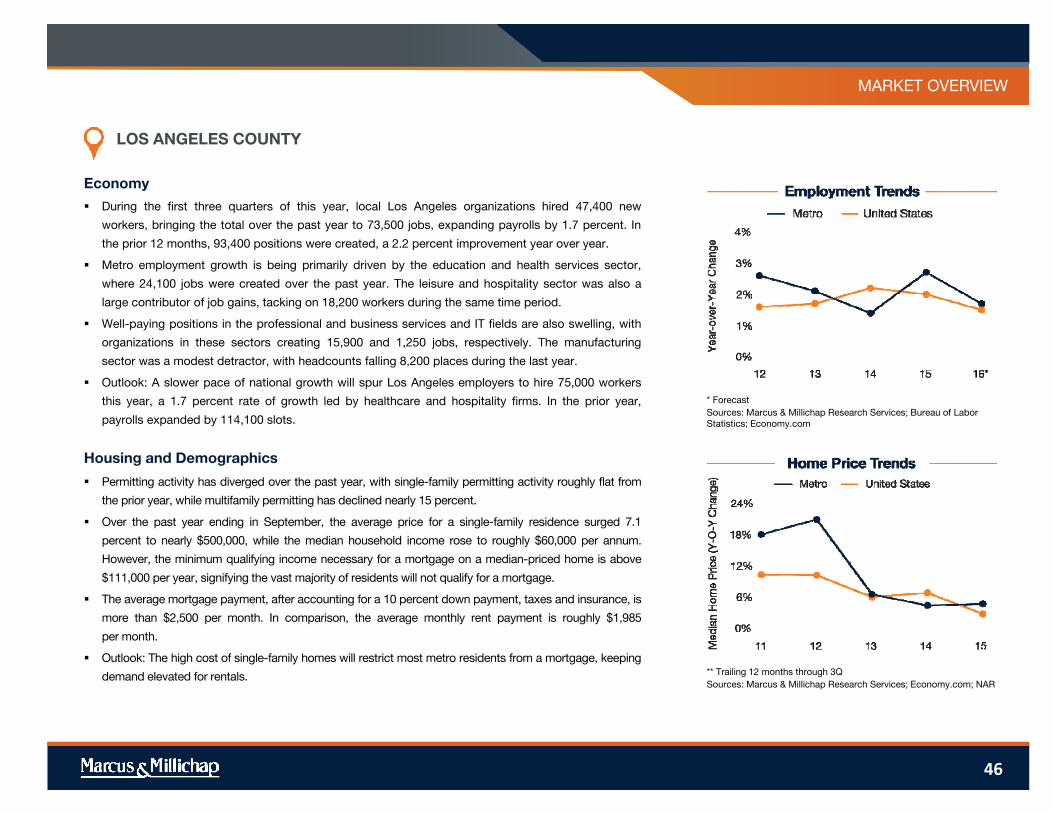
Economy
Housing and Demographics
** Trailing 12 months through 3Q
Sources: Marcus & Millichap Research Services; Economy.com; NAR
* Forecast
Sources: Marcus & Millichap Research Services; Bureau of Labor
Statistics; Economy.com
LOS ANGELES COUNTY
Permitting activity has diverged over the past year, with single-family permitting activity roughly flat from
the prior year, while multifamily permitting has declined nearly 15 percent.
Over the past year ending in September, the average price for a single-family residence surged 7.1
percent to nearly $500,000, while the median household income rose to roughly $60,000 per annum.
However, the minimum qualifying income necessary for a mortgage on a median-priced home is above
$111,000 per year, signifying the vast majority of residents will not qualify for a mortgage.
The average mortgage payment, after accounting for a 10 percent down payment, taxes and insurance, is
more than $2,500 per month. In comparison, the average monthly rent payment is roughly $1,985
per month.
Outlook: The high cost of single-family homes will restrict most metro residents from a mortgage, keeping
demand elevated for rentals.
During the first three quarters of this year, local Los Angeles organizations hired 47,400 new
workers, bringing the total over the past year to 73,500 jobs, expanding payrolls by 1.7 percent. In
the prior 12 months, 93,400 positions were created, a 2.2 percent improvement year over year.
Metro employment growth is being primarily driven by the education and health services sector,
where 24,100 jobs were created over the past year. The leisure and hospitality sector was also a
large contributor of job gains, tacking on 18,200 workers during the same time period.
Well-paying positions in the professional and business services and IT fields are also swelling, with
organizations in these sectors creating 15,900 and 1,250 jobs, respectively. The manufacturing
sector was a modest detractor, with headcounts falling 8,200 places during the last year.
Outlook: A slower pace of national growth will spur Los Angeles employers to hire 75,000 workers
this year, a 1.7 percent rate of growth led by healthcare and hospitality firms. In the prior year,
payrolls expanded by 114,100 slots.
46
MARKET OVERVIEW
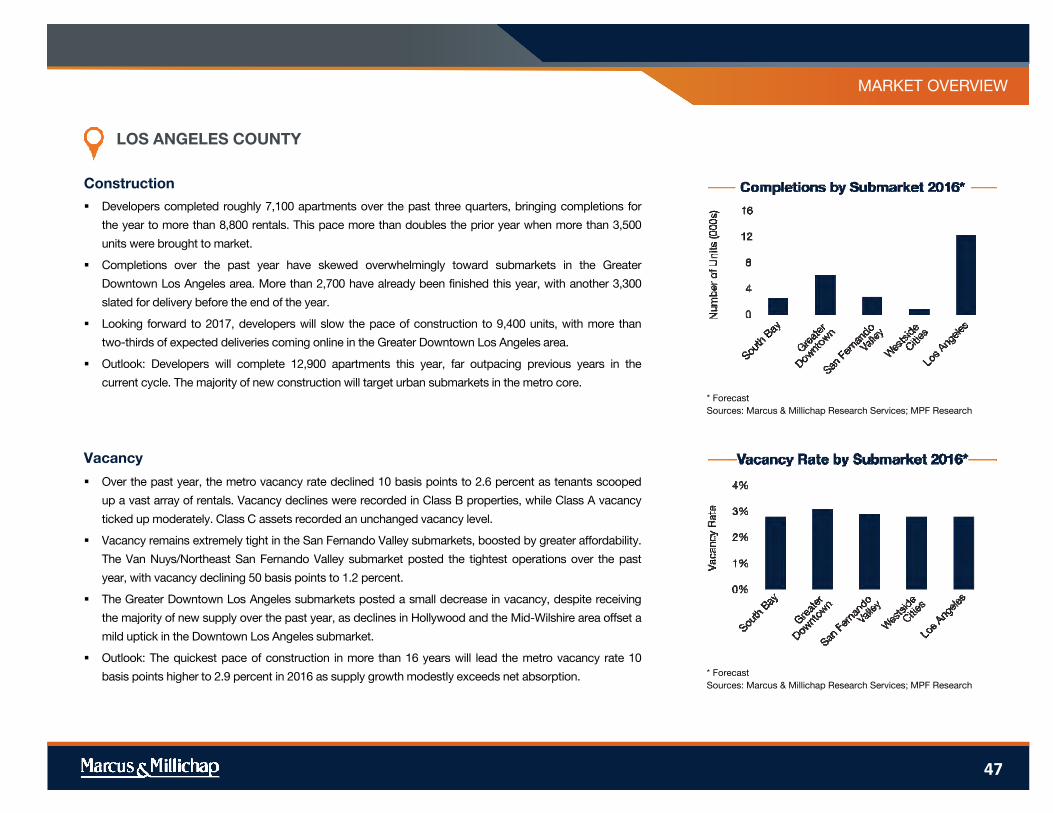
Construction
Vacancy
* Forecast
Sources: Marcus & Millichap Research Services; MPF Research
* Forecast
Sources: Marcus & Millichap Research Services; MPF Research
LOS ANGELES COUNTY
Over the past year, the metro vacancy rate declined 10 basis points to 2.6 percent as tenants scooped
up a vast array of rentals. Vacancy declines were recorded in Class B properties, while Class A vacancy
ticked up moderately. Class C assets recorded an unchanged vacancy level.
Vacancy remains extremely tight in the San Fernando Valley submarkets, boosted by greater affordability.
The Van Nuys/Northeast San Fernando Valley submarket posted the tightest operations over the past
year, with vacancy declining 50 basis points to 1.2 percent.
The Greater Downtown Los Angeles submarkets posted a small decrease in vacancy, despite receiving
the majority of new supply over the past year, as declines in Hollywood and the Mid-Wilshire area offset a
mild uptick in the Downtown Los Angeles submarket.
Outlook: The quickest pace of construction in more than 16 years will lead the metro vacancy rate 10
basis points higher to 2.9 percent in 2016 as supply growth modestly exceeds net absorption.
Developers completed roughly 7,100 apartments over the past three quarters, bringing completions for
the year to more than 8,800 rentals. This pace more than doubles the prior year when more than 3,500
units were brought to market.
Completions over the past year have skewed overwhelmingly toward submarkets in the Greater
Downtown Los Angeles area. More than 2,700 have already been finished this year, with another 3,300
slated for delivery before the end of the year.
Looking forward to 2017, developers will slow the pace of construction to 9,400 units, with more than
two-thirds of expected deliveries coming online in the Greater Downtown Los Angeles area.
Outlook: Developers will complete 12,900 apartments this year, far outpacing previous years in the
current cycle. The majority of new construction will target urban submarkets in the metro core.
47
MARKET OVERVIEW
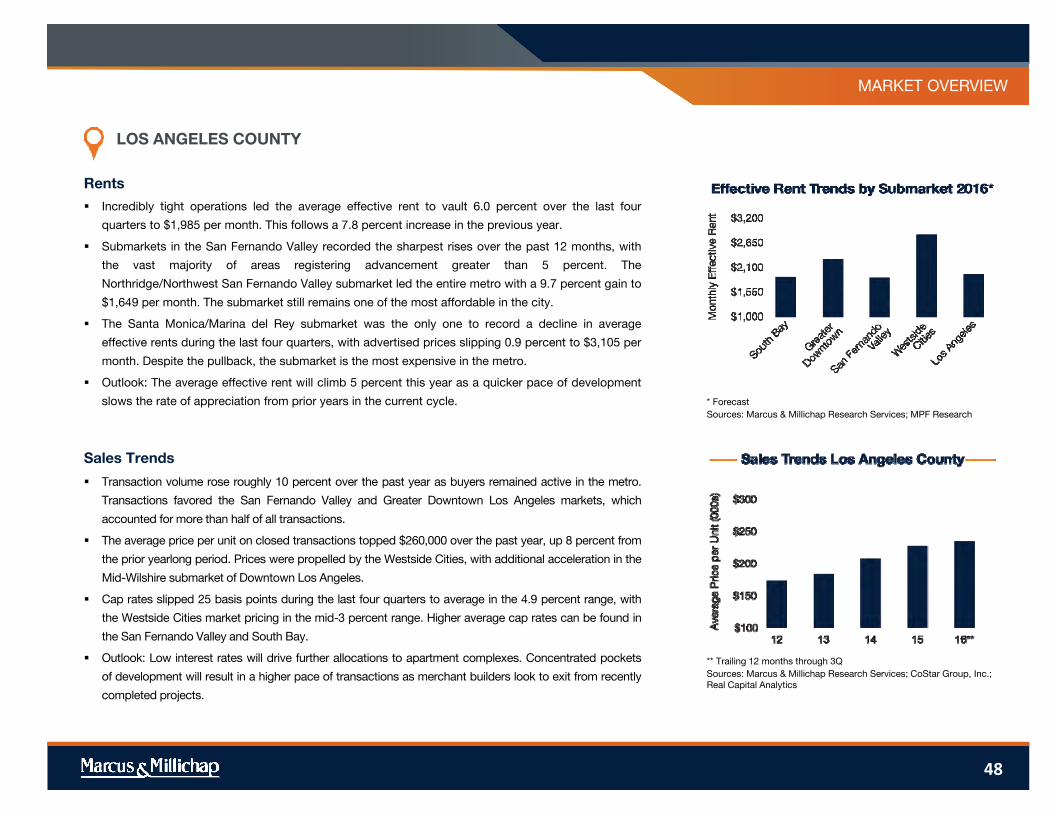
Rents
Sales Trends
** Trailing 12 months through 3Q
Sources: Marcus & Millichap Research Services; CoStar Group, Inc.;
Real Capital Analytics
* Forecast
Sources: Marcus & Millichap Research Services; MPF Research
LOS ANGELES COUNTY
Transaction volume rose roughly 10 percent over the past year as buyers remained active in the metro.
Transactions favored the San Fernando Valley and Greater Downtown Los Angeles markets, which
accounted for more than half of all transactions.
The average price per unit on closed transactions topped $260,000 over the past year, up 8 percent from
the prior yearlong period. Prices were propelled by the Westside Cities, with additional acceleration in the
Mid-Wilshire submarket of Downtown Los Angeles.
Cap rates slipped 25 basis points during the last four quarters to average in the 4.9 percent range, with
the Westside Cities market pricing in the mid-3 percent range. Higher average cap rates can be found in
the San Fernando Valley and South Bay.
Outlook: Low interest rates will drive further allocations to apartment complexes. Concentrated pockets
of development will result in a higher pace of transactions as merchant builders look to exit from recently
completed projects.
Incredibly tight operations led the average effective rent to vault 6.0 percent over the last four
quarters to $1,985 per month. This follows a 7.8 percent increase in the previous year.
Submarkets in the San Fernando Valley recorded the sharpest rises over the past 12 months, with
the vast majority of areas registering advancement greater than 5 percent. The
Northridge/Northwest San Fernando Valley submarket led the entire metro with a 9.7 percent gain to
$1,649 per month. The submarket still remains one of the most affordable in the city.
The Santa Monica/Marina del Rey submarket was the only one to record a decline in average
effective rents during the last four quarters, with advertised prices slipping 0.9 percent to $3,105 per
month. Despite the pullback, the submarket is the most expensive in the metro.
Outlook: The average effective rent will climb 5 percent this year as a quicker pace of development
slows the rate of appreciation from prior years in the current cycle.
48
MARKET OVERVIEW
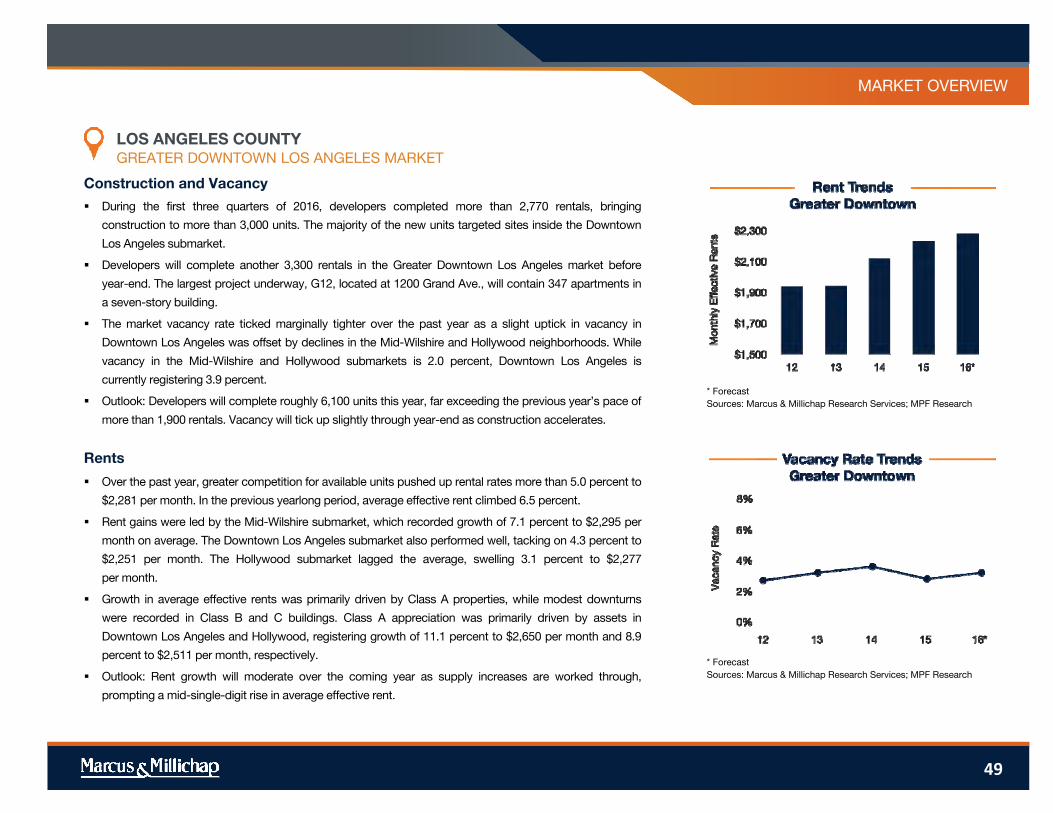
Construction and Vacancy
Rents
* Forecast
Sources: Marcus & Millichap Research Services; MPF Research
* Forecast
Sources: Marcus & Millichap Research Services; MPF Research
GREATER DOWNTOWN LOS ANGELES MARKET
LOS ANGELES COUNTY
Over the past year, greater competition for available units pushed up rental rates more than 5.0 percent to
$2,281 per month. In the previous yearlong period, average effective rent climbed 6.5 percent.
Rent gains were led by the Mid-Wilshire submarket, which recorded growth of 7.1 percent to $2,295 per
month on average. The Downtown Los Angeles submarket also performed well, tacking on 4.3 percent to
$2,251 per month. The Hollywood submarket lagged the average, swelling 3.1 percent to $2,277
per month.
Growth in average effective rents was primarily driven by Class A properties, while modest downturns
were recorded in Class B and C buildings. Class A appreciation was primarily driven by assets in
Downtown Los Angeles and Hollywood, registering growth of 11.1 percent to $2,650 per month and 8.9
percent to $2,511 per month, respectively.
Outlook: Rent growth will moderate over the coming year as supply increases are worked through,
prompting a mid-single-digit rise in average effective rent.
During the first three quarters of 2016, developers completed more than 2,770 rentals, bringing
construction to more than 3,000 units. The majority of the new units targeted sites inside the Downtown
Los Angeles submarket.
Developers will complete another 3,300 rentals in the Greater Downtown Los Angeles market before
year-end. The largest project underway, G12, located at 1200 Grand Ave., will contain 347 apartments in
a seven-story building.
The market vacancy rate ticked marginally tighter over the past year as a slight uptick in vacancy in
Downtown Los Angeles was offset by declines in the Mid-Wilshire and Hollywood neighborhoods. While
vacancy in the Mid-Wilshire and Hollywood submarkets is 2.0 percent, Downtown Los Angeles is
currently registering 3.9 percent.
Outlook: Developers will complete roughly 6,100 units this year, far exceeding the previous year’s pace of
more than 1,900 rentals. Vacancy will tick up slightly through year-end as construction accelerates.
49
MARKET OVERVIEW
Sales Trends
** Trailing 12 months through 3Q
Sources: Marcus & Millichap Research Services; MPF Research
GREATER DOWNTOWN LOS ANGELES MARKET
LOS ANGELES COUNTY
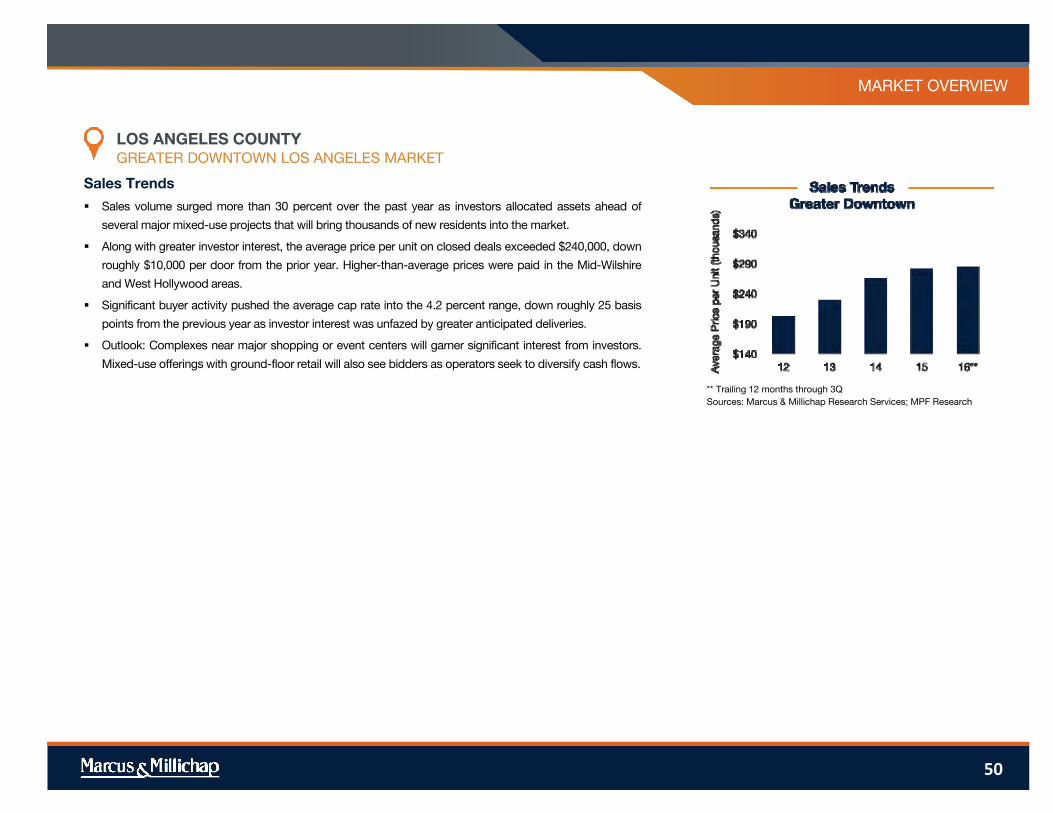
Sales volume surged more than 30 percent over the past year as investors allocated assets ahead of
several major mixed-use projects that will bring thousands of new residents into the market.
Along with greater investor interest, the average price per unit on closed deals exceeded $240,000, down
roughly $10,000 per door from the prior year. Higher-than-average prices were paid in the Mid-Wilshire
and West Hollywood areas.
Significant buyer activity pushed the average cap rate into the 4.2 percent range, down roughly 25 basis
points from the previous year as investor interest was unfazed by greater anticipated deliveries.
Outlook: Complexes near major shopping or event centers will garner significant interest from investors.
Mixed-use offerings with ground-floor retail will also see bidders as operators seek to diversify cash flows.
50
MARKET OVERVIEW
Construction and Vacancy
Rents
* Forecast
Sources: Marcus & Millichap Research Services; MPF Research
* Forecast
Sources: Marcus & Millichap Research Services; MPF Research
WESTSIDE CITIES MARKET
LOS ANGELES COUNTY
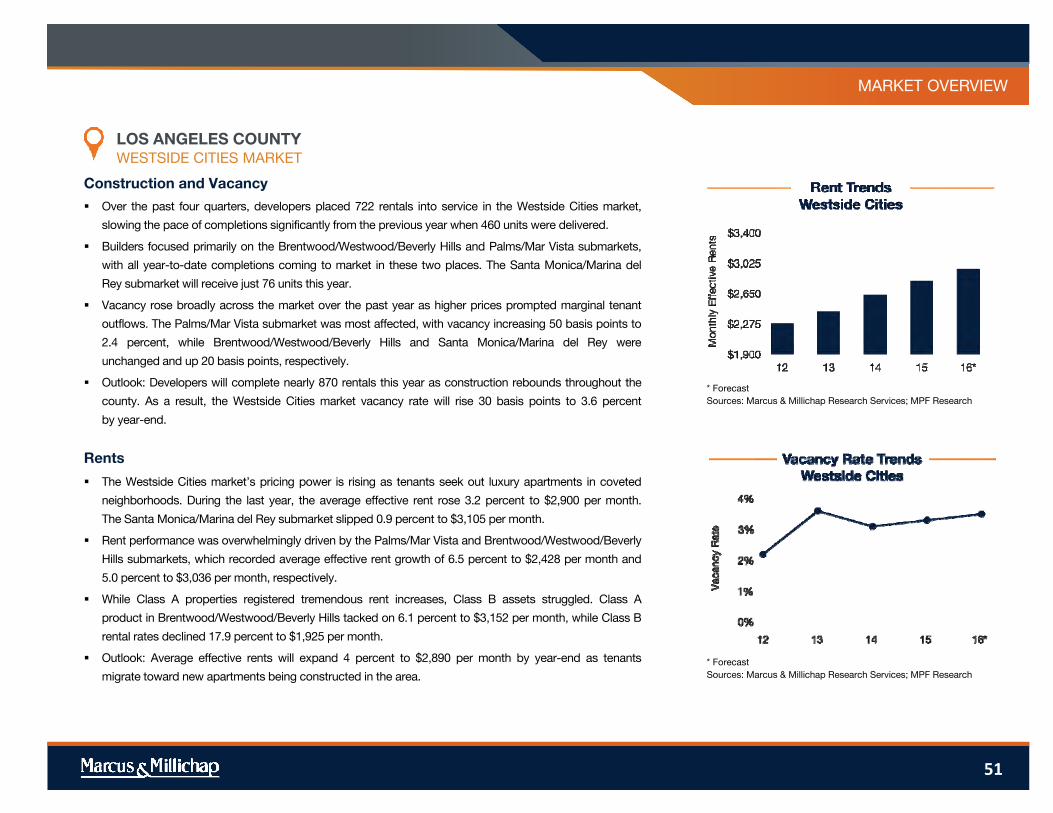
The Westside Cities market’s pricing power is rising as tenants seek out luxury apartments in coveted
neighborhoods. During the last year, the average effective rent rose 3.2 percent to $2,900 per month.
The Santa Monica/Marina del Rey submarket slipped 0.9 percent to $3,105 per month.
Rent performance was overwhelmingly driven by the Palms/Mar Vista and Brentwood/Westwood/Beverly
Hills submarkets, which recorded average effective rent growth of 6.5 percent to $2,428 per month and
5.0 percent to $3,036 per month, respectively.
While Class A properties registered tremendous rent increases, Class B assets struggled. Class A
product in Brentwood/Westwood/Beverly Hills tacked on 6.1 percent to $3,152 per month, while Class B
rental rates declined 17.9 percent to $1,925 per month.
Outlook: Average effective rents will expand 4 percent to $2,890 per month by year-end as tenants
migrate toward new apartments being constructed in the area.
Over the past four quarters, developers placed 722 rentals into service in the Westside Cities market,
slowing the pace of completions significantly from the previous year when 460 units were delivered.
Builders focused primarily on the Brentwood/Westwood/Beverly Hills and Palms/Mar Vista submarkets,
with all year-to-date completions coming to market in these two places. The Santa Monica/Marina del
Rey submarket will receive just 76 units this year.
Vacancy rose broadly across the market over the past year as higher prices prompted marginal tenant
outflows. The Palms/Mar Vista submarket was most affected, with vacancy increasing 50 basis points to
2.4 percent, while Brentwood/Westwood/Beverly Hills and Santa Monica/Marina del Rey were
unchanged and up 20 basis points, respectively.
Outlook: Developers will complete nearly 870 rentals this year as construction rebounds throughout the
county. As a result, the Westside Cities market vacancy rate will rise 30 basis points to 3.6 percent
by year-end.
51
MARKET OVERVIEW
Sales Trends
** Trailing 12 months through 3Q
Sources: Marcus & Millichap Research Services; MPF Research
WESTSIDE CITIES MARKET
LOS ANGELES COUNTY
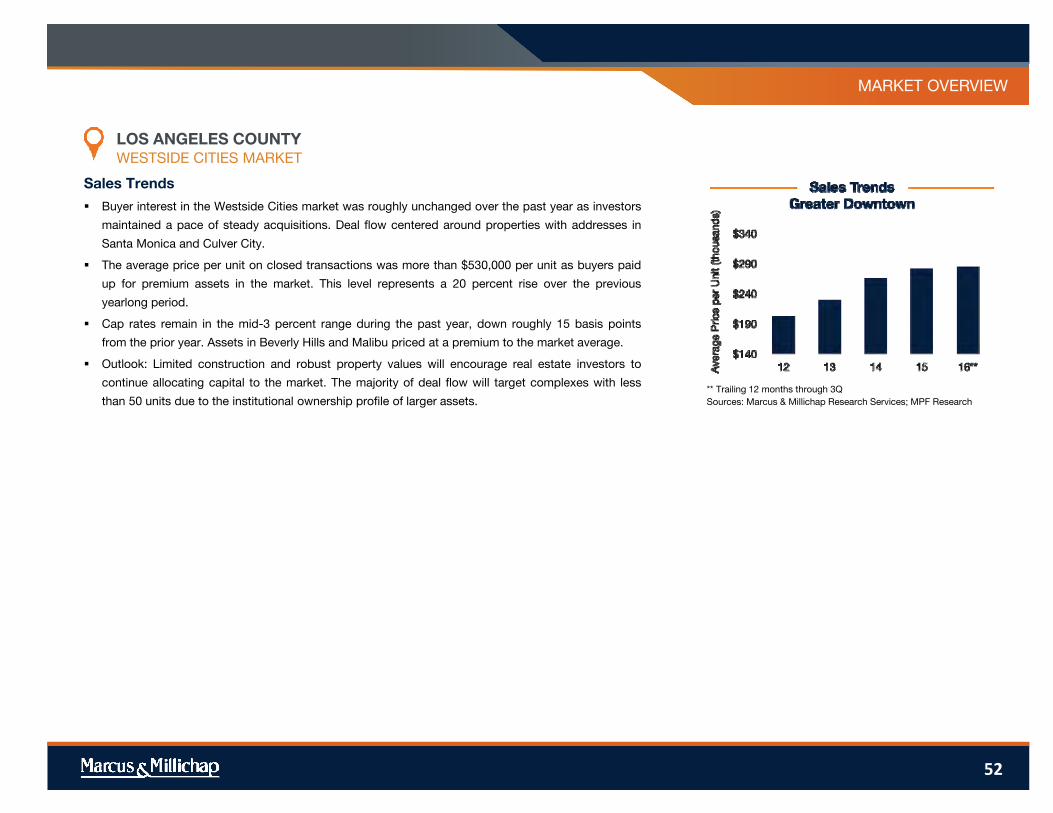
Buyer interest in the Westside Cities market was roughly unchanged over the past year as investors
maintained a pace of steady acquisitions. Deal flow centered around properties with addresses in
Santa Monica and Culver City.
The average price per unit on closed transactions was more than $530,000 per unit as buyers paid
up for premium assets in the market. This level represents a 20 percent rise over the previous
yearlong period.
Cap rates remain in the mid-3 percent range during the past year, down roughly 15 basis points
from the prior year. Assets in Beverly Hills and Malibu priced at a premium to the market average.
Outlook: Limited construction and robust property values will encourage real estate investors to
continue allocating capital to the market. The majority of deal flow will target complexes with less
than 50 units due to the institutional ownership profile of larger assets.
52
MARKET OVERVIEW
Construction and Vacancy
Rents
* Forecast
Sources: Marcus & Millichap Research Services; MPF Research
* Forecast
Sources: Marcus & Millichap Research Services; MPF Research
SAN FERNANDO VALLEY/TRI-CITIES MARKET
LOS ANGELES COUNTY
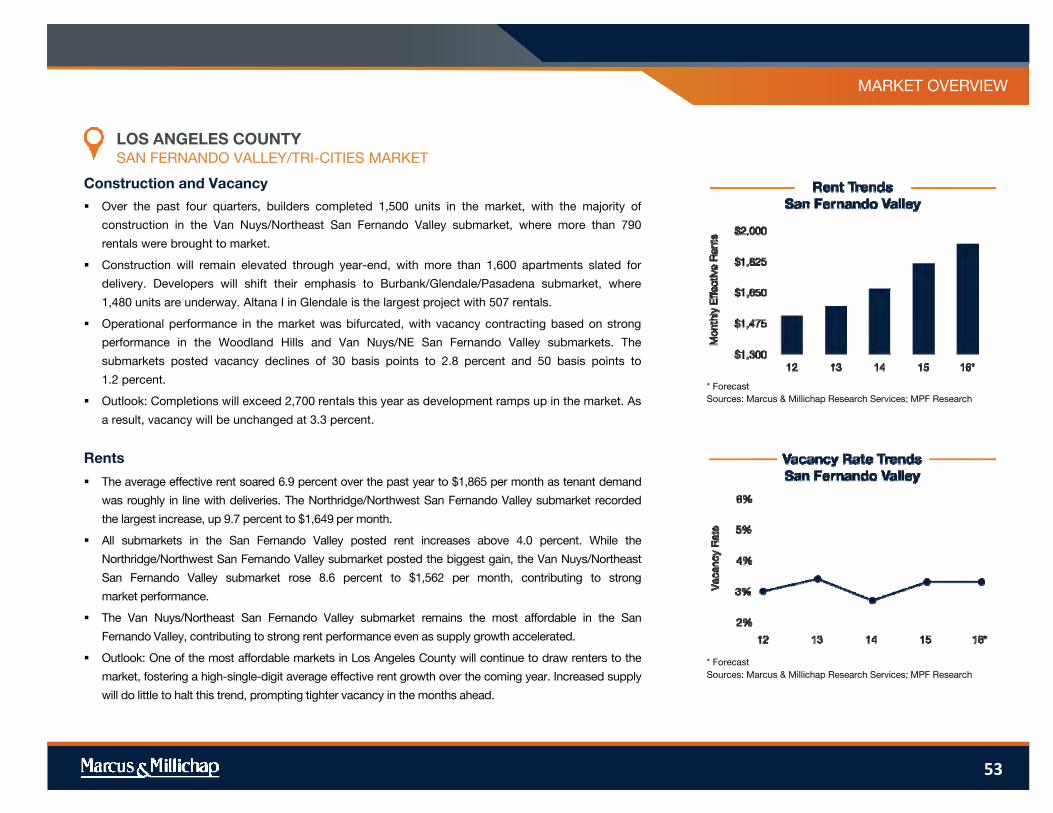
The average effective rent soared 6.9 percent over the past year to $1,865 per month as tenant demand
was roughly in line with deliveries. The Northridge/Northwest San Fernando Valley submarket recorded
the largest increase, up 9.7 percent to $1,649 per month.
All submarkets in the San Fernando Valley posted rent increases above 4.0 percent. While the
Northridge/Northwest San Fernando Valley submarket posted the biggest gain, the Van Nuys/Northeast
San Fernando Valley submarket rose 8.6 percent to $1,562 per month, contributing to strong
market performance.
The Van Nuys/Northeast San Fernando Valley submarket remains the most affordable in the San
Fernando Valley, contributing to strong rent performance even as supply growth accelerated.
Outlook: One of the most affordable markets in Los Angeles County will continue to draw renters to the
market, fostering a high-single-digit average effective rent growth over the coming year. Increased supply
will do little to halt this trend, prompting tighter vacancy in the months ahead.
Over the past four quarters, builders completed 1,500 units in the market, with the majority of
construction in the Van Nuys/Northeast San Fernando Valley submarket, where more than 790
rentals were brought to market.
Construction will remain elevated through year-end, with more than 1,600 apartments slated for
delivery. Developers will shift their emphasis to Burbank/Glendale/Pasadena submarket, where
1,480 units are underway. Altana I in Glendale is the largest project with 507 rentals.
Operational performance in the market was bifurcated, with vacancy contracting based on strong
performance in the Woodland Hills and Van Nuys/NE San Fernando Valley submarkets. The
submarkets posted vacancy declines of 30 basis points to 2.8 percent and 50 basis points to
1.2 percent.
Outlook: Completions will exceed 2,700 rentals this year as development ramps up in the market. As
a result, vacancy will be unchanged at 3.3 percent.
53

MARKET OVERVIEW
Sales Trends
** Trailing 12 months through 3Q
Sources: Marcus & Millichap Research Services; MPF Research
SAN FERNANDO VALLEY/TRI-CITIES MARKET
LOS ANGELES COUNTY
Over the past year, transaction volume in the San Fernando Valley vaulted 13.3 percent as buyers bid for
above-market-average yields. Dollar volume during this period exceeded $2.4 billion, with average
transaction prices above $4.8 million.
Greater investor interest also spilled over into the average price per unit, rising to more than $225,000 per
door. The bulk of deal flow was based in the Westlake, Glendale and Studio City/North Hollywood, while
higher than average prices were paid in Burbank and Sherman Oaks.
Initial cap rates in the market will average in the mid-4 percent band while extending into the mid-5
percent range farther from the metro core. The vast majority of deal flow will range from the low- to mid-4
percent area.
Outlook: Buyers seeking higher initial yields will seek outlying areas of the market for assets. Higher-end
assets will receive multiple offers, particularly with value-add opportunities.
54
MARKET OVERVIEW
Construction and Vacancy
Rents
* Forecast
Sources: Marcus & Millichap Research Services; MPF Research
* Forecast
Sources: Marcus & Millichap Research Services; MPF Research
SOUTH BAY/LONG BEACH MARKET
LOS ANGELES COUNTY
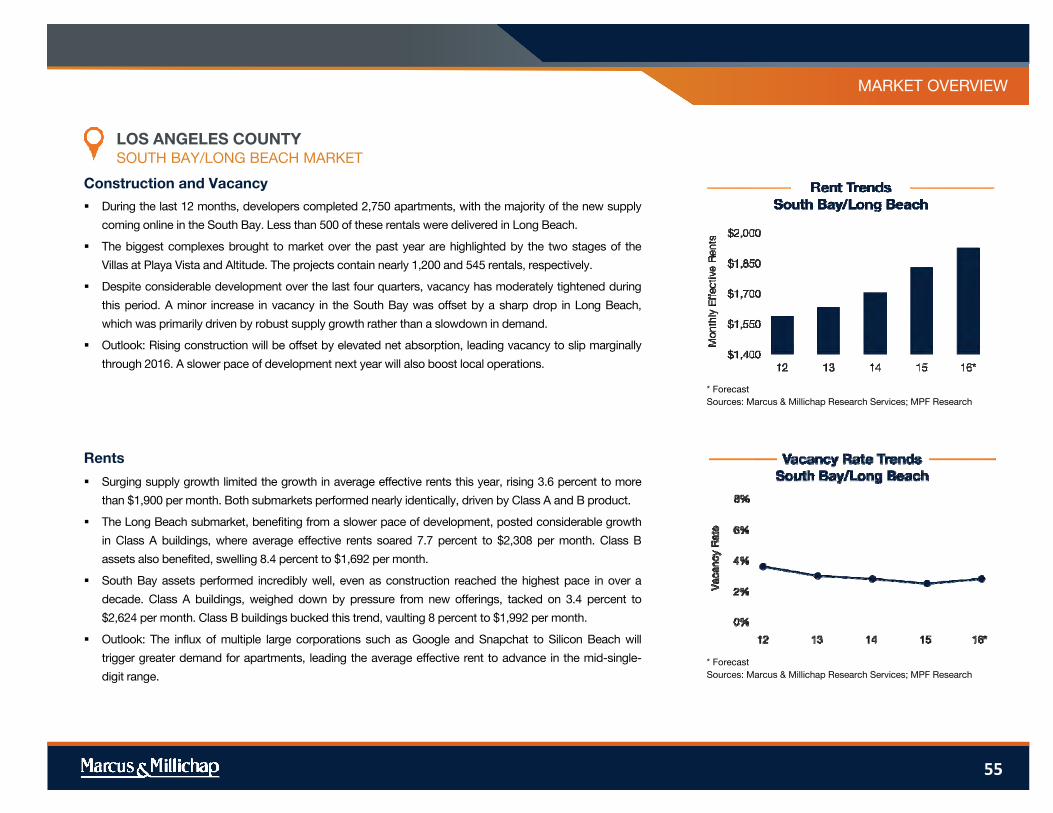
Surging supply growth limited the growth in average effective rents this year, rising 3.6 percent to more
than $1,900 per month. Both submarkets performed nearly identically, driven by Class A and B product.
The Long Beach submarket, benefiting from a slower pace of development, posted considerable growth
in Class A buildings, where average effective rents soared 7.7 percent to $2,308 per month. Class B
assets also benefited, swelling 8.4 percent to $1,692 per month.
South Bay assets performed incredibly well, even as construction reached the highest pace in over a
decade. Class A buildings, weighed down by pressure from new offerings, tacked on 3.4 percent to
$2,624 per month. Class B buildings bucked this trend, vaulting 8 percent to $1,992 per month.
Outlook: The influx of multiple large corporations such as Google and Snapchat to Silicon Beach will
trigger greater demand for apartments, leading the average effective rent to advance in the mid-single-
digit range.
During the last 12 months, developers completed 2,750 apartments, with the majority of the new supply
coming online in the South Bay. Less than 500 of these rentals were delivered in Long Beach.
The biggest complexes brought to market over the past year are highlighted by the two stages of the
Villas at Playa Vista and Altitude. The projects contain nearly 1,200 and 545 rentals, respectively.
Despite considerable development over the last four quarters, vacancy has moderately tightened during
this period. A minor increase in vacancy in the South Bay was offset by a sharp drop in Long Beach,
which was primarily driven by robust supply growth rather than a slowdown in demand.
Outlook: Rising construction will be offset by elevated net absorption, leading vacancy to slip marginally
through 2016. A slower pace of development next year will also boost local operations.
55
MARKET OVERVIEW
Sales Trends
** Trailing 12 months through 3Q
Sources: Marcus & Millichap Research Services; MPF Research
SOUTH BAY/LONG BEACH MARKET
LOS ANGELES COUNTY
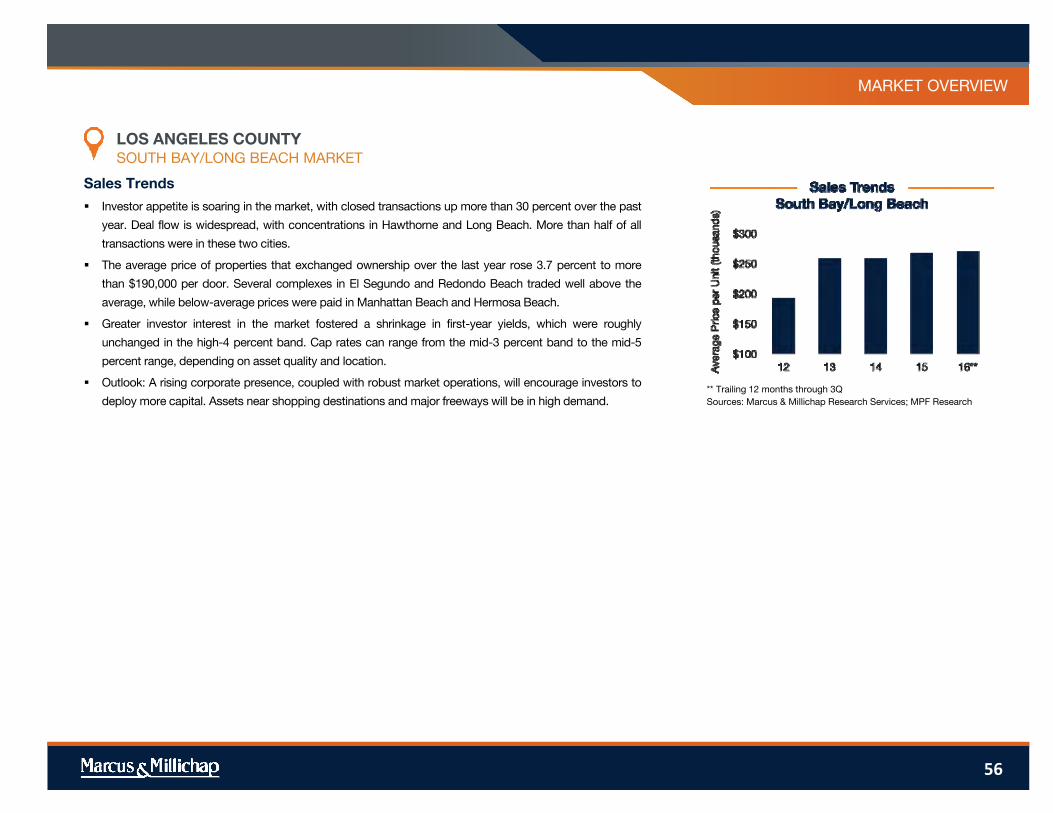
Investor appetite is soaring in the market, with closed transactions up more than 30 percent over the past
year. Deal flow is widespread, with concentrations in Hawthorne and Long Beach. More than half of all
transactions were in these two cities.
The average price of properties that exchanged ownership over the last year rose 3.7 percent to more
than $190,000 per door. Several complexes in El Segundo and Redondo Beach traded well above the
average, while below-average prices were paid in Manhattan Beach and Hermosa Beach.
Greater investor interest in the market fostered a shrinkage in first-year yields, which were roughly
unchanged in the high-4 percent band. Cap rates can range from the mid-3 percent band to the mid-5
percent range, depending on asset quality and location.
Outlook: A rising corporate presence, coupled with robust market operations, will encourage investors to
deploy more capital. Assets near shopping destinations and major freeways will be in high demand.
56

MARKET OVERVIEW
Capital Markets
LOS ANGELES COUNTY
57
Submarket Vacancy Ranking
Rank SubmarketVacancy
Rate
Y-O-Y bps
Change
Effective Rents
Y-O-Y % Change
1 East Los Angeles 0.7% 180 $1,346 10.1%
2Van Nuys/NE San Fernando
Valley1.2% 50 $1,562 8.6%
3 South San Gabriel Valley 1.5% 250 $1,567 7.8%
4 Southeast Los Angeles 1.8% 50 $1,548 7.9%
5 Mid-Wilshire 2.0% 20 $2,295 7.1%
6 Hollywood 2.0% 60 $2,277 3.1%
7 Long Beach 2.1% 50 $1,673 3.3%
8Brentwood/Westwood/Bever
ly Hills2.3% 0 $3,036 5.0%
9Northridge/NW San
Fernando Valley2.3% -30 $1,649 9.7%
10 Palms/Mar Vista 2.4% -50 $2,428 6.5%
11 South Los Angeles 2.5% -110 $1,453 2.4%
12 South Bay 2.7% -10 $2,172 3.5%
13 Woodland Hills 2.8% 30 $2,116 6.8%
14 Santa Clarita Valley 2.9% 50 $1,895 8.1%
15Sherman Oaks/N
Hollywood/Encino3.0% -120 $2,098 4.6%
16Santa Monica/Marina del
Rey3.1% -20 $3,105 -0.9%
17 North San Gabriel Valley 3.2% 30 $1,478 6.5%
18 Antelope Valley 3.5% -20 $1,063 11.5%
19 Burbank/Glendale/Pasadena 3.6% -150 $2,144 6.3%
20 Downtown Los Angeles 3.9% -20 $2,251 4.3%
The initial reading of third quarter GDP of 2.9 percent and consistent growth
in employment are fanning expectations that the Federal Reserve will raise
its benchmark short-term lending rate at its December meeting. Other
economic data showing steady improvement in the housing market and the
stabilization of oil prices around $50 per barrel offer signals that the U.S.
economy is growing at a sustainable pace.
Increasing rental housing demand underpinned a decline in the U.S.
apartment vacancy rate of 60 basis points to 3.5 percent year to date
through the third quarter, the lowest level this cycle. Apartment builders
have responded to growing demand and favorable demographic trends by
ramping up construction. Completions will rise to 320,000 units this year and
peak in 2017.
Capital markets remain highly competitive, offering an assortment of fixed-
rate products available through commercial banks, life-insurance
companies, CMBS and agency lenders. Fannie Mae and Freddie Mac are
underwriting loans of 10 years at maximum leverage of 80 percent. Rates
will typically reside in the high-3 to low-4 percent range, depending on
underwriting criteria. Portfolio lenders will also price in this vicinity but will
typically require loan-to-value ratios in the 65 to 75 percent band. Floating-
rate bridge loans and financing for asset repositioning are typically
underwritten with LTVs 70 to 75 percent of stabilized value (80 to 85
percent of cost) and price 300 basis points above Libor for recourse deals
and extending to 450 basis points above Libor for
non-recourse transactions.
PROPERTY NAME
MARKETING TEAM
TOLUCA PLAZA
DEMOGRAPHICS
Source: © 2016 Experian
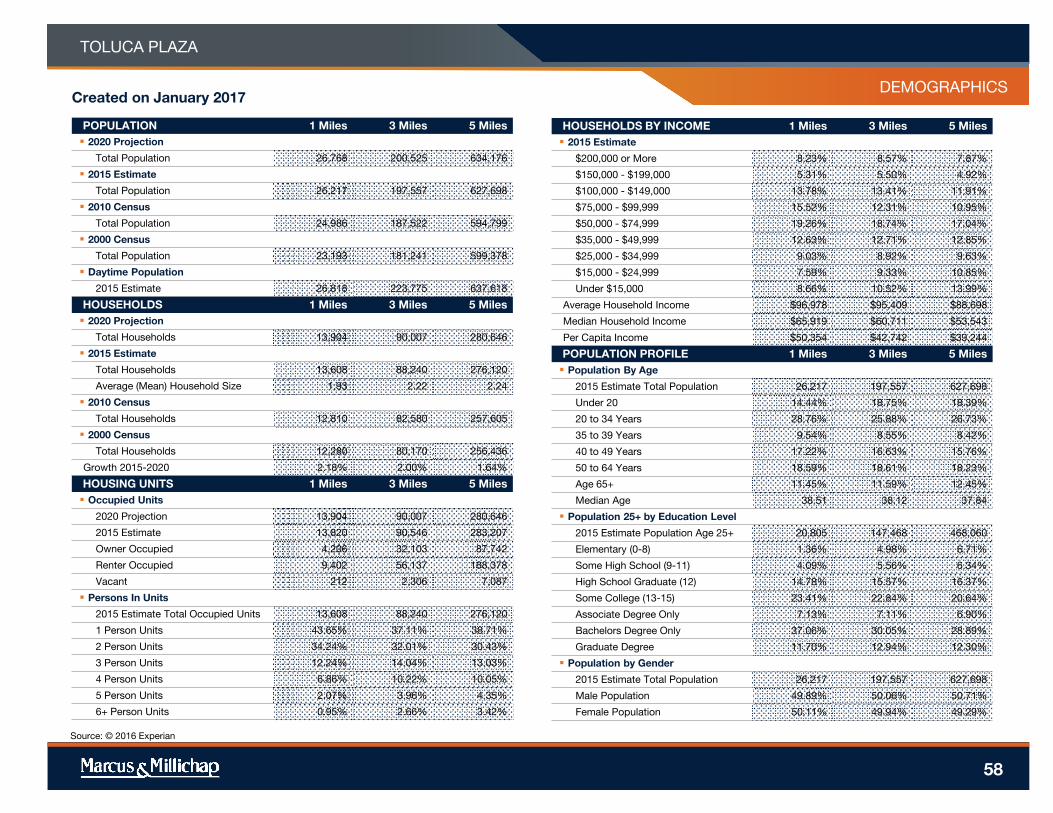
Created on January 2017
POPULATION 1 Miles 3 Miles 5 Miles
2020 Projection
Total Population 26,768 200,525 634,176
2015 Estimate
Total Population 26,217 197,557 627,698
2010 Census
Total Population 24,986 187,522 594,799
2000 Census
Total Population 23,193 181,241 599,378
Daytime Population
2015 Estimate 26,818 223,775 637,618
HOUSEHOLDS 1 Miles 3 Miles 5 Miles
2020 Projection
Total Households 13,904 90,007 280,646
2015 Estimate
Total Households 13,608 88,240 276,120
Average (Mean) Household Size 1.93 2.22 2.24
2010 Census
Total Households 12,810 82,580 257,605
2000 Census
Total Households 12,280 80,170 256,436
Growth 2015-2020 2.18% 2.00% 1.64%
HOUSING UNITS 1 Miles 3 Miles 5 Miles
Occupied Units
2020 Projection 13,904 90,007 280,646
2015 Estimate 13,820 90,546 283,207
Owner Occupied 4,206 32,103 87,742
Renter Occupied 9,402 56,137 188,378
Vacant 212 2,306 7,087
Persons In Units
2015 Estimate Total Occupied Units 13,608 88,240 276,120
1 Person Units 43.65% 37.11% 38.71%
2 Person Units 34.24% 32.01% 30.43%
3 Person Units 12.24% 14.04% 13.03%
4 Person Units 6.86% 10.22% 10.05%
5 Person Units 2.07% 3.96% 4.35%
6+ Person Units 0.95% 2.66% 3.42%
HOUSEHOLDS BY INCOME 1 Miles 3 Miles 5 Miles
2015 Estimate
$200,000 or More 8.23% 8.57% 7.87%
$150,000 - $199,000 5.31% 5.50% 4.92%
$100,000 - $149,000 13.78% 13.41% 11.91%
$75,000 - $99,999 15.52% 12.31% 10.95%
$50,000 - $74,999 19.26% 18.74% 17.04%
$35,000 - $49,999 12.63% 12.71% 12.85%
$25,000 - $34,999 9.03% 8.92% 9.63%
$15,000 - $24,999 7.59% 9.33% 10.85%
Under $15,000 8.66% 10.52% 13.99%
Average Household Income $96,978 $95,409 $88,698
Median Household Income $65,919 $60,711 $53,543
Per Capita Income $50,354 $42,742 $39,244
POPULATION PROFILE 1 Miles 3 Miles 5 Miles
Population By Age
2015 Estimate Total Population 26,217 197,557 627,698
Under 20 14.44% 18.75% 18.39%
20 to 34 Years 28.76% 25.88% 26.73%
35 to 39 Years 9.54% 8.55% 8.42%
40 to 49 Years 17.22% 16.63% 15.76%
50 to 64 Years 18.59% 18.61% 18.23%
Age 65+ 11.45% 11.59% 12.45%
Median Age 38.51 38.12 37.84
Population 25+ by Education Level
2015 Estimate Population Age 25+ 20,805 147,468 468,060
Elementary (0-8) 1.36% 4.98% 6.71%
Some High School (9-11) 4.09% 5.56% 6.34%
High School Graduate (12) 14.78% 15.57% 16.37%
Some College (13-15) 23.41% 22.84% 20.64%
Associate Degree Only 7.13% 7.11% 6.90%
Bachelors Degree Only 37.06% 30.05% 28.89%
Graduate Degree 11.70% 12.94% 12.30%
Population by Gender
2015 Estimate Total Population 26,217 197,557 627,698
Male Population 49.89% 50.06% 50.71%
Female Population 50.11% 49.94% 49.29%
58
Income
In 2016, the median household income for your selected geography is
$65,919, compare this to the US average which is currently . The
median household income for your area has changed by 33.01%
since 2000. It is estimated that the median household income in your
area will be $77,585 five years from now, which represents a change
of 17.70% from the current year.
The current year per capita income in your area is $50,354, compare
this to the US average, which is . The current year average
household income in your area is $96,978, compare this to the US
average which is .
Population
In 2016, the population in your selected geography is 26,217. The
population has changed by 13.04% since 2000. It is estimated that
the population in your area will be 26,768.00 five years from now,
which represents a change of 2.10% from the current year. The
current population is 49.89% male and 50.11% female. The median
age of the population in your area is 38.51, compare this to the US
average which is . The population density in your area is 8,343.73
people per square mile.
Households
There are currently 13,608 households in your selected geography.
The number of households has changed by 10.81% since 2000. It is
estimated that the number of households in your area will be 13,904
five years from now, which represents a change of 2.18% from the
current year. The average household size in your area is 1.93 persons.
Employment
In 2016, there are 20,366 employees in your selected area, this is also
known as the daytime population. The 2000 Census revealed that
80.74% of employees are employed in white-collar occupations in
this geography, and 19.26% are employed in blue-collar occupations.
In 2016, unemployment in this area is 8.95%. In 2000, the average
time traveled to work was 29.00 minutes.
Race and Ethnicity
The current year racial makeup of your selected area is as follows:
73.78% White, 5.59% Black, 0.07% Native American and 9.13%
Asian/Pacific Islander. Compare these to US averages which are:
White, Black, Native American and Asian/Pacific Islander. People
of Hispanic origin are counted independently of race.
People of Hispanic origin make up 18.48% of the current year
population in your selected area. Compare this to the US average of .
PROPERTY NAME
MARKETING TEAM
TOLUCA PLAZA
Housing
The median housing value in your area was $607,210 in 2016,
compare this to the US average of . In 2000, there were 4,030 owner
occupied housing units in your area and there were 8,250 renter
occupied housing units in your area. The median rent at the time was
$768.
Source: © 2016 Experian
DEMOGRAPHICS
59

www.MarcusMillichap.com
Jeff Louks
Executive Vice President Investments
Senior Director - National Multi Housing Group
Encino Office
Tel: (818) 212-2780
Fax: (818) 212-2710
License: CA 00908473
Brett Sanson
Senior Associate
Director - National Multi Housing Group
Encino Office
Tel: (818) 212-2785
Fax: (818) 212-2710
License: CA 01387480
Gayle Factor
Vice President Investments
Director - National Multi Housing Group
Encino Office
Tel: (818) 212-2756
Fax: (818) 212-2710
License: CA 01066258
P R E S E N T E D B Y


![RESEARCHARTICLE MicroRNAshsa-miR-99b,hsa-miR · PDF fileATG2A,PMEPA1, DKK3,PDCD4). ... endometriosis, cellfate decisions andangiogenesis[62–70].Hsa-miR-99b hasbeendemonstratedtotargetcomponentsofNF](https://img.pdfslide.us/doc/110x75/5a985eb07f8b9a30358d63f2/researcharticle-micrornashsa-mir-99bhsa-mir-pmepa1-dkk3pdcd4-endometriosis.jpg)