Embed Size (px)
DESCRIPTION
ZTE UMTS KPI Optimization Analysis Guide
Citation preview
UMTS KPI Optimization Analysis Guide
V11
UMTS KPI Optimization Analysis Guide Internal Use Only
LEGAL INFORMATION
By accepting this certain document of ZTE CORPORATIN you agree to the following terms If you do not agree to the following terms please notice that you are not allowed to use this document
Copyright copy 2009 ZTE CORPORATION Any rights not expressly granted herein are reserved This document contains proprietary information of ZTE CORPORATION Any reproduction transfer distribution use or disclosure of this document or any portion of this document in any form by any means without the prior written consent of ZTE CORPORATION is prohibited
and are registered trademarks of ZTE CORPORATION ZTErsquos company name logo and product names referenced herein are either trademarks or registered trademarks of ZTE CORPORATION Other product and company names mentioned herein may be trademarks or trade names of their respective owners Without the prior written consent of ZTE CORPORATION or the third party owner thereof anyonersquos access to this document should not be construed as granting by implication estopped or otherwise any license or right to use any marks appearing in the document
The design of this product complies with requirements of environmental protection and personal security This product shall be stored used or discarded in accordance with product manual relevant contract or laws and regulations in relevant country (countries)
This document is provided ldquoas isrdquo and ldquoas availablerdquo Information contained in this document is subject to continuous update without further notice due to improvement and update of ZTE CORPORATIONrsquos products and technologies
ZTE CORPORATION
Address
NO 55Hi-tech Road SouthShenZhenPRChina518057
Website httpsup portztecomcn
Email docztecomcn
ZTE Confidential Proprietary copy 2012 ZTE CORPORATION All rights reserved I
UMTS KPI Optimization Analysis Guide Internal Use Only
Revision History
Product Version Document Version Serial Number Reason for Revision
V10 First published
V11 Content modification
Author
Date Document VersionPrepared
byReviewed by Approved by
2007-12-28 V10 Qin Jianhan
Wang Zhenhai and Jin Zhengtuan
Jin Zhengtuan
2010-07-12 V11Wang Cun
Wang Zhenhai and Jin Zhengtuan
Jin Zhengtuan
ZTE Confidential Proprietary copy 2012 ZTE CORPORATION All rights reserved II
UMTS KPI Optimization Analysis Guide Internal Use Only
Key Words
KPI (key performance indicator) indicator definition formula KPI monitoring flow KPI optimization KPI classification
Abstract
This guide mainly describes the formulae KPI classification KPI monitoring methods and flows and KPI optimization methods
Abbreviations
Abbreviation Full name
ATM Asynchronous Transfer Mode
CDR Call Drop Rate
CE Channel Element
CN Core Network
CPICH Common Pilot Channel
CQI Channel Quality Indicator
CQT Call Quality Test
DT Drive Test
E-DCH Enhanced uplink Dedicated Channel
HSDPA High Speed Downlink Packet Access
HS-DSCH High Speed Downlink Shared Channel
HS-SCCH High Speed Shared Control Channel
HSUPA High Speed Uplink Packet Access
ICMP Internet Control Message Protocol
IP Internet Protocols
IPoA Internet Protocols Over ATM
KPI Key Performance Index
LAN Local Area Network
MAC Media Access Control
MBMSMultimedia Broadcast and Multicast Service
NodeB Node B
OMC Operation amp maintenance Centre
PDP Packet data protocol
PI Performance Index
PPP Point to Point Protocol
PS Packet-Switched domain
QoS Quality of Service
RAB Radio Access Bearer
ZTE Confidential Proprietary copy 2012 ZTE CORPORATION All rights reserved III
UMTS KPI Optimization Analysis Guide Internal Use Only
Abbreviation Full name
RF Radio Frequency
RNC Radio Network Controller
RRC Radio Resource Control
RRU Radio Remote Unit
RSCP Received Signal Code Power
RTWP Received Total Wideband Power
SAAL Signaling ATM Adaptation Layer
SCCP Signaling Connection Control Part
SNR Signal to Noise Ratio
TB Transport Block
TCP Transfer Control Protocol
UDP User Datagram Protocol
UE User Equipment
VIP Very Important People
VP Video Phone
WAN Wide Area Network
ZTE Confidential Proprietary copy 2012 ZTE CORPORATION All rights reserved IV
UMTS KPI Optimization Analysis Guide Internal Use Only
About This Document
Summary
Chapter Description
1 Overview Brief introduction to KPI optimization
2 KPI Monitoring Process KPI monitoring process
3 KPI Analysis Methods Common KPI analysis methods basic KPI analysis skills and general process for KPI optimization analysis
4 KPI Optimization Analysis KPI Optimization Analysis on CS call drops PS call drops accessibility indicators mobility indicators and resource indicators
ZTE Confidential Proprietary copy 2012 ZTE CORPORATION All rights reserved V
UMTS KPI Optimization Analysis Guide Internal Use Only
TABLE OF CONTENTS
1 Overview 1
2 KPI Monitoring Process 2 21 KPI Monitoring Process 2 22 Routine KPI Monitoring Process 2 23 KPI Monitoring Process During Parameter Modification 4 24 KPI Monitoring During RNC or NodeB Version Upgrade 5 25 KPI Monitoring During Cutover 6
3 KPI Analysis Methods 6 31 KPI Analysis Methods 6 311 TOP N Worst Cells Method 7 32 Basic KPI Analysis Skills 10 321 KPI Monitoring Tools 11 322 KPI Analysis Tools 11 33 General Process of KPI Optimization Analysis 12
4 KPI Optimization Analysis 16 41 CS Call Drop Optimization 16 411 Definition of Call Drop 16 412 CS Call Drop Analysis Flowchart 17 42 PS Call Drop Optimization 19 421 Optimization Flowchart 19 43 Optimization of Accessibility Indicators 21 431 Definition of Access Failure 21 432 Analysis on RRC Connection Failures 22 433 Analysis on RABRB Setup Failures 27 44 Optimization of Mobility Indicators 33 441 Optimization of Soft Handovers 33 442 Optimization of Hard Handovers 39 443 Optimization of Inter-RAT Handovers 44 45 Optimization of Resource Indicators 48 451 Resource Indicator Optimization Flowchart 49 452 Code Resource Optimization 51 453 Monitoring CE Resource 51 454 Optimization of Power Control 52 455 Speeding up Rate Downgrade 52 456 Monitoring and Optimizing Uplink Capacity 52 457 Optimization of Uplink Capacity at the Whole Network Level 53 458 Optimization of Uplink Capacity for a Single Cell 53
ZTE Confidential Proprietary copy 2012 ZTE CORPORATION All rights reserved VI
UMTS KPI Optimization Analysis Guide Internal Use Only
FIGURES
Figure 1-1 Joint KPI analysis1
Figure 2-2 Routine KPI monitoring process2
Figure 2-3 KPI monitoring process during parameter modification4
Figure 2-4 KPI monitoring workflow during RNC or NodeB version upgrade5
Figure 3-5 RF configuration at HIC site8
Figure 3-6 Antenna energy distribution at HIC site8
Figure 3-7 KPI optimization analysis process 15
Figure 4-8 CS call drop analysis flowchart17
Figure 4-9 PS call drop optimization flowchart19
Figure 4-10 Analysis flowchart of RRC connection setup failures23
Figure 4-11 Analysis flowchart of RAB setup failures28
Figure 4-12 Soft handover optimization flowchart34
Figure 4-13 Hard handover optimization flowchart41
Figure 4-14 Inter-RAT handover optimization flowchart46
Figure 4-15 Resource indicator optimization flowchart49
TABLES
ZTE Confidential Proprietary copy 2012 ZTE CORPORATION All rights reserved VII
UMTS KPI Optimization Analysis Guide Internal Use Only
Table 3-1 List of CS TOP N Worst Cells7
Table 3-2 Indicators Related with CS Call Drop9
Table 4-3 Parameters That 2G Shall Provide to 3G44
Table 4-4 Parameters That 3G Shall Provide to 2G44
Table 4-5 Resource KPIs and Alarm Thresholds48
Table 4-6 Adjusting Code Resource Allocation51
Table 4-7 Example of Parameter Modification for Rate Downgrade52
Table 4-8 Example of Power Control Parameter Modification53
Table 4-9 Example of Power Control Parameter Modification for Heavy-Traffic Cell 53
ZTE Confidential Proprietary copy 2012 ZTE CORPORATION All rights reserved VIII
UMTS KPI Optimization Analysis Guide Internal Use Only
1 OverviewThe radio network KPIs directly reflect the network quality and KPI monitoring is an important means to locate the faults KPI monitoring and optimization are mostly performed during the network operation and maintenance stage Abnormal events are supposed to be detected as early as possible and handled with proper solutions so that sound voice and data services can be ensured for the subscribers
At the beginning of the network construction the optimization team should put more emphasis on the RF adjustment rather than the optimization of KPIs except for CS call drop rate the PS call drop rate and the RTWP indicator During the network operation and maintenance stage KPI optimization (also called parameter optimization) plays the main role that is the optimization team should optimize a certain indicator through integrated parameter adjustment so as to meet the customerrsquos requirements
KPI data comes from NetNumenT31 the network management system in the operation and maintenance center (OMC) Based on the analysis on KPIs the current states of those indicators are learned and they are important reference for assessing the network performance The KPIs include the network service retaining capacity accessibility mobility system capacity and so on According to the current values of these indicators for example some site has congestion some site has a call drop rate of 10 or some RNC has a certain worst cell proportion busy cell proportion cell code resource availability access success rate call delay and handover success rate the optimization team should judge and locate the area scope and severity of the fault
KPIs are divided into service KPIs and network KPIs by the statistic sources Service KPIs are collected through field drive tests (DTs) while network KPIs are collected from the unified network management system This article mainly discusses the analysis on network KPIs Usually the final solution is made based on the joint analysis on the OMC KPI data alarms subscribersrsquo complaints and DT results
Figure 1-1 Joint KPI analysis
ZTE Confidential Proprietary copy 2012 ZTE CORPORATION All rights reserved 1
Hand to RampD dept or
customer service dept交研发或用
服处理
UMTS KPI Optimization Analysis Guide Internal Use Only
2 KPI Monitoring ProcessThe purpose of KPI monitoring is to find out abnormal events that affect services as well as subscribersrsquo perception and solve the problems as early as possible For instance if the call drop rate at a certain site goes over 50 we need to find the problem and work out the solution in the earliest time
As it is very urgent and important to locate KPI problems we need a whole set of scientific KPI monitoring mechanism and problem shooting process as well as appropriate monitoring tool and analysis tool to help us find the call drops caused by transmission problems resource congestion cells service interruption serious interference hardware fault with NodeB wrong configuration of RNC parameters in time
We classify KPI monitoring into four categories routine KPI monitoring KPI monitoring during the process of parameter modification KPI monitoring during the RNC or NodeB version upgrade and KPI monitoring during the process of cutover Routine KPI monitoring should be performed every day and be recorded in a KPI daily report which should involve the worst CS cell the worst PS cell the cell with the lowest RRC connection rate the cell with the most serious resource limit and so on
21 KPI Monitoring Process
KPI monitoring falls into four categories routine KPI monitoring KPI monitoring during the process of parameter modification KPI monitoring during the version upgrade of RNC or NodeB and KPI monitoring during the process of cutover Each type of monitoring has its own monitoring items and output form For instance the output of the routine KPI monitoring should be a daily report while the output of other KPI monitoring types should be a KPI comparison report Different types of KPI monitoring should have different time granularities according to the requirement of problem location
Routine KPI monitoring should be done persistently and be recorded in a daily report which should include a collection of the cells worst in different aspects and be sent to relevant person by email
22 Routine KPI Monitoring Process
Figure 2-2 Routine KPI monitoring process
ZTE Confidential Proprietary copy 2012 ZTE CORPORATION All rights reserved 2
Hand to RampD dept or
customer service dept交研发或用
服处理
UMTS KPI Optimization Analysis Guide Internal Use Only
ZTE Confidential Proprietary copy 2012 ZTE CORPORATION All rights reserved 3
Parameter problem
Hand to the planning personnel
Classification of the
worst cells
Problem handling team classifies
collects and locates the worst cells
Hand to the network
optimization personnel
Hand to RampD dept or
customer service dept交研发或用
服处理
Send email in fixed format to relevant
personnel
Coverage problem
Equipmentversion problem
Network KPI monitoring
( 15 minutes time granularity)
Screen out the worst cells with
KPI tool
EMS exports the one-day granularity
of the whole network
Output KPI daily report in Excel
UMTS KPI Optimization Analysis Guide Internal Use Only
23 KPI Monitoring Process During Parameter Modification
Figure 2-3 KPI monitoring process during parameter modification
Old parameter configuration
Configure data according to the
worksheet
Network KPI monitoring (15-
minute granularity)
Whether the KPIs at the
RNC level are normal
Keep on monitoring (15-
minute granularity)
Output a report in Word (hourly
granularity KPIs before and after the parameter modification)
End
Yes
Notify the person in charge by mail
or phone
Rollback or not
Locate the worst cells and check if they are caused
by the parameter modification
No
Yes
No
ZTE Confidential Proprietary copy 2012 ZTE CORPORATION All rights reserved 4
Network KPI monitoring
( 15 minutes time granularity)
UMTS KPI Optimization Analysis Guide Internal Use Only
24 KPI Monitoring During RNC or NodeB Version Upgrade
Figure 2-4 KPI monitoring workflow during RNC or NodeB version upgrade
ZTE Confidential Proprietary copy 2012 ZTE CORPORATION All rights reserved 5
Yes
No
No
End
Locate the worst cells Determine whether they are related with the version update
Yes
Network KPI monitoring
( 15 minutes time granularity)
Execute the worksheet to
upgrade version
Output formal Word report (Compare the hourly granularity KPIs before and after the parameter modification and output the result every hour)
Whether the RNC-level
KPI is normal
Keep on monitoring (15 minutes granularity)
Send mail to or call the person in charge
Rollback or not
Current version
UMTS KPI Optimization Analysis Guide Internal Use Only
25 KPI Monitoring During Cutover
For the network on which the equipment needs to be replaced (for instance HongKong CSL network for which we replaced Nokiarsquos equipment with ZTErsquos) after the network optimization is completed the subscribers on the existing network should be cut over to our network gradually During the cutover there will be subscribers registering on our network constantly which will cause load increase on the network In this case we should watch KPI changes closely The monitoring process items method and report are the same as those described in section 24 ldquoKPI Monitoring During RNC or NodeB VersionUpgraderdquo Please read it for reference
3 KPI Analysis Methods
31 KPI Analysis Methods
Different network problems require different performance analysis methods Choose one or more appropriate methods after learning the running state of the existing network and the problems with it Common analysis methods are as follows
TOP N worst cells method Based on the traffic statistics indicators we care about (such as the call drop rate connection rate and soft handoff failure rate) choose N worst cells whose average indicator values in the peak hours or of the whole day are the lowest as the target of fault analysis and optimization Or prioritize objects of optimization against these indicator values
Time tendency chart method Tendency chart of indicator change is commonly used in the traffic analysis The analysis engineer can work out an hourly daily or weekly tendency chart of one or more indicators of the whole network a cluster or a single cell and find out the change rule of traffic statistics indicators
Regional location method The change of network performance indicators often occurs in some regions The indicators in these regions may be worsened by traffic increase traffic mode change radio environment change faults with a small number of stations or uplinkdownlink interference which will therefore affect the performance indicators of the whole network By comparing the network performance indicators before and after the change we can mark out the station or the sector with the greatest indicator change on an electronic map and take these problem regions as the analysis focus
Comparison method A single traffic statistics indicator may be affected by many factors While some factors change others may not Choose a proper object for comparison to confirm the existence of problems and then analyze the causes of the problems When examining an indicator do not care whether the absolute indicator value is high or low only pay more attention to whether the value is high or low compared to other indicators instead
ZTE Confidential Proprietary copy 2012 ZTE CORPORATION All rights reserved 6
UMTS KPI Optimization Analysis Guide Internal Use Only
311 TOP N Worst Cells Method
During the whole process of KPI optimization analysis TOP N worst cells analysis method is the most effective one which can be used throughout the whole optimization phase By focusing on the TOP N worst cells you can solve the major problems with the network Abnormal call drop events may happen every day and these events may represent problems of a kind After solving the problems with TOP N cells you can solve the problems of the same kind Therefore focusing on TOP N cells is one of the most effective ways to solve problems
TOP N worst cells analysis method is applicable to the optimization analysis of all the indicators Choose TOP N worst cells according to a certain threshold which varies depending on different indicators N stands for the number of the worst cells When the worst cells are too many to be worked on the number of the worst cells can be decreased so that you can focus on them TOP N cells analysis method includes the following steps
Step 1 Screen out TOP N cells according to the condition of the indicators you care about
Step 2 Conduct a health check for TOP N cells Check whether there are any problems with transmission or boards and check whether the worst cells are caused by external abrupt incidents such as terrible weather gatherings or holiday (because during gatherings and holidays the traffic is usually heavy)
Step 3 Check the radio parameters configuration of these cells the radius of these cells and their neighboring cells and compare them with the normal cells
Step 4 Export the indicator relevant most closely with the indicators you care about and analyze it to find the problem indirectly
For instance one day CS call drop rate of a whole network was high We analyzed the problem by the TOP N cells analysis method
Step 1 Screen out TOP N cells according to the condition of the indicators you care about
We used the CNO KPI analysis function to screen out TOP N cells (other tools can be also used) and selected 10 cells with the highest CS call drop rate
Table 3-1 List of CS TOP N Worst Cells
Index Cell RNS subnet ID Cell IDCall drop
rate CS AMRNumber of call
drop voice
1 ZBL1U-AI-1 (201) 12911 4158 553
2 ZBL1U-AI-3 (201) 12913 3955 545
3HKE1U-5H-1
(203) 30461 1556 370
ZTE Confidential Proprietary copy 2012 ZTE CORPORATION All rights reserved 7
UMTS KPI Optimization Analysis Guide Internal Use Only
Index Cell RNS subnet ID Cell IDCall drop
rate CS AMRNumber of call
drop voice
4HKE1U-5H-3
(203) 30463 1581 360
5LAK1U-9M-3
(202) 11063 339 282
6 HIC1U-9R-1 RNC101(101) 10891 226 216
7LAK1U-9M-1
(202) 11061 249 215
8EBP1U-9R-3
RNC101(101) 12823 230 205
9SRS1U-5H-1
RNC102-CSL(102)
12091 392 169
10HRM1U-6R-1
RNC102-CSL(102)
20671 341 167
Step 2 Check the transmission and hardware of the TOP N cells and check whether they are caused by external abrupt incidents such as terrible whether gatherings or holidays when traffic is usually heavy
And then we conducted a health check for each cell and paid attention to routine alarms and BPC board problems We found there were broken associations in some HKE sites
Step 3 Check the radio parameters configuration of these cells the radius of these cells and their neighboring cells and compare them with the normal cells
(1)Problem with the cell radius After the check we found the cell radius of the LAK site was 25 km Because the LAK site was situated by the sea and the antenna was placed very high the radius of 25 km was far from enough So we changed the cell radius to 10 km and the problem of high call drop rate was thus solved
(2)Problem with configuration HIC site is an indoor POI site The RRU RxTx port and the RRU Rx port were configured reversely which is the cause of high call drop rate After modifying HIC we found that signals of the second RRU were received by the Rx port So we changed the configuration of the RxTx port and the Rx port the problem of high call drop rate was thus solved
Figure 3-5 RF configuration at HIC site
Figure 3-6 Antenna energy distribution at HIC site
ZTE Confidential Proprietary copy 2012 ZTE CORPORATION All rights reserved 8
UMTS KPI Optimization Analysis Guide Internal Use Only
Step 4 Export the indicator relevant most closely with the indicators you care about and analyze it to find the problem indirectly
Table 3-2 Indicators Related with CS Call Drop
Index Cell
RAB release number for Iu connection
release request by UTRAN for CS domain in
cell radio connection with UE lost
RAB release number for Iu connection
release request by UTRAN for CS domain in cell failure in
the radio Interface
procedure
RAB release number for Iu connection
release request by
UTRAN for CS domain in
cell release due to
overload control
RAB release number for Iu connection
release request by
UTRAN for CS domain in
cell unspecified
failure
Average cell freq RTWP (dbm)
1ZBL1U-AI-1
482 43 0 29 -104177
2ZBL1U-AI-3
473 40 0 33 -104125
3HKE1U-5H-1
346 16 0 8 -105908
4HKE1U-5H-3
330 18 0 13 -1060777
5LAK1U-9M-3
69 196 0 18 -1031906
6HIC1U-9R-1
100 100 0 16 -1015404
7 LAK1U- 64 131 0 20 -1031934
ZTE Confidential Proprietary copy 2012 ZTE CORPORATION All rights reserved 9
UMTS KPI Optimization Analysis Guide Internal Use Only
Index Cell
RAB release number for Iu connection
release request by UTRAN for CS domain in
cell radio connection with UE lost
RAB release number for Iu connection
release request by UTRAN for CS domain in cell failure in
the radio Interface
procedure
RAB release number for Iu connection
release request by
UTRAN for CS domain in
cell release due to
overload control
RAB release number for Iu connection
release request by
UTRAN for CS domain in
cell unspecified
failure
Average cell freq RTWP (dbm)
9M-1
8EBP1U-9R-3
98 90 0 17 -101413
9SRS1U-5H-1
87 59 0 22 -1043528
10HRM1U-6R-1
42 111 0 13 -1027697
32 Basic KPI Analysis Skills
Be able to use the KPI statistics tool and the analysis tool
Use tools to learn about the running state of the whole network quickly and screen out TOP N worst cells quickly
Use different analysis tools to find problems from different aspects and locate the problem quickly
Understand the signaling process and basic principle
In the process of abnormity location keep a clear aim in mind and be able to apply the process and basic principle to check the other relevant indicators rapidly to facilitate the analysis
Be familiar with the process and basic principle and be able to make logical association between abnormal KPI problems and network problems (such as the coverage problem and the interference problem) Be able to determine the problem nature according to the abnormal KPI and then choose the appropriate tool to analyze the problem in depth
Performance analysis requires engineers to understand basic signaling process be familiar with the protocol stacks of standard interfaces and know relevant algorithms to realize the product functions Engineers should at least have a concept about the various algorithms If the analysis of a commercial network involves some algorithms engineers should study these algorithms in depth
ZTE Confidential Proprietary copy 2012 ZTE CORPORATION All rights reserved 10
UMTS KPI Optimization Analysis Guide Internal Use Only
321 KPI Monitoring Tools
minus Network management tool NetNumenT31 count KPI original data alarm data radio parameter configuration in cells and parameter configuration on the earth
minus KPI daily report generating tool classify key indicators according to a certain condition and screen out the worst cells
322 KPI Analysis Tools
minus CNO Tool CNO tool has the KPI analysis function So using it you can screen out the worst cells according to various conditions and point out the corresponding counter of an indicator
minus SignalTrace Trace the signaling (RNL signaling and RNL signaling) of RNC interfaces which includes the Iu interface the Iur interface the Iub interface and the Uu interface (the signaling flow between RNC and UE at RRC layer) And RNL signaling trace is a common way for locating the KPI problem Being able to trace the RNC signaling is a basic requirement for the on-site KPI optimization engineers and the network optimization and maintenance engineers This signaling tracing tool is very powerful which can trace signaling according to the UE cell and IMSI in the KPI analysis According to the UE cell it can trace the signaling of multiple subscribers while according to IMSI it can trace the signaling of only one subscriber However if the RRC connection is not established yet signaling cannot be traced That is because only when RRC connection has been established can the RNC obtain the subscriberrsquos IMSI from the CN
minus RNC ASS Log ASS log is usually applied when there is abnormity and RNC signaling is out of trace In this case use ASS log to analyze the signaling before and after the abnormity occurs Abnormity can be queried according to IMSI or cell ID ASS log can be also used to collect various abnormities
minus NodeB LMT NodeB local operation and maintenance tool Apart from all the operation functions of the OMCB this tool can collect more detailed information about cells and UE NodeB local maintenance terminals include EOMS EFMS DMS and PMS
minus NodeB Abnormity Probe On the site of WCDMA commercial office NodeB abnormity probe is an effective tool to monitor the running state of the NodeB Every module of NodeB can record the abnormal information automatically which makes it easy to locate problems However this method requires professional knowledge such as knowledge about the function and interface of each module or board If the on-site engineers cannot make the simple analysis they can just obtain the abnormity probe and send it to the RampD engineers at the rear side The abnormities reported on the NodeB will be stored at the OMCB server according to different RNCs To conduct NodeB
ZTE Confidential Proprietary copy 2012 ZTE CORPORATION All rights reserved 11
UMTS KPI Optimization Analysis Guide Internal Use Only
abnormity probe analysis you need to download abnormity probe files from different OMCB servers and then use the abnormity probe tool to make a comprehensive analysis
minus CTS Tool CTS is a tool developed by the CN department which can trace signaling in depth according to IMSI and trace signaling across RNCs So this is particularly suitable to trace VIP subscribers In this case CTS is easier to use than SignalTrace which can only trace signaling of RNCs one by one CTS can trace the interactive signaling between network elements (NEs) within the CN as well as the signaling of the Iu interface and the Uu interface This kind of signaling tracing is what we called in-depth tracing The work principle of CTS is to set up an IMSI task on the CTS server and send it to the CN front side which will then send this task to each CN module via the interfaces dedicated to the CN modules and the RNC and then each module after receiving the signaling related to the IMSI task will send the signaling back to the CTS server via the CN front side The interfaces mentioned above are private interfaces so this tool can only support our own CN and RNC CTS signaling can be checked and analyzed with an offline tool but the offline tool does not work very well because of the lack of continuous optimization and perfection
minus UE log DT test is also an important auxiliary way in analyzing KPI indicators There are many problems that cannot be located by tracing signaling at the network side and can only be located by the use of UE log The commonly used drive test software includes QXDMAPEX (QCAT) CNTCAN and TEMS CNTCAN and TEMS are often used for network optimization For the use of CNTCAN please refer to the corresponding help file and the instruction document publicly released by the Network Optimization Tool Department QXDM and the analysis tool APEX (QCAT) provided by Qualcomm is very powerful which have contributed a lot for the stability and maturity of our system for many years
33 General Process of KPI Optimization Analysis
Basic analyzing ideas
KPI optimization is a process to find and solve problems KPI optimization during the operation and maintenance stage is mainly to pick out the performance data that needs special attention from the OMC classify these performance data and then compare the value of these data with that required by the operator If the value of an indicator is lower than the operatorrsquos requirement analyze this indicator and find out the factor that affect the indicator and then propose a solution to the operator If the values are higher than the operatorrsquos requirement therersquos no need to pay special attention to them
KPI analysis is a process from the whole to the part
Step 1 Check the key indicators from the view of the whole network If there is not any
ZTE Confidential Proprietary copy 2012 ZTE CORPORATION All rights reserved 12
UMTS KPI Optimization Analysis Guide Internal Use Only
problem just ignore them Otherwise try to locate the RNC NE that has the problem
Step 2 Analyze the indicators of the corresponding RNC to find out the RNC whose indicators have the problem
Step 3 Analyze the indicators of the cell under the problem RNC to find out the worst cells or TOP N cells If the indicators of all the cells under the RNC are tend to be low it is a common problem probably caused by parameter configuration And then check whether the radio parameter configuration in the cells under this RNC is the same as that in the cells under the normal RNCs
Step 4 Make a comprehensive analysis on the KPIs alarms DT test data and customer complains of the worst cells to find out a solution
Analysis method
After learning the KPI analysis ideas we must know some common KPI analysis methods to rule out causes of problems from the obvious ones to the hidden ones
For example we found that the TCP code words were strictly limited at eight sites near a park and the call drop rate rose suddenly How to solve this problem
Method one First we checked whether the alarms transmission and boards of these sites were normal After they are proved all normal we sent some engineers to the site to do test And meanwhile we traced the RNC signaling at the OMC It turned out that the test result was normal and the indicators of these sites of that day did not have any problem and code words were not limited And later we knew from the news that there was a big gathering of about one million people at the park at that moment Until then we came to know that the congestion was caused by too many users using the network at the same time
Method two First because the eight sites went worse all of a sudden it was unlikely that the problem lied in the hardware Then we checked whether the radio parameters had been modified the day before The result is no worksheet had been issued to modify those parameters and no alarm was found at those sites Therefore we excluded the possibility of hardware problem Then we checked the traffic trend graph of the last few days (over seven days) and found that the high call drop rate might be caused by high traffic The graph showed that traffic of each site rose suddenly on the day before Thus we came to the conclusion that this was an abnormal abrupt event which may have been caused by a gathering And later we were told that there was a big gathering at the park So we were assured the code words limitation and high call drop rate at the eight sites were caused by too many subscribers using the network at the same time
By comparing the two methods above we can find that although the first one (sending engineers to the site without the consideration of abnormal events) is commonly used it is inefficient and costs more resource The second method (analyzing the problem by the means of exclusion and association) is more efficient From this case we would like to emphasize that KPI analysis is a process of problem exclusion Using the comprehensive
ZTE Confidential Proprietary copy 2012 ZTE CORPORATION All rights reserved 13
UMTS KPI Optimization Analysis Guide Internal Use Only
methods (like Method One) at the first brush may be making a detour
minus Exclusion method Check the alarms on the OMC to learn about the state of the RNC NodeB BPC board and the transmission If there are obvious broken link in transmission or hardware problem the cause of the problem is easy to locate
minus Incident association If the problem is with a great number of sites take abrupt incidents into account such as large-scale gathering terrible weather of incorrect operation These incidents will put influence of different levels and ranges on the network indicators
minus Comparison of radio parameters If some site goes wrong in a sudden check whether the radio parameter configuration of this site is consistent with that of other normal sites If not change it as that of the normal sites because the indicator decrease may be caused by an incorrect modification of radio parameters
minus Relevant indicators association If a certain indicator is in poor condition check its relevant indicators and find the common problem from these relevant indicators
minus Comprehensive problem location When the above reasons are excluded use DT data KPI data RNC signaling analysis data to locate the problem with indicators comprehensively
ZTE Confidential Proprietary copy 2012 ZTE CORPORATION All rights reserved 14
UMTS KPI Optimization Analysis Guide Internal Use Only
Figure 3-7 KPI optimization analysis process
StartPick out
performance indexes
RNC index abnormal
Equipment alarms exist
Deal with equipment alarms
RNC index recovers
Common problem with the
worst cells
Transmission softwarehardware version wireless
parameter configuration
CNRNC Transmission
Hardware Software Interference
Wireless parameters
Time range
Abrupt and self-curable abnormality
helliphellip
Analyze and record causes
Suggestion about improvement
Common problems analysis
Problem resolved
Successful call
Call drop Soft handover
23G alternate operation
PS rate helliphellip
Deal with the relevant problem
Indexes normal
End
Climate change holidays assembly
transmission interruption power
fault and so on
Y
N
Y
Y
N
Y
N
Abnormal indexes analysis in one cell
Y
N
N
N
Y
N
Y
Show TOPN abnormal cells
and their locations
If the problem is proved to be equipment bug or system problem after
several attempts feed it back to RampD dept
ZTE Confidential Proprietary copy 2012 ZTE CORPORATION All rights reserved 15
UMTS KPI Optimization Analysis Guide Internal Use Only
4 KPI Optimization Analysis This chapter mainly demonstrates how to analyze the indicator problems from the aspect of OMC data and provides flowcharts for KPI optimization The detailed analyzing method and cases of every special subject can be checked in the optimization guides of all the subjects
41 CS Call Drop Optimization
The CS call drop rate is the most important indicator in KPI optimization
411 Definition of Call Drop
After checking the signaling on the Uu interface at the UE side the engineer can judge the situation a call drop if the Uu interface message satisfies one of the following three conditions during the calling process (in connection)
RNC Release is not received but the UE condition changes from CELL_DCH to IDLE
RRC Release is received and the released cause value is Not Normal
One of the following three messages mdash CC Disconnect CC Release Complete and CC Release mdash is received and the released cause value is Not Normal Clearing or Not Normal Unspecified
In a board sense the call drop includes the call drop rates of CN and UTRAN The call drop of UTRAN includes the following two aspects
After the successful service establishment RNC sends the RAB Release Request to CN
After the successful service establishment RNC sends the IU Release Request to CN Later RNC receives the IU Release Command from CN
Note that RAN call drop statistics which is defined from the aspect of lu interface signaling means the launching times of RAB Release Request and lu Release Request of RNC And the DT call drop statistics is defined from the aspects of the Uu interface message non-access stratum message and cause value RAN call drop statistics and DT call drop statistics are not exactly the same
ZTE Confidential Proprietary copy 2012 ZTE CORPORATION All rights reserved 16
UMTS KPI Optimization Analysis Guide Internal Use Only
412 CS Call Drop Analysis Flowchart
Figure 4-8 CS call drop analysis flowchart
ZTE Confidential Proprietary copy 2012 ZTE CORPORATION All rights reserved 17
UMTS KPI Optimization Analysis Guide Internal Use Only
Extract performance data
CS TOP Ncell filtering
Analyze a single cell
1 Check NE alarms
2 Associate emergencies
3 Compare parameter
configurations
4 Associate indicators
5 Locate the fault
comprehensively
Exist or not
Handle alarms
Solved or not
Yes
Yes
End
No
No
Exist or not
Handle emergencies
Solved or not
Yes
No
No
Exist or not
Correct wrong parameter
configurations
Solved or not
Yes
No
No
List related indicator counters
Call-drop-related
countersRTWP
Handover success rate
Traffic volume
Resource limit indicators
Checkamp analysis of
interference
Optimizationanalysis of
handover failures
Optimization analysis of
resource limitCall-drop-
related counters
C301230362C301230363C301230365C301230315C301230316C301230318C301230319C301230322C301230323
Solved or not
Yes
Yes
No
Drive Test+RNC signaling
trace
Yes
ZTE Confidential Proprietary copy 2012 ZTE CORPORATION All rights reserved 18
UMTS KPI Optimization Analysis Guide Internal Use Only
42 PS Call Drop Optimization
421 Optimization Flowchart
Figure 4-9 PS call drop optimization flowchart
ZTE Confidential Proprietary copy 2012 ZTE CORPORATION All rights reserved 19
UMTS KPI Optimization Analysis Guide Internal Use Only
Extract performance data
PS TOP Ncell filtering
Analyze a single cell
1 Check NE alarms
2 Associate emergencies
3 Compare parameter
configurations
4 Associate indicators
5 Locate the fault
comprehensive ly
Exist or not
Handle alarms
Solved or not
Yes
Yes
End
No
No
Exist or not
Handle emergencies
Solved or not
Yes
No
No
Exist or not
Correct wrong parameter
configurations
Solved or not
Yes
No
No
List related indicator counters
Call -drop-related
countersRTWP
Handover success rate
Traffic volume
Resource limit indicators
Check amp analysis of interference
Optimizationanalysis of
handover failures
Optimization analysis of
resource limitCall -drop-
related counters
C301230372C301230373C301230375C301230330C301230332C301230333C301230334C301230337C301230338
Solved or not
Yes
Yes
No
Drive Test +RNC signaling
trace
Yes
ZTE Confidential Proprietary copy 2012 ZTE CORPORATION All rights reserved 20
UMTS KPI Optimization Analysis Guide Internal Use Only
43 Optimization of Accessibility Indicators
Accessibility performance includes the success rate of RRC connection setup and the success rate of CSPS RAB assignment These two kinds of KPIs play important roles in the network optimization and directly influence the success rate of CSPS service establishment In this document this kind of problems are found from the aspect of OMC data and solved through parameter optimization
431 Definition of Access Failure
For the mobile originated call in the CS domain the access failure event means that the UE sends RRC REQUEST and IE establish cause is Originating Conversational Call but alerting of the direct transfer message is not received
The relevant events are defined as follows in the access failure stage
RRC connection setup failure After considering the resending times and the waiting time the UE sends RRC CONNECTION REQUEST and does not receive the response from RNC or RRC CONNECTION REJECT delivered by RNC
Initial direct transfer and security mode establishment failure After sending RRC CONNECTION SETUP COMPLETE the UE does not send NAS SETUP
RAB assignment failure After receiving CALL PROCEEDING the UE does not receive RB SETUP delivered by RNC Or the UE replies with RB SETUP FAIL after receiving RB SETUP Or the UE receives DISCONNECT with the cause value not being Normal Release after receiving RB SETUP At this time the UE has not reported RB SETUP CMP
Failure after RAB assignment After the UE sends RB SETUP COMPLETE the originating UE receives DISCONNECTRELEASE from CN Or the UE waits CONNECT or ALERTING overtime and launches the Call Clearing process Or the UE becomes IDLE before receiving Alerting and starts to receive the system message
For the mobile terminated in the CS domain the access failure event means that the terminating UE receives the paging of paging type 1 and does not send RRC CONNECTION REQUEST with the cause value being Terminating Conversational Call Or the UE does not send the alerting of direct transfer message to CN after sending RRC CONNECTION REQUEST
The relevant events are defined as follows in the access failure stage
RRC connection setup failure After sending RRC CONNECTION REQUEST the UE does not receive the response from RNC or RRC CONNECTION REJECT delivered by RNC
Initial direct transfer and security mode establishment failure After sending RRC
ZTE Confidential Proprietary copy 2012 ZTE CORPORATION All rights reserved 21
UMTS KPI Optimization Analysis Guide Internal Use Only
CONNECTION SETUP COMPLETE the UE does not receive the SETUP direct transfer message Or the UE sends RELEASE COMPLETE Or the UE receives DISCONNECT from CN
RAB assignment failure The UE does not receive RB SETUP delivered by RNC after sending CALL CONFIRM Or the UE replies with RB SETUP FAIL after receiving RB SETUP Or the UE receives DISCONNECT with the cause value not being Normal Release after receiving RB SETUP At this time the UE has not reported RB SETUP CMP
Failure after RAB assignment After the UE sends RB SETUP COMPLETE the terminating UE receives DISCONNECTRELEASE from CN
432 Analysis on RRC Connection Failures
The problem of RRC connection setup failure can be analyzed through the UE signaling flow and RNC single-user tracing The RRC connection setup includes the following steps
The UE sends RRC Connection Request through the RACH channel
RNC sends RRC Connection Setup through the FACH channel
The UE sends RRC Connection Setup Complete through the dedicated uplink channel after the downlink dedicated channel is established and synchronized
RRC connection setup failures are always caused by following issues
Uplink RACH problem
Problem about downlink FACH power allocation proportion
Parameter reselection problem of the cell
Low downlink dedicated initial transmitting power
Uplink initial power control problem
Congestion
Equipment malfunctions
Among these issues the problems of uplink RACH downlink FACH power allocation proportion parameter reselection of the cell and equipment malfunctions appear more frequently
ZTE Confidential Proprietary copy 2012 ZTE CORPORATION All rights reserved 22
UMTS KPI Optimization Analysis Guide Internal Use Only
4321 Analysis Flowchart of RRC Connection Setup Failures
Figure 4-10 Analysis flowchart of RRC connection setup failures
ZTE Confidential Proprietary copy 2012 ZTE CORPORATION All rights reserved 23
UMTS KPI Optimization Analysis Guide Internal Use Only
Extract performance data
TOP Ncell filtering
Analyze a single cell
1 Check NE alarms
2 Associate emergencies
3 Compare parameter
configurations
4 Associate indicators
5 Locate the fault
comprehensive ly
Exist or not
Handle alarms
Solved or not
Yes
Yes
End
No
No
Exist or not
Handle emergencies
Solved or not
Yes
No
No
Exist or not
Correct wrong parameter
configurations
Solved or not
Yes
No
No
List related indicator counters
Counters related to RRC setup
failuresRTWP
Resource limit
indicators
Checkamp analysis of interference
Optimization analysis of
resource limitCounters related
to RRC setup failures
C301480485C301480486C301480487C301480489C301480490C301480491C301481288C301481289C301481337C301481338C301481339C301481407C301481408
Solved or not
Yes
Yes
No
Drive Test+RNC signaling
trace
Yes
ZTE Confidential Proprietary copy 2012 ZTE CORPORATION All rights reserved 24
UMTS KPI Optimization Analysis Guide Internal Use Only
4322 UE sends RRC Connection Request but RNC does not receive it
If the EcIo of downlink CPICH is relatively low it is the problem of coverage
If the EcIo of downlink CPICH is not very low (for example the value is larger than -14 dB) Usually it is the problem of RACH and the following issues may cause the problem
minus The power of Preamble does not rise to a required value and the rising times of Preamble should be increased
minus The output power of UE is lower than the required value which is caused by poor UE performance In this case the UE should be changed
minus The NodeB equipment has a standing wave and the engineer should check whether NodeB has any SWR alarm
minus The radius of the cell is set improperly If the radius parameter of the cell is set too small the NodeB can not synchronize the UE beyond the range of the radius and the access fails This problem often happens in the places with large coverage such as the rural areas and the suburbs
4323 RNC delivers RRC Connection Reject after receiving RRC Setup Request
When RRC Connection Reject appears the engineer should check the specific reject cause value Usually there are two kinds of causes
The CPU load of RNC control plane board is too heavy and more boards should be added
DCH and FACH admission is rejected However this situation does not always happen
4324 UE does not receive RRC Connection Setup delivered by RNC
This problem may be caused by the following reasons
Poor coverage
Improper parameters of cell selection and reselection
Checking method The engineer should check the EcIo of CPICH If the value is lower than -12 dB (EcIo is -12 dB by default) and there is no cell of better quality in the monitor set the cause of this problem is poor coverage If there is better cell in the monitor set cell reselection may cause this problem
Poor coverage can be improved by coverage enhancement such as adding some sites to cover the places without signal coverage and adjusting the engineering parameters If the coverage can not be improved the engineer can enhance the FACH power according to
ZTE Confidential Proprietary copy 2012 ZTE CORPORATION All rights reserved 25
UMTS KPI Optimization Analysis Guide Internal Use Only
the PCPICH EcIo coverage of the current network For example if all the pilot EcIo values are larger than -12 dB in the coverage area the power proportion of the common channel should be configured on the basis of the situation that the EcIo value is larger than -12 dB And so the success rate of the idle UE assessment can be ensured
As for the access problem caused by cell selection and reselection the engineer can speed up the cell selection and reselection by adjusting the cell selection and reselection parameters and the problem of RRC connection setup failure caused by improper cell selection and reselection parameters can be solved
Note
The RRC Connection Setup message is borne by FACH RRC Connection Request sent by the UE is received by UTRAN at the preamble of PRACH and then it is sent from the RACH channel based on the current preamble power And the transmit power of preamble can rise all the time until the response is received (There is a limitation for the maximum number of preamble retransmissions) Therefore in the areas with poor coverage the RACH coverage and FACH coverage may become unbalanced and as a result UTRAN can receive RRC Connection Request sent by the UE but the UE can not receive RRC Connection Setup sent by RNC
4325 UE receives RRC Connection Setup and does not send RRC Setup Complete
If the downlink signal quality is normal this problem may be caused by the abnormal condition of the cell phone
Another reason of this problem may be the downlink synchronization failure caused by the low initial power of downlink dedicated channel You can solve this problem by adjusting the service downlink EbNo
4326 RNC does not receive RRC Setup Complete sent by UE
Because the uplink initial power control may increase the UE transmit power this kind of problem seldom appears If it appears the engineer can increase the Constant Value of the dedicated channel properly to raise the uplink DPCCH initial transmission power of the UE
At the same time this problem is also relevant with the uplink SIR initial target value configuration because this value may affect the uplink initial synchronization at the initial stage of link setup If the value of the parameter is set too large there will be too much uplink inference brought by the initial setup of the link If the value is set too small the uplink synchronization will take longer time and the initial synchronization may even fail This parameter is an RNC-level parameter which has a great influence on network performance Therefore the engineer should be cautious while adjusting this parameter
ZTE Confidential Proprietary copy 2012 ZTE CORPORATION All rights reserved 26
UMTS KPI Optimization Analysis Guide Internal Use Only
Note
RRC Connection Setup Complete is sent through uplink DPCH and the UE calculates the initial power of uplink DPCCH according to the received IErdquoDPCCH_Power_offsetrdquo and the measured CPICH_RSCP value
DPCCH_Initial_power = DPCCH_Power_offset - CPICH_RSCP
DPCCH_Power_offset = Primary CPICH DL TX Power + UL Interference + Constant Value The Constant Value can be configured in the OMC If this value is set too small the UE may not have enough power to send RRC Connection Setup Complete
433 Analysis on RABRB Setup Failures
When RAB or RB setup fails RNC will send RAB Assignment Fail in the RAB Assignment Response signaling The engineer can find out the specific failure reason from the failure cause value carried in relevant cells The reasons for common RABRB setup failures include
RNC directly rejecting RAB Setup Request because of wrong parameter configuration
Admission reject
RAB setup failure because the UE fails to respond to RB Setup Request
RAB setup failure because the Uu interface fails to set up RB
ZTE Confidential Proprietary copy 2012 ZTE CORPORATION All rights reserved 27
UMTS KPI Optimization Analysis Guide Internal Use Only
4331 Analysis Flowchart of RAB Setup Failures
Figure 4-11 Analysis flowchart of RAB setup failures
ZTE Confidential Proprietary copy 2012 ZTE CORPORATION All rights reserved 28
UMTS KPI Optimization Analysis Guide Internal Use Only
Extract performance data
TOP Ncell filtering
Analyze a single cell
1 Check NE alarms
2 Associate emergencies
3 Compare parameter
configurations
4 Associate indicators
5 Locate the fault
comprehensively
Exist or not
Handle alarms
Solved or not
Yes
Yes
End
No
No
Exist or not
Handle emergencies
Solved or not
Yes
No
No
Exist or not
Correct wrong parameter
configurations
Solved or not
Yes
No
No
List related indicator counters
Counters related to RAB setup failures RTWP
Resource limit
indicators
Checkamp analysis of interference
Optimization analysis of
resource limitCounters related to RAB setup failures
CS domain PS domainC301230290 C301230302C301230291 C301230303C301230292 C301230304C301230293 C301230305C301230294 C301230306C301230295 C301230307C301230296 C301230308C301230297 C301230309C301230298 C301230310C301230299 C301230311C301230300 C301230312C301230301 C301230313
Solved or not
Yes
Yes
No
Drive Test+RNC signaling
trace
Yes
ZTE Confidential Proprietary copy 2012 ZTE CORPORATION All rights reserved 29
UMTS KPI Optimization Analysis Guide Internal Use Only
4332 RNC Directly Rejecting RAB Setup Request Because Of Wrong Parameter Configuration
The case that RNC responds with RAB Setup Failure directly is seldom caused by invalid parameter configuration in the business network Usually this case is caused by special operations of the special users
The main scenario is that the subscription information of the userrsquos PS service is beyond the capability of the UE which leads to the direct refusal from RNC For example a special userrsquos subscription rates of uplink and downlink are 384 K but the maximum uplink rate of the UE is only 64 K The maximum uplink and downlink rates of the QoS message used for activating PDP set by the AT command or mobile terminal software used by the user are 384 K so the RNC will find the maximum uplink rate is beyond the UErsquos capability directly reply with RAB Setup Failure and will not launch the RB setup process when it receives RAB Assignment Request
After the RAB setup fails because the parameter configuration is beyond the UErsquos capability SGSN will negotiate again to launch the new RAB assignment until the UE has the capability to support the assignment and the RAB assignment is finished For the users the PDP activation is still successful and the actual maximum rate is the maximum rate the UE can support
However if the minimum guaranteed bit rate required by the QoS setting in the UErsquos PDP activation request is beyond the UErsquos capability though the network negotiates a lower rate to accept the UErsquos PDP activation request the UE will launch the request of deactivating PDP when it finds that the rate negotiated by the network in PDP activation accept request is lower than the minimum guaranteed bit rate and finally the PDP activation can not be completed
4333 Admission Reject
For the non-HSDPA user if there are insufficient system resources (including power channel code lub transmission resource and CE) the call establishment failure will be caused by the admission reject At this time it is necessary to check the network load code resource lub transmission resource and CE resource occupation to make sure the congestion is caused by the limitation of a certain kind of resource What is more the engineer should plan the corresponding expansion method
If the cell does not support the HSDPA service the R99 user admission is judged according to the fixed R99 admission threshold If the cell supports the HSDPA service and the HSDPA and R99 dynamic power is allocated the uplink admission of non-HSDPA is judged based on RTWP or the equivalent user number If the uplink load is too heavy the non-HSDPA user admission will also fail
If the bandwidth configuration on the lub interface is insufficient the lub interface will reject the R99 data service activation because of limited bandwidth
ZTE Confidential Proprietary copy 2012 ZTE CORPORATION All rights reserved 30
UMTS KPI Optimization Analysis Guide Internal Use Only
The admission control of the NodeB Credit resource is similar to the power admission control Whether the remaining Credit can support the currently requested service or not can be judged according to the spectrum spreading factor of the new access user According to the condition of the RAB Downsizing Switch RNC will deal with the issue in the corresponding way
For the HSDPA user in the dynamic power allocation mode besides the mentioned system resources such as the power channel code lub transmission resource and CE the admission reject should take into consideration whether the number of H users supported by NodeB and the number of H users supported by the cell are over the regulated threshold or not into consideration
For the HSDPA user when the bandwidth configuration on lub interface is insufficient the admission reject will not happen but the rate will be reduced What is more the AAL2PATHs of HSDPA and R99 are configured respectively and the HSDPA AAL2PATH must be configured to the HSDPA_RT or HSDPA_NRT type If the HSDPA AAL2PATH is configured to RT or NRT of R99 AAL2PATH type the RAB assignment failure will not happen but RNC will establish the HSDPA service as R99 384 Kbps
For the downlink power admission
Besides whether the R99 service load is over the non-HSDPA service threshold DCH service should take into consideration whether non-HSDPA power and HSDPA GBP (the minimum power needed for the guaranteed bit rate) are over the general power threshold of the cell
For the HSDPA service it is necessary to check whether the throughput rate provided by the cell is over the sum of all the usersrsquo GBR thresholds or whether the GBPs of the stream service and the background service are over the HSDPA power of the cell At the same time whether the non-HSDPA power and the HSDPA GBP (the minimum power needed for the guaranteed bit rate) are over the overall power threshold of the cell should be also taken into consideration
For the lub admission
For the DCH service the admission is made according to the multiplication of the peak rate and the service activation factor
For HSDPA service the admission is made according to the GBR
If the lub exceeds the congestion threshold the DCCC rate reduction will be triggered And if the RLC_AM retransmission rate is over a certain threshold the Iub Overbooking switch can be opened to trigger the TF which limits R99 or to reduce the rate of HSDPA service by a certain factor
ZTE Confidential Proprietary copy 2012 ZTE CORPORATION All rights reserved 31
UMTS KPI Optimization Analysis Guide Internal Use Only
4334 RAB Setup Failure Because the UE Fails to Respond to RB Setup
The UE fails to respond to RB setup mainly because of the userrsquos operation
Take the following cases as examples
When the user already has had the downlink 12 K data service he receives RB Setup Request of the VP service (either the originated call in the VP domain or the terminated call in the VP domain) Because the UE does not support the VP and high-speed PS service in the downlink at the same time it directly replies with RB Setup Failure and the cause value is unsupported configuration
Compared with the WCDMA subscriber originating the VP service the terminating subscriber resides in the GSM network and so it does not support the VP service After RNC receives RAB Assignment Request the core network will deliver the Disconnect command right after call proceeding and the cause value is Bearer capability not authorized At this time the UE has just received the RB SETUP command and has no enough time to finish the RB setup So the UE will reply with RB Setup Failure after it receives the Disconnect command and the RNC will reply with RAB Setup Failure with the cause value being failure in radio interface procedure
4335 RAB Setup Failure Because the Uu Interface Fails to Set Up RB
RNC sends the Radio Bearer Setup command to the UE but fails to receive Radio Bearer Setup Compete This kind of situation (RB setup failure) often appears in the cells with weak signals There are two causes of weak signals one is that the UE does not reside in the best server to launch the access and the other is poor coverage
If the UE does not reside in the best server to launch the access it will hope to enter the best server through active set update in the RB setup process (At the same time the fast signal change will drastically weaken the signals in the cell) but the active set update can only be processed after the RB setup is completed because the procedures can not be processed alternately (Neither the network nor the terminal supports it) Therefore RB can only be set up in the cell with weak signals and the setup is easy to fail As for this situation the starting threshold and speed of co-frequency cell reselection should be increased to make the UE reside in the best server and launch the access as soon as possible
RB setup failure may be caused by the poor downlinkuplink coverage If the failure is caused by downlink coverage the UE can not receive the Radio Bearer Setup command which may be caused by the uplink interference and this can be fixed through checking RTWP The poor downlink coverage is partly caused by the bad UE demodulation performance and other causes should be solved by RF optimization
ZTE Confidential Proprietary copy 2012 ZTE CORPORATION All rights reserved 32
UMTS KPI Optimization Analysis Guide Internal Use Only
44 Optimization of Mobility Indicators
Mobility indicators mainly fall into three categories mdash soft handovers hard handovers and inter-RAT handovers The handover problems usually happen in the following cases
The best server changes too fast or there is no best server due to pilot pollution
The handover is not prompt or there are pingpong handovers due to improper parameter configuration
Adjust the engineering parameters for antennas in areas with severe pilot pollution And adjust the handover parameters such as the values of 1A 1B CIO TTT (time to trigger) Hysteresis and so on to solve the problem that the handover is not prompt or there are pingpong handovers This section tries to solve this kind of problems through OMC data analysis and parameter optimization
441 Optimization of Soft Handovers
Missed neighboring cell configuration pilot pollution improper soft handover parameter configuration and equipment malfunctions are the major causes of soft handover failures To confirm the problems the field DTs are required
ZTE Confidential Proprietary copy 2012 ZTE CORPORATION All rights reserved 33
UMTS KPI Optimization Analysis Guide Internal Use Only
4411 Soft Handover Optimization Flowchart
Figure 4-12 Soft handover optimization flowchart
ZTE Confidential Proprietary copy 2012 ZTE CORPORATION All rights reserved 34
UMTS KPI Optimization Analysis Guide Internal Use Only
Extract performance data
TOP Ncell filtering
Analyze a single cell
1 Check NE alarms
2 Associate emergencies
3 Compare parameter
configurations
4 Associate indicators
5 Locate the fault
comprehensive ly
Exist or not
Handle alarms
Solved or not
Yes
Yes
End
No
No
Exist or not
Handle emergencies
Solved or not
Yes
No
No
Exist or not
Correct wrong parameter
configurations
Solved or not
Yes
No
No
List related indicator counters
RTWPResource
limit indicators
Checkamp analysis of interference
Optimization analysis of
resource limitCounters related to intra-frequency
handover failures
C301391101 C301390593C301391102 C301390594C301391103 C301390595C301390586 C301390596C301390587 C301390597C301390588 C301390598C301390589 C301390599C301390590 C301390600C301390591 C301390601C301390592 C301390602
Solved or not
Yes
Yes
No
Drive Test+RNC signaling
trace
Yes
Counters related to soft handover
failures
30055 3005630057 3005830059 3006030061 30062
Cell hand-inhand-out indicators
ZTE Confidential Proprietary copy 2012 ZTE CORPORATION All rights reserved 35
UMTS KPI Optimization Analysis Guide Internal Use Only
4412 Checking Missed Neighboring Cell Configuration
Generally speaking most of the call drops at the beginning of the optimization are caused by missed neighboring cell configuration The following methods are often used to judge whether the call drops are caused by missed configuration of co-frequency neighboring cells
Observe the active set EcIo information recorded by the UE and the Best Server EcIo information recorded by the Scanner before the call drop If the former record is very bad but the latter record is very good then check whether the Best Server scrambling code recorded by the Scanner appears in the latest list of the neighboring cells under intra-frequency measurement control If it does not then the call drop is caused by missed neighboring cell configuration
If the UE re-accesses immediately after the call drop and the cell scrambling codes during the UE reaccess and those during the call drop are different then the call drop may also be caused by missed neighboring cell configuration You can confirm it through measurement control (look backwards from the message of the call drop event for the latest intra-frequency measurement control message and check the neighboring cell list of this message)
Some UE may report the Detected Set information If the corresponding scrambling code appears in the Detected Set information before the call drop then the call drop is caused by missed neighboring cell configuration
4413 Checking Pilot Pollution
Definition of pilot pollution Excessive strong pilot signals exist at a certain point but none of them is strong enough to be the best server To form pilot pollution the following points in this definition should be satisfied
Strong pilot signal The absolute pilot signal strength is used to judge whether the pilot signal is a strong one The pilot signal strength can be evaluated through the pilot RSCP If the pilot RSCP exceeds a threshold it is considered a strong pilot signal The formula is
AbsoluteRSCPThRSCPCPICH __ gt
Excessive The number of pilot signals is used to judge whether there are excessive pilot signals at a certain point If the number exceeds a threshold it is regarded that excessive pilot signals exist at this point The formula is
NThNumberCPICH gt_
None of them is strong enough to be the best server The relative strength of a pilot signal is a key factor in judging whether the pilot signal is strong enough Based on the above definition and formulae if the difference between the strength of the
ZTE Confidential Proprietary copy 2012 ZTE CORPORATION All rights reserved 36
UMTS KPI Optimization Analysis Guide Internal Use Only
strongest pilot signal and that of the )1( +NTh strongest pilot signal at this point is
less than a threshold it is regarded that there is no pilot signal strong enough to be the best server at this point The formula is
lativeRSCPthThbest ThRSCPCPICHRSCPCPICHN Re_)1( )__( ltminus +
According to the above description it is regarded that pilot pollution exists if the following conditions are both satisfied
The number of pilot signals that meet the condition
AbsoluteRSCPThRSCPCPICH __ gt is more than NTh
lativeRSCPthThbest ThRSCPCPICHRSCPCPICHN Re_)1( )__( ltminus +
For example during the network optimization suppose
dBmTh AbsoluteRSCP 95_ minus= 3=NTh and dBTh lativeRSCP 5Re_ = if the following
conditions are both satisfied then it is regarded that pilot pollution exists
The number of the pilot signals that meet the condition
dBmRSCPCPICH 95_ minusgt is more than 3
dBRSCPCPICHRSCPCPICH thbest 5)__( 4 ltminus
4414 Adjusting Soft Handover Algorithm Parameters
You can solve the following kinds of problems by adjusting handover algorithm parameters
1 The handover is not prompt
From the perspective of the CS service signaling flow the symptom of this problem is that the UE cannot receive Active Set Update (physical channel reallocation in the case of the intra-frequency hard handover) because after the UE reports the measurement report the source cell has a fast reduction in EcIo When the RNC sends Active Set Update the UE has closed the transmitter due to the loss of downlink synchronization Viewed from the UE side it cannot receive Active Set Update In the PS services if the UE cannot receive Active Set Update or TRB resets before the handover the handover will also fail
From the perspective of signals the following phenomena may accompany this problem
ZTE Confidential Proprietary copy 2012 ZTE CORPORATION All rights reserved 37
UMTS KPI Optimization Analysis Guide Internal Use Only
minus Corner effect EcIo of the source cell decreases drastically and EcIo of the target cell increases sharply (very high when it appears)
minus Fast fading EcIo of the source cell decreases quickly for a while and then increases and EcIo of the target cell increases for a short while
2 Pingpong handovers The following phenomena may accompany this problem
The best server changes quickly Two or more cells take turns to be the best server But as the best server none of the cells can last long though they has good RSCPs and EcIos
There is no best server There are multiple cells Their RSCPs are normal and similar to each other But EcIo of every cell is very bad
From the perspective of the signaling flow Event 1A is reported immediately after one cell is deleted Because the UE cannot receive Active Set Update from the RNC the handover fails
4415 Equipment Malfunctions
First check the alarm console to see whether there are abnormal alarms and analyze the message traces at the same time Find out in which step the soft handover fails Check the failure message and contact the local product maintaining engineer to confirm whether the equipment has malfunctions
4416 Solutions
Corresponding adjustments should be taken for the confirmed problems
Handover failures caused by pilot pollution Adjust the engineering parameters of a certain antenna to set this antenna as the best server in this interfered location If the power of one of its sectors is reduced then Io of the pilot pollution area will decrease even if the powers of other pilots are not adjusted EcIo will also increase Thereby the EcIo differences with other scrambling codes in the active set will become larger and pilot pollution will be eliminated Through a lot of research ZTE has proved that the reduction in the pilot transmit power will not change cell capacity greatly If condition allows new base stations can be added to cover this area
Equipment malfunctions Consult the customer service engineers and ask them to help check whether there are alarms and whether the transport layer is abnormal If there are alarms coordinate with the customer service engineers and the engineering personnel to solve the problems
Call drops because the handovers are not prompt
ZTE Confidential Proprietary copy 2012 ZTE CORPORATION All rights reserved 38
UMTS KPI Optimization Analysis Guide Internal Use Only
minus Adjust the antenna to expand the handover zone
minus Configure the Event 1A handover parameters to make the handover easier to happen
minus Increase CIO to make the handover happen earlier in the target cell The sum of CIO and the actually measured value is used for judging the UE events including the UE intra-frequency handover CIO helps shift the cell border in the handover algorithm If CIO is configured with a larger value the handover will be easier to happen and there will be more UE in the soft-handover status but more resources will be occupied If CIO is configured with a smaller value the soft handover will be more difficult to happen and the receiving quality may be impaired A CIO of about 5dB is quite good for eliminating the fast fading and the corner effect but this configuration has some side effects such as the increase of handover proportion
Call drops caused by pingpong handovers Adjust the antenna to form a best server in its coverage zone or set the Event 1B handover parameters (increase the threshold of Event 1B the Event 1B hysteresis or the time to trigger Event 1B) to increase the difficulty in deleting the active set
442 Optimization of Hard Handovers
4421 Classification of Hard handovers
Hard handovers mainly fall into two classifications
Intra-frequency hard handovers The intra-frequency hard handover is triggered only when the intra-frequency softsofter handover cannot be performed and it is applicable to the following circumstances
minus Inter-RNC intra-frequency cell handovers when there is no Iur interface
minus Insufficient Iur interface resources though there is the Iur interface
minus Handovers controlled by the threshold of the PS service rate in the handover cell
The intra-frequency softsofter handovers can not be performed (intra-frequency hard handover should be triggered) in the following scenarios
minus When the intra-frequency handover happens the UE is using the transmit diversity in the active set cell but the target cell does not support the transmit diversity
minus The intra-frequency measurement report does not contain OFF and TM of the
ZTE Confidential Proprietary copy 2012 ZTE CORPORATION All rights reserved 39
UMTS KPI Optimization Analysis Guide Internal Use Only
target cell
minus When the intra-frequency handover happens between RNCs the Iur interface is unavailable
minus The UE performs the multiuser detection in the active set cell but the target cell does not support the multiuser detection
minus The target cell and the original cell belong to different classifications (The cells of R99 R5+R99 and R6+R5+R99 belong to the same classification while the cells of R5 and R6+R5 belong to another classification)
Inter-frequency hard handovers The inter-frequency hard handover means a UE connection is handed over from a cell of a UTRAN frequency to a cell of another frequency Many factors including the radio quality the load and the speed of the moving UE may trigger inter-frequency hard handovers
For example the radio quality triggers the inter-frequency hard handover in the following way
When the quality of the UE radio frequency becomes lower the inter-frequency measurement will be triggered and according to the measurement result the UE connection will be handed over to a better frequency
ZTE Confidential Proprietary copy 2012 ZTE CORPORATION All rights reserved 40
UMTS KPI Optimization Analysis Guide Internal Use Only
4422 Hard Handover Optimization Flowchart
Figure 4-13 Hard handover optimization flowchart
ZTE Confidential Proprietary copy 2012 ZTE CORPORATION All rights reserved 41
UMTS KPI Optimization Analysis Guide Internal Use Only
Extract performance data
TOP Ncell filtering
Analyze a single cell
1 Check NE alarms
2 Associate emergencies
3 Compare parameter
configurations
4 Associate indicators
5 Locate the fault
comprehensive ly
Exist or not
Handle alarms
Solved or not
Yes
Yes
End
No
Exist or not
Handle emergencies
Solved or not
YesNo
Exist or not
Correct wrong parameter
configurations
Solved or not
Yes
No
No
List related indicator counters
RTWPResource
limit indicators
Checkamp analysis of interference
Optimization analysis of
resource limit
Counters related to inter-frequency handover failures
C301110489 C301110516C301110499 C301110517C301110500 C301110518C301110501 C301110519C301110502 C301110520C301110503 C301110521C301110504 C301110522C301110505 C301110523
Solved or not
Yes
Yes
No
Drive Test+RNC signaling
trace
Yes
Counters related to hard handover
failures
30041 3004230043 3004430045 3004630047 30048
Cell hand-inhand-out indicators
NoNo
ZTE Confidential Proprietary copy 2012 ZTE CORPORATION All rights reserved 42
UMTS KPI Optimization Analysis Guide Internal Use Only
4423 Hard Handover Optimization Methods
The optimization flow for the hard handover is similar to that of the soft handover The major differences are in the parameter optimization To optimize intra-frequency hard handovers you can properly reduce the Event 1D hysteresis and the time to trigger Event 1D according to the real radio environment to ensure timely handovers
Inter-frequency coverage is often applied to some special scenarios such as indoor coverage and tested through CQT The method of judging whether there is missed configuration of the inter-frequency neighboring cell is almost the same as that of the co-frequency neighboring cell when a call drop occurs the UE fails to measure or report the inter-frequency neighboring cell after the call drop the UE resides in the inter-frequency neighboring cell again
The common hard handover problems are
1 The handover is not prompt The common symptoms are frequent call drops in the hard handovers when the UE moves
Solutions
Increase the threshold of activating the compressing mode The compressing mode is usually activated before the inter-frequency handover or the inter-RAT handover and it is used to measure the quality of the inter-frequency or inter-RAT cell You can set a threshold of the CPICH RSCP or EcIo to activate the compressing mode And the RSCP is widely used
minus Requirements on setting the threshold of activating the compressing mode Before the cell quality becomes low enough to cause a call drop the signal of the target cell should be measured and reported and the handover should be performed
minus Requirement on setting the threshold of deactivating the compression mode Frequent activationdeactivation of the compression mode should be avoided
Increase CIOs of the inter-frequency cell pair
Reduce the threshold of triggering the target frequency handover under the inter-frequency coverage
2 There are pingpong handovers
Solution Increase the hard handover hysteresis and the time to trigger the event
ZTE Confidential Proprietary copy 2012 ZTE CORPORATION All rights reserved 43
UMTS KPI Optimization Analysis Guide Internal Use Only
443 Optimization of Inter-RAT Handovers
4431 Configuring Basic Inter-RAT Parameters
Most of the inter-RAT handover failures are caused by incomplete parameter configuration The following parameters need special attention
Complete RNC parameter configuration for the GSM neighboring cell The 2G system shall provide the 3G system with the correct radio parameters based on negotiation mdash MCC MNC LAC ID (CI) NCC BCC frequency band indicator (900 or 1800) and BCCH
Table 4-3 Parameters That 2G Shall Provide to 3G
MCC MNC LACIDCI
NCC BCCFrequency
band indicator
BCCH
460 2 202 193 0 0 900 102
Complete GSM BSC parameter configuration for the WCDMA neighboring cell The 3G system shall provide the 2G system with the correct radio parameters based on negotiation mdash MCC MNC LAC RNC ID cell ID (C_ID) downlink frequency scrambling code and RAC
Table 4-4 Parameters That 3G Shall Provide to 2G
MCC MNC LACRNC
IDCell IDC_ID
Downlink frequency
Scrambling code
RAC
460 3 20 18 51 10787 51 20
According to the current strategy of one-way inter-RAT handovers if the parameter configuration is complete one probable cause of the inter-RAT handover failure is that the handover is not prompt The common parameter adjustment is to increase CIO the threshold to activatedeactivate the compressing mode and the threshold to trigger the WCDMA-to-GSM handover at the same time
Call drops during the inter-RAT handovers between WCDMA and GSM may be caused by
minus Inconsistent data configuration at the GSM side and the WCDMA side after GSM modifies the configuration data but does not inform WCDMA
minus Missed configuration of neighboring cells which can be solved by the correct configuration of neighboring cells
minus Too fast signal changes
ZTE Confidential Proprietary copy 2012 ZTE CORPORATION All rights reserved 44
UMTS KPI Optimization Analysis Guide Internal Use Only
minus Pingpong reselection
minus Faults with the UE for example the UE fails to respond to the handover or report the inter-RAT measurement report
minus Changes of the best server during the physical channel reallocation
minus Wrong LAC configuration which can be located through data configuration check
ZTE Confidential Proprietary copy 2012 ZTE CORPORATION All rights reserved 45
UMTS KPI Optimization Analysis Guide Internal Use Only
4432 Inter-RAT Handover Optimization Flowchart
Figure 4-14 Inter-RAT handover optimization flowchart
ZTE Confidential Proprietary copy 2012 ZTE CORPORATION All rights reserved 46
UMTS KPI Optimization Analysis Guide Internal Use Only
Extract performance data
TOP Ncell filtering
Analyze a single cell
1 Check NE alarms
2 Associate emergencies
3 Compare parameter
configurations
4 Associate indicators
5 Locate the fault
comprehensive ly
Exist or not
Handle alarms
Solved or not
Yes
Yes
End
No
No
Exist or not
Handle emergencies
Solved or not
Yes
No
No
Exist or not
Correct wrong parameter
configurations
Solved or not
Yes
No
No
List related indicator counters
RTWPResource
limit indicators
Checkamp analysis of interference
Optimization analysis of
resource limitCounters related to inter-RAT handover failures
C301130667 C301130681C301130668 C301130682C301130669 C301130690C301130670 C301130691C301130671 C301130692C301130672 C301130693C301130673 C301130694C301130674 C301130696C301130675 C301130697C301130677 C301130698C301130678 C301130699C301130679 C301130700
C301130680
Solved or not
Yes
Yes
No
Drive Test+RNC signaling
trace
Yes
Counters related to inter-RAT handover
failures
Cell hand-inhand-out indicators
30049 3005030051 3005230053 30054
ZTE Confidential Proprietary copy 2012 ZTE CORPORATION All rights reserved 47
UMTS KPI Optimization Analysis Guide Internal Use Only
45 Optimization of Resource Indicators
The resource indicators directly reflect the system capacity Increasing subscribers will consume more system resources and some resources may be limited for example the code resource may be limited the TCP access request may be rejected and the CE resource usage rate may exceed the threshold Limited system resources have a negative influence on the whole-network indicators and the subscribersrsquo perception for example call drops may frequently happen and more TCP access requests may be rejected during the voice services
Table 4-5 Resource KPIs and Alarm Thresholds
Resource type KPI No and nameAlarm
threshold
TCP
C301320150 Number of rejected services DCH downlink TCP limit
50
PI30167 Average non-HS (SOA) (SOA)DPA TCP 40
PI30092 Maximum Cell TCP () 100
PI30093 Average Cell TCP 70
UL TrafficPI30029 Handover Blocking Rate 05
KPI RTWP (in busy hour) -98 dBm
Code
C301320153 Number of rejected services DCH no code
50
PI30205 Average Cell HSUPA Users 12
PI30172 Cell Average HSDPA Users 16
CE
PI301830006 Maximum use Ratio of Uplink NodeB CE
60
PI301830010 Maximum use Ratio of Downlink NodeB CE
60
ZTE Confidential Proprietary copy 2012 ZTE CORPORATION All rights reserved 48
UMTS KPI Optimization Analysis Guide Internal Use Only
451 Resource Indicator Optimization Flowchart
Figure 4-15 Resource indicator optimization flowchart
ZTE Confidential Proprietary copy 2012 ZTE CORPORATION All rights reserved 49
UMTS KPI Optimization Analysis Guide Internal Use Only
Extract performance data
TOP Ncell filtering
Analyze a single cell
1 Check NE alarms
2 Associate emergencies
3 Compare parameter
configurations
4 Associate indicators
5 Locate the fault
comprehensive ly
Exist or not
Handle alarms
Solved or not
Yes
是
End
No
No
Exist or not
Handle emergencies
Solved or not
Yes
No
No
Exist or not
Correct wrong parameter
configurations
Solved or not
Yes
No
No
List related indicator counters
Code resource indicators
CE resource indicators
TCPadmission
reject counter
C301320150
Solved or not
Yes
Yes
No
Drive Test+RNC signaling
trace
Yes
Counter related to TCP limit
Cell TX power
indicators
30090 3009130092 3009330166 3016730168 3016930170 30171
30163301643016530075
30223302243045030451
Yes
Yes
ZTE Confidential Proprietary copy 2012 ZTE CORPORATION All rights reserved 50
UMTS KPI Optimization Analysis Guide Internal Use Only
452 Code Resource Optimization
The statistics of Number of rejected services and DCH no code the average code resource usage rate and the number of the HSDPA subscribers can be used to judge whether the code resource in a cell is limited If the code resource is limited you can adjust the code resource allocation to alleviate the situation
Based on the system algorithm when Formula 1 is satisfied you can add an HS-PDSCH when Formula 2 is satisfied then an HS-PDSCH is deleted
Formula 1 OcuRateNoHspdsch + OcuRateHspdsch + DpchCodeHy + 32 lt= 512
Formula 2 OcuRateNoHspdsch + OcuRateHspdsch + CodeUptHyA gt 512
OcuRateHspdschHSPDSCH means the number of the codes of SF=512 blocked by the HS-PDSCH OcuRateNoHspdsch means the number of codes of SF=512 blocked by other channels DpchCodeHy means the number of codes of SF=512 reserved for the DPCH and CodeUptHyA is the threshold to decide whether to delete the HSPDSCH
Therefore to ensure the access of the R99 subscribers you can make some adjustment according to Table 4-6 when the code resource is limited though the HSDPA rate may decrease
Table 4-6 Adjusting Code Resource Allocation
AbbreviationParameter
nameRange
and stepCurrent value
Update value
Remark
DpchCodeHy DPCH Code Hysteresis
0512 16 28
To decrease the number of rejected services for DCH no code
CodeUptHyACode Update Hysteresis A
0512 16 28
To decrease the number of rejected services for DCH no code
453 Monitoring CE Resource
The CE resource is mainly monitored through the maximum UE uplinkdownlink usage rate If there is any problem you can solve it by controlling the load or adding more boards
ZTE Confidential Proprietary copy 2012 ZTE CORPORATION All rights reserved 51
UMTS KPI Optimization Analysis Guide Internal Use Only
454 Optimization of Power Control
4541 Monitoring and Optimizing Downlink Power Control
Limited TCP in busy hours will not only increase access failures and call drops in the local cell but also increase soft handover failures and call drops in the neighboring cells Number of rejected services and DCH downlink TCP limit are intuitive KPIs to judge whether TCP is limited Although limited uplink capacity and massive UE moves in the rush hours may also cause call drops the limited TCP is absolutely a key factor
Based on the system algorithm MinHsdpaPower (MinHspaPwrRto) + NoHsPower gtNode B if the safety threshold is used (MinHsdpaPower means the power reserved for HSPA) then it will activate the downlink rate downgrade algorithm flow for the congestion (lower the downlink DCH rate) Although the rate downgrade can ensure access of some subscribers it is an irregular action and will degrade the performance
455 Speeding up Rate Downgrade
Considering that the cells with heavy load reject more access requests you can speed up the rate downgrade during the resource congestion to release the resources as soon as possible and avoid call drops caused by access failures (this method is only applicable to the cells with many PS service users but not those with only CS service users) Table 4-7 is an example of the parameter modification for the rate downgrade
Table 4-7 Example of Parameter Modification for Rate Downgrade
Abbreviation Parameter nameRange and
stepCurrent value
Update value
Remark
UlDnMaxStg Maximum Number of Degraded Uplink Load Steps Every Time
[1 8] 1 2 Downgrade from 384 Kbps to 16 Kbps
DlDnMaxStg Maximum Number of Degraded Downlink Load Steps Every Time
[1 8] 1 3 Downgrade from 384 Kbps to 8 Kbps
456 Monitoring and Optimizing Uplink Capacity
Handover Blocking Rate and RTWP can reflect the uplink capacity of the cell Because interference may also increase RTWP this factor should be distinguished during the RTWP monitoring Another effective indicator is the voice service erl If a cell has over 20 erls in busy hours you should pay special attention to it
ZTE Confidential Proprietary copy 2012 ZTE CORPORATION All rights reserved 52
UMTS KPI Optimization Analysis Guide Internal Use Only
457 Optimization of Uplink Capacity at the Whole Network Level
Case The uplink capacity was limited in a large number of sites after the cutover and the symptoms are a sharp rise of RTWP and a high call drop rate during the rush hours
After the following parameters were modified as shown in Table 4-8 the problem was solved
Table 4-8 Example of Power Control Parameter Modification
AbbreviationParameter
nameRange
Current value
Update value
ULINITSIRUplink Initial SIR target (dB)
UL 34 K136 K signaling UL 122 K AMR
4-5 35
ULMAXSIRMaximum Uplink SIR target (dB)
UL 34 K136 K signaling UL 122 K AMR
15 10
UlSirTargDnStepUplink SIR Target Down Step Size (dB)
UL 34 K136 K signaling UL 122 K AMR
01 02
458 Optimization of Uplink Capacity for a Single Cell
A lot of optimization measures can be taken to bring down the rising RTWP However with increasing subscribers the capacity may still be limited in some area while further modification of SirTarget will obviously degrade the call quality of the whole network and undermine the subscribersrsquo perception In this case you can adjust the power control parameters for a single site that has heavy traffic in the following way add one set of DivPc parameters and use this set of parameters only for this site
Case Table 4-9 shows an example of the power control parameter modification After this modification the call drop rate in the site with heavy traffic decreased to one quarter of the original one
Table 4-9 Example of Power Control Parameter Modification for Heavy-Traffic Cell
SRVTYPE ULINITSIR ULMAXSIR ULMINSIR
0 35-gt15 100-gt35 20-gt10
104 40-gt20 150-gt50 05-gt0
28 35-gt15 100-gt35 05-gt0
50 60-gt20 150-gt50 20-gt0
54 60-gt20 150-gt50 20-gt0
ZTE Confidential Proprietary copy 2012 ZTE CORPORATION All rights reserved 53
UMTS KPI Optimization Analysis Guide Internal Use Only
Revision History
Product Version Document Version Serial Number Reason for Revision
V10 First published
V11 Content modification
Author
Date Document VersionPrepared
byReviewed by Approved by
2007-12-28 V10 Qin Jianhan
Wang Zhenhai and Jin Zhengtuan
Jin Zhengtuan
2010-07-12 V11Wang Cun
Wang Zhenhai and Jin Zhengtuan
Jin Zhengtuan
ZTE Confidential Proprietary copy 2012 ZTE CORPORATION All rights reserved II
UMTS KPI Optimization Analysis Guide Internal Use Only
Key Words
KPI (key performance indicator) indicator definition formula KPI monitoring flow KPI optimization KPI classification
Abstract
This guide mainly describes the formulae KPI classification KPI monitoring methods and flows and KPI optimization methods
Abbreviations
Abbreviation Full name
ATM Asynchronous Transfer Mode
CDR Call Drop Rate
CE Channel Element
CN Core Network
CPICH Common Pilot Channel
CQI Channel Quality Indicator
CQT Call Quality Test
DT Drive Test
E-DCH Enhanced uplink Dedicated Channel
HSDPA High Speed Downlink Packet Access
HS-DSCH High Speed Downlink Shared Channel
HS-SCCH High Speed Shared Control Channel
HSUPA High Speed Uplink Packet Access
ICMP Internet Control Message Protocol
IP Internet Protocols
IPoA Internet Protocols Over ATM
KPI Key Performance Index
LAN Local Area Network
MAC Media Access Control
MBMSMultimedia Broadcast and Multicast Service
NodeB Node B
OMC Operation amp maintenance Centre
PDP Packet data protocol
PI Performance Index
PPP Point to Point Protocol
PS Packet-Switched domain
QoS Quality of Service
RAB Radio Access Bearer
ZTE Confidential Proprietary copy 2012 ZTE CORPORATION All rights reserved III
UMTS KPI Optimization Analysis Guide Internal Use Only
Abbreviation Full name
RF Radio Frequency
RNC Radio Network Controller
RRC Radio Resource Control
RRU Radio Remote Unit
RSCP Received Signal Code Power
RTWP Received Total Wideband Power
SAAL Signaling ATM Adaptation Layer
SCCP Signaling Connection Control Part
SNR Signal to Noise Ratio
TB Transport Block
TCP Transfer Control Protocol
UDP User Datagram Protocol
UE User Equipment
VIP Very Important People
VP Video Phone
WAN Wide Area Network
ZTE Confidential Proprietary copy 2012 ZTE CORPORATION All rights reserved IV
UMTS KPI Optimization Analysis Guide Internal Use Only
About This Document
Summary
Chapter Description
1 Overview Brief introduction to KPI optimization
2 KPI Monitoring Process KPI monitoring process
3 KPI Analysis Methods Common KPI analysis methods basic KPI analysis skills and general process for KPI optimization analysis
4 KPI Optimization Analysis KPI Optimization Analysis on CS call drops PS call drops accessibility indicators mobility indicators and resource indicators
ZTE Confidential Proprietary copy 2012 ZTE CORPORATION All rights reserved V
UMTS KPI Optimization Analysis Guide Internal Use Only
TABLE OF CONTENTS
1 Overview 1
2 KPI Monitoring Process 2 21 KPI Monitoring Process 2 22 Routine KPI Monitoring Process 2 23 KPI Monitoring Process During Parameter Modification 4 24 KPI Monitoring During RNC or NodeB Version Upgrade 5 25 KPI Monitoring During Cutover 6
3 KPI Analysis Methods 6 31 KPI Analysis Methods 6 311 TOP N Worst Cells Method 7 32 Basic KPI Analysis Skills 10 321 KPI Monitoring Tools 11 322 KPI Analysis Tools 11 33 General Process of KPI Optimization Analysis 12
4 KPI Optimization Analysis 16 41 CS Call Drop Optimization 16 411 Definition of Call Drop 16 412 CS Call Drop Analysis Flowchart 17 42 PS Call Drop Optimization 19 421 Optimization Flowchart 19 43 Optimization of Accessibility Indicators 21 431 Definition of Access Failure 21 432 Analysis on RRC Connection Failures 22 433 Analysis on RABRB Setup Failures 27 44 Optimization of Mobility Indicators 33 441 Optimization of Soft Handovers 33 442 Optimization of Hard Handovers 39 443 Optimization of Inter-RAT Handovers 44 45 Optimization of Resource Indicators 48 451 Resource Indicator Optimization Flowchart 49 452 Code Resource Optimization 51 453 Monitoring CE Resource 51 454 Optimization of Power Control 52 455 Speeding up Rate Downgrade 52 456 Monitoring and Optimizing Uplink Capacity 52 457 Optimization of Uplink Capacity at the Whole Network Level 53 458 Optimization of Uplink Capacity for a Single Cell 53
ZTE Confidential Proprietary copy 2012 ZTE CORPORATION All rights reserved VI
UMTS KPI Optimization Analysis Guide Internal Use Only
FIGURES
Figure 1-1 Joint KPI analysis1
Figure 2-2 Routine KPI monitoring process2
Figure 2-3 KPI monitoring process during parameter modification4
Figure 2-4 KPI monitoring workflow during RNC or NodeB version upgrade5
Figure 3-5 RF configuration at HIC site8
Figure 3-6 Antenna energy distribution at HIC site8
Figure 3-7 KPI optimization analysis process 15
Figure 4-8 CS call drop analysis flowchart17
Figure 4-9 PS call drop optimization flowchart19
Figure 4-10 Analysis flowchart of RRC connection setup failures23
Figure 4-11 Analysis flowchart of RAB setup failures28
Figure 4-12 Soft handover optimization flowchart34
Figure 4-13 Hard handover optimization flowchart41
Figure 4-14 Inter-RAT handover optimization flowchart46
Figure 4-15 Resource indicator optimization flowchart49
TABLES
ZTE Confidential Proprietary copy 2012 ZTE CORPORATION All rights reserved VII
UMTS KPI Optimization Analysis Guide Internal Use Only
Table 3-1 List of CS TOP N Worst Cells7
Table 3-2 Indicators Related with CS Call Drop9
Table 4-3 Parameters That 2G Shall Provide to 3G44
Table 4-4 Parameters That 3G Shall Provide to 2G44
Table 4-5 Resource KPIs and Alarm Thresholds48
Table 4-6 Adjusting Code Resource Allocation51
Table 4-7 Example of Parameter Modification for Rate Downgrade52
Table 4-8 Example of Power Control Parameter Modification53
Table 4-9 Example of Power Control Parameter Modification for Heavy-Traffic Cell 53
ZTE Confidential Proprietary copy 2012 ZTE CORPORATION All rights reserved VIII
UMTS KPI Optimization Analysis Guide Internal Use Only
1 OverviewThe radio network KPIs directly reflect the network quality and KPI monitoring is an important means to locate the faults KPI monitoring and optimization are mostly performed during the network operation and maintenance stage Abnormal events are supposed to be detected as early as possible and handled with proper solutions so that sound voice and data services can be ensured for the subscribers
At the beginning of the network construction the optimization team should put more emphasis on the RF adjustment rather than the optimization of KPIs except for CS call drop rate the PS call drop rate and the RTWP indicator During the network operation and maintenance stage KPI optimization (also called parameter optimization) plays the main role that is the optimization team should optimize a certain indicator through integrated parameter adjustment so as to meet the customerrsquos requirements
KPI data comes from NetNumenT31 the network management system in the operation and maintenance center (OMC) Based on the analysis on KPIs the current states of those indicators are learned and they are important reference for assessing the network performance The KPIs include the network service retaining capacity accessibility mobility system capacity and so on According to the current values of these indicators for example some site has congestion some site has a call drop rate of 10 or some RNC has a certain worst cell proportion busy cell proportion cell code resource availability access success rate call delay and handover success rate the optimization team should judge and locate the area scope and severity of the fault
KPIs are divided into service KPIs and network KPIs by the statistic sources Service KPIs are collected through field drive tests (DTs) while network KPIs are collected from the unified network management system This article mainly discusses the analysis on network KPIs Usually the final solution is made based on the joint analysis on the OMC KPI data alarms subscribersrsquo complaints and DT results
Figure 1-1 Joint KPI analysis
ZTE Confidential Proprietary copy 2012 ZTE CORPORATION All rights reserved 1
Hand to RampD dept or
customer service dept交研发或用
服处理
UMTS KPI Optimization Analysis Guide Internal Use Only
2 KPI Monitoring ProcessThe purpose of KPI monitoring is to find out abnormal events that affect services as well as subscribersrsquo perception and solve the problems as early as possible For instance if the call drop rate at a certain site goes over 50 we need to find the problem and work out the solution in the earliest time
As it is very urgent and important to locate KPI problems we need a whole set of scientific KPI monitoring mechanism and problem shooting process as well as appropriate monitoring tool and analysis tool to help us find the call drops caused by transmission problems resource congestion cells service interruption serious interference hardware fault with NodeB wrong configuration of RNC parameters in time
We classify KPI monitoring into four categories routine KPI monitoring KPI monitoring during the process of parameter modification KPI monitoring during the RNC or NodeB version upgrade and KPI monitoring during the process of cutover Routine KPI monitoring should be performed every day and be recorded in a KPI daily report which should involve the worst CS cell the worst PS cell the cell with the lowest RRC connection rate the cell with the most serious resource limit and so on
21 KPI Monitoring Process
KPI monitoring falls into four categories routine KPI monitoring KPI monitoring during the process of parameter modification KPI monitoring during the version upgrade of RNC or NodeB and KPI monitoring during the process of cutover Each type of monitoring has its own monitoring items and output form For instance the output of the routine KPI monitoring should be a daily report while the output of other KPI monitoring types should be a KPI comparison report Different types of KPI monitoring should have different time granularities according to the requirement of problem location
Routine KPI monitoring should be done persistently and be recorded in a daily report which should include a collection of the cells worst in different aspects and be sent to relevant person by email
22 Routine KPI Monitoring Process
Figure 2-2 Routine KPI monitoring process
ZTE Confidential Proprietary copy 2012 ZTE CORPORATION All rights reserved 2
Hand to RampD dept or
customer service dept交研发或用
服处理
UMTS KPI Optimization Analysis Guide Internal Use Only
ZTE Confidential Proprietary copy 2012 ZTE CORPORATION All rights reserved 3
Parameter problem
Hand to the planning personnel
Classification of the
worst cells
Problem handling team classifies
collects and locates the worst cells
Hand to the network
optimization personnel
Hand to RampD dept or
customer service dept交研发或用
服处理
Send email in fixed format to relevant
personnel
Coverage problem
Equipmentversion problem
Network KPI monitoring
( 15 minutes time granularity)
Screen out the worst cells with
KPI tool
EMS exports the one-day granularity
of the whole network
Output KPI daily report in Excel
UMTS KPI Optimization Analysis Guide Internal Use Only
23 KPI Monitoring Process During Parameter Modification
Figure 2-3 KPI monitoring process during parameter modification
Old parameter configuration
Configure data according to the
worksheet
Network KPI monitoring (15-
minute granularity)
Whether the KPIs at the
RNC level are normal
Keep on monitoring (15-
minute granularity)
Output a report in Word (hourly
granularity KPIs before and after the parameter modification)
End
Yes
Notify the person in charge by mail
or phone
Rollback or not
Locate the worst cells and check if they are caused
by the parameter modification
No
Yes
No
ZTE Confidential Proprietary copy 2012 ZTE CORPORATION All rights reserved 4
Network KPI monitoring
( 15 minutes time granularity)
UMTS KPI Optimization Analysis Guide Internal Use Only
24 KPI Monitoring During RNC or NodeB Version Upgrade
Figure 2-4 KPI monitoring workflow during RNC or NodeB version upgrade
ZTE Confidential Proprietary copy 2012 ZTE CORPORATION All rights reserved 5
Yes
No
No
End
Locate the worst cells Determine whether they are related with the version update
Yes
Network KPI monitoring
( 15 minutes time granularity)
Execute the worksheet to
upgrade version
Output formal Word report (Compare the hourly granularity KPIs before and after the parameter modification and output the result every hour)
Whether the RNC-level
KPI is normal
Keep on monitoring (15 minutes granularity)
Send mail to or call the person in charge
Rollback or not
Current version
UMTS KPI Optimization Analysis Guide Internal Use Only
25 KPI Monitoring During Cutover
For the network on which the equipment needs to be replaced (for instance HongKong CSL network for which we replaced Nokiarsquos equipment with ZTErsquos) after the network optimization is completed the subscribers on the existing network should be cut over to our network gradually During the cutover there will be subscribers registering on our network constantly which will cause load increase on the network In this case we should watch KPI changes closely The monitoring process items method and report are the same as those described in section 24 ldquoKPI Monitoring During RNC or NodeB VersionUpgraderdquo Please read it for reference
3 KPI Analysis Methods
31 KPI Analysis Methods
Different network problems require different performance analysis methods Choose one or more appropriate methods after learning the running state of the existing network and the problems with it Common analysis methods are as follows
TOP N worst cells method Based on the traffic statistics indicators we care about (such as the call drop rate connection rate and soft handoff failure rate) choose N worst cells whose average indicator values in the peak hours or of the whole day are the lowest as the target of fault analysis and optimization Or prioritize objects of optimization against these indicator values
Time tendency chart method Tendency chart of indicator change is commonly used in the traffic analysis The analysis engineer can work out an hourly daily or weekly tendency chart of one or more indicators of the whole network a cluster or a single cell and find out the change rule of traffic statistics indicators
Regional location method The change of network performance indicators often occurs in some regions The indicators in these regions may be worsened by traffic increase traffic mode change radio environment change faults with a small number of stations or uplinkdownlink interference which will therefore affect the performance indicators of the whole network By comparing the network performance indicators before and after the change we can mark out the station or the sector with the greatest indicator change on an electronic map and take these problem regions as the analysis focus
Comparison method A single traffic statistics indicator may be affected by many factors While some factors change others may not Choose a proper object for comparison to confirm the existence of problems and then analyze the causes of the problems When examining an indicator do not care whether the absolute indicator value is high or low only pay more attention to whether the value is high or low compared to other indicators instead
ZTE Confidential Proprietary copy 2012 ZTE CORPORATION All rights reserved 6
UMTS KPI Optimization Analysis Guide Internal Use Only
311 TOP N Worst Cells Method
During the whole process of KPI optimization analysis TOP N worst cells analysis method is the most effective one which can be used throughout the whole optimization phase By focusing on the TOP N worst cells you can solve the major problems with the network Abnormal call drop events may happen every day and these events may represent problems of a kind After solving the problems with TOP N cells you can solve the problems of the same kind Therefore focusing on TOP N cells is one of the most effective ways to solve problems
TOP N worst cells analysis method is applicable to the optimization analysis of all the indicators Choose TOP N worst cells according to a certain threshold which varies depending on different indicators N stands for the number of the worst cells When the worst cells are too many to be worked on the number of the worst cells can be decreased so that you can focus on them TOP N cells analysis method includes the following steps
Step 1 Screen out TOP N cells according to the condition of the indicators you care about
Step 2 Conduct a health check for TOP N cells Check whether there are any problems with transmission or boards and check whether the worst cells are caused by external abrupt incidents such as terrible weather gatherings or holiday (because during gatherings and holidays the traffic is usually heavy)
Step 3 Check the radio parameters configuration of these cells the radius of these cells and their neighboring cells and compare them with the normal cells
Step 4 Export the indicator relevant most closely with the indicators you care about and analyze it to find the problem indirectly
For instance one day CS call drop rate of a whole network was high We analyzed the problem by the TOP N cells analysis method
Step 1 Screen out TOP N cells according to the condition of the indicators you care about
We used the CNO KPI analysis function to screen out TOP N cells (other tools can be also used) and selected 10 cells with the highest CS call drop rate
Table 3-1 List of CS TOP N Worst Cells
Index Cell RNS subnet ID Cell IDCall drop
rate CS AMRNumber of call
drop voice
1 ZBL1U-AI-1 (201) 12911 4158 553
2 ZBL1U-AI-3 (201) 12913 3955 545
3HKE1U-5H-1
(203) 30461 1556 370
ZTE Confidential Proprietary copy 2012 ZTE CORPORATION All rights reserved 7
UMTS KPI Optimization Analysis Guide Internal Use Only
Index Cell RNS subnet ID Cell IDCall drop
rate CS AMRNumber of call
drop voice
4HKE1U-5H-3
(203) 30463 1581 360
5LAK1U-9M-3
(202) 11063 339 282
6 HIC1U-9R-1 RNC101(101) 10891 226 216
7LAK1U-9M-1
(202) 11061 249 215
8EBP1U-9R-3
RNC101(101) 12823 230 205
9SRS1U-5H-1
RNC102-CSL(102)
12091 392 169
10HRM1U-6R-1
RNC102-CSL(102)
20671 341 167
Step 2 Check the transmission and hardware of the TOP N cells and check whether they are caused by external abrupt incidents such as terrible whether gatherings or holidays when traffic is usually heavy
And then we conducted a health check for each cell and paid attention to routine alarms and BPC board problems We found there were broken associations in some HKE sites
Step 3 Check the radio parameters configuration of these cells the radius of these cells and their neighboring cells and compare them with the normal cells
(1)Problem with the cell radius After the check we found the cell radius of the LAK site was 25 km Because the LAK site was situated by the sea and the antenna was placed very high the radius of 25 km was far from enough So we changed the cell radius to 10 km and the problem of high call drop rate was thus solved
(2)Problem with configuration HIC site is an indoor POI site The RRU RxTx port and the RRU Rx port were configured reversely which is the cause of high call drop rate After modifying HIC we found that signals of the second RRU were received by the Rx port So we changed the configuration of the RxTx port and the Rx port the problem of high call drop rate was thus solved
Figure 3-5 RF configuration at HIC site
Figure 3-6 Antenna energy distribution at HIC site
ZTE Confidential Proprietary copy 2012 ZTE CORPORATION All rights reserved 8
UMTS KPI Optimization Analysis Guide Internal Use Only
Step 4 Export the indicator relevant most closely with the indicators you care about and analyze it to find the problem indirectly
Table 3-2 Indicators Related with CS Call Drop
Index Cell
RAB release number for Iu connection
release request by UTRAN for CS domain in
cell radio connection with UE lost
RAB release number for Iu connection
release request by UTRAN for CS domain in cell failure in
the radio Interface
procedure
RAB release number for Iu connection
release request by
UTRAN for CS domain in
cell release due to
overload control
RAB release number for Iu connection
release request by
UTRAN for CS domain in
cell unspecified
failure
Average cell freq RTWP (dbm)
1ZBL1U-AI-1
482 43 0 29 -104177
2ZBL1U-AI-3
473 40 0 33 -104125
3HKE1U-5H-1
346 16 0 8 -105908
4HKE1U-5H-3
330 18 0 13 -1060777
5LAK1U-9M-3
69 196 0 18 -1031906
6HIC1U-9R-1
100 100 0 16 -1015404
7 LAK1U- 64 131 0 20 -1031934
ZTE Confidential Proprietary copy 2012 ZTE CORPORATION All rights reserved 9
UMTS KPI Optimization Analysis Guide Internal Use Only
Index Cell
RAB release number for Iu connection
release request by UTRAN for CS domain in
cell radio connection with UE lost
RAB release number for Iu connection
release request by UTRAN for CS domain in cell failure in
the radio Interface
procedure
RAB release number for Iu connection
release request by
UTRAN for CS domain in
cell release due to
overload control
RAB release number for Iu connection
release request by
UTRAN for CS domain in
cell unspecified
failure
Average cell freq RTWP (dbm)
9M-1
8EBP1U-9R-3
98 90 0 17 -101413
9SRS1U-5H-1
87 59 0 22 -1043528
10HRM1U-6R-1
42 111 0 13 -1027697
32 Basic KPI Analysis Skills
Be able to use the KPI statistics tool and the analysis tool
Use tools to learn about the running state of the whole network quickly and screen out TOP N worst cells quickly
Use different analysis tools to find problems from different aspects and locate the problem quickly
Understand the signaling process and basic principle
In the process of abnormity location keep a clear aim in mind and be able to apply the process and basic principle to check the other relevant indicators rapidly to facilitate the analysis
Be familiar with the process and basic principle and be able to make logical association between abnormal KPI problems and network problems (such as the coverage problem and the interference problem) Be able to determine the problem nature according to the abnormal KPI and then choose the appropriate tool to analyze the problem in depth
Performance analysis requires engineers to understand basic signaling process be familiar with the protocol stacks of standard interfaces and know relevant algorithms to realize the product functions Engineers should at least have a concept about the various algorithms If the analysis of a commercial network involves some algorithms engineers should study these algorithms in depth
ZTE Confidential Proprietary copy 2012 ZTE CORPORATION All rights reserved 10
UMTS KPI Optimization Analysis Guide Internal Use Only
321 KPI Monitoring Tools
minus Network management tool NetNumenT31 count KPI original data alarm data radio parameter configuration in cells and parameter configuration on the earth
minus KPI daily report generating tool classify key indicators according to a certain condition and screen out the worst cells
322 KPI Analysis Tools
minus CNO Tool CNO tool has the KPI analysis function So using it you can screen out the worst cells according to various conditions and point out the corresponding counter of an indicator
minus SignalTrace Trace the signaling (RNL signaling and RNL signaling) of RNC interfaces which includes the Iu interface the Iur interface the Iub interface and the Uu interface (the signaling flow between RNC and UE at RRC layer) And RNL signaling trace is a common way for locating the KPI problem Being able to trace the RNC signaling is a basic requirement for the on-site KPI optimization engineers and the network optimization and maintenance engineers This signaling tracing tool is very powerful which can trace signaling according to the UE cell and IMSI in the KPI analysis According to the UE cell it can trace the signaling of multiple subscribers while according to IMSI it can trace the signaling of only one subscriber However if the RRC connection is not established yet signaling cannot be traced That is because only when RRC connection has been established can the RNC obtain the subscriberrsquos IMSI from the CN
minus RNC ASS Log ASS log is usually applied when there is abnormity and RNC signaling is out of trace In this case use ASS log to analyze the signaling before and after the abnormity occurs Abnormity can be queried according to IMSI or cell ID ASS log can be also used to collect various abnormities
minus NodeB LMT NodeB local operation and maintenance tool Apart from all the operation functions of the OMCB this tool can collect more detailed information about cells and UE NodeB local maintenance terminals include EOMS EFMS DMS and PMS
minus NodeB Abnormity Probe On the site of WCDMA commercial office NodeB abnormity probe is an effective tool to monitor the running state of the NodeB Every module of NodeB can record the abnormal information automatically which makes it easy to locate problems However this method requires professional knowledge such as knowledge about the function and interface of each module or board If the on-site engineers cannot make the simple analysis they can just obtain the abnormity probe and send it to the RampD engineers at the rear side The abnormities reported on the NodeB will be stored at the OMCB server according to different RNCs To conduct NodeB
ZTE Confidential Proprietary copy 2012 ZTE CORPORATION All rights reserved 11
UMTS KPI Optimization Analysis Guide Internal Use Only
abnormity probe analysis you need to download abnormity probe files from different OMCB servers and then use the abnormity probe tool to make a comprehensive analysis
minus CTS Tool CTS is a tool developed by the CN department which can trace signaling in depth according to IMSI and trace signaling across RNCs So this is particularly suitable to trace VIP subscribers In this case CTS is easier to use than SignalTrace which can only trace signaling of RNCs one by one CTS can trace the interactive signaling between network elements (NEs) within the CN as well as the signaling of the Iu interface and the Uu interface This kind of signaling tracing is what we called in-depth tracing The work principle of CTS is to set up an IMSI task on the CTS server and send it to the CN front side which will then send this task to each CN module via the interfaces dedicated to the CN modules and the RNC and then each module after receiving the signaling related to the IMSI task will send the signaling back to the CTS server via the CN front side The interfaces mentioned above are private interfaces so this tool can only support our own CN and RNC CTS signaling can be checked and analyzed with an offline tool but the offline tool does not work very well because of the lack of continuous optimization and perfection
minus UE log DT test is also an important auxiliary way in analyzing KPI indicators There are many problems that cannot be located by tracing signaling at the network side and can only be located by the use of UE log The commonly used drive test software includes QXDMAPEX (QCAT) CNTCAN and TEMS CNTCAN and TEMS are often used for network optimization For the use of CNTCAN please refer to the corresponding help file and the instruction document publicly released by the Network Optimization Tool Department QXDM and the analysis tool APEX (QCAT) provided by Qualcomm is very powerful which have contributed a lot for the stability and maturity of our system for many years
33 General Process of KPI Optimization Analysis
Basic analyzing ideas
KPI optimization is a process to find and solve problems KPI optimization during the operation and maintenance stage is mainly to pick out the performance data that needs special attention from the OMC classify these performance data and then compare the value of these data with that required by the operator If the value of an indicator is lower than the operatorrsquos requirement analyze this indicator and find out the factor that affect the indicator and then propose a solution to the operator If the values are higher than the operatorrsquos requirement therersquos no need to pay special attention to them
KPI analysis is a process from the whole to the part
Step 1 Check the key indicators from the view of the whole network If there is not any
ZTE Confidential Proprietary copy 2012 ZTE CORPORATION All rights reserved 12
UMTS KPI Optimization Analysis Guide Internal Use Only
problem just ignore them Otherwise try to locate the RNC NE that has the problem
Step 2 Analyze the indicators of the corresponding RNC to find out the RNC whose indicators have the problem
Step 3 Analyze the indicators of the cell under the problem RNC to find out the worst cells or TOP N cells If the indicators of all the cells under the RNC are tend to be low it is a common problem probably caused by parameter configuration And then check whether the radio parameter configuration in the cells under this RNC is the same as that in the cells under the normal RNCs
Step 4 Make a comprehensive analysis on the KPIs alarms DT test data and customer complains of the worst cells to find out a solution
Analysis method
After learning the KPI analysis ideas we must know some common KPI analysis methods to rule out causes of problems from the obvious ones to the hidden ones
For example we found that the TCP code words were strictly limited at eight sites near a park and the call drop rate rose suddenly How to solve this problem
Method one First we checked whether the alarms transmission and boards of these sites were normal After they are proved all normal we sent some engineers to the site to do test And meanwhile we traced the RNC signaling at the OMC It turned out that the test result was normal and the indicators of these sites of that day did not have any problem and code words were not limited And later we knew from the news that there was a big gathering of about one million people at the park at that moment Until then we came to know that the congestion was caused by too many users using the network at the same time
Method two First because the eight sites went worse all of a sudden it was unlikely that the problem lied in the hardware Then we checked whether the radio parameters had been modified the day before The result is no worksheet had been issued to modify those parameters and no alarm was found at those sites Therefore we excluded the possibility of hardware problem Then we checked the traffic trend graph of the last few days (over seven days) and found that the high call drop rate might be caused by high traffic The graph showed that traffic of each site rose suddenly on the day before Thus we came to the conclusion that this was an abnormal abrupt event which may have been caused by a gathering And later we were told that there was a big gathering at the park So we were assured the code words limitation and high call drop rate at the eight sites were caused by too many subscribers using the network at the same time
By comparing the two methods above we can find that although the first one (sending engineers to the site without the consideration of abnormal events) is commonly used it is inefficient and costs more resource The second method (analyzing the problem by the means of exclusion and association) is more efficient From this case we would like to emphasize that KPI analysis is a process of problem exclusion Using the comprehensive
ZTE Confidential Proprietary copy 2012 ZTE CORPORATION All rights reserved 13
UMTS KPI Optimization Analysis Guide Internal Use Only
methods (like Method One) at the first brush may be making a detour
minus Exclusion method Check the alarms on the OMC to learn about the state of the RNC NodeB BPC board and the transmission If there are obvious broken link in transmission or hardware problem the cause of the problem is easy to locate
minus Incident association If the problem is with a great number of sites take abrupt incidents into account such as large-scale gathering terrible weather of incorrect operation These incidents will put influence of different levels and ranges on the network indicators
minus Comparison of radio parameters If some site goes wrong in a sudden check whether the radio parameter configuration of this site is consistent with that of other normal sites If not change it as that of the normal sites because the indicator decrease may be caused by an incorrect modification of radio parameters
minus Relevant indicators association If a certain indicator is in poor condition check its relevant indicators and find the common problem from these relevant indicators
minus Comprehensive problem location When the above reasons are excluded use DT data KPI data RNC signaling analysis data to locate the problem with indicators comprehensively
ZTE Confidential Proprietary copy 2012 ZTE CORPORATION All rights reserved 14
UMTS KPI Optimization Analysis Guide Internal Use Only
Figure 3-7 KPI optimization analysis process
StartPick out
performance indexes
RNC index abnormal
Equipment alarms exist
Deal with equipment alarms
RNC index recovers
Common problem with the
worst cells
Transmission softwarehardware version wireless
parameter configuration
CNRNC Transmission
Hardware Software Interference
Wireless parameters
Time range
Abrupt and self-curable abnormality
helliphellip
Analyze and record causes
Suggestion about improvement
Common problems analysis
Problem resolved
Successful call
Call drop Soft handover
23G alternate operation
PS rate helliphellip
Deal with the relevant problem
Indexes normal
End
Climate change holidays assembly
transmission interruption power
fault and so on
Y
N
Y
Y
N
Y
N
Abnormal indexes analysis in one cell
Y
N
N
N
Y
N
Y
Show TOPN abnormal cells
and their locations
If the problem is proved to be equipment bug or system problem after
several attempts feed it back to RampD dept
ZTE Confidential Proprietary copy 2012 ZTE CORPORATION All rights reserved 15
UMTS KPI Optimization Analysis Guide Internal Use Only
4 KPI Optimization Analysis This chapter mainly demonstrates how to analyze the indicator problems from the aspect of OMC data and provides flowcharts for KPI optimization The detailed analyzing method and cases of every special subject can be checked in the optimization guides of all the subjects
41 CS Call Drop Optimization
The CS call drop rate is the most important indicator in KPI optimization
411 Definition of Call Drop
After checking the signaling on the Uu interface at the UE side the engineer can judge the situation a call drop if the Uu interface message satisfies one of the following three conditions during the calling process (in connection)
RNC Release is not received but the UE condition changes from CELL_DCH to IDLE
RRC Release is received and the released cause value is Not Normal
One of the following three messages mdash CC Disconnect CC Release Complete and CC Release mdash is received and the released cause value is Not Normal Clearing or Not Normal Unspecified
In a board sense the call drop includes the call drop rates of CN and UTRAN The call drop of UTRAN includes the following two aspects
After the successful service establishment RNC sends the RAB Release Request to CN
After the successful service establishment RNC sends the IU Release Request to CN Later RNC receives the IU Release Command from CN
Note that RAN call drop statistics which is defined from the aspect of lu interface signaling means the launching times of RAB Release Request and lu Release Request of RNC And the DT call drop statistics is defined from the aspects of the Uu interface message non-access stratum message and cause value RAN call drop statistics and DT call drop statistics are not exactly the same
ZTE Confidential Proprietary copy 2012 ZTE CORPORATION All rights reserved 16
UMTS KPI Optimization Analysis Guide Internal Use Only
412 CS Call Drop Analysis Flowchart
Figure 4-8 CS call drop analysis flowchart
ZTE Confidential Proprietary copy 2012 ZTE CORPORATION All rights reserved 17
UMTS KPI Optimization Analysis Guide Internal Use Only
Extract performance data
CS TOP Ncell filtering
Analyze a single cell
1 Check NE alarms
2 Associate emergencies
3 Compare parameter
configurations
4 Associate indicators
5 Locate the fault
comprehensively
Exist or not
Handle alarms
Solved or not
Yes
Yes
End
No
No
Exist or not
Handle emergencies
Solved or not
Yes
No
No
Exist or not
Correct wrong parameter
configurations
Solved or not
Yes
No
No
List related indicator counters
Call-drop-related
countersRTWP
Handover success rate
Traffic volume
Resource limit indicators
Checkamp analysis of
interference
Optimizationanalysis of
handover failures
Optimization analysis of
resource limitCall-drop-
related counters
C301230362C301230363C301230365C301230315C301230316C301230318C301230319C301230322C301230323
Solved or not
Yes
Yes
No
Drive Test+RNC signaling
trace
Yes
ZTE Confidential Proprietary copy 2012 ZTE CORPORATION All rights reserved 18
UMTS KPI Optimization Analysis Guide Internal Use Only
42 PS Call Drop Optimization
421 Optimization Flowchart
Figure 4-9 PS call drop optimization flowchart
ZTE Confidential Proprietary copy 2012 ZTE CORPORATION All rights reserved 19
UMTS KPI Optimization Analysis Guide Internal Use Only
Extract performance data
PS TOP Ncell filtering
Analyze a single cell
1 Check NE alarms
2 Associate emergencies
3 Compare parameter
configurations
4 Associate indicators
5 Locate the fault
comprehensive ly
Exist or not
Handle alarms
Solved or not
Yes
Yes
End
No
No
Exist or not
Handle emergencies
Solved or not
Yes
No
No
Exist or not
Correct wrong parameter
configurations
Solved or not
Yes
No
No
List related indicator counters
Call -drop-related
countersRTWP
Handover success rate
Traffic volume
Resource limit indicators
Check amp analysis of interference
Optimizationanalysis of
handover failures
Optimization analysis of
resource limitCall -drop-
related counters
C301230372C301230373C301230375C301230330C301230332C301230333C301230334C301230337C301230338
Solved or not
Yes
Yes
No
Drive Test +RNC signaling
trace
Yes
ZTE Confidential Proprietary copy 2012 ZTE CORPORATION All rights reserved 20
UMTS KPI Optimization Analysis Guide Internal Use Only
43 Optimization of Accessibility Indicators
Accessibility performance includes the success rate of RRC connection setup and the success rate of CSPS RAB assignment These two kinds of KPIs play important roles in the network optimization and directly influence the success rate of CSPS service establishment In this document this kind of problems are found from the aspect of OMC data and solved through parameter optimization
431 Definition of Access Failure
For the mobile originated call in the CS domain the access failure event means that the UE sends RRC REQUEST and IE establish cause is Originating Conversational Call but alerting of the direct transfer message is not received
The relevant events are defined as follows in the access failure stage
RRC connection setup failure After considering the resending times and the waiting time the UE sends RRC CONNECTION REQUEST and does not receive the response from RNC or RRC CONNECTION REJECT delivered by RNC
Initial direct transfer and security mode establishment failure After sending RRC CONNECTION SETUP COMPLETE the UE does not send NAS SETUP
RAB assignment failure After receiving CALL PROCEEDING the UE does not receive RB SETUP delivered by RNC Or the UE replies with RB SETUP FAIL after receiving RB SETUP Or the UE receives DISCONNECT with the cause value not being Normal Release after receiving RB SETUP At this time the UE has not reported RB SETUP CMP
Failure after RAB assignment After the UE sends RB SETUP COMPLETE the originating UE receives DISCONNECTRELEASE from CN Or the UE waits CONNECT or ALERTING overtime and launches the Call Clearing process Or the UE becomes IDLE before receiving Alerting and starts to receive the system message
For the mobile terminated in the CS domain the access failure event means that the terminating UE receives the paging of paging type 1 and does not send RRC CONNECTION REQUEST with the cause value being Terminating Conversational Call Or the UE does not send the alerting of direct transfer message to CN after sending RRC CONNECTION REQUEST
The relevant events are defined as follows in the access failure stage
RRC connection setup failure After sending RRC CONNECTION REQUEST the UE does not receive the response from RNC or RRC CONNECTION REJECT delivered by RNC
Initial direct transfer and security mode establishment failure After sending RRC
ZTE Confidential Proprietary copy 2012 ZTE CORPORATION All rights reserved 21
UMTS KPI Optimization Analysis Guide Internal Use Only
CONNECTION SETUP COMPLETE the UE does not receive the SETUP direct transfer message Or the UE sends RELEASE COMPLETE Or the UE receives DISCONNECT from CN
RAB assignment failure The UE does not receive RB SETUP delivered by RNC after sending CALL CONFIRM Or the UE replies with RB SETUP FAIL after receiving RB SETUP Or the UE receives DISCONNECT with the cause value not being Normal Release after receiving RB SETUP At this time the UE has not reported RB SETUP CMP
Failure after RAB assignment After the UE sends RB SETUP COMPLETE the terminating UE receives DISCONNECTRELEASE from CN
432 Analysis on RRC Connection Failures
The problem of RRC connection setup failure can be analyzed through the UE signaling flow and RNC single-user tracing The RRC connection setup includes the following steps
The UE sends RRC Connection Request through the RACH channel
RNC sends RRC Connection Setup through the FACH channel
The UE sends RRC Connection Setup Complete through the dedicated uplink channel after the downlink dedicated channel is established and synchronized
RRC connection setup failures are always caused by following issues
Uplink RACH problem
Problem about downlink FACH power allocation proportion
Parameter reselection problem of the cell
Low downlink dedicated initial transmitting power
Uplink initial power control problem
Congestion
Equipment malfunctions
Among these issues the problems of uplink RACH downlink FACH power allocation proportion parameter reselection of the cell and equipment malfunctions appear more frequently
ZTE Confidential Proprietary copy 2012 ZTE CORPORATION All rights reserved 22
UMTS KPI Optimization Analysis Guide Internal Use Only
4321 Analysis Flowchart of RRC Connection Setup Failures
Figure 4-10 Analysis flowchart of RRC connection setup failures
ZTE Confidential Proprietary copy 2012 ZTE CORPORATION All rights reserved 23
UMTS KPI Optimization Analysis Guide Internal Use Only
Extract performance data
TOP Ncell filtering
Analyze a single cell
1 Check NE alarms
2 Associate emergencies
3 Compare parameter
configurations
4 Associate indicators
5 Locate the fault
comprehensive ly
Exist or not
Handle alarms
Solved or not
Yes
Yes
End
No
No
Exist or not
Handle emergencies
Solved or not
Yes
No
No
Exist or not
Correct wrong parameter
configurations
Solved or not
Yes
No
No
List related indicator counters
Counters related to RRC setup
failuresRTWP
Resource limit
indicators
Checkamp analysis of interference
Optimization analysis of
resource limitCounters related
to RRC setup failures
C301480485C301480486C301480487C301480489C301480490C301480491C301481288C301481289C301481337C301481338C301481339C301481407C301481408
Solved or not
Yes
Yes
No
Drive Test+RNC signaling
trace
Yes
ZTE Confidential Proprietary copy 2012 ZTE CORPORATION All rights reserved 24
UMTS KPI Optimization Analysis Guide Internal Use Only
4322 UE sends RRC Connection Request but RNC does not receive it
If the EcIo of downlink CPICH is relatively low it is the problem of coverage
If the EcIo of downlink CPICH is not very low (for example the value is larger than -14 dB) Usually it is the problem of RACH and the following issues may cause the problem
minus The power of Preamble does not rise to a required value and the rising times of Preamble should be increased
minus The output power of UE is lower than the required value which is caused by poor UE performance In this case the UE should be changed
minus The NodeB equipment has a standing wave and the engineer should check whether NodeB has any SWR alarm
minus The radius of the cell is set improperly If the radius parameter of the cell is set too small the NodeB can not synchronize the UE beyond the range of the radius and the access fails This problem often happens in the places with large coverage such as the rural areas and the suburbs
4323 RNC delivers RRC Connection Reject after receiving RRC Setup Request
When RRC Connection Reject appears the engineer should check the specific reject cause value Usually there are two kinds of causes
The CPU load of RNC control plane board is too heavy and more boards should be added
DCH and FACH admission is rejected However this situation does not always happen
4324 UE does not receive RRC Connection Setup delivered by RNC
This problem may be caused by the following reasons
Poor coverage
Improper parameters of cell selection and reselection
Checking method The engineer should check the EcIo of CPICH If the value is lower than -12 dB (EcIo is -12 dB by default) and there is no cell of better quality in the monitor set the cause of this problem is poor coverage If there is better cell in the monitor set cell reselection may cause this problem
Poor coverage can be improved by coverage enhancement such as adding some sites to cover the places without signal coverage and adjusting the engineering parameters If the coverage can not be improved the engineer can enhance the FACH power according to
ZTE Confidential Proprietary copy 2012 ZTE CORPORATION All rights reserved 25
UMTS KPI Optimization Analysis Guide Internal Use Only
the PCPICH EcIo coverage of the current network For example if all the pilot EcIo values are larger than -12 dB in the coverage area the power proportion of the common channel should be configured on the basis of the situation that the EcIo value is larger than -12 dB And so the success rate of the idle UE assessment can be ensured
As for the access problem caused by cell selection and reselection the engineer can speed up the cell selection and reselection by adjusting the cell selection and reselection parameters and the problem of RRC connection setup failure caused by improper cell selection and reselection parameters can be solved
Note
The RRC Connection Setup message is borne by FACH RRC Connection Request sent by the UE is received by UTRAN at the preamble of PRACH and then it is sent from the RACH channel based on the current preamble power And the transmit power of preamble can rise all the time until the response is received (There is a limitation for the maximum number of preamble retransmissions) Therefore in the areas with poor coverage the RACH coverage and FACH coverage may become unbalanced and as a result UTRAN can receive RRC Connection Request sent by the UE but the UE can not receive RRC Connection Setup sent by RNC
4325 UE receives RRC Connection Setup and does not send RRC Setup Complete
If the downlink signal quality is normal this problem may be caused by the abnormal condition of the cell phone
Another reason of this problem may be the downlink synchronization failure caused by the low initial power of downlink dedicated channel You can solve this problem by adjusting the service downlink EbNo
4326 RNC does not receive RRC Setup Complete sent by UE
Because the uplink initial power control may increase the UE transmit power this kind of problem seldom appears If it appears the engineer can increase the Constant Value of the dedicated channel properly to raise the uplink DPCCH initial transmission power of the UE
At the same time this problem is also relevant with the uplink SIR initial target value configuration because this value may affect the uplink initial synchronization at the initial stage of link setup If the value of the parameter is set too large there will be too much uplink inference brought by the initial setup of the link If the value is set too small the uplink synchronization will take longer time and the initial synchronization may even fail This parameter is an RNC-level parameter which has a great influence on network performance Therefore the engineer should be cautious while adjusting this parameter
ZTE Confidential Proprietary copy 2012 ZTE CORPORATION All rights reserved 26
UMTS KPI Optimization Analysis Guide Internal Use Only
Note
RRC Connection Setup Complete is sent through uplink DPCH and the UE calculates the initial power of uplink DPCCH according to the received IErdquoDPCCH_Power_offsetrdquo and the measured CPICH_RSCP value
DPCCH_Initial_power = DPCCH_Power_offset - CPICH_RSCP
DPCCH_Power_offset = Primary CPICH DL TX Power + UL Interference + Constant Value The Constant Value can be configured in the OMC If this value is set too small the UE may not have enough power to send RRC Connection Setup Complete
433 Analysis on RABRB Setup Failures
When RAB or RB setup fails RNC will send RAB Assignment Fail in the RAB Assignment Response signaling The engineer can find out the specific failure reason from the failure cause value carried in relevant cells The reasons for common RABRB setup failures include
RNC directly rejecting RAB Setup Request because of wrong parameter configuration
Admission reject
RAB setup failure because the UE fails to respond to RB Setup Request
RAB setup failure because the Uu interface fails to set up RB
ZTE Confidential Proprietary copy 2012 ZTE CORPORATION All rights reserved 27
UMTS KPI Optimization Analysis Guide Internal Use Only
4331 Analysis Flowchart of RAB Setup Failures
Figure 4-11 Analysis flowchart of RAB setup failures
ZTE Confidential Proprietary copy 2012 ZTE CORPORATION All rights reserved 28
UMTS KPI Optimization Analysis Guide Internal Use Only
Extract performance data
TOP Ncell filtering
Analyze a single cell
1 Check NE alarms
2 Associate emergencies
3 Compare parameter
configurations
4 Associate indicators
5 Locate the fault
comprehensively
Exist or not
Handle alarms
Solved or not
Yes
Yes
End
No
No
Exist or not
Handle emergencies
Solved or not
Yes
No
No
Exist or not
Correct wrong parameter
configurations
Solved or not
Yes
No
No
List related indicator counters
Counters related to RAB setup failures RTWP
Resource limit
indicators
Checkamp analysis of interference
Optimization analysis of
resource limitCounters related to RAB setup failures
CS domain PS domainC301230290 C301230302C301230291 C301230303C301230292 C301230304C301230293 C301230305C301230294 C301230306C301230295 C301230307C301230296 C301230308C301230297 C301230309C301230298 C301230310C301230299 C301230311C301230300 C301230312C301230301 C301230313
Solved or not
Yes
Yes
No
Drive Test+RNC signaling
trace
Yes
ZTE Confidential Proprietary copy 2012 ZTE CORPORATION All rights reserved 29
UMTS KPI Optimization Analysis Guide Internal Use Only
4332 RNC Directly Rejecting RAB Setup Request Because Of Wrong Parameter Configuration
The case that RNC responds with RAB Setup Failure directly is seldom caused by invalid parameter configuration in the business network Usually this case is caused by special operations of the special users
The main scenario is that the subscription information of the userrsquos PS service is beyond the capability of the UE which leads to the direct refusal from RNC For example a special userrsquos subscription rates of uplink and downlink are 384 K but the maximum uplink rate of the UE is only 64 K The maximum uplink and downlink rates of the QoS message used for activating PDP set by the AT command or mobile terminal software used by the user are 384 K so the RNC will find the maximum uplink rate is beyond the UErsquos capability directly reply with RAB Setup Failure and will not launch the RB setup process when it receives RAB Assignment Request
After the RAB setup fails because the parameter configuration is beyond the UErsquos capability SGSN will negotiate again to launch the new RAB assignment until the UE has the capability to support the assignment and the RAB assignment is finished For the users the PDP activation is still successful and the actual maximum rate is the maximum rate the UE can support
However if the minimum guaranteed bit rate required by the QoS setting in the UErsquos PDP activation request is beyond the UErsquos capability though the network negotiates a lower rate to accept the UErsquos PDP activation request the UE will launch the request of deactivating PDP when it finds that the rate negotiated by the network in PDP activation accept request is lower than the minimum guaranteed bit rate and finally the PDP activation can not be completed
4333 Admission Reject
For the non-HSDPA user if there are insufficient system resources (including power channel code lub transmission resource and CE) the call establishment failure will be caused by the admission reject At this time it is necessary to check the network load code resource lub transmission resource and CE resource occupation to make sure the congestion is caused by the limitation of a certain kind of resource What is more the engineer should plan the corresponding expansion method
If the cell does not support the HSDPA service the R99 user admission is judged according to the fixed R99 admission threshold If the cell supports the HSDPA service and the HSDPA and R99 dynamic power is allocated the uplink admission of non-HSDPA is judged based on RTWP or the equivalent user number If the uplink load is too heavy the non-HSDPA user admission will also fail
If the bandwidth configuration on the lub interface is insufficient the lub interface will reject the R99 data service activation because of limited bandwidth
ZTE Confidential Proprietary copy 2012 ZTE CORPORATION All rights reserved 30
UMTS KPI Optimization Analysis Guide Internal Use Only
The admission control of the NodeB Credit resource is similar to the power admission control Whether the remaining Credit can support the currently requested service or not can be judged according to the spectrum spreading factor of the new access user According to the condition of the RAB Downsizing Switch RNC will deal with the issue in the corresponding way
For the HSDPA user in the dynamic power allocation mode besides the mentioned system resources such as the power channel code lub transmission resource and CE the admission reject should take into consideration whether the number of H users supported by NodeB and the number of H users supported by the cell are over the regulated threshold or not into consideration
For the HSDPA user when the bandwidth configuration on lub interface is insufficient the admission reject will not happen but the rate will be reduced What is more the AAL2PATHs of HSDPA and R99 are configured respectively and the HSDPA AAL2PATH must be configured to the HSDPA_RT or HSDPA_NRT type If the HSDPA AAL2PATH is configured to RT or NRT of R99 AAL2PATH type the RAB assignment failure will not happen but RNC will establish the HSDPA service as R99 384 Kbps
For the downlink power admission
Besides whether the R99 service load is over the non-HSDPA service threshold DCH service should take into consideration whether non-HSDPA power and HSDPA GBP (the minimum power needed for the guaranteed bit rate) are over the general power threshold of the cell
For the HSDPA service it is necessary to check whether the throughput rate provided by the cell is over the sum of all the usersrsquo GBR thresholds or whether the GBPs of the stream service and the background service are over the HSDPA power of the cell At the same time whether the non-HSDPA power and the HSDPA GBP (the minimum power needed for the guaranteed bit rate) are over the overall power threshold of the cell should be also taken into consideration
For the lub admission
For the DCH service the admission is made according to the multiplication of the peak rate and the service activation factor
For HSDPA service the admission is made according to the GBR
If the lub exceeds the congestion threshold the DCCC rate reduction will be triggered And if the RLC_AM retransmission rate is over a certain threshold the Iub Overbooking switch can be opened to trigger the TF which limits R99 or to reduce the rate of HSDPA service by a certain factor
ZTE Confidential Proprietary copy 2012 ZTE CORPORATION All rights reserved 31
UMTS KPI Optimization Analysis Guide Internal Use Only
4334 RAB Setup Failure Because the UE Fails to Respond to RB Setup
The UE fails to respond to RB setup mainly because of the userrsquos operation
Take the following cases as examples
When the user already has had the downlink 12 K data service he receives RB Setup Request of the VP service (either the originated call in the VP domain or the terminated call in the VP domain) Because the UE does not support the VP and high-speed PS service in the downlink at the same time it directly replies with RB Setup Failure and the cause value is unsupported configuration
Compared with the WCDMA subscriber originating the VP service the terminating subscriber resides in the GSM network and so it does not support the VP service After RNC receives RAB Assignment Request the core network will deliver the Disconnect command right after call proceeding and the cause value is Bearer capability not authorized At this time the UE has just received the RB SETUP command and has no enough time to finish the RB setup So the UE will reply with RB Setup Failure after it receives the Disconnect command and the RNC will reply with RAB Setup Failure with the cause value being failure in radio interface procedure
4335 RAB Setup Failure Because the Uu Interface Fails to Set Up RB
RNC sends the Radio Bearer Setup command to the UE but fails to receive Radio Bearer Setup Compete This kind of situation (RB setup failure) often appears in the cells with weak signals There are two causes of weak signals one is that the UE does not reside in the best server to launch the access and the other is poor coverage
If the UE does not reside in the best server to launch the access it will hope to enter the best server through active set update in the RB setup process (At the same time the fast signal change will drastically weaken the signals in the cell) but the active set update can only be processed after the RB setup is completed because the procedures can not be processed alternately (Neither the network nor the terminal supports it) Therefore RB can only be set up in the cell with weak signals and the setup is easy to fail As for this situation the starting threshold and speed of co-frequency cell reselection should be increased to make the UE reside in the best server and launch the access as soon as possible
RB setup failure may be caused by the poor downlinkuplink coverage If the failure is caused by downlink coverage the UE can not receive the Radio Bearer Setup command which may be caused by the uplink interference and this can be fixed through checking RTWP The poor downlink coverage is partly caused by the bad UE demodulation performance and other causes should be solved by RF optimization
ZTE Confidential Proprietary copy 2012 ZTE CORPORATION All rights reserved 32
UMTS KPI Optimization Analysis Guide Internal Use Only
44 Optimization of Mobility Indicators
Mobility indicators mainly fall into three categories mdash soft handovers hard handovers and inter-RAT handovers The handover problems usually happen in the following cases
The best server changes too fast or there is no best server due to pilot pollution
The handover is not prompt or there are pingpong handovers due to improper parameter configuration
Adjust the engineering parameters for antennas in areas with severe pilot pollution And adjust the handover parameters such as the values of 1A 1B CIO TTT (time to trigger) Hysteresis and so on to solve the problem that the handover is not prompt or there are pingpong handovers This section tries to solve this kind of problems through OMC data analysis and parameter optimization
441 Optimization of Soft Handovers
Missed neighboring cell configuration pilot pollution improper soft handover parameter configuration and equipment malfunctions are the major causes of soft handover failures To confirm the problems the field DTs are required
ZTE Confidential Proprietary copy 2012 ZTE CORPORATION All rights reserved 33
UMTS KPI Optimization Analysis Guide Internal Use Only
4411 Soft Handover Optimization Flowchart
Figure 4-12 Soft handover optimization flowchart
ZTE Confidential Proprietary copy 2012 ZTE CORPORATION All rights reserved 34
UMTS KPI Optimization Analysis Guide Internal Use Only
Extract performance data
TOP Ncell filtering
Analyze a single cell
1 Check NE alarms
2 Associate emergencies
3 Compare parameter
configurations
4 Associate indicators
5 Locate the fault
comprehensive ly
Exist or not
Handle alarms
Solved or not
Yes
Yes
End
No
No
Exist or not
Handle emergencies
Solved or not
Yes
No
No
Exist or not
Correct wrong parameter
configurations
Solved or not
Yes
No
No
List related indicator counters
RTWPResource
limit indicators
Checkamp analysis of interference
Optimization analysis of
resource limitCounters related to intra-frequency
handover failures
C301391101 C301390593C301391102 C301390594C301391103 C301390595C301390586 C301390596C301390587 C301390597C301390588 C301390598C301390589 C301390599C301390590 C301390600C301390591 C301390601C301390592 C301390602
Solved or not
Yes
Yes
No
Drive Test+RNC signaling
trace
Yes
Counters related to soft handover
failures
30055 3005630057 3005830059 3006030061 30062
Cell hand-inhand-out indicators
ZTE Confidential Proprietary copy 2012 ZTE CORPORATION All rights reserved 35
UMTS KPI Optimization Analysis Guide Internal Use Only
4412 Checking Missed Neighboring Cell Configuration
Generally speaking most of the call drops at the beginning of the optimization are caused by missed neighboring cell configuration The following methods are often used to judge whether the call drops are caused by missed configuration of co-frequency neighboring cells
Observe the active set EcIo information recorded by the UE and the Best Server EcIo information recorded by the Scanner before the call drop If the former record is very bad but the latter record is very good then check whether the Best Server scrambling code recorded by the Scanner appears in the latest list of the neighboring cells under intra-frequency measurement control If it does not then the call drop is caused by missed neighboring cell configuration
If the UE re-accesses immediately after the call drop and the cell scrambling codes during the UE reaccess and those during the call drop are different then the call drop may also be caused by missed neighboring cell configuration You can confirm it through measurement control (look backwards from the message of the call drop event for the latest intra-frequency measurement control message and check the neighboring cell list of this message)
Some UE may report the Detected Set information If the corresponding scrambling code appears in the Detected Set information before the call drop then the call drop is caused by missed neighboring cell configuration
4413 Checking Pilot Pollution
Definition of pilot pollution Excessive strong pilot signals exist at a certain point but none of them is strong enough to be the best server To form pilot pollution the following points in this definition should be satisfied
Strong pilot signal The absolute pilot signal strength is used to judge whether the pilot signal is a strong one The pilot signal strength can be evaluated through the pilot RSCP If the pilot RSCP exceeds a threshold it is considered a strong pilot signal The formula is
AbsoluteRSCPThRSCPCPICH __ gt
Excessive The number of pilot signals is used to judge whether there are excessive pilot signals at a certain point If the number exceeds a threshold it is regarded that excessive pilot signals exist at this point The formula is
NThNumberCPICH gt_
None of them is strong enough to be the best server The relative strength of a pilot signal is a key factor in judging whether the pilot signal is strong enough Based on the above definition and formulae if the difference between the strength of the
ZTE Confidential Proprietary copy 2012 ZTE CORPORATION All rights reserved 36
UMTS KPI Optimization Analysis Guide Internal Use Only
strongest pilot signal and that of the )1( +NTh strongest pilot signal at this point is
less than a threshold it is regarded that there is no pilot signal strong enough to be the best server at this point The formula is
lativeRSCPthThbest ThRSCPCPICHRSCPCPICHN Re_)1( )__( ltminus +
According to the above description it is regarded that pilot pollution exists if the following conditions are both satisfied
The number of pilot signals that meet the condition
AbsoluteRSCPThRSCPCPICH __ gt is more than NTh
lativeRSCPthThbest ThRSCPCPICHRSCPCPICHN Re_)1( )__( ltminus +
For example during the network optimization suppose
dBmTh AbsoluteRSCP 95_ minus= 3=NTh and dBTh lativeRSCP 5Re_ = if the following
conditions are both satisfied then it is regarded that pilot pollution exists
The number of the pilot signals that meet the condition
dBmRSCPCPICH 95_ minusgt is more than 3
dBRSCPCPICHRSCPCPICH thbest 5)__( 4 ltminus
4414 Adjusting Soft Handover Algorithm Parameters
You can solve the following kinds of problems by adjusting handover algorithm parameters
1 The handover is not prompt
From the perspective of the CS service signaling flow the symptom of this problem is that the UE cannot receive Active Set Update (physical channel reallocation in the case of the intra-frequency hard handover) because after the UE reports the measurement report the source cell has a fast reduction in EcIo When the RNC sends Active Set Update the UE has closed the transmitter due to the loss of downlink synchronization Viewed from the UE side it cannot receive Active Set Update In the PS services if the UE cannot receive Active Set Update or TRB resets before the handover the handover will also fail
From the perspective of signals the following phenomena may accompany this problem
ZTE Confidential Proprietary copy 2012 ZTE CORPORATION All rights reserved 37
UMTS KPI Optimization Analysis Guide Internal Use Only
minus Corner effect EcIo of the source cell decreases drastically and EcIo of the target cell increases sharply (very high when it appears)
minus Fast fading EcIo of the source cell decreases quickly for a while and then increases and EcIo of the target cell increases for a short while
2 Pingpong handovers The following phenomena may accompany this problem
The best server changes quickly Two or more cells take turns to be the best server But as the best server none of the cells can last long though they has good RSCPs and EcIos
There is no best server There are multiple cells Their RSCPs are normal and similar to each other But EcIo of every cell is very bad
From the perspective of the signaling flow Event 1A is reported immediately after one cell is deleted Because the UE cannot receive Active Set Update from the RNC the handover fails
4415 Equipment Malfunctions
First check the alarm console to see whether there are abnormal alarms and analyze the message traces at the same time Find out in which step the soft handover fails Check the failure message and contact the local product maintaining engineer to confirm whether the equipment has malfunctions
4416 Solutions
Corresponding adjustments should be taken for the confirmed problems
Handover failures caused by pilot pollution Adjust the engineering parameters of a certain antenna to set this antenna as the best server in this interfered location If the power of one of its sectors is reduced then Io of the pilot pollution area will decrease even if the powers of other pilots are not adjusted EcIo will also increase Thereby the EcIo differences with other scrambling codes in the active set will become larger and pilot pollution will be eliminated Through a lot of research ZTE has proved that the reduction in the pilot transmit power will not change cell capacity greatly If condition allows new base stations can be added to cover this area
Equipment malfunctions Consult the customer service engineers and ask them to help check whether there are alarms and whether the transport layer is abnormal If there are alarms coordinate with the customer service engineers and the engineering personnel to solve the problems
Call drops because the handovers are not prompt
ZTE Confidential Proprietary copy 2012 ZTE CORPORATION All rights reserved 38
UMTS KPI Optimization Analysis Guide Internal Use Only
minus Adjust the antenna to expand the handover zone
minus Configure the Event 1A handover parameters to make the handover easier to happen
minus Increase CIO to make the handover happen earlier in the target cell The sum of CIO and the actually measured value is used for judging the UE events including the UE intra-frequency handover CIO helps shift the cell border in the handover algorithm If CIO is configured with a larger value the handover will be easier to happen and there will be more UE in the soft-handover status but more resources will be occupied If CIO is configured with a smaller value the soft handover will be more difficult to happen and the receiving quality may be impaired A CIO of about 5dB is quite good for eliminating the fast fading and the corner effect but this configuration has some side effects such as the increase of handover proportion
Call drops caused by pingpong handovers Adjust the antenna to form a best server in its coverage zone or set the Event 1B handover parameters (increase the threshold of Event 1B the Event 1B hysteresis or the time to trigger Event 1B) to increase the difficulty in deleting the active set
442 Optimization of Hard Handovers
4421 Classification of Hard handovers
Hard handovers mainly fall into two classifications
Intra-frequency hard handovers The intra-frequency hard handover is triggered only when the intra-frequency softsofter handover cannot be performed and it is applicable to the following circumstances
minus Inter-RNC intra-frequency cell handovers when there is no Iur interface
minus Insufficient Iur interface resources though there is the Iur interface
minus Handovers controlled by the threshold of the PS service rate in the handover cell
The intra-frequency softsofter handovers can not be performed (intra-frequency hard handover should be triggered) in the following scenarios
minus When the intra-frequency handover happens the UE is using the transmit diversity in the active set cell but the target cell does not support the transmit diversity
minus The intra-frequency measurement report does not contain OFF and TM of the
ZTE Confidential Proprietary copy 2012 ZTE CORPORATION All rights reserved 39
UMTS KPI Optimization Analysis Guide Internal Use Only
target cell
minus When the intra-frequency handover happens between RNCs the Iur interface is unavailable
minus The UE performs the multiuser detection in the active set cell but the target cell does not support the multiuser detection
minus The target cell and the original cell belong to different classifications (The cells of R99 R5+R99 and R6+R5+R99 belong to the same classification while the cells of R5 and R6+R5 belong to another classification)
Inter-frequency hard handovers The inter-frequency hard handover means a UE connection is handed over from a cell of a UTRAN frequency to a cell of another frequency Many factors including the radio quality the load and the speed of the moving UE may trigger inter-frequency hard handovers
For example the radio quality triggers the inter-frequency hard handover in the following way
When the quality of the UE radio frequency becomes lower the inter-frequency measurement will be triggered and according to the measurement result the UE connection will be handed over to a better frequency
ZTE Confidential Proprietary copy 2012 ZTE CORPORATION All rights reserved 40
UMTS KPI Optimization Analysis Guide Internal Use Only
4422 Hard Handover Optimization Flowchart
Figure 4-13 Hard handover optimization flowchart
ZTE Confidential Proprietary copy 2012 ZTE CORPORATION All rights reserved 41
UMTS KPI Optimization Analysis Guide Internal Use Only
Extract performance data
TOP Ncell filtering
Analyze a single cell
1 Check NE alarms
2 Associate emergencies
3 Compare parameter
configurations
4 Associate indicators
5 Locate the fault
comprehensive ly
Exist or not
Handle alarms
Solved or not
Yes
Yes
End
No
Exist or not
Handle emergencies
Solved or not
YesNo
Exist or not
Correct wrong parameter
configurations
Solved or not
Yes
No
No
List related indicator counters
RTWPResource
limit indicators
Checkamp analysis of interference
Optimization analysis of
resource limit
Counters related to inter-frequency handover failures
C301110489 C301110516C301110499 C301110517C301110500 C301110518C301110501 C301110519C301110502 C301110520C301110503 C301110521C301110504 C301110522C301110505 C301110523
Solved or not
Yes
Yes
No
Drive Test+RNC signaling
trace
Yes
Counters related to hard handover
failures
30041 3004230043 3004430045 3004630047 30048
Cell hand-inhand-out indicators
NoNo
ZTE Confidential Proprietary copy 2012 ZTE CORPORATION All rights reserved 42
UMTS KPI Optimization Analysis Guide Internal Use Only
4423 Hard Handover Optimization Methods
The optimization flow for the hard handover is similar to that of the soft handover The major differences are in the parameter optimization To optimize intra-frequency hard handovers you can properly reduce the Event 1D hysteresis and the time to trigger Event 1D according to the real radio environment to ensure timely handovers
Inter-frequency coverage is often applied to some special scenarios such as indoor coverage and tested through CQT The method of judging whether there is missed configuration of the inter-frequency neighboring cell is almost the same as that of the co-frequency neighboring cell when a call drop occurs the UE fails to measure or report the inter-frequency neighboring cell after the call drop the UE resides in the inter-frequency neighboring cell again
The common hard handover problems are
1 The handover is not prompt The common symptoms are frequent call drops in the hard handovers when the UE moves
Solutions
Increase the threshold of activating the compressing mode The compressing mode is usually activated before the inter-frequency handover or the inter-RAT handover and it is used to measure the quality of the inter-frequency or inter-RAT cell You can set a threshold of the CPICH RSCP or EcIo to activate the compressing mode And the RSCP is widely used
minus Requirements on setting the threshold of activating the compressing mode Before the cell quality becomes low enough to cause a call drop the signal of the target cell should be measured and reported and the handover should be performed
minus Requirement on setting the threshold of deactivating the compression mode Frequent activationdeactivation of the compression mode should be avoided
Increase CIOs of the inter-frequency cell pair
Reduce the threshold of triggering the target frequency handover under the inter-frequency coverage
2 There are pingpong handovers
Solution Increase the hard handover hysteresis and the time to trigger the event
ZTE Confidential Proprietary copy 2012 ZTE CORPORATION All rights reserved 43
UMTS KPI Optimization Analysis Guide Internal Use Only
443 Optimization of Inter-RAT Handovers
4431 Configuring Basic Inter-RAT Parameters
Most of the inter-RAT handover failures are caused by incomplete parameter configuration The following parameters need special attention
Complete RNC parameter configuration for the GSM neighboring cell The 2G system shall provide the 3G system with the correct radio parameters based on negotiation mdash MCC MNC LAC ID (CI) NCC BCC frequency band indicator (900 or 1800) and BCCH
Table 4-3 Parameters That 2G Shall Provide to 3G
MCC MNC LACIDCI
NCC BCCFrequency
band indicator
BCCH
460 2 202 193 0 0 900 102
Complete GSM BSC parameter configuration for the WCDMA neighboring cell The 3G system shall provide the 2G system with the correct radio parameters based on negotiation mdash MCC MNC LAC RNC ID cell ID (C_ID) downlink frequency scrambling code and RAC
Table 4-4 Parameters That 3G Shall Provide to 2G
MCC MNC LACRNC
IDCell IDC_ID
Downlink frequency
Scrambling code
RAC
460 3 20 18 51 10787 51 20
According to the current strategy of one-way inter-RAT handovers if the parameter configuration is complete one probable cause of the inter-RAT handover failure is that the handover is not prompt The common parameter adjustment is to increase CIO the threshold to activatedeactivate the compressing mode and the threshold to trigger the WCDMA-to-GSM handover at the same time
Call drops during the inter-RAT handovers between WCDMA and GSM may be caused by
minus Inconsistent data configuration at the GSM side and the WCDMA side after GSM modifies the configuration data but does not inform WCDMA
minus Missed configuration of neighboring cells which can be solved by the correct configuration of neighboring cells
minus Too fast signal changes
ZTE Confidential Proprietary copy 2012 ZTE CORPORATION All rights reserved 44
UMTS KPI Optimization Analysis Guide Internal Use Only
minus Pingpong reselection
minus Faults with the UE for example the UE fails to respond to the handover or report the inter-RAT measurement report
minus Changes of the best server during the physical channel reallocation
minus Wrong LAC configuration which can be located through data configuration check
ZTE Confidential Proprietary copy 2012 ZTE CORPORATION All rights reserved 45
UMTS KPI Optimization Analysis Guide Internal Use Only
4432 Inter-RAT Handover Optimization Flowchart
Figure 4-14 Inter-RAT handover optimization flowchart
ZTE Confidential Proprietary copy 2012 ZTE CORPORATION All rights reserved 46
UMTS KPI Optimization Analysis Guide Internal Use Only
Extract performance data
TOP Ncell filtering
Analyze a single cell
1 Check NE alarms
2 Associate emergencies
3 Compare parameter
configurations
4 Associate indicators
5 Locate the fault
comprehensive ly
Exist or not
Handle alarms
Solved or not
Yes
Yes
End
No
No
Exist or not
Handle emergencies
Solved or not
Yes
No
No
Exist or not
Correct wrong parameter
configurations
Solved or not
Yes
No
No
List related indicator counters
RTWPResource
limit indicators
Checkamp analysis of interference
Optimization analysis of
resource limitCounters related to inter-RAT handover failures
C301130667 C301130681C301130668 C301130682C301130669 C301130690C301130670 C301130691C301130671 C301130692C301130672 C301130693C301130673 C301130694C301130674 C301130696C301130675 C301130697C301130677 C301130698C301130678 C301130699C301130679 C301130700
C301130680
Solved or not
Yes
Yes
No
Drive Test+RNC signaling
trace
Yes
Counters related to inter-RAT handover
failures
Cell hand-inhand-out indicators
30049 3005030051 3005230053 30054
ZTE Confidential Proprietary copy 2012 ZTE CORPORATION All rights reserved 47
UMTS KPI Optimization Analysis Guide Internal Use Only
45 Optimization of Resource Indicators
The resource indicators directly reflect the system capacity Increasing subscribers will consume more system resources and some resources may be limited for example the code resource may be limited the TCP access request may be rejected and the CE resource usage rate may exceed the threshold Limited system resources have a negative influence on the whole-network indicators and the subscribersrsquo perception for example call drops may frequently happen and more TCP access requests may be rejected during the voice services
Table 4-5 Resource KPIs and Alarm Thresholds
Resource type KPI No and nameAlarm
threshold
TCP
C301320150 Number of rejected services DCH downlink TCP limit
50
PI30167 Average non-HS (SOA) (SOA)DPA TCP 40
PI30092 Maximum Cell TCP () 100
PI30093 Average Cell TCP 70
UL TrafficPI30029 Handover Blocking Rate 05
KPI RTWP (in busy hour) -98 dBm
Code
C301320153 Number of rejected services DCH no code
50
PI30205 Average Cell HSUPA Users 12
PI30172 Cell Average HSDPA Users 16
CE
PI301830006 Maximum use Ratio of Uplink NodeB CE
60
PI301830010 Maximum use Ratio of Downlink NodeB CE
60
ZTE Confidential Proprietary copy 2012 ZTE CORPORATION All rights reserved 48
UMTS KPI Optimization Analysis Guide Internal Use Only
451 Resource Indicator Optimization Flowchart
Figure 4-15 Resource indicator optimization flowchart
ZTE Confidential Proprietary copy 2012 ZTE CORPORATION All rights reserved 49
UMTS KPI Optimization Analysis Guide Internal Use Only
Extract performance data
TOP Ncell filtering
Analyze a single cell
1 Check NE alarms
2 Associate emergencies
3 Compare parameter
configurations
4 Associate indicators
5 Locate the fault
comprehensive ly
Exist or not
Handle alarms
Solved or not
Yes
是
End
No
No
Exist or not
Handle emergencies
Solved or not
Yes
No
No
Exist or not
Correct wrong parameter
configurations
Solved or not
Yes
No
No
List related indicator counters
Code resource indicators
CE resource indicators
TCPadmission
reject counter
C301320150
Solved or not
Yes
Yes
No
Drive Test+RNC signaling
trace
Yes
Counter related to TCP limit
Cell TX power
indicators
30090 3009130092 3009330166 3016730168 3016930170 30171
30163301643016530075
30223302243045030451
Yes
Yes
ZTE Confidential Proprietary copy 2012 ZTE CORPORATION All rights reserved 50
UMTS KPI Optimization Analysis Guide Internal Use Only
452 Code Resource Optimization
The statistics of Number of rejected services and DCH no code the average code resource usage rate and the number of the HSDPA subscribers can be used to judge whether the code resource in a cell is limited If the code resource is limited you can adjust the code resource allocation to alleviate the situation
Based on the system algorithm when Formula 1 is satisfied you can add an HS-PDSCH when Formula 2 is satisfied then an HS-PDSCH is deleted
Formula 1 OcuRateNoHspdsch + OcuRateHspdsch + DpchCodeHy + 32 lt= 512
Formula 2 OcuRateNoHspdsch + OcuRateHspdsch + CodeUptHyA gt 512
OcuRateHspdschHSPDSCH means the number of the codes of SF=512 blocked by the HS-PDSCH OcuRateNoHspdsch means the number of codes of SF=512 blocked by other channels DpchCodeHy means the number of codes of SF=512 reserved for the DPCH and CodeUptHyA is the threshold to decide whether to delete the HSPDSCH
Therefore to ensure the access of the R99 subscribers you can make some adjustment according to Table 4-6 when the code resource is limited though the HSDPA rate may decrease
Table 4-6 Adjusting Code Resource Allocation
AbbreviationParameter
nameRange
and stepCurrent value
Update value
Remark
DpchCodeHy DPCH Code Hysteresis
0512 16 28
To decrease the number of rejected services for DCH no code
CodeUptHyACode Update Hysteresis A
0512 16 28
To decrease the number of rejected services for DCH no code
453 Monitoring CE Resource
The CE resource is mainly monitored through the maximum UE uplinkdownlink usage rate If there is any problem you can solve it by controlling the load or adding more boards
ZTE Confidential Proprietary copy 2012 ZTE CORPORATION All rights reserved 51
UMTS KPI Optimization Analysis Guide Internal Use Only
454 Optimization of Power Control
4541 Monitoring and Optimizing Downlink Power Control
Limited TCP in busy hours will not only increase access failures and call drops in the local cell but also increase soft handover failures and call drops in the neighboring cells Number of rejected services and DCH downlink TCP limit are intuitive KPIs to judge whether TCP is limited Although limited uplink capacity and massive UE moves in the rush hours may also cause call drops the limited TCP is absolutely a key factor
Based on the system algorithm MinHsdpaPower (MinHspaPwrRto) + NoHsPower gtNode B if the safety threshold is used (MinHsdpaPower means the power reserved for HSPA) then it will activate the downlink rate downgrade algorithm flow for the congestion (lower the downlink DCH rate) Although the rate downgrade can ensure access of some subscribers it is an irregular action and will degrade the performance
455 Speeding up Rate Downgrade
Considering that the cells with heavy load reject more access requests you can speed up the rate downgrade during the resource congestion to release the resources as soon as possible and avoid call drops caused by access failures (this method is only applicable to the cells with many PS service users but not those with only CS service users) Table 4-7 is an example of the parameter modification for the rate downgrade
Table 4-7 Example of Parameter Modification for Rate Downgrade
Abbreviation Parameter nameRange and
stepCurrent value
Update value
Remark
UlDnMaxStg Maximum Number of Degraded Uplink Load Steps Every Time
[1 8] 1 2 Downgrade from 384 Kbps to 16 Kbps
DlDnMaxStg Maximum Number of Degraded Downlink Load Steps Every Time
[1 8] 1 3 Downgrade from 384 Kbps to 8 Kbps
456 Monitoring and Optimizing Uplink Capacity
Handover Blocking Rate and RTWP can reflect the uplink capacity of the cell Because interference may also increase RTWP this factor should be distinguished during the RTWP monitoring Another effective indicator is the voice service erl If a cell has over 20 erls in busy hours you should pay special attention to it
ZTE Confidential Proprietary copy 2012 ZTE CORPORATION All rights reserved 52
UMTS KPI Optimization Analysis Guide Internal Use Only
457 Optimization of Uplink Capacity at the Whole Network Level
Case The uplink capacity was limited in a large number of sites after the cutover and the symptoms are a sharp rise of RTWP and a high call drop rate during the rush hours
After the following parameters were modified as shown in Table 4-8 the problem was solved
Table 4-8 Example of Power Control Parameter Modification
AbbreviationParameter
nameRange
Current value
Update value
ULINITSIRUplink Initial SIR target (dB)
UL 34 K136 K signaling UL 122 K AMR
4-5 35
ULMAXSIRMaximum Uplink SIR target (dB)
UL 34 K136 K signaling UL 122 K AMR
15 10
UlSirTargDnStepUplink SIR Target Down Step Size (dB)
UL 34 K136 K signaling UL 122 K AMR
01 02
458 Optimization of Uplink Capacity for a Single Cell
A lot of optimization measures can be taken to bring down the rising RTWP However with increasing subscribers the capacity may still be limited in some area while further modification of SirTarget will obviously degrade the call quality of the whole network and undermine the subscribersrsquo perception In this case you can adjust the power control parameters for a single site that has heavy traffic in the following way add one set of DivPc parameters and use this set of parameters only for this site
Case Table 4-9 shows an example of the power control parameter modification After this modification the call drop rate in the site with heavy traffic decreased to one quarter of the original one
Table 4-9 Example of Power Control Parameter Modification for Heavy-Traffic Cell
SRVTYPE ULINITSIR ULMAXSIR ULMINSIR
0 35-gt15 100-gt35 20-gt10
104 40-gt20 150-gt50 05-gt0
28 35-gt15 100-gt35 05-gt0
50 60-gt20 150-gt50 20-gt0
54 60-gt20 150-gt50 20-gt0
ZTE Confidential Proprietary copy 2012 ZTE CORPORATION All rights reserved 53
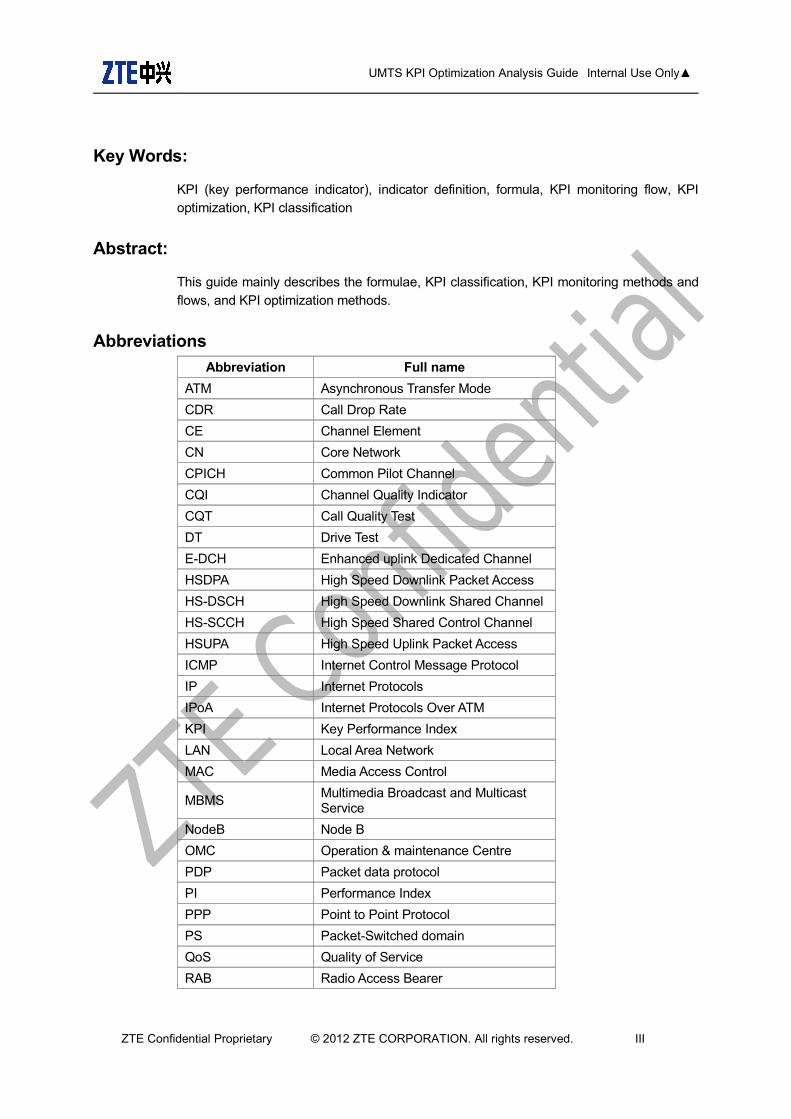
UMTS KPI Optimization Analysis Guide Internal Use Only
Key Words
KPI (key performance indicator) indicator definition formula KPI monitoring flow KPI optimization KPI classification
Abstract
This guide mainly describes the formulae KPI classification KPI monitoring methods and flows and KPI optimization methods
Abbreviations
Abbreviation Full name
ATM Asynchronous Transfer Mode
CDR Call Drop Rate
CE Channel Element
CN Core Network
CPICH Common Pilot Channel
CQI Channel Quality Indicator
CQT Call Quality Test
DT Drive Test
E-DCH Enhanced uplink Dedicated Channel
HSDPA High Speed Downlink Packet Access
HS-DSCH High Speed Downlink Shared Channel
HS-SCCH High Speed Shared Control Channel
HSUPA High Speed Uplink Packet Access
ICMP Internet Control Message Protocol
IP Internet Protocols
IPoA Internet Protocols Over ATM
KPI Key Performance Index
LAN Local Area Network
MAC Media Access Control
MBMSMultimedia Broadcast and Multicast Service
NodeB Node B
OMC Operation amp maintenance Centre
PDP Packet data protocol
PI Performance Index
PPP Point to Point Protocol
PS Packet-Switched domain
QoS Quality of Service
RAB Radio Access Bearer
ZTE Confidential Proprietary copy 2012 ZTE CORPORATION All rights reserved III
UMTS KPI Optimization Analysis Guide Internal Use Only
Abbreviation Full name
RF Radio Frequency
RNC Radio Network Controller
RRC Radio Resource Control
RRU Radio Remote Unit
RSCP Received Signal Code Power
RTWP Received Total Wideband Power
SAAL Signaling ATM Adaptation Layer
SCCP Signaling Connection Control Part
SNR Signal to Noise Ratio
TB Transport Block
TCP Transfer Control Protocol
UDP User Datagram Protocol
UE User Equipment
VIP Very Important People
VP Video Phone
WAN Wide Area Network
ZTE Confidential Proprietary copy 2012 ZTE CORPORATION All rights reserved IV
UMTS KPI Optimization Analysis Guide Internal Use Only
About This Document
Summary
Chapter Description
1 Overview Brief introduction to KPI optimization
2 KPI Monitoring Process KPI monitoring process
3 KPI Analysis Methods Common KPI analysis methods basic KPI analysis skills and general process for KPI optimization analysis
4 KPI Optimization Analysis KPI Optimization Analysis on CS call drops PS call drops accessibility indicators mobility indicators and resource indicators
ZTE Confidential Proprietary copy 2012 ZTE CORPORATION All rights reserved V
UMTS KPI Optimization Analysis Guide Internal Use Only
TABLE OF CONTENTS
1 Overview 1
2 KPI Monitoring Process 2 21 KPI Monitoring Process 2 22 Routine KPI Monitoring Process 2 23 KPI Monitoring Process During Parameter Modification 4 24 KPI Monitoring During RNC or NodeB Version Upgrade 5 25 KPI Monitoring During Cutover 6
3 KPI Analysis Methods 6 31 KPI Analysis Methods 6 311 TOP N Worst Cells Method 7 32 Basic KPI Analysis Skills 10 321 KPI Monitoring Tools 11 322 KPI Analysis Tools 11 33 General Process of KPI Optimization Analysis 12
4 KPI Optimization Analysis 16 41 CS Call Drop Optimization 16 411 Definition of Call Drop 16 412 CS Call Drop Analysis Flowchart 17 42 PS Call Drop Optimization 19 421 Optimization Flowchart 19 43 Optimization of Accessibility Indicators 21 431 Definition of Access Failure 21 432 Analysis on RRC Connection Failures 22 433 Analysis on RABRB Setup Failures 27 44 Optimization of Mobility Indicators 33 441 Optimization of Soft Handovers 33 442 Optimization of Hard Handovers 39 443 Optimization of Inter-RAT Handovers 44 45 Optimization of Resource Indicators 48 451 Resource Indicator Optimization Flowchart 49 452 Code Resource Optimization 51 453 Monitoring CE Resource 51 454 Optimization of Power Control 52 455 Speeding up Rate Downgrade 52 456 Monitoring and Optimizing Uplink Capacity 52 457 Optimization of Uplink Capacity at the Whole Network Level 53 458 Optimization of Uplink Capacity for a Single Cell 53
ZTE Confidential Proprietary copy 2012 ZTE CORPORATION All rights reserved VI
UMTS KPI Optimization Analysis Guide Internal Use Only
FIGURES
Figure 1-1 Joint KPI analysis1
Figure 2-2 Routine KPI monitoring process2
Figure 2-3 KPI monitoring process during parameter modification4
Figure 2-4 KPI monitoring workflow during RNC or NodeB version upgrade5
Figure 3-5 RF configuration at HIC site8
Figure 3-6 Antenna energy distribution at HIC site8
Figure 3-7 KPI optimization analysis process 15
Figure 4-8 CS call drop analysis flowchart17
Figure 4-9 PS call drop optimization flowchart19
Figure 4-10 Analysis flowchart of RRC connection setup failures23
Figure 4-11 Analysis flowchart of RAB setup failures28
Figure 4-12 Soft handover optimization flowchart34
Figure 4-13 Hard handover optimization flowchart41
Figure 4-14 Inter-RAT handover optimization flowchart46
Figure 4-15 Resource indicator optimization flowchart49
TABLES
ZTE Confidential Proprietary copy 2012 ZTE CORPORATION All rights reserved VII
UMTS KPI Optimization Analysis Guide Internal Use Only
Table 3-1 List of CS TOP N Worst Cells7
Table 3-2 Indicators Related with CS Call Drop9
Table 4-3 Parameters That 2G Shall Provide to 3G44
Table 4-4 Parameters That 3G Shall Provide to 2G44
Table 4-5 Resource KPIs and Alarm Thresholds48
Table 4-6 Adjusting Code Resource Allocation51
Table 4-7 Example of Parameter Modification for Rate Downgrade52
Table 4-8 Example of Power Control Parameter Modification53
Table 4-9 Example of Power Control Parameter Modification for Heavy-Traffic Cell 53
ZTE Confidential Proprietary copy 2012 ZTE CORPORATION All rights reserved VIII
UMTS KPI Optimization Analysis Guide Internal Use Only
1 OverviewThe radio network KPIs directly reflect the network quality and KPI monitoring is an important means to locate the faults KPI monitoring and optimization are mostly performed during the network operation and maintenance stage Abnormal events are supposed to be detected as early as possible and handled with proper solutions so that sound voice and data services can be ensured for the subscribers
At the beginning of the network construction the optimization team should put more emphasis on the RF adjustment rather than the optimization of KPIs except for CS call drop rate the PS call drop rate and the RTWP indicator During the network operation and maintenance stage KPI optimization (also called parameter optimization) plays the main role that is the optimization team should optimize a certain indicator through integrated parameter adjustment so as to meet the customerrsquos requirements
KPI data comes from NetNumenT31 the network management system in the operation and maintenance center (OMC) Based on the analysis on KPIs the current states of those indicators are learned and they are important reference for assessing the network performance The KPIs include the network service retaining capacity accessibility mobility system capacity and so on According to the current values of these indicators for example some site has congestion some site has a call drop rate of 10 or some RNC has a certain worst cell proportion busy cell proportion cell code resource availability access success rate call delay and handover success rate the optimization team should judge and locate the area scope and severity of the fault
KPIs are divided into service KPIs and network KPIs by the statistic sources Service KPIs are collected through field drive tests (DTs) while network KPIs are collected from the unified network management system This article mainly discusses the analysis on network KPIs Usually the final solution is made based on the joint analysis on the OMC KPI data alarms subscribersrsquo complaints and DT results
Figure 1-1 Joint KPI analysis
ZTE Confidential Proprietary copy 2012 ZTE CORPORATION All rights reserved 1
Hand to RampD dept or
customer service dept交研发或用
服处理
UMTS KPI Optimization Analysis Guide Internal Use Only
2 KPI Monitoring ProcessThe purpose of KPI monitoring is to find out abnormal events that affect services as well as subscribersrsquo perception and solve the problems as early as possible For instance if the call drop rate at a certain site goes over 50 we need to find the problem and work out the solution in the earliest time
As it is very urgent and important to locate KPI problems we need a whole set of scientific KPI monitoring mechanism and problem shooting process as well as appropriate monitoring tool and analysis tool to help us find the call drops caused by transmission problems resource congestion cells service interruption serious interference hardware fault with NodeB wrong configuration of RNC parameters in time
We classify KPI monitoring into four categories routine KPI monitoring KPI monitoring during the process of parameter modification KPI monitoring during the RNC or NodeB version upgrade and KPI monitoring during the process of cutover Routine KPI monitoring should be performed every day and be recorded in a KPI daily report which should involve the worst CS cell the worst PS cell the cell with the lowest RRC connection rate the cell with the most serious resource limit and so on
21 KPI Monitoring Process
KPI monitoring falls into four categories routine KPI monitoring KPI monitoring during the process of parameter modification KPI monitoring during the version upgrade of RNC or NodeB and KPI monitoring during the process of cutover Each type of monitoring has its own monitoring items and output form For instance the output of the routine KPI monitoring should be a daily report while the output of other KPI monitoring types should be a KPI comparison report Different types of KPI monitoring should have different time granularities according to the requirement of problem location
Routine KPI monitoring should be done persistently and be recorded in a daily report which should include a collection of the cells worst in different aspects and be sent to relevant person by email
22 Routine KPI Monitoring Process
Figure 2-2 Routine KPI monitoring process
ZTE Confidential Proprietary copy 2012 ZTE CORPORATION All rights reserved 2
Hand to RampD dept or
customer service dept交研发或用
服处理
UMTS KPI Optimization Analysis Guide Internal Use Only
ZTE Confidential Proprietary copy 2012 ZTE CORPORATION All rights reserved 3
Parameter problem
Hand to the planning personnel
Classification of the
worst cells
Problem handling team classifies
collects and locates the worst cells
Hand to the network
optimization personnel
Hand to RampD dept or
customer service dept交研发或用
服处理
Send email in fixed format to relevant
personnel
Coverage problem
Equipmentversion problem
Network KPI monitoring
( 15 minutes time granularity)
Screen out the worst cells with
KPI tool
EMS exports the one-day granularity
of the whole network
Output KPI daily report in Excel
UMTS KPI Optimization Analysis Guide Internal Use Only
23 KPI Monitoring Process During Parameter Modification
Figure 2-3 KPI monitoring process during parameter modification
Old parameter configuration
Configure data according to the
worksheet
Network KPI monitoring (15-
minute granularity)
Whether the KPIs at the
RNC level are normal
Keep on monitoring (15-
minute granularity)
Output a report in Word (hourly
granularity KPIs before and after the parameter modification)
End
Yes
Notify the person in charge by mail
or phone
Rollback or not
Locate the worst cells and check if they are caused
by the parameter modification
No
Yes
No
ZTE Confidential Proprietary copy 2012 ZTE CORPORATION All rights reserved 4
Network KPI monitoring
( 15 minutes time granularity)
UMTS KPI Optimization Analysis Guide Internal Use Only
24 KPI Monitoring During RNC or NodeB Version Upgrade
Figure 2-4 KPI monitoring workflow during RNC or NodeB version upgrade
ZTE Confidential Proprietary copy 2012 ZTE CORPORATION All rights reserved 5
Yes
No
No
End
Locate the worst cells Determine whether they are related with the version update
Yes
Network KPI monitoring
( 15 minutes time granularity)
Execute the worksheet to
upgrade version
Output formal Word report (Compare the hourly granularity KPIs before and after the parameter modification and output the result every hour)
Whether the RNC-level
KPI is normal
Keep on monitoring (15 minutes granularity)
Send mail to or call the person in charge
Rollback or not
Current version
UMTS KPI Optimization Analysis Guide Internal Use Only
25 KPI Monitoring During Cutover
For the network on which the equipment needs to be replaced (for instance HongKong CSL network for which we replaced Nokiarsquos equipment with ZTErsquos) after the network optimization is completed the subscribers on the existing network should be cut over to our network gradually During the cutover there will be subscribers registering on our network constantly which will cause load increase on the network In this case we should watch KPI changes closely The monitoring process items method and report are the same as those described in section 24 ldquoKPI Monitoring During RNC or NodeB VersionUpgraderdquo Please read it for reference
3 KPI Analysis Methods
31 KPI Analysis Methods
Different network problems require different performance analysis methods Choose one or more appropriate methods after learning the running state of the existing network and the problems with it Common analysis methods are as follows
TOP N worst cells method Based on the traffic statistics indicators we care about (such as the call drop rate connection rate and soft handoff failure rate) choose N worst cells whose average indicator values in the peak hours or of the whole day are the lowest as the target of fault analysis and optimization Or prioritize objects of optimization against these indicator values
Time tendency chart method Tendency chart of indicator change is commonly used in the traffic analysis The analysis engineer can work out an hourly daily or weekly tendency chart of one or more indicators of the whole network a cluster or a single cell and find out the change rule of traffic statistics indicators
Regional location method The change of network performance indicators often occurs in some regions The indicators in these regions may be worsened by traffic increase traffic mode change radio environment change faults with a small number of stations or uplinkdownlink interference which will therefore affect the performance indicators of the whole network By comparing the network performance indicators before and after the change we can mark out the station or the sector with the greatest indicator change on an electronic map and take these problem regions as the analysis focus
Comparison method A single traffic statistics indicator may be affected by many factors While some factors change others may not Choose a proper object for comparison to confirm the existence of problems and then analyze the causes of the problems When examining an indicator do not care whether the absolute indicator value is high or low only pay more attention to whether the value is high or low compared to other indicators instead
ZTE Confidential Proprietary copy 2012 ZTE CORPORATION All rights reserved 6
UMTS KPI Optimization Analysis Guide Internal Use Only
311 TOP N Worst Cells Method
During the whole process of KPI optimization analysis TOP N worst cells analysis method is the most effective one which can be used throughout the whole optimization phase By focusing on the TOP N worst cells you can solve the major problems with the network Abnormal call drop events may happen every day and these events may represent problems of a kind After solving the problems with TOP N cells you can solve the problems of the same kind Therefore focusing on TOP N cells is one of the most effective ways to solve problems
TOP N worst cells analysis method is applicable to the optimization analysis of all the indicators Choose TOP N worst cells according to a certain threshold which varies depending on different indicators N stands for the number of the worst cells When the worst cells are too many to be worked on the number of the worst cells can be decreased so that you can focus on them TOP N cells analysis method includes the following steps
Step 1 Screen out TOP N cells according to the condition of the indicators you care about
Step 2 Conduct a health check for TOP N cells Check whether there are any problems with transmission or boards and check whether the worst cells are caused by external abrupt incidents such as terrible weather gatherings or holiday (because during gatherings and holidays the traffic is usually heavy)
Step 3 Check the radio parameters configuration of these cells the radius of these cells and their neighboring cells and compare them with the normal cells
Step 4 Export the indicator relevant most closely with the indicators you care about and analyze it to find the problem indirectly
For instance one day CS call drop rate of a whole network was high We analyzed the problem by the TOP N cells analysis method
Step 1 Screen out TOP N cells according to the condition of the indicators you care about
We used the CNO KPI analysis function to screen out TOP N cells (other tools can be also used) and selected 10 cells with the highest CS call drop rate
Table 3-1 List of CS TOP N Worst Cells
Index Cell RNS subnet ID Cell IDCall drop
rate CS AMRNumber of call
drop voice
1 ZBL1U-AI-1 (201) 12911 4158 553
2 ZBL1U-AI-3 (201) 12913 3955 545
3HKE1U-5H-1
(203) 30461 1556 370
ZTE Confidential Proprietary copy 2012 ZTE CORPORATION All rights reserved 7
UMTS KPI Optimization Analysis Guide Internal Use Only
Index Cell RNS subnet ID Cell IDCall drop
rate CS AMRNumber of call
drop voice
4HKE1U-5H-3
(203) 30463 1581 360
5LAK1U-9M-3
(202) 11063 339 282
6 HIC1U-9R-1 RNC101(101) 10891 226 216
7LAK1U-9M-1
(202) 11061 249 215
8EBP1U-9R-3
RNC101(101) 12823 230 205
9SRS1U-5H-1
RNC102-CSL(102)
12091 392 169
10HRM1U-6R-1
RNC102-CSL(102)
20671 341 167
Step 2 Check the transmission and hardware of the TOP N cells and check whether they are caused by external abrupt incidents such as terrible whether gatherings or holidays when traffic is usually heavy
And then we conducted a health check for each cell and paid attention to routine alarms and BPC board problems We found there were broken associations in some HKE sites
Step 3 Check the radio parameters configuration of these cells the radius of these cells and their neighboring cells and compare them with the normal cells
(1)Problem with the cell radius After the check we found the cell radius of the LAK site was 25 km Because the LAK site was situated by the sea and the antenna was placed very high the radius of 25 km was far from enough So we changed the cell radius to 10 km and the problem of high call drop rate was thus solved
(2)Problem with configuration HIC site is an indoor POI site The RRU RxTx port and the RRU Rx port were configured reversely which is the cause of high call drop rate After modifying HIC we found that signals of the second RRU were received by the Rx port So we changed the configuration of the RxTx port and the Rx port the problem of high call drop rate was thus solved
Figure 3-5 RF configuration at HIC site
Figure 3-6 Antenna energy distribution at HIC site
ZTE Confidential Proprietary copy 2012 ZTE CORPORATION All rights reserved 8
UMTS KPI Optimization Analysis Guide Internal Use Only
Step 4 Export the indicator relevant most closely with the indicators you care about and analyze it to find the problem indirectly
Table 3-2 Indicators Related with CS Call Drop
Index Cell
RAB release number for Iu connection
release request by UTRAN for CS domain in
cell radio connection with UE lost
RAB release number for Iu connection
release request by UTRAN for CS domain in cell failure in
the radio Interface
procedure
RAB release number for Iu connection
release request by
UTRAN for CS domain in
cell release due to
overload control
RAB release number for Iu connection
release request by
UTRAN for CS domain in
cell unspecified
failure
Average cell freq RTWP (dbm)
1ZBL1U-AI-1
482 43 0 29 -104177
2ZBL1U-AI-3
473 40 0 33 -104125
3HKE1U-5H-1
346 16 0 8 -105908
4HKE1U-5H-3
330 18 0 13 -1060777
5LAK1U-9M-3
69 196 0 18 -1031906
6HIC1U-9R-1
100 100 0 16 -1015404
7 LAK1U- 64 131 0 20 -1031934
ZTE Confidential Proprietary copy 2012 ZTE CORPORATION All rights reserved 9
UMTS KPI Optimization Analysis Guide Internal Use Only
Index Cell
RAB release number for Iu connection
release request by UTRAN for CS domain in
cell radio connection with UE lost
RAB release number for Iu connection
release request by UTRAN for CS domain in cell failure in
the radio Interface
procedure
RAB release number for Iu connection
release request by
UTRAN for CS domain in
cell release due to
overload control
RAB release number for Iu connection
release request by
UTRAN for CS domain in
cell unspecified
failure
Average cell freq RTWP (dbm)
9M-1
8EBP1U-9R-3
98 90 0 17 -101413
9SRS1U-5H-1
87 59 0 22 -1043528
10HRM1U-6R-1
42 111 0 13 -1027697
32 Basic KPI Analysis Skills
Be able to use the KPI statistics tool and the analysis tool
Use tools to learn about the running state of the whole network quickly and screen out TOP N worst cells quickly
Use different analysis tools to find problems from different aspects and locate the problem quickly
Understand the signaling process and basic principle
In the process of abnormity location keep a clear aim in mind and be able to apply the process and basic principle to check the other relevant indicators rapidly to facilitate the analysis
Be familiar with the process and basic principle and be able to make logical association between abnormal KPI problems and network problems (such as the coverage problem and the interference problem) Be able to determine the problem nature according to the abnormal KPI and then choose the appropriate tool to analyze the problem in depth
Performance analysis requires engineers to understand basic signaling process be familiar with the protocol stacks of standard interfaces and know relevant algorithms to realize the product functions Engineers should at least have a concept about the various algorithms If the analysis of a commercial network involves some algorithms engineers should study these algorithms in depth
ZTE Confidential Proprietary copy 2012 ZTE CORPORATION All rights reserved 10
UMTS KPI Optimization Analysis Guide Internal Use Only
321 KPI Monitoring Tools
minus Network management tool NetNumenT31 count KPI original data alarm data radio parameter configuration in cells and parameter configuration on the earth
minus KPI daily report generating tool classify key indicators according to a certain condition and screen out the worst cells
322 KPI Analysis Tools
minus CNO Tool CNO tool has the KPI analysis function So using it you can screen out the worst cells according to various conditions and point out the corresponding counter of an indicator
minus SignalTrace Trace the signaling (RNL signaling and RNL signaling) of RNC interfaces which includes the Iu interface the Iur interface the Iub interface and the Uu interface (the signaling flow between RNC and UE at RRC layer) And RNL signaling trace is a common way for locating the KPI problem Being able to trace the RNC signaling is a basic requirement for the on-site KPI optimization engineers and the network optimization and maintenance engineers This signaling tracing tool is very powerful which can trace signaling according to the UE cell and IMSI in the KPI analysis According to the UE cell it can trace the signaling of multiple subscribers while according to IMSI it can trace the signaling of only one subscriber However if the RRC connection is not established yet signaling cannot be traced That is because only when RRC connection has been established can the RNC obtain the subscriberrsquos IMSI from the CN
minus RNC ASS Log ASS log is usually applied when there is abnormity and RNC signaling is out of trace In this case use ASS log to analyze the signaling before and after the abnormity occurs Abnormity can be queried according to IMSI or cell ID ASS log can be also used to collect various abnormities
minus NodeB LMT NodeB local operation and maintenance tool Apart from all the operation functions of the OMCB this tool can collect more detailed information about cells and UE NodeB local maintenance terminals include EOMS EFMS DMS and PMS
minus NodeB Abnormity Probe On the site of WCDMA commercial office NodeB abnormity probe is an effective tool to monitor the running state of the NodeB Every module of NodeB can record the abnormal information automatically which makes it easy to locate problems However this method requires professional knowledge such as knowledge about the function and interface of each module or board If the on-site engineers cannot make the simple analysis they can just obtain the abnormity probe and send it to the RampD engineers at the rear side The abnormities reported on the NodeB will be stored at the OMCB server according to different RNCs To conduct NodeB
ZTE Confidential Proprietary copy 2012 ZTE CORPORATION All rights reserved 11
UMTS KPI Optimization Analysis Guide Internal Use Only
abnormity probe analysis you need to download abnormity probe files from different OMCB servers and then use the abnormity probe tool to make a comprehensive analysis
minus CTS Tool CTS is a tool developed by the CN department which can trace signaling in depth according to IMSI and trace signaling across RNCs So this is particularly suitable to trace VIP subscribers In this case CTS is easier to use than SignalTrace which can only trace signaling of RNCs one by one CTS can trace the interactive signaling between network elements (NEs) within the CN as well as the signaling of the Iu interface and the Uu interface This kind of signaling tracing is what we called in-depth tracing The work principle of CTS is to set up an IMSI task on the CTS server and send it to the CN front side which will then send this task to each CN module via the interfaces dedicated to the CN modules and the RNC and then each module after receiving the signaling related to the IMSI task will send the signaling back to the CTS server via the CN front side The interfaces mentioned above are private interfaces so this tool can only support our own CN and RNC CTS signaling can be checked and analyzed with an offline tool but the offline tool does not work very well because of the lack of continuous optimization and perfection
minus UE log DT test is also an important auxiliary way in analyzing KPI indicators There are many problems that cannot be located by tracing signaling at the network side and can only be located by the use of UE log The commonly used drive test software includes QXDMAPEX (QCAT) CNTCAN and TEMS CNTCAN and TEMS are often used for network optimization For the use of CNTCAN please refer to the corresponding help file and the instruction document publicly released by the Network Optimization Tool Department QXDM and the analysis tool APEX (QCAT) provided by Qualcomm is very powerful which have contributed a lot for the stability and maturity of our system for many years
33 General Process of KPI Optimization Analysis
Basic analyzing ideas
KPI optimization is a process to find and solve problems KPI optimization during the operation and maintenance stage is mainly to pick out the performance data that needs special attention from the OMC classify these performance data and then compare the value of these data with that required by the operator If the value of an indicator is lower than the operatorrsquos requirement analyze this indicator and find out the factor that affect the indicator and then propose a solution to the operator If the values are higher than the operatorrsquos requirement therersquos no need to pay special attention to them
KPI analysis is a process from the whole to the part
Step 1 Check the key indicators from the view of the whole network If there is not any
ZTE Confidential Proprietary copy 2012 ZTE CORPORATION All rights reserved 12
UMTS KPI Optimization Analysis Guide Internal Use Only
problem just ignore them Otherwise try to locate the RNC NE that has the problem
Step 2 Analyze the indicators of the corresponding RNC to find out the RNC whose indicators have the problem
Step 3 Analyze the indicators of the cell under the problem RNC to find out the worst cells or TOP N cells If the indicators of all the cells under the RNC are tend to be low it is a common problem probably caused by parameter configuration And then check whether the radio parameter configuration in the cells under this RNC is the same as that in the cells under the normal RNCs
Step 4 Make a comprehensive analysis on the KPIs alarms DT test data and customer complains of the worst cells to find out a solution
Analysis method
After learning the KPI analysis ideas we must know some common KPI analysis methods to rule out causes of problems from the obvious ones to the hidden ones
For example we found that the TCP code words were strictly limited at eight sites near a park and the call drop rate rose suddenly How to solve this problem
Method one First we checked whether the alarms transmission and boards of these sites were normal After they are proved all normal we sent some engineers to the site to do test And meanwhile we traced the RNC signaling at the OMC It turned out that the test result was normal and the indicators of these sites of that day did not have any problem and code words were not limited And later we knew from the news that there was a big gathering of about one million people at the park at that moment Until then we came to know that the congestion was caused by too many users using the network at the same time
Method two First because the eight sites went worse all of a sudden it was unlikely that the problem lied in the hardware Then we checked whether the radio parameters had been modified the day before The result is no worksheet had been issued to modify those parameters and no alarm was found at those sites Therefore we excluded the possibility of hardware problem Then we checked the traffic trend graph of the last few days (over seven days) and found that the high call drop rate might be caused by high traffic The graph showed that traffic of each site rose suddenly on the day before Thus we came to the conclusion that this was an abnormal abrupt event which may have been caused by a gathering And later we were told that there was a big gathering at the park So we were assured the code words limitation and high call drop rate at the eight sites were caused by too many subscribers using the network at the same time
By comparing the two methods above we can find that although the first one (sending engineers to the site without the consideration of abnormal events) is commonly used it is inefficient and costs more resource The second method (analyzing the problem by the means of exclusion and association) is more efficient From this case we would like to emphasize that KPI analysis is a process of problem exclusion Using the comprehensive
ZTE Confidential Proprietary copy 2012 ZTE CORPORATION All rights reserved 13
UMTS KPI Optimization Analysis Guide Internal Use Only
methods (like Method One) at the first brush may be making a detour
minus Exclusion method Check the alarms on the OMC to learn about the state of the RNC NodeB BPC board and the transmission If there are obvious broken link in transmission or hardware problem the cause of the problem is easy to locate
minus Incident association If the problem is with a great number of sites take abrupt incidents into account such as large-scale gathering terrible weather of incorrect operation These incidents will put influence of different levels and ranges on the network indicators
minus Comparison of radio parameters If some site goes wrong in a sudden check whether the radio parameter configuration of this site is consistent with that of other normal sites If not change it as that of the normal sites because the indicator decrease may be caused by an incorrect modification of radio parameters
minus Relevant indicators association If a certain indicator is in poor condition check its relevant indicators and find the common problem from these relevant indicators
minus Comprehensive problem location When the above reasons are excluded use DT data KPI data RNC signaling analysis data to locate the problem with indicators comprehensively
ZTE Confidential Proprietary copy 2012 ZTE CORPORATION All rights reserved 14
UMTS KPI Optimization Analysis Guide Internal Use Only
Figure 3-7 KPI optimization analysis process
StartPick out
performance indexes
RNC index abnormal
Equipment alarms exist
Deal with equipment alarms
RNC index recovers
Common problem with the
worst cells
Transmission softwarehardware version wireless
parameter configuration
CNRNC Transmission
Hardware Software Interference
Wireless parameters
Time range
Abrupt and self-curable abnormality
helliphellip
Analyze and record causes
Suggestion about improvement
Common problems analysis
Problem resolved
Successful call
Call drop Soft handover
23G alternate operation
PS rate helliphellip
Deal with the relevant problem
Indexes normal
End
Climate change holidays assembly
transmission interruption power
fault and so on
Y
N
Y
Y
N
Y
N
Abnormal indexes analysis in one cell
Y
N
N
N
Y
N
Y
Show TOPN abnormal cells
and their locations
If the problem is proved to be equipment bug or system problem after
several attempts feed it back to RampD dept
ZTE Confidential Proprietary copy 2012 ZTE CORPORATION All rights reserved 15
UMTS KPI Optimization Analysis Guide Internal Use Only
4 KPI Optimization Analysis This chapter mainly demonstrates how to analyze the indicator problems from the aspect of OMC data and provides flowcharts for KPI optimization The detailed analyzing method and cases of every special subject can be checked in the optimization guides of all the subjects
41 CS Call Drop Optimization
The CS call drop rate is the most important indicator in KPI optimization
411 Definition of Call Drop
After checking the signaling on the Uu interface at the UE side the engineer can judge the situation a call drop if the Uu interface message satisfies one of the following three conditions during the calling process (in connection)
RNC Release is not received but the UE condition changes from CELL_DCH to IDLE
RRC Release is received and the released cause value is Not Normal
One of the following three messages mdash CC Disconnect CC Release Complete and CC Release mdash is received and the released cause value is Not Normal Clearing or Not Normal Unspecified
In a board sense the call drop includes the call drop rates of CN and UTRAN The call drop of UTRAN includes the following two aspects
After the successful service establishment RNC sends the RAB Release Request to CN
After the successful service establishment RNC sends the IU Release Request to CN Later RNC receives the IU Release Command from CN
Note that RAN call drop statistics which is defined from the aspect of lu interface signaling means the launching times of RAB Release Request and lu Release Request of RNC And the DT call drop statistics is defined from the aspects of the Uu interface message non-access stratum message and cause value RAN call drop statistics and DT call drop statistics are not exactly the same
ZTE Confidential Proprietary copy 2012 ZTE CORPORATION All rights reserved 16
UMTS KPI Optimization Analysis Guide Internal Use Only
412 CS Call Drop Analysis Flowchart
Figure 4-8 CS call drop analysis flowchart
ZTE Confidential Proprietary copy 2012 ZTE CORPORATION All rights reserved 17
UMTS KPI Optimization Analysis Guide Internal Use Only
Extract performance data
CS TOP Ncell filtering
Analyze a single cell
1 Check NE alarms
2 Associate emergencies
3 Compare parameter
configurations
4 Associate indicators
5 Locate the fault
comprehensively
Exist or not
Handle alarms
Solved or not
Yes
Yes
End
No
No
Exist or not
Handle emergencies
Solved or not
Yes
No
No
Exist or not
Correct wrong parameter
configurations
Solved or not
Yes
No
No
List related indicator counters
Call-drop-related
countersRTWP
Handover success rate
Traffic volume
Resource limit indicators
Checkamp analysis of
interference
Optimizationanalysis of
handover failures
Optimization analysis of
resource limitCall-drop-
related counters
C301230362C301230363C301230365C301230315C301230316C301230318C301230319C301230322C301230323
Solved or not
Yes
Yes
No
Drive Test+RNC signaling
trace
Yes
ZTE Confidential Proprietary copy 2012 ZTE CORPORATION All rights reserved 18
UMTS KPI Optimization Analysis Guide Internal Use Only
42 PS Call Drop Optimization
421 Optimization Flowchart
Figure 4-9 PS call drop optimization flowchart
ZTE Confidential Proprietary copy 2012 ZTE CORPORATION All rights reserved 19
UMTS KPI Optimization Analysis Guide Internal Use Only
Extract performance data
PS TOP Ncell filtering
Analyze a single cell
1 Check NE alarms
2 Associate emergencies
3 Compare parameter
configurations
4 Associate indicators
5 Locate the fault
comprehensive ly
Exist or not
Handle alarms
Solved or not
Yes
Yes
End
No
No
Exist or not
Handle emergencies
Solved or not
Yes
No
No
Exist or not
Correct wrong parameter
configurations
Solved or not
Yes
No
No
List related indicator counters
Call -drop-related
countersRTWP
Handover success rate
Traffic volume
Resource limit indicators
Check amp analysis of interference
Optimizationanalysis of
handover failures
Optimization analysis of
resource limitCall -drop-
related counters
C301230372C301230373C301230375C301230330C301230332C301230333C301230334C301230337C301230338
Solved or not
Yes
Yes
No
Drive Test +RNC signaling
trace
Yes
ZTE Confidential Proprietary copy 2012 ZTE CORPORATION All rights reserved 20
UMTS KPI Optimization Analysis Guide Internal Use Only
43 Optimization of Accessibility Indicators
Accessibility performance includes the success rate of RRC connection setup and the success rate of CSPS RAB assignment These two kinds of KPIs play important roles in the network optimization and directly influence the success rate of CSPS service establishment In this document this kind of problems are found from the aspect of OMC data and solved through parameter optimization
431 Definition of Access Failure
For the mobile originated call in the CS domain the access failure event means that the UE sends RRC REQUEST and IE establish cause is Originating Conversational Call but alerting of the direct transfer message is not received
The relevant events are defined as follows in the access failure stage
RRC connection setup failure After considering the resending times and the waiting time the UE sends RRC CONNECTION REQUEST and does not receive the response from RNC or RRC CONNECTION REJECT delivered by RNC
Initial direct transfer and security mode establishment failure After sending RRC CONNECTION SETUP COMPLETE the UE does not send NAS SETUP
RAB assignment failure After receiving CALL PROCEEDING the UE does not receive RB SETUP delivered by RNC Or the UE replies with RB SETUP FAIL after receiving RB SETUP Or the UE receives DISCONNECT with the cause value not being Normal Release after receiving RB SETUP At this time the UE has not reported RB SETUP CMP
Failure after RAB assignment After the UE sends RB SETUP COMPLETE the originating UE receives DISCONNECTRELEASE from CN Or the UE waits CONNECT or ALERTING overtime and launches the Call Clearing process Or the UE becomes IDLE before receiving Alerting and starts to receive the system message
For the mobile terminated in the CS domain the access failure event means that the terminating UE receives the paging of paging type 1 and does not send RRC CONNECTION REQUEST with the cause value being Terminating Conversational Call Or the UE does not send the alerting of direct transfer message to CN after sending RRC CONNECTION REQUEST
The relevant events are defined as follows in the access failure stage
RRC connection setup failure After sending RRC CONNECTION REQUEST the UE does not receive the response from RNC or RRC CONNECTION REJECT delivered by RNC
Initial direct transfer and security mode establishment failure After sending RRC
ZTE Confidential Proprietary copy 2012 ZTE CORPORATION All rights reserved 21
UMTS KPI Optimization Analysis Guide Internal Use Only
CONNECTION SETUP COMPLETE the UE does not receive the SETUP direct transfer message Or the UE sends RELEASE COMPLETE Or the UE receives DISCONNECT from CN
RAB assignment failure The UE does not receive RB SETUP delivered by RNC after sending CALL CONFIRM Or the UE replies with RB SETUP FAIL after receiving RB SETUP Or the UE receives DISCONNECT with the cause value not being Normal Release after receiving RB SETUP At this time the UE has not reported RB SETUP CMP
Failure after RAB assignment After the UE sends RB SETUP COMPLETE the terminating UE receives DISCONNECTRELEASE from CN
432 Analysis on RRC Connection Failures
The problem of RRC connection setup failure can be analyzed through the UE signaling flow and RNC single-user tracing The RRC connection setup includes the following steps
The UE sends RRC Connection Request through the RACH channel
RNC sends RRC Connection Setup through the FACH channel
The UE sends RRC Connection Setup Complete through the dedicated uplink channel after the downlink dedicated channel is established and synchronized
RRC connection setup failures are always caused by following issues
Uplink RACH problem
Problem about downlink FACH power allocation proportion
Parameter reselection problem of the cell
Low downlink dedicated initial transmitting power
Uplink initial power control problem
Congestion
Equipment malfunctions
Among these issues the problems of uplink RACH downlink FACH power allocation proportion parameter reselection of the cell and equipment malfunctions appear more frequently
ZTE Confidential Proprietary copy 2012 ZTE CORPORATION All rights reserved 22
UMTS KPI Optimization Analysis Guide Internal Use Only
4321 Analysis Flowchart of RRC Connection Setup Failures
Figure 4-10 Analysis flowchart of RRC connection setup failures
ZTE Confidential Proprietary copy 2012 ZTE CORPORATION All rights reserved 23
UMTS KPI Optimization Analysis Guide Internal Use Only
Extract performance data
TOP Ncell filtering
Analyze a single cell
1 Check NE alarms
2 Associate emergencies
3 Compare parameter
configurations
4 Associate indicators
5 Locate the fault
comprehensive ly
Exist or not
Handle alarms
Solved or not
Yes
Yes
End
No
No
Exist or not
Handle emergencies
Solved or not
Yes
No
No
Exist or not
Correct wrong parameter
configurations
Solved or not
Yes
No
No
List related indicator counters
Counters related to RRC setup
failuresRTWP
Resource limit
indicators
Checkamp analysis of interference
Optimization analysis of
resource limitCounters related
to RRC setup failures
C301480485C301480486C301480487C301480489C301480490C301480491C301481288C301481289C301481337C301481338C301481339C301481407C301481408
Solved or not
Yes
Yes
No
Drive Test+RNC signaling
trace
Yes
ZTE Confidential Proprietary copy 2012 ZTE CORPORATION All rights reserved 24
UMTS KPI Optimization Analysis Guide Internal Use Only
4322 UE sends RRC Connection Request but RNC does not receive it
If the EcIo of downlink CPICH is relatively low it is the problem of coverage
If the EcIo of downlink CPICH is not very low (for example the value is larger than -14 dB) Usually it is the problem of RACH and the following issues may cause the problem
minus The power of Preamble does not rise to a required value and the rising times of Preamble should be increased
minus The output power of UE is lower than the required value which is caused by poor UE performance In this case the UE should be changed
minus The NodeB equipment has a standing wave and the engineer should check whether NodeB has any SWR alarm
minus The radius of the cell is set improperly If the radius parameter of the cell is set too small the NodeB can not synchronize the UE beyond the range of the radius and the access fails This problem often happens in the places with large coverage such as the rural areas and the suburbs
4323 RNC delivers RRC Connection Reject after receiving RRC Setup Request
When RRC Connection Reject appears the engineer should check the specific reject cause value Usually there are two kinds of causes
The CPU load of RNC control plane board is too heavy and more boards should be added
DCH and FACH admission is rejected However this situation does not always happen
4324 UE does not receive RRC Connection Setup delivered by RNC
This problem may be caused by the following reasons
Poor coverage
Improper parameters of cell selection and reselection
Checking method The engineer should check the EcIo of CPICH If the value is lower than -12 dB (EcIo is -12 dB by default) and there is no cell of better quality in the monitor set the cause of this problem is poor coverage If there is better cell in the monitor set cell reselection may cause this problem
Poor coverage can be improved by coverage enhancement such as adding some sites to cover the places without signal coverage and adjusting the engineering parameters If the coverage can not be improved the engineer can enhance the FACH power according to
ZTE Confidential Proprietary copy 2012 ZTE CORPORATION All rights reserved 25
UMTS KPI Optimization Analysis Guide Internal Use Only
the PCPICH EcIo coverage of the current network For example if all the pilot EcIo values are larger than -12 dB in the coverage area the power proportion of the common channel should be configured on the basis of the situation that the EcIo value is larger than -12 dB And so the success rate of the idle UE assessment can be ensured
As for the access problem caused by cell selection and reselection the engineer can speed up the cell selection and reselection by adjusting the cell selection and reselection parameters and the problem of RRC connection setup failure caused by improper cell selection and reselection parameters can be solved
Note
The RRC Connection Setup message is borne by FACH RRC Connection Request sent by the UE is received by UTRAN at the preamble of PRACH and then it is sent from the RACH channel based on the current preamble power And the transmit power of preamble can rise all the time until the response is received (There is a limitation for the maximum number of preamble retransmissions) Therefore in the areas with poor coverage the RACH coverage and FACH coverage may become unbalanced and as a result UTRAN can receive RRC Connection Request sent by the UE but the UE can not receive RRC Connection Setup sent by RNC
4325 UE receives RRC Connection Setup and does not send RRC Setup Complete
If the downlink signal quality is normal this problem may be caused by the abnormal condition of the cell phone
Another reason of this problem may be the downlink synchronization failure caused by the low initial power of downlink dedicated channel You can solve this problem by adjusting the service downlink EbNo
4326 RNC does not receive RRC Setup Complete sent by UE
Because the uplink initial power control may increase the UE transmit power this kind of problem seldom appears If it appears the engineer can increase the Constant Value of the dedicated channel properly to raise the uplink DPCCH initial transmission power of the UE
At the same time this problem is also relevant with the uplink SIR initial target value configuration because this value may affect the uplink initial synchronization at the initial stage of link setup If the value of the parameter is set too large there will be too much uplink inference brought by the initial setup of the link If the value is set too small the uplink synchronization will take longer time and the initial synchronization may even fail This parameter is an RNC-level parameter which has a great influence on network performance Therefore the engineer should be cautious while adjusting this parameter
ZTE Confidential Proprietary copy 2012 ZTE CORPORATION All rights reserved 26
UMTS KPI Optimization Analysis Guide Internal Use Only
Note
RRC Connection Setup Complete is sent through uplink DPCH and the UE calculates the initial power of uplink DPCCH according to the received IErdquoDPCCH_Power_offsetrdquo and the measured CPICH_RSCP value
DPCCH_Initial_power = DPCCH_Power_offset - CPICH_RSCP
DPCCH_Power_offset = Primary CPICH DL TX Power + UL Interference + Constant Value The Constant Value can be configured in the OMC If this value is set too small the UE may not have enough power to send RRC Connection Setup Complete
433 Analysis on RABRB Setup Failures
When RAB or RB setup fails RNC will send RAB Assignment Fail in the RAB Assignment Response signaling The engineer can find out the specific failure reason from the failure cause value carried in relevant cells The reasons for common RABRB setup failures include
RNC directly rejecting RAB Setup Request because of wrong parameter configuration
Admission reject
RAB setup failure because the UE fails to respond to RB Setup Request
RAB setup failure because the Uu interface fails to set up RB
ZTE Confidential Proprietary copy 2012 ZTE CORPORATION All rights reserved 27
UMTS KPI Optimization Analysis Guide Internal Use Only
4331 Analysis Flowchart of RAB Setup Failures
Figure 4-11 Analysis flowchart of RAB setup failures
ZTE Confidential Proprietary copy 2012 ZTE CORPORATION All rights reserved 28
UMTS KPI Optimization Analysis Guide Internal Use Only
Extract performance data
TOP Ncell filtering
Analyze a single cell
1 Check NE alarms
2 Associate emergencies
3 Compare parameter
configurations
4 Associate indicators
5 Locate the fault
comprehensively
Exist or not
Handle alarms
Solved or not
Yes
Yes
End
No
No
Exist or not
Handle emergencies
Solved or not
Yes
No
No
Exist or not
Correct wrong parameter
configurations
Solved or not
Yes
No
No
List related indicator counters
Counters related to RAB setup failures RTWP
Resource limit
indicators
Checkamp analysis of interference
Optimization analysis of
resource limitCounters related to RAB setup failures
CS domain PS domainC301230290 C301230302C301230291 C301230303C301230292 C301230304C301230293 C301230305C301230294 C301230306C301230295 C301230307C301230296 C301230308C301230297 C301230309C301230298 C301230310C301230299 C301230311C301230300 C301230312C301230301 C301230313
Solved or not
Yes
Yes
No
Drive Test+RNC signaling
trace
Yes
ZTE Confidential Proprietary copy 2012 ZTE CORPORATION All rights reserved 29
UMTS KPI Optimization Analysis Guide Internal Use Only
4332 RNC Directly Rejecting RAB Setup Request Because Of Wrong Parameter Configuration
The case that RNC responds with RAB Setup Failure directly is seldom caused by invalid parameter configuration in the business network Usually this case is caused by special operations of the special users
The main scenario is that the subscription information of the userrsquos PS service is beyond the capability of the UE which leads to the direct refusal from RNC For example a special userrsquos subscription rates of uplink and downlink are 384 K but the maximum uplink rate of the UE is only 64 K The maximum uplink and downlink rates of the QoS message used for activating PDP set by the AT command or mobile terminal software used by the user are 384 K so the RNC will find the maximum uplink rate is beyond the UErsquos capability directly reply with RAB Setup Failure and will not launch the RB setup process when it receives RAB Assignment Request
After the RAB setup fails because the parameter configuration is beyond the UErsquos capability SGSN will negotiate again to launch the new RAB assignment until the UE has the capability to support the assignment and the RAB assignment is finished For the users the PDP activation is still successful and the actual maximum rate is the maximum rate the UE can support
However if the minimum guaranteed bit rate required by the QoS setting in the UErsquos PDP activation request is beyond the UErsquos capability though the network negotiates a lower rate to accept the UErsquos PDP activation request the UE will launch the request of deactivating PDP when it finds that the rate negotiated by the network in PDP activation accept request is lower than the minimum guaranteed bit rate and finally the PDP activation can not be completed
4333 Admission Reject
For the non-HSDPA user if there are insufficient system resources (including power channel code lub transmission resource and CE) the call establishment failure will be caused by the admission reject At this time it is necessary to check the network load code resource lub transmission resource and CE resource occupation to make sure the congestion is caused by the limitation of a certain kind of resource What is more the engineer should plan the corresponding expansion method
If the cell does not support the HSDPA service the R99 user admission is judged according to the fixed R99 admission threshold If the cell supports the HSDPA service and the HSDPA and R99 dynamic power is allocated the uplink admission of non-HSDPA is judged based on RTWP or the equivalent user number If the uplink load is too heavy the non-HSDPA user admission will also fail
If the bandwidth configuration on the lub interface is insufficient the lub interface will reject the R99 data service activation because of limited bandwidth
ZTE Confidential Proprietary copy 2012 ZTE CORPORATION All rights reserved 30
UMTS KPI Optimization Analysis Guide Internal Use Only
The admission control of the NodeB Credit resource is similar to the power admission control Whether the remaining Credit can support the currently requested service or not can be judged according to the spectrum spreading factor of the new access user According to the condition of the RAB Downsizing Switch RNC will deal with the issue in the corresponding way
For the HSDPA user in the dynamic power allocation mode besides the mentioned system resources such as the power channel code lub transmission resource and CE the admission reject should take into consideration whether the number of H users supported by NodeB and the number of H users supported by the cell are over the regulated threshold or not into consideration
For the HSDPA user when the bandwidth configuration on lub interface is insufficient the admission reject will not happen but the rate will be reduced What is more the AAL2PATHs of HSDPA and R99 are configured respectively and the HSDPA AAL2PATH must be configured to the HSDPA_RT or HSDPA_NRT type If the HSDPA AAL2PATH is configured to RT or NRT of R99 AAL2PATH type the RAB assignment failure will not happen but RNC will establish the HSDPA service as R99 384 Kbps
For the downlink power admission
Besides whether the R99 service load is over the non-HSDPA service threshold DCH service should take into consideration whether non-HSDPA power and HSDPA GBP (the minimum power needed for the guaranteed bit rate) are over the general power threshold of the cell
For the HSDPA service it is necessary to check whether the throughput rate provided by the cell is over the sum of all the usersrsquo GBR thresholds or whether the GBPs of the stream service and the background service are over the HSDPA power of the cell At the same time whether the non-HSDPA power and the HSDPA GBP (the minimum power needed for the guaranteed bit rate) are over the overall power threshold of the cell should be also taken into consideration
For the lub admission
For the DCH service the admission is made according to the multiplication of the peak rate and the service activation factor
For HSDPA service the admission is made according to the GBR
If the lub exceeds the congestion threshold the DCCC rate reduction will be triggered And if the RLC_AM retransmission rate is over a certain threshold the Iub Overbooking switch can be opened to trigger the TF which limits R99 or to reduce the rate of HSDPA service by a certain factor
ZTE Confidential Proprietary copy 2012 ZTE CORPORATION All rights reserved 31
UMTS KPI Optimization Analysis Guide Internal Use Only
4334 RAB Setup Failure Because the UE Fails to Respond to RB Setup
The UE fails to respond to RB setup mainly because of the userrsquos operation
Take the following cases as examples
When the user already has had the downlink 12 K data service he receives RB Setup Request of the VP service (either the originated call in the VP domain or the terminated call in the VP domain) Because the UE does not support the VP and high-speed PS service in the downlink at the same time it directly replies with RB Setup Failure and the cause value is unsupported configuration
Compared with the WCDMA subscriber originating the VP service the terminating subscriber resides in the GSM network and so it does not support the VP service After RNC receives RAB Assignment Request the core network will deliver the Disconnect command right after call proceeding and the cause value is Bearer capability not authorized At this time the UE has just received the RB SETUP command and has no enough time to finish the RB setup So the UE will reply with RB Setup Failure after it receives the Disconnect command and the RNC will reply with RAB Setup Failure with the cause value being failure in radio interface procedure
4335 RAB Setup Failure Because the Uu Interface Fails to Set Up RB
RNC sends the Radio Bearer Setup command to the UE but fails to receive Radio Bearer Setup Compete This kind of situation (RB setup failure) often appears in the cells with weak signals There are two causes of weak signals one is that the UE does not reside in the best server to launch the access and the other is poor coverage
If the UE does not reside in the best server to launch the access it will hope to enter the best server through active set update in the RB setup process (At the same time the fast signal change will drastically weaken the signals in the cell) but the active set update can only be processed after the RB setup is completed because the procedures can not be processed alternately (Neither the network nor the terminal supports it) Therefore RB can only be set up in the cell with weak signals and the setup is easy to fail As for this situation the starting threshold and speed of co-frequency cell reselection should be increased to make the UE reside in the best server and launch the access as soon as possible
RB setup failure may be caused by the poor downlinkuplink coverage If the failure is caused by downlink coverage the UE can not receive the Radio Bearer Setup command which may be caused by the uplink interference and this can be fixed through checking RTWP The poor downlink coverage is partly caused by the bad UE demodulation performance and other causes should be solved by RF optimization
ZTE Confidential Proprietary copy 2012 ZTE CORPORATION All rights reserved 32
UMTS KPI Optimization Analysis Guide Internal Use Only
44 Optimization of Mobility Indicators
Mobility indicators mainly fall into three categories mdash soft handovers hard handovers and inter-RAT handovers The handover problems usually happen in the following cases
The best server changes too fast or there is no best server due to pilot pollution
The handover is not prompt or there are pingpong handovers due to improper parameter configuration
Adjust the engineering parameters for antennas in areas with severe pilot pollution And adjust the handover parameters such as the values of 1A 1B CIO TTT (time to trigger) Hysteresis and so on to solve the problem that the handover is not prompt or there are pingpong handovers This section tries to solve this kind of problems through OMC data analysis and parameter optimization
441 Optimization of Soft Handovers
Missed neighboring cell configuration pilot pollution improper soft handover parameter configuration and equipment malfunctions are the major causes of soft handover failures To confirm the problems the field DTs are required
ZTE Confidential Proprietary copy 2012 ZTE CORPORATION All rights reserved 33
UMTS KPI Optimization Analysis Guide Internal Use Only
4411 Soft Handover Optimization Flowchart
Figure 4-12 Soft handover optimization flowchart
ZTE Confidential Proprietary copy 2012 ZTE CORPORATION All rights reserved 34
UMTS KPI Optimization Analysis Guide Internal Use Only
Extract performance data
TOP Ncell filtering
Analyze a single cell
1 Check NE alarms
2 Associate emergencies
3 Compare parameter
configurations
4 Associate indicators
5 Locate the fault
comprehensive ly
Exist or not
Handle alarms
Solved or not
Yes
Yes
End
No
No
Exist or not
Handle emergencies
Solved or not
Yes
No
No
Exist or not
Correct wrong parameter
configurations
Solved or not
Yes
No
No
List related indicator counters
RTWPResource
limit indicators
Checkamp analysis of interference
Optimization analysis of
resource limitCounters related to intra-frequency
handover failures
C301391101 C301390593C301391102 C301390594C301391103 C301390595C301390586 C301390596C301390587 C301390597C301390588 C301390598C301390589 C301390599C301390590 C301390600C301390591 C301390601C301390592 C301390602
Solved or not
Yes
Yes
No
Drive Test+RNC signaling
trace
Yes
Counters related to soft handover
failures
30055 3005630057 3005830059 3006030061 30062
Cell hand-inhand-out indicators
ZTE Confidential Proprietary copy 2012 ZTE CORPORATION All rights reserved 35
UMTS KPI Optimization Analysis Guide Internal Use Only
4412 Checking Missed Neighboring Cell Configuration
Generally speaking most of the call drops at the beginning of the optimization are caused by missed neighboring cell configuration The following methods are often used to judge whether the call drops are caused by missed configuration of co-frequency neighboring cells
Observe the active set EcIo information recorded by the UE and the Best Server EcIo information recorded by the Scanner before the call drop If the former record is very bad but the latter record is very good then check whether the Best Server scrambling code recorded by the Scanner appears in the latest list of the neighboring cells under intra-frequency measurement control If it does not then the call drop is caused by missed neighboring cell configuration
If the UE re-accesses immediately after the call drop and the cell scrambling codes during the UE reaccess and those during the call drop are different then the call drop may also be caused by missed neighboring cell configuration You can confirm it through measurement control (look backwards from the message of the call drop event for the latest intra-frequency measurement control message and check the neighboring cell list of this message)
Some UE may report the Detected Set information If the corresponding scrambling code appears in the Detected Set information before the call drop then the call drop is caused by missed neighboring cell configuration
4413 Checking Pilot Pollution
Definition of pilot pollution Excessive strong pilot signals exist at a certain point but none of them is strong enough to be the best server To form pilot pollution the following points in this definition should be satisfied
Strong pilot signal The absolute pilot signal strength is used to judge whether the pilot signal is a strong one The pilot signal strength can be evaluated through the pilot RSCP If the pilot RSCP exceeds a threshold it is considered a strong pilot signal The formula is
AbsoluteRSCPThRSCPCPICH __ gt
Excessive The number of pilot signals is used to judge whether there are excessive pilot signals at a certain point If the number exceeds a threshold it is regarded that excessive pilot signals exist at this point The formula is
NThNumberCPICH gt_
None of them is strong enough to be the best server The relative strength of a pilot signal is a key factor in judging whether the pilot signal is strong enough Based on the above definition and formulae if the difference between the strength of the
ZTE Confidential Proprietary copy 2012 ZTE CORPORATION All rights reserved 36
UMTS KPI Optimization Analysis Guide Internal Use Only
strongest pilot signal and that of the )1( +NTh strongest pilot signal at this point is
less than a threshold it is regarded that there is no pilot signal strong enough to be the best server at this point The formula is
lativeRSCPthThbest ThRSCPCPICHRSCPCPICHN Re_)1( )__( ltminus +
According to the above description it is regarded that pilot pollution exists if the following conditions are both satisfied
The number of pilot signals that meet the condition
AbsoluteRSCPThRSCPCPICH __ gt is more than NTh
lativeRSCPthThbest ThRSCPCPICHRSCPCPICHN Re_)1( )__( ltminus +
For example during the network optimization suppose
dBmTh AbsoluteRSCP 95_ minus= 3=NTh and dBTh lativeRSCP 5Re_ = if the following
conditions are both satisfied then it is regarded that pilot pollution exists
The number of the pilot signals that meet the condition
dBmRSCPCPICH 95_ minusgt is more than 3
dBRSCPCPICHRSCPCPICH thbest 5)__( 4 ltminus
4414 Adjusting Soft Handover Algorithm Parameters
You can solve the following kinds of problems by adjusting handover algorithm parameters
1 The handover is not prompt
From the perspective of the CS service signaling flow the symptom of this problem is that the UE cannot receive Active Set Update (physical channel reallocation in the case of the intra-frequency hard handover) because after the UE reports the measurement report the source cell has a fast reduction in EcIo When the RNC sends Active Set Update the UE has closed the transmitter due to the loss of downlink synchronization Viewed from the UE side it cannot receive Active Set Update In the PS services if the UE cannot receive Active Set Update or TRB resets before the handover the handover will also fail
From the perspective of signals the following phenomena may accompany this problem
ZTE Confidential Proprietary copy 2012 ZTE CORPORATION All rights reserved 37
UMTS KPI Optimization Analysis Guide Internal Use Only
minus Corner effect EcIo of the source cell decreases drastically and EcIo of the target cell increases sharply (very high when it appears)
minus Fast fading EcIo of the source cell decreases quickly for a while and then increases and EcIo of the target cell increases for a short while
2 Pingpong handovers The following phenomena may accompany this problem
The best server changes quickly Two or more cells take turns to be the best server But as the best server none of the cells can last long though they has good RSCPs and EcIos
There is no best server There are multiple cells Their RSCPs are normal and similar to each other But EcIo of every cell is very bad
From the perspective of the signaling flow Event 1A is reported immediately after one cell is deleted Because the UE cannot receive Active Set Update from the RNC the handover fails
4415 Equipment Malfunctions
First check the alarm console to see whether there are abnormal alarms and analyze the message traces at the same time Find out in which step the soft handover fails Check the failure message and contact the local product maintaining engineer to confirm whether the equipment has malfunctions
4416 Solutions
Corresponding adjustments should be taken for the confirmed problems
Handover failures caused by pilot pollution Adjust the engineering parameters of a certain antenna to set this antenna as the best server in this interfered location If the power of one of its sectors is reduced then Io of the pilot pollution area will decrease even if the powers of other pilots are not adjusted EcIo will also increase Thereby the EcIo differences with other scrambling codes in the active set will become larger and pilot pollution will be eliminated Through a lot of research ZTE has proved that the reduction in the pilot transmit power will not change cell capacity greatly If condition allows new base stations can be added to cover this area
Equipment malfunctions Consult the customer service engineers and ask them to help check whether there are alarms and whether the transport layer is abnormal If there are alarms coordinate with the customer service engineers and the engineering personnel to solve the problems
Call drops because the handovers are not prompt
ZTE Confidential Proprietary copy 2012 ZTE CORPORATION All rights reserved 38
UMTS KPI Optimization Analysis Guide Internal Use Only
minus Adjust the antenna to expand the handover zone
minus Configure the Event 1A handover parameters to make the handover easier to happen
minus Increase CIO to make the handover happen earlier in the target cell The sum of CIO and the actually measured value is used for judging the UE events including the UE intra-frequency handover CIO helps shift the cell border in the handover algorithm If CIO is configured with a larger value the handover will be easier to happen and there will be more UE in the soft-handover status but more resources will be occupied If CIO is configured with a smaller value the soft handover will be more difficult to happen and the receiving quality may be impaired A CIO of about 5dB is quite good for eliminating the fast fading and the corner effect but this configuration has some side effects such as the increase of handover proportion
Call drops caused by pingpong handovers Adjust the antenna to form a best server in its coverage zone or set the Event 1B handover parameters (increase the threshold of Event 1B the Event 1B hysteresis or the time to trigger Event 1B) to increase the difficulty in deleting the active set
442 Optimization of Hard Handovers
4421 Classification of Hard handovers
Hard handovers mainly fall into two classifications
Intra-frequency hard handovers The intra-frequency hard handover is triggered only when the intra-frequency softsofter handover cannot be performed and it is applicable to the following circumstances
minus Inter-RNC intra-frequency cell handovers when there is no Iur interface
minus Insufficient Iur interface resources though there is the Iur interface
minus Handovers controlled by the threshold of the PS service rate in the handover cell
The intra-frequency softsofter handovers can not be performed (intra-frequency hard handover should be triggered) in the following scenarios
minus When the intra-frequency handover happens the UE is using the transmit diversity in the active set cell but the target cell does not support the transmit diversity
minus The intra-frequency measurement report does not contain OFF and TM of the
ZTE Confidential Proprietary copy 2012 ZTE CORPORATION All rights reserved 39
UMTS KPI Optimization Analysis Guide Internal Use Only
target cell
minus When the intra-frequency handover happens between RNCs the Iur interface is unavailable
minus The UE performs the multiuser detection in the active set cell but the target cell does not support the multiuser detection
minus The target cell and the original cell belong to different classifications (The cells of R99 R5+R99 and R6+R5+R99 belong to the same classification while the cells of R5 and R6+R5 belong to another classification)
Inter-frequency hard handovers The inter-frequency hard handover means a UE connection is handed over from a cell of a UTRAN frequency to a cell of another frequency Many factors including the radio quality the load and the speed of the moving UE may trigger inter-frequency hard handovers
For example the radio quality triggers the inter-frequency hard handover in the following way
When the quality of the UE radio frequency becomes lower the inter-frequency measurement will be triggered and according to the measurement result the UE connection will be handed over to a better frequency
ZTE Confidential Proprietary copy 2012 ZTE CORPORATION All rights reserved 40
UMTS KPI Optimization Analysis Guide Internal Use Only
4422 Hard Handover Optimization Flowchart
Figure 4-13 Hard handover optimization flowchart
ZTE Confidential Proprietary copy 2012 ZTE CORPORATION All rights reserved 41
UMTS KPI Optimization Analysis Guide Internal Use Only
Extract performance data
TOP Ncell filtering
Analyze a single cell
1 Check NE alarms
2 Associate emergencies
3 Compare parameter
configurations
4 Associate indicators
5 Locate the fault
comprehensive ly
Exist or not
Handle alarms
Solved or not
Yes
Yes
End
No
Exist or not
Handle emergencies
Solved or not
YesNo
Exist or not
Correct wrong parameter
configurations
Solved or not
Yes
No
No
List related indicator counters
RTWPResource
limit indicators
Checkamp analysis of interference
Optimization analysis of
resource limit
Counters related to inter-frequency handover failures
C301110489 C301110516C301110499 C301110517C301110500 C301110518C301110501 C301110519C301110502 C301110520C301110503 C301110521C301110504 C301110522C301110505 C301110523
Solved or not
Yes
Yes
No
Drive Test+RNC signaling
trace
Yes
Counters related to hard handover
failures
30041 3004230043 3004430045 3004630047 30048
Cell hand-inhand-out indicators
NoNo
ZTE Confidential Proprietary copy 2012 ZTE CORPORATION All rights reserved 42
UMTS KPI Optimization Analysis Guide Internal Use Only
4423 Hard Handover Optimization Methods
The optimization flow for the hard handover is similar to that of the soft handover The major differences are in the parameter optimization To optimize intra-frequency hard handovers you can properly reduce the Event 1D hysteresis and the time to trigger Event 1D according to the real radio environment to ensure timely handovers
Inter-frequency coverage is often applied to some special scenarios such as indoor coverage and tested through CQT The method of judging whether there is missed configuration of the inter-frequency neighboring cell is almost the same as that of the co-frequency neighboring cell when a call drop occurs the UE fails to measure or report the inter-frequency neighboring cell after the call drop the UE resides in the inter-frequency neighboring cell again
The common hard handover problems are
1 The handover is not prompt The common symptoms are frequent call drops in the hard handovers when the UE moves
Solutions
Increase the threshold of activating the compressing mode The compressing mode is usually activated before the inter-frequency handover or the inter-RAT handover and it is used to measure the quality of the inter-frequency or inter-RAT cell You can set a threshold of the CPICH RSCP or EcIo to activate the compressing mode And the RSCP is widely used
minus Requirements on setting the threshold of activating the compressing mode Before the cell quality becomes low enough to cause a call drop the signal of the target cell should be measured and reported and the handover should be performed
minus Requirement on setting the threshold of deactivating the compression mode Frequent activationdeactivation of the compression mode should be avoided
Increase CIOs of the inter-frequency cell pair
Reduce the threshold of triggering the target frequency handover under the inter-frequency coverage
2 There are pingpong handovers
Solution Increase the hard handover hysteresis and the time to trigger the event
ZTE Confidential Proprietary copy 2012 ZTE CORPORATION All rights reserved 43
UMTS KPI Optimization Analysis Guide Internal Use Only
443 Optimization of Inter-RAT Handovers
4431 Configuring Basic Inter-RAT Parameters
Most of the inter-RAT handover failures are caused by incomplete parameter configuration The following parameters need special attention
Complete RNC parameter configuration for the GSM neighboring cell The 2G system shall provide the 3G system with the correct radio parameters based on negotiation mdash MCC MNC LAC ID (CI) NCC BCC frequency band indicator (900 or 1800) and BCCH
Table 4-3 Parameters That 2G Shall Provide to 3G
MCC MNC LACIDCI
NCC BCCFrequency
band indicator
BCCH
460 2 202 193 0 0 900 102
Complete GSM BSC parameter configuration for the WCDMA neighboring cell The 3G system shall provide the 2G system with the correct radio parameters based on negotiation mdash MCC MNC LAC RNC ID cell ID (C_ID) downlink frequency scrambling code and RAC
Table 4-4 Parameters That 3G Shall Provide to 2G
MCC MNC LACRNC
IDCell IDC_ID
Downlink frequency
Scrambling code
RAC
460 3 20 18 51 10787 51 20
According to the current strategy of one-way inter-RAT handovers if the parameter configuration is complete one probable cause of the inter-RAT handover failure is that the handover is not prompt The common parameter adjustment is to increase CIO the threshold to activatedeactivate the compressing mode and the threshold to trigger the WCDMA-to-GSM handover at the same time
Call drops during the inter-RAT handovers between WCDMA and GSM may be caused by
minus Inconsistent data configuration at the GSM side and the WCDMA side after GSM modifies the configuration data but does not inform WCDMA
minus Missed configuration of neighboring cells which can be solved by the correct configuration of neighboring cells
minus Too fast signal changes
ZTE Confidential Proprietary copy 2012 ZTE CORPORATION All rights reserved 44
UMTS KPI Optimization Analysis Guide Internal Use Only
minus Pingpong reselection
minus Faults with the UE for example the UE fails to respond to the handover or report the inter-RAT measurement report
minus Changes of the best server during the physical channel reallocation
minus Wrong LAC configuration which can be located through data configuration check
ZTE Confidential Proprietary copy 2012 ZTE CORPORATION All rights reserved 45
UMTS KPI Optimization Analysis Guide Internal Use Only
4432 Inter-RAT Handover Optimization Flowchart
Figure 4-14 Inter-RAT handover optimization flowchart
ZTE Confidential Proprietary copy 2012 ZTE CORPORATION All rights reserved 46
UMTS KPI Optimization Analysis Guide Internal Use Only
Extract performance data
TOP Ncell filtering
Analyze a single cell
1 Check NE alarms
2 Associate emergencies
3 Compare parameter
configurations
4 Associate indicators
5 Locate the fault
comprehensive ly
Exist or not
Handle alarms
Solved or not
Yes
Yes
End
No
No
Exist or not
Handle emergencies
Solved or not
Yes
No
No
Exist or not
Correct wrong parameter
configurations
Solved or not
Yes
No
No
List related indicator counters
RTWPResource
limit indicators
Checkamp analysis of interference
Optimization analysis of
resource limitCounters related to inter-RAT handover failures
C301130667 C301130681C301130668 C301130682C301130669 C301130690C301130670 C301130691C301130671 C301130692C301130672 C301130693C301130673 C301130694C301130674 C301130696C301130675 C301130697C301130677 C301130698C301130678 C301130699C301130679 C301130700
C301130680
Solved or not
Yes
Yes
No
Drive Test+RNC signaling
trace
Yes
Counters related to inter-RAT handover
failures
Cell hand-inhand-out indicators
30049 3005030051 3005230053 30054
ZTE Confidential Proprietary copy 2012 ZTE CORPORATION All rights reserved 47
UMTS KPI Optimization Analysis Guide Internal Use Only
45 Optimization of Resource Indicators
The resource indicators directly reflect the system capacity Increasing subscribers will consume more system resources and some resources may be limited for example the code resource may be limited the TCP access request may be rejected and the CE resource usage rate may exceed the threshold Limited system resources have a negative influence on the whole-network indicators and the subscribersrsquo perception for example call drops may frequently happen and more TCP access requests may be rejected during the voice services
Table 4-5 Resource KPIs and Alarm Thresholds
Resource type KPI No and nameAlarm
threshold
TCP
C301320150 Number of rejected services DCH downlink TCP limit
50
PI30167 Average non-HS (SOA) (SOA)DPA TCP 40
PI30092 Maximum Cell TCP () 100
PI30093 Average Cell TCP 70
UL TrafficPI30029 Handover Blocking Rate 05
KPI RTWP (in busy hour) -98 dBm
Code
C301320153 Number of rejected services DCH no code
50
PI30205 Average Cell HSUPA Users 12
PI30172 Cell Average HSDPA Users 16
CE
PI301830006 Maximum use Ratio of Uplink NodeB CE
60
PI301830010 Maximum use Ratio of Downlink NodeB CE
60
ZTE Confidential Proprietary copy 2012 ZTE CORPORATION All rights reserved 48
UMTS KPI Optimization Analysis Guide Internal Use Only
451 Resource Indicator Optimization Flowchart
Figure 4-15 Resource indicator optimization flowchart
ZTE Confidential Proprietary copy 2012 ZTE CORPORATION All rights reserved 49
UMTS KPI Optimization Analysis Guide Internal Use Only
Extract performance data
TOP Ncell filtering
Analyze a single cell
1 Check NE alarms
2 Associate emergencies
3 Compare parameter
configurations
4 Associate indicators
5 Locate the fault
comprehensive ly
Exist or not
Handle alarms
Solved or not
Yes
是
End
No
No
Exist or not
Handle emergencies
Solved or not
Yes
No
No
Exist or not
Correct wrong parameter
configurations
Solved or not
Yes
No
No
List related indicator counters
Code resource indicators
CE resource indicators
TCPadmission
reject counter
C301320150
Solved or not
Yes
Yes
No
Drive Test+RNC signaling
trace
Yes
Counter related to TCP limit
Cell TX power
indicators
30090 3009130092 3009330166 3016730168 3016930170 30171
30163301643016530075
30223302243045030451
Yes
Yes
ZTE Confidential Proprietary copy 2012 ZTE CORPORATION All rights reserved 50
UMTS KPI Optimization Analysis Guide Internal Use Only
452 Code Resource Optimization
The statistics of Number of rejected services and DCH no code the average code resource usage rate and the number of the HSDPA subscribers can be used to judge whether the code resource in a cell is limited If the code resource is limited you can adjust the code resource allocation to alleviate the situation
Based on the system algorithm when Formula 1 is satisfied you can add an HS-PDSCH when Formula 2 is satisfied then an HS-PDSCH is deleted
Formula 1 OcuRateNoHspdsch + OcuRateHspdsch + DpchCodeHy + 32 lt= 512
Formula 2 OcuRateNoHspdsch + OcuRateHspdsch + CodeUptHyA gt 512
OcuRateHspdschHSPDSCH means the number of the codes of SF=512 blocked by the HS-PDSCH OcuRateNoHspdsch means the number of codes of SF=512 blocked by other channels DpchCodeHy means the number of codes of SF=512 reserved for the DPCH and CodeUptHyA is the threshold to decide whether to delete the HSPDSCH
Therefore to ensure the access of the R99 subscribers you can make some adjustment according to Table 4-6 when the code resource is limited though the HSDPA rate may decrease
Table 4-6 Adjusting Code Resource Allocation
AbbreviationParameter
nameRange
and stepCurrent value
Update value
Remark
DpchCodeHy DPCH Code Hysteresis
0512 16 28
To decrease the number of rejected services for DCH no code
CodeUptHyACode Update Hysteresis A
0512 16 28
To decrease the number of rejected services for DCH no code
453 Monitoring CE Resource
The CE resource is mainly monitored through the maximum UE uplinkdownlink usage rate If there is any problem you can solve it by controlling the load or adding more boards
ZTE Confidential Proprietary copy 2012 ZTE CORPORATION All rights reserved 51
UMTS KPI Optimization Analysis Guide Internal Use Only
454 Optimization of Power Control
4541 Monitoring and Optimizing Downlink Power Control
Limited TCP in busy hours will not only increase access failures and call drops in the local cell but also increase soft handover failures and call drops in the neighboring cells Number of rejected services and DCH downlink TCP limit are intuitive KPIs to judge whether TCP is limited Although limited uplink capacity and massive UE moves in the rush hours may also cause call drops the limited TCP is absolutely a key factor
Based on the system algorithm MinHsdpaPower (MinHspaPwrRto) + NoHsPower gtNode B if the safety threshold is used (MinHsdpaPower means the power reserved for HSPA) then it will activate the downlink rate downgrade algorithm flow for the congestion (lower the downlink DCH rate) Although the rate downgrade can ensure access of some subscribers it is an irregular action and will degrade the performance
455 Speeding up Rate Downgrade
Considering that the cells with heavy load reject more access requests you can speed up the rate downgrade during the resource congestion to release the resources as soon as possible and avoid call drops caused by access failures (this method is only applicable to the cells with many PS service users but not those with only CS service users) Table 4-7 is an example of the parameter modification for the rate downgrade
Table 4-7 Example of Parameter Modification for Rate Downgrade
Abbreviation Parameter nameRange and
stepCurrent value
Update value
Remark
UlDnMaxStg Maximum Number of Degraded Uplink Load Steps Every Time
[1 8] 1 2 Downgrade from 384 Kbps to 16 Kbps
DlDnMaxStg Maximum Number of Degraded Downlink Load Steps Every Time
[1 8] 1 3 Downgrade from 384 Kbps to 8 Kbps
456 Monitoring and Optimizing Uplink Capacity
Handover Blocking Rate and RTWP can reflect the uplink capacity of the cell Because interference may also increase RTWP this factor should be distinguished during the RTWP monitoring Another effective indicator is the voice service erl If a cell has over 20 erls in busy hours you should pay special attention to it
ZTE Confidential Proprietary copy 2012 ZTE CORPORATION All rights reserved 52
UMTS KPI Optimization Analysis Guide Internal Use Only
457 Optimization of Uplink Capacity at the Whole Network Level
Case The uplink capacity was limited in a large number of sites after the cutover and the symptoms are a sharp rise of RTWP and a high call drop rate during the rush hours
After the following parameters were modified as shown in Table 4-8 the problem was solved
Table 4-8 Example of Power Control Parameter Modification
AbbreviationParameter
nameRange
Current value
Update value
ULINITSIRUplink Initial SIR target (dB)
UL 34 K136 K signaling UL 122 K AMR
4-5 35
ULMAXSIRMaximum Uplink SIR target (dB)
UL 34 K136 K signaling UL 122 K AMR
15 10
UlSirTargDnStepUplink SIR Target Down Step Size (dB)
UL 34 K136 K signaling UL 122 K AMR
01 02
458 Optimization of Uplink Capacity for a Single Cell
A lot of optimization measures can be taken to bring down the rising RTWP However with increasing subscribers the capacity may still be limited in some area while further modification of SirTarget will obviously degrade the call quality of the whole network and undermine the subscribersrsquo perception In this case you can adjust the power control parameters for a single site that has heavy traffic in the following way add one set of DivPc parameters and use this set of parameters only for this site
Case Table 4-9 shows an example of the power control parameter modification After this modification the call drop rate in the site with heavy traffic decreased to one quarter of the original one
Table 4-9 Example of Power Control Parameter Modification for Heavy-Traffic Cell
SRVTYPE ULINITSIR ULMAXSIR ULMINSIR
0 35-gt15 100-gt35 20-gt10
104 40-gt20 150-gt50 05-gt0
28 35-gt15 100-gt35 05-gt0
50 60-gt20 150-gt50 20-gt0
54 60-gt20 150-gt50 20-gt0
ZTE Confidential Proprietary copy 2012 ZTE CORPORATION All rights reserved 53
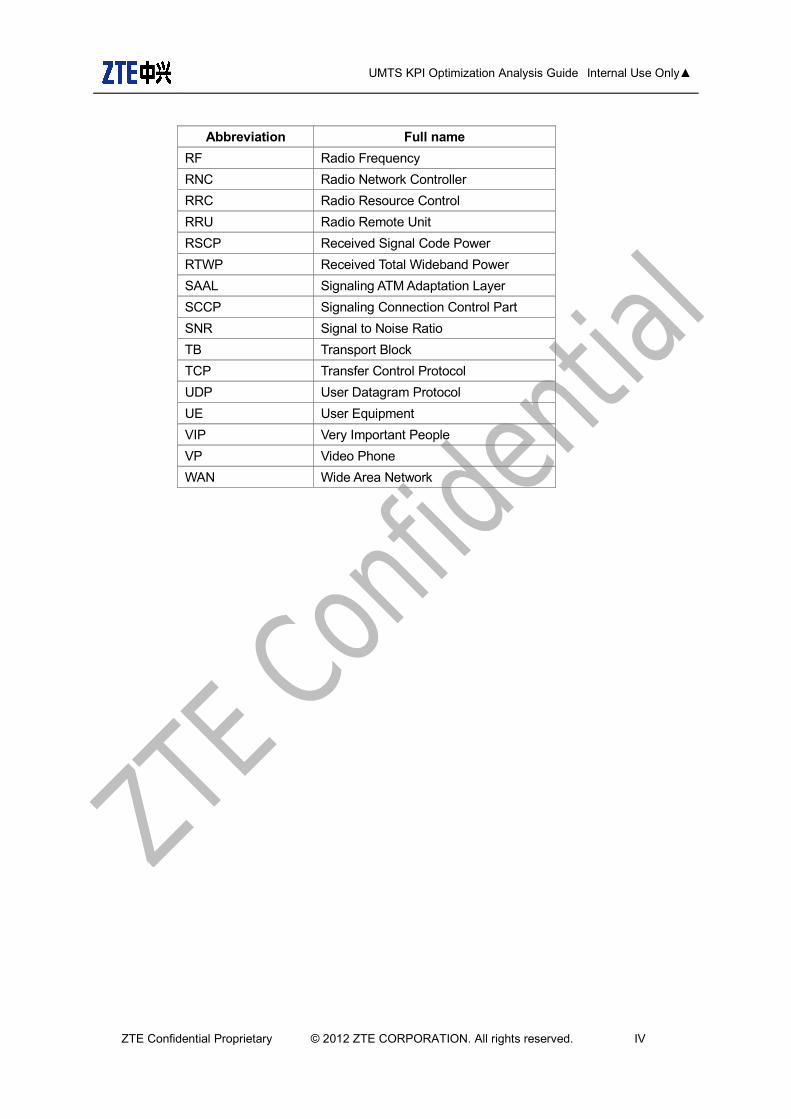
UMTS KPI Optimization Analysis Guide Internal Use Only
Abbreviation Full name
RF Radio Frequency
RNC Radio Network Controller
RRC Radio Resource Control
RRU Radio Remote Unit
RSCP Received Signal Code Power
RTWP Received Total Wideband Power
SAAL Signaling ATM Adaptation Layer
SCCP Signaling Connection Control Part
SNR Signal to Noise Ratio
TB Transport Block
TCP Transfer Control Protocol
UDP User Datagram Protocol
UE User Equipment
VIP Very Important People
VP Video Phone
WAN Wide Area Network
ZTE Confidential Proprietary copy 2012 ZTE CORPORATION All rights reserved IV
UMTS KPI Optimization Analysis Guide Internal Use Only
About This Document
Summary
Chapter Description
1 Overview Brief introduction to KPI optimization
2 KPI Monitoring Process KPI monitoring process
3 KPI Analysis Methods Common KPI analysis methods basic KPI analysis skills and general process for KPI optimization analysis
4 KPI Optimization Analysis KPI Optimization Analysis on CS call drops PS call drops accessibility indicators mobility indicators and resource indicators
ZTE Confidential Proprietary copy 2012 ZTE CORPORATION All rights reserved V
UMTS KPI Optimization Analysis Guide Internal Use Only
TABLE OF CONTENTS
1 Overview 1
2 KPI Monitoring Process 2 21 KPI Monitoring Process 2 22 Routine KPI Monitoring Process 2 23 KPI Monitoring Process During Parameter Modification 4 24 KPI Monitoring During RNC or NodeB Version Upgrade 5 25 KPI Monitoring During Cutover 6
3 KPI Analysis Methods 6 31 KPI Analysis Methods 6 311 TOP N Worst Cells Method 7 32 Basic KPI Analysis Skills 10 321 KPI Monitoring Tools 11 322 KPI Analysis Tools 11 33 General Process of KPI Optimization Analysis 12
4 KPI Optimization Analysis 16 41 CS Call Drop Optimization 16 411 Definition of Call Drop 16 412 CS Call Drop Analysis Flowchart 17 42 PS Call Drop Optimization 19 421 Optimization Flowchart 19 43 Optimization of Accessibility Indicators 21 431 Definition of Access Failure 21 432 Analysis on RRC Connection Failures 22 433 Analysis on RABRB Setup Failures 27 44 Optimization of Mobility Indicators 33 441 Optimization of Soft Handovers 33 442 Optimization of Hard Handovers 39 443 Optimization of Inter-RAT Handovers 44 45 Optimization of Resource Indicators 48 451 Resource Indicator Optimization Flowchart 49 452 Code Resource Optimization 51 453 Monitoring CE Resource 51 454 Optimization of Power Control 52 455 Speeding up Rate Downgrade 52 456 Monitoring and Optimizing Uplink Capacity 52 457 Optimization of Uplink Capacity at the Whole Network Level 53 458 Optimization of Uplink Capacity for a Single Cell 53
ZTE Confidential Proprietary copy 2012 ZTE CORPORATION All rights reserved VI
UMTS KPI Optimization Analysis Guide Internal Use Only
FIGURES
Figure 1-1 Joint KPI analysis1
Figure 2-2 Routine KPI monitoring process2
Figure 2-3 KPI monitoring process during parameter modification4
Figure 2-4 KPI monitoring workflow during RNC or NodeB version upgrade5
Figure 3-5 RF configuration at HIC site8
Figure 3-6 Antenna energy distribution at HIC site8
Figure 3-7 KPI optimization analysis process 15
Figure 4-8 CS call drop analysis flowchart17
Figure 4-9 PS call drop optimization flowchart19
Figure 4-10 Analysis flowchart of RRC connection setup failures23
Figure 4-11 Analysis flowchart of RAB setup failures28
Figure 4-12 Soft handover optimization flowchart34
Figure 4-13 Hard handover optimization flowchart41
Figure 4-14 Inter-RAT handover optimization flowchart46
Figure 4-15 Resource indicator optimization flowchart49
TABLES
ZTE Confidential Proprietary copy 2012 ZTE CORPORATION All rights reserved VII
UMTS KPI Optimization Analysis Guide Internal Use Only
Table 3-1 List of CS TOP N Worst Cells7
Table 3-2 Indicators Related with CS Call Drop9
Table 4-3 Parameters That 2G Shall Provide to 3G44
Table 4-4 Parameters That 3G Shall Provide to 2G44
Table 4-5 Resource KPIs and Alarm Thresholds48
Table 4-6 Adjusting Code Resource Allocation51
Table 4-7 Example of Parameter Modification for Rate Downgrade52
Table 4-8 Example of Power Control Parameter Modification53
Table 4-9 Example of Power Control Parameter Modification for Heavy-Traffic Cell 53
ZTE Confidential Proprietary copy 2012 ZTE CORPORATION All rights reserved VIII
UMTS KPI Optimization Analysis Guide Internal Use Only
1 OverviewThe radio network KPIs directly reflect the network quality and KPI monitoring is an important means to locate the faults KPI monitoring and optimization are mostly performed during the network operation and maintenance stage Abnormal events are supposed to be detected as early as possible and handled with proper solutions so that sound voice and data services can be ensured for the subscribers
At the beginning of the network construction the optimization team should put more emphasis on the RF adjustment rather than the optimization of KPIs except for CS call drop rate the PS call drop rate and the RTWP indicator During the network operation and maintenance stage KPI optimization (also called parameter optimization) plays the main role that is the optimization team should optimize a certain indicator through integrated parameter adjustment so as to meet the customerrsquos requirements
KPI data comes from NetNumenT31 the network management system in the operation and maintenance center (OMC) Based on the analysis on KPIs the current states of those indicators are learned and they are important reference for assessing the network performance The KPIs include the network service retaining capacity accessibility mobility system capacity and so on According to the current values of these indicators for example some site has congestion some site has a call drop rate of 10 or some RNC has a certain worst cell proportion busy cell proportion cell code resource availability access success rate call delay and handover success rate the optimization team should judge and locate the area scope and severity of the fault
KPIs are divided into service KPIs and network KPIs by the statistic sources Service KPIs are collected through field drive tests (DTs) while network KPIs are collected from the unified network management system This article mainly discusses the analysis on network KPIs Usually the final solution is made based on the joint analysis on the OMC KPI data alarms subscribersrsquo complaints and DT results
Figure 1-1 Joint KPI analysis
ZTE Confidential Proprietary copy 2012 ZTE CORPORATION All rights reserved 1
Hand to RampD dept or
customer service dept交研发或用
服处理
UMTS KPI Optimization Analysis Guide Internal Use Only
2 KPI Monitoring ProcessThe purpose of KPI monitoring is to find out abnormal events that affect services as well as subscribersrsquo perception and solve the problems as early as possible For instance if the call drop rate at a certain site goes over 50 we need to find the problem and work out the solution in the earliest time
As it is very urgent and important to locate KPI problems we need a whole set of scientific KPI monitoring mechanism and problem shooting process as well as appropriate monitoring tool and analysis tool to help us find the call drops caused by transmission problems resource congestion cells service interruption serious interference hardware fault with NodeB wrong configuration of RNC parameters in time
We classify KPI monitoring into four categories routine KPI monitoring KPI monitoring during the process of parameter modification KPI monitoring during the RNC or NodeB version upgrade and KPI monitoring during the process of cutover Routine KPI monitoring should be performed every day and be recorded in a KPI daily report which should involve the worst CS cell the worst PS cell the cell with the lowest RRC connection rate the cell with the most serious resource limit and so on
21 KPI Monitoring Process
KPI monitoring falls into four categories routine KPI monitoring KPI monitoring during the process of parameter modification KPI monitoring during the version upgrade of RNC or NodeB and KPI monitoring during the process of cutover Each type of monitoring has its own monitoring items and output form For instance the output of the routine KPI monitoring should be a daily report while the output of other KPI monitoring types should be a KPI comparison report Different types of KPI monitoring should have different time granularities according to the requirement of problem location
Routine KPI monitoring should be done persistently and be recorded in a daily report which should include a collection of the cells worst in different aspects and be sent to relevant person by email
22 Routine KPI Monitoring Process
Figure 2-2 Routine KPI monitoring process
ZTE Confidential Proprietary copy 2012 ZTE CORPORATION All rights reserved 2
Hand to RampD dept or
customer service dept交研发或用
服处理
UMTS KPI Optimization Analysis Guide Internal Use Only
ZTE Confidential Proprietary copy 2012 ZTE CORPORATION All rights reserved 3
Parameter problem
Hand to the planning personnel
Classification of the
worst cells
Problem handling team classifies
collects and locates the worst cells
Hand to the network
optimization personnel
Hand to RampD dept or
customer service dept交研发或用
服处理
Send email in fixed format to relevant
personnel
Coverage problem
Equipmentversion problem
Network KPI monitoring
( 15 minutes time granularity)
Screen out the worst cells with
KPI tool
EMS exports the one-day granularity
of the whole network
Output KPI daily report in Excel
UMTS KPI Optimization Analysis Guide Internal Use Only
23 KPI Monitoring Process During Parameter Modification
Figure 2-3 KPI monitoring process during parameter modification
Old parameter configuration
Configure data according to the
worksheet
Network KPI monitoring (15-
minute granularity)
Whether the KPIs at the
RNC level are normal
Keep on monitoring (15-
minute granularity)
Output a report in Word (hourly
granularity KPIs before and after the parameter modification)
End
Yes
Notify the person in charge by mail
or phone
Rollback or not
Locate the worst cells and check if they are caused
by the parameter modification
No
Yes
No
ZTE Confidential Proprietary copy 2012 ZTE CORPORATION All rights reserved 4
Network KPI monitoring
( 15 minutes time granularity)
UMTS KPI Optimization Analysis Guide Internal Use Only
24 KPI Monitoring During RNC or NodeB Version Upgrade
Figure 2-4 KPI monitoring workflow during RNC or NodeB version upgrade
ZTE Confidential Proprietary copy 2012 ZTE CORPORATION All rights reserved 5
Yes
No
No
End
Locate the worst cells Determine whether they are related with the version update
Yes
Network KPI monitoring
( 15 minutes time granularity)
Execute the worksheet to
upgrade version
Output formal Word report (Compare the hourly granularity KPIs before and after the parameter modification and output the result every hour)
Whether the RNC-level
KPI is normal
Keep on monitoring (15 minutes granularity)
Send mail to or call the person in charge
Rollback or not
Current version
UMTS KPI Optimization Analysis Guide Internal Use Only
25 KPI Monitoring During Cutover
For the network on which the equipment needs to be replaced (for instance HongKong CSL network for which we replaced Nokiarsquos equipment with ZTErsquos) after the network optimization is completed the subscribers on the existing network should be cut over to our network gradually During the cutover there will be subscribers registering on our network constantly which will cause load increase on the network In this case we should watch KPI changes closely The monitoring process items method and report are the same as those described in section 24 ldquoKPI Monitoring During RNC or NodeB VersionUpgraderdquo Please read it for reference
3 KPI Analysis Methods
31 KPI Analysis Methods
Different network problems require different performance analysis methods Choose one or more appropriate methods after learning the running state of the existing network and the problems with it Common analysis methods are as follows
TOP N worst cells method Based on the traffic statistics indicators we care about (such as the call drop rate connection rate and soft handoff failure rate) choose N worst cells whose average indicator values in the peak hours or of the whole day are the lowest as the target of fault analysis and optimization Or prioritize objects of optimization against these indicator values
Time tendency chart method Tendency chart of indicator change is commonly used in the traffic analysis The analysis engineer can work out an hourly daily or weekly tendency chart of one or more indicators of the whole network a cluster or a single cell and find out the change rule of traffic statistics indicators
Regional location method The change of network performance indicators often occurs in some regions The indicators in these regions may be worsened by traffic increase traffic mode change radio environment change faults with a small number of stations or uplinkdownlink interference which will therefore affect the performance indicators of the whole network By comparing the network performance indicators before and after the change we can mark out the station or the sector with the greatest indicator change on an electronic map and take these problem regions as the analysis focus
Comparison method A single traffic statistics indicator may be affected by many factors While some factors change others may not Choose a proper object for comparison to confirm the existence of problems and then analyze the causes of the problems When examining an indicator do not care whether the absolute indicator value is high or low only pay more attention to whether the value is high or low compared to other indicators instead
ZTE Confidential Proprietary copy 2012 ZTE CORPORATION All rights reserved 6
UMTS KPI Optimization Analysis Guide Internal Use Only
311 TOP N Worst Cells Method
During the whole process of KPI optimization analysis TOP N worst cells analysis method is the most effective one which can be used throughout the whole optimization phase By focusing on the TOP N worst cells you can solve the major problems with the network Abnormal call drop events may happen every day and these events may represent problems of a kind After solving the problems with TOP N cells you can solve the problems of the same kind Therefore focusing on TOP N cells is one of the most effective ways to solve problems
TOP N worst cells analysis method is applicable to the optimization analysis of all the indicators Choose TOP N worst cells according to a certain threshold which varies depending on different indicators N stands for the number of the worst cells When the worst cells are too many to be worked on the number of the worst cells can be decreased so that you can focus on them TOP N cells analysis method includes the following steps
Step 1 Screen out TOP N cells according to the condition of the indicators you care about
Step 2 Conduct a health check for TOP N cells Check whether there are any problems with transmission or boards and check whether the worst cells are caused by external abrupt incidents such as terrible weather gatherings or holiday (because during gatherings and holidays the traffic is usually heavy)
Step 3 Check the radio parameters configuration of these cells the radius of these cells and their neighboring cells and compare them with the normal cells
Step 4 Export the indicator relevant most closely with the indicators you care about and analyze it to find the problem indirectly
For instance one day CS call drop rate of a whole network was high We analyzed the problem by the TOP N cells analysis method
Step 1 Screen out TOP N cells according to the condition of the indicators you care about
We used the CNO KPI analysis function to screen out TOP N cells (other tools can be also used) and selected 10 cells with the highest CS call drop rate
Table 3-1 List of CS TOP N Worst Cells
Index Cell RNS subnet ID Cell IDCall drop
rate CS AMRNumber of call
drop voice
1 ZBL1U-AI-1 (201) 12911 4158 553
2 ZBL1U-AI-3 (201) 12913 3955 545
3HKE1U-5H-1
(203) 30461 1556 370
ZTE Confidential Proprietary copy 2012 ZTE CORPORATION All rights reserved 7
UMTS KPI Optimization Analysis Guide Internal Use Only
Index Cell RNS subnet ID Cell IDCall drop
rate CS AMRNumber of call
drop voice
4HKE1U-5H-3
(203) 30463 1581 360
5LAK1U-9M-3
(202) 11063 339 282
6 HIC1U-9R-1 RNC101(101) 10891 226 216
7LAK1U-9M-1
(202) 11061 249 215
8EBP1U-9R-3
RNC101(101) 12823 230 205
9SRS1U-5H-1
RNC102-CSL(102)
12091 392 169
10HRM1U-6R-1
RNC102-CSL(102)
20671 341 167
Step 2 Check the transmission and hardware of the TOP N cells and check whether they are caused by external abrupt incidents such as terrible whether gatherings or holidays when traffic is usually heavy
And then we conducted a health check for each cell and paid attention to routine alarms and BPC board problems We found there were broken associations in some HKE sites
Step 3 Check the radio parameters configuration of these cells the radius of these cells and their neighboring cells and compare them with the normal cells
(1)Problem with the cell radius After the check we found the cell radius of the LAK site was 25 km Because the LAK site was situated by the sea and the antenna was placed very high the radius of 25 km was far from enough So we changed the cell radius to 10 km and the problem of high call drop rate was thus solved
(2)Problem with configuration HIC site is an indoor POI site The RRU RxTx port and the RRU Rx port were configured reversely which is the cause of high call drop rate After modifying HIC we found that signals of the second RRU were received by the Rx port So we changed the configuration of the RxTx port and the Rx port the problem of high call drop rate was thus solved
Figure 3-5 RF configuration at HIC site
Figure 3-6 Antenna energy distribution at HIC site
ZTE Confidential Proprietary copy 2012 ZTE CORPORATION All rights reserved 8
UMTS KPI Optimization Analysis Guide Internal Use Only
Step 4 Export the indicator relevant most closely with the indicators you care about and analyze it to find the problem indirectly
Table 3-2 Indicators Related with CS Call Drop
Index Cell
RAB release number for Iu connection
release request by UTRAN for CS domain in
cell radio connection with UE lost
RAB release number for Iu connection
release request by UTRAN for CS domain in cell failure in
the radio Interface
procedure
RAB release number for Iu connection
release request by
UTRAN for CS domain in
cell release due to
overload control
RAB release number for Iu connection
release request by
UTRAN for CS domain in
cell unspecified
failure
Average cell freq RTWP (dbm)
1ZBL1U-AI-1
482 43 0 29 -104177
2ZBL1U-AI-3
473 40 0 33 -104125
3HKE1U-5H-1
346 16 0 8 -105908
4HKE1U-5H-3
330 18 0 13 -1060777
5LAK1U-9M-3
69 196 0 18 -1031906
6HIC1U-9R-1
100 100 0 16 -1015404
7 LAK1U- 64 131 0 20 -1031934
ZTE Confidential Proprietary copy 2012 ZTE CORPORATION All rights reserved 9
UMTS KPI Optimization Analysis Guide Internal Use Only
Index Cell
RAB release number for Iu connection
release request by UTRAN for CS domain in
cell radio connection with UE lost
RAB release number for Iu connection
release request by UTRAN for CS domain in cell failure in
the radio Interface
procedure
RAB release number for Iu connection
release request by
UTRAN for CS domain in
cell release due to
overload control
RAB release number for Iu connection
release request by
UTRAN for CS domain in
cell unspecified
failure
Average cell freq RTWP (dbm)
9M-1
8EBP1U-9R-3
98 90 0 17 -101413
9SRS1U-5H-1
87 59 0 22 -1043528
10HRM1U-6R-1
42 111 0 13 -1027697
32 Basic KPI Analysis Skills
Be able to use the KPI statistics tool and the analysis tool
Use tools to learn about the running state of the whole network quickly and screen out TOP N worst cells quickly
Use different analysis tools to find problems from different aspects and locate the problem quickly
Understand the signaling process and basic principle
In the process of abnormity location keep a clear aim in mind and be able to apply the process and basic principle to check the other relevant indicators rapidly to facilitate the analysis
Be familiar with the process and basic principle and be able to make logical association between abnormal KPI problems and network problems (such as the coverage problem and the interference problem) Be able to determine the problem nature according to the abnormal KPI and then choose the appropriate tool to analyze the problem in depth
Performance analysis requires engineers to understand basic signaling process be familiar with the protocol stacks of standard interfaces and know relevant algorithms to realize the product functions Engineers should at least have a concept about the various algorithms If the analysis of a commercial network involves some algorithms engineers should study these algorithms in depth
ZTE Confidential Proprietary copy 2012 ZTE CORPORATION All rights reserved 10
UMTS KPI Optimization Analysis Guide Internal Use Only
321 KPI Monitoring Tools
minus Network management tool NetNumenT31 count KPI original data alarm data radio parameter configuration in cells and parameter configuration on the earth
minus KPI daily report generating tool classify key indicators according to a certain condition and screen out the worst cells
322 KPI Analysis Tools
minus CNO Tool CNO tool has the KPI analysis function So using it you can screen out the worst cells according to various conditions and point out the corresponding counter of an indicator
minus SignalTrace Trace the signaling (RNL signaling and RNL signaling) of RNC interfaces which includes the Iu interface the Iur interface the Iub interface and the Uu interface (the signaling flow between RNC and UE at RRC layer) And RNL signaling trace is a common way for locating the KPI problem Being able to trace the RNC signaling is a basic requirement for the on-site KPI optimization engineers and the network optimization and maintenance engineers This signaling tracing tool is very powerful which can trace signaling according to the UE cell and IMSI in the KPI analysis According to the UE cell it can trace the signaling of multiple subscribers while according to IMSI it can trace the signaling of only one subscriber However if the RRC connection is not established yet signaling cannot be traced That is because only when RRC connection has been established can the RNC obtain the subscriberrsquos IMSI from the CN
minus RNC ASS Log ASS log is usually applied when there is abnormity and RNC signaling is out of trace In this case use ASS log to analyze the signaling before and after the abnormity occurs Abnormity can be queried according to IMSI or cell ID ASS log can be also used to collect various abnormities
minus NodeB LMT NodeB local operation and maintenance tool Apart from all the operation functions of the OMCB this tool can collect more detailed information about cells and UE NodeB local maintenance terminals include EOMS EFMS DMS and PMS
minus NodeB Abnormity Probe On the site of WCDMA commercial office NodeB abnormity probe is an effective tool to monitor the running state of the NodeB Every module of NodeB can record the abnormal information automatically which makes it easy to locate problems However this method requires professional knowledge such as knowledge about the function and interface of each module or board If the on-site engineers cannot make the simple analysis they can just obtain the abnormity probe and send it to the RampD engineers at the rear side The abnormities reported on the NodeB will be stored at the OMCB server according to different RNCs To conduct NodeB
ZTE Confidential Proprietary copy 2012 ZTE CORPORATION All rights reserved 11
UMTS KPI Optimization Analysis Guide Internal Use Only
abnormity probe analysis you need to download abnormity probe files from different OMCB servers and then use the abnormity probe tool to make a comprehensive analysis
minus CTS Tool CTS is a tool developed by the CN department which can trace signaling in depth according to IMSI and trace signaling across RNCs So this is particularly suitable to trace VIP subscribers In this case CTS is easier to use than SignalTrace which can only trace signaling of RNCs one by one CTS can trace the interactive signaling between network elements (NEs) within the CN as well as the signaling of the Iu interface and the Uu interface This kind of signaling tracing is what we called in-depth tracing The work principle of CTS is to set up an IMSI task on the CTS server and send it to the CN front side which will then send this task to each CN module via the interfaces dedicated to the CN modules and the RNC and then each module after receiving the signaling related to the IMSI task will send the signaling back to the CTS server via the CN front side The interfaces mentioned above are private interfaces so this tool can only support our own CN and RNC CTS signaling can be checked and analyzed with an offline tool but the offline tool does not work very well because of the lack of continuous optimization and perfection
minus UE log DT test is also an important auxiliary way in analyzing KPI indicators There are many problems that cannot be located by tracing signaling at the network side and can only be located by the use of UE log The commonly used drive test software includes QXDMAPEX (QCAT) CNTCAN and TEMS CNTCAN and TEMS are often used for network optimization For the use of CNTCAN please refer to the corresponding help file and the instruction document publicly released by the Network Optimization Tool Department QXDM and the analysis tool APEX (QCAT) provided by Qualcomm is very powerful which have contributed a lot for the stability and maturity of our system for many years
33 General Process of KPI Optimization Analysis
Basic analyzing ideas
KPI optimization is a process to find and solve problems KPI optimization during the operation and maintenance stage is mainly to pick out the performance data that needs special attention from the OMC classify these performance data and then compare the value of these data with that required by the operator If the value of an indicator is lower than the operatorrsquos requirement analyze this indicator and find out the factor that affect the indicator and then propose a solution to the operator If the values are higher than the operatorrsquos requirement therersquos no need to pay special attention to them
KPI analysis is a process from the whole to the part
Step 1 Check the key indicators from the view of the whole network If there is not any
ZTE Confidential Proprietary copy 2012 ZTE CORPORATION All rights reserved 12
UMTS KPI Optimization Analysis Guide Internal Use Only
problem just ignore them Otherwise try to locate the RNC NE that has the problem
Step 2 Analyze the indicators of the corresponding RNC to find out the RNC whose indicators have the problem
Step 3 Analyze the indicators of the cell under the problem RNC to find out the worst cells or TOP N cells If the indicators of all the cells under the RNC are tend to be low it is a common problem probably caused by parameter configuration And then check whether the radio parameter configuration in the cells under this RNC is the same as that in the cells under the normal RNCs
Step 4 Make a comprehensive analysis on the KPIs alarms DT test data and customer complains of the worst cells to find out a solution
Analysis method
After learning the KPI analysis ideas we must know some common KPI analysis methods to rule out causes of problems from the obvious ones to the hidden ones
For example we found that the TCP code words were strictly limited at eight sites near a park and the call drop rate rose suddenly How to solve this problem
Method one First we checked whether the alarms transmission and boards of these sites were normal After they are proved all normal we sent some engineers to the site to do test And meanwhile we traced the RNC signaling at the OMC It turned out that the test result was normal and the indicators of these sites of that day did not have any problem and code words were not limited And later we knew from the news that there was a big gathering of about one million people at the park at that moment Until then we came to know that the congestion was caused by too many users using the network at the same time
Method two First because the eight sites went worse all of a sudden it was unlikely that the problem lied in the hardware Then we checked whether the radio parameters had been modified the day before The result is no worksheet had been issued to modify those parameters and no alarm was found at those sites Therefore we excluded the possibility of hardware problem Then we checked the traffic trend graph of the last few days (over seven days) and found that the high call drop rate might be caused by high traffic The graph showed that traffic of each site rose suddenly on the day before Thus we came to the conclusion that this was an abnormal abrupt event which may have been caused by a gathering And later we were told that there was a big gathering at the park So we were assured the code words limitation and high call drop rate at the eight sites were caused by too many subscribers using the network at the same time
By comparing the two methods above we can find that although the first one (sending engineers to the site without the consideration of abnormal events) is commonly used it is inefficient and costs more resource The second method (analyzing the problem by the means of exclusion and association) is more efficient From this case we would like to emphasize that KPI analysis is a process of problem exclusion Using the comprehensive
ZTE Confidential Proprietary copy 2012 ZTE CORPORATION All rights reserved 13
UMTS KPI Optimization Analysis Guide Internal Use Only
methods (like Method One) at the first brush may be making a detour
minus Exclusion method Check the alarms on the OMC to learn about the state of the RNC NodeB BPC board and the transmission If there are obvious broken link in transmission or hardware problem the cause of the problem is easy to locate
minus Incident association If the problem is with a great number of sites take abrupt incidents into account such as large-scale gathering terrible weather of incorrect operation These incidents will put influence of different levels and ranges on the network indicators
minus Comparison of radio parameters If some site goes wrong in a sudden check whether the radio parameter configuration of this site is consistent with that of other normal sites If not change it as that of the normal sites because the indicator decrease may be caused by an incorrect modification of radio parameters
minus Relevant indicators association If a certain indicator is in poor condition check its relevant indicators and find the common problem from these relevant indicators
minus Comprehensive problem location When the above reasons are excluded use DT data KPI data RNC signaling analysis data to locate the problem with indicators comprehensively
ZTE Confidential Proprietary copy 2012 ZTE CORPORATION All rights reserved 14
UMTS KPI Optimization Analysis Guide Internal Use Only
Figure 3-7 KPI optimization analysis process
StartPick out
performance indexes
RNC index abnormal
Equipment alarms exist
Deal with equipment alarms
RNC index recovers
Common problem with the
worst cells
Transmission softwarehardware version wireless
parameter configuration
CNRNC Transmission
Hardware Software Interference
Wireless parameters
Time range
Abrupt and self-curable abnormality
helliphellip
Analyze and record causes
Suggestion about improvement
Common problems analysis
Problem resolved
Successful call
Call drop Soft handover
23G alternate operation
PS rate helliphellip
Deal with the relevant problem
Indexes normal
End
Climate change holidays assembly
transmission interruption power
fault and so on
Y
N
Y
Y
N
Y
N
Abnormal indexes analysis in one cell
Y
N
N
N
Y
N
Y
Show TOPN abnormal cells
and their locations
If the problem is proved to be equipment bug or system problem after
several attempts feed it back to RampD dept
ZTE Confidential Proprietary copy 2012 ZTE CORPORATION All rights reserved 15
UMTS KPI Optimization Analysis Guide Internal Use Only
4 KPI Optimization Analysis This chapter mainly demonstrates how to analyze the indicator problems from the aspect of OMC data and provides flowcharts for KPI optimization The detailed analyzing method and cases of every special subject can be checked in the optimization guides of all the subjects
41 CS Call Drop Optimization
The CS call drop rate is the most important indicator in KPI optimization
411 Definition of Call Drop
After checking the signaling on the Uu interface at the UE side the engineer can judge the situation a call drop if the Uu interface message satisfies one of the following three conditions during the calling process (in connection)
RNC Release is not received but the UE condition changes from CELL_DCH to IDLE
RRC Release is received and the released cause value is Not Normal
One of the following three messages mdash CC Disconnect CC Release Complete and CC Release mdash is received and the released cause value is Not Normal Clearing or Not Normal Unspecified
In a board sense the call drop includes the call drop rates of CN and UTRAN The call drop of UTRAN includes the following two aspects
After the successful service establishment RNC sends the RAB Release Request to CN
After the successful service establishment RNC sends the IU Release Request to CN Later RNC receives the IU Release Command from CN
Note that RAN call drop statistics which is defined from the aspect of lu interface signaling means the launching times of RAB Release Request and lu Release Request of RNC And the DT call drop statistics is defined from the aspects of the Uu interface message non-access stratum message and cause value RAN call drop statistics and DT call drop statistics are not exactly the same
ZTE Confidential Proprietary copy 2012 ZTE CORPORATION All rights reserved 16
UMTS KPI Optimization Analysis Guide Internal Use Only
412 CS Call Drop Analysis Flowchart
Figure 4-8 CS call drop analysis flowchart
ZTE Confidential Proprietary copy 2012 ZTE CORPORATION All rights reserved 17
UMTS KPI Optimization Analysis Guide Internal Use Only
Extract performance data
CS TOP Ncell filtering
Analyze a single cell
1 Check NE alarms
2 Associate emergencies
3 Compare parameter
configurations
4 Associate indicators
5 Locate the fault
comprehensively
Exist or not
Handle alarms
Solved or not
Yes
Yes
End
No
No
Exist or not
Handle emergencies
Solved or not
Yes
No
No
Exist or not
Correct wrong parameter
configurations
Solved or not
Yes
No
No
List related indicator counters
Call-drop-related
countersRTWP
Handover success rate
Traffic volume
Resource limit indicators
Checkamp analysis of
interference
Optimizationanalysis of
handover failures
Optimization analysis of
resource limitCall-drop-
related counters
C301230362C301230363C301230365C301230315C301230316C301230318C301230319C301230322C301230323
Solved or not
Yes
Yes
No
Drive Test+RNC signaling
trace
Yes
ZTE Confidential Proprietary copy 2012 ZTE CORPORATION All rights reserved 18
UMTS KPI Optimization Analysis Guide Internal Use Only
42 PS Call Drop Optimization
421 Optimization Flowchart
Figure 4-9 PS call drop optimization flowchart
ZTE Confidential Proprietary copy 2012 ZTE CORPORATION All rights reserved 19
UMTS KPI Optimization Analysis Guide Internal Use Only
Extract performance data
PS TOP Ncell filtering
Analyze a single cell
1 Check NE alarms
2 Associate emergencies
3 Compare parameter
configurations
4 Associate indicators
5 Locate the fault
comprehensive ly
Exist or not
Handle alarms
Solved or not
Yes
Yes
End
No
No
Exist or not
Handle emergencies
Solved or not
Yes
No
No
Exist or not
Correct wrong parameter
configurations
Solved or not
Yes
No
No
List related indicator counters
Call -drop-related
countersRTWP
Handover success rate
Traffic volume
Resource limit indicators
Check amp analysis of interference
Optimizationanalysis of
handover failures
Optimization analysis of
resource limitCall -drop-
related counters
C301230372C301230373C301230375C301230330C301230332C301230333C301230334C301230337C301230338
Solved or not
Yes
Yes
No
Drive Test +RNC signaling
trace
Yes
ZTE Confidential Proprietary copy 2012 ZTE CORPORATION All rights reserved 20
UMTS KPI Optimization Analysis Guide Internal Use Only
43 Optimization of Accessibility Indicators
Accessibility performance includes the success rate of RRC connection setup and the success rate of CSPS RAB assignment These two kinds of KPIs play important roles in the network optimization and directly influence the success rate of CSPS service establishment In this document this kind of problems are found from the aspect of OMC data and solved through parameter optimization
431 Definition of Access Failure
For the mobile originated call in the CS domain the access failure event means that the UE sends RRC REQUEST and IE establish cause is Originating Conversational Call but alerting of the direct transfer message is not received
The relevant events are defined as follows in the access failure stage
RRC connection setup failure After considering the resending times and the waiting time the UE sends RRC CONNECTION REQUEST and does not receive the response from RNC or RRC CONNECTION REJECT delivered by RNC
Initial direct transfer and security mode establishment failure After sending RRC CONNECTION SETUP COMPLETE the UE does not send NAS SETUP
RAB assignment failure After receiving CALL PROCEEDING the UE does not receive RB SETUP delivered by RNC Or the UE replies with RB SETUP FAIL after receiving RB SETUP Or the UE receives DISCONNECT with the cause value not being Normal Release after receiving RB SETUP At this time the UE has not reported RB SETUP CMP
Failure after RAB assignment After the UE sends RB SETUP COMPLETE the originating UE receives DISCONNECTRELEASE from CN Or the UE waits CONNECT or ALERTING overtime and launches the Call Clearing process Or the UE becomes IDLE before receiving Alerting and starts to receive the system message
For the mobile terminated in the CS domain the access failure event means that the terminating UE receives the paging of paging type 1 and does not send RRC CONNECTION REQUEST with the cause value being Terminating Conversational Call Or the UE does not send the alerting of direct transfer message to CN after sending RRC CONNECTION REQUEST
The relevant events are defined as follows in the access failure stage
RRC connection setup failure After sending RRC CONNECTION REQUEST the UE does not receive the response from RNC or RRC CONNECTION REJECT delivered by RNC
Initial direct transfer and security mode establishment failure After sending RRC
ZTE Confidential Proprietary copy 2012 ZTE CORPORATION All rights reserved 21
UMTS KPI Optimization Analysis Guide Internal Use Only
CONNECTION SETUP COMPLETE the UE does not receive the SETUP direct transfer message Or the UE sends RELEASE COMPLETE Or the UE receives DISCONNECT from CN
RAB assignment failure The UE does not receive RB SETUP delivered by RNC after sending CALL CONFIRM Or the UE replies with RB SETUP FAIL after receiving RB SETUP Or the UE receives DISCONNECT with the cause value not being Normal Release after receiving RB SETUP At this time the UE has not reported RB SETUP CMP
Failure after RAB assignment After the UE sends RB SETUP COMPLETE the terminating UE receives DISCONNECTRELEASE from CN
432 Analysis on RRC Connection Failures
The problem of RRC connection setup failure can be analyzed through the UE signaling flow and RNC single-user tracing The RRC connection setup includes the following steps
The UE sends RRC Connection Request through the RACH channel
RNC sends RRC Connection Setup through the FACH channel
The UE sends RRC Connection Setup Complete through the dedicated uplink channel after the downlink dedicated channel is established and synchronized
RRC connection setup failures are always caused by following issues
Uplink RACH problem
Problem about downlink FACH power allocation proportion
Parameter reselection problem of the cell
Low downlink dedicated initial transmitting power
Uplink initial power control problem
Congestion
Equipment malfunctions
Among these issues the problems of uplink RACH downlink FACH power allocation proportion parameter reselection of the cell and equipment malfunctions appear more frequently
ZTE Confidential Proprietary copy 2012 ZTE CORPORATION All rights reserved 22
UMTS KPI Optimization Analysis Guide Internal Use Only
4321 Analysis Flowchart of RRC Connection Setup Failures
Figure 4-10 Analysis flowchart of RRC connection setup failures
ZTE Confidential Proprietary copy 2012 ZTE CORPORATION All rights reserved 23
UMTS KPI Optimization Analysis Guide Internal Use Only
Extract performance data
TOP Ncell filtering
Analyze a single cell
1 Check NE alarms
2 Associate emergencies
3 Compare parameter
configurations
4 Associate indicators
5 Locate the fault
comprehensive ly
Exist or not
Handle alarms
Solved or not
Yes
Yes
End
No
No
Exist or not
Handle emergencies
Solved or not
Yes
No
No
Exist or not
Correct wrong parameter
configurations
Solved or not
Yes
No
No
List related indicator counters
Counters related to RRC setup
failuresRTWP
Resource limit
indicators
Checkamp analysis of interference
Optimization analysis of
resource limitCounters related
to RRC setup failures
C301480485C301480486C301480487C301480489C301480490C301480491C301481288C301481289C301481337C301481338C301481339C301481407C301481408
Solved or not
Yes
Yes
No
Drive Test+RNC signaling
trace
Yes
ZTE Confidential Proprietary copy 2012 ZTE CORPORATION All rights reserved 24
UMTS KPI Optimization Analysis Guide Internal Use Only
4322 UE sends RRC Connection Request but RNC does not receive it
If the EcIo of downlink CPICH is relatively low it is the problem of coverage
If the EcIo of downlink CPICH is not very low (for example the value is larger than -14 dB) Usually it is the problem of RACH and the following issues may cause the problem
minus The power of Preamble does not rise to a required value and the rising times of Preamble should be increased
minus The output power of UE is lower than the required value which is caused by poor UE performance In this case the UE should be changed
minus The NodeB equipment has a standing wave and the engineer should check whether NodeB has any SWR alarm
minus The radius of the cell is set improperly If the radius parameter of the cell is set too small the NodeB can not synchronize the UE beyond the range of the radius and the access fails This problem often happens in the places with large coverage such as the rural areas and the suburbs
4323 RNC delivers RRC Connection Reject after receiving RRC Setup Request
When RRC Connection Reject appears the engineer should check the specific reject cause value Usually there are two kinds of causes
The CPU load of RNC control plane board is too heavy and more boards should be added
DCH and FACH admission is rejected However this situation does not always happen
4324 UE does not receive RRC Connection Setup delivered by RNC
This problem may be caused by the following reasons
Poor coverage
Improper parameters of cell selection and reselection
Checking method The engineer should check the EcIo of CPICH If the value is lower than -12 dB (EcIo is -12 dB by default) and there is no cell of better quality in the monitor set the cause of this problem is poor coverage If there is better cell in the monitor set cell reselection may cause this problem
Poor coverage can be improved by coverage enhancement such as adding some sites to cover the places without signal coverage and adjusting the engineering parameters If the coverage can not be improved the engineer can enhance the FACH power according to
ZTE Confidential Proprietary copy 2012 ZTE CORPORATION All rights reserved 25
UMTS KPI Optimization Analysis Guide Internal Use Only
the PCPICH EcIo coverage of the current network For example if all the pilot EcIo values are larger than -12 dB in the coverage area the power proportion of the common channel should be configured on the basis of the situation that the EcIo value is larger than -12 dB And so the success rate of the idle UE assessment can be ensured
As for the access problem caused by cell selection and reselection the engineer can speed up the cell selection and reselection by adjusting the cell selection and reselection parameters and the problem of RRC connection setup failure caused by improper cell selection and reselection parameters can be solved
Note
The RRC Connection Setup message is borne by FACH RRC Connection Request sent by the UE is received by UTRAN at the preamble of PRACH and then it is sent from the RACH channel based on the current preamble power And the transmit power of preamble can rise all the time until the response is received (There is a limitation for the maximum number of preamble retransmissions) Therefore in the areas with poor coverage the RACH coverage and FACH coverage may become unbalanced and as a result UTRAN can receive RRC Connection Request sent by the UE but the UE can not receive RRC Connection Setup sent by RNC
4325 UE receives RRC Connection Setup and does not send RRC Setup Complete
If the downlink signal quality is normal this problem may be caused by the abnormal condition of the cell phone
Another reason of this problem may be the downlink synchronization failure caused by the low initial power of downlink dedicated channel You can solve this problem by adjusting the service downlink EbNo
4326 RNC does not receive RRC Setup Complete sent by UE
Because the uplink initial power control may increase the UE transmit power this kind of problem seldom appears If it appears the engineer can increase the Constant Value of the dedicated channel properly to raise the uplink DPCCH initial transmission power of the UE
At the same time this problem is also relevant with the uplink SIR initial target value configuration because this value may affect the uplink initial synchronization at the initial stage of link setup If the value of the parameter is set too large there will be too much uplink inference brought by the initial setup of the link If the value is set too small the uplink synchronization will take longer time and the initial synchronization may even fail This parameter is an RNC-level parameter which has a great influence on network performance Therefore the engineer should be cautious while adjusting this parameter
ZTE Confidential Proprietary copy 2012 ZTE CORPORATION All rights reserved 26
UMTS KPI Optimization Analysis Guide Internal Use Only
Note
RRC Connection Setup Complete is sent through uplink DPCH and the UE calculates the initial power of uplink DPCCH according to the received IErdquoDPCCH_Power_offsetrdquo and the measured CPICH_RSCP value
DPCCH_Initial_power = DPCCH_Power_offset - CPICH_RSCP
DPCCH_Power_offset = Primary CPICH DL TX Power + UL Interference + Constant Value The Constant Value can be configured in the OMC If this value is set too small the UE may not have enough power to send RRC Connection Setup Complete
433 Analysis on RABRB Setup Failures
When RAB or RB setup fails RNC will send RAB Assignment Fail in the RAB Assignment Response signaling The engineer can find out the specific failure reason from the failure cause value carried in relevant cells The reasons for common RABRB setup failures include
RNC directly rejecting RAB Setup Request because of wrong parameter configuration
Admission reject
RAB setup failure because the UE fails to respond to RB Setup Request
RAB setup failure because the Uu interface fails to set up RB
ZTE Confidential Proprietary copy 2012 ZTE CORPORATION All rights reserved 27
UMTS KPI Optimization Analysis Guide Internal Use Only
4331 Analysis Flowchart of RAB Setup Failures
Figure 4-11 Analysis flowchart of RAB setup failures
ZTE Confidential Proprietary copy 2012 ZTE CORPORATION All rights reserved 28
UMTS KPI Optimization Analysis Guide Internal Use Only
Extract performance data
TOP Ncell filtering
Analyze a single cell
1 Check NE alarms
2 Associate emergencies
3 Compare parameter
configurations
4 Associate indicators
5 Locate the fault
comprehensively
Exist or not
Handle alarms
Solved or not
Yes
Yes
End
No
No
Exist or not
Handle emergencies
Solved or not
Yes
No
No
Exist or not
Correct wrong parameter
configurations
Solved or not
Yes
No
No
List related indicator counters
Counters related to RAB setup failures RTWP
Resource limit
indicators
Checkamp analysis of interference
Optimization analysis of
resource limitCounters related to RAB setup failures
CS domain PS domainC301230290 C301230302C301230291 C301230303C301230292 C301230304C301230293 C301230305C301230294 C301230306C301230295 C301230307C301230296 C301230308C301230297 C301230309C301230298 C301230310C301230299 C301230311C301230300 C301230312C301230301 C301230313
Solved or not
Yes
Yes
No
Drive Test+RNC signaling
trace
Yes
ZTE Confidential Proprietary copy 2012 ZTE CORPORATION All rights reserved 29
UMTS KPI Optimization Analysis Guide Internal Use Only
4332 RNC Directly Rejecting RAB Setup Request Because Of Wrong Parameter Configuration
The case that RNC responds with RAB Setup Failure directly is seldom caused by invalid parameter configuration in the business network Usually this case is caused by special operations of the special users
The main scenario is that the subscription information of the userrsquos PS service is beyond the capability of the UE which leads to the direct refusal from RNC For example a special userrsquos subscription rates of uplink and downlink are 384 K but the maximum uplink rate of the UE is only 64 K The maximum uplink and downlink rates of the QoS message used for activating PDP set by the AT command or mobile terminal software used by the user are 384 K so the RNC will find the maximum uplink rate is beyond the UErsquos capability directly reply with RAB Setup Failure and will not launch the RB setup process when it receives RAB Assignment Request
After the RAB setup fails because the parameter configuration is beyond the UErsquos capability SGSN will negotiate again to launch the new RAB assignment until the UE has the capability to support the assignment and the RAB assignment is finished For the users the PDP activation is still successful and the actual maximum rate is the maximum rate the UE can support
However if the minimum guaranteed bit rate required by the QoS setting in the UErsquos PDP activation request is beyond the UErsquos capability though the network negotiates a lower rate to accept the UErsquos PDP activation request the UE will launch the request of deactivating PDP when it finds that the rate negotiated by the network in PDP activation accept request is lower than the minimum guaranteed bit rate and finally the PDP activation can not be completed
4333 Admission Reject
For the non-HSDPA user if there are insufficient system resources (including power channel code lub transmission resource and CE) the call establishment failure will be caused by the admission reject At this time it is necessary to check the network load code resource lub transmission resource and CE resource occupation to make sure the congestion is caused by the limitation of a certain kind of resource What is more the engineer should plan the corresponding expansion method
If the cell does not support the HSDPA service the R99 user admission is judged according to the fixed R99 admission threshold If the cell supports the HSDPA service and the HSDPA and R99 dynamic power is allocated the uplink admission of non-HSDPA is judged based on RTWP or the equivalent user number If the uplink load is too heavy the non-HSDPA user admission will also fail
If the bandwidth configuration on the lub interface is insufficient the lub interface will reject the R99 data service activation because of limited bandwidth
ZTE Confidential Proprietary copy 2012 ZTE CORPORATION All rights reserved 30
UMTS KPI Optimization Analysis Guide Internal Use Only
The admission control of the NodeB Credit resource is similar to the power admission control Whether the remaining Credit can support the currently requested service or not can be judged according to the spectrum spreading factor of the new access user According to the condition of the RAB Downsizing Switch RNC will deal with the issue in the corresponding way
For the HSDPA user in the dynamic power allocation mode besides the mentioned system resources such as the power channel code lub transmission resource and CE the admission reject should take into consideration whether the number of H users supported by NodeB and the number of H users supported by the cell are over the regulated threshold or not into consideration
For the HSDPA user when the bandwidth configuration on lub interface is insufficient the admission reject will not happen but the rate will be reduced What is more the AAL2PATHs of HSDPA and R99 are configured respectively and the HSDPA AAL2PATH must be configured to the HSDPA_RT or HSDPA_NRT type If the HSDPA AAL2PATH is configured to RT or NRT of R99 AAL2PATH type the RAB assignment failure will not happen but RNC will establish the HSDPA service as R99 384 Kbps
For the downlink power admission
Besides whether the R99 service load is over the non-HSDPA service threshold DCH service should take into consideration whether non-HSDPA power and HSDPA GBP (the minimum power needed for the guaranteed bit rate) are over the general power threshold of the cell
For the HSDPA service it is necessary to check whether the throughput rate provided by the cell is over the sum of all the usersrsquo GBR thresholds or whether the GBPs of the stream service and the background service are over the HSDPA power of the cell At the same time whether the non-HSDPA power and the HSDPA GBP (the minimum power needed for the guaranteed bit rate) are over the overall power threshold of the cell should be also taken into consideration
For the lub admission
For the DCH service the admission is made according to the multiplication of the peak rate and the service activation factor
For HSDPA service the admission is made according to the GBR
If the lub exceeds the congestion threshold the DCCC rate reduction will be triggered And if the RLC_AM retransmission rate is over a certain threshold the Iub Overbooking switch can be opened to trigger the TF which limits R99 or to reduce the rate of HSDPA service by a certain factor
ZTE Confidential Proprietary copy 2012 ZTE CORPORATION All rights reserved 31
UMTS KPI Optimization Analysis Guide Internal Use Only
4334 RAB Setup Failure Because the UE Fails to Respond to RB Setup
The UE fails to respond to RB setup mainly because of the userrsquos operation
Take the following cases as examples
When the user already has had the downlink 12 K data service he receives RB Setup Request of the VP service (either the originated call in the VP domain or the terminated call in the VP domain) Because the UE does not support the VP and high-speed PS service in the downlink at the same time it directly replies with RB Setup Failure and the cause value is unsupported configuration
Compared with the WCDMA subscriber originating the VP service the terminating subscriber resides in the GSM network and so it does not support the VP service After RNC receives RAB Assignment Request the core network will deliver the Disconnect command right after call proceeding and the cause value is Bearer capability not authorized At this time the UE has just received the RB SETUP command and has no enough time to finish the RB setup So the UE will reply with RB Setup Failure after it receives the Disconnect command and the RNC will reply with RAB Setup Failure with the cause value being failure in radio interface procedure
4335 RAB Setup Failure Because the Uu Interface Fails to Set Up RB
RNC sends the Radio Bearer Setup command to the UE but fails to receive Radio Bearer Setup Compete This kind of situation (RB setup failure) often appears in the cells with weak signals There are two causes of weak signals one is that the UE does not reside in the best server to launch the access and the other is poor coverage
If the UE does not reside in the best server to launch the access it will hope to enter the best server through active set update in the RB setup process (At the same time the fast signal change will drastically weaken the signals in the cell) but the active set update can only be processed after the RB setup is completed because the procedures can not be processed alternately (Neither the network nor the terminal supports it) Therefore RB can only be set up in the cell with weak signals and the setup is easy to fail As for this situation the starting threshold and speed of co-frequency cell reselection should be increased to make the UE reside in the best server and launch the access as soon as possible
RB setup failure may be caused by the poor downlinkuplink coverage If the failure is caused by downlink coverage the UE can not receive the Radio Bearer Setup command which may be caused by the uplink interference and this can be fixed through checking RTWP The poor downlink coverage is partly caused by the bad UE demodulation performance and other causes should be solved by RF optimization
ZTE Confidential Proprietary copy 2012 ZTE CORPORATION All rights reserved 32
UMTS KPI Optimization Analysis Guide Internal Use Only
44 Optimization of Mobility Indicators
Mobility indicators mainly fall into three categories mdash soft handovers hard handovers and inter-RAT handovers The handover problems usually happen in the following cases
The best server changes too fast or there is no best server due to pilot pollution
The handover is not prompt or there are pingpong handovers due to improper parameter configuration
Adjust the engineering parameters for antennas in areas with severe pilot pollution And adjust the handover parameters such as the values of 1A 1B CIO TTT (time to trigger) Hysteresis and so on to solve the problem that the handover is not prompt or there are pingpong handovers This section tries to solve this kind of problems through OMC data analysis and parameter optimization
441 Optimization of Soft Handovers
Missed neighboring cell configuration pilot pollution improper soft handover parameter configuration and equipment malfunctions are the major causes of soft handover failures To confirm the problems the field DTs are required
ZTE Confidential Proprietary copy 2012 ZTE CORPORATION All rights reserved 33
UMTS KPI Optimization Analysis Guide Internal Use Only
4411 Soft Handover Optimization Flowchart
Figure 4-12 Soft handover optimization flowchart
ZTE Confidential Proprietary copy 2012 ZTE CORPORATION All rights reserved 34
UMTS KPI Optimization Analysis Guide Internal Use Only
Extract performance data
TOP Ncell filtering
Analyze a single cell
1 Check NE alarms
2 Associate emergencies
3 Compare parameter
configurations
4 Associate indicators
5 Locate the fault
comprehensive ly
Exist or not
Handle alarms
Solved or not
Yes
Yes
End
No
No
Exist or not
Handle emergencies
Solved or not
Yes
No
No
Exist or not
Correct wrong parameter
configurations
Solved or not
Yes
No
No
List related indicator counters
RTWPResource
limit indicators
Checkamp analysis of interference
Optimization analysis of
resource limitCounters related to intra-frequency
handover failures
C301391101 C301390593C301391102 C301390594C301391103 C301390595C301390586 C301390596C301390587 C301390597C301390588 C301390598C301390589 C301390599C301390590 C301390600C301390591 C301390601C301390592 C301390602
Solved or not
Yes
Yes
No
Drive Test+RNC signaling
trace
Yes
Counters related to soft handover
failures
30055 3005630057 3005830059 3006030061 30062
Cell hand-inhand-out indicators
ZTE Confidential Proprietary copy 2012 ZTE CORPORATION All rights reserved 35
UMTS KPI Optimization Analysis Guide Internal Use Only
4412 Checking Missed Neighboring Cell Configuration
Generally speaking most of the call drops at the beginning of the optimization are caused by missed neighboring cell configuration The following methods are often used to judge whether the call drops are caused by missed configuration of co-frequency neighboring cells
Observe the active set EcIo information recorded by the UE and the Best Server EcIo information recorded by the Scanner before the call drop If the former record is very bad but the latter record is very good then check whether the Best Server scrambling code recorded by the Scanner appears in the latest list of the neighboring cells under intra-frequency measurement control If it does not then the call drop is caused by missed neighboring cell configuration
If the UE re-accesses immediately after the call drop and the cell scrambling codes during the UE reaccess and those during the call drop are different then the call drop may also be caused by missed neighboring cell configuration You can confirm it through measurement control (look backwards from the message of the call drop event for the latest intra-frequency measurement control message and check the neighboring cell list of this message)
Some UE may report the Detected Set information If the corresponding scrambling code appears in the Detected Set information before the call drop then the call drop is caused by missed neighboring cell configuration
4413 Checking Pilot Pollution
Definition of pilot pollution Excessive strong pilot signals exist at a certain point but none of them is strong enough to be the best server To form pilot pollution the following points in this definition should be satisfied
Strong pilot signal The absolute pilot signal strength is used to judge whether the pilot signal is a strong one The pilot signal strength can be evaluated through the pilot RSCP If the pilot RSCP exceeds a threshold it is considered a strong pilot signal The formula is
AbsoluteRSCPThRSCPCPICH __ gt
Excessive The number of pilot signals is used to judge whether there are excessive pilot signals at a certain point If the number exceeds a threshold it is regarded that excessive pilot signals exist at this point The formula is
NThNumberCPICH gt_
None of them is strong enough to be the best server The relative strength of a pilot signal is a key factor in judging whether the pilot signal is strong enough Based on the above definition and formulae if the difference between the strength of the
ZTE Confidential Proprietary copy 2012 ZTE CORPORATION All rights reserved 36
UMTS KPI Optimization Analysis Guide Internal Use Only
strongest pilot signal and that of the )1( +NTh strongest pilot signal at this point is
less than a threshold it is regarded that there is no pilot signal strong enough to be the best server at this point The formula is
lativeRSCPthThbest ThRSCPCPICHRSCPCPICHN Re_)1( )__( ltminus +
According to the above description it is regarded that pilot pollution exists if the following conditions are both satisfied
The number of pilot signals that meet the condition
AbsoluteRSCPThRSCPCPICH __ gt is more than NTh
lativeRSCPthThbest ThRSCPCPICHRSCPCPICHN Re_)1( )__( ltminus +
For example during the network optimization suppose
dBmTh AbsoluteRSCP 95_ minus= 3=NTh and dBTh lativeRSCP 5Re_ = if the following
conditions are both satisfied then it is regarded that pilot pollution exists
The number of the pilot signals that meet the condition
dBmRSCPCPICH 95_ minusgt is more than 3
dBRSCPCPICHRSCPCPICH thbest 5)__( 4 ltminus
4414 Adjusting Soft Handover Algorithm Parameters
You can solve the following kinds of problems by adjusting handover algorithm parameters
1 The handover is not prompt
From the perspective of the CS service signaling flow the symptom of this problem is that the UE cannot receive Active Set Update (physical channel reallocation in the case of the intra-frequency hard handover) because after the UE reports the measurement report the source cell has a fast reduction in EcIo When the RNC sends Active Set Update the UE has closed the transmitter due to the loss of downlink synchronization Viewed from the UE side it cannot receive Active Set Update In the PS services if the UE cannot receive Active Set Update or TRB resets before the handover the handover will also fail
From the perspective of signals the following phenomena may accompany this problem
ZTE Confidential Proprietary copy 2012 ZTE CORPORATION All rights reserved 37
UMTS KPI Optimization Analysis Guide Internal Use Only
minus Corner effect EcIo of the source cell decreases drastically and EcIo of the target cell increases sharply (very high when it appears)
minus Fast fading EcIo of the source cell decreases quickly for a while and then increases and EcIo of the target cell increases for a short while
2 Pingpong handovers The following phenomena may accompany this problem
The best server changes quickly Two or more cells take turns to be the best server But as the best server none of the cells can last long though they has good RSCPs and EcIos
There is no best server There are multiple cells Their RSCPs are normal and similar to each other But EcIo of every cell is very bad
From the perspective of the signaling flow Event 1A is reported immediately after one cell is deleted Because the UE cannot receive Active Set Update from the RNC the handover fails
4415 Equipment Malfunctions
First check the alarm console to see whether there are abnormal alarms and analyze the message traces at the same time Find out in which step the soft handover fails Check the failure message and contact the local product maintaining engineer to confirm whether the equipment has malfunctions
4416 Solutions
Corresponding adjustments should be taken for the confirmed problems
Handover failures caused by pilot pollution Adjust the engineering parameters of a certain antenna to set this antenna as the best server in this interfered location If the power of one of its sectors is reduced then Io of the pilot pollution area will decrease even if the powers of other pilots are not adjusted EcIo will also increase Thereby the EcIo differences with other scrambling codes in the active set will become larger and pilot pollution will be eliminated Through a lot of research ZTE has proved that the reduction in the pilot transmit power will not change cell capacity greatly If condition allows new base stations can be added to cover this area
Equipment malfunctions Consult the customer service engineers and ask them to help check whether there are alarms and whether the transport layer is abnormal If there are alarms coordinate with the customer service engineers and the engineering personnel to solve the problems
Call drops because the handovers are not prompt
ZTE Confidential Proprietary copy 2012 ZTE CORPORATION All rights reserved 38
UMTS KPI Optimization Analysis Guide Internal Use Only
minus Adjust the antenna to expand the handover zone
minus Configure the Event 1A handover parameters to make the handover easier to happen
minus Increase CIO to make the handover happen earlier in the target cell The sum of CIO and the actually measured value is used for judging the UE events including the UE intra-frequency handover CIO helps shift the cell border in the handover algorithm If CIO is configured with a larger value the handover will be easier to happen and there will be more UE in the soft-handover status but more resources will be occupied If CIO is configured with a smaller value the soft handover will be more difficult to happen and the receiving quality may be impaired A CIO of about 5dB is quite good for eliminating the fast fading and the corner effect but this configuration has some side effects such as the increase of handover proportion
Call drops caused by pingpong handovers Adjust the antenna to form a best server in its coverage zone or set the Event 1B handover parameters (increase the threshold of Event 1B the Event 1B hysteresis or the time to trigger Event 1B) to increase the difficulty in deleting the active set
442 Optimization of Hard Handovers
4421 Classification of Hard handovers
Hard handovers mainly fall into two classifications
Intra-frequency hard handovers The intra-frequency hard handover is triggered only when the intra-frequency softsofter handover cannot be performed and it is applicable to the following circumstances
minus Inter-RNC intra-frequency cell handovers when there is no Iur interface
minus Insufficient Iur interface resources though there is the Iur interface
minus Handovers controlled by the threshold of the PS service rate in the handover cell
The intra-frequency softsofter handovers can not be performed (intra-frequency hard handover should be triggered) in the following scenarios
minus When the intra-frequency handover happens the UE is using the transmit diversity in the active set cell but the target cell does not support the transmit diversity
minus The intra-frequency measurement report does not contain OFF and TM of the
ZTE Confidential Proprietary copy 2012 ZTE CORPORATION All rights reserved 39
UMTS KPI Optimization Analysis Guide Internal Use Only
target cell
minus When the intra-frequency handover happens between RNCs the Iur interface is unavailable
minus The UE performs the multiuser detection in the active set cell but the target cell does not support the multiuser detection
minus The target cell and the original cell belong to different classifications (The cells of R99 R5+R99 and R6+R5+R99 belong to the same classification while the cells of R5 and R6+R5 belong to another classification)
Inter-frequency hard handovers The inter-frequency hard handover means a UE connection is handed over from a cell of a UTRAN frequency to a cell of another frequency Many factors including the radio quality the load and the speed of the moving UE may trigger inter-frequency hard handovers
For example the radio quality triggers the inter-frequency hard handover in the following way
When the quality of the UE radio frequency becomes lower the inter-frequency measurement will be triggered and according to the measurement result the UE connection will be handed over to a better frequency
ZTE Confidential Proprietary copy 2012 ZTE CORPORATION All rights reserved 40
UMTS KPI Optimization Analysis Guide Internal Use Only
4422 Hard Handover Optimization Flowchart
Figure 4-13 Hard handover optimization flowchart
ZTE Confidential Proprietary copy 2012 ZTE CORPORATION All rights reserved 41
UMTS KPI Optimization Analysis Guide Internal Use Only
Extract performance data
TOP Ncell filtering
Analyze a single cell
1 Check NE alarms
2 Associate emergencies
3 Compare parameter
configurations
4 Associate indicators
5 Locate the fault
comprehensive ly
Exist or not
Handle alarms
Solved or not
Yes
Yes
End
No
Exist or not
Handle emergencies
Solved or not
YesNo
Exist or not
Correct wrong parameter
configurations
Solved or not
Yes
No
No
List related indicator counters
RTWPResource
limit indicators
Checkamp analysis of interference
Optimization analysis of
resource limit
Counters related to inter-frequency handover failures
C301110489 C301110516C301110499 C301110517C301110500 C301110518C301110501 C301110519C301110502 C301110520C301110503 C301110521C301110504 C301110522C301110505 C301110523
Solved or not
Yes
Yes
No
Drive Test+RNC signaling
trace
Yes
Counters related to hard handover
failures
30041 3004230043 3004430045 3004630047 30048
Cell hand-inhand-out indicators
NoNo
ZTE Confidential Proprietary copy 2012 ZTE CORPORATION All rights reserved 42
UMTS KPI Optimization Analysis Guide Internal Use Only
4423 Hard Handover Optimization Methods
The optimization flow for the hard handover is similar to that of the soft handover The major differences are in the parameter optimization To optimize intra-frequency hard handovers you can properly reduce the Event 1D hysteresis and the time to trigger Event 1D according to the real radio environment to ensure timely handovers
Inter-frequency coverage is often applied to some special scenarios such as indoor coverage and tested through CQT The method of judging whether there is missed configuration of the inter-frequency neighboring cell is almost the same as that of the co-frequency neighboring cell when a call drop occurs the UE fails to measure or report the inter-frequency neighboring cell after the call drop the UE resides in the inter-frequency neighboring cell again
The common hard handover problems are
1 The handover is not prompt The common symptoms are frequent call drops in the hard handovers when the UE moves
Solutions
Increase the threshold of activating the compressing mode The compressing mode is usually activated before the inter-frequency handover or the inter-RAT handover and it is used to measure the quality of the inter-frequency or inter-RAT cell You can set a threshold of the CPICH RSCP or EcIo to activate the compressing mode And the RSCP is widely used
minus Requirements on setting the threshold of activating the compressing mode Before the cell quality becomes low enough to cause a call drop the signal of the target cell should be measured and reported and the handover should be performed
minus Requirement on setting the threshold of deactivating the compression mode Frequent activationdeactivation of the compression mode should be avoided
Increase CIOs of the inter-frequency cell pair
Reduce the threshold of triggering the target frequency handover under the inter-frequency coverage
2 There are pingpong handovers
Solution Increase the hard handover hysteresis and the time to trigger the event
ZTE Confidential Proprietary copy 2012 ZTE CORPORATION All rights reserved 43
UMTS KPI Optimization Analysis Guide Internal Use Only
443 Optimization of Inter-RAT Handovers
4431 Configuring Basic Inter-RAT Parameters
Most of the inter-RAT handover failures are caused by incomplete parameter configuration The following parameters need special attention
Complete RNC parameter configuration for the GSM neighboring cell The 2G system shall provide the 3G system with the correct radio parameters based on negotiation mdash MCC MNC LAC ID (CI) NCC BCC frequency band indicator (900 or 1800) and BCCH
Table 4-3 Parameters That 2G Shall Provide to 3G
MCC MNC LACIDCI
NCC BCCFrequency
band indicator
BCCH
460 2 202 193 0 0 900 102
Complete GSM BSC parameter configuration for the WCDMA neighboring cell The 3G system shall provide the 2G system with the correct radio parameters based on negotiation mdash MCC MNC LAC RNC ID cell ID (C_ID) downlink frequency scrambling code and RAC
Table 4-4 Parameters That 3G Shall Provide to 2G
MCC MNC LACRNC
IDCell IDC_ID
Downlink frequency
Scrambling code
RAC
460 3 20 18 51 10787 51 20
According to the current strategy of one-way inter-RAT handovers if the parameter configuration is complete one probable cause of the inter-RAT handover failure is that the handover is not prompt The common parameter adjustment is to increase CIO the threshold to activatedeactivate the compressing mode and the threshold to trigger the WCDMA-to-GSM handover at the same time
Call drops during the inter-RAT handovers between WCDMA and GSM may be caused by
minus Inconsistent data configuration at the GSM side and the WCDMA side after GSM modifies the configuration data but does not inform WCDMA
minus Missed configuration of neighboring cells which can be solved by the correct configuration of neighboring cells
minus Too fast signal changes
ZTE Confidential Proprietary copy 2012 ZTE CORPORATION All rights reserved 44
UMTS KPI Optimization Analysis Guide Internal Use Only
minus Pingpong reselection
minus Faults with the UE for example the UE fails to respond to the handover or report the inter-RAT measurement report
minus Changes of the best server during the physical channel reallocation
minus Wrong LAC configuration which can be located through data configuration check
ZTE Confidential Proprietary copy 2012 ZTE CORPORATION All rights reserved 45
UMTS KPI Optimization Analysis Guide Internal Use Only
4432 Inter-RAT Handover Optimization Flowchart
Figure 4-14 Inter-RAT handover optimization flowchart
ZTE Confidential Proprietary copy 2012 ZTE CORPORATION All rights reserved 46
UMTS KPI Optimization Analysis Guide Internal Use Only
Extract performance data
TOP Ncell filtering
Analyze a single cell
1 Check NE alarms
2 Associate emergencies
3 Compare parameter
configurations
4 Associate indicators
5 Locate the fault
comprehensive ly
Exist or not
Handle alarms
Solved or not
Yes
Yes
End
No
No
Exist or not
Handle emergencies
Solved or not
Yes
No
No
Exist or not
Correct wrong parameter
configurations
Solved or not
Yes
No
No
List related indicator counters
RTWPResource
limit indicators
Checkamp analysis of interference
Optimization analysis of
resource limitCounters related to inter-RAT handover failures
C301130667 C301130681C301130668 C301130682C301130669 C301130690C301130670 C301130691C301130671 C301130692C301130672 C301130693C301130673 C301130694C301130674 C301130696C301130675 C301130697C301130677 C301130698C301130678 C301130699C301130679 C301130700
C301130680
Solved or not
Yes
Yes
No
Drive Test+RNC signaling
trace
Yes
Counters related to inter-RAT handover
failures
Cell hand-inhand-out indicators
30049 3005030051 3005230053 30054
ZTE Confidential Proprietary copy 2012 ZTE CORPORATION All rights reserved 47
UMTS KPI Optimization Analysis Guide Internal Use Only
45 Optimization of Resource Indicators
The resource indicators directly reflect the system capacity Increasing subscribers will consume more system resources and some resources may be limited for example the code resource may be limited the TCP access request may be rejected and the CE resource usage rate may exceed the threshold Limited system resources have a negative influence on the whole-network indicators and the subscribersrsquo perception for example call drops may frequently happen and more TCP access requests may be rejected during the voice services
Table 4-5 Resource KPIs and Alarm Thresholds
Resource type KPI No and nameAlarm
threshold
TCP
C301320150 Number of rejected services DCH downlink TCP limit
50
PI30167 Average non-HS (SOA) (SOA)DPA TCP 40
PI30092 Maximum Cell TCP () 100
PI30093 Average Cell TCP 70
UL TrafficPI30029 Handover Blocking Rate 05
KPI RTWP (in busy hour) -98 dBm
Code
C301320153 Number of rejected services DCH no code
50
PI30205 Average Cell HSUPA Users 12
PI30172 Cell Average HSDPA Users 16
CE
PI301830006 Maximum use Ratio of Uplink NodeB CE
60
PI301830010 Maximum use Ratio of Downlink NodeB CE
60
ZTE Confidential Proprietary copy 2012 ZTE CORPORATION All rights reserved 48
UMTS KPI Optimization Analysis Guide Internal Use Only
451 Resource Indicator Optimization Flowchart
Figure 4-15 Resource indicator optimization flowchart
ZTE Confidential Proprietary copy 2012 ZTE CORPORATION All rights reserved 49
UMTS KPI Optimization Analysis Guide Internal Use Only
Extract performance data
TOP Ncell filtering
Analyze a single cell
1 Check NE alarms
2 Associate emergencies
3 Compare parameter
configurations
4 Associate indicators
5 Locate the fault
comprehensive ly
Exist or not
Handle alarms
Solved or not
Yes
是
End
No
No
Exist or not
Handle emergencies
Solved or not
Yes
No
No
Exist or not
Correct wrong parameter
configurations
Solved or not
Yes
No
No
List related indicator counters
Code resource indicators
CE resource indicators
TCPadmission
reject counter
C301320150
Solved or not
Yes
Yes
No
Drive Test+RNC signaling
trace
Yes
Counter related to TCP limit
Cell TX power
indicators
30090 3009130092 3009330166 3016730168 3016930170 30171
30163301643016530075
30223302243045030451
Yes
Yes
ZTE Confidential Proprietary copy 2012 ZTE CORPORATION All rights reserved 50
UMTS KPI Optimization Analysis Guide Internal Use Only
452 Code Resource Optimization
The statistics of Number of rejected services and DCH no code the average code resource usage rate and the number of the HSDPA subscribers can be used to judge whether the code resource in a cell is limited If the code resource is limited you can adjust the code resource allocation to alleviate the situation
Based on the system algorithm when Formula 1 is satisfied you can add an HS-PDSCH when Formula 2 is satisfied then an HS-PDSCH is deleted
Formula 1 OcuRateNoHspdsch + OcuRateHspdsch + DpchCodeHy + 32 lt= 512
Formula 2 OcuRateNoHspdsch + OcuRateHspdsch + CodeUptHyA gt 512
OcuRateHspdschHSPDSCH means the number of the codes of SF=512 blocked by the HS-PDSCH OcuRateNoHspdsch means the number of codes of SF=512 blocked by other channels DpchCodeHy means the number of codes of SF=512 reserved for the DPCH and CodeUptHyA is the threshold to decide whether to delete the HSPDSCH
Therefore to ensure the access of the R99 subscribers you can make some adjustment according to Table 4-6 when the code resource is limited though the HSDPA rate may decrease
Table 4-6 Adjusting Code Resource Allocation
AbbreviationParameter
nameRange
and stepCurrent value
Update value
Remark
DpchCodeHy DPCH Code Hysteresis
0512 16 28
To decrease the number of rejected services for DCH no code
CodeUptHyACode Update Hysteresis A
0512 16 28
To decrease the number of rejected services for DCH no code
453 Monitoring CE Resource
The CE resource is mainly monitored through the maximum UE uplinkdownlink usage rate If there is any problem you can solve it by controlling the load or adding more boards
ZTE Confidential Proprietary copy 2012 ZTE CORPORATION All rights reserved 51
UMTS KPI Optimization Analysis Guide Internal Use Only
454 Optimization of Power Control
4541 Monitoring and Optimizing Downlink Power Control
Limited TCP in busy hours will not only increase access failures and call drops in the local cell but also increase soft handover failures and call drops in the neighboring cells Number of rejected services and DCH downlink TCP limit are intuitive KPIs to judge whether TCP is limited Although limited uplink capacity and massive UE moves in the rush hours may also cause call drops the limited TCP is absolutely a key factor
Based on the system algorithm MinHsdpaPower (MinHspaPwrRto) + NoHsPower gtNode B if the safety threshold is used (MinHsdpaPower means the power reserved for HSPA) then it will activate the downlink rate downgrade algorithm flow for the congestion (lower the downlink DCH rate) Although the rate downgrade can ensure access of some subscribers it is an irregular action and will degrade the performance
455 Speeding up Rate Downgrade
Considering that the cells with heavy load reject more access requests you can speed up the rate downgrade during the resource congestion to release the resources as soon as possible and avoid call drops caused by access failures (this method is only applicable to the cells with many PS service users but not those with only CS service users) Table 4-7 is an example of the parameter modification for the rate downgrade
Table 4-7 Example of Parameter Modification for Rate Downgrade
Abbreviation Parameter nameRange and
stepCurrent value
Update value
Remark
UlDnMaxStg Maximum Number of Degraded Uplink Load Steps Every Time
[1 8] 1 2 Downgrade from 384 Kbps to 16 Kbps
DlDnMaxStg Maximum Number of Degraded Downlink Load Steps Every Time
[1 8] 1 3 Downgrade from 384 Kbps to 8 Kbps
456 Monitoring and Optimizing Uplink Capacity
Handover Blocking Rate and RTWP can reflect the uplink capacity of the cell Because interference may also increase RTWP this factor should be distinguished during the RTWP monitoring Another effective indicator is the voice service erl If a cell has over 20 erls in busy hours you should pay special attention to it
ZTE Confidential Proprietary copy 2012 ZTE CORPORATION All rights reserved 52
UMTS KPI Optimization Analysis Guide Internal Use Only
457 Optimization of Uplink Capacity at the Whole Network Level
Case The uplink capacity was limited in a large number of sites after the cutover and the symptoms are a sharp rise of RTWP and a high call drop rate during the rush hours
After the following parameters were modified as shown in Table 4-8 the problem was solved
Table 4-8 Example of Power Control Parameter Modification
AbbreviationParameter
nameRange
Current value
Update value
ULINITSIRUplink Initial SIR target (dB)
UL 34 K136 K signaling UL 122 K AMR
4-5 35
ULMAXSIRMaximum Uplink SIR target (dB)
UL 34 K136 K signaling UL 122 K AMR
15 10
UlSirTargDnStepUplink SIR Target Down Step Size (dB)
UL 34 K136 K signaling UL 122 K AMR
01 02
458 Optimization of Uplink Capacity for a Single Cell
A lot of optimization measures can be taken to bring down the rising RTWP However with increasing subscribers the capacity may still be limited in some area while further modification of SirTarget will obviously degrade the call quality of the whole network and undermine the subscribersrsquo perception In this case you can adjust the power control parameters for a single site that has heavy traffic in the following way add one set of DivPc parameters and use this set of parameters only for this site
Case Table 4-9 shows an example of the power control parameter modification After this modification the call drop rate in the site with heavy traffic decreased to one quarter of the original one
Table 4-9 Example of Power Control Parameter Modification for Heavy-Traffic Cell
SRVTYPE ULINITSIR ULMAXSIR ULMINSIR
0 35-gt15 100-gt35 20-gt10
104 40-gt20 150-gt50 05-gt0
28 35-gt15 100-gt35 05-gt0
50 60-gt20 150-gt50 20-gt0
54 60-gt20 150-gt50 20-gt0
ZTE Confidential Proprietary copy 2012 ZTE CORPORATION All rights reserved 53
UMTS KPI Optimization Analysis Guide Internal Use Only
Table 3-1 List of CS TOP N Worst Cells7
Table 3-2 Indicators Related with CS Call Drop9
Table 4-3 Parameters That 2G Shall Provide to 3G44
Table 4-4 Parameters That 3G Shall Provide to 2G44
Table 4-5 Resource KPIs and Alarm Thresholds48
Table 4-6 Adjusting Code Resource Allocation51
Table 4-7 Example of Parameter Modification for Rate Downgrade52
Table 4-8 Example of Power Control Parameter Modification53
Table 4-9 Example of Power Control Parameter Modification for Heavy-Traffic Cell 53
ZTE Confidential Proprietary copy 2012 ZTE CORPORATION All rights reserved VIII
UMTS KPI Optimization Analysis Guide Internal Use Only
1 OverviewThe radio network KPIs directly reflect the network quality and KPI monitoring is an important means to locate the faults KPI monitoring and optimization are mostly performed during the network operation and maintenance stage Abnormal events are supposed to be detected as early as possible and handled with proper solutions so that sound voice and data services can be ensured for the subscribers
At the beginning of the network construction the optimization team should put more emphasis on the RF adjustment rather than the optimization of KPIs except for CS call drop rate the PS call drop rate and the RTWP indicator During the network operation and maintenance stage KPI optimization (also called parameter optimization) plays the main role that is the optimization team should optimize a certain indicator through integrated parameter adjustment so as to meet the customerrsquos requirements
KPI data comes from NetNumenT31 the network management system in the operation and maintenance center (OMC) Based on the analysis on KPIs the current states of those indicators are learned and they are important reference for assessing the network performance The KPIs include the network service retaining capacity accessibility mobility system capacity and so on According to the current values of these indicators for example some site has congestion some site has a call drop rate of 10 or some RNC has a certain worst cell proportion busy cell proportion cell code resource availability access success rate call delay and handover success rate the optimization team should judge and locate the area scope and severity of the fault
KPIs are divided into service KPIs and network KPIs by the statistic sources Service KPIs are collected through field drive tests (DTs) while network KPIs are collected from the unified network management system This article mainly discusses the analysis on network KPIs Usually the final solution is made based on the joint analysis on the OMC KPI data alarms subscribersrsquo complaints and DT results
Figure 1-1 Joint KPI analysis
ZTE Confidential Proprietary copy 2012 ZTE CORPORATION All rights reserved 1
Hand to RampD dept or
customer service dept交研发或用
服处理
UMTS KPI Optimization Analysis Guide Internal Use Only
2 KPI Monitoring ProcessThe purpose of KPI monitoring is to find out abnormal events that affect services as well as subscribersrsquo perception and solve the problems as early as possible For instance if the call drop rate at a certain site goes over 50 we need to find the problem and work out the solution in the earliest time
As it is very urgent and important to locate KPI problems we need a whole set of scientific KPI monitoring mechanism and problem shooting process as well as appropriate monitoring tool and analysis tool to help us find the call drops caused by transmission problems resource congestion cells service interruption serious interference hardware fault with NodeB wrong configuration of RNC parameters in time
We classify KPI monitoring into four categories routine KPI monitoring KPI monitoring during the process of parameter modification KPI monitoring during the RNC or NodeB version upgrade and KPI monitoring during the process of cutover Routine KPI monitoring should be performed every day and be recorded in a KPI daily report which should involve the worst CS cell the worst PS cell the cell with the lowest RRC connection rate the cell with the most serious resource limit and so on
21 KPI Monitoring Process
KPI monitoring falls into four categories routine KPI monitoring KPI monitoring during the process of parameter modification KPI monitoring during the version upgrade of RNC or NodeB and KPI monitoring during the process of cutover Each type of monitoring has its own monitoring items and output form For instance the output of the routine KPI monitoring should be a daily report while the output of other KPI monitoring types should be a KPI comparison report Different types of KPI monitoring should have different time granularities according to the requirement of problem location
Routine KPI monitoring should be done persistently and be recorded in a daily report which should include a collection of the cells worst in different aspects and be sent to relevant person by email
22 Routine KPI Monitoring Process
Figure 2-2 Routine KPI monitoring process
ZTE Confidential Proprietary copy 2012 ZTE CORPORATION All rights reserved 2
Hand to RampD dept or
customer service dept交研发或用
服处理
UMTS KPI Optimization Analysis Guide Internal Use Only
ZTE Confidential Proprietary copy 2012 ZTE CORPORATION All rights reserved 3
Parameter problem
Hand to the planning personnel
Classification of the
worst cells
Problem handling team classifies
collects and locates the worst cells
Hand to the network
optimization personnel
Hand to RampD dept or
customer service dept交研发或用
服处理
Send email in fixed format to relevant
personnel
Coverage problem
Equipmentversion problem
Network KPI monitoring
( 15 minutes time granularity)
Screen out the worst cells with
KPI tool
EMS exports the one-day granularity
of the whole network
Output KPI daily report in Excel
UMTS KPI Optimization Analysis Guide Internal Use Only
23 KPI Monitoring Process During Parameter Modification
Figure 2-3 KPI monitoring process during parameter modification
Old parameter configuration
Configure data according to the
worksheet
Network KPI monitoring (15-
minute granularity)
Whether the KPIs at the
RNC level are normal
Keep on monitoring (15-
minute granularity)
Output a report in Word (hourly
granularity KPIs before and after the parameter modification)
End
Yes
Notify the person in charge by mail
or phone
Rollback or not
Locate the worst cells and check if they are caused
by the parameter modification
No
Yes
No
ZTE Confidential Proprietary copy 2012 ZTE CORPORATION All rights reserved 4
Network KPI monitoring
( 15 minutes time granularity)
UMTS KPI Optimization Analysis Guide Internal Use Only
24 KPI Monitoring During RNC or NodeB Version Upgrade
Figure 2-4 KPI monitoring workflow during RNC or NodeB version upgrade
ZTE Confidential Proprietary copy 2012 ZTE CORPORATION All rights reserved 5
Yes
No
No
End
Locate the worst cells Determine whether they are related with the version update
Yes
Network KPI monitoring
( 15 minutes time granularity)
Execute the worksheet to
upgrade version
Output formal Word report (Compare the hourly granularity KPIs before and after the parameter modification and output the result every hour)
Whether the RNC-level
KPI is normal
Keep on monitoring (15 minutes granularity)
Send mail to or call the person in charge
Rollback or not
Current version
UMTS KPI Optimization Analysis Guide Internal Use Only
25 KPI Monitoring During Cutover
For the network on which the equipment needs to be replaced (for instance HongKong CSL network for which we replaced Nokiarsquos equipment with ZTErsquos) after the network optimization is completed the subscribers on the existing network should be cut over to our network gradually During the cutover there will be subscribers registering on our network constantly which will cause load increase on the network In this case we should watch KPI changes closely The monitoring process items method and report are the same as those described in section 24 ldquoKPI Monitoring During RNC or NodeB VersionUpgraderdquo Please read it for reference
3 KPI Analysis Methods
31 KPI Analysis Methods
Different network problems require different performance analysis methods Choose one or more appropriate methods after learning the running state of the existing network and the problems with it Common analysis methods are as follows
TOP N worst cells method Based on the traffic statistics indicators we care about (such as the call drop rate connection rate and soft handoff failure rate) choose N worst cells whose average indicator values in the peak hours or of the whole day are the lowest as the target of fault analysis and optimization Or prioritize objects of optimization against these indicator values
Time tendency chart method Tendency chart of indicator change is commonly used in the traffic analysis The analysis engineer can work out an hourly daily or weekly tendency chart of one or more indicators of the whole network a cluster or a single cell and find out the change rule of traffic statistics indicators
Regional location method The change of network performance indicators often occurs in some regions The indicators in these regions may be worsened by traffic increase traffic mode change radio environment change faults with a small number of stations or uplinkdownlink interference which will therefore affect the performance indicators of the whole network By comparing the network performance indicators before and after the change we can mark out the station or the sector with the greatest indicator change on an electronic map and take these problem regions as the analysis focus
Comparison method A single traffic statistics indicator may be affected by many factors While some factors change others may not Choose a proper object for comparison to confirm the existence of problems and then analyze the causes of the problems When examining an indicator do not care whether the absolute indicator value is high or low only pay more attention to whether the value is high or low compared to other indicators instead
ZTE Confidential Proprietary copy 2012 ZTE CORPORATION All rights reserved 6
UMTS KPI Optimization Analysis Guide Internal Use Only
311 TOP N Worst Cells Method
During the whole process of KPI optimization analysis TOP N worst cells analysis method is the most effective one which can be used throughout the whole optimization phase By focusing on the TOP N worst cells you can solve the major problems with the network Abnormal call drop events may happen every day and these events may represent problems of a kind After solving the problems with TOP N cells you can solve the problems of the same kind Therefore focusing on TOP N cells is one of the most effective ways to solve problems
TOP N worst cells analysis method is applicable to the optimization analysis of all the indicators Choose TOP N worst cells according to a certain threshold which varies depending on different indicators N stands for the number of the worst cells When the worst cells are too many to be worked on the number of the worst cells can be decreased so that you can focus on them TOP N cells analysis method includes the following steps
Step 1 Screen out TOP N cells according to the condition of the indicators you care about
Step 2 Conduct a health check for TOP N cells Check whether there are any problems with transmission or boards and check whether the worst cells are caused by external abrupt incidents such as terrible weather gatherings or holiday (because during gatherings and holidays the traffic is usually heavy)
Step 3 Check the radio parameters configuration of these cells the radius of these cells and their neighboring cells and compare them with the normal cells
Step 4 Export the indicator relevant most closely with the indicators you care about and analyze it to find the problem indirectly
For instance one day CS call drop rate of a whole network was high We analyzed the problem by the TOP N cells analysis method
Step 1 Screen out TOP N cells according to the condition of the indicators you care about
We used the CNO KPI analysis function to screen out TOP N cells (other tools can be also used) and selected 10 cells with the highest CS call drop rate
Table 3-1 List of CS TOP N Worst Cells
Index Cell RNS subnet ID Cell IDCall drop
rate CS AMRNumber of call
drop voice
1 ZBL1U-AI-1 (201) 12911 4158 553
2 ZBL1U-AI-3 (201) 12913 3955 545
3HKE1U-5H-1
(203) 30461 1556 370
ZTE Confidential Proprietary copy 2012 ZTE CORPORATION All rights reserved 7
UMTS KPI Optimization Analysis Guide Internal Use Only
Index Cell RNS subnet ID Cell IDCall drop
rate CS AMRNumber of call
drop voice
4HKE1U-5H-3
(203) 30463 1581 360
5LAK1U-9M-3
(202) 11063 339 282
6 HIC1U-9R-1 RNC101(101) 10891 226 216
7LAK1U-9M-1
(202) 11061 249 215
8EBP1U-9R-3
RNC101(101) 12823 230 205
9SRS1U-5H-1
RNC102-CSL(102)
12091 392 169
10HRM1U-6R-1
RNC102-CSL(102)
20671 341 167
Step 2 Check the transmission and hardware of the TOP N cells and check whether they are caused by external abrupt incidents such as terrible whether gatherings or holidays when traffic is usually heavy
And then we conducted a health check for each cell and paid attention to routine alarms and BPC board problems We found there were broken associations in some HKE sites
Step 3 Check the radio parameters configuration of these cells the radius of these cells and their neighboring cells and compare them with the normal cells
(1)Problem with the cell radius After the check we found the cell radius of the LAK site was 25 km Because the LAK site was situated by the sea and the antenna was placed very high the radius of 25 km was far from enough So we changed the cell radius to 10 km and the problem of high call drop rate was thus solved
(2)Problem with configuration HIC site is an indoor POI site The RRU RxTx port and the RRU Rx port were configured reversely which is the cause of high call drop rate After modifying HIC we found that signals of the second RRU were received by the Rx port So we changed the configuration of the RxTx port and the Rx port the problem of high call drop rate was thus solved
Figure 3-5 RF configuration at HIC site
Figure 3-6 Antenna energy distribution at HIC site
ZTE Confidential Proprietary copy 2012 ZTE CORPORATION All rights reserved 8
UMTS KPI Optimization Analysis Guide Internal Use Only
Step 4 Export the indicator relevant most closely with the indicators you care about and analyze it to find the problem indirectly
Table 3-2 Indicators Related with CS Call Drop
Index Cell
RAB release number for Iu connection
release request by UTRAN for CS domain in
cell radio connection with UE lost
RAB release number for Iu connection
release request by UTRAN for CS domain in cell failure in
the radio Interface
procedure
RAB release number for Iu connection
release request by
UTRAN for CS domain in
cell release due to
overload control
RAB release number for Iu connection
release request by
UTRAN for CS domain in
cell unspecified
failure
Average cell freq RTWP (dbm)
1ZBL1U-AI-1
482 43 0 29 -104177
2ZBL1U-AI-3
473 40 0 33 -104125
3HKE1U-5H-1
346 16 0 8 -105908
4HKE1U-5H-3
330 18 0 13 -1060777
5LAK1U-9M-3
69 196 0 18 -1031906
6HIC1U-9R-1
100 100 0 16 -1015404
7 LAK1U- 64 131 0 20 -1031934
ZTE Confidential Proprietary copy 2012 ZTE CORPORATION All rights reserved 9
UMTS KPI Optimization Analysis Guide Internal Use Only
Index Cell
RAB release number for Iu connection
release request by UTRAN for CS domain in
cell radio connection with UE lost
RAB release number for Iu connection
release request by UTRAN for CS domain in cell failure in
the radio Interface
procedure
RAB release number for Iu connection
release request by
UTRAN for CS domain in
cell release due to
overload control
RAB release number for Iu connection
release request by
UTRAN for CS domain in
cell unspecified
failure
Average cell freq RTWP (dbm)
9M-1
8EBP1U-9R-3
98 90 0 17 -101413
9SRS1U-5H-1
87 59 0 22 -1043528
10HRM1U-6R-1
42 111 0 13 -1027697
32 Basic KPI Analysis Skills
Be able to use the KPI statistics tool and the analysis tool
Use tools to learn about the running state of the whole network quickly and screen out TOP N worst cells quickly
Use different analysis tools to find problems from different aspects and locate the problem quickly
Understand the signaling process and basic principle
In the process of abnormity location keep a clear aim in mind and be able to apply the process and basic principle to check the other relevant indicators rapidly to facilitate the analysis
Be familiar with the process and basic principle and be able to make logical association between abnormal KPI problems and network problems (such as the coverage problem and the interference problem) Be able to determine the problem nature according to the abnormal KPI and then choose the appropriate tool to analyze the problem in depth
Performance analysis requires engineers to understand basic signaling process be familiar with the protocol stacks of standard interfaces and know relevant algorithms to realize the product functions Engineers should at least have a concept about the various algorithms If the analysis of a commercial network involves some algorithms engineers should study these algorithms in depth
ZTE Confidential Proprietary copy 2012 ZTE CORPORATION All rights reserved 10
UMTS KPI Optimization Analysis Guide Internal Use Only
321 KPI Monitoring Tools
minus Network management tool NetNumenT31 count KPI original data alarm data radio parameter configuration in cells and parameter configuration on the earth
minus KPI daily report generating tool classify key indicators according to a certain condition and screen out the worst cells
322 KPI Analysis Tools
minus CNO Tool CNO tool has the KPI analysis function So using it you can screen out the worst cells according to various conditions and point out the corresponding counter of an indicator
minus SignalTrace Trace the signaling (RNL signaling and RNL signaling) of RNC interfaces which includes the Iu interface the Iur interface the Iub interface and the Uu interface (the signaling flow between RNC and UE at RRC layer) And RNL signaling trace is a common way for locating the KPI problem Being able to trace the RNC signaling is a basic requirement for the on-site KPI optimization engineers and the network optimization and maintenance engineers This signaling tracing tool is very powerful which can trace signaling according to the UE cell and IMSI in the KPI analysis According to the UE cell it can trace the signaling of multiple subscribers while according to IMSI it can trace the signaling of only one subscriber However if the RRC connection is not established yet signaling cannot be traced That is because only when RRC connection has been established can the RNC obtain the subscriberrsquos IMSI from the CN
minus RNC ASS Log ASS log is usually applied when there is abnormity and RNC signaling is out of trace In this case use ASS log to analyze the signaling before and after the abnormity occurs Abnormity can be queried according to IMSI or cell ID ASS log can be also used to collect various abnormities
minus NodeB LMT NodeB local operation and maintenance tool Apart from all the operation functions of the OMCB this tool can collect more detailed information about cells and UE NodeB local maintenance terminals include EOMS EFMS DMS and PMS
minus NodeB Abnormity Probe On the site of WCDMA commercial office NodeB abnormity probe is an effective tool to monitor the running state of the NodeB Every module of NodeB can record the abnormal information automatically which makes it easy to locate problems However this method requires professional knowledge such as knowledge about the function and interface of each module or board If the on-site engineers cannot make the simple analysis they can just obtain the abnormity probe and send it to the RampD engineers at the rear side The abnormities reported on the NodeB will be stored at the OMCB server according to different RNCs To conduct NodeB
ZTE Confidential Proprietary copy 2012 ZTE CORPORATION All rights reserved 11
UMTS KPI Optimization Analysis Guide Internal Use Only
abnormity probe analysis you need to download abnormity probe files from different OMCB servers and then use the abnormity probe tool to make a comprehensive analysis
minus CTS Tool CTS is a tool developed by the CN department which can trace signaling in depth according to IMSI and trace signaling across RNCs So this is particularly suitable to trace VIP subscribers In this case CTS is easier to use than SignalTrace which can only trace signaling of RNCs one by one CTS can trace the interactive signaling between network elements (NEs) within the CN as well as the signaling of the Iu interface and the Uu interface This kind of signaling tracing is what we called in-depth tracing The work principle of CTS is to set up an IMSI task on the CTS server and send it to the CN front side which will then send this task to each CN module via the interfaces dedicated to the CN modules and the RNC and then each module after receiving the signaling related to the IMSI task will send the signaling back to the CTS server via the CN front side The interfaces mentioned above are private interfaces so this tool can only support our own CN and RNC CTS signaling can be checked and analyzed with an offline tool but the offline tool does not work very well because of the lack of continuous optimization and perfection
minus UE log DT test is also an important auxiliary way in analyzing KPI indicators There are many problems that cannot be located by tracing signaling at the network side and can only be located by the use of UE log The commonly used drive test software includes QXDMAPEX (QCAT) CNTCAN and TEMS CNTCAN and TEMS are often used for network optimization For the use of CNTCAN please refer to the corresponding help file and the instruction document publicly released by the Network Optimization Tool Department QXDM and the analysis tool APEX (QCAT) provided by Qualcomm is very powerful which have contributed a lot for the stability and maturity of our system for many years
33 General Process of KPI Optimization Analysis
Basic analyzing ideas
KPI optimization is a process to find and solve problems KPI optimization during the operation and maintenance stage is mainly to pick out the performance data that needs special attention from the OMC classify these performance data and then compare the value of these data with that required by the operator If the value of an indicator is lower than the operatorrsquos requirement analyze this indicator and find out the factor that affect the indicator and then propose a solution to the operator If the values are higher than the operatorrsquos requirement therersquos no need to pay special attention to them
KPI analysis is a process from the whole to the part
Step 1 Check the key indicators from the view of the whole network If there is not any
ZTE Confidential Proprietary copy 2012 ZTE CORPORATION All rights reserved 12
UMTS KPI Optimization Analysis Guide Internal Use Only
problem just ignore them Otherwise try to locate the RNC NE that has the problem
Step 2 Analyze the indicators of the corresponding RNC to find out the RNC whose indicators have the problem
Step 3 Analyze the indicators of the cell under the problem RNC to find out the worst cells or TOP N cells If the indicators of all the cells under the RNC are tend to be low it is a common problem probably caused by parameter configuration And then check whether the radio parameter configuration in the cells under this RNC is the same as that in the cells under the normal RNCs
Step 4 Make a comprehensive analysis on the KPIs alarms DT test data and customer complains of the worst cells to find out a solution
Analysis method
After learning the KPI analysis ideas we must know some common KPI analysis methods to rule out causes of problems from the obvious ones to the hidden ones
For example we found that the TCP code words were strictly limited at eight sites near a park and the call drop rate rose suddenly How to solve this problem
Method one First we checked whether the alarms transmission and boards of these sites were normal After they are proved all normal we sent some engineers to the site to do test And meanwhile we traced the RNC signaling at the OMC It turned out that the test result was normal and the indicators of these sites of that day did not have any problem and code words were not limited And later we knew from the news that there was a big gathering of about one million people at the park at that moment Until then we came to know that the congestion was caused by too many users using the network at the same time
Method two First because the eight sites went worse all of a sudden it was unlikely that the problem lied in the hardware Then we checked whether the radio parameters had been modified the day before The result is no worksheet had been issued to modify those parameters and no alarm was found at those sites Therefore we excluded the possibility of hardware problem Then we checked the traffic trend graph of the last few days (over seven days) and found that the high call drop rate might be caused by high traffic The graph showed that traffic of each site rose suddenly on the day before Thus we came to the conclusion that this was an abnormal abrupt event which may have been caused by a gathering And later we were told that there was a big gathering at the park So we were assured the code words limitation and high call drop rate at the eight sites were caused by too many subscribers using the network at the same time
By comparing the two methods above we can find that although the first one (sending engineers to the site without the consideration of abnormal events) is commonly used it is inefficient and costs more resource The second method (analyzing the problem by the means of exclusion and association) is more efficient From this case we would like to emphasize that KPI analysis is a process of problem exclusion Using the comprehensive
ZTE Confidential Proprietary copy 2012 ZTE CORPORATION All rights reserved 13
UMTS KPI Optimization Analysis Guide Internal Use Only
methods (like Method One) at the first brush may be making a detour
minus Exclusion method Check the alarms on the OMC to learn about the state of the RNC NodeB BPC board and the transmission If there are obvious broken link in transmission or hardware problem the cause of the problem is easy to locate
minus Incident association If the problem is with a great number of sites take abrupt incidents into account such as large-scale gathering terrible weather of incorrect operation These incidents will put influence of different levels and ranges on the network indicators
minus Comparison of radio parameters If some site goes wrong in a sudden check whether the radio parameter configuration of this site is consistent with that of other normal sites If not change it as that of the normal sites because the indicator decrease may be caused by an incorrect modification of radio parameters
minus Relevant indicators association If a certain indicator is in poor condition check its relevant indicators and find the common problem from these relevant indicators
minus Comprehensive problem location When the above reasons are excluded use DT data KPI data RNC signaling analysis data to locate the problem with indicators comprehensively
ZTE Confidential Proprietary copy 2012 ZTE CORPORATION All rights reserved 14
UMTS KPI Optimization Analysis Guide Internal Use Only
Figure 3-7 KPI optimization analysis process
StartPick out
performance indexes
RNC index abnormal
Equipment alarms exist
Deal with equipment alarms
RNC index recovers
Common problem with the
worst cells
Transmission softwarehardware version wireless
parameter configuration
CNRNC Transmission
Hardware Software Interference
Wireless parameters
Time range
Abrupt and self-curable abnormality
helliphellip
Analyze and record causes
Suggestion about improvement
Common problems analysis
Problem resolved
Successful call
Call drop Soft handover
23G alternate operation
PS rate helliphellip
Deal with the relevant problem
Indexes normal
End
Climate change holidays assembly
transmission interruption power
fault and so on
Y
N
Y
Y
N
Y
N
Abnormal indexes analysis in one cell
Y
N
N
N
Y
N
Y
Show TOPN abnormal cells
and their locations
If the problem is proved to be equipment bug or system problem after
several attempts feed it back to RampD dept
ZTE Confidential Proprietary copy 2012 ZTE CORPORATION All rights reserved 15
UMTS KPI Optimization Analysis Guide Internal Use Only
4 KPI Optimization Analysis This chapter mainly demonstrates how to analyze the indicator problems from the aspect of OMC data and provides flowcharts for KPI optimization The detailed analyzing method and cases of every special subject can be checked in the optimization guides of all the subjects
41 CS Call Drop Optimization
The CS call drop rate is the most important indicator in KPI optimization
411 Definition of Call Drop
After checking the signaling on the Uu interface at the UE side the engineer can judge the situation a call drop if the Uu interface message satisfies one of the following three conditions during the calling process (in connection)
RNC Release is not received but the UE condition changes from CELL_DCH to IDLE
RRC Release is received and the released cause value is Not Normal
One of the following three messages mdash CC Disconnect CC Release Complete and CC Release mdash is received and the released cause value is Not Normal Clearing or Not Normal Unspecified
In a board sense the call drop includes the call drop rates of CN and UTRAN The call drop of UTRAN includes the following two aspects
After the successful service establishment RNC sends the RAB Release Request to CN
After the successful service establishment RNC sends the IU Release Request to CN Later RNC receives the IU Release Command from CN
Note that RAN call drop statistics which is defined from the aspect of lu interface signaling means the launching times of RAB Release Request and lu Release Request of RNC And the DT call drop statistics is defined from the aspects of the Uu interface message non-access stratum message and cause value RAN call drop statistics and DT call drop statistics are not exactly the same
ZTE Confidential Proprietary copy 2012 ZTE CORPORATION All rights reserved 16
UMTS KPI Optimization Analysis Guide Internal Use Only
412 CS Call Drop Analysis Flowchart
Figure 4-8 CS call drop analysis flowchart
ZTE Confidential Proprietary copy 2012 ZTE CORPORATION All rights reserved 17
UMTS KPI Optimization Analysis Guide Internal Use Only
Extract performance data
CS TOP Ncell filtering
Analyze a single cell
1 Check NE alarms
2 Associate emergencies
3 Compare parameter
configurations
4 Associate indicators
5 Locate the fault
comprehensively
Exist or not
Handle alarms
Solved or not
Yes
Yes
End
No
No
Exist or not
Handle emergencies
Solved or not
Yes
No
No
Exist or not
Correct wrong parameter
configurations
Solved or not
Yes
No
No
List related indicator counters
Call-drop-related
countersRTWP
Handover success rate
Traffic volume
Resource limit indicators
Checkamp analysis of
interference
Optimizationanalysis of
handover failures
Optimization analysis of
resource limitCall-drop-
related counters
C301230362C301230363C301230365C301230315C301230316C301230318C301230319C301230322C301230323
Solved or not
Yes
Yes
No
Drive Test+RNC signaling
trace
Yes
ZTE Confidential Proprietary copy 2012 ZTE CORPORATION All rights reserved 18
UMTS KPI Optimization Analysis Guide Internal Use Only
42 PS Call Drop Optimization
421 Optimization Flowchart
Figure 4-9 PS call drop optimization flowchart
ZTE Confidential Proprietary copy 2012 ZTE CORPORATION All rights reserved 19
UMTS KPI Optimization Analysis Guide Internal Use Only
Extract performance data
PS TOP Ncell filtering
Analyze a single cell
1 Check NE alarms
2 Associate emergencies
3 Compare parameter
configurations
4 Associate indicators
5 Locate the fault
comprehensive ly
Exist or not
Handle alarms
Solved or not
Yes
Yes
End
No
No
Exist or not
Handle emergencies
Solved or not
Yes
No
No
Exist or not
Correct wrong parameter
configurations
Solved or not
Yes
No
No
List related indicator counters
Call -drop-related
countersRTWP
Handover success rate
Traffic volume
Resource limit indicators
Check amp analysis of interference
Optimizationanalysis of
handover failures
Optimization analysis of
resource limitCall -drop-
related counters
C301230372C301230373C301230375C301230330C301230332C301230333C301230334C301230337C301230338
Solved or not
Yes
Yes
No
Drive Test +RNC signaling
trace
Yes
ZTE Confidential Proprietary copy 2012 ZTE CORPORATION All rights reserved 20
UMTS KPI Optimization Analysis Guide Internal Use Only
43 Optimization of Accessibility Indicators
Accessibility performance includes the success rate of RRC connection setup and the success rate of CSPS RAB assignment These two kinds of KPIs play important roles in the network optimization and directly influence the success rate of CSPS service establishment In this document this kind of problems are found from the aspect of OMC data and solved through parameter optimization
431 Definition of Access Failure
For the mobile originated call in the CS domain the access failure event means that the UE sends RRC REQUEST and IE establish cause is Originating Conversational Call but alerting of the direct transfer message is not received
The relevant events are defined as follows in the access failure stage
RRC connection setup failure After considering the resending times and the waiting time the UE sends RRC CONNECTION REQUEST and does not receive the response from RNC or RRC CONNECTION REJECT delivered by RNC
Initial direct transfer and security mode establishment failure After sending RRC CONNECTION SETUP COMPLETE the UE does not send NAS SETUP
RAB assignment failure After receiving CALL PROCEEDING the UE does not receive RB SETUP delivered by RNC Or the UE replies with RB SETUP FAIL after receiving RB SETUP Or the UE receives DISCONNECT with the cause value not being Normal Release after receiving RB SETUP At this time the UE has not reported RB SETUP CMP
Failure after RAB assignment After the UE sends RB SETUP COMPLETE the originating UE receives DISCONNECTRELEASE from CN Or the UE waits CONNECT or ALERTING overtime and launches the Call Clearing process Or the UE becomes IDLE before receiving Alerting and starts to receive the system message
For the mobile terminated in the CS domain the access failure event means that the terminating UE receives the paging of paging type 1 and does not send RRC CONNECTION REQUEST with the cause value being Terminating Conversational Call Or the UE does not send the alerting of direct transfer message to CN after sending RRC CONNECTION REQUEST
The relevant events are defined as follows in the access failure stage
RRC connection setup failure After sending RRC CONNECTION REQUEST the UE does not receive the response from RNC or RRC CONNECTION REJECT delivered by RNC
Initial direct transfer and security mode establishment failure After sending RRC
ZTE Confidential Proprietary copy 2012 ZTE CORPORATION All rights reserved 21
UMTS KPI Optimization Analysis Guide Internal Use Only
CONNECTION SETUP COMPLETE the UE does not receive the SETUP direct transfer message Or the UE sends RELEASE COMPLETE Or the UE receives DISCONNECT from CN
RAB assignment failure The UE does not receive RB SETUP delivered by RNC after sending CALL CONFIRM Or the UE replies with RB SETUP FAIL after receiving RB SETUP Or the UE receives DISCONNECT with the cause value not being Normal Release after receiving RB SETUP At this time the UE has not reported RB SETUP CMP
Failure after RAB assignment After the UE sends RB SETUP COMPLETE the terminating UE receives DISCONNECTRELEASE from CN
432 Analysis on RRC Connection Failures
The problem of RRC connection setup failure can be analyzed through the UE signaling flow and RNC single-user tracing The RRC connection setup includes the following steps
The UE sends RRC Connection Request through the RACH channel
RNC sends RRC Connection Setup through the FACH channel
The UE sends RRC Connection Setup Complete through the dedicated uplink channel after the downlink dedicated channel is established and synchronized
RRC connection setup failures are always caused by following issues
Uplink RACH problem
Problem about downlink FACH power allocation proportion
Parameter reselection problem of the cell
Low downlink dedicated initial transmitting power
Uplink initial power control problem
Congestion
Equipment malfunctions
Among these issues the problems of uplink RACH downlink FACH power allocation proportion parameter reselection of the cell and equipment malfunctions appear more frequently
ZTE Confidential Proprietary copy 2012 ZTE CORPORATION All rights reserved 22
UMTS KPI Optimization Analysis Guide Internal Use Only
4321 Analysis Flowchart of RRC Connection Setup Failures
Figure 4-10 Analysis flowchart of RRC connection setup failures
ZTE Confidential Proprietary copy 2012 ZTE CORPORATION All rights reserved 23
UMTS KPI Optimization Analysis Guide Internal Use Only
Extract performance data
TOP Ncell filtering
Analyze a single cell
1 Check NE alarms
2 Associate emergencies
3 Compare parameter
configurations
4 Associate indicators
5 Locate the fault
comprehensive ly
Exist or not
Handle alarms
Solved or not
Yes
Yes
End
No
No
Exist or not
Handle emergencies
Solved or not
Yes
No
No
Exist or not
Correct wrong parameter
configurations
Solved or not
Yes
No
No
List related indicator counters
Counters related to RRC setup
failuresRTWP
Resource limit
indicators
Checkamp analysis of interference
Optimization analysis of
resource limitCounters related
to RRC setup failures
C301480485C301480486C301480487C301480489C301480490C301480491C301481288C301481289C301481337C301481338C301481339C301481407C301481408
Solved or not
Yes
Yes
No
Drive Test+RNC signaling
trace
Yes
ZTE Confidential Proprietary copy 2012 ZTE CORPORATION All rights reserved 24
UMTS KPI Optimization Analysis Guide Internal Use Only
4322 UE sends RRC Connection Request but RNC does not receive it
If the EcIo of downlink CPICH is relatively low it is the problem of coverage
If the EcIo of downlink CPICH is not very low (for example the value is larger than -14 dB) Usually it is the problem of RACH and the following issues may cause the problem
minus The power of Preamble does not rise to a required value and the rising times of Preamble should be increased
minus The output power of UE is lower than the required value which is caused by poor UE performance In this case the UE should be changed
minus The NodeB equipment has a standing wave and the engineer should check whether NodeB has any SWR alarm
minus The radius of the cell is set improperly If the radius parameter of the cell is set too small the NodeB can not synchronize the UE beyond the range of the radius and the access fails This problem often happens in the places with large coverage such as the rural areas and the suburbs
4323 RNC delivers RRC Connection Reject after receiving RRC Setup Request
When RRC Connection Reject appears the engineer should check the specific reject cause value Usually there are two kinds of causes
The CPU load of RNC control plane board is too heavy and more boards should be added
DCH and FACH admission is rejected However this situation does not always happen
4324 UE does not receive RRC Connection Setup delivered by RNC
This problem may be caused by the following reasons
Poor coverage
Improper parameters of cell selection and reselection
Checking method The engineer should check the EcIo of CPICH If the value is lower than -12 dB (EcIo is -12 dB by default) and there is no cell of better quality in the monitor set the cause of this problem is poor coverage If there is better cell in the monitor set cell reselection may cause this problem
Poor coverage can be improved by coverage enhancement such as adding some sites to cover the places without signal coverage and adjusting the engineering parameters If the coverage can not be improved the engineer can enhance the FACH power according to
ZTE Confidential Proprietary copy 2012 ZTE CORPORATION All rights reserved 25
UMTS KPI Optimization Analysis Guide Internal Use Only
the PCPICH EcIo coverage of the current network For example if all the pilot EcIo values are larger than -12 dB in the coverage area the power proportion of the common channel should be configured on the basis of the situation that the EcIo value is larger than -12 dB And so the success rate of the idle UE assessment can be ensured
As for the access problem caused by cell selection and reselection the engineer can speed up the cell selection and reselection by adjusting the cell selection and reselection parameters and the problem of RRC connection setup failure caused by improper cell selection and reselection parameters can be solved
Note
The RRC Connection Setup message is borne by FACH RRC Connection Request sent by the UE is received by UTRAN at the preamble of PRACH and then it is sent from the RACH channel based on the current preamble power And the transmit power of preamble can rise all the time until the response is received (There is a limitation for the maximum number of preamble retransmissions) Therefore in the areas with poor coverage the RACH coverage and FACH coverage may become unbalanced and as a result UTRAN can receive RRC Connection Request sent by the UE but the UE can not receive RRC Connection Setup sent by RNC
4325 UE receives RRC Connection Setup and does not send RRC Setup Complete
If the downlink signal quality is normal this problem may be caused by the abnormal condition of the cell phone
Another reason of this problem may be the downlink synchronization failure caused by the low initial power of downlink dedicated channel You can solve this problem by adjusting the service downlink EbNo
4326 RNC does not receive RRC Setup Complete sent by UE
Because the uplink initial power control may increase the UE transmit power this kind of problem seldom appears If it appears the engineer can increase the Constant Value of the dedicated channel properly to raise the uplink DPCCH initial transmission power of the UE
At the same time this problem is also relevant with the uplink SIR initial target value configuration because this value may affect the uplink initial synchronization at the initial stage of link setup If the value of the parameter is set too large there will be too much uplink inference brought by the initial setup of the link If the value is set too small the uplink synchronization will take longer time and the initial synchronization may even fail This parameter is an RNC-level parameter which has a great influence on network performance Therefore the engineer should be cautious while adjusting this parameter
ZTE Confidential Proprietary copy 2012 ZTE CORPORATION All rights reserved 26
UMTS KPI Optimization Analysis Guide Internal Use Only
Note
RRC Connection Setup Complete is sent through uplink DPCH and the UE calculates the initial power of uplink DPCCH according to the received IErdquoDPCCH_Power_offsetrdquo and the measured CPICH_RSCP value
DPCCH_Initial_power = DPCCH_Power_offset - CPICH_RSCP
DPCCH_Power_offset = Primary CPICH DL TX Power + UL Interference + Constant Value The Constant Value can be configured in the OMC If this value is set too small the UE may not have enough power to send RRC Connection Setup Complete
433 Analysis on RABRB Setup Failures
When RAB or RB setup fails RNC will send RAB Assignment Fail in the RAB Assignment Response signaling The engineer can find out the specific failure reason from the failure cause value carried in relevant cells The reasons for common RABRB setup failures include
RNC directly rejecting RAB Setup Request because of wrong parameter configuration
Admission reject
RAB setup failure because the UE fails to respond to RB Setup Request
RAB setup failure because the Uu interface fails to set up RB
ZTE Confidential Proprietary copy 2012 ZTE CORPORATION All rights reserved 27
UMTS KPI Optimization Analysis Guide Internal Use Only
4331 Analysis Flowchart of RAB Setup Failures
Figure 4-11 Analysis flowchart of RAB setup failures
ZTE Confidential Proprietary copy 2012 ZTE CORPORATION All rights reserved 28
UMTS KPI Optimization Analysis Guide Internal Use Only
Extract performance data
TOP Ncell filtering
Analyze a single cell
1 Check NE alarms
2 Associate emergencies
3 Compare parameter
configurations
4 Associate indicators
5 Locate the fault
comprehensively
Exist or not
Handle alarms
Solved or not
Yes
Yes
End
No
No
Exist or not
Handle emergencies
Solved or not
Yes
No
No
Exist or not
Correct wrong parameter
configurations
Solved or not
Yes
No
No
List related indicator counters
Counters related to RAB setup failures RTWP
Resource limit
indicators
Checkamp analysis of interference
Optimization analysis of
resource limitCounters related to RAB setup failures
CS domain PS domainC301230290 C301230302C301230291 C301230303C301230292 C301230304C301230293 C301230305C301230294 C301230306C301230295 C301230307C301230296 C301230308C301230297 C301230309C301230298 C301230310C301230299 C301230311C301230300 C301230312C301230301 C301230313
Solved or not
Yes
Yes
No
Drive Test+RNC signaling
trace
Yes
ZTE Confidential Proprietary copy 2012 ZTE CORPORATION All rights reserved 29
UMTS KPI Optimization Analysis Guide Internal Use Only
4332 RNC Directly Rejecting RAB Setup Request Because Of Wrong Parameter Configuration
The case that RNC responds with RAB Setup Failure directly is seldom caused by invalid parameter configuration in the business network Usually this case is caused by special operations of the special users
The main scenario is that the subscription information of the userrsquos PS service is beyond the capability of the UE which leads to the direct refusal from RNC For example a special userrsquos subscription rates of uplink and downlink are 384 K but the maximum uplink rate of the UE is only 64 K The maximum uplink and downlink rates of the QoS message used for activating PDP set by the AT command or mobile terminal software used by the user are 384 K so the RNC will find the maximum uplink rate is beyond the UErsquos capability directly reply with RAB Setup Failure and will not launch the RB setup process when it receives RAB Assignment Request
After the RAB setup fails because the parameter configuration is beyond the UErsquos capability SGSN will negotiate again to launch the new RAB assignment until the UE has the capability to support the assignment and the RAB assignment is finished For the users the PDP activation is still successful and the actual maximum rate is the maximum rate the UE can support
However if the minimum guaranteed bit rate required by the QoS setting in the UErsquos PDP activation request is beyond the UErsquos capability though the network negotiates a lower rate to accept the UErsquos PDP activation request the UE will launch the request of deactivating PDP when it finds that the rate negotiated by the network in PDP activation accept request is lower than the minimum guaranteed bit rate and finally the PDP activation can not be completed
4333 Admission Reject
For the non-HSDPA user if there are insufficient system resources (including power channel code lub transmission resource and CE) the call establishment failure will be caused by the admission reject At this time it is necessary to check the network load code resource lub transmission resource and CE resource occupation to make sure the congestion is caused by the limitation of a certain kind of resource What is more the engineer should plan the corresponding expansion method
If the cell does not support the HSDPA service the R99 user admission is judged according to the fixed R99 admission threshold If the cell supports the HSDPA service and the HSDPA and R99 dynamic power is allocated the uplink admission of non-HSDPA is judged based on RTWP or the equivalent user number If the uplink load is too heavy the non-HSDPA user admission will also fail
If the bandwidth configuration on the lub interface is insufficient the lub interface will reject the R99 data service activation because of limited bandwidth
ZTE Confidential Proprietary copy 2012 ZTE CORPORATION All rights reserved 30
UMTS KPI Optimization Analysis Guide Internal Use Only
The admission control of the NodeB Credit resource is similar to the power admission control Whether the remaining Credit can support the currently requested service or not can be judged according to the spectrum spreading factor of the new access user According to the condition of the RAB Downsizing Switch RNC will deal with the issue in the corresponding way
For the HSDPA user in the dynamic power allocation mode besides the mentioned system resources such as the power channel code lub transmission resource and CE the admission reject should take into consideration whether the number of H users supported by NodeB and the number of H users supported by the cell are over the regulated threshold or not into consideration
For the HSDPA user when the bandwidth configuration on lub interface is insufficient the admission reject will not happen but the rate will be reduced What is more the AAL2PATHs of HSDPA and R99 are configured respectively and the HSDPA AAL2PATH must be configured to the HSDPA_RT or HSDPA_NRT type If the HSDPA AAL2PATH is configured to RT or NRT of R99 AAL2PATH type the RAB assignment failure will not happen but RNC will establish the HSDPA service as R99 384 Kbps
For the downlink power admission
Besides whether the R99 service load is over the non-HSDPA service threshold DCH service should take into consideration whether non-HSDPA power and HSDPA GBP (the minimum power needed for the guaranteed bit rate) are over the general power threshold of the cell
For the HSDPA service it is necessary to check whether the throughput rate provided by the cell is over the sum of all the usersrsquo GBR thresholds or whether the GBPs of the stream service and the background service are over the HSDPA power of the cell At the same time whether the non-HSDPA power and the HSDPA GBP (the minimum power needed for the guaranteed bit rate) are over the overall power threshold of the cell should be also taken into consideration
For the lub admission
For the DCH service the admission is made according to the multiplication of the peak rate and the service activation factor
For HSDPA service the admission is made according to the GBR
If the lub exceeds the congestion threshold the DCCC rate reduction will be triggered And if the RLC_AM retransmission rate is over a certain threshold the Iub Overbooking switch can be opened to trigger the TF which limits R99 or to reduce the rate of HSDPA service by a certain factor
ZTE Confidential Proprietary copy 2012 ZTE CORPORATION All rights reserved 31
UMTS KPI Optimization Analysis Guide Internal Use Only
4334 RAB Setup Failure Because the UE Fails to Respond to RB Setup
The UE fails to respond to RB setup mainly because of the userrsquos operation
Take the following cases as examples
When the user already has had the downlink 12 K data service he receives RB Setup Request of the VP service (either the originated call in the VP domain or the terminated call in the VP domain) Because the UE does not support the VP and high-speed PS service in the downlink at the same time it directly replies with RB Setup Failure and the cause value is unsupported configuration
Compared with the WCDMA subscriber originating the VP service the terminating subscriber resides in the GSM network and so it does not support the VP service After RNC receives RAB Assignment Request the core network will deliver the Disconnect command right after call proceeding and the cause value is Bearer capability not authorized At this time the UE has just received the RB SETUP command and has no enough time to finish the RB setup So the UE will reply with RB Setup Failure after it receives the Disconnect command and the RNC will reply with RAB Setup Failure with the cause value being failure in radio interface procedure
4335 RAB Setup Failure Because the Uu Interface Fails to Set Up RB
RNC sends the Radio Bearer Setup command to the UE but fails to receive Radio Bearer Setup Compete This kind of situation (RB setup failure) often appears in the cells with weak signals There are two causes of weak signals one is that the UE does not reside in the best server to launch the access and the other is poor coverage
If the UE does not reside in the best server to launch the access it will hope to enter the best server through active set update in the RB setup process (At the same time the fast signal change will drastically weaken the signals in the cell) but the active set update can only be processed after the RB setup is completed because the procedures can not be processed alternately (Neither the network nor the terminal supports it) Therefore RB can only be set up in the cell with weak signals and the setup is easy to fail As for this situation the starting threshold and speed of co-frequency cell reselection should be increased to make the UE reside in the best server and launch the access as soon as possible
RB setup failure may be caused by the poor downlinkuplink coverage If the failure is caused by downlink coverage the UE can not receive the Radio Bearer Setup command which may be caused by the uplink interference and this can be fixed through checking RTWP The poor downlink coverage is partly caused by the bad UE demodulation performance and other causes should be solved by RF optimization
ZTE Confidential Proprietary copy 2012 ZTE CORPORATION All rights reserved 32
UMTS KPI Optimization Analysis Guide Internal Use Only
44 Optimization of Mobility Indicators
Mobility indicators mainly fall into three categories mdash soft handovers hard handovers and inter-RAT handovers The handover problems usually happen in the following cases
The best server changes too fast or there is no best server due to pilot pollution
The handover is not prompt or there are pingpong handovers due to improper parameter configuration
Adjust the engineering parameters for antennas in areas with severe pilot pollution And adjust the handover parameters such as the values of 1A 1B CIO TTT (time to trigger) Hysteresis and so on to solve the problem that the handover is not prompt or there are pingpong handovers This section tries to solve this kind of problems through OMC data analysis and parameter optimization
441 Optimization of Soft Handovers
Missed neighboring cell configuration pilot pollution improper soft handover parameter configuration and equipment malfunctions are the major causes of soft handover failures To confirm the problems the field DTs are required
ZTE Confidential Proprietary copy 2012 ZTE CORPORATION All rights reserved 33
UMTS KPI Optimization Analysis Guide Internal Use Only
4411 Soft Handover Optimization Flowchart
Figure 4-12 Soft handover optimization flowchart
ZTE Confidential Proprietary copy 2012 ZTE CORPORATION All rights reserved 34
UMTS KPI Optimization Analysis Guide Internal Use Only
Extract performance data
TOP Ncell filtering
Analyze a single cell
1 Check NE alarms
2 Associate emergencies
3 Compare parameter
configurations
4 Associate indicators
5 Locate the fault
comprehensive ly
Exist or not
Handle alarms
Solved or not
Yes
Yes
End
No
No
Exist or not
Handle emergencies
Solved or not
Yes
No
No
Exist or not
Correct wrong parameter
configurations
Solved or not
Yes
No
No
List related indicator counters
RTWPResource
limit indicators
Checkamp analysis of interference
Optimization analysis of
resource limitCounters related to intra-frequency
handover failures
C301391101 C301390593C301391102 C301390594C301391103 C301390595C301390586 C301390596C301390587 C301390597C301390588 C301390598C301390589 C301390599C301390590 C301390600C301390591 C301390601C301390592 C301390602
Solved or not
Yes
Yes
No
Drive Test+RNC signaling
trace
Yes
Counters related to soft handover
failures
30055 3005630057 3005830059 3006030061 30062
Cell hand-inhand-out indicators
ZTE Confidential Proprietary copy 2012 ZTE CORPORATION All rights reserved 35
UMTS KPI Optimization Analysis Guide Internal Use Only
4412 Checking Missed Neighboring Cell Configuration
Generally speaking most of the call drops at the beginning of the optimization are caused by missed neighboring cell configuration The following methods are often used to judge whether the call drops are caused by missed configuration of co-frequency neighboring cells
Observe the active set EcIo information recorded by the UE and the Best Server EcIo information recorded by the Scanner before the call drop If the former record is very bad but the latter record is very good then check whether the Best Server scrambling code recorded by the Scanner appears in the latest list of the neighboring cells under intra-frequency measurement control If it does not then the call drop is caused by missed neighboring cell configuration
If the UE re-accesses immediately after the call drop and the cell scrambling codes during the UE reaccess and those during the call drop are different then the call drop may also be caused by missed neighboring cell configuration You can confirm it through measurement control (look backwards from the message of the call drop event for the latest intra-frequency measurement control message and check the neighboring cell list of this message)
Some UE may report the Detected Set information If the corresponding scrambling code appears in the Detected Set information before the call drop then the call drop is caused by missed neighboring cell configuration
4413 Checking Pilot Pollution
Definition of pilot pollution Excessive strong pilot signals exist at a certain point but none of them is strong enough to be the best server To form pilot pollution the following points in this definition should be satisfied
Strong pilot signal The absolute pilot signal strength is used to judge whether the pilot signal is a strong one The pilot signal strength can be evaluated through the pilot RSCP If the pilot RSCP exceeds a threshold it is considered a strong pilot signal The formula is
AbsoluteRSCPThRSCPCPICH __ gt
Excessive The number of pilot signals is used to judge whether there are excessive pilot signals at a certain point If the number exceeds a threshold it is regarded that excessive pilot signals exist at this point The formula is
NThNumberCPICH gt_
None of them is strong enough to be the best server The relative strength of a pilot signal is a key factor in judging whether the pilot signal is strong enough Based on the above definition and formulae if the difference between the strength of the
ZTE Confidential Proprietary copy 2012 ZTE CORPORATION All rights reserved 36
UMTS KPI Optimization Analysis Guide Internal Use Only
strongest pilot signal and that of the )1( +NTh strongest pilot signal at this point is
less than a threshold it is regarded that there is no pilot signal strong enough to be the best server at this point The formula is
lativeRSCPthThbest ThRSCPCPICHRSCPCPICHN Re_)1( )__( ltminus +
According to the above description it is regarded that pilot pollution exists if the following conditions are both satisfied
The number of pilot signals that meet the condition
AbsoluteRSCPThRSCPCPICH __ gt is more than NTh
lativeRSCPthThbest ThRSCPCPICHRSCPCPICHN Re_)1( )__( ltminus +
For example during the network optimization suppose
dBmTh AbsoluteRSCP 95_ minus= 3=NTh and dBTh lativeRSCP 5Re_ = if the following
conditions are both satisfied then it is regarded that pilot pollution exists
The number of the pilot signals that meet the condition
dBmRSCPCPICH 95_ minusgt is more than 3
dBRSCPCPICHRSCPCPICH thbest 5)__( 4 ltminus
4414 Adjusting Soft Handover Algorithm Parameters
You can solve the following kinds of problems by adjusting handover algorithm parameters
1 The handover is not prompt
From the perspective of the CS service signaling flow the symptom of this problem is that the UE cannot receive Active Set Update (physical channel reallocation in the case of the intra-frequency hard handover) because after the UE reports the measurement report the source cell has a fast reduction in EcIo When the RNC sends Active Set Update the UE has closed the transmitter due to the loss of downlink synchronization Viewed from the UE side it cannot receive Active Set Update In the PS services if the UE cannot receive Active Set Update or TRB resets before the handover the handover will also fail
From the perspective of signals the following phenomena may accompany this problem
ZTE Confidential Proprietary copy 2012 ZTE CORPORATION All rights reserved 37
UMTS KPI Optimization Analysis Guide Internal Use Only
minus Corner effect EcIo of the source cell decreases drastically and EcIo of the target cell increases sharply (very high when it appears)
minus Fast fading EcIo of the source cell decreases quickly for a while and then increases and EcIo of the target cell increases for a short while
2 Pingpong handovers The following phenomena may accompany this problem
The best server changes quickly Two or more cells take turns to be the best server But as the best server none of the cells can last long though they has good RSCPs and EcIos
There is no best server There are multiple cells Their RSCPs are normal and similar to each other But EcIo of every cell is very bad
From the perspective of the signaling flow Event 1A is reported immediately after one cell is deleted Because the UE cannot receive Active Set Update from the RNC the handover fails
4415 Equipment Malfunctions
First check the alarm console to see whether there are abnormal alarms and analyze the message traces at the same time Find out in which step the soft handover fails Check the failure message and contact the local product maintaining engineer to confirm whether the equipment has malfunctions
4416 Solutions
Corresponding adjustments should be taken for the confirmed problems
Handover failures caused by pilot pollution Adjust the engineering parameters of a certain antenna to set this antenna as the best server in this interfered location If the power of one of its sectors is reduced then Io of the pilot pollution area will decrease even if the powers of other pilots are not adjusted EcIo will also increase Thereby the EcIo differences with other scrambling codes in the active set will become larger and pilot pollution will be eliminated Through a lot of research ZTE has proved that the reduction in the pilot transmit power will not change cell capacity greatly If condition allows new base stations can be added to cover this area
Equipment malfunctions Consult the customer service engineers and ask them to help check whether there are alarms and whether the transport layer is abnormal If there are alarms coordinate with the customer service engineers and the engineering personnel to solve the problems
Call drops because the handovers are not prompt
ZTE Confidential Proprietary copy 2012 ZTE CORPORATION All rights reserved 38
UMTS KPI Optimization Analysis Guide Internal Use Only
minus Adjust the antenna to expand the handover zone
minus Configure the Event 1A handover parameters to make the handover easier to happen
minus Increase CIO to make the handover happen earlier in the target cell The sum of CIO and the actually measured value is used for judging the UE events including the UE intra-frequency handover CIO helps shift the cell border in the handover algorithm If CIO is configured with a larger value the handover will be easier to happen and there will be more UE in the soft-handover status but more resources will be occupied If CIO is configured with a smaller value the soft handover will be more difficult to happen and the receiving quality may be impaired A CIO of about 5dB is quite good for eliminating the fast fading and the corner effect but this configuration has some side effects such as the increase of handover proportion
Call drops caused by pingpong handovers Adjust the antenna to form a best server in its coverage zone or set the Event 1B handover parameters (increase the threshold of Event 1B the Event 1B hysteresis or the time to trigger Event 1B) to increase the difficulty in deleting the active set
442 Optimization of Hard Handovers
4421 Classification of Hard handovers
Hard handovers mainly fall into two classifications
Intra-frequency hard handovers The intra-frequency hard handover is triggered only when the intra-frequency softsofter handover cannot be performed and it is applicable to the following circumstances
minus Inter-RNC intra-frequency cell handovers when there is no Iur interface
minus Insufficient Iur interface resources though there is the Iur interface
minus Handovers controlled by the threshold of the PS service rate in the handover cell
The intra-frequency softsofter handovers can not be performed (intra-frequency hard handover should be triggered) in the following scenarios
minus When the intra-frequency handover happens the UE is using the transmit diversity in the active set cell but the target cell does not support the transmit diversity
minus The intra-frequency measurement report does not contain OFF and TM of the
ZTE Confidential Proprietary copy 2012 ZTE CORPORATION All rights reserved 39
UMTS KPI Optimization Analysis Guide Internal Use Only
target cell
minus When the intra-frequency handover happens between RNCs the Iur interface is unavailable
minus The UE performs the multiuser detection in the active set cell but the target cell does not support the multiuser detection
minus The target cell and the original cell belong to different classifications (The cells of R99 R5+R99 and R6+R5+R99 belong to the same classification while the cells of R5 and R6+R5 belong to another classification)
Inter-frequency hard handovers The inter-frequency hard handover means a UE connection is handed over from a cell of a UTRAN frequency to a cell of another frequency Many factors including the radio quality the load and the speed of the moving UE may trigger inter-frequency hard handovers
For example the radio quality triggers the inter-frequency hard handover in the following way
When the quality of the UE radio frequency becomes lower the inter-frequency measurement will be triggered and according to the measurement result the UE connection will be handed over to a better frequency
ZTE Confidential Proprietary copy 2012 ZTE CORPORATION All rights reserved 40
UMTS KPI Optimization Analysis Guide Internal Use Only
4422 Hard Handover Optimization Flowchart
Figure 4-13 Hard handover optimization flowchart
ZTE Confidential Proprietary copy 2012 ZTE CORPORATION All rights reserved 41
UMTS KPI Optimization Analysis Guide Internal Use Only
Extract performance data
TOP Ncell filtering
Analyze a single cell
1 Check NE alarms
2 Associate emergencies
3 Compare parameter
configurations
4 Associate indicators
5 Locate the fault
comprehensive ly
Exist or not
Handle alarms
Solved or not
Yes
Yes
End
No
Exist or not
Handle emergencies
Solved or not
YesNo
Exist or not
Correct wrong parameter
configurations
Solved or not
Yes
No
No
List related indicator counters
RTWPResource
limit indicators
Checkamp analysis of interference
Optimization analysis of
resource limit
Counters related to inter-frequency handover failures
C301110489 C301110516C301110499 C301110517C301110500 C301110518C301110501 C301110519C301110502 C301110520C301110503 C301110521C301110504 C301110522C301110505 C301110523
Solved or not
Yes
Yes
No
Drive Test+RNC signaling
trace
Yes
Counters related to hard handover
failures
30041 3004230043 3004430045 3004630047 30048
Cell hand-inhand-out indicators
NoNo
ZTE Confidential Proprietary copy 2012 ZTE CORPORATION All rights reserved 42
UMTS KPI Optimization Analysis Guide Internal Use Only
4423 Hard Handover Optimization Methods
The optimization flow for the hard handover is similar to that of the soft handover The major differences are in the parameter optimization To optimize intra-frequency hard handovers you can properly reduce the Event 1D hysteresis and the time to trigger Event 1D according to the real radio environment to ensure timely handovers
Inter-frequency coverage is often applied to some special scenarios such as indoor coverage and tested through CQT The method of judging whether there is missed configuration of the inter-frequency neighboring cell is almost the same as that of the co-frequency neighboring cell when a call drop occurs the UE fails to measure or report the inter-frequency neighboring cell after the call drop the UE resides in the inter-frequency neighboring cell again
The common hard handover problems are
1 The handover is not prompt The common symptoms are frequent call drops in the hard handovers when the UE moves
Solutions
Increase the threshold of activating the compressing mode The compressing mode is usually activated before the inter-frequency handover or the inter-RAT handover and it is used to measure the quality of the inter-frequency or inter-RAT cell You can set a threshold of the CPICH RSCP or EcIo to activate the compressing mode And the RSCP is widely used
minus Requirements on setting the threshold of activating the compressing mode Before the cell quality becomes low enough to cause a call drop the signal of the target cell should be measured and reported and the handover should be performed
minus Requirement on setting the threshold of deactivating the compression mode Frequent activationdeactivation of the compression mode should be avoided
Increase CIOs of the inter-frequency cell pair
Reduce the threshold of triggering the target frequency handover under the inter-frequency coverage
2 There are pingpong handovers
Solution Increase the hard handover hysteresis and the time to trigger the event
ZTE Confidential Proprietary copy 2012 ZTE CORPORATION All rights reserved 43
UMTS KPI Optimization Analysis Guide Internal Use Only
443 Optimization of Inter-RAT Handovers
4431 Configuring Basic Inter-RAT Parameters
Most of the inter-RAT handover failures are caused by incomplete parameter configuration The following parameters need special attention
Complete RNC parameter configuration for the GSM neighboring cell The 2G system shall provide the 3G system with the correct radio parameters based on negotiation mdash MCC MNC LAC ID (CI) NCC BCC frequency band indicator (900 or 1800) and BCCH
Table 4-3 Parameters That 2G Shall Provide to 3G
MCC MNC LACIDCI
NCC BCCFrequency
band indicator
BCCH
460 2 202 193 0 0 900 102
Complete GSM BSC parameter configuration for the WCDMA neighboring cell The 3G system shall provide the 2G system with the correct radio parameters based on negotiation mdash MCC MNC LAC RNC ID cell ID (C_ID) downlink frequency scrambling code and RAC
Table 4-4 Parameters That 3G Shall Provide to 2G
MCC MNC LACRNC
IDCell IDC_ID
Downlink frequency
Scrambling code
RAC
460 3 20 18 51 10787 51 20
According to the current strategy of one-way inter-RAT handovers if the parameter configuration is complete one probable cause of the inter-RAT handover failure is that the handover is not prompt The common parameter adjustment is to increase CIO the threshold to activatedeactivate the compressing mode and the threshold to trigger the WCDMA-to-GSM handover at the same time
Call drops during the inter-RAT handovers between WCDMA and GSM may be caused by
minus Inconsistent data configuration at the GSM side and the WCDMA side after GSM modifies the configuration data but does not inform WCDMA
minus Missed configuration of neighboring cells which can be solved by the correct configuration of neighboring cells
minus Too fast signal changes
ZTE Confidential Proprietary copy 2012 ZTE CORPORATION All rights reserved 44
UMTS KPI Optimization Analysis Guide Internal Use Only
minus Pingpong reselection
minus Faults with the UE for example the UE fails to respond to the handover or report the inter-RAT measurement report
minus Changes of the best server during the physical channel reallocation
minus Wrong LAC configuration which can be located through data configuration check
ZTE Confidential Proprietary copy 2012 ZTE CORPORATION All rights reserved 45
UMTS KPI Optimization Analysis Guide Internal Use Only
4432 Inter-RAT Handover Optimization Flowchart
Figure 4-14 Inter-RAT handover optimization flowchart
ZTE Confidential Proprietary copy 2012 ZTE CORPORATION All rights reserved 46
UMTS KPI Optimization Analysis Guide Internal Use Only
Extract performance data
TOP Ncell filtering
Analyze a single cell
1 Check NE alarms
2 Associate emergencies
3 Compare parameter
configurations
4 Associate indicators
5 Locate the fault
comprehensive ly
Exist or not
Handle alarms
Solved or not
Yes
Yes
End
No
No
Exist or not
Handle emergencies
Solved or not
Yes
No
No
Exist or not
Correct wrong parameter
configurations
Solved or not
Yes
No
No
List related indicator counters
RTWPResource
limit indicators
Checkamp analysis of interference
Optimization analysis of
resource limitCounters related to inter-RAT handover failures
C301130667 C301130681C301130668 C301130682C301130669 C301130690C301130670 C301130691C301130671 C301130692C301130672 C301130693C301130673 C301130694C301130674 C301130696C301130675 C301130697C301130677 C301130698C301130678 C301130699C301130679 C301130700
C301130680
Solved or not
Yes
Yes
No
Drive Test+RNC signaling
trace
Yes
Counters related to inter-RAT handover
failures
Cell hand-inhand-out indicators
30049 3005030051 3005230053 30054
ZTE Confidential Proprietary copy 2012 ZTE CORPORATION All rights reserved 47
UMTS KPI Optimization Analysis Guide Internal Use Only
45 Optimization of Resource Indicators
The resource indicators directly reflect the system capacity Increasing subscribers will consume more system resources and some resources may be limited for example the code resource may be limited the TCP access request may be rejected and the CE resource usage rate may exceed the threshold Limited system resources have a negative influence on the whole-network indicators and the subscribersrsquo perception for example call drops may frequently happen and more TCP access requests may be rejected during the voice services
Table 4-5 Resource KPIs and Alarm Thresholds
Resource type KPI No and nameAlarm
threshold
TCP
C301320150 Number of rejected services DCH downlink TCP limit
50
PI30167 Average non-HS (SOA) (SOA)DPA TCP 40
PI30092 Maximum Cell TCP () 100
PI30093 Average Cell TCP 70
UL TrafficPI30029 Handover Blocking Rate 05
KPI RTWP (in busy hour) -98 dBm
Code
C301320153 Number of rejected services DCH no code
50
PI30205 Average Cell HSUPA Users 12
PI30172 Cell Average HSDPA Users 16
CE
PI301830006 Maximum use Ratio of Uplink NodeB CE
60
PI301830010 Maximum use Ratio of Downlink NodeB CE
60
ZTE Confidential Proprietary copy 2012 ZTE CORPORATION All rights reserved 48
UMTS KPI Optimization Analysis Guide Internal Use Only
451 Resource Indicator Optimization Flowchart
Figure 4-15 Resource indicator optimization flowchart
ZTE Confidential Proprietary copy 2012 ZTE CORPORATION All rights reserved 49
UMTS KPI Optimization Analysis Guide Internal Use Only
Extract performance data
TOP Ncell filtering
Analyze a single cell
1 Check NE alarms
2 Associate emergencies
3 Compare parameter
configurations
4 Associate indicators
5 Locate the fault
comprehensive ly
Exist or not
Handle alarms
Solved or not
Yes
是
End
No
No
Exist or not
Handle emergencies
Solved or not
Yes
No
No
Exist or not
Correct wrong parameter
configurations
Solved or not
Yes
No
No
List related indicator counters
Code resource indicators
CE resource indicators
TCPadmission
reject counter
C301320150
Solved or not
Yes
Yes
No
Drive Test+RNC signaling
trace
Yes
Counter related to TCP limit
Cell TX power
indicators
30090 3009130092 3009330166 3016730168 3016930170 30171
30163301643016530075
30223302243045030451
Yes
Yes
ZTE Confidential Proprietary copy 2012 ZTE CORPORATION All rights reserved 50
UMTS KPI Optimization Analysis Guide Internal Use Only
452 Code Resource Optimization
The statistics of Number of rejected services and DCH no code the average code resource usage rate and the number of the HSDPA subscribers can be used to judge whether the code resource in a cell is limited If the code resource is limited you can adjust the code resource allocation to alleviate the situation
Based on the system algorithm when Formula 1 is satisfied you can add an HS-PDSCH when Formula 2 is satisfied then an HS-PDSCH is deleted
Formula 1 OcuRateNoHspdsch + OcuRateHspdsch + DpchCodeHy + 32 lt= 512
Formula 2 OcuRateNoHspdsch + OcuRateHspdsch + CodeUptHyA gt 512
OcuRateHspdschHSPDSCH means the number of the codes of SF=512 blocked by the HS-PDSCH OcuRateNoHspdsch means the number of codes of SF=512 blocked by other channels DpchCodeHy means the number of codes of SF=512 reserved for the DPCH and CodeUptHyA is the threshold to decide whether to delete the HSPDSCH
Therefore to ensure the access of the R99 subscribers you can make some adjustment according to Table 4-6 when the code resource is limited though the HSDPA rate may decrease
Table 4-6 Adjusting Code Resource Allocation
AbbreviationParameter
nameRange
and stepCurrent value
Update value
Remark
DpchCodeHy DPCH Code Hysteresis
0512 16 28
To decrease the number of rejected services for DCH no code
CodeUptHyACode Update Hysteresis A
0512 16 28
To decrease the number of rejected services for DCH no code
453 Monitoring CE Resource
The CE resource is mainly monitored through the maximum UE uplinkdownlink usage rate If there is any problem you can solve it by controlling the load or adding more boards
ZTE Confidential Proprietary copy 2012 ZTE CORPORATION All rights reserved 51
UMTS KPI Optimization Analysis Guide Internal Use Only
454 Optimization of Power Control
4541 Monitoring and Optimizing Downlink Power Control
Limited TCP in busy hours will not only increase access failures and call drops in the local cell but also increase soft handover failures and call drops in the neighboring cells Number of rejected services and DCH downlink TCP limit are intuitive KPIs to judge whether TCP is limited Although limited uplink capacity and massive UE moves in the rush hours may also cause call drops the limited TCP is absolutely a key factor
Based on the system algorithm MinHsdpaPower (MinHspaPwrRto) + NoHsPower gtNode B if the safety threshold is used (MinHsdpaPower means the power reserved for HSPA) then it will activate the downlink rate downgrade algorithm flow for the congestion (lower the downlink DCH rate) Although the rate downgrade can ensure access of some subscribers it is an irregular action and will degrade the performance
455 Speeding up Rate Downgrade
Considering that the cells with heavy load reject more access requests you can speed up the rate downgrade during the resource congestion to release the resources as soon as possible and avoid call drops caused by access failures (this method is only applicable to the cells with many PS service users but not those with only CS service users) Table 4-7 is an example of the parameter modification for the rate downgrade
Table 4-7 Example of Parameter Modification for Rate Downgrade
Abbreviation Parameter nameRange and
stepCurrent value
Update value
Remark
UlDnMaxStg Maximum Number of Degraded Uplink Load Steps Every Time
[1 8] 1 2 Downgrade from 384 Kbps to 16 Kbps
DlDnMaxStg Maximum Number of Degraded Downlink Load Steps Every Time
[1 8] 1 3 Downgrade from 384 Kbps to 8 Kbps
456 Monitoring and Optimizing Uplink Capacity
Handover Blocking Rate and RTWP can reflect the uplink capacity of the cell Because interference may also increase RTWP this factor should be distinguished during the RTWP monitoring Another effective indicator is the voice service erl If a cell has over 20 erls in busy hours you should pay special attention to it
ZTE Confidential Proprietary copy 2012 ZTE CORPORATION All rights reserved 52
UMTS KPI Optimization Analysis Guide Internal Use Only
457 Optimization of Uplink Capacity at the Whole Network Level
Case The uplink capacity was limited in a large number of sites after the cutover and the symptoms are a sharp rise of RTWP and a high call drop rate during the rush hours
After the following parameters were modified as shown in Table 4-8 the problem was solved
Table 4-8 Example of Power Control Parameter Modification
AbbreviationParameter
nameRange
Current value
Update value
ULINITSIRUplink Initial SIR target (dB)
UL 34 K136 K signaling UL 122 K AMR
4-5 35
ULMAXSIRMaximum Uplink SIR target (dB)
UL 34 K136 K signaling UL 122 K AMR
15 10
UlSirTargDnStepUplink SIR Target Down Step Size (dB)
UL 34 K136 K signaling UL 122 K AMR
01 02
458 Optimization of Uplink Capacity for a Single Cell
A lot of optimization measures can be taken to bring down the rising RTWP However with increasing subscribers the capacity may still be limited in some area while further modification of SirTarget will obviously degrade the call quality of the whole network and undermine the subscribersrsquo perception In this case you can adjust the power control parameters for a single site that has heavy traffic in the following way add one set of DivPc parameters and use this set of parameters only for this site
Case Table 4-9 shows an example of the power control parameter modification After this modification the call drop rate in the site with heavy traffic decreased to one quarter of the original one
Table 4-9 Example of Power Control Parameter Modification for Heavy-Traffic Cell
SRVTYPE ULINITSIR ULMAXSIR ULMINSIR
0 35-gt15 100-gt35 20-gt10
104 40-gt20 150-gt50 05-gt0
28 35-gt15 100-gt35 05-gt0
50 60-gt20 150-gt50 20-gt0
54 60-gt20 150-gt50 20-gt0
ZTE Confidential Proprietary copy 2012 ZTE CORPORATION All rights reserved 53
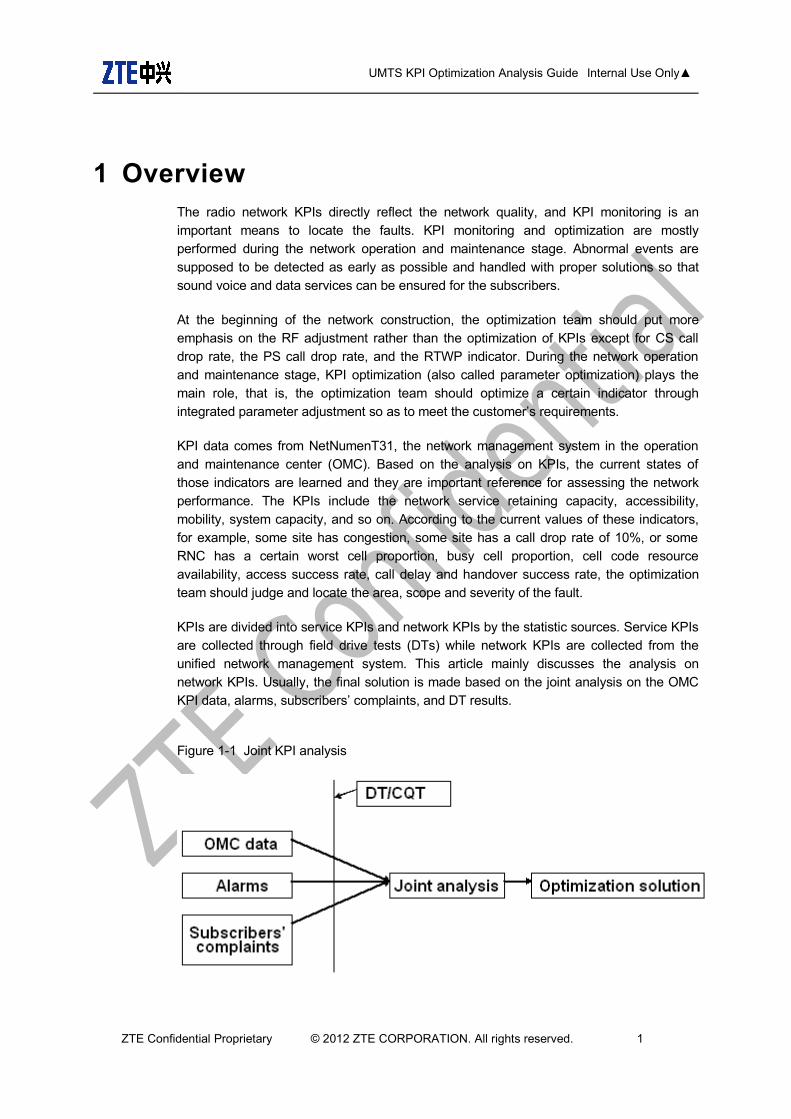
UMTS KPI Optimization Analysis Guide Internal Use Only
1 OverviewThe radio network KPIs directly reflect the network quality and KPI monitoring is an important means to locate the faults KPI monitoring and optimization are mostly performed during the network operation and maintenance stage Abnormal events are supposed to be detected as early as possible and handled with proper solutions so that sound voice and data services can be ensured for the subscribers
At the beginning of the network construction the optimization team should put more emphasis on the RF adjustment rather than the optimization of KPIs except for CS call drop rate the PS call drop rate and the RTWP indicator During the network operation and maintenance stage KPI optimization (also called parameter optimization) plays the main role that is the optimization team should optimize a certain indicator through integrated parameter adjustment so as to meet the customerrsquos requirements
KPI data comes from NetNumenT31 the network management system in the operation and maintenance center (OMC) Based on the analysis on KPIs the current states of those indicators are learned and they are important reference for assessing the network performance The KPIs include the network service retaining capacity accessibility mobility system capacity and so on According to the current values of these indicators for example some site has congestion some site has a call drop rate of 10 or some RNC has a certain worst cell proportion busy cell proportion cell code resource availability access success rate call delay and handover success rate the optimization team should judge and locate the area scope and severity of the fault
KPIs are divided into service KPIs and network KPIs by the statistic sources Service KPIs are collected through field drive tests (DTs) while network KPIs are collected from the unified network management system This article mainly discusses the analysis on network KPIs Usually the final solution is made based on the joint analysis on the OMC KPI data alarms subscribersrsquo complaints and DT results
Figure 1-1 Joint KPI analysis
ZTE Confidential Proprietary copy 2012 ZTE CORPORATION All rights reserved 1
Hand to RampD dept or
customer service dept交研发或用
服处理
UMTS KPI Optimization Analysis Guide Internal Use Only
2 KPI Monitoring ProcessThe purpose of KPI monitoring is to find out abnormal events that affect services as well as subscribersrsquo perception and solve the problems as early as possible For instance if the call drop rate at a certain site goes over 50 we need to find the problem and work out the solution in the earliest time
As it is very urgent and important to locate KPI problems we need a whole set of scientific KPI monitoring mechanism and problem shooting process as well as appropriate monitoring tool and analysis tool to help us find the call drops caused by transmission problems resource congestion cells service interruption serious interference hardware fault with NodeB wrong configuration of RNC parameters in time
We classify KPI monitoring into four categories routine KPI monitoring KPI monitoring during the process of parameter modification KPI monitoring during the RNC or NodeB version upgrade and KPI monitoring during the process of cutover Routine KPI monitoring should be performed every day and be recorded in a KPI daily report which should involve the worst CS cell the worst PS cell the cell with the lowest RRC connection rate the cell with the most serious resource limit and so on
21 KPI Monitoring Process
KPI monitoring falls into four categories routine KPI monitoring KPI monitoring during the process of parameter modification KPI monitoring during the version upgrade of RNC or NodeB and KPI monitoring during the process of cutover Each type of monitoring has its own monitoring items and output form For instance the output of the routine KPI monitoring should be a daily report while the output of other KPI monitoring types should be a KPI comparison report Different types of KPI monitoring should have different time granularities according to the requirement of problem location
Routine KPI monitoring should be done persistently and be recorded in a daily report which should include a collection of the cells worst in different aspects and be sent to relevant person by email
22 Routine KPI Monitoring Process
Figure 2-2 Routine KPI monitoring process
ZTE Confidential Proprietary copy 2012 ZTE CORPORATION All rights reserved 2
Hand to RampD dept or
customer service dept交研发或用
服处理
UMTS KPI Optimization Analysis Guide Internal Use Only
ZTE Confidential Proprietary copy 2012 ZTE CORPORATION All rights reserved 3
Parameter problem
Hand to the planning personnel
Classification of the
worst cells
Problem handling team classifies
collects and locates the worst cells
Hand to the network
optimization personnel
Hand to RampD dept or
customer service dept交研发或用
服处理
Send email in fixed format to relevant
personnel
Coverage problem
Equipmentversion problem
Network KPI monitoring
( 15 minutes time granularity)
Screen out the worst cells with
KPI tool
EMS exports the one-day granularity
of the whole network
Output KPI daily report in Excel
UMTS KPI Optimization Analysis Guide Internal Use Only
23 KPI Monitoring Process During Parameter Modification
Figure 2-3 KPI monitoring process during parameter modification
Old parameter configuration
Configure data according to the
worksheet
Network KPI monitoring (15-
minute granularity)
Whether the KPIs at the
RNC level are normal
Keep on monitoring (15-
minute granularity)
Output a report in Word (hourly
granularity KPIs before and after the parameter modification)
End
Yes
Notify the person in charge by mail
or phone
Rollback or not
Locate the worst cells and check if they are caused
by the parameter modification
No
Yes
No
ZTE Confidential Proprietary copy 2012 ZTE CORPORATION All rights reserved 4
Network KPI monitoring
( 15 minutes time granularity)
UMTS KPI Optimization Analysis Guide Internal Use Only
24 KPI Monitoring During RNC or NodeB Version Upgrade
Figure 2-4 KPI monitoring workflow during RNC or NodeB version upgrade
ZTE Confidential Proprietary copy 2012 ZTE CORPORATION All rights reserved 5
Yes
No
No
End
Locate the worst cells Determine whether they are related with the version update
Yes
Network KPI monitoring
( 15 minutes time granularity)
Execute the worksheet to
upgrade version
Output formal Word report (Compare the hourly granularity KPIs before and after the parameter modification and output the result every hour)
Whether the RNC-level
KPI is normal
Keep on monitoring (15 minutes granularity)
Send mail to or call the person in charge
Rollback or not
Current version
UMTS KPI Optimization Analysis Guide Internal Use Only
25 KPI Monitoring During Cutover
For the network on which the equipment needs to be replaced (for instance HongKong CSL network for which we replaced Nokiarsquos equipment with ZTErsquos) after the network optimization is completed the subscribers on the existing network should be cut over to our network gradually During the cutover there will be subscribers registering on our network constantly which will cause load increase on the network In this case we should watch KPI changes closely The monitoring process items method and report are the same as those described in section 24 ldquoKPI Monitoring During RNC or NodeB VersionUpgraderdquo Please read it for reference
3 KPI Analysis Methods
31 KPI Analysis Methods
Different network problems require different performance analysis methods Choose one or more appropriate methods after learning the running state of the existing network and the problems with it Common analysis methods are as follows
TOP N worst cells method Based on the traffic statistics indicators we care about (such as the call drop rate connection rate and soft handoff failure rate) choose N worst cells whose average indicator values in the peak hours or of the whole day are the lowest as the target of fault analysis and optimization Or prioritize objects of optimization against these indicator values
Time tendency chart method Tendency chart of indicator change is commonly used in the traffic analysis The analysis engineer can work out an hourly daily or weekly tendency chart of one or more indicators of the whole network a cluster or a single cell and find out the change rule of traffic statistics indicators
Regional location method The change of network performance indicators often occurs in some regions The indicators in these regions may be worsened by traffic increase traffic mode change radio environment change faults with a small number of stations or uplinkdownlink interference which will therefore affect the performance indicators of the whole network By comparing the network performance indicators before and after the change we can mark out the station or the sector with the greatest indicator change on an electronic map and take these problem regions as the analysis focus
Comparison method A single traffic statistics indicator may be affected by many factors While some factors change others may not Choose a proper object for comparison to confirm the existence of problems and then analyze the causes of the problems When examining an indicator do not care whether the absolute indicator value is high or low only pay more attention to whether the value is high or low compared to other indicators instead
ZTE Confidential Proprietary copy 2012 ZTE CORPORATION All rights reserved 6
UMTS KPI Optimization Analysis Guide Internal Use Only
311 TOP N Worst Cells Method
During the whole process of KPI optimization analysis TOP N worst cells analysis method is the most effective one which can be used throughout the whole optimization phase By focusing on the TOP N worst cells you can solve the major problems with the network Abnormal call drop events may happen every day and these events may represent problems of a kind After solving the problems with TOP N cells you can solve the problems of the same kind Therefore focusing on TOP N cells is one of the most effective ways to solve problems
TOP N worst cells analysis method is applicable to the optimization analysis of all the indicators Choose TOP N worst cells according to a certain threshold which varies depending on different indicators N stands for the number of the worst cells When the worst cells are too many to be worked on the number of the worst cells can be decreased so that you can focus on them TOP N cells analysis method includes the following steps
Step 1 Screen out TOP N cells according to the condition of the indicators you care about
Step 2 Conduct a health check for TOP N cells Check whether there are any problems with transmission or boards and check whether the worst cells are caused by external abrupt incidents such as terrible weather gatherings or holiday (because during gatherings and holidays the traffic is usually heavy)
Step 3 Check the radio parameters configuration of these cells the radius of these cells and their neighboring cells and compare them with the normal cells
Step 4 Export the indicator relevant most closely with the indicators you care about and analyze it to find the problem indirectly
For instance one day CS call drop rate of a whole network was high We analyzed the problem by the TOP N cells analysis method
Step 1 Screen out TOP N cells according to the condition of the indicators you care about
We used the CNO KPI analysis function to screen out TOP N cells (other tools can be also used) and selected 10 cells with the highest CS call drop rate
Table 3-1 List of CS TOP N Worst Cells
Index Cell RNS subnet ID Cell IDCall drop
rate CS AMRNumber of call
drop voice
1 ZBL1U-AI-1 (201) 12911 4158 553
2 ZBL1U-AI-3 (201) 12913 3955 545
3HKE1U-5H-1
(203) 30461 1556 370
ZTE Confidential Proprietary copy 2012 ZTE CORPORATION All rights reserved 7
UMTS KPI Optimization Analysis Guide Internal Use Only
Index Cell RNS subnet ID Cell IDCall drop
rate CS AMRNumber of call
drop voice
4HKE1U-5H-3
(203) 30463 1581 360
5LAK1U-9M-3
(202) 11063 339 282
6 HIC1U-9R-1 RNC101(101) 10891 226 216
7LAK1U-9M-1
(202) 11061 249 215
8EBP1U-9R-3
RNC101(101) 12823 230 205
9SRS1U-5H-1
RNC102-CSL(102)
12091 392 169
10HRM1U-6R-1
RNC102-CSL(102)
20671 341 167
Step 2 Check the transmission and hardware of the TOP N cells and check whether they are caused by external abrupt incidents such as terrible whether gatherings or holidays when traffic is usually heavy
And then we conducted a health check for each cell and paid attention to routine alarms and BPC board problems We found there were broken associations in some HKE sites
Step 3 Check the radio parameters configuration of these cells the radius of these cells and their neighboring cells and compare them with the normal cells
(1)Problem with the cell radius After the check we found the cell radius of the LAK site was 25 km Because the LAK site was situated by the sea and the antenna was placed very high the radius of 25 km was far from enough So we changed the cell radius to 10 km and the problem of high call drop rate was thus solved
(2)Problem with configuration HIC site is an indoor POI site The RRU RxTx port and the RRU Rx port were configured reversely which is the cause of high call drop rate After modifying HIC we found that signals of the second RRU were received by the Rx port So we changed the configuration of the RxTx port and the Rx port the problem of high call drop rate was thus solved
Figure 3-5 RF configuration at HIC site
Figure 3-6 Antenna energy distribution at HIC site
ZTE Confidential Proprietary copy 2012 ZTE CORPORATION All rights reserved 8
UMTS KPI Optimization Analysis Guide Internal Use Only
Step 4 Export the indicator relevant most closely with the indicators you care about and analyze it to find the problem indirectly
Table 3-2 Indicators Related with CS Call Drop
Index Cell
RAB release number for Iu connection
release request by UTRAN for CS domain in
cell radio connection with UE lost
RAB release number for Iu connection
release request by UTRAN for CS domain in cell failure in
the radio Interface
procedure
RAB release number for Iu connection
release request by
UTRAN for CS domain in
cell release due to
overload control
RAB release number for Iu connection
release request by
UTRAN for CS domain in
cell unspecified
failure
Average cell freq RTWP (dbm)
1ZBL1U-AI-1
482 43 0 29 -104177
2ZBL1U-AI-3
473 40 0 33 -104125
3HKE1U-5H-1
346 16 0 8 -105908
4HKE1U-5H-3
330 18 0 13 -1060777
5LAK1U-9M-3
69 196 0 18 -1031906
6HIC1U-9R-1
100 100 0 16 -1015404
7 LAK1U- 64 131 0 20 -1031934
ZTE Confidential Proprietary copy 2012 ZTE CORPORATION All rights reserved 9
UMTS KPI Optimization Analysis Guide Internal Use Only
Index Cell
RAB release number for Iu connection
release request by UTRAN for CS domain in
cell radio connection with UE lost
RAB release number for Iu connection
release request by UTRAN for CS domain in cell failure in
the radio Interface
procedure
RAB release number for Iu connection
release request by
UTRAN for CS domain in
cell release due to
overload control
RAB release number for Iu connection
release request by
UTRAN for CS domain in
cell unspecified
failure
Average cell freq RTWP (dbm)
9M-1
8EBP1U-9R-3
98 90 0 17 -101413
9SRS1U-5H-1
87 59 0 22 -1043528
10HRM1U-6R-1
42 111 0 13 -1027697
32 Basic KPI Analysis Skills
Be able to use the KPI statistics tool and the analysis tool
Use tools to learn about the running state of the whole network quickly and screen out TOP N worst cells quickly
Use different analysis tools to find problems from different aspects and locate the problem quickly
Understand the signaling process and basic principle
In the process of abnormity location keep a clear aim in mind and be able to apply the process and basic principle to check the other relevant indicators rapidly to facilitate the analysis
Be familiar with the process and basic principle and be able to make logical association between abnormal KPI problems and network problems (such as the coverage problem and the interference problem) Be able to determine the problem nature according to the abnormal KPI and then choose the appropriate tool to analyze the problem in depth
Performance analysis requires engineers to understand basic signaling process be familiar with the protocol stacks of standard interfaces and know relevant algorithms to realize the product functions Engineers should at least have a concept about the various algorithms If the analysis of a commercial network involves some algorithms engineers should study these algorithms in depth
ZTE Confidential Proprietary copy 2012 ZTE CORPORATION All rights reserved 10
UMTS KPI Optimization Analysis Guide Internal Use Only
321 KPI Monitoring Tools
minus Network management tool NetNumenT31 count KPI original data alarm data radio parameter configuration in cells and parameter configuration on the earth
minus KPI daily report generating tool classify key indicators according to a certain condition and screen out the worst cells
322 KPI Analysis Tools
minus CNO Tool CNO tool has the KPI analysis function So using it you can screen out the worst cells according to various conditions and point out the corresponding counter of an indicator
minus SignalTrace Trace the signaling (RNL signaling and RNL signaling) of RNC interfaces which includes the Iu interface the Iur interface the Iub interface and the Uu interface (the signaling flow between RNC and UE at RRC layer) And RNL signaling trace is a common way for locating the KPI problem Being able to trace the RNC signaling is a basic requirement for the on-site KPI optimization engineers and the network optimization and maintenance engineers This signaling tracing tool is very powerful which can trace signaling according to the UE cell and IMSI in the KPI analysis According to the UE cell it can trace the signaling of multiple subscribers while according to IMSI it can trace the signaling of only one subscriber However if the RRC connection is not established yet signaling cannot be traced That is because only when RRC connection has been established can the RNC obtain the subscriberrsquos IMSI from the CN
minus RNC ASS Log ASS log is usually applied when there is abnormity and RNC signaling is out of trace In this case use ASS log to analyze the signaling before and after the abnormity occurs Abnormity can be queried according to IMSI or cell ID ASS log can be also used to collect various abnormities
minus NodeB LMT NodeB local operation and maintenance tool Apart from all the operation functions of the OMCB this tool can collect more detailed information about cells and UE NodeB local maintenance terminals include EOMS EFMS DMS and PMS
minus NodeB Abnormity Probe On the site of WCDMA commercial office NodeB abnormity probe is an effective tool to monitor the running state of the NodeB Every module of NodeB can record the abnormal information automatically which makes it easy to locate problems However this method requires professional knowledge such as knowledge about the function and interface of each module or board If the on-site engineers cannot make the simple analysis they can just obtain the abnormity probe and send it to the RampD engineers at the rear side The abnormities reported on the NodeB will be stored at the OMCB server according to different RNCs To conduct NodeB
ZTE Confidential Proprietary copy 2012 ZTE CORPORATION All rights reserved 11
UMTS KPI Optimization Analysis Guide Internal Use Only
abnormity probe analysis you need to download abnormity probe files from different OMCB servers and then use the abnormity probe tool to make a comprehensive analysis
minus CTS Tool CTS is a tool developed by the CN department which can trace signaling in depth according to IMSI and trace signaling across RNCs So this is particularly suitable to trace VIP subscribers In this case CTS is easier to use than SignalTrace which can only trace signaling of RNCs one by one CTS can trace the interactive signaling between network elements (NEs) within the CN as well as the signaling of the Iu interface and the Uu interface This kind of signaling tracing is what we called in-depth tracing The work principle of CTS is to set up an IMSI task on the CTS server and send it to the CN front side which will then send this task to each CN module via the interfaces dedicated to the CN modules and the RNC and then each module after receiving the signaling related to the IMSI task will send the signaling back to the CTS server via the CN front side The interfaces mentioned above are private interfaces so this tool can only support our own CN and RNC CTS signaling can be checked and analyzed with an offline tool but the offline tool does not work very well because of the lack of continuous optimization and perfection
minus UE log DT test is also an important auxiliary way in analyzing KPI indicators There are many problems that cannot be located by tracing signaling at the network side and can only be located by the use of UE log The commonly used drive test software includes QXDMAPEX (QCAT) CNTCAN and TEMS CNTCAN and TEMS are often used for network optimization For the use of CNTCAN please refer to the corresponding help file and the instruction document publicly released by the Network Optimization Tool Department QXDM and the analysis tool APEX (QCAT) provided by Qualcomm is very powerful which have contributed a lot for the stability and maturity of our system for many years
33 General Process of KPI Optimization Analysis
Basic analyzing ideas
KPI optimization is a process to find and solve problems KPI optimization during the operation and maintenance stage is mainly to pick out the performance data that needs special attention from the OMC classify these performance data and then compare the value of these data with that required by the operator If the value of an indicator is lower than the operatorrsquos requirement analyze this indicator and find out the factor that affect the indicator and then propose a solution to the operator If the values are higher than the operatorrsquos requirement therersquos no need to pay special attention to them
KPI analysis is a process from the whole to the part
Step 1 Check the key indicators from the view of the whole network If there is not any
ZTE Confidential Proprietary copy 2012 ZTE CORPORATION All rights reserved 12
UMTS KPI Optimization Analysis Guide Internal Use Only
problem just ignore them Otherwise try to locate the RNC NE that has the problem
Step 2 Analyze the indicators of the corresponding RNC to find out the RNC whose indicators have the problem
Step 3 Analyze the indicators of the cell under the problem RNC to find out the worst cells or TOP N cells If the indicators of all the cells under the RNC are tend to be low it is a common problem probably caused by parameter configuration And then check whether the radio parameter configuration in the cells under this RNC is the same as that in the cells under the normal RNCs
Step 4 Make a comprehensive analysis on the KPIs alarms DT test data and customer complains of the worst cells to find out a solution
Analysis method
After learning the KPI analysis ideas we must know some common KPI analysis methods to rule out causes of problems from the obvious ones to the hidden ones
For example we found that the TCP code words were strictly limited at eight sites near a park and the call drop rate rose suddenly How to solve this problem
Method one First we checked whether the alarms transmission and boards of these sites were normal After they are proved all normal we sent some engineers to the site to do test And meanwhile we traced the RNC signaling at the OMC It turned out that the test result was normal and the indicators of these sites of that day did not have any problem and code words were not limited And later we knew from the news that there was a big gathering of about one million people at the park at that moment Until then we came to know that the congestion was caused by too many users using the network at the same time
Method two First because the eight sites went worse all of a sudden it was unlikely that the problem lied in the hardware Then we checked whether the radio parameters had been modified the day before The result is no worksheet had been issued to modify those parameters and no alarm was found at those sites Therefore we excluded the possibility of hardware problem Then we checked the traffic trend graph of the last few days (over seven days) and found that the high call drop rate might be caused by high traffic The graph showed that traffic of each site rose suddenly on the day before Thus we came to the conclusion that this was an abnormal abrupt event which may have been caused by a gathering And later we were told that there was a big gathering at the park So we were assured the code words limitation and high call drop rate at the eight sites were caused by too many subscribers using the network at the same time
By comparing the two methods above we can find that although the first one (sending engineers to the site without the consideration of abnormal events) is commonly used it is inefficient and costs more resource The second method (analyzing the problem by the means of exclusion and association) is more efficient From this case we would like to emphasize that KPI analysis is a process of problem exclusion Using the comprehensive
ZTE Confidential Proprietary copy 2012 ZTE CORPORATION All rights reserved 13
UMTS KPI Optimization Analysis Guide Internal Use Only
methods (like Method One) at the first brush may be making a detour
minus Exclusion method Check the alarms on the OMC to learn about the state of the RNC NodeB BPC board and the transmission If there are obvious broken link in transmission or hardware problem the cause of the problem is easy to locate
minus Incident association If the problem is with a great number of sites take abrupt incidents into account such as large-scale gathering terrible weather of incorrect operation These incidents will put influence of different levels and ranges on the network indicators
minus Comparison of radio parameters If some site goes wrong in a sudden check whether the radio parameter configuration of this site is consistent with that of other normal sites If not change it as that of the normal sites because the indicator decrease may be caused by an incorrect modification of radio parameters
minus Relevant indicators association If a certain indicator is in poor condition check its relevant indicators and find the common problem from these relevant indicators
minus Comprehensive problem location When the above reasons are excluded use DT data KPI data RNC signaling analysis data to locate the problem with indicators comprehensively
ZTE Confidential Proprietary copy 2012 ZTE CORPORATION All rights reserved 14
UMTS KPI Optimization Analysis Guide Internal Use Only
Figure 3-7 KPI optimization analysis process
StartPick out
performance indexes
RNC index abnormal
Equipment alarms exist
Deal with equipment alarms
RNC index recovers
Common problem with the
worst cells
Transmission softwarehardware version wireless
parameter configuration
CNRNC Transmission
Hardware Software Interference
Wireless parameters
Time range
Abrupt and self-curable abnormality
helliphellip
Analyze and record causes
Suggestion about improvement
Common problems analysis
Problem resolved
Successful call
Call drop Soft handover
23G alternate operation
PS rate helliphellip
Deal with the relevant problem
Indexes normal
End
Climate change holidays assembly
transmission interruption power
fault and so on
Y
N
Y
Y
N
Y
N
Abnormal indexes analysis in one cell
Y
N
N
N
Y
N
Y
Show TOPN abnormal cells
and their locations
If the problem is proved to be equipment bug or system problem after
several attempts feed it back to RampD dept
ZTE Confidential Proprietary copy 2012 ZTE CORPORATION All rights reserved 15
UMTS KPI Optimization Analysis Guide Internal Use Only
4 KPI Optimization Analysis This chapter mainly demonstrates how to analyze the indicator problems from the aspect of OMC data and provides flowcharts for KPI optimization The detailed analyzing method and cases of every special subject can be checked in the optimization guides of all the subjects
41 CS Call Drop Optimization
The CS call drop rate is the most important indicator in KPI optimization
411 Definition of Call Drop
After checking the signaling on the Uu interface at the UE side the engineer can judge the situation a call drop if the Uu interface message satisfies one of the following three conditions during the calling process (in connection)
RNC Release is not received but the UE condition changes from CELL_DCH to IDLE
RRC Release is received and the released cause value is Not Normal
One of the following three messages mdash CC Disconnect CC Release Complete and CC Release mdash is received and the released cause value is Not Normal Clearing or Not Normal Unspecified
In a board sense the call drop includes the call drop rates of CN and UTRAN The call drop of UTRAN includes the following two aspects
After the successful service establishment RNC sends the RAB Release Request to CN
After the successful service establishment RNC sends the IU Release Request to CN Later RNC receives the IU Release Command from CN
Note that RAN call drop statistics which is defined from the aspect of lu interface signaling means the launching times of RAB Release Request and lu Release Request of RNC And the DT call drop statistics is defined from the aspects of the Uu interface message non-access stratum message and cause value RAN call drop statistics and DT call drop statistics are not exactly the same
ZTE Confidential Proprietary copy 2012 ZTE CORPORATION All rights reserved 16
UMTS KPI Optimization Analysis Guide Internal Use Only
412 CS Call Drop Analysis Flowchart
Figure 4-8 CS call drop analysis flowchart
ZTE Confidential Proprietary copy 2012 ZTE CORPORATION All rights reserved 17
UMTS KPI Optimization Analysis Guide Internal Use Only
Extract performance data
CS TOP Ncell filtering
Analyze a single cell
1 Check NE alarms
2 Associate emergencies
3 Compare parameter
configurations
4 Associate indicators
5 Locate the fault
comprehensively
Exist or not
Handle alarms
Solved or not
Yes
Yes
End
No
No
Exist or not
Handle emergencies
Solved or not
Yes
No
No
Exist or not
Correct wrong parameter
configurations
Solved or not
Yes
No
No
List related indicator counters
Call-drop-related
countersRTWP
Handover success rate
Traffic volume
Resource limit indicators
Checkamp analysis of
interference
Optimizationanalysis of
handover failures
Optimization analysis of
resource limitCall-drop-
related counters
C301230362C301230363C301230365C301230315C301230316C301230318C301230319C301230322C301230323
Solved or not
Yes
Yes
No
Drive Test+RNC signaling
trace
Yes
ZTE Confidential Proprietary copy 2012 ZTE CORPORATION All rights reserved 18
UMTS KPI Optimization Analysis Guide Internal Use Only
42 PS Call Drop Optimization
421 Optimization Flowchart
Figure 4-9 PS call drop optimization flowchart
ZTE Confidential Proprietary copy 2012 ZTE CORPORATION All rights reserved 19
UMTS KPI Optimization Analysis Guide Internal Use Only
Extract performance data
PS TOP Ncell filtering
Analyze a single cell
1 Check NE alarms
2 Associate emergencies
3 Compare parameter
configurations
4 Associate indicators
5 Locate the fault
comprehensive ly
Exist or not
Handle alarms
Solved or not
Yes
Yes
End
No
No
Exist or not
Handle emergencies
Solved or not
Yes
No
No
Exist or not
Correct wrong parameter
configurations
Solved or not
Yes
No
No
List related indicator counters
Call -drop-related
countersRTWP
Handover success rate
Traffic volume
Resource limit indicators
Check amp analysis of interference
Optimizationanalysis of
handover failures
Optimization analysis of
resource limitCall -drop-
related counters
C301230372C301230373C301230375C301230330C301230332C301230333C301230334C301230337C301230338
Solved or not
Yes
Yes
No
Drive Test +RNC signaling
trace
Yes
ZTE Confidential Proprietary copy 2012 ZTE CORPORATION All rights reserved 20
UMTS KPI Optimization Analysis Guide Internal Use Only
43 Optimization of Accessibility Indicators
Accessibility performance includes the success rate of RRC connection setup and the success rate of CSPS RAB assignment These two kinds of KPIs play important roles in the network optimization and directly influence the success rate of CSPS service establishment In this document this kind of problems are found from the aspect of OMC data and solved through parameter optimization
431 Definition of Access Failure
For the mobile originated call in the CS domain the access failure event means that the UE sends RRC REQUEST and IE establish cause is Originating Conversational Call but alerting of the direct transfer message is not received
The relevant events are defined as follows in the access failure stage
RRC connection setup failure After considering the resending times and the waiting time the UE sends RRC CONNECTION REQUEST and does not receive the response from RNC or RRC CONNECTION REJECT delivered by RNC
Initial direct transfer and security mode establishment failure After sending RRC CONNECTION SETUP COMPLETE the UE does not send NAS SETUP
RAB assignment failure After receiving CALL PROCEEDING the UE does not receive RB SETUP delivered by RNC Or the UE replies with RB SETUP FAIL after receiving RB SETUP Or the UE receives DISCONNECT with the cause value not being Normal Release after receiving RB SETUP At this time the UE has not reported RB SETUP CMP
Failure after RAB assignment After the UE sends RB SETUP COMPLETE the originating UE receives DISCONNECTRELEASE from CN Or the UE waits CONNECT or ALERTING overtime and launches the Call Clearing process Or the UE becomes IDLE before receiving Alerting and starts to receive the system message
For the mobile terminated in the CS domain the access failure event means that the terminating UE receives the paging of paging type 1 and does not send RRC CONNECTION REQUEST with the cause value being Terminating Conversational Call Or the UE does not send the alerting of direct transfer message to CN after sending RRC CONNECTION REQUEST
The relevant events are defined as follows in the access failure stage
RRC connection setup failure After sending RRC CONNECTION REQUEST the UE does not receive the response from RNC or RRC CONNECTION REJECT delivered by RNC
Initial direct transfer and security mode establishment failure After sending RRC
ZTE Confidential Proprietary copy 2012 ZTE CORPORATION All rights reserved 21
UMTS KPI Optimization Analysis Guide Internal Use Only
CONNECTION SETUP COMPLETE the UE does not receive the SETUP direct transfer message Or the UE sends RELEASE COMPLETE Or the UE receives DISCONNECT from CN
RAB assignment failure The UE does not receive RB SETUP delivered by RNC after sending CALL CONFIRM Or the UE replies with RB SETUP FAIL after receiving RB SETUP Or the UE receives DISCONNECT with the cause value not being Normal Release after receiving RB SETUP At this time the UE has not reported RB SETUP CMP
Failure after RAB assignment After the UE sends RB SETUP COMPLETE the terminating UE receives DISCONNECTRELEASE from CN
432 Analysis on RRC Connection Failures
The problem of RRC connection setup failure can be analyzed through the UE signaling flow and RNC single-user tracing The RRC connection setup includes the following steps
The UE sends RRC Connection Request through the RACH channel
RNC sends RRC Connection Setup through the FACH channel
The UE sends RRC Connection Setup Complete through the dedicated uplink channel after the downlink dedicated channel is established and synchronized
RRC connection setup failures are always caused by following issues
Uplink RACH problem
Problem about downlink FACH power allocation proportion
Parameter reselection problem of the cell
Low downlink dedicated initial transmitting power
Uplink initial power control problem
Congestion
Equipment malfunctions
Among these issues the problems of uplink RACH downlink FACH power allocation proportion parameter reselection of the cell and equipment malfunctions appear more frequently
ZTE Confidential Proprietary copy 2012 ZTE CORPORATION All rights reserved 22
UMTS KPI Optimization Analysis Guide Internal Use Only
4321 Analysis Flowchart of RRC Connection Setup Failures
Figure 4-10 Analysis flowchart of RRC connection setup failures
ZTE Confidential Proprietary copy 2012 ZTE CORPORATION All rights reserved 23
UMTS KPI Optimization Analysis Guide Internal Use Only
Extract performance data
TOP Ncell filtering
Analyze a single cell
1 Check NE alarms
2 Associate emergencies
3 Compare parameter
configurations
4 Associate indicators
5 Locate the fault
comprehensive ly
Exist or not
Handle alarms
Solved or not
Yes
Yes
End
No
No
Exist or not
Handle emergencies
Solved or not
Yes
No
No
Exist or not
Correct wrong parameter
configurations
Solved or not
Yes
No
No
List related indicator counters
Counters related to RRC setup
failuresRTWP
Resource limit
indicators
Checkamp analysis of interference
Optimization analysis of
resource limitCounters related
to RRC setup failures
C301480485C301480486C301480487C301480489C301480490C301480491C301481288C301481289C301481337C301481338C301481339C301481407C301481408
Solved or not
Yes
Yes
No
Drive Test+RNC signaling
trace
Yes
ZTE Confidential Proprietary copy 2012 ZTE CORPORATION All rights reserved 24
UMTS KPI Optimization Analysis Guide Internal Use Only
4322 UE sends RRC Connection Request but RNC does not receive it
If the EcIo of downlink CPICH is relatively low it is the problem of coverage
If the EcIo of downlink CPICH is not very low (for example the value is larger than -14 dB) Usually it is the problem of RACH and the following issues may cause the problem
minus The power of Preamble does not rise to a required value and the rising times of Preamble should be increased
minus The output power of UE is lower than the required value which is caused by poor UE performance In this case the UE should be changed
minus The NodeB equipment has a standing wave and the engineer should check whether NodeB has any SWR alarm
minus The radius of the cell is set improperly If the radius parameter of the cell is set too small the NodeB can not synchronize the UE beyond the range of the radius and the access fails This problem often happens in the places with large coverage such as the rural areas and the suburbs
4323 RNC delivers RRC Connection Reject after receiving RRC Setup Request
When RRC Connection Reject appears the engineer should check the specific reject cause value Usually there are two kinds of causes
The CPU load of RNC control plane board is too heavy and more boards should be added
DCH and FACH admission is rejected However this situation does not always happen
4324 UE does not receive RRC Connection Setup delivered by RNC
This problem may be caused by the following reasons
Poor coverage
Improper parameters of cell selection and reselection
Checking method The engineer should check the EcIo of CPICH If the value is lower than -12 dB (EcIo is -12 dB by default) and there is no cell of better quality in the monitor set the cause of this problem is poor coverage If there is better cell in the monitor set cell reselection may cause this problem
Poor coverage can be improved by coverage enhancement such as adding some sites to cover the places without signal coverage and adjusting the engineering parameters If the coverage can not be improved the engineer can enhance the FACH power according to
ZTE Confidential Proprietary copy 2012 ZTE CORPORATION All rights reserved 25
UMTS KPI Optimization Analysis Guide Internal Use Only
the PCPICH EcIo coverage of the current network For example if all the pilot EcIo values are larger than -12 dB in the coverage area the power proportion of the common channel should be configured on the basis of the situation that the EcIo value is larger than -12 dB And so the success rate of the idle UE assessment can be ensured
As for the access problem caused by cell selection and reselection the engineer can speed up the cell selection and reselection by adjusting the cell selection and reselection parameters and the problem of RRC connection setup failure caused by improper cell selection and reselection parameters can be solved
Note
The RRC Connection Setup message is borne by FACH RRC Connection Request sent by the UE is received by UTRAN at the preamble of PRACH and then it is sent from the RACH channel based on the current preamble power And the transmit power of preamble can rise all the time until the response is received (There is a limitation for the maximum number of preamble retransmissions) Therefore in the areas with poor coverage the RACH coverage and FACH coverage may become unbalanced and as a result UTRAN can receive RRC Connection Request sent by the UE but the UE can not receive RRC Connection Setup sent by RNC
4325 UE receives RRC Connection Setup and does not send RRC Setup Complete
If the downlink signal quality is normal this problem may be caused by the abnormal condition of the cell phone
Another reason of this problem may be the downlink synchronization failure caused by the low initial power of downlink dedicated channel You can solve this problem by adjusting the service downlink EbNo
4326 RNC does not receive RRC Setup Complete sent by UE
Because the uplink initial power control may increase the UE transmit power this kind of problem seldom appears If it appears the engineer can increase the Constant Value of the dedicated channel properly to raise the uplink DPCCH initial transmission power of the UE
At the same time this problem is also relevant with the uplink SIR initial target value configuration because this value may affect the uplink initial synchronization at the initial stage of link setup If the value of the parameter is set too large there will be too much uplink inference brought by the initial setup of the link If the value is set too small the uplink synchronization will take longer time and the initial synchronization may even fail This parameter is an RNC-level parameter which has a great influence on network performance Therefore the engineer should be cautious while adjusting this parameter
ZTE Confidential Proprietary copy 2012 ZTE CORPORATION All rights reserved 26
UMTS KPI Optimization Analysis Guide Internal Use Only
Note
RRC Connection Setup Complete is sent through uplink DPCH and the UE calculates the initial power of uplink DPCCH according to the received IErdquoDPCCH_Power_offsetrdquo and the measured CPICH_RSCP value
DPCCH_Initial_power = DPCCH_Power_offset - CPICH_RSCP
DPCCH_Power_offset = Primary CPICH DL TX Power + UL Interference + Constant Value The Constant Value can be configured in the OMC If this value is set too small the UE may not have enough power to send RRC Connection Setup Complete
433 Analysis on RABRB Setup Failures
When RAB or RB setup fails RNC will send RAB Assignment Fail in the RAB Assignment Response signaling The engineer can find out the specific failure reason from the failure cause value carried in relevant cells The reasons for common RABRB setup failures include
RNC directly rejecting RAB Setup Request because of wrong parameter configuration
Admission reject
RAB setup failure because the UE fails to respond to RB Setup Request
RAB setup failure because the Uu interface fails to set up RB
ZTE Confidential Proprietary copy 2012 ZTE CORPORATION All rights reserved 27
UMTS KPI Optimization Analysis Guide Internal Use Only
4331 Analysis Flowchart of RAB Setup Failures
Figure 4-11 Analysis flowchart of RAB setup failures
ZTE Confidential Proprietary copy 2012 ZTE CORPORATION All rights reserved 28
UMTS KPI Optimization Analysis Guide Internal Use Only
Extract performance data
TOP Ncell filtering
Analyze a single cell
1 Check NE alarms
2 Associate emergencies
3 Compare parameter
configurations
4 Associate indicators
5 Locate the fault
comprehensively
Exist or not
Handle alarms
Solved or not
Yes
Yes
End
No
No
Exist or not
Handle emergencies
Solved or not
Yes
No
No
Exist or not
Correct wrong parameter
configurations
Solved or not
Yes
No
No
List related indicator counters
Counters related to RAB setup failures RTWP
Resource limit
indicators
Checkamp analysis of interference
Optimization analysis of
resource limitCounters related to RAB setup failures
CS domain PS domainC301230290 C301230302C301230291 C301230303C301230292 C301230304C301230293 C301230305C301230294 C301230306C301230295 C301230307C301230296 C301230308C301230297 C301230309C301230298 C301230310C301230299 C301230311C301230300 C301230312C301230301 C301230313
Solved or not
Yes
Yes
No
Drive Test+RNC signaling
trace
Yes
ZTE Confidential Proprietary copy 2012 ZTE CORPORATION All rights reserved 29
UMTS KPI Optimization Analysis Guide Internal Use Only
4332 RNC Directly Rejecting RAB Setup Request Because Of Wrong Parameter Configuration
The case that RNC responds with RAB Setup Failure directly is seldom caused by invalid parameter configuration in the business network Usually this case is caused by special operations of the special users
The main scenario is that the subscription information of the userrsquos PS service is beyond the capability of the UE which leads to the direct refusal from RNC For example a special userrsquos subscription rates of uplink and downlink are 384 K but the maximum uplink rate of the UE is only 64 K The maximum uplink and downlink rates of the QoS message used for activating PDP set by the AT command or mobile terminal software used by the user are 384 K so the RNC will find the maximum uplink rate is beyond the UErsquos capability directly reply with RAB Setup Failure and will not launch the RB setup process when it receives RAB Assignment Request
After the RAB setup fails because the parameter configuration is beyond the UErsquos capability SGSN will negotiate again to launch the new RAB assignment until the UE has the capability to support the assignment and the RAB assignment is finished For the users the PDP activation is still successful and the actual maximum rate is the maximum rate the UE can support
However if the minimum guaranteed bit rate required by the QoS setting in the UErsquos PDP activation request is beyond the UErsquos capability though the network negotiates a lower rate to accept the UErsquos PDP activation request the UE will launch the request of deactivating PDP when it finds that the rate negotiated by the network in PDP activation accept request is lower than the minimum guaranteed bit rate and finally the PDP activation can not be completed
4333 Admission Reject
For the non-HSDPA user if there are insufficient system resources (including power channel code lub transmission resource and CE) the call establishment failure will be caused by the admission reject At this time it is necessary to check the network load code resource lub transmission resource and CE resource occupation to make sure the congestion is caused by the limitation of a certain kind of resource What is more the engineer should plan the corresponding expansion method
If the cell does not support the HSDPA service the R99 user admission is judged according to the fixed R99 admission threshold If the cell supports the HSDPA service and the HSDPA and R99 dynamic power is allocated the uplink admission of non-HSDPA is judged based on RTWP or the equivalent user number If the uplink load is too heavy the non-HSDPA user admission will also fail
If the bandwidth configuration on the lub interface is insufficient the lub interface will reject the R99 data service activation because of limited bandwidth
ZTE Confidential Proprietary copy 2012 ZTE CORPORATION All rights reserved 30
UMTS KPI Optimization Analysis Guide Internal Use Only
The admission control of the NodeB Credit resource is similar to the power admission control Whether the remaining Credit can support the currently requested service or not can be judged according to the spectrum spreading factor of the new access user According to the condition of the RAB Downsizing Switch RNC will deal with the issue in the corresponding way
For the HSDPA user in the dynamic power allocation mode besides the mentioned system resources such as the power channel code lub transmission resource and CE the admission reject should take into consideration whether the number of H users supported by NodeB and the number of H users supported by the cell are over the regulated threshold or not into consideration
For the HSDPA user when the bandwidth configuration on lub interface is insufficient the admission reject will not happen but the rate will be reduced What is more the AAL2PATHs of HSDPA and R99 are configured respectively and the HSDPA AAL2PATH must be configured to the HSDPA_RT or HSDPA_NRT type If the HSDPA AAL2PATH is configured to RT or NRT of R99 AAL2PATH type the RAB assignment failure will not happen but RNC will establish the HSDPA service as R99 384 Kbps
For the downlink power admission
Besides whether the R99 service load is over the non-HSDPA service threshold DCH service should take into consideration whether non-HSDPA power and HSDPA GBP (the minimum power needed for the guaranteed bit rate) are over the general power threshold of the cell
For the HSDPA service it is necessary to check whether the throughput rate provided by the cell is over the sum of all the usersrsquo GBR thresholds or whether the GBPs of the stream service and the background service are over the HSDPA power of the cell At the same time whether the non-HSDPA power and the HSDPA GBP (the minimum power needed for the guaranteed bit rate) are over the overall power threshold of the cell should be also taken into consideration
For the lub admission
For the DCH service the admission is made according to the multiplication of the peak rate and the service activation factor
For HSDPA service the admission is made according to the GBR
If the lub exceeds the congestion threshold the DCCC rate reduction will be triggered And if the RLC_AM retransmission rate is over a certain threshold the Iub Overbooking switch can be opened to trigger the TF which limits R99 or to reduce the rate of HSDPA service by a certain factor
ZTE Confidential Proprietary copy 2012 ZTE CORPORATION All rights reserved 31
UMTS KPI Optimization Analysis Guide Internal Use Only
4334 RAB Setup Failure Because the UE Fails to Respond to RB Setup
The UE fails to respond to RB setup mainly because of the userrsquos operation
Take the following cases as examples
When the user already has had the downlink 12 K data service he receives RB Setup Request of the VP service (either the originated call in the VP domain or the terminated call in the VP domain) Because the UE does not support the VP and high-speed PS service in the downlink at the same time it directly replies with RB Setup Failure and the cause value is unsupported configuration
Compared with the WCDMA subscriber originating the VP service the terminating subscriber resides in the GSM network and so it does not support the VP service After RNC receives RAB Assignment Request the core network will deliver the Disconnect command right after call proceeding and the cause value is Bearer capability not authorized At this time the UE has just received the RB SETUP command and has no enough time to finish the RB setup So the UE will reply with RB Setup Failure after it receives the Disconnect command and the RNC will reply with RAB Setup Failure with the cause value being failure in radio interface procedure
4335 RAB Setup Failure Because the Uu Interface Fails to Set Up RB
RNC sends the Radio Bearer Setup command to the UE but fails to receive Radio Bearer Setup Compete This kind of situation (RB setup failure) often appears in the cells with weak signals There are two causes of weak signals one is that the UE does not reside in the best server to launch the access and the other is poor coverage
If the UE does not reside in the best server to launch the access it will hope to enter the best server through active set update in the RB setup process (At the same time the fast signal change will drastically weaken the signals in the cell) but the active set update can only be processed after the RB setup is completed because the procedures can not be processed alternately (Neither the network nor the terminal supports it) Therefore RB can only be set up in the cell with weak signals and the setup is easy to fail As for this situation the starting threshold and speed of co-frequency cell reselection should be increased to make the UE reside in the best server and launch the access as soon as possible
RB setup failure may be caused by the poor downlinkuplink coverage If the failure is caused by downlink coverage the UE can not receive the Radio Bearer Setup command which may be caused by the uplink interference and this can be fixed through checking RTWP The poor downlink coverage is partly caused by the bad UE demodulation performance and other causes should be solved by RF optimization
ZTE Confidential Proprietary copy 2012 ZTE CORPORATION All rights reserved 32
UMTS KPI Optimization Analysis Guide Internal Use Only
44 Optimization of Mobility Indicators
Mobility indicators mainly fall into three categories mdash soft handovers hard handovers and inter-RAT handovers The handover problems usually happen in the following cases
The best server changes too fast or there is no best server due to pilot pollution
The handover is not prompt or there are pingpong handovers due to improper parameter configuration
Adjust the engineering parameters for antennas in areas with severe pilot pollution And adjust the handover parameters such as the values of 1A 1B CIO TTT (time to trigger) Hysteresis and so on to solve the problem that the handover is not prompt or there are pingpong handovers This section tries to solve this kind of problems through OMC data analysis and parameter optimization
441 Optimization of Soft Handovers
Missed neighboring cell configuration pilot pollution improper soft handover parameter configuration and equipment malfunctions are the major causes of soft handover failures To confirm the problems the field DTs are required
ZTE Confidential Proprietary copy 2012 ZTE CORPORATION All rights reserved 33
UMTS KPI Optimization Analysis Guide Internal Use Only
4411 Soft Handover Optimization Flowchart
Figure 4-12 Soft handover optimization flowchart
ZTE Confidential Proprietary copy 2012 ZTE CORPORATION All rights reserved 34
UMTS KPI Optimization Analysis Guide Internal Use Only
Extract performance data
TOP Ncell filtering
Analyze a single cell
1 Check NE alarms
2 Associate emergencies
3 Compare parameter
configurations
4 Associate indicators
5 Locate the fault
comprehensive ly
Exist or not
Handle alarms
Solved or not
Yes
Yes
End
No
No
Exist or not
Handle emergencies
Solved or not
Yes
No
No
Exist or not
Correct wrong parameter
configurations
Solved or not
Yes
No
No
List related indicator counters
RTWPResource
limit indicators
Checkamp analysis of interference
Optimization analysis of
resource limitCounters related to intra-frequency
handover failures
C301391101 C301390593C301391102 C301390594C301391103 C301390595C301390586 C301390596C301390587 C301390597C301390588 C301390598C301390589 C301390599C301390590 C301390600C301390591 C301390601C301390592 C301390602
Solved or not
Yes
Yes
No
Drive Test+RNC signaling
trace
Yes
Counters related to soft handover
failures
30055 3005630057 3005830059 3006030061 30062
Cell hand-inhand-out indicators
ZTE Confidential Proprietary copy 2012 ZTE CORPORATION All rights reserved 35
UMTS KPI Optimization Analysis Guide Internal Use Only
4412 Checking Missed Neighboring Cell Configuration
Generally speaking most of the call drops at the beginning of the optimization are caused by missed neighboring cell configuration The following methods are often used to judge whether the call drops are caused by missed configuration of co-frequency neighboring cells
Observe the active set EcIo information recorded by the UE and the Best Server EcIo information recorded by the Scanner before the call drop If the former record is very bad but the latter record is very good then check whether the Best Server scrambling code recorded by the Scanner appears in the latest list of the neighboring cells under intra-frequency measurement control If it does not then the call drop is caused by missed neighboring cell configuration
If the UE re-accesses immediately after the call drop and the cell scrambling codes during the UE reaccess and those during the call drop are different then the call drop may also be caused by missed neighboring cell configuration You can confirm it through measurement control (look backwards from the message of the call drop event for the latest intra-frequency measurement control message and check the neighboring cell list of this message)
Some UE may report the Detected Set information If the corresponding scrambling code appears in the Detected Set information before the call drop then the call drop is caused by missed neighboring cell configuration
4413 Checking Pilot Pollution
Definition of pilot pollution Excessive strong pilot signals exist at a certain point but none of them is strong enough to be the best server To form pilot pollution the following points in this definition should be satisfied
Strong pilot signal The absolute pilot signal strength is used to judge whether the pilot signal is a strong one The pilot signal strength can be evaluated through the pilot RSCP If the pilot RSCP exceeds a threshold it is considered a strong pilot signal The formula is
AbsoluteRSCPThRSCPCPICH __ gt
Excessive The number of pilot signals is used to judge whether there are excessive pilot signals at a certain point If the number exceeds a threshold it is regarded that excessive pilot signals exist at this point The formula is
NThNumberCPICH gt_
None of them is strong enough to be the best server The relative strength of a pilot signal is a key factor in judging whether the pilot signal is strong enough Based on the above definition and formulae if the difference between the strength of the
ZTE Confidential Proprietary copy 2012 ZTE CORPORATION All rights reserved 36
UMTS KPI Optimization Analysis Guide Internal Use Only
strongest pilot signal and that of the )1( +NTh strongest pilot signal at this point is
less than a threshold it is regarded that there is no pilot signal strong enough to be the best server at this point The formula is
lativeRSCPthThbest ThRSCPCPICHRSCPCPICHN Re_)1( )__( ltminus +
According to the above description it is regarded that pilot pollution exists if the following conditions are both satisfied
The number of pilot signals that meet the condition
AbsoluteRSCPThRSCPCPICH __ gt is more than NTh
lativeRSCPthThbest ThRSCPCPICHRSCPCPICHN Re_)1( )__( ltminus +
For example during the network optimization suppose
dBmTh AbsoluteRSCP 95_ minus= 3=NTh and dBTh lativeRSCP 5Re_ = if the following
conditions are both satisfied then it is regarded that pilot pollution exists
The number of the pilot signals that meet the condition
dBmRSCPCPICH 95_ minusgt is more than 3
dBRSCPCPICHRSCPCPICH thbest 5)__( 4 ltminus
4414 Adjusting Soft Handover Algorithm Parameters
You can solve the following kinds of problems by adjusting handover algorithm parameters
1 The handover is not prompt
From the perspective of the CS service signaling flow the symptom of this problem is that the UE cannot receive Active Set Update (physical channel reallocation in the case of the intra-frequency hard handover) because after the UE reports the measurement report the source cell has a fast reduction in EcIo When the RNC sends Active Set Update the UE has closed the transmitter due to the loss of downlink synchronization Viewed from the UE side it cannot receive Active Set Update In the PS services if the UE cannot receive Active Set Update or TRB resets before the handover the handover will also fail
From the perspective of signals the following phenomena may accompany this problem
ZTE Confidential Proprietary copy 2012 ZTE CORPORATION All rights reserved 37
UMTS KPI Optimization Analysis Guide Internal Use Only
minus Corner effect EcIo of the source cell decreases drastically and EcIo of the target cell increases sharply (very high when it appears)
minus Fast fading EcIo of the source cell decreases quickly for a while and then increases and EcIo of the target cell increases for a short while
2 Pingpong handovers The following phenomena may accompany this problem
The best server changes quickly Two or more cells take turns to be the best server But as the best server none of the cells can last long though they has good RSCPs and EcIos
There is no best server There are multiple cells Their RSCPs are normal and similar to each other But EcIo of every cell is very bad
From the perspective of the signaling flow Event 1A is reported immediately after one cell is deleted Because the UE cannot receive Active Set Update from the RNC the handover fails
4415 Equipment Malfunctions
First check the alarm console to see whether there are abnormal alarms and analyze the message traces at the same time Find out in which step the soft handover fails Check the failure message and contact the local product maintaining engineer to confirm whether the equipment has malfunctions
4416 Solutions
Corresponding adjustments should be taken for the confirmed problems
Handover failures caused by pilot pollution Adjust the engineering parameters of a certain antenna to set this antenna as the best server in this interfered location If the power of one of its sectors is reduced then Io of the pilot pollution area will decrease even if the powers of other pilots are not adjusted EcIo will also increase Thereby the EcIo differences with other scrambling codes in the active set will become larger and pilot pollution will be eliminated Through a lot of research ZTE has proved that the reduction in the pilot transmit power will not change cell capacity greatly If condition allows new base stations can be added to cover this area
Equipment malfunctions Consult the customer service engineers and ask them to help check whether there are alarms and whether the transport layer is abnormal If there are alarms coordinate with the customer service engineers and the engineering personnel to solve the problems
Call drops because the handovers are not prompt
ZTE Confidential Proprietary copy 2012 ZTE CORPORATION All rights reserved 38
UMTS KPI Optimization Analysis Guide Internal Use Only
minus Adjust the antenna to expand the handover zone
minus Configure the Event 1A handover parameters to make the handover easier to happen
minus Increase CIO to make the handover happen earlier in the target cell The sum of CIO and the actually measured value is used for judging the UE events including the UE intra-frequency handover CIO helps shift the cell border in the handover algorithm If CIO is configured with a larger value the handover will be easier to happen and there will be more UE in the soft-handover status but more resources will be occupied If CIO is configured with a smaller value the soft handover will be more difficult to happen and the receiving quality may be impaired A CIO of about 5dB is quite good for eliminating the fast fading and the corner effect but this configuration has some side effects such as the increase of handover proportion
Call drops caused by pingpong handovers Adjust the antenna to form a best server in its coverage zone or set the Event 1B handover parameters (increase the threshold of Event 1B the Event 1B hysteresis or the time to trigger Event 1B) to increase the difficulty in deleting the active set
442 Optimization of Hard Handovers
4421 Classification of Hard handovers
Hard handovers mainly fall into two classifications
Intra-frequency hard handovers The intra-frequency hard handover is triggered only when the intra-frequency softsofter handover cannot be performed and it is applicable to the following circumstances
minus Inter-RNC intra-frequency cell handovers when there is no Iur interface
minus Insufficient Iur interface resources though there is the Iur interface
minus Handovers controlled by the threshold of the PS service rate in the handover cell
The intra-frequency softsofter handovers can not be performed (intra-frequency hard handover should be triggered) in the following scenarios
minus When the intra-frequency handover happens the UE is using the transmit diversity in the active set cell but the target cell does not support the transmit diversity
minus The intra-frequency measurement report does not contain OFF and TM of the
ZTE Confidential Proprietary copy 2012 ZTE CORPORATION All rights reserved 39
UMTS KPI Optimization Analysis Guide Internal Use Only
target cell
minus When the intra-frequency handover happens between RNCs the Iur interface is unavailable
minus The UE performs the multiuser detection in the active set cell but the target cell does not support the multiuser detection
minus The target cell and the original cell belong to different classifications (The cells of R99 R5+R99 and R6+R5+R99 belong to the same classification while the cells of R5 and R6+R5 belong to another classification)
Inter-frequency hard handovers The inter-frequency hard handover means a UE connection is handed over from a cell of a UTRAN frequency to a cell of another frequency Many factors including the radio quality the load and the speed of the moving UE may trigger inter-frequency hard handovers
For example the radio quality triggers the inter-frequency hard handover in the following way
When the quality of the UE radio frequency becomes lower the inter-frequency measurement will be triggered and according to the measurement result the UE connection will be handed over to a better frequency
ZTE Confidential Proprietary copy 2012 ZTE CORPORATION All rights reserved 40
UMTS KPI Optimization Analysis Guide Internal Use Only
4422 Hard Handover Optimization Flowchart
Figure 4-13 Hard handover optimization flowchart
ZTE Confidential Proprietary copy 2012 ZTE CORPORATION All rights reserved 41
UMTS KPI Optimization Analysis Guide Internal Use Only
Extract performance data
TOP Ncell filtering
Analyze a single cell
1 Check NE alarms
2 Associate emergencies
3 Compare parameter
configurations
4 Associate indicators
5 Locate the fault
comprehensive ly
Exist or not
Handle alarms
Solved or not
Yes
Yes
End
No
Exist or not
Handle emergencies
Solved or not
YesNo
Exist or not
Correct wrong parameter
configurations
Solved or not
Yes
No
No
List related indicator counters
RTWPResource
limit indicators
Checkamp analysis of interference
Optimization analysis of
resource limit
Counters related to inter-frequency handover failures
C301110489 C301110516C301110499 C301110517C301110500 C301110518C301110501 C301110519C301110502 C301110520C301110503 C301110521C301110504 C301110522C301110505 C301110523
Solved or not
Yes
Yes
No
Drive Test+RNC signaling
trace
Yes
Counters related to hard handover
failures
30041 3004230043 3004430045 3004630047 30048
Cell hand-inhand-out indicators
NoNo
ZTE Confidential Proprietary copy 2012 ZTE CORPORATION All rights reserved 42
UMTS KPI Optimization Analysis Guide Internal Use Only
4423 Hard Handover Optimization Methods
The optimization flow for the hard handover is similar to that of the soft handover The major differences are in the parameter optimization To optimize intra-frequency hard handovers you can properly reduce the Event 1D hysteresis and the time to trigger Event 1D according to the real radio environment to ensure timely handovers
Inter-frequency coverage is often applied to some special scenarios such as indoor coverage and tested through CQT The method of judging whether there is missed configuration of the inter-frequency neighboring cell is almost the same as that of the co-frequency neighboring cell when a call drop occurs the UE fails to measure or report the inter-frequency neighboring cell after the call drop the UE resides in the inter-frequency neighboring cell again
The common hard handover problems are
1 The handover is not prompt The common symptoms are frequent call drops in the hard handovers when the UE moves
Solutions
Increase the threshold of activating the compressing mode The compressing mode is usually activated before the inter-frequency handover or the inter-RAT handover and it is used to measure the quality of the inter-frequency or inter-RAT cell You can set a threshold of the CPICH RSCP or EcIo to activate the compressing mode And the RSCP is widely used
minus Requirements on setting the threshold of activating the compressing mode Before the cell quality becomes low enough to cause a call drop the signal of the target cell should be measured and reported and the handover should be performed
minus Requirement on setting the threshold of deactivating the compression mode Frequent activationdeactivation of the compression mode should be avoided
Increase CIOs of the inter-frequency cell pair
Reduce the threshold of triggering the target frequency handover under the inter-frequency coverage
2 There are pingpong handovers
Solution Increase the hard handover hysteresis and the time to trigger the event
ZTE Confidential Proprietary copy 2012 ZTE CORPORATION All rights reserved 43
UMTS KPI Optimization Analysis Guide Internal Use Only
443 Optimization of Inter-RAT Handovers
4431 Configuring Basic Inter-RAT Parameters
Most of the inter-RAT handover failures are caused by incomplete parameter configuration The following parameters need special attention
Complete RNC parameter configuration for the GSM neighboring cell The 2G system shall provide the 3G system with the correct radio parameters based on negotiation mdash MCC MNC LAC ID (CI) NCC BCC frequency band indicator (900 or 1800) and BCCH
Table 4-3 Parameters That 2G Shall Provide to 3G
MCC MNC LACIDCI
NCC BCCFrequency
band indicator
BCCH
460 2 202 193 0 0 900 102
Complete GSM BSC parameter configuration for the WCDMA neighboring cell The 3G system shall provide the 2G system with the correct radio parameters based on negotiation mdash MCC MNC LAC RNC ID cell ID (C_ID) downlink frequency scrambling code and RAC
Table 4-4 Parameters That 3G Shall Provide to 2G
MCC MNC LACRNC
IDCell IDC_ID
Downlink frequency
Scrambling code
RAC
460 3 20 18 51 10787 51 20
According to the current strategy of one-way inter-RAT handovers if the parameter configuration is complete one probable cause of the inter-RAT handover failure is that the handover is not prompt The common parameter adjustment is to increase CIO the threshold to activatedeactivate the compressing mode and the threshold to trigger the WCDMA-to-GSM handover at the same time
Call drops during the inter-RAT handovers between WCDMA and GSM may be caused by
minus Inconsistent data configuration at the GSM side and the WCDMA side after GSM modifies the configuration data but does not inform WCDMA
minus Missed configuration of neighboring cells which can be solved by the correct configuration of neighboring cells
minus Too fast signal changes
ZTE Confidential Proprietary copy 2012 ZTE CORPORATION All rights reserved 44
UMTS KPI Optimization Analysis Guide Internal Use Only
minus Pingpong reselection
minus Faults with the UE for example the UE fails to respond to the handover or report the inter-RAT measurement report
minus Changes of the best server during the physical channel reallocation
minus Wrong LAC configuration which can be located through data configuration check
ZTE Confidential Proprietary copy 2012 ZTE CORPORATION All rights reserved 45
UMTS KPI Optimization Analysis Guide Internal Use Only
4432 Inter-RAT Handover Optimization Flowchart
Figure 4-14 Inter-RAT handover optimization flowchart
ZTE Confidential Proprietary copy 2012 ZTE CORPORATION All rights reserved 46
UMTS KPI Optimization Analysis Guide Internal Use Only
Extract performance data
TOP Ncell filtering
Analyze a single cell
1 Check NE alarms
2 Associate emergencies
3 Compare parameter
configurations
4 Associate indicators
5 Locate the fault
comprehensive ly
Exist or not
Handle alarms
Solved or not
Yes
Yes
End
No
No
Exist or not
Handle emergencies
Solved or not
Yes
No
No
Exist or not
Correct wrong parameter
configurations
Solved or not
Yes
No
No
List related indicator counters
RTWPResource
limit indicators
Checkamp analysis of interference
Optimization analysis of
resource limitCounters related to inter-RAT handover failures
C301130667 C301130681C301130668 C301130682C301130669 C301130690C301130670 C301130691C301130671 C301130692C301130672 C301130693C301130673 C301130694C301130674 C301130696C301130675 C301130697C301130677 C301130698C301130678 C301130699C301130679 C301130700
C301130680
Solved or not
Yes
Yes
No
Drive Test+RNC signaling
trace
Yes
Counters related to inter-RAT handover
failures
Cell hand-inhand-out indicators
30049 3005030051 3005230053 30054
ZTE Confidential Proprietary copy 2012 ZTE CORPORATION All rights reserved 47
UMTS KPI Optimization Analysis Guide Internal Use Only
45 Optimization of Resource Indicators
The resource indicators directly reflect the system capacity Increasing subscribers will consume more system resources and some resources may be limited for example the code resource may be limited the TCP access request may be rejected and the CE resource usage rate may exceed the threshold Limited system resources have a negative influence on the whole-network indicators and the subscribersrsquo perception for example call drops may frequently happen and more TCP access requests may be rejected during the voice services
Table 4-5 Resource KPIs and Alarm Thresholds
Resource type KPI No and nameAlarm
threshold
TCP
C301320150 Number of rejected services DCH downlink TCP limit
50
PI30167 Average non-HS (SOA) (SOA)DPA TCP 40
PI30092 Maximum Cell TCP () 100
PI30093 Average Cell TCP 70
UL TrafficPI30029 Handover Blocking Rate 05
KPI RTWP (in busy hour) -98 dBm
Code
C301320153 Number of rejected services DCH no code
50
PI30205 Average Cell HSUPA Users 12
PI30172 Cell Average HSDPA Users 16
CE
PI301830006 Maximum use Ratio of Uplink NodeB CE
60
PI301830010 Maximum use Ratio of Downlink NodeB CE
60
ZTE Confidential Proprietary copy 2012 ZTE CORPORATION All rights reserved 48
UMTS KPI Optimization Analysis Guide Internal Use Only
451 Resource Indicator Optimization Flowchart
Figure 4-15 Resource indicator optimization flowchart
ZTE Confidential Proprietary copy 2012 ZTE CORPORATION All rights reserved 49
UMTS KPI Optimization Analysis Guide Internal Use Only
Extract performance data
TOP Ncell filtering
Analyze a single cell
1 Check NE alarms
2 Associate emergencies
3 Compare parameter
configurations
4 Associate indicators
5 Locate the fault
comprehensive ly
Exist or not
Handle alarms
Solved or not
Yes
是
End
No
No
Exist or not
Handle emergencies
Solved or not
Yes
No
No
Exist or not
Correct wrong parameter
configurations
Solved or not
Yes
No
No
List related indicator counters
Code resource indicators
CE resource indicators
TCPadmission
reject counter
C301320150
Solved or not
Yes
Yes
No
Drive Test+RNC signaling
trace
Yes
Counter related to TCP limit
Cell TX power
indicators
30090 3009130092 3009330166 3016730168 3016930170 30171
30163301643016530075
30223302243045030451
Yes
Yes
ZTE Confidential Proprietary copy 2012 ZTE CORPORATION All rights reserved 50
UMTS KPI Optimization Analysis Guide Internal Use Only
452 Code Resource Optimization
The statistics of Number of rejected services and DCH no code the average code resource usage rate and the number of the HSDPA subscribers can be used to judge whether the code resource in a cell is limited If the code resource is limited you can adjust the code resource allocation to alleviate the situation
Based on the system algorithm when Formula 1 is satisfied you can add an HS-PDSCH when Formula 2 is satisfied then an HS-PDSCH is deleted
Formula 1 OcuRateNoHspdsch + OcuRateHspdsch + DpchCodeHy + 32 lt= 512
Formula 2 OcuRateNoHspdsch + OcuRateHspdsch + CodeUptHyA gt 512
OcuRateHspdschHSPDSCH means the number of the codes of SF=512 blocked by the HS-PDSCH OcuRateNoHspdsch means the number of codes of SF=512 blocked by other channels DpchCodeHy means the number of codes of SF=512 reserved for the DPCH and CodeUptHyA is the threshold to decide whether to delete the HSPDSCH
Therefore to ensure the access of the R99 subscribers you can make some adjustment according to Table 4-6 when the code resource is limited though the HSDPA rate may decrease
Table 4-6 Adjusting Code Resource Allocation
AbbreviationParameter
nameRange
and stepCurrent value
Update value
Remark
DpchCodeHy DPCH Code Hysteresis
0512 16 28
To decrease the number of rejected services for DCH no code
CodeUptHyACode Update Hysteresis A
0512 16 28
To decrease the number of rejected services for DCH no code
453 Monitoring CE Resource
The CE resource is mainly monitored through the maximum UE uplinkdownlink usage rate If there is any problem you can solve it by controlling the load or adding more boards
ZTE Confidential Proprietary copy 2012 ZTE CORPORATION All rights reserved 51
UMTS KPI Optimization Analysis Guide Internal Use Only
454 Optimization of Power Control
4541 Monitoring and Optimizing Downlink Power Control
Limited TCP in busy hours will not only increase access failures and call drops in the local cell but also increase soft handover failures and call drops in the neighboring cells Number of rejected services and DCH downlink TCP limit are intuitive KPIs to judge whether TCP is limited Although limited uplink capacity and massive UE moves in the rush hours may also cause call drops the limited TCP is absolutely a key factor
Based on the system algorithm MinHsdpaPower (MinHspaPwrRto) + NoHsPower gtNode B if the safety threshold is used (MinHsdpaPower means the power reserved for HSPA) then it will activate the downlink rate downgrade algorithm flow for the congestion (lower the downlink DCH rate) Although the rate downgrade can ensure access of some subscribers it is an irregular action and will degrade the performance
455 Speeding up Rate Downgrade
Considering that the cells with heavy load reject more access requests you can speed up the rate downgrade during the resource congestion to release the resources as soon as possible and avoid call drops caused by access failures (this method is only applicable to the cells with many PS service users but not those with only CS service users) Table 4-7 is an example of the parameter modification for the rate downgrade
Table 4-7 Example of Parameter Modification for Rate Downgrade
Abbreviation Parameter nameRange and
stepCurrent value
Update value
Remark
UlDnMaxStg Maximum Number of Degraded Uplink Load Steps Every Time
[1 8] 1 2 Downgrade from 384 Kbps to 16 Kbps
DlDnMaxStg Maximum Number of Degraded Downlink Load Steps Every Time
[1 8] 1 3 Downgrade from 384 Kbps to 8 Kbps
456 Monitoring and Optimizing Uplink Capacity
Handover Blocking Rate and RTWP can reflect the uplink capacity of the cell Because interference may also increase RTWP this factor should be distinguished during the RTWP monitoring Another effective indicator is the voice service erl If a cell has over 20 erls in busy hours you should pay special attention to it
ZTE Confidential Proprietary copy 2012 ZTE CORPORATION All rights reserved 52
UMTS KPI Optimization Analysis Guide Internal Use Only
457 Optimization of Uplink Capacity at the Whole Network Level
Case The uplink capacity was limited in a large number of sites after the cutover and the symptoms are a sharp rise of RTWP and a high call drop rate during the rush hours
After the following parameters were modified as shown in Table 4-8 the problem was solved
Table 4-8 Example of Power Control Parameter Modification
AbbreviationParameter
nameRange
Current value
Update value
ULINITSIRUplink Initial SIR target (dB)
UL 34 K136 K signaling UL 122 K AMR
4-5 35
ULMAXSIRMaximum Uplink SIR target (dB)
UL 34 K136 K signaling UL 122 K AMR
15 10
UlSirTargDnStepUplink SIR Target Down Step Size (dB)
UL 34 K136 K signaling UL 122 K AMR
01 02
458 Optimization of Uplink Capacity for a Single Cell
A lot of optimization measures can be taken to bring down the rising RTWP However with increasing subscribers the capacity may still be limited in some area while further modification of SirTarget will obviously degrade the call quality of the whole network and undermine the subscribersrsquo perception In this case you can adjust the power control parameters for a single site that has heavy traffic in the following way add one set of DivPc parameters and use this set of parameters only for this site
Case Table 4-9 shows an example of the power control parameter modification After this modification the call drop rate in the site with heavy traffic decreased to one quarter of the original one
Table 4-9 Example of Power Control Parameter Modification for Heavy-Traffic Cell
SRVTYPE ULINITSIR ULMAXSIR ULMINSIR
0 35-gt15 100-gt35 20-gt10
104 40-gt20 150-gt50 05-gt0
28 35-gt15 100-gt35 05-gt0
50 60-gt20 150-gt50 20-gt0
54 60-gt20 150-gt50 20-gt0
ZTE Confidential Proprietary copy 2012 ZTE CORPORATION All rights reserved 53
UMTS KPI Optimization Analysis Guide Internal Use Only
2 KPI Monitoring ProcessThe purpose of KPI monitoring is to find out abnormal events that affect services as well as subscribersrsquo perception and solve the problems as early as possible For instance if the call drop rate at a certain site goes over 50 we need to find the problem and work out the solution in the earliest time
As it is very urgent and important to locate KPI problems we need a whole set of scientific KPI monitoring mechanism and problem shooting process as well as appropriate monitoring tool and analysis tool to help us find the call drops caused by transmission problems resource congestion cells service interruption serious interference hardware fault with NodeB wrong configuration of RNC parameters in time
We classify KPI monitoring into four categories routine KPI monitoring KPI monitoring during the process of parameter modification KPI monitoring during the RNC or NodeB version upgrade and KPI monitoring during the process of cutover Routine KPI monitoring should be performed every day and be recorded in a KPI daily report which should involve the worst CS cell the worst PS cell the cell with the lowest RRC connection rate the cell with the most serious resource limit and so on
21 KPI Monitoring Process
KPI monitoring falls into four categories routine KPI monitoring KPI monitoring during the process of parameter modification KPI monitoring during the version upgrade of RNC or NodeB and KPI monitoring during the process of cutover Each type of monitoring has its own monitoring items and output form For instance the output of the routine KPI monitoring should be a daily report while the output of other KPI monitoring types should be a KPI comparison report Different types of KPI monitoring should have different time granularities according to the requirement of problem location
Routine KPI monitoring should be done persistently and be recorded in a daily report which should include a collection of the cells worst in different aspects and be sent to relevant person by email
22 Routine KPI Monitoring Process
Figure 2-2 Routine KPI monitoring process
ZTE Confidential Proprietary copy 2012 ZTE CORPORATION All rights reserved 2
Hand to RampD dept or
customer service dept交研发或用
服处理
UMTS KPI Optimization Analysis Guide Internal Use Only
ZTE Confidential Proprietary copy 2012 ZTE CORPORATION All rights reserved 3
Parameter problem
Hand to the planning personnel
Classification of the
worst cells
Problem handling team classifies
collects and locates the worst cells
Hand to the network
optimization personnel
Hand to RampD dept or
customer service dept交研发或用
服处理
Send email in fixed format to relevant
personnel
Coverage problem
Equipmentversion problem
Network KPI monitoring
( 15 minutes time granularity)
Screen out the worst cells with
KPI tool
EMS exports the one-day granularity
of the whole network
Output KPI daily report in Excel
UMTS KPI Optimization Analysis Guide Internal Use Only
23 KPI Monitoring Process During Parameter Modification
Figure 2-3 KPI monitoring process during parameter modification
Old parameter configuration
Configure data according to the
worksheet
Network KPI monitoring (15-
minute granularity)
Whether the KPIs at the
RNC level are normal
Keep on monitoring (15-
minute granularity)
Output a report in Word (hourly
granularity KPIs before and after the parameter modification)
End
Yes
Notify the person in charge by mail
or phone
Rollback or not
Locate the worst cells and check if they are caused
by the parameter modification
No
Yes
No
ZTE Confidential Proprietary copy 2012 ZTE CORPORATION All rights reserved 4
Network KPI monitoring
( 15 minutes time granularity)
UMTS KPI Optimization Analysis Guide Internal Use Only
24 KPI Monitoring During RNC or NodeB Version Upgrade
Figure 2-4 KPI monitoring workflow during RNC or NodeB version upgrade
ZTE Confidential Proprietary copy 2012 ZTE CORPORATION All rights reserved 5
Yes
No
No
End
Locate the worst cells Determine whether they are related with the version update
Yes
Network KPI monitoring
( 15 minutes time granularity)
Execute the worksheet to
upgrade version
Output formal Word report (Compare the hourly granularity KPIs before and after the parameter modification and output the result every hour)
Whether the RNC-level
KPI is normal
Keep on monitoring (15 minutes granularity)
Send mail to or call the person in charge
Rollback or not
Current version
UMTS KPI Optimization Analysis Guide Internal Use Only
25 KPI Monitoring During Cutover
For the network on which the equipment needs to be replaced (for instance HongKong CSL network for which we replaced Nokiarsquos equipment with ZTErsquos) after the network optimization is completed the subscribers on the existing network should be cut over to our network gradually During the cutover there will be subscribers registering on our network constantly which will cause load increase on the network In this case we should watch KPI changes closely The monitoring process items method and report are the same as those described in section 24 ldquoKPI Monitoring During RNC or NodeB VersionUpgraderdquo Please read it for reference
3 KPI Analysis Methods
31 KPI Analysis Methods
Different network problems require different performance analysis methods Choose one or more appropriate methods after learning the running state of the existing network and the problems with it Common analysis methods are as follows
TOP N worst cells method Based on the traffic statistics indicators we care about (such as the call drop rate connection rate and soft handoff failure rate) choose N worst cells whose average indicator values in the peak hours or of the whole day are the lowest as the target of fault analysis and optimization Or prioritize objects of optimization against these indicator values
Time tendency chart method Tendency chart of indicator change is commonly used in the traffic analysis The analysis engineer can work out an hourly daily or weekly tendency chart of one or more indicators of the whole network a cluster or a single cell and find out the change rule of traffic statistics indicators
Regional location method The change of network performance indicators often occurs in some regions The indicators in these regions may be worsened by traffic increase traffic mode change radio environment change faults with a small number of stations or uplinkdownlink interference which will therefore affect the performance indicators of the whole network By comparing the network performance indicators before and after the change we can mark out the station or the sector with the greatest indicator change on an electronic map and take these problem regions as the analysis focus
Comparison method A single traffic statistics indicator may be affected by many factors While some factors change others may not Choose a proper object for comparison to confirm the existence of problems and then analyze the causes of the problems When examining an indicator do not care whether the absolute indicator value is high or low only pay more attention to whether the value is high or low compared to other indicators instead
ZTE Confidential Proprietary copy 2012 ZTE CORPORATION All rights reserved 6
UMTS KPI Optimization Analysis Guide Internal Use Only
311 TOP N Worst Cells Method
During the whole process of KPI optimization analysis TOP N worst cells analysis method is the most effective one which can be used throughout the whole optimization phase By focusing on the TOP N worst cells you can solve the major problems with the network Abnormal call drop events may happen every day and these events may represent problems of a kind After solving the problems with TOP N cells you can solve the problems of the same kind Therefore focusing on TOP N cells is one of the most effective ways to solve problems
TOP N worst cells analysis method is applicable to the optimization analysis of all the indicators Choose TOP N worst cells according to a certain threshold which varies depending on different indicators N stands for the number of the worst cells When the worst cells are too many to be worked on the number of the worst cells can be decreased so that you can focus on them TOP N cells analysis method includes the following steps
Step 1 Screen out TOP N cells according to the condition of the indicators you care about
Step 2 Conduct a health check for TOP N cells Check whether there are any problems with transmission or boards and check whether the worst cells are caused by external abrupt incidents such as terrible weather gatherings or holiday (because during gatherings and holidays the traffic is usually heavy)
Step 3 Check the radio parameters configuration of these cells the radius of these cells and their neighboring cells and compare them with the normal cells
Step 4 Export the indicator relevant most closely with the indicators you care about and analyze it to find the problem indirectly
For instance one day CS call drop rate of a whole network was high We analyzed the problem by the TOP N cells analysis method
Step 1 Screen out TOP N cells according to the condition of the indicators you care about
We used the CNO KPI analysis function to screen out TOP N cells (other tools can be also used) and selected 10 cells with the highest CS call drop rate
Table 3-1 List of CS TOP N Worst Cells
Index Cell RNS subnet ID Cell IDCall drop
rate CS AMRNumber of call
drop voice
1 ZBL1U-AI-1 (201) 12911 4158 553
2 ZBL1U-AI-3 (201) 12913 3955 545
3HKE1U-5H-1
(203) 30461 1556 370
ZTE Confidential Proprietary copy 2012 ZTE CORPORATION All rights reserved 7
UMTS KPI Optimization Analysis Guide Internal Use Only
Index Cell RNS subnet ID Cell IDCall drop
rate CS AMRNumber of call
drop voice
4HKE1U-5H-3
(203) 30463 1581 360
5LAK1U-9M-3
(202) 11063 339 282
6 HIC1U-9R-1 RNC101(101) 10891 226 216
7LAK1U-9M-1
(202) 11061 249 215
8EBP1U-9R-3
RNC101(101) 12823 230 205
9SRS1U-5H-1
RNC102-CSL(102)
12091 392 169
10HRM1U-6R-1
RNC102-CSL(102)
20671 341 167
Step 2 Check the transmission and hardware of the TOP N cells and check whether they are caused by external abrupt incidents such as terrible whether gatherings or holidays when traffic is usually heavy
And then we conducted a health check for each cell and paid attention to routine alarms and BPC board problems We found there were broken associations in some HKE sites
Step 3 Check the radio parameters configuration of these cells the radius of these cells and their neighboring cells and compare them with the normal cells
(1)Problem with the cell radius After the check we found the cell radius of the LAK site was 25 km Because the LAK site was situated by the sea and the antenna was placed very high the radius of 25 km was far from enough So we changed the cell radius to 10 km and the problem of high call drop rate was thus solved
(2)Problem with configuration HIC site is an indoor POI site The RRU RxTx port and the RRU Rx port were configured reversely which is the cause of high call drop rate After modifying HIC we found that signals of the second RRU were received by the Rx port So we changed the configuration of the RxTx port and the Rx port the problem of high call drop rate was thus solved
Figure 3-5 RF configuration at HIC site
Figure 3-6 Antenna energy distribution at HIC site
ZTE Confidential Proprietary copy 2012 ZTE CORPORATION All rights reserved 8
UMTS KPI Optimization Analysis Guide Internal Use Only
Step 4 Export the indicator relevant most closely with the indicators you care about and analyze it to find the problem indirectly
Table 3-2 Indicators Related with CS Call Drop
Index Cell
RAB release number for Iu connection
release request by UTRAN for CS domain in
cell radio connection with UE lost
RAB release number for Iu connection
release request by UTRAN for CS domain in cell failure in
the radio Interface
procedure
RAB release number for Iu connection
release request by
UTRAN for CS domain in
cell release due to
overload control
RAB release number for Iu connection
release request by
UTRAN for CS domain in
cell unspecified
failure
Average cell freq RTWP (dbm)
1ZBL1U-AI-1
482 43 0 29 -104177
2ZBL1U-AI-3
473 40 0 33 -104125
3HKE1U-5H-1
346 16 0 8 -105908
4HKE1U-5H-3
330 18 0 13 -1060777
5LAK1U-9M-3
69 196 0 18 -1031906
6HIC1U-9R-1
100 100 0 16 -1015404
7 LAK1U- 64 131 0 20 -1031934
ZTE Confidential Proprietary copy 2012 ZTE CORPORATION All rights reserved 9
UMTS KPI Optimization Analysis Guide Internal Use Only
Index Cell
RAB release number for Iu connection
release request by UTRAN for CS domain in
cell radio connection with UE lost
RAB release number for Iu connection
release request by UTRAN for CS domain in cell failure in
the radio Interface
procedure
RAB release number for Iu connection
release request by
UTRAN for CS domain in
cell release due to
overload control
RAB release number for Iu connection
release request by
UTRAN for CS domain in
cell unspecified
failure
Average cell freq RTWP (dbm)
9M-1
8EBP1U-9R-3
98 90 0 17 -101413
9SRS1U-5H-1
87 59 0 22 -1043528
10HRM1U-6R-1
42 111 0 13 -1027697
32 Basic KPI Analysis Skills
Be able to use the KPI statistics tool and the analysis tool
Use tools to learn about the running state of the whole network quickly and screen out TOP N worst cells quickly
Use different analysis tools to find problems from different aspects and locate the problem quickly
Understand the signaling process and basic principle
In the process of abnormity location keep a clear aim in mind and be able to apply the process and basic principle to check the other relevant indicators rapidly to facilitate the analysis
Be familiar with the process and basic principle and be able to make logical association between abnormal KPI problems and network problems (such as the coverage problem and the interference problem) Be able to determine the problem nature according to the abnormal KPI and then choose the appropriate tool to analyze the problem in depth
Performance analysis requires engineers to understand basic signaling process be familiar with the protocol stacks of standard interfaces and know relevant algorithms to realize the product functions Engineers should at least have a concept about the various algorithms If the analysis of a commercial network involves some algorithms engineers should study these algorithms in depth
ZTE Confidential Proprietary copy 2012 ZTE CORPORATION All rights reserved 10
UMTS KPI Optimization Analysis Guide Internal Use Only
321 KPI Monitoring Tools
minus Network management tool NetNumenT31 count KPI original data alarm data radio parameter configuration in cells and parameter configuration on the earth
minus KPI daily report generating tool classify key indicators according to a certain condition and screen out the worst cells
322 KPI Analysis Tools
minus CNO Tool CNO tool has the KPI analysis function So using it you can screen out the worst cells according to various conditions and point out the corresponding counter of an indicator
minus SignalTrace Trace the signaling (RNL signaling and RNL signaling) of RNC interfaces which includes the Iu interface the Iur interface the Iub interface and the Uu interface (the signaling flow between RNC and UE at RRC layer) And RNL signaling trace is a common way for locating the KPI problem Being able to trace the RNC signaling is a basic requirement for the on-site KPI optimization engineers and the network optimization and maintenance engineers This signaling tracing tool is very powerful which can trace signaling according to the UE cell and IMSI in the KPI analysis According to the UE cell it can trace the signaling of multiple subscribers while according to IMSI it can trace the signaling of only one subscriber However if the RRC connection is not established yet signaling cannot be traced That is because only when RRC connection has been established can the RNC obtain the subscriberrsquos IMSI from the CN
minus RNC ASS Log ASS log is usually applied when there is abnormity and RNC signaling is out of trace In this case use ASS log to analyze the signaling before and after the abnormity occurs Abnormity can be queried according to IMSI or cell ID ASS log can be also used to collect various abnormities
minus NodeB LMT NodeB local operation and maintenance tool Apart from all the operation functions of the OMCB this tool can collect more detailed information about cells and UE NodeB local maintenance terminals include EOMS EFMS DMS and PMS
minus NodeB Abnormity Probe On the site of WCDMA commercial office NodeB abnormity probe is an effective tool to monitor the running state of the NodeB Every module of NodeB can record the abnormal information automatically which makes it easy to locate problems However this method requires professional knowledge such as knowledge about the function and interface of each module or board If the on-site engineers cannot make the simple analysis they can just obtain the abnormity probe and send it to the RampD engineers at the rear side The abnormities reported on the NodeB will be stored at the OMCB server according to different RNCs To conduct NodeB
ZTE Confidential Proprietary copy 2012 ZTE CORPORATION All rights reserved 11
UMTS KPI Optimization Analysis Guide Internal Use Only
abnormity probe analysis you need to download abnormity probe files from different OMCB servers and then use the abnormity probe tool to make a comprehensive analysis
minus CTS Tool CTS is a tool developed by the CN department which can trace signaling in depth according to IMSI and trace signaling across RNCs So this is particularly suitable to trace VIP subscribers In this case CTS is easier to use than SignalTrace which can only trace signaling of RNCs one by one CTS can trace the interactive signaling between network elements (NEs) within the CN as well as the signaling of the Iu interface and the Uu interface This kind of signaling tracing is what we called in-depth tracing The work principle of CTS is to set up an IMSI task on the CTS server and send it to the CN front side which will then send this task to each CN module via the interfaces dedicated to the CN modules and the RNC and then each module after receiving the signaling related to the IMSI task will send the signaling back to the CTS server via the CN front side The interfaces mentioned above are private interfaces so this tool can only support our own CN and RNC CTS signaling can be checked and analyzed with an offline tool but the offline tool does not work very well because of the lack of continuous optimization and perfection
minus UE log DT test is also an important auxiliary way in analyzing KPI indicators There are many problems that cannot be located by tracing signaling at the network side and can only be located by the use of UE log The commonly used drive test software includes QXDMAPEX (QCAT) CNTCAN and TEMS CNTCAN and TEMS are often used for network optimization For the use of CNTCAN please refer to the corresponding help file and the instruction document publicly released by the Network Optimization Tool Department QXDM and the analysis tool APEX (QCAT) provided by Qualcomm is very powerful which have contributed a lot for the stability and maturity of our system for many years
33 General Process of KPI Optimization Analysis
Basic analyzing ideas
KPI optimization is a process to find and solve problems KPI optimization during the operation and maintenance stage is mainly to pick out the performance data that needs special attention from the OMC classify these performance data and then compare the value of these data with that required by the operator If the value of an indicator is lower than the operatorrsquos requirement analyze this indicator and find out the factor that affect the indicator and then propose a solution to the operator If the values are higher than the operatorrsquos requirement therersquos no need to pay special attention to them
KPI analysis is a process from the whole to the part
Step 1 Check the key indicators from the view of the whole network If there is not any
ZTE Confidential Proprietary copy 2012 ZTE CORPORATION All rights reserved 12
UMTS KPI Optimization Analysis Guide Internal Use Only
problem just ignore them Otherwise try to locate the RNC NE that has the problem
Step 2 Analyze the indicators of the corresponding RNC to find out the RNC whose indicators have the problem
Step 3 Analyze the indicators of the cell under the problem RNC to find out the worst cells or TOP N cells If the indicators of all the cells under the RNC are tend to be low it is a common problem probably caused by parameter configuration And then check whether the radio parameter configuration in the cells under this RNC is the same as that in the cells under the normal RNCs
Step 4 Make a comprehensive analysis on the KPIs alarms DT test data and customer complains of the worst cells to find out a solution
Analysis method
After learning the KPI analysis ideas we must know some common KPI analysis methods to rule out causes of problems from the obvious ones to the hidden ones
For example we found that the TCP code words were strictly limited at eight sites near a park and the call drop rate rose suddenly How to solve this problem
Method one First we checked whether the alarms transmission and boards of these sites were normal After they are proved all normal we sent some engineers to the site to do test And meanwhile we traced the RNC signaling at the OMC It turned out that the test result was normal and the indicators of these sites of that day did not have any problem and code words were not limited And later we knew from the news that there was a big gathering of about one million people at the park at that moment Until then we came to know that the congestion was caused by too many users using the network at the same time
Method two First because the eight sites went worse all of a sudden it was unlikely that the problem lied in the hardware Then we checked whether the radio parameters had been modified the day before The result is no worksheet had been issued to modify those parameters and no alarm was found at those sites Therefore we excluded the possibility of hardware problem Then we checked the traffic trend graph of the last few days (over seven days) and found that the high call drop rate might be caused by high traffic The graph showed that traffic of each site rose suddenly on the day before Thus we came to the conclusion that this was an abnormal abrupt event which may have been caused by a gathering And later we were told that there was a big gathering at the park So we were assured the code words limitation and high call drop rate at the eight sites were caused by too many subscribers using the network at the same time
By comparing the two methods above we can find that although the first one (sending engineers to the site without the consideration of abnormal events) is commonly used it is inefficient and costs more resource The second method (analyzing the problem by the means of exclusion and association) is more efficient From this case we would like to emphasize that KPI analysis is a process of problem exclusion Using the comprehensive
ZTE Confidential Proprietary copy 2012 ZTE CORPORATION All rights reserved 13
UMTS KPI Optimization Analysis Guide Internal Use Only
methods (like Method One) at the first brush may be making a detour
minus Exclusion method Check the alarms on the OMC to learn about the state of the RNC NodeB BPC board and the transmission If there are obvious broken link in transmission or hardware problem the cause of the problem is easy to locate
minus Incident association If the problem is with a great number of sites take abrupt incidents into account such as large-scale gathering terrible weather of incorrect operation These incidents will put influence of different levels and ranges on the network indicators
minus Comparison of radio parameters If some site goes wrong in a sudden check whether the radio parameter configuration of this site is consistent with that of other normal sites If not change it as that of the normal sites because the indicator decrease may be caused by an incorrect modification of radio parameters
minus Relevant indicators association If a certain indicator is in poor condition check its relevant indicators and find the common problem from these relevant indicators
minus Comprehensive problem location When the above reasons are excluded use DT data KPI data RNC signaling analysis data to locate the problem with indicators comprehensively
ZTE Confidential Proprietary copy 2012 ZTE CORPORATION All rights reserved 14
UMTS KPI Optimization Analysis Guide Internal Use Only
Figure 3-7 KPI optimization analysis process
StartPick out
performance indexes
RNC index abnormal
Equipment alarms exist
Deal with equipment alarms
RNC index recovers
Common problem with the
worst cells
Transmission softwarehardware version wireless
parameter configuration
CNRNC Transmission
Hardware Software Interference
Wireless parameters
Time range
Abrupt and self-curable abnormality
helliphellip
Analyze and record causes
Suggestion about improvement
Common problems analysis
Problem resolved
Successful call
Call drop Soft handover
23G alternate operation
PS rate helliphellip
Deal with the relevant problem
Indexes normal
End
Climate change holidays assembly
transmission interruption power
fault and so on
Y
N
Y
Y
N
Y
N
Abnormal indexes analysis in one cell
Y
N
N
N
Y
N
Y
Show TOPN abnormal cells
and their locations
If the problem is proved to be equipment bug or system problem after
several attempts feed it back to RampD dept
ZTE Confidential Proprietary copy 2012 ZTE CORPORATION All rights reserved 15
UMTS KPI Optimization Analysis Guide Internal Use Only
4 KPI Optimization Analysis This chapter mainly demonstrates how to analyze the indicator problems from the aspect of OMC data and provides flowcharts for KPI optimization The detailed analyzing method and cases of every special subject can be checked in the optimization guides of all the subjects
41 CS Call Drop Optimization
The CS call drop rate is the most important indicator in KPI optimization
411 Definition of Call Drop
After checking the signaling on the Uu interface at the UE side the engineer can judge the situation a call drop if the Uu interface message satisfies one of the following three conditions during the calling process (in connection)
RNC Release is not received but the UE condition changes from CELL_DCH to IDLE
RRC Release is received and the released cause value is Not Normal
One of the following three messages mdash CC Disconnect CC Release Complete and CC Release mdash is received and the released cause value is Not Normal Clearing or Not Normal Unspecified
In a board sense the call drop includes the call drop rates of CN and UTRAN The call drop of UTRAN includes the following two aspects
After the successful service establishment RNC sends the RAB Release Request to CN
After the successful service establishment RNC sends the IU Release Request to CN Later RNC receives the IU Release Command from CN
Note that RAN call drop statistics which is defined from the aspect of lu interface signaling means the launching times of RAB Release Request and lu Release Request of RNC And the DT call drop statistics is defined from the aspects of the Uu interface message non-access stratum message and cause value RAN call drop statistics and DT call drop statistics are not exactly the same
ZTE Confidential Proprietary copy 2012 ZTE CORPORATION All rights reserved 16
UMTS KPI Optimization Analysis Guide Internal Use Only
412 CS Call Drop Analysis Flowchart
Figure 4-8 CS call drop analysis flowchart
ZTE Confidential Proprietary copy 2012 ZTE CORPORATION All rights reserved 17
UMTS KPI Optimization Analysis Guide Internal Use Only
Extract performance data
CS TOP Ncell filtering
Analyze a single cell
1 Check NE alarms
2 Associate emergencies
3 Compare parameter
configurations
4 Associate indicators
5 Locate the fault
comprehensively
Exist or not
Handle alarms
Solved or not
Yes
Yes
End
No
No
Exist or not
Handle emergencies
Solved or not
Yes
No
No
Exist or not
Correct wrong parameter
configurations
Solved or not
Yes
No
No
List related indicator counters
Call-drop-related
countersRTWP
Handover success rate
Traffic volume
Resource limit indicators
Checkamp analysis of
interference
Optimizationanalysis of
handover failures
Optimization analysis of
resource limitCall-drop-
related counters
C301230362C301230363C301230365C301230315C301230316C301230318C301230319C301230322C301230323
Solved or not
Yes
Yes
No
Drive Test+RNC signaling
trace
Yes
ZTE Confidential Proprietary copy 2012 ZTE CORPORATION All rights reserved 18
UMTS KPI Optimization Analysis Guide Internal Use Only
42 PS Call Drop Optimization
421 Optimization Flowchart
Figure 4-9 PS call drop optimization flowchart
ZTE Confidential Proprietary copy 2012 ZTE CORPORATION All rights reserved 19
UMTS KPI Optimization Analysis Guide Internal Use Only
Extract performance data
PS TOP Ncell filtering
Analyze a single cell
1 Check NE alarms
2 Associate emergencies
3 Compare parameter
configurations
4 Associate indicators
5 Locate the fault
comprehensive ly
Exist or not
Handle alarms
Solved or not
Yes
Yes
End
No
No
Exist or not
Handle emergencies
Solved or not
Yes
No
No
Exist or not
Correct wrong parameter
configurations
Solved or not
Yes
No
No
List related indicator counters
Call -drop-related
countersRTWP
Handover success rate
Traffic volume
Resource limit indicators
Check amp analysis of interference
Optimizationanalysis of
handover failures
Optimization analysis of
resource limitCall -drop-
related counters
C301230372C301230373C301230375C301230330C301230332C301230333C301230334C301230337C301230338
Solved or not
Yes
Yes
No
Drive Test +RNC signaling
trace
Yes
ZTE Confidential Proprietary copy 2012 ZTE CORPORATION All rights reserved 20
UMTS KPI Optimization Analysis Guide Internal Use Only
43 Optimization of Accessibility Indicators
Accessibility performance includes the success rate of RRC connection setup and the success rate of CSPS RAB assignment These two kinds of KPIs play important roles in the network optimization and directly influence the success rate of CSPS service establishment In this document this kind of problems are found from the aspect of OMC data and solved through parameter optimization
431 Definition of Access Failure
For the mobile originated call in the CS domain the access failure event means that the UE sends RRC REQUEST and IE establish cause is Originating Conversational Call but alerting of the direct transfer message is not received
The relevant events are defined as follows in the access failure stage
RRC connection setup failure After considering the resending times and the waiting time the UE sends RRC CONNECTION REQUEST and does not receive the response from RNC or RRC CONNECTION REJECT delivered by RNC
Initial direct transfer and security mode establishment failure After sending RRC CONNECTION SETUP COMPLETE the UE does not send NAS SETUP
RAB assignment failure After receiving CALL PROCEEDING the UE does not receive RB SETUP delivered by RNC Or the UE replies with RB SETUP FAIL after receiving RB SETUP Or the UE receives DISCONNECT with the cause value not being Normal Release after receiving RB SETUP At this time the UE has not reported RB SETUP CMP
Failure after RAB assignment After the UE sends RB SETUP COMPLETE the originating UE receives DISCONNECTRELEASE from CN Or the UE waits CONNECT or ALERTING overtime and launches the Call Clearing process Or the UE becomes IDLE before receiving Alerting and starts to receive the system message
For the mobile terminated in the CS domain the access failure event means that the terminating UE receives the paging of paging type 1 and does not send RRC CONNECTION REQUEST with the cause value being Terminating Conversational Call Or the UE does not send the alerting of direct transfer message to CN after sending RRC CONNECTION REQUEST
The relevant events are defined as follows in the access failure stage
RRC connection setup failure After sending RRC CONNECTION REQUEST the UE does not receive the response from RNC or RRC CONNECTION REJECT delivered by RNC
Initial direct transfer and security mode establishment failure After sending RRC
ZTE Confidential Proprietary copy 2012 ZTE CORPORATION All rights reserved 21
UMTS KPI Optimization Analysis Guide Internal Use Only
CONNECTION SETUP COMPLETE the UE does not receive the SETUP direct transfer message Or the UE sends RELEASE COMPLETE Or the UE receives DISCONNECT from CN
RAB assignment failure The UE does not receive RB SETUP delivered by RNC after sending CALL CONFIRM Or the UE replies with RB SETUP FAIL after receiving RB SETUP Or the UE receives DISCONNECT with the cause value not being Normal Release after receiving RB SETUP At this time the UE has not reported RB SETUP CMP
Failure after RAB assignment After the UE sends RB SETUP COMPLETE the terminating UE receives DISCONNECTRELEASE from CN
432 Analysis on RRC Connection Failures
The problem of RRC connection setup failure can be analyzed through the UE signaling flow and RNC single-user tracing The RRC connection setup includes the following steps
The UE sends RRC Connection Request through the RACH channel
RNC sends RRC Connection Setup through the FACH channel
The UE sends RRC Connection Setup Complete through the dedicated uplink channel after the downlink dedicated channel is established and synchronized
RRC connection setup failures are always caused by following issues
Uplink RACH problem
Problem about downlink FACH power allocation proportion
Parameter reselection problem of the cell
Low downlink dedicated initial transmitting power
Uplink initial power control problem
Congestion
Equipment malfunctions
Among these issues the problems of uplink RACH downlink FACH power allocation proportion parameter reselection of the cell and equipment malfunctions appear more frequently
ZTE Confidential Proprietary copy 2012 ZTE CORPORATION All rights reserved 22
UMTS KPI Optimization Analysis Guide Internal Use Only
4321 Analysis Flowchart of RRC Connection Setup Failures
Figure 4-10 Analysis flowchart of RRC connection setup failures
ZTE Confidential Proprietary copy 2012 ZTE CORPORATION All rights reserved 23
UMTS KPI Optimization Analysis Guide Internal Use Only
Extract performance data
TOP Ncell filtering
Analyze a single cell
1 Check NE alarms
2 Associate emergencies
3 Compare parameter
configurations
4 Associate indicators
5 Locate the fault
comprehensive ly
Exist or not
Handle alarms
Solved or not
Yes
Yes
End
No
No
Exist or not
Handle emergencies
Solved or not
Yes
No
No
Exist or not
Correct wrong parameter
configurations
Solved or not
Yes
No
No
List related indicator counters
Counters related to RRC setup
failuresRTWP
Resource limit
indicators
Checkamp analysis of interference
Optimization analysis of
resource limitCounters related
to RRC setup failures
C301480485C301480486C301480487C301480489C301480490C301480491C301481288C301481289C301481337C301481338C301481339C301481407C301481408
Solved or not
Yes
Yes
No
Drive Test+RNC signaling
trace
Yes
ZTE Confidential Proprietary copy 2012 ZTE CORPORATION All rights reserved 24
UMTS KPI Optimization Analysis Guide Internal Use Only
4322 UE sends RRC Connection Request but RNC does not receive it
If the EcIo of downlink CPICH is relatively low it is the problem of coverage
If the EcIo of downlink CPICH is not very low (for example the value is larger than -14 dB) Usually it is the problem of RACH and the following issues may cause the problem
minus The power of Preamble does not rise to a required value and the rising times of Preamble should be increased
minus The output power of UE is lower than the required value which is caused by poor UE performance In this case the UE should be changed
minus The NodeB equipment has a standing wave and the engineer should check whether NodeB has any SWR alarm
minus The radius of the cell is set improperly If the radius parameter of the cell is set too small the NodeB can not synchronize the UE beyond the range of the radius and the access fails This problem often happens in the places with large coverage such as the rural areas and the suburbs
4323 RNC delivers RRC Connection Reject after receiving RRC Setup Request
When RRC Connection Reject appears the engineer should check the specific reject cause value Usually there are two kinds of causes
The CPU load of RNC control plane board is too heavy and more boards should be added
DCH and FACH admission is rejected However this situation does not always happen
4324 UE does not receive RRC Connection Setup delivered by RNC
This problem may be caused by the following reasons
Poor coverage
Improper parameters of cell selection and reselection
Checking method The engineer should check the EcIo of CPICH If the value is lower than -12 dB (EcIo is -12 dB by default) and there is no cell of better quality in the monitor set the cause of this problem is poor coverage If there is better cell in the monitor set cell reselection may cause this problem
Poor coverage can be improved by coverage enhancement such as adding some sites to cover the places without signal coverage and adjusting the engineering parameters If the coverage can not be improved the engineer can enhance the FACH power according to
ZTE Confidential Proprietary copy 2012 ZTE CORPORATION All rights reserved 25
UMTS KPI Optimization Analysis Guide Internal Use Only
the PCPICH EcIo coverage of the current network For example if all the pilot EcIo values are larger than -12 dB in the coverage area the power proportion of the common channel should be configured on the basis of the situation that the EcIo value is larger than -12 dB And so the success rate of the idle UE assessment can be ensured
As for the access problem caused by cell selection and reselection the engineer can speed up the cell selection and reselection by adjusting the cell selection and reselection parameters and the problem of RRC connection setup failure caused by improper cell selection and reselection parameters can be solved
Note
The RRC Connection Setup message is borne by FACH RRC Connection Request sent by the UE is received by UTRAN at the preamble of PRACH and then it is sent from the RACH channel based on the current preamble power And the transmit power of preamble can rise all the time until the response is received (There is a limitation for the maximum number of preamble retransmissions) Therefore in the areas with poor coverage the RACH coverage and FACH coverage may become unbalanced and as a result UTRAN can receive RRC Connection Request sent by the UE but the UE can not receive RRC Connection Setup sent by RNC
4325 UE receives RRC Connection Setup and does not send RRC Setup Complete
If the downlink signal quality is normal this problem may be caused by the abnormal condition of the cell phone
Another reason of this problem may be the downlink synchronization failure caused by the low initial power of downlink dedicated channel You can solve this problem by adjusting the service downlink EbNo
4326 RNC does not receive RRC Setup Complete sent by UE
Because the uplink initial power control may increase the UE transmit power this kind of problem seldom appears If it appears the engineer can increase the Constant Value of the dedicated channel properly to raise the uplink DPCCH initial transmission power of the UE
At the same time this problem is also relevant with the uplink SIR initial target value configuration because this value may affect the uplink initial synchronization at the initial stage of link setup If the value of the parameter is set too large there will be too much uplink inference brought by the initial setup of the link If the value is set too small the uplink synchronization will take longer time and the initial synchronization may even fail This parameter is an RNC-level parameter which has a great influence on network performance Therefore the engineer should be cautious while adjusting this parameter
ZTE Confidential Proprietary copy 2012 ZTE CORPORATION All rights reserved 26
UMTS KPI Optimization Analysis Guide Internal Use Only
Note
RRC Connection Setup Complete is sent through uplink DPCH and the UE calculates the initial power of uplink DPCCH according to the received IErdquoDPCCH_Power_offsetrdquo and the measured CPICH_RSCP value
DPCCH_Initial_power = DPCCH_Power_offset - CPICH_RSCP
DPCCH_Power_offset = Primary CPICH DL TX Power + UL Interference + Constant Value The Constant Value can be configured in the OMC If this value is set too small the UE may not have enough power to send RRC Connection Setup Complete
433 Analysis on RABRB Setup Failures
When RAB or RB setup fails RNC will send RAB Assignment Fail in the RAB Assignment Response signaling The engineer can find out the specific failure reason from the failure cause value carried in relevant cells The reasons for common RABRB setup failures include
RNC directly rejecting RAB Setup Request because of wrong parameter configuration
Admission reject
RAB setup failure because the UE fails to respond to RB Setup Request
RAB setup failure because the Uu interface fails to set up RB
ZTE Confidential Proprietary copy 2012 ZTE CORPORATION All rights reserved 27
UMTS KPI Optimization Analysis Guide Internal Use Only
4331 Analysis Flowchart of RAB Setup Failures
Figure 4-11 Analysis flowchart of RAB setup failures
ZTE Confidential Proprietary copy 2012 ZTE CORPORATION All rights reserved 28
UMTS KPI Optimization Analysis Guide Internal Use Only
Extract performance data
TOP Ncell filtering
Analyze a single cell
1 Check NE alarms
2 Associate emergencies
3 Compare parameter
configurations
4 Associate indicators
5 Locate the fault
comprehensively
Exist or not
Handle alarms
Solved or not
Yes
Yes
End
No
No
Exist or not
Handle emergencies
Solved or not
Yes
No
No
Exist or not
Correct wrong parameter
configurations
Solved or not
Yes
No
No
List related indicator counters
Counters related to RAB setup failures RTWP
Resource limit
indicators
Checkamp analysis of interference
Optimization analysis of
resource limitCounters related to RAB setup failures
CS domain PS domainC301230290 C301230302C301230291 C301230303C301230292 C301230304C301230293 C301230305C301230294 C301230306C301230295 C301230307C301230296 C301230308C301230297 C301230309C301230298 C301230310C301230299 C301230311C301230300 C301230312C301230301 C301230313
Solved or not
Yes
Yes
No
Drive Test+RNC signaling
trace
Yes
ZTE Confidential Proprietary copy 2012 ZTE CORPORATION All rights reserved 29
UMTS KPI Optimization Analysis Guide Internal Use Only
4332 RNC Directly Rejecting RAB Setup Request Because Of Wrong Parameter Configuration
The case that RNC responds with RAB Setup Failure directly is seldom caused by invalid parameter configuration in the business network Usually this case is caused by special operations of the special users
The main scenario is that the subscription information of the userrsquos PS service is beyond the capability of the UE which leads to the direct refusal from RNC For example a special userrsquos subscription rates of uplink and downlink are 384 K but the maximum uplink rate of the UE is only 64 K The maximum uplink and downlink rates of the QoS message used for activating PDP set by the AT command or mobile terminal software used by the user are 384 K so the RNC will find the maximum uplink rate is beyond the UErsquos capability directly reply with RAB Setup Failure and will not launch the RB setup process when it receives RAB Assignment Request
After the RAB setup fails because the parameter configuration is beyond the UErsquos capability SGSN will negotiate again to launch the new RAB assignment until the UE has the capability to support the assignment and the RAB assignment is finished For the users the PDP activation is still successful and the actual maximum rate is the maximum rate the UE can support
However if the minimum guaranteed bit rate required by the QoS setting in the UErsquos PDP activation request is beyond the UErsquos capability though the network negotiates a lower rate to accept the UErsquos PDP activation request the UE will launch the request of deactivating PDP when it finds that the rate negotiated by the network in PDP activation accept request is lower than the minimum guaranteed bit rate and finally the PDP activation can not be completed
4333 Admission Reject
For the non-HSDPA user if there are insufficient system resources (including power channel code lub transmission resource and CE) the call establishment failure will be caused by the admission reject At this time it is necessary to check the network load code resource lub transmission resource and CE resource occupation to make sure the congestion is caused by the limitation of a certain kind of resource What is more the engineer should plan the corresponding expansion method
If the cell does not support the HSDPA service the R99 user admission is judged according to the fixed R99 admission threshold If the cell supports the HSDPA service and the HSDPA and R99 dynamic power is allocated the uplink admission of non-HSDPA is judged based on RTWP or the equivalent user number If the uplink load is too heavy the non-HSDPA user admission will also fail
If the bandwidth configuration on the lub interface is insufficient the lub interface will reject the R99 data service activation because of limited bandwidth
ZTE Confidential Proprietary copy 2012 ZTE CORPORATION All rights reserved 30
UMTS KPI Optimization Analysis Guide Internal Use Only
The admission control of the NodeB Credit resource is similar to the power admission control Whether the remaining Credit can support the currently requested service or not can be judged according to the spectrum spreading factor of the new access user According to the condition of the RAB Downsizing Switch RNC will deal with the issue in the corresponding way
For the HSDPA user in the dynamic power allocation mode besides the mentioned system resources such as the power channel code lub transmission resource and CE the admission reject should take into consideration whether the number of H users supported by NodeB and the number of H users supported by the cell are over the regulated threshold or not into consideration
For the HSDPA user when the bandwidth configuration on lub interface is insufficient the admission reject will not happen but the rate will be reduced What is more the AAL2PATHs of HSDPA and R99 are configured respectively and the HSDPA AAL2PATH must be configured to the HSDPA_RT or HSDPA_NRT type If the HSDPA AAL2PATH is configured to RT or NRT of R99 AAL2PATH type the RAB assignment failure will not happen but RNC will establish the HSDPA service as R99 384 Kbps
For the downlink power admission
Besides whether the R99 service load is over the non-HSDPA service threshold DCH service should take into consideration whether non-HSDPA power and HSDPA GBP (the minimum power needed for the guaranteed bit rate) are over the general power threshold of the cell
For the HSDPA service it is necessary to check whether the throughput rate provided by the cell is over the sum of all the usersrsquo GBR thresholds or whether the GBPs of the stream service and the background service are over the HSDPA power of the cell At the same time whether the non-HSDPA power and the HSDPA GBP (the minimum power needed for the guaranteed bit rate) are over the overall power threshold of the cell should be also taken into consideration
For the lub admission
For the DCH service the admission is made according to the multiplication of the peak rate and the service activation factor
For HSDPA service the admission is made according to the GBR
If the lub exceeds the congestion threshold the DCCC rate reduction will be triggered And if the RLC_AM retransmission rate is over a certain threshold the Iub Overbooking switch can be opened to trigger the TF which limits R99 or to reduce the rate of HSDPA service by a certain factor
ZTE Confidential Proprietary copy 2012 ZTE CORPORATION All rights reserved 31
UMTS KPI Optimization Analysis Guide Internal Use Only
4334 RAB Setup Failure Because the UE Fails to Respond to RB Setup
The UE fails to respond to RB setup mainly because of the userrsquos operation
Take the following cases as examples
When the user already has had the downlink 12 K data service he receives RB Setup Request of the VP service (either the originated call in the VP domain or the terminated call in the VP domain) Because the UE does not support the VP and high-speed PS service in the downlink at the same time it directly replies with RB Setup Failure and the cause value is unsupported configuration
Compared with the WCDMA subscriber originating the VP service the terminating subscriber resides in the GSM network and so it does not support the VP service After RNC receives RAB Assignment Request the core network will deliver the Disconnect command right after call proceeding and the cause value is Bearer capability not authorized At this time the UE has just received the RB SETUP command and has no enough time to finish the RB setup So the UE will reply with RB Setup Failure after it receives the Disconnect command and the RNC will reply with RAB Setup Failure with the cause value being failure in radio interface procedure
4335 RAB Setup Failure Because the Uu Interface Fails to Set Up RB
RNC sends the Radio Bearer Setup command to the UE but fails to receive Radio Bearer Setup Compete This kind of situation (RB setup failure) often appears in the cells with weak signals There are two causes of weak signals one is that the UE does not reside in the best server to launch the access and the other is poor coverage
If the UE does not reside in the best server to launch the access it will hope to enter the best server through active set update in the RB setup process (At the same time the fast signal change will drastically weaken the signals in the cell) but the active set update can only be processed after the RB setup is completed because the procedures can not be processed alternately (Neither the network nor the terminal supports it) Therefore RB can only be set up in the cell with weak signals and the setup is easy to fail As for this situation the starting threshold and speed of co-frequency cell reselection should be increased to make the UE reside in the best server and launch the access as soon as possible
RB setup failure may be caused by the poor downlinkuplink coverage If the failure is caused by downlink coverage the UE can not receive the Radio Bearer Setup command which may be caused by the uplink interference and this can be fixed through checking RTWP The poor downlink coverage is partly caused by the bad UE demodulation performance and other causes should be solved by RF optimization
ZTE Confidential Proprietary copy 2012 ZTE CORPORATION All rights reserved 32
UMTS KPI Optimization Analysis Guide Internal Use Only
44 Optimization of Mobility Indicators
Mobility indicators mainly fall into three categories mdash soft handovers hard handovers and inter-RAT handovers The handover problems usually happen in the following cases
The best server changes too fast or there is no best server due to pilot pollution
The handover is not prompt or there are pingpong handovers due to improper parameter configuration
Adjust the engineering parameters for antennas in areas with severe pilot pollution And adjust the handover parameters such as the values of 1A 1B CIO TTT (time to trigger) Hysteresis and so on to solve the problem that the handover is not prompt or there are pingpong handovers This section tries to solve this kind of problems through OMC data analysis and parameter optimization
441 Optimization of Soft Handovers
Missed neighboring cell configuration pilot pollution improper soft handover parameter configuration and equipment malfunctions are the major causes of soft handover failures To confirm the problems the field DTs are required
ZTE Confidential Proprietary copy 2012 ZTE CORPORATION All rights reserved 33
UMTS KPI Optimization Analysis Guide Internal Use Only
4411 Soft Handover Optimization Flowchart
Figure 4-12 Soft handover optimization flowchart
ZTE Confidential Proprietary copy 2012 ZTE CORPORATION All rights reserved 34
UMTS KPI Optimization Analysis Guide Internal Use Only
Extract performance data
TOP Ncell filtering
Analyze a single cell
1 Check NE alarms
2 Associate emergencies
3 Compare parameter
configurations
4 Associate indicators
5 Locate the fault
comprehensive ly
Exist or not
Handle alarms
Solved or not
Yes
Yes
End
No
No
Exist or not
Handle emergencies
Solved or not
Yes
No
No
Exist or not
Correct wrong parameter
configurations
Solved or not
Yes
No
No
List related indicator counters
RTWPResource
limit indicators
Checkamp analysis of interference
Optimization analysis of
resource limitCounters related to intra-frequency
handover failures
C301391101 C301390593C301391102 C301390594C301391103 C301390595C301390586 C301390596C301390587 C301390597C301390588 C301390598C301390589 C301390599C301390590 C301390600C301390591 C301390601C301390592 C301390602
Solved or not
Yes
Yes
No
Drive Test+RNC signaling
trace
Yes
Counters related to soft handover
failures
30055 3005630057 3005830059 3006030061 30062
Cell hand-inhand-out indicators
ZTE Confidential Proprietary copy 2012 ZTE CORPORATION All rights reserved 35
UMTS KPI Optimization Analysis Guide Internal Use Only
4412 Checking Missed Neighboring Cell Configuration
Generally speaking most of the call drops at the beginning of the optimization are caused by missed neighboring cell configuration The following methods are often used to judge whether the call drops are caused by missed configuration of co-frequency neighboring cells
Observe the active set EcIo information recorded by the UE and the Best Server EcIo information recorded by the Scanner before the call drop If the former record is very bad but the latter record is very good then check whether the Best Server scrambling code recorded by the Scanner appears in the latest list of the neighboring cells under intra-frequency measurement control If it does not then the call drop is caused by missed neighboring cell configuration
If the UE re-accesses immediately after the call drop and the cell scrambling codes during the UE reaccess and those during the call drop are different then the call drop may also be caused by missed neighboring cell configuration You can confirm it through measurement control (look backwards from the message of the call drop event for the latest intra-frequency measurement control message and check the neighboring cell list of this message)
Some UE may report the Detected Set information If the corresponding scrambling code appears in the Detected Set information before the call drop then the call drop is caused by missed neighboring cell configuration
4413 Checking Pilot Pollution
Definition of pilot pollution Excessive strong pilot signals exist at a certain point but none of them is strong enough to be the best server To form pilot pollution the following points in this definition should be satisfied
Strong pilot signal The absolute pilot signal strength is used to judge whether the pilot signal is a strong one The pilot signal strength can be evaluated through the pilot RSCP If the pilot RSCP exceeds a threshold it is considered a strong pilot signal The formula is
AbsoluteRSCPThRSCPCPICH __ gt
Excessive The number of pilot signals is used to judge whether there are excessive pilot signals at a certain point If the number exceeds a threshold it is regarded that excessive pilot signals exist at this point The formula is
NThNumberCPICH gt_
None of them is strong enough to be the best server The relative strength of a pilot signal is a key factor in judging whether the pilot signal is strong enough Based on the above definition and formulae if the difference between the strength of the
ZTE Confidential Proprietary copy 2012 ZTE CORPORATION All rights reserved 36
UMTS KPI Optimization Analysis Guide Internal Use Only
strongest pilot signal and that of the )1( +NTh strongest pilot signal at this point is
less than a threshold it is regarded that there is no pilot signal strong enough to be the best server at this point The formula is
lativeRSCPthThbest ThRSCPCPICHRSCPCPICHN Re_)1( )__( ltminus +
According to the above description it is regarded that pilot pollution exists if the following conditions are both satisfied
The number of pilot signals that meet the condition
AbsoluteRSCPThRSCPCPICH __ gt is more than NTh
lativeRSCPthThbest ThRSCPCPICHRSCPCPICHN Re_)1( )__( ltminus +
For example during the network optimization suppose
dBmTh AbsoluteRSCP 95_ minus= 3=NTh and dBTh lativeRSCP 5Re_ = if the following
conditions are both satisfied then it is regarded that pilot pollution exists
The number of the pilot signals that meet the condition
dBmRSCPCPICH 95_ minusgt is more than 3
dBRSCPCPICHRSCPCPICH thbest 5)__( 4 ltminus
4414 Adjusting Soft Handover Algorithm Parameters
You can solve the following kinds of problems by adjusting handover algorithm parameters
1 The handover is not prompt
From the perspective of the CS service signaling flow the symptom of this problem is that the UE cannot receive Active Set Update (physical channel reallocation in the case of the intra-frequency hard handover) because after the UE reports the measurement report the source cell has a fast reduction in EcIo When the RNC sends Active Set Update the UE has closed the transmitter due to the loss of downlink synchronization Viewed from the UE side it cannot receive Active Set Update In the PS services if the UE cannot receive Active Set Update or TRB resets before the handover the handover will also fail
From the perspective of signals the following phenomena may accompany this problem
ZTE Confidential Proprietary copy 2012 ZTE CORPORATION All rights reserved 37
UMTS KPI Optimization Analysis Guide Internal Use Only
minus Corner effect EcIo of the source cell decreases drastically and EcIo of the target cell increases sharply (very high when it appears)
minus Fast fading EcIo of the source cell decreases quickly for a while and then increases and EcIo of the target cell increases for a short while
2 Pingpong handovers The following phenomena may accompany this problem
The best server changes quickly Two or more cells take turns to be the best server But as the best server none of the cells can last long though they has good RSCPs and EcIos
There is no best server There are multiple cells Their RSCPs are normal and similar to each other But EcIo of every cell is very bad
From the perspective of the signaling flow Event 1A is reported immediately after one cell is deleted Because the UE cannot receive Active Set Update from the RNC the handover fails
4415 Equipment Malfunctions
First check the alarm console to see whether there are abnormal alarms and analyze the message traces at the same time Find out in which step the soft handover fails Check the failure message and contact the local product maintaining engineer to confirm whether the equipment has malfunctions
4416 Solutions
Corresponding adjustments should be taken for the confirmed problems
Handover failures caused by pilot pollution Adjust the engineering parameters of a certain antenna to set this antenna as the best server in this interfered location If the power of one of its sectors is reduced then Io of the pilot pollution area will decrease even if the powers of other pilots are not adjusted EcIo will also increase Thereby the EcIo differences with other scrambling codes in the active set will become larger and pilot pollution will be eliminated Through a lot of research ZTE has proved that the reduction in the pilot transmit power will not change cell capacity greatly If condition allows new base stations can be added to cover this area
Equipment malfunctions Consult the customer service engineers and ask them to help check whether there are alarms and whether the transport layer is abnormal If there are alarms coordinate with the customer service engineers and the engineering personnel to solve the problems
Call drops because the handovers are not prompt
ZTE Confidential Proprietary copy 2012 ZTE CORPORATION All rights reserved 38
UMTS KPI Optimization Analysis Guide Internal Use Only
minus Adjust the antenna to expand the handover zone
minus Configure the Event 1A handover parameters to make the handover easier to happen
minus Increase CIO to make the handover happen earlier in the target cell The sum of CIO and the actually measured value is used for judging the UE events including the UE intra-frequency handover CIO helps shift the cell border in the handover algorithm If CIO is configured with a larger value the handover will be easier to happen and there will be more UE in the soft-handover status but more resources will be occupied If CIO is configured with a smaller value the soft handover will be more difficult to happen and the receiving quality may be impaired A CIO of about 5dB is quite good for eliminating the fast fading and the corner effect but this configuration has some side effects such as the increase of handover proportion
Call drops caused by pingpong handovers Adjust the antenna to form a best server in its coverage zone or set the Event 1B handover parameters (increase the threshold of Event 1B the Event 1B hysteresis or the time to trigger Event 1B) to increase the difficulty in deleting the active set
442 Optimization of Hard Handovers
4421 Classification of Hard handovers
Hard handovers mainly fall into two classifications
Intra-frequency hard handovers The intra-frequency hard handover is triggered only when the intra-frequency softsofter handover cannot be performed and it is applicable to the following circumstances
minus Inter-RNC intra-frequency cell handovers when there is no Iur interface
minus Insufficient Iur interface resources though there is the Iur interface
minus Handovers controlled by the threshold of the PS service rate in the handover cell
The intra-frequency softsofter handovers can not be performed (intra-frequency hard handover should be triggered) in the following scenarios
minus When the intra-frequency handover happens the UE is using the transmit diversity in the active set cell but the target cell does not support the transmit diversity
minus The intra-frequency measurement report does not contain OFF and TM of the
ZTE Confidential Proprietary copy 2012 ZTE CORPORATION All rights reserved 39
UMTS KPI Optimization Analysis Guide Internal Use Only
target cell
minus When the intra-frequency handover happens between RNCs the Iur interface is unavailable
minus The UE performs the multiuser detection in the active set cell but the target cell does not support the multiuser detection
minus The target cell and the original cell belong to different classifications (The cells of R99 R5+R99 and R6+R5+R99 belong to the same classification while the cells of R5 and R6+R5 belong to another classification)
Inter-frequency hard handovers The inter-frequency hard handover means a UE connection is handed over from a cell of a UTRAN frequency to a cell of another frequency Many factors including the radio quality the load and the speed of the moving UE may trigger inter-frequency hard handovers
For example the radio quality triggers the inter-frequency hard handover in the following way
When the quality of the UE radio frequency becomes lower the inter-frequency measurement will be triggered and according to the measurement result the UE connection will be handed over to a better frequency
ZTE Confidential Proprietary copy 2012 ZTE CORPORATION All rights reserved 40
UMTS KPI Optimization Analysis Guide Internal Use Only
4422 Hard Handover Optimization Flowchart
Figure 4-13 Hard handover optimization flowchart
ZTE Confidential Proprietary copy 2012 ZTE CORPORATION All rights reserved 41
UMTS KPI Optimization Analysis Guide Internal Use Only
Extract performance data
TOP Ncell filtering
Analyze a single cell
1 Check NE alarms
2 Associate emergencies
3 Compare parameter
configurations
4 Associate indicators
5 Locate the fault
comprehensive ly
Exist or not
Handle alarms
Solved or not
Yes
Yes
End
No
Exist or not
Handle emergencies
Solved or not
YesNo
Exist or not
Correct wrong parameter
configurations
Solved or not
Yes
No
No
List related indicator counters
RTWPResource
limit indicators
Checkamp analysis of interference
Optimization analysis of
resource limit
Counters related to inter-frequency handover failures
C301110489 C301110516C301110499 C301110517C301110500 C301110518C301110501 C301110519C301110502 C301110520C301110503 C301110521C301110504 C301110522C301110505 C301110523
Solved or not
Yes
Yes
No
Drive Test+RNC signaling
trace
Yes
Counters related to hard handover
failures
30041 3004230043 3004430045 3004630047 30048
Cell hand-inhand-out indicators
NoNo
ZTE Confidential Proprietary copy 2012 ZTE CORPORATION All rights reserved 42
UMTS KPI Optimization Analysis Guide Internal Use Only
4423 Hard Handover Optimization Methods
The optimization flow for the hard handover is similar to that of the soft handover The major differences are in the parameter optimization To optimize intra-frequency hard handovers you can properly reduce the Event 1D hysteresis and the time to trigger Event 1D according to the real radio environment to ensure timely handovers
Inter-frequency coverage is often applied to some special scenarios such as indoor coverage and tested through CQT The method of judging whether there is missed configuration of the inter-frequency neighboring cell is almost the same as that of the co-frequency neighboring cell when a call drop occurs the UE fails to measure or report the inter-frequency neighboring cell after the call drop the UE resides in the inter-frequency neighboring cell again
The common hard handover problems are
1 The handover is not prompt The common symptoms are frequent call drops in the hard handovers when the UE moves
Solutions
Increase the threshold of activating the compressing mode The compressing mode is usually activated before the inter-frequency handover or the inter-RAT handover and it is used to measure the quality of the inter-frequency or inter-RAT cell You can set a threshold of the CPICH RSCP or EcIo to activate the compressing mode And the RSCP is widely used
minus Requirements on setting the threshold of activating the compressing mode Before the cell quality becomes low enough to cause a call drop the signal of the target cell should be measured and reported and the handover should be performed
minus Requirement on setting the threshold of deactivating the compression mode Frequent activationdeactivation of the compression mode should be avoided
Increase CIOs of the inter-frequency cell pair
Reduce the threshold of triggering the target frequency handover under the inter-frequency coverage
2 There are pingpong handovers
Solution Increase the hard handover hysteresis and the time to trigger the event
ZTE Confidential Proprietary copy 2012 ZTE CORPORATION All rights reserved 43
UMTS KPI Optimization Analysis Guide Internal Use Only
443 Optimization of Inter-RAT Handovers
4431 Configuring Basic Inter-RAT Parameters
Most of the inter-RAT handover failures are caused by incomplete parameter configuration The following parameters need special attention
Complete RNC parameter configuration for the GSM neighboring cell The 2G system shall provide the 3G system with the correct radio parameters based on negotiation mdash MCC MNC LAC ID (CI) NCC BCC frequency band indicator (900 or 1800) and BCCH
Table 4-3 Parameters That 2G Shall Provide to 3G
MCC MNC LACIDCI
NCC BCCFrequency
band indicator
BCCH
460 2 202 193 0 0 900 102
Complete GSM BSC parameter configuration for the WCDMA neighboring cell The 3G system shall provide the 2G system with the correct radio parameters based on negotiation mdash MCC MNC LAC RNC ID cell ID (C_ID) downlink frequency scrambling code and RAC
Table 4-4 Parameters That 3G Shall Provide to 2G
MCC MNC LACRNC
IDCell IDC_ID
Downlink frequency
Scrambling code
RAC
460 3 20 18 51 10787 51 20
According to the current strategy of one-way inter-RAT handovers if the parameter configuration is complete one probable cause of the inter-RAT handover failure is that the handover is not prompt The common parameter adjustment is to increase CIO the threshold to activatedeactivate the compressing mode and the threshold to trigger the WCDMA-to-GSM handover at the same time
Call drops during the inter-RAT handovers between WCDMA and GSM may be caused by
minus Inconsistent data configuration at the GSM side and the WCDMA side after GSM modifies the configuration data but does not inform WCDMA
minus Missed configuration of neighboring cells which can be solved by the correct configuration of neighboring cells
minus Too fast signal changes
ZTE Confidential Proprietary copy 2012 ZTE CORPORATION All rights reserved 44
UMTS KPI Optimization Analysis Guide Internal Use Only
minus Pingpong reselection
minus Faults with the UE for example the UE fails to respond to the handover or report the inter-RAT measurement report
minus Changes of the best server during the physical channel reallocation
minus Wrong LAC configuration which can be located through data configuration check
ZTE Confidential Proprietary copy 2012 ZTE CORPORATION All rights reserved 45
UMTS KPI Optimization Analysis Guide Internal Use Only
4432 Inter-RAT Handover Optimization Flowchart
Figure 4-14 Inter-RAT handover optimization flowchart
ZTE Confidential Proprietary copy 2012 ZTE CORPORATION All rights reserved 46
UMTS KPI Optimization Analysis Guide Internal Use Only
Extract performance data
TOP Ncell filtering
Analyze a single cell
1 Check NE alarms
2 Associate emergencies
3 Compare parameter
configurations
4 Associate indicators
5 Locate the fault
comprehensive ly
Exist or not
Handle alarms
Solved or not
Yes
Yes
End
No
No
Exist or not
Handle emergencies
Solved or not
Yes
No
No
Exist or not
Correct wrong parameter
configurations
Solved or not
Yes
No
No
List related indicator counters
RTWPResource
limit indicators
Checkamp analysis of interference
Optimization analysis of
resource limitCounters related to inter-RAT handover failures
C301130667 C301130681C301130668 C301130682C301130669 C301130690C301130670 C301130691C301130671 C301130692C301130672 C301130693C301130673 C301130694C301130674 C301130696C301130675 C301130697C301130677 C301130698C301130678 C301130699C301130679 C301130700
C301130680
Solved or not
Yes
Yes
No
Drive Test+RNC signaling
trace
Yes
Counters related to inter-RAT handover
failures
Cell hand-inhand-out indicators
30049 3005030051 3005230053 30054
ZTE Confidential Proprietary copy 2012 ZTE CORPORATION All rights reserved 47
UMTS KPI Optimization Analysis Guide Internal Use Only
45 Optimization of Resource Indicators
The resource indicators directly reflect the system capacity Increasing subscribers will consume more system resources and some resources may be limited for example the code resource may be limited the TCP access request may be rejected and the CE resource usage rate may exceed the threshold Limited system resources have a negative influence on the whole-network indicators and the subscribersrsquo perception for example call drops may frequently happen and more TCP access requests may be rejected during the voice services
Table 4-5 Resource KPIs and Alarm Thresholds
Resource type KPI No and nameAlarm
threshold
TCP
C301320150 Number of rejected services DCH downlink TCP limit
50
PI30167 Average non-HS (SOA) (SOA)DPA TCP 40
PI30092 Maximum Cell TCP () 100
PI30093 Average Cell TCP 70
UL TrafficPI30029 Handover Blocking Rate 05
KPI RTWP (in busy hour) -98 dBm
Code
C301320153 Number of rejected services DCH no code
50
PI30205 Average Cell HSUPA Users 12
PI30172 Cell Average HSDPA Users 16
CE
PI301830006 Maximum use Ratio of Uplink NodeB CE
60
PI301830010 Maximum use Ratio of Downlink NodeB CE
60
ZTE Confidential Proprietary copy 2012 ZTE CORPORATION All rights reserved 48
UMTS KPI Optimization Analysis Guide Internal Use Only
451 Resource Indicator Optimization Flowchart
Figure 4-15 Resource indicator optimization flowchart
ZTE Confidential Proprietary copy 2012 ZTE CORPORATION All rights reserved 49
UMTS KPI Optimization Analysis Guide Internal Use Only
Extract performance data
TOP Ncell filtering
Analyze a single cell
1 Check NE alarms
2 Associate emergencies
3 Compare parameter
configurations
4 Associate indicators
5 Locate the fault
comprehensive ly
Exist or not
Handle alarms
Solved or not
Yes
是
End
No
No
Exist or not
Handle emergencies
Solved or not
Yes
No
No
Exist or not
Correct wrong parameter
configurations
Solved or not
Yes
No
No
List related indicator counters
Code resource indicators
CE resource indicators
TCPadmission
reject counter
C301320150
Solved or not
Yes
Yes
No
Drive Test+RNC signaling
trace
Yes
Counter related to TCP limit
Cell TX power
indicators
30090 3009130092 3009330166 3016730168 3016930170 30171
30163301643016530075
30223302243045030451
Yes
Yes
ZTE Confidential Proprietary copy 2012 ZTE CORPORATION All rights reserved 50
UMTS KPI Optimization Analysis Guide Internal Use Only
452 Code Resource Optimization
The statistics of Number of rejected services and DCH no code the average code resource usage rate and the number of the HSDPA subscribers can be used to judge whether the code resource in a cell is limited If the code resource is limited you can adjust the code resource allocation to alleviate the situation
Based on the system algorithm when Formula 1 is satisfied you can add an HS-PDSCH when Formula 2 is satisfied then an HS-PDSCH is deleted
Formula 1 OcuRateNoHspdsch + OcuRateHspdsch + DpchCodeHy + 32 lt= 512
Formula 2 OcuRateNoHspdsch + OcuRateHspdsch + CodeUptHyA gt 512
OcuRateHspdschHSPDSCH means the number of the codes of SF=512 blocked by the HS-PDSCH OcuRateNoHspdsch means the number of codes of SF=512 blocked by other channels DpchCodeHy means the number of codes of SF=512 reserved for the DPCH and CodeUptHyA is the threshold to decide whether to delete the HSPDSCH
Therefore to ensure the access of the R99 subscribers you can make some adjustment according to Table 4-6 when the code resource is limited though the HSDPA rate may decrease
Table 4-6 Adjusting Code Resource Allocation
AbbreviationParameter
nameRange
and stepCurrent value
Update value
Remark
DpchCodeHy DPCH Code Hysteresis
0512 16 28
To decrease the number of rejected services for DCH no code
CodeUptHyACode Update Hysteresis A
0512 16 28
To decrease the number of rejected services for DCH no code
453 Monitoring CE Resource
The CE resource is mainly monitored through the maximum UE uplinkdownlink usage rate If there is any problem you can solve it by controlling the load or adding more boards
ZTE Confidential Proprietary copy 2012 ZTE CORPORATION All rights reserved 51
UMTS KPI Optimization Analysis Guide Internal Use Only
454 Optimization of Power Control
4541 Monitoring and Optimizing Downlink Power Control
Limited TCP in busy hours will not only increase access failures and call drops in the local cell but also increase soft handover failures and call drops in the neighboring cells Number of rejected services and DCH downlink TCP limit are intuitive KPIs to judge whether TCP is limited Although limited uplink capacity and massive UE moves in the rush hours may also cause call drops the limited TCP is absolutely a key factor
Based on the system algorithm MinHsdpaPower (MinHspaPwrRto) + NoHsPower gtNode B if the safety threshold is used (MinHsdpaPower means the power reserved for HSPA) then it will activate the downlink rate downgrade algorithm flow for the congestion (lower the downlink DCH rate) Although the rate downgrade can ensure access of some subscribers it is an irregular action and will degrade the performance
455 Speeding up Rate Downgrade
Considering that the cells with heavy load reject more access requests you can speed up the rate downgrade during the resource congestion to release the resources as soon as possible and avoid call drops caused by access failures (this method is only applicable to the cells with many PS service users but not those with only CS service users) Table 4-7 is an example of the parameter modification for the rate downgrade
Table 4-7 Example of Parameter Modification for Rate Downgrade
Abbreviation Parameter nameRange and
stepCurrent value
Update value
Remark
UlDnMaxStg Maximum Number of Degraded Uplink Load Steps Every Time
[1 8] 1 2 Downgrade from 384 Kbps to 16 Kbps
DlDnMaxStg Maximum Number of Degraded Downlink Load Steps Every Time
[1 8] 1 3 Downgrade from 384 Kbps to 8 Kbps
456 Monitoring and Optimizing Uplink Capacity
Handover Blocking Rate and RTWP can reflect the uplink capacity of the cell Because interference may also increase RTWP this factor should be distinguished during the RTWP monitoring Another effective indicator is the voice service erl If a cell has over 20 erls in busy hours you should pay special attention to it
ZTE Confidential Proprietary copy 2012 ZTE CORPORATION All rights reserved 52
UMTS KPI Optimization Analysis Guide Internal Use Only
457 Optimization of Uplink Capacity at the Whole Network Level
Case The uplink capacity was limited in a large number of sites after the cutover and the symptoms are a sharp rise of RTWP and a high call drop rate during the rush hours
After the following parameters were modified as shown in Table 4-8 the problem was solved
Table 4-8 Example of Power Control Parameter Modification
AbbreviationParameter
nameRange
Current value
Update value
ULINITSIRUplink Initial SIR target (dB)
UL 34 K136 K signaling UL 122 K AMR
4-5 35
ULMAXSIRMaximum Uplink SIR target (dB)
UL 34 K136 K signaling UL 122 K AMR
15 10
UlSirTargDnStepUplink SIR Target Down Step Size (dB)
UL 34 K136 K signaling UL 122 K AMR
01 02
458 Optimization of Uplink Capacity for a Single Cell
A lot of optimization measures can be taken to bring down the rising RTWP However with increasing subscribers the capacity may still be limited in some area while further modification of SirTarget will obviously degrade the call quality of the whole network and undermine the subscribersrsquo perception In this case you can adjust the power control parameters for a single site that has heavy traffic in the following way add one set of DivPc parameters and use this set of parameters only for this site
Case Table 4-9 shows an example of the power control parameter modification After this modification the call drop rate in the site with heavy traffic decreased to one quarter of the original one
Table 4-9 Example of Power Control Parameter Modification for Heavy-Traffic Cell
SRVTYPE ULINITSIR ULMAXSIR ULMINSIR
0 35-gt15 100-gt35 20-gt10
104 40-gt20 150-gt50 05-gt0
28 35-gt15 100-gt35 05-gt0
50 60-gt20 150-gt50 20-gt0
54 60-gt20 150-gt50 20-gt0
ZTE Confidential Proprietary copy 2012 ZTE CORPORATION All rights reserved 53
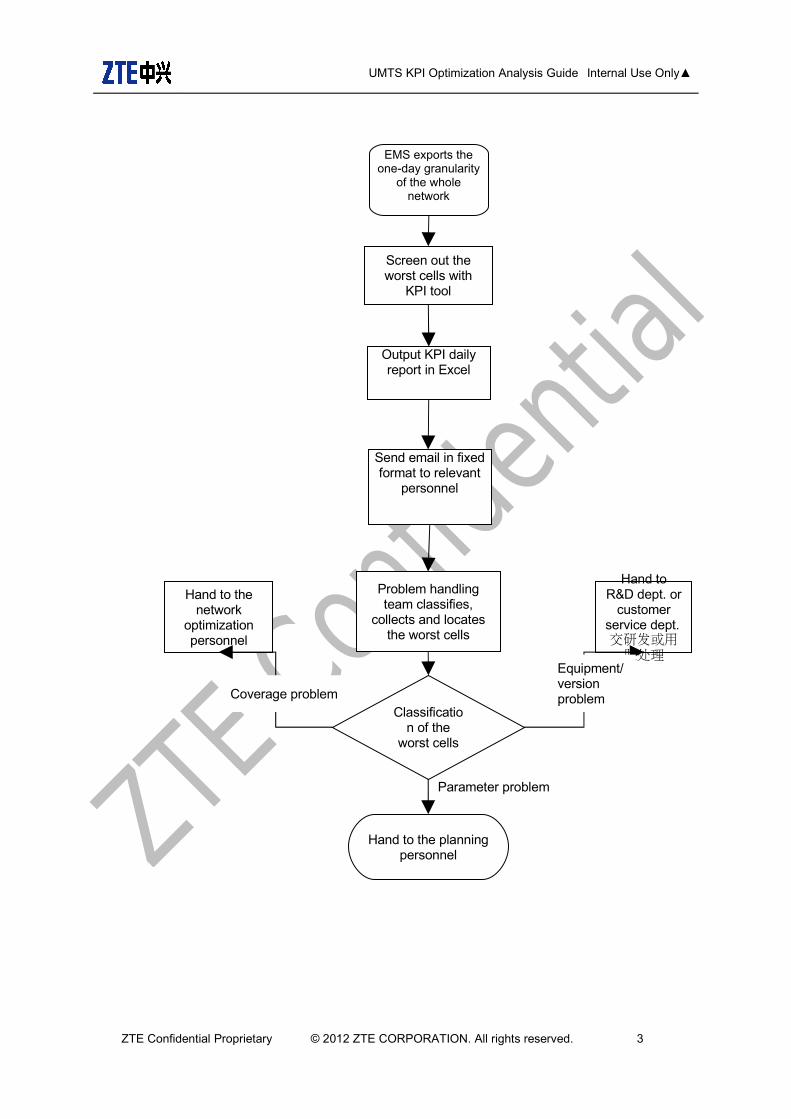
UMTS KPI Optimization Analysis Guide Internal Use Only
ZTE Confidential Proprietary copy 2012 ZTE CORPORATION All rights reserved 3
Parameter problem
Hand to the planning personnel
Classification of the
worst cells
Problem handling team classifies
collects and locates the worst cells
Hand to the network
optimization personnel
Hand to RampD dept or
customer service dept交研发或用
服处理
Send email in fixed format to relevant
personnel
Coverage problem
Equipmentversion problem
Network KPI monitoring
( 15 minutes time granularity)
Screen out the worst cells with
KPI tool
EMS exports the one-day granularity
of the whole network
Output KPI daily report in Excel
UMTS KPI Optimization Analysis Guide Internal Use Only
23 KPI Monitoring Process During Parameter Modification
Figure 2-3 KPI monitoring process during parameter modification
Old parameter configuration
Configure data according to the
worksheet
Network KPI monitoring (15-
minute granularity)
Whether the KPIs at the
RNC level are normal
Keep on monitoring (15-
minute granularity)
Output a report in Word (hourly
granularity KPIs before and after the parameter modification)
End
Yes
Notify the person in charge by mail
or phone
Rollback or not
Locate the worst cells and check if they are caused
by the parameter modification
No
Yes
No
ZTE Confidential Proprietary copy 2012 ZTE CORPORATION All rights reserved 4
Network KPI monitoring
( 15 minutes time granularity)
UMTS KPI Optimization Analysis Guide Internal Use Only
24 KPI Monitoring During RNC or NodeB Version Upgrade
Figure 2-4 KPI monitoring workflow during RNC or NodeB version upgrade
ZTE Confidential Proprietary copy 2012 ZTE CORPORATION All rights reserved 5
Yes
No
No
End
Locate the worst cells Determine whether they are related with the version update
Yes
Network KPI monitoring
( 15 minutes time granularity)
Execute the worksheet to
upgrade version
Output formal Word report (Compare the hourly granularity KPIs before and after the parameter modification and output the result every hour)
Whether the RNC-level
KPI is normal
Keep on monitoring (15 minutes granularity)
Send mail to or call the person in charge
Rollback or not
Current version
UMTS KPI Optimization Analysis Guide Internal Use Only
25 KPI Monitoring During Cutover
For the network on which the equipment needs to be replaced (for instance HongKong CSL network for which we replaced Nokiarsquos equipment with ZTErsquos) after the network optimization is completed the subscribers on the existing network should be cut over to our network gradually During the cutover there will be subscribers registering on our network constantly which will cause load increase on the network In this case we should watch KPI changes closely The monitoring process items method and report are the same as those described in section 24 ldquoKPI Monitoring During RNC or NodeB VersionUpgraderdquo Please read it for reference
3 KPI Analysis Methods
31 KPI Analysis Methods
Different network problems require different performance analysis methods Choose one or more appropriate methods after learning the running state of the existing network and the problems with it Common analysis methods are as follows
TOP N worst cells method Based on the traffic statistics indicators we care about (such as the call drop rate connection rate and soft handoff failure rate) choose N worst cells whose average indicator values in the peak hours or of the whole day are the lowest as the target of fault analysis and optimization Or prioritize objects of optimization against these indicator values
Time tendency chart method Tendency chart of indicator change is commonly used in the traffic analysis The analysis engineer can work out an hourly daily or weekly tendency chart of one or more indicators of the whole network a cluster or a single cell and find out the change rule of traffic statistics indicators
Regional location method The change of network performance indicators often occurs in some regions The indicators in these regions may be worsened by traffic increase traffic mode change radio environment change faults with a small number of stations or uplinkdownlink interference which will therefore affect the performance indicators of the whole network By comparing the network performance indicators before and after the change we can mark out the station or the sector with the greatest indicator change on an electronic map and take these problem regions as the analysis focus
Comparison method A single traffic statistics indicator may be affected by many factors While some factors change others may not Choose a proper object for comparison to confirm the existence of problems and then analyze the causes of the problems When examining an indicator do not care whether the absolute indicator value is high or low only pay more attention to whether the value is high or low compared to other indicators instead
ZTE Confidential Proprietary copy 2012 ZTE CORPORATION All rights reserved 6
UMTS KPI Optimization Analysis Guide Internal Use Only
311 TOP N Worst Cells Method
During the whole process of KPI optimization analysis TOP N worst cells analysis method is the most effective one which can be used throughout the whole optimization phase By focusing on the TOP N worst cells you can solve the major problems with the network Abnormal call drop events may happen every day and these events may represent problems of a kind After solving the problems with TOP N cells you can solve the problems of the same kind Therefore focusing on TOP N cells is one of the most effective ways to solve problems
TOP N worst cells analysis method is applicable to the optimization analysis of all the indicators Choose TOP N worst cells according to a certain threshold which varies depending on different indicators N stands for the number of the worst cells When the worst cells are too many to be worked on the number of the worst cells can be decreased so that you can focus on them TOP N cells analysis method includes the following steps
Step 1 Screen out TOP N cells according to the condition of the indicators you care about
Step 2 Conduct a health check for TOP N cells Check whether there are any problems with transmission or boards and check whether the worst cells are caused by external abrupt incidents such as terrible weather gatherings or holiday (because during gatherings and holidays the traffic is usually heavy)
Step 3 Check the radio parameters configuration of these cells the radius of these cells and their neighboring cells and compare them with the normal cells
Step 4 Export the indicator relevant most closely with the indicators you care about and analyze it to find the problem indirectly
For instance one day CS call drop rate of a whole network was high We analyzed the problem by the TOP N cells analysis method
Step 1 Screen out TOP N cells according to the condition of the indicators you care about
We used the CNO KPI analysis function to screen out TOP N cells (other tools can be also used) and selected 10 cells with the highest CS call drop rate
Table 3-1 List of CS TOP N Worst Cells
Index Cell RNS subnet ID Cell IDCall drop
rate CS AMRNumber of call
drop voice
1 ZBL1U-AI-1 (201) 12911 4158 553
2 ZBL1U-AI-3 (201) 12913 3955 545
3HKE1U-5H-1
(203) 30461 1556 370
ZTE Confidential Proprietary copy 2012 ZTE CORPORATION All rights reserved 7
UMTS KPI Optimization Analysis Guide Internal Use Only
Index Cell RNS subnet ID Cell IDCall drop
rate CS AMRNumber of call
drop voice
4HKE1U-5H-3
(203) 30463 1581 360
5LAK1U-9M-3
(202) 11063 339 282
6 HIC1U-9R-1 RNC101(101) 10891 226 216
7LAK1U-9M-1
(202) 11061 249 215
8EBP1U-9R-3
RNC101(101) 12823 230 205
9SRS1U-5H-1
RNC102-CSL(102)
12091 392 169
10HRM1U-6R-1
RNC102-CSL(102)
20671 341 167
Step 2 Check the transmission and hardware of the TOP N cells and check whether they are caused by external abrupt incidents such as terrible whether gatherings or holidays when traffic is usually heavy
And then we conducted a health check for each cell and paid attention to routine alarms and BPC board problems We found there were broken associations in some HKE sites
Step 3 Check the radio parameters configuration of these cells the radius of these cells and their neighboring cells and compare them with the normal cells
(1)Problem with the cell radius After the check we found the cell radius of the LAK site was 25 km Because the LAK site was situated by the sea and the antenna was placed very high the radius of 25 km was far from enough So we changed the cell radius to 10 km and the problem of high call drop rate was thus solved
(2)Problem with configuration HIC site is an indoor POI site The RRU RxTx port and the RRU Rx port were configured reversely which is the cause of high call drop rate After modifying HIC we found that signals of the second RRU were received by the Rx port So we changed the configuration of the RxTx port and the Rx port the problem of high call drop rate was thus solved
Figure 3-5 RF configuration at HIC site
Figure 3-6 Antenna energy distribution at HIC site
ZTE Confidential Proprietary copy 2012 ZTE CORPORATION All rights reserved 8
UMTS KPI Optimization Analysis Guide Internal Use Only
Step 4 Export the indicator relevant most closely with the indicators you care about and analyze it to find the problem indirectly
Table 3-2 Indicators Related with CS Call Drop
Index Cell
RAB release number for Iu connection
release request by UTRAN for CS domain in
cell radio connection with UE lost
RAB release number for Iu connection
release request by UTRAN for CS domain in cell failure in
the radio Interface
procedure
RAB release number for Iu connection
release request by
UTRAN for CS domain in
cell release due to
overload control
RAB release number for Iu connection
release request by
UTRAN for CS domain in
cell unspecified
failure
Average cell freq RTWP (dbm)
1ZBL1U-AI-1
482 43 0 29 -104177
2ZBL1U-AI-3
473 40 0 33 -104125
3HKE1U-5H-1
346 16 0 8 -105908
4HKE1U-5H-3
330 18 0 13 -1060777
5LAK1U-9M-3
69 196 0 18 -1031906
6HIC1U-9R-1
100 100 0 16 -1015404
7 LAK1U- 64 131 0 20 -1031934
ZTE Confidential Proprietary copy 2012 ZTE CORPORATION All rights reserved 9
UMTS KPI Optimization Analysis Guide Internal Use Only
Index Cell
RAB release number for Iu connection
release request by UTRAN for CS domain in
cell radio connection with UE lost
RAB release number for Iu connection
release request by UTRAN for CS domain in cell failure in
the radio Interface
procedure
RAB release number for Iu connection
release request by
UTRAN for CS domain in
cell release due to
overload control
RAB release number for Iu connection
release request by
UTRAN for CS domain in
cell unspecified
failure
Average cell freq RTWP (dbm)
9M-1
8EBP1U-9R-3
98 90 0 17 -101413
9SRS1U-5H-1
87 59 0 22 -1043528
10HRM1U-6R-1
42 111 0 13 -1027697
32 Basic KPI Analysis Skills
Be able to use the KPI statistics tool and the analysis tool
Use tools to learn about the running state of the whole network quickly and screen out TOP N worst cells quickly
Use different analysis tools to find problems from different aspects and locate the problem quickly
Understand the signaling process and basic principle
In the process of abnormity location keep a clear aim in mind and be able to apply the process and basic principle to check the other relevant indicators rapidly to facilitate the analysis
Be familiar with the process and basic principle and be able to make logical association between abnormal KPI problems and network problems (such as the coverage problem and the interference problem) Be able to determine the problem nature according to the abnormal KPI and then choose the appropriate tool to analyze the problem in depth
Performance analysis requires engineers to understand basic signaling process be familiar with the protocol stacks of standard interfaces and know relevant algorithms to realize the product functions Engineers should at least have a concept about the various algorithms If the analysis of a commercial network involves some algorithms engineers should study these algorithms in depth
ZTE Confidential Proprietary copy 2012 ZTE CORPORATION All rights reserved 10
UMTS KPI Optimization Analysis Guide Internal Use Only
321 KPI Monitoring Tools
minus Network management tool NetNumenT31 count KPI original data alarm data radio parameter configuration in cells and parameter configuration on the earth
minus KPI daily report generating tool classify key indicators according to a certain condition and screen out the worst cells
322 KPI Analysis Tools
minus CNO Tool CNO tool has the KPI analysis function So using it you can screen out the worst cells according to various conditions and point out the corresponding counter of an indicator
minus SignalTrace Trace the signaling (RNL signaling and RNL signaling) of RNC interfaces which includes the Iu interface the Iur interface the Iub interface and the Uu interface (the signaling flow between RNC and UE at RRC layer) And RNL signaling trace is a common way for locating the KPI problem Being able to trace the RNC signaling is a basic requirement for the on-site KPI optimization engineers and the network optimization and maintenance engineers This signaling tracing tool is very powerful which can trace signaling according to the UE cell and IMSI in the KPI analysis According to the UE cell it can trace the signaling of multiple subscribers while according to IMSI it can trace the signaling of only one subscriber However if the RRC connection is not established yet signaling cannot be traced That is because only when RRC connection has been established can the RNC obtain the subscriberrsquos IMSI from the CN
minus RNC ASS Log ASS log is usually applied when there is abnormity and RNC signaling is out of trace In this case use ASS log to analyze the signaling before and after the abnormity occurs Abnormity can be queried according to IMSI or cell ID ASS log can be also used to collect various abnormities
minus NodeB LMT NodeB local operation and maintenance tool Apart from all the operation functions of the OMCB this tool can collect more detailed information about cells and UE NodeB local maintenance terminals include EOMS EFMS DMS and PMS
minus NodeB Abnormity Probe On the site of WCDMA commercial office NodeB abnormity probe is an effective tool to monitor the running state of the NodeB Every module of NodeB can record the abnormal information automatically which makes it easy to locate problems However this method requires professional knowledge such as knowledge about the function and interface of each module or board If the on-site engineers cannot make the simple analysis they can just obtain the abnormity probe and send it to the RampD engineers at the rear side The abnormities reported on the NodeB will be stored at the OMCB server according to different RNCs To conduct NodeB
ZTE Confidential Proprietary copy 2012 ZTE CORPORATION All rights reserved 11
UMTS KPI Optimization Analysis Guide Internal Use Only
abnormity probe analysis you need to download abnormity probe files from different OMCB servers and then use the abnormity probe tool to make a comprehensive analysis
minus CTS Tool CTS is a tool developed by the CN department which can trace signaling in depth according to IMSI and trace signaling across RNCs So this is particularly suitable to trace VIP subscribers In this case CTS is easier to use than SignalTrace which can only trace signaling of RNCs one by one CTS can trace the interactive signaling between network elements (NEs) within the CN as well as the signaling of the Iu interface and the Uu interface This kind of signaling tracing is what we called in-depth tracing The work principle of CTS is to set up an IMSI task on the CTS server and send it to the CN front side which will then send this task to each CN module via the interfaces dedicated to the CN modules and the RNC and then each module after receiving the signaling related to the IMSI task will send the signaling back to the CTS server via the CN front side The interfaces mentioned above are private interfaces so this tool can only support our own CN and RNC CTS signaling can be checked and analyzed with an offline tool but the offline tool does not work very well because of the lack of continuous optimization and perfection
minus UE log DT test is also an important auxiliary way in analyzing KPI indicators There are many problems that cannot be located by tracing signaling at the network side and can only be located by the use of UE log The commonly used drive test software includes QXDMAPEX (QCAT) CNTCAN and TEMS CNTCAN and TEMS are often used for network optimization For the use of CNTCAN please refer to the corresponding help file and the instruction document publicly released by the Network Optimization Tool Department QXDM and the analysis tool APEX (QCAT) provided by Qualcomm is very powerful which have contributed a lot for the stability and maturity of our system for many years
33 General Process of KPI Optimization Analysis
Basic analyzing ideas
KPI optimization is a process to find and solve problems KPI optimization during the operation and maintenance stage is mainly to pick out the performance data that needs special attention from the OMC classify these performance data and then compare the value of these data with that required by the operator If the value of an indicator is lower than the operatorrsquos requirement analyze this indicator and find out the factor that affect the indicator and then propose a solution to the operator If the values are higher than the operatorrsquos requirement therersquos no need to pay special attention to them
KPI analysis is a process from the whole to the part
Step 1 Check the key indicators from the view of the whole network If there is not any
ZTE Confidential Proprietary copy 2012 ZTE CORPORATION All rights reserved 12
UMTS KPI Optimization Analysis Guide Internal Use Only
problem just ignore them Otherwise try to locate the RNC NE that has the problem
Step 2 Analyze the indicators of the corresponding RNC to find out the RNC whose indicators have the problem
Step 3 Analyze the indicators of the cell under the problem RNC to find out the worst cells or TOP N cells If the indicators of all the cells under the RNC are tend to be low it is a common problem probably caused by parameter configuration And then check whether the radio parameter configuration in the cells under this RNC is the same as that in the cells under the normal RNCs
Step 4 Make a comprehensive analysis on the KPIs alarms DT test data and customer complains of the worst cells to find out a solution
Analysis method
After learning the KPI analysis ideas we must know some common KPI analysis methods to rule out causes of problems from the obvious ones to the hidden ones
For example we found that the TCP code words were strictly limited at eight sites near a park and the call drop rate rose suddenly How to solve this problem
Method one First we checked whether the alarms transmission and boards of these sites were normal After they are proved all normal we sent some engineers to the site to do test And meanwhile we traced the RNC signaling at the OMC It turned out that the test result was normal and the indicators of these sites of that day did not have any problem and code words were not limited And later we knew from the news that there was a big gathering of about one million people at the park at that moment Until then we came to know that the congestion was caused by too many users using the network at the same time
Method two First because the eight sites went worse all of a sudden it was unlikely that the problem lied in the hardware Then we checked whether the radio parameters had been modified the day before The result is no worksheet had been issued to modify those parameters and no alarm was found at those sites Therefore we excluded the possibility of hardware problem Then we checked the traffic trend graph of the last few days (over seven days) and found that the high call drop rate might be caused by high traffic The graph showed that traffic of each site rose suddenly on the day before Thus we came to the conclusion that this was an abnormal abrupt event which may have been caused by a gathering And later we were told that there was a big gathering at the park So we were assured the code words limitation and high call drop rate at the eight sites were caused by too many subscribers using the network at the same time
By comparing the two methods above we can find that although the first one (sending engineers to the site without the consideration of abnormal events) is commonly used it is inefficient and costs more resource The second method (analyzing the problem by the means of exclusion and association) is more efficient From this case we would like to emphasize that KPI analysis is a process of problem exclusion Using the comprehensive
ZTE Confidential Proprietary copy 2012 ZTE CORPORATION All rights reserved 13
UMTS KPI Optimization Analysis Guide Internal Use Only
methods (like Method One) at the first brush may be making a detour
minus Exclusion method Check the alarms on the OMC to learn about the state of the RNC NodeB BPC board and the transmission If there are obvious broken link in transmission or hardware problem the cause of the problem is easy to locate
minus Incident association If the problem is with a great number of sites take abrupt incidents into account such as large-scale gathering terrible weather of incorrect operation These incidents will put influence of different levels and ranges on the network indicators
minus Comparison of radio parameters If some site goes wrong in a sudden check whether the radio parameter configuration of this site is consistent with that of other normal sites If not change it as that of the normal sites because the indicator decrease may be caused by an incorrect modification of radio parameters
minus Relevant indicators association If a certain indicator is in poor condition check its relevant indicators and find the common problem from these relevant indicators
minus Comprehensive problem location When the above reasons are excluded use DT data KPI data RNC signaling analysis data to locate the problem with indicators comprehensively
ZTE Confidential Proprietary copy 2012 ZTE CORPORATION All rights reserved 14
UMTS KPI Optimization Analysis Guide Internal Use Only
Figure 3-7 KPI optimization analysis process
StartPick out
performance indexes
RNC index abnormal
Equipment alarms exist
Deal with equipment alarms
RNC index recovers
Common problem with the
worst cells
Transmission softwarehardware version wireless
parameter configuration
CNRNC Transmission
Hardware Software Interference
Wireless parameters
Time range
Abrupt and self-curable abnormality
helliphellip
Analyze and record causes
Suggestion about improvement
Common problems analysis
Problem resolved
Successful call
Call drop Soft handover
23G alternate operation
PS rate helliphellip
Deal with the relevant problem
Indexes normal
End
Climate change holidays assembly
transmission interruption power
fault and so on
Y
N
Y
Y
N
Y
N
Abnormal indexes analysis in one cell
Y
N
N
N
Y
N
Y
Show TOPN abnormal cells
and their locations
If the problem is proved to be equipment bug or system problem after
several attempts feed it back to RampD dept
ZTE Confidential Proprietary copy 2012 ZTE CORPORATION All rights reserved 15
UMTS KPI Optimization Analysis Guide Internal Use Only
4 KPI Optimization Analysis This chapter mainly demonstrates how to analyze the indicator problems from the aspect of OMC data and provides flowcharts for KPI optimization The detailed analyzing method and cases of every special subject can be checked in the optimization guides of all the subjects
41 CS Call Drop Optimization
The CS call drop rate is the most important indicator in KPI optimization
411 Definition of Call Drop
After checking the signaling on the Uu interface at the UE side the engineer can judge the situation a call drop if the Uu interface message satisfies one of the following three conditions during the calling process (in connection)
RNC Release is not received but the UE condition changes from CELL_DCH to IDLE
RRC Release is received and the released cause value is Not Normal
One of the following three messages mdash CC Disconnect CC Release Complete and CC Release mdash is received and the released cause value is Not Normal Clearing or Not Normal Unspecified
In a board sense the call drop includes the call drop rates of CN and UTRAN The call drop of UTRAN includes the following two aspects
After the successful service establishment RNC sends the RAB Release Request to CN
After the successful service establishment RNC sends the IU Release Request to CN Later RNC receives the IU Release Command from CN
Note that RAN call drop statistics which is defined from the aspect of lu interface signaling means the launching times of RAB Release Request and lu Release Request of RNC And the DT call drop statistics is defined from the aspects of the Uu interface message non-access stratum message and cause value RAN call drop statistics and DT call drop statistics are not exactly the same
ZTE Confidential Proprietary copy 2012 ZTE CORPORATION All rights reserved 16
UMTS KPI Optimization Analysis Guide Internal Use Only
412 CS Call Drop Analysis Flowchart
Figure 4-8 CS call drop analysis flowchart
ZTE Confidential Proprietary copy 2012 ZTE CORPORATION All rights reserved 17
UMTS KPI Optimization Analysis Guide Internal Use Only
Extract performance data
CS TOP Ncell filtering
Analyze a single cell
1 Check NE alarms
2 Associate emergencies
3 Compare parameter
configurations
4 Associate indicators
5 Locate the fault
comprehensively
Exist or not
Handle alarms
Solved or not
Yes
Yes
End
No
No
Exist or not
Handle emergencies
Solved or not
Yes
No
No
Exist or not
Correct wrong parameter
configurations
Solved or not
Yes
No
No
List related indicator counters
Call-drop-related
countersRTWP
Handover success rate
Traffic volume
Resource limit indicators
Checkamp analysis of
interference
Optimizationanalysis of
handover failures
Optimization analysis of
resource limitCall-drop-
related counters
C301230362C301230363C301230365C301230315C301230316C301230318C301230319C301230322C301230323
Solved or not
Yes
Yes
No
Drive Test+RNC signaling
trace
Yes
ZTE Confidential Proprietary copy 2012 ZTE CORPORATION All rights reserved 18
UMTS KPI Optimization Analysis Guide Internal Use Only
42 PS Call Drop Optimization
421 Optimization Flowchart
Figure 4-9 PS call drop optimization flowchart
ZTE Confidential Proprietary copy 2012 ZTE CORPORATION All rights reserved 19
UMTS KPI Optimization Analysis Guide Internal Use Only
Extract performance data
PS TOP Ncell filtering
Analyze a single cell
1 Check NE alarms
2 Associate emergencies
3 Compare parameter
configurations
4 Associate indicators
5 Locate the fault
comprehensive ly
Exist or not
Handle alarms
Solved or not
Yes
Yes
End
No
No
Exist or not
Handle emergencies
Solved or not
Yes
No
No
Exist or not
Correct wrong parameter
configurations
Solved or not
Yes
No
No
List related indicator counters
Call -drop-related
countersRTWP
Handover success rate
Traffic volume
Resource limit indicators
Check amp analysis of interference
Optimizationanalysis of
handover failures
Optimization analysis of
resource limitCall -drop-
related counters
C301230372C301230373C301230375C301230330C301230332C301230333C301230334C301230337C301230338
Solved or not
Yes
Yes
No
Drive Test +RNC signaling
trace
Yes
ZTE Confidential Proprietary copy 2012 ZTE CORPORATION All rights reserved 20
UMTS KPI Optimization Analysis Guide Internal Use Only
43 Optimization of Accessibility Indicators
Accessibility performance includes the success rate of RRC connection setup and the success rate of CSPS RAB assignment These two kinds of KPIs play important roles in the network optimization and directly influence the success rate of CSPS service establishment In this document this kind of problems are found from the aspect of OMC data and solved through parameter optimization
431 Definition of Access Failure
For the mobile originated call in the CS domain the access failure event means that the UE sends RRC REQUEST and IE establish cause is Originating Conversational Call but alerting of the direct transfer message is not received
The relevant events are defined as follows in the access failure stage
RRC connection setup failure After considering the resending times and the waiting time the UE sends RRC CONNECTION REQUEST and does not receive the response from RNC or RRC CONNECTION REJECT delivered by RNC
Initial direct transfer and security mode establishment failure After sending RRC CONNECTION SETUP COMPLETE the UE does not send NAS SETUP
RAB assignment failure After receiving CALL PROCEEDING the UE does not receive RB SETUP delivered by RNC Or the UE replies with RB SETUP FAIL after receiving RB SETUP Or the UE receives DISCONNECT with the cause value not being Normal Release after receiving RB SETUP At this time the UE has not reported RB SETUP CMP
Failure after RAB assignment After the UE sends RB SETUP COMPLETE the originating UE receives DISCONNECTRELEASE from CN Or the UE waits CONNECT or ALERTING overtime and launches the Call Clearing process Or the UE becomes IDLE before receiving Alerting and starts to receive the system message
For the mobile terminated in the CS domain the access failure event means that the terminating UE receives the paging of paging type 1 and does not send RRC CONNECTION REQUEST with the cause value being Terminating Conversational Call Or the UE does not send the alerting of direct transfer message to CN after sending RRC CONNECTION REQUEST
The relevant events are defined as follows in the access failure stage
RRC connection setup failure After sending RRC CONNECTION REQUEST the UE does not receive the response from RNC or RRC CONNECTION REJECT delivered by RNC
Initial direct transfer and security mode establishment failure After sending RRC
ZTE Confidential Proprietary copy 2012 ZTE CORPORATION All rights reserved 21
UMTS KPI Optimization Analysis Guide Internal Use Only
CONNECTION SETUP COMPLETE the UE does not receive the SETUP direct transfer message Or the UE sends RELEASE COMPLETE Or the UE receives DISCONNECT from CN
RAB assignment failure The UE does not receive RB SETUP delivered by RNC after sending CALL CONFIRM Or the UE replies with RB SETUP FAIL after receiving RB SETUP Or the UE receives DISCONNECT with the cause value not being Normal Release after receiving RB SETUP At this time the UE has not reported RB SETUP CMP
Failure after RAB assignment After the UE sends RB SETUP COMPLETE the terminating UE receives DISCONNECTRELEASE from CN
432 Analysis on RRC Connection Failures
The problem of RRC connection setup failure can be analyzed through the UE signaling flow and RNC single-user tracing The RRC connection setup includes the following steps
The UE sends RRC Connection Request through the RACH channel
RNC sends RRC Connection Setup through the FACH channel
The UE sends RRC Connection Setup Complete through the dedicated uplink channel after the downlink dedicated channel is established and synchronized
RRC connection setup failures are always caused by following issues
Uplink RACH problem
Problem about downlink FACH power allocation proportion
Parameter reselection problem of the cell
Low downlink dedicated initial transmitting power
Uplink initial power control problem
Congestion
Equipment malfunctions
Among these issues the problems of uplink RACH downlink FACH power allocation proportion parameter reselection of the cell and equipment malfunctions appear more frequently
ZTE Confidential Proprietary copy 2012 ZTE CORPORATION All rights reserved 22
UMTS KPI Optimization Analysis Guide Internal Use Only
4321 Analysis Flowchart of RRC Connection Setup Failures
Figure 4-10 Analysis flowchart of RRC connection setup failures
ZTE Confidential Proprietary copy 2012 ZTE CORPORATION All rights reserved 23
UMTS KPI Optimization Analysis Guide Internal Use Only
Extract performance data
TOP Ncell filtering
Analyze a single cell
1 Check NE alarms
2 Associate emergencies
3 Compare parameter
configurations
4 Associate indicators
5 Locate the fault
comprehensive ly
Exist or not
Handle alarms
Solved or not
Yes
Yes
End
No
No
Exist or not
Handle emergencies
Solved or not
Yes
No
No
Exist or not
Correct wrong parameter
configurations
Solved or not
Yes
No
No
List related indicator counters
Counters related to RRC setup
failuresRTWP
Resource limit
indicators
Checkamp analysis of interference
Optimization analysis of
resource limitCounters related
to RRC setup failures
C301480485C301480486C301480487C301480489C301480490C301480491C301481288C301481289C301481337C301481338C301481339C301481407C301481408
Solved or not
Yes
Yes
No
Drive Test+RNC signaling
trace
Yes
ZTE Confidential Proprietary copy 2012 ZTE CORPORATION All rights reserved 24
UMTS KPI Optimization Analysis Guide Internal Use Only
4322 UE sends RRC Connection Request but RNC does not receive it
If the EcIo of downlink CPICH is relatively low it is the problem of coverage
If the EcIo of downlink CPICH is not very low (for example the value is larger than -14 dB) Usually it is the problem of RACH and the following issues may cause the problem
minus The power of Preamble does not rise to a required value and the rising times of Preamble should be increased
minus The output power of UE is lower than the required value which is caused by poor UE performance In this case the UE should be changed
minus The NodeB equipment has a standing wave and the engineer should check whether NodeB has any SWR alarm
minus The radius of the cell is set improperly If the radius parameter of the cell is set too small the NodeB can not synchronize the UE beyond the range of the radius and the access fails This problem often happens in the places with large coverage such as the rural areas and the suburbs
4323 RNC delivers RRC Connection Reject after receiving RRC Setup Request
When RRC Connection Reject appears the engineer should check the specific reject cause value Usually there are two kinds of causes
The CPU load of RNC control plane board is too heavy and more boards should be added
DCH and FACH admission is rejected However this situation does not always happen
4324 UE does not receive RRC Connection Setup delivered by RNC
This problem may be caused by the following reasons
Poor coverage
Improper parameters of cell selection and reselection
Checking method The engineer should check the EcIo of CPICH If the value is lower than -12 dB (EcIo is -12 dB by default) and there is no cell of better quality in the monitor set the cause of this problem is poor coverage If there is better cell in the monitor set cell reselection may cause this problem
Poor coverage can be improved by coverage enhancement such as adding some sites to cover the places without signal coverage and adjusting the engineering parameters If the coverage can not be improved the engineer can enhance the FACH power according to
ZTE Confidential Proprietary copy 2012 ZTE CORPORATION All rights reserved 25
UMTS KPI Optimization Analysis Guide Internal Use Only
the PCPICH EcIo coverage of the current network For example if all the pilot EcIo values are larger than -12 dB in the coverage area the power proportion of the common channel should be configured on the basis of the situation that the EcIo value is larger than -12 dB And so the success rate of the idle UE assessment can be ensured
As for the access problem caused by cell selection and reselection the engineer can speed up the cell selection and reselection by adjusting the cell selection and reselection parameters and the problem of RRC connection setup failure caused by improper cell selection and reselection parameters can be solved
Note
The RRC Connection Setup message is borne by FACH RRC Connection Request sent by the UE is received by UTRAN at the preamble of PRACH and then it is sent from the RACH channel based on the current preamble power And the transmit power of preamble can rise all the time until the response is received (There is a limitation for the maximum number of preamble retransmissions) Therefore in the areas with poor coverage the RACH coverage and FACH coverage may become unbalanced and as a result UTRAN can receive RRC Connection Request sent by the UE but the UE can not receive RRC Connection Setup sent by RNC
4325 UE receives RRC Connection Setup and does not send RRC Setup Complete
If the downlink signal quality is normal this problem may be caused by the abnormal condition of the cell phone
Another reason of this problem may be the downlink synchronization failure caused by the low initial power of downlink dedicated channel You can solve this problem by adjusting the service downlink EbNo
4326 RNC does not receive RRC Setup Complete sent by UE
Because the uplink initial power control may increase the UE transmit power this kind of problem seldom appears If it appears the engineer can increase the Constant Value of the dedicated channel properly to raise the uplink DPCCH initial transmission power of the UE
At the same time this problem is also relevant with the uplink SIR initial target value configuration because this value may affect the uplink initial synchronization at the initial stage of link setup If the value of the parameter is set too large there will be too much uplink inference brought by the initial setup of the link If the value is set too small the uplink synchronization will take longer time and the initial synchronization may even fail This parameter is an RNC-level parameter which has a great influence on network performance Therefore the engineer should be cautious while adjusting this parameter
ZTE Confidential Proprietary copy 2012 ZTE CORPORATION All rights reserved 26
UMTS KPI Optimization Analysis Guide Internal Use Only
Note
RRC Connection Setup Complete is sent through uplink DPCH and the UE calculates the initial power of uplink DPCCH according to the received IErdquoDPCCH_Power_offsetrdquo and the measured CPICH_RSCP value
DPCCH_Initial_power = DPCCH_Power_offset - CPICH_RSCP
DPCCH_Power_offset = Primary CPICH DL TX Power + UL Interference + Constant Value The Constant Value can be configured in the OMC If this value is set too small the UE may not have enough power to send RRC Connection Setup Complete
433 Analysis on RABRB Setup Failures
When RAB or RB setup fails RNC will send RAB Assignment Fail in the RAB Assignment Response signaling The engineer can find out the specific failure reason from the failure cause value carried in relevant cells The reasons for common RABRB setup failures include
RNC directly rejecting RAB Setup Request because of wrong parameter configuration
Admission reject
RAB setup failure because the UE fails to respond to RB Setup Request
RAB setup failure because the Uu interface fails to set up RB
ZTE Confidential Proprietary copy 2012 ZTE CORPORATION All rights reserved 27
UMTS KPI Optimization Analysis Guide Internal Use Only
4331 Analysis Flowchart of RAB Setup Failures
Figure 4-11 Analysis flowchart of RAB setup failures
ZTE Confidential Proprietary copy 2012 ZTE CORPORATION All rights reserved 28
UMTS KPI Optimization Analysis Guide Internal Use Only
Extract performance data
TOP Ncell filtering
Analyze a single cell
1 Check NE alarms
2 Associate emergencies
3 Compare parameter
configurations
4 Associate indicators
5 Locate the fault
comprehensively
Exist or not
Handle alarms
Solved or not
Yes
Yes
End
No
No
Exist or not
Handle emergencies
Solved or not
Yes
No
No
Exist or not
Correct wrong parameter
configurations
Solved or not
Yes
No
No
List related indicator counters
Counters related to RAB setup failures RTWP
Resource limit
indicators
Checkamp analysis of interference
Optimization analysis of
resource limitCounters related to RAB setup failures
CS domain PS domainC301230290 C301230302C301230291 C301230303C301230292 C301230304C301230293 C301230305C301230294 C301230306C301230295 C301230307C301230296 C301230308C301230297 C301230309C301230298 C301230310C301230299 C301230311C301230300 C301230312C301230301 C301230313
Solved or not
Yes
Yes
No
Drive Test+RNC signaling
trace
Yes
ZTE Confidential Proprietary copy 2012 ZTE CORPORATION All rights reserved 29
UMTS KPI Optimization Analysis Guide Internal Use Only
4332 RNC Directly Rejecting RAB Setup Request Because Of Wrong Parameter Configuration
The case that RNC responds with RAB Setup Failure directly is seldom caused by invalid parameter configuration in the business network Usually this case is caused by special operations of the special users
The main scenario is that the subscription information of the userrsquos PS service is beyond the capability of the UE which leads to the direct refusal from RNC For example a special userrsquos subscription rates of uplink and downlink are 384 K but the maximum uplink rate of the UE is only 64 K The maximum uplink and downlink rates of the QoS message used for activating PDP set by the AT command or mobile terminal software used by the user are 384 K so the RNC will find the maximum uplink rate is beyond the UErsquos capability directly reply with RAB Setup Failure and will not launch the RB setup process when it receives RAB Assignment Request
After the RAB setup fails because the parameter configuration is beyond the UErsquos capability SGSN will negotiate again to launch the new RAB assignment until the UE has the capability to support the assignment and the RAB assignment is finished For the users the PDP activation is still successful and the actual maximum rate is the maximum rate the UE can support
However if the minimum guaranteed bit rate required by the QoS setting in the UErsquos PDP activation request is beyond the UErsquos capability though the network negotiates a lower rate to accept the UErsquos PDP activation request the UE will launch the request of deactivating PDP when it finds that the rate negotiated by the network in PDP activation accept request is lower than the minimum guaranteed bit rate and finally the PDP activation can not be completed
4333 Admission Reject
For the non-HSDPA user if there are insufficient system resources (including power channel code lub transmission resource and CE) the call establishment failure will be caused by the admission reject At this time it is necessary to check the network load code resource lub transmission resource and CE resource occupation to make sure the congestion is caused by the limitation of a certain kind of resource What is more the engineer should plan the corresponding expansion method
If the cell does not support the HSDPA service the R99 user admission is judged according to the fixed R99 admission threshold If the cell supports the HSDPA service and the HSDPA and R99 dynamic power is allocated the uplink admission of non-HSDPA is judged based on RTWP or the equivalent user number If the uplink load is too heavy the non-HSDPA user admission will also fail
If the bandwidth configuration on the lub interface is insufficient the lub interface will reject the R99 data service activation because of limited bandwidth
ZTE Confidential Proprietary copy 2012 ZTE CORPORATION All rights reserved 30
UMTS KPI Optimization Analysis Guide Internal Use Only
The admission control of the NodeB Credit resource is similar to the power admission control Whether the remaining Credit can support the currently requested service or not can be judged according to the spectrum spreading factor of the new access user According to the condition of the RAB Downsizing Switch RNC will deal with the issue in the corresponding way
For the HSDPA user in the dynamic power allocation mode besides the mentioned system resources such as the power channel code lub transmission resource and CE the admission reject should take into consideration whether the number of H users supported by NodeB and the number of H users supported by the cell are over the regulated threshold or not into consideration
For the HSDPA user when the bandwidth configuration on lub interface is insufficient the admission reject will not happen but the rate will be reduced What is more the AAL2PATHs of HSDPA and R99 are configured respectively and the HSDPA AAL2PATH must be configured to the HSDPA_RT or HSDPA_NRT type If the HSDPA AAL2PATH is configured to RT or NRT of R99 AAL2PATH type the RAB assignment failure will not happen but RNC will establish the HSDPA service as R99 384 Kbps
For the downlink power admission
Besides whether the R99 service load is over the non-HSDPA service threshold DCH service should take into consideration whether non-HSDPA power and HSDPA GBP (the minimum power needed for the guaranteed bit rate) are over the general power threshold of the cell
For the HSDPA service it is necessary to check whether the throughput rate provided by the cell is over the sum of all the usersrsquo GBR thresholds or whether the GBPs of the stream service and the background service are over the HSDPA power of the cell At the same time whether the non-HSDPA power and the HSDPA GBP (the minimum power needed for the guaranteed bit rate) are over the overall power threshold of the cell should be also taken into consideration
For the lub admission
For the DCH service the admission is made according to the multiplication of the peak rate and the service activation factor
For HSDPA service the admission is made according to the GBR
If the lub exceeds the congestion threshold the DCCC rate reduction will be triggered And if the RLC_AM retransmission rate is over a certain threshold the Iub Overbooking switch can be opened to trigger the TF which limits R99 or to reduce the rate of HSDPA service by a certain factor
ZTE Confidential Proprietary copy 2012 ZTE CORPORATION All rights reserved 31
UMTS KPI Optimization Analysis Guide Internal Use Only
4334 RAB Setup Failure Because the UE Fails to Respond to RB Setup
The UE fails to respond to RB setup mainly because of the userrsquos operation
Take the following cases as examples
When the user already has had the downlink 12 K data service he receives RB Setup Request of the VP service (either the originated call in the VP domain or the terminated call in the VP domain) Because the UE does not support the VP and high-speed PS service in the downlink at the same time it directly replies with RB Setup Failure and the cause value is unsupported configuration
Compared with the WCDMA subscriber originating the VP service the terminating subscriber resides in the GSM network and so it does not support the VP service After RNC receives RAB Assignment Request the core network will deliver the Disconnect command right after call proceeding and the cause value is Bearer capability not authorized At this time the UE has just received the RB SETUP command and has no enough time to finish the RB setup So the UE will reply with RB Setup Failure after it receives the Disconnect command and the RNC will reply with RAB Setup Failure with the cause value being failure in radio interface procedure
4335 RAB Setup Failure Because the Uu Interface Fails to Set Up RB
RNC sends the Radio Bearer Setup command to the UE but fails to receive Radio Bearer Setup Compete This kind of situation (RB setup failure) often appears in the cells with weak signals There are two causes of weak signals one is that the UE does not reside in the best server to launch the access and the other is poor coverage
If the UE does not reside in the best server to launch the access it will hope to enter the best server through active set update in the RB setup process (At the same time the fast signal change will drastically weaken the signals in the cell) but the active set update can only be processed after the RB setup is completed because the procedures can not be processed alternately (Neither the network nor the terminal supports it) Therefore RB can only be set up in the cell with weak signals and the setup is easy to fail As for this situation the starting threshold and speed of co-frequency cell reselection should be increased to make the UE reside in the best server and launch the access as soon as possible
RB setup failure may be caused by the poor downlinkuplink coverage If the failure is caused by downlink coverage the UE can not receive the Radio Bearer Setup command which may be caused by the uplink interference and this can be fixed through checking RTWP The poor downlink coverage is partly caused by the bad UE demodulation performance and other causes should be solved by RF optimization
ZTE Confidential Proprietary copy 2012 ZTE CORPORATION All rights reserved 32
UMTS KPI Optimization Analysis Guide Internal Use Only
44 Optimization of Mobility Indicators
Mobility indicators mainly fall into three categories mdash soft handovers hard handovers and inter-RAT handovers The handover problems usually happen in the following cases
The best server changes too fast or there is no best server due to pilot pollution
The handover is not prompt or there are pingpong handovers due to improper parameter configuration
Adjust the engineering parameters for antennas in areas with severe pilot pollution And adjust the handover parameters such as the values of 1A 1B CIO TTT (time to trigger) Hysteresis and so on to solve the problem that the handover is not prompt or there are pingpong handovers This section tries to solve this kind of problems through OMC data analysis and parameter optimization
441 Optimization of Soft Handovers
Missed neighboring cell configuration pilot pollution improper soft handover parameter configuration and equipment malfunctions are the major causes of soft handover failures To confirm the problems the field DTs are required
ZTE Confidential Proprietary copy 2012 ZTE CORPORATION All rights reserved 33
UMTS KPI Optimization Analysis Guide Internal Use Only
4411 Soft Handover Optimization Flowchart
Figure 4-12 Soft handover optimization flowchart
ZTE Confidential Proprietary copy 2012 ZTE CORPORATION All rights reserved 34
UMTS KPI Optimization Analysis Guide Internal Use Only
Extract performance data
TOP Ncell filtering
Analyze a single cell
1 Check NE alarms
2 Associate emergencies
3 Compare parameter
configurations
4 Associate indicators
5 Locate the fault
comprehensive ly
Exist or not
Handle alarms
Solved or not
Yes
Yes
End
No
No
Exist or not
Handle emergencies
Solved or not
Yes
No
No
Exist or not
Correct wrong parameter
configurations
Solved or not
Yes
No
No
List related indicator counters
RTWPResource
limit indicators
Checkamp analysis of interference
Optimization analysis of
resource limitCounters related to intra-frequency
handover failures
C301391101 C301390593C301391102 C301390594C301391103 C301390595C301390586 C301390596C301390587 C301390597C301390588 C301390598C301390589 C301390599C301390590 C301390600C301390591 C301390601C301390592 C301390602
Solved or not
Yes
Yes
No
Drive Test+RNC signaling
trace
Yes
Counters related to soft handover
failures
30055 3005630057 3005830059 3006030061 30062
Cell hand-inhand-out indicators
ZTE Confidential Proprietary copy 2012 ZTE CORPORATION All rights reserved 35
UMTS KPI Optimization Analysis Guide Internal Use Only
4412 Checking Missed Neighboring Cell Configuration
Generally speaking most of the call drops at the beginning of the optimization are caused by missed neighboring cell configuration The following methods are often used to judge whether the call drops are caused by missed configuration of co-frequency neighboring cells
Observe the active set EcIo information recorded by the UE and the Best Server EcIo information recorded by the Scanner before the call drop If the former record is very bad but the latter record is very good then check whether the Best Server scrambling code recorded by the Scanner appears in the latest list of the neighboring cells under intra-frequency measurement control If it does not then the call drop is caused by missed neighboring cell configuration
If the UE re-accesses immediately after the call drop and the cell scrambling codes during the UE reaccess and those during the call drop are different then the call drop may also be caused by missed neighboring cell configuration You can confirm it through measurement control (look backwards from the message of the call drop event for the latest intra-frequency measurement control message and check the neighboring cell list of this message)
Some UE may report the Detected Set information If the corresponding scrambling code appears in the Detected Set information before the call drop then the call drop is caused by missed neighboring cell configuration
4413 Checking Pilot Pollution
Definition of pilot pollution Excessive strong pilot signals exist at a certain point but none of them is strong enough to be the best server To form pilot pollution the following points in this definition should be satisfied
Strong pilot signal The absolute pilot signal strength is used to judge whether the pilot signal is a strong one The pilot signal strength can be evaluated through the pilot RSCP If the pilot RSCP exceeds a threshold it is considered a strong pilot signal The formula is
AbsoluteRSCPThRSCPCPICH __ gt
Excessive The number of pilot signals is used to judge whether there are excessive pilot signals at a certain point If the number exceeds a threshold it is regarded that excessive pilot signals exist at this point The formula is
NThNumberCPICH gt_
None of them is strong enough to be the best server The relative strength of a pilot signal is a key factor in judging whether the pilot signal is strong enough Based on the above definition and formulae if the difference between the strength of the
ZTE Confidential Proprietary copy 2012 ZTE CORPORATION All rights reserved 36
UMTS KPI Optimization Analysis Guide Internal Use Only
strongest pilot signal and that of the )1( +NTh strongest pilot signal at this point is
less than a threshold it is regarded that there is no pilot signal strong enough to be the best server at this point The formula is
lativeRSCPthThbest ThRSCPCPICHRSCPCPICHN Re_)1( )__( ltminus +
According to the above description it is regarded that pilot pollution exists if the following conditions are both satisfied
The number of pilot signals that meet the condition
AbsoluteRSCPThRSCPCPICH __ gt is more than NTh
lativeRSCPthThbest ThRSCPCPICHRSCPCPICHN Re_)1( )__( ltminus +
For example during the network optimization suppose
dBmTh AbsoluteRSCP 95_ minus= 3=NTh and dBTh lativeRSCP 5Re_ = if the following
conditions are both satisfied then it is regarded that pilot pollution exists
The number of the pilot signals that meet the condition
dBmRSCPCPICH 95_ minusgt is more than 3
dBRSCPCPICHRSCPCPICH thbest 5)__( 4 ltminus
4414 Adjusting Soft Handover Algorithm Parameters
You can solve the following kinds of problems by adjusting handover algorithm parameters
1 The handover is not prompt
From the perspective of the CS service signaling flow the symptom of this problem is that the UE cannot receive Active Set Update (physical channel reallocation in the case of the intra-frequency hard handover) because after the UE reports the measurement report the source cell has a fast reduction in EcIo When the RNC sends Active Set Update the UE has closed the transmitter due to the loss of downlink synchronization Viewed from the UE side it cannot receive Active Set Update In the PS services if the UE cannot receive Active Set Update or TRB resets before the handover the handover will also fail
From the perspective of signals the following phenomena may accompany this problem
ZTE Confidential Proprietary copy 2012 ZTE CORPORATION All rights reserved 37
UMTS KPI Optimization Analysis Guide Internal Use Only
minus Corner effect EcIo of the source cell decreases drastically and EcIo of the target cell increases sharply (very high when it appears)
minus Fast fading EcIo of the source cell decreases quickly for a while and then increases and EcIo of the target cell increases for a short while
2 Pingpong handovers The following phenomena may accompany this problem
The best server changes quickly Two or more cells take turns to be the best server But as the best server none of the cells can last long though they has good RSCPs and EcIos
There is no best server There are multiple cells Their RSCPs are normal and similar to each other But EcIo of every cell is very bad
From the perspective of the signaling flow Event 1A is reported immediately after one cell is deleted Because the UE cannot receive Active Set Update from the RNC the handover fails
4415 Equipment Malfunctions
First check the alarm console to see whether there are abnormal alarms and analyze the message traces at the same time Find out in which step the soft handover fails Check the failure message and contact the local product maintaining engineer to confirm whether the equipment has malfunctions
4416 Solutions
Corresponding adjustments should be taken for the confirmed problems
Handover failures caused by pilot pollution Adjust the engineering parameters of a certain antenna to set this antenna as the best server in this interfered location If the power of one of its sectors is reduced then Io of the pilot pollution area will decrease even if the powers of other pilots are not adjusted EcIo will also increase Thereby the EcIo differences with other scrambling codes in the active set will become larger and pilot pollution will be eliminated Through a lot of research ZTE has proved that the reduction in the pilot transmit power will not change cell capacity greatly If condition allows new base stations can be added to cover this area
Equipment malfunctions Consult the customer service engineers and ask them to help check whether there are alarms and whether the transport layer is abnormal If there are alarms coordinate with the customer service engineers and the engineering personnel to solve the problems
Call drops because the handovers are not prompt
ZTE Confidential Proprietary copy 2012 ZTE CORPORATION All rights reserved 38
UMTS KPI Optimization Analysis Guide Internal Use Only
minus Adjust the antenna to expand the handover zone
minus Configure the Event 1A handover parameters to make the handover easier to happen
minus Increase CIO to make the handover happen earlier in the target cell The sum of CIO and the actually measured value is used for judging the UE events including the UE intra-frequency handover CIO helps shift the cell border in the handover algorithm If CIO is configured with a larger value the handover will be easier to happen and there will be more UE in the soft-handover status but more resources will be occupied If CIO is configured with a smaller value the soft handover will be more difficult to happen and the receiving quality may be impaired A CIO of about 5dB is quite good for eliminating the fast fading and the corner effect but this configuration has some side effects such as the increase of handover proportion
Call drops caused by pingpong handovers Adjust the antenna to form a best server in its coverage zone or set the Event 1B handover parameters (increase the threshold of Event 1B the Event 1B hysteresis or the time to trigger Event 1B) to increase the difficulty in deleting the active set
442 Optimization of Hard Handovers
4421 Classification of Hard handovers
Hard handovers mainly fall into two classifications
Intra-frequency hard handovers The intra-frequency hard handover is triggered only when the intra-frequency softsofter handover cannot be performed and it is applicable to the following circumstances
minus Inter-RNC intra-frequency cell handovers when there is no Iur interface
minus Insufficient Iur interface resources though there is the Iur interface
minus Handovers controlled by the threshold of the PS service rate in the handover cell
The intra-frequency softsofter handovers can not be performed (intra-frequency hard handover should be triggered) in the following scenarios
minus When the intra-frequency handover happens the UE is using the transmit diversity in the active set cell but the target cell does not support the transmit diversity
minus The intra-frequency measurement report does not contain OFF and TM of the
ZTE Confidential Proprietary copy 2012 ZTE CORPORATION All rights reserved 39
UMTS KPI Optimization Analysis Guide Internal Use Only
target cell
minus When the intra-frequency handover happens between RNCs the Iur interface is unavailable
minus The UE performs the multiuser detection in the active set cell but the target cell does not support the multiuser detection
minus The target cell and the original cell belong to different classifications (The cells of R99 R5+R99 and R6+R5+R99 belong to the same classification while the cells of R5 and R6+R5 belong to another classification)
Inter-frequency hard handovers The inter-frequency hard handover means a UE connection is handed over from a cell of a UTRAN frequency to a cell of another frequency Many factors including the radio quality the load and the speed of the moving UE may trigger inter-frequency hard handovers
For example the radio quality triggers the inter-frequency hard handover in the following way
When the quality of the UE radio frequency becomes lower the inter-frequency measurement will be triggered and according to the measurement result the UE connection will be handed over to a better frequency
ZTE Confidential Proprietary copy 2012 ZTE CORPORATION All rights reserved 40
UMTS KPI Optimization Analysis Guide Internal Use Only
4422 Hard Handover Optimization Flowchart
Figure 4-13 Hard handover optimization flowchart
ZTE Confidential Proprietary copy 2012 ZTE CORPORATION All rights reserved 41
UMTS KPI Optimization Analysis Guide Internal Use Only
Extract performance data
TOP Ncell filtering
Analyze a single cell
1 Check NE alarms
2 Associate emergencies
3 Compare parameter
configurations
4 Associate indicators
5 Locate the fault
comprehensive ly
Exist or not
Handle alarms
Solved or not
Yes
Yes
End
No
Exist or not
Handle emergencies
Solved or not
YesNo
Exist or not
Correct wrong parameter
configurations
Solved or not
Yes
No
No
List related indicator counters
RTWPResource
limit indicators
Checkamp analysis of interference
Optimization analysis of
resource limit
Counters related to inter-frequency handover failures
C301110489 C301110516C301110499 C301110517C301110500 C301110518C301110501 C301110519C301110502 C301110520C301110503 C301110521C301110504 C301110522C301110505 C301110523
Solved or not
Yes
Yes
No
Drive Test+RNC signaling
trace
Yes
Counters related to hard handover
failures
30041 3004230043 3004430045 3004630047 30048
Cell hand-inhand-out indicators
NoNo
ZTE Confidential Proprietary copy 2012 ZTE CORPORATION All rights reserved 42
UMTS KPI Optimization Analysis Guide Internal Use Only
4423 Hard Handover Optimization Methods
The optimization flow for the hard handover is similar to that of the soft handover The major differences are in the parameter optimization To optimize intra-frequency hard handovers you can properly reduce the Event 1D hysteresis and the time to trigger Event 1D according to the real radio environment to ensure timely handovers
Inter-frequency coverage is often applied to some special scenarios such as indoor coverage and tested through CQT The method of judging whether there is missed configuration of the inter-frequency neighboring cell is almost the same as that of the co-frequency neighboring cell when a call drop occurs the UE fails to measure or report the inter-frequency neighboring cell after the call drop the UE resides in the inter-frequency neighboring cell again
The common hard handover problems are
1 The handover is not prompt The common symptoms are frequent call drops in the hard handovers when the UE moves
Solutions
Increase the threshold of activating the compressing mode The compressing mode is usually activated before the inter-frequency handover or the inter-RAT handover and it is used to measure the quality of the inter-frequency or inter-RAT cell You can set a threshold of the CPICH RSCP or EcIo to activate the compressing mode And the RSCP is widely used
minus Requirements on setting the threshold of activating the compressing mode Before the cell quality becomes low enough to cause a call drop the signal of the target cell should be measured and reported and the handover should be performed
minus Requirement on setting the threshold of deactivating the compression mode Frequent activationdeactivation of the compression mode should be avoided
Increase CIOs of the inter-frequency cell pair
Reduce the threshold of triggering the target frequency handover under the inter-frequency coverage
2 There are pingpong handovers
Solution Increase the hard handover hysteresis and the time to trigger the event
ZTE Confidential Proprietary copy 2012 ZTE CORPORATION All rights reserved 43
UMTS KPI Optimization Analysis Guide Internal Use Only
443 Optimization of Inter-RAT Handovers
4431 Configuring Basic Inter-RAT Parameters
Most of the inter-RAT handover failures are caused by incomplete parameter configuration The following parameters need special attention
Complete RNC parameter configuration for the GSM neighboring cell The 2G system shall provide the 3G system with the correct radio parameters based on negotiation mdash MCC MNC LAC ID (CI) NCC BCC frequency band indicator (900 or 1800) and BCCH
Table 4-3 Parameters That 2G Shall Provide to 3G
MCC MNC LACIDCI
NCC BCCFrequency
band indicator
BCCH
460 2 202 193 0 0 900 102
Complete GSM BSC parameter configuration for the WCDMA neighboring cell The 3G system shall provide the 2G system with the correct radio parameters based on negotiation mdash MCC MNC LAC RNC ID cell ID (C_ID) downlink frequency scrambling code and RAC
Table 4-4 Parameters That 3G Shall Provide to 2G
MCC MNC LACRNC
IDCell IDC_ID
Downlink frequency
Scrambling code
RAC
460 3 20 18 51 10787 51 20
According to the current strategy of one-way inter-RAT handovers if the parameter configuration is complete one probable cause of the inter-RAT handover failure is that the handover is not prompt The common parameter adjustment is to increase CIO the threshold to activatedeactivate the compressing mode and the threshold to trigger the WCDMA-to-GSM handover at the same time
Call drops during the inter-RAT handovers between WCDMA and GSM may be caused by
minus Inconsistent data configuration at the GSM side and the WCDMA side after GSM modifies the configuration data but does not inform WCDMA
minus Missed configuration of neighboring cells which can be solved by the correct configuration of neighboring cells
minus Too fast signal changes
ZTE Confidential Proprietary copy 2012 ZTE CORPORATION All rights reserved 44
UMTS KPI Optimization Analysis Guide Internal Use Only
minus Pingpong reselection
minus Faults with the UE for example the UE fails to respond to the handover or report the inter-RAT measurement report
minus Changes of the best server during the physical channel reallocation
minus Wrong LAC configuration which can be located through data configuration check
ZTE Confidential Proprietary copy 2012 ZTE CORPORATION All rights reserved 45
UMTS KPI Optimization Analysis Guide Internal Use Only
4432 Inter-RAT Handover Optimization Flowchart
Figure 4-14 Inter-RAT handover optimization flowchart
ZTE Confidential Proprietary copy 2012 ZTE CORPORATION All rights reserved 46
UMTS KPI Optimization Analysis Guide Internal Use Only
Extract performance data
TOP Ncell filtering
Analyze a single cell
1 Check NE alarms
2 Associate emergencies
3 Compare parameter
configurations
4 Associate indicators
5 Locate the fault
comprehensive ly
Exist or not
Handle alarms
Solved or not
Yes
Yes
End
No
No
Exist or not
Handle emergencies
Solved or not
Yes
No
No
Exist or not
Correct wrong parameter
configurations
Solved or not
Yes
No
No
List related indicator counters
RTWPResource
limit indicators
Checkamp analysis of interference
Optimization analysis of
resource limitCounters related to inter-RAT handover failures
C301130667 C301130681C301130668 C301130682C301130669 C301130690C301130670 C301130691C301130671 C301130692C301130672 C301130693C301130673 C301130694C301130674 C301130696C301130675 C301130697C301130677 C301130698C301130678 C301130699C301130679 C301130700
C301130680
Solved or not
Yes
Yes
No
Drive Test+RNC signaling
trace
Yes
Counters related to inter-RAT handover
failures
Cell hand-inhand-out indicators
30049 3005030051 3005230053 30054
ZTE Confidential Proprietary copy 2012 ZTE CORPORATION All rights reserved 47
UMTS KPI Optimization Analysis Guide Internal Use Only
45 Optimization of Resource Indicators
The resource indicators directly reflect the system capacity Increasing subscribers will consume more system resources and some resources may be limited for example the code resource may be limited the TCP access request may be rejected and the CE resource usage rate may exceed the threshold Limited system resources have a negative influence on the whole-network indicators and the subscribersrsquo perception for example call drops may frequently happen and more TCP access requests may be rejected during the voice services
Table 4-5 Resource KPIs and Alarm Thresholds
Resource type KPI No and nameAlarm
threshold
TCP
C301320150 Number of rejected services DCH downlink TCP limit
50
PI30167 Average non-HS (SOA) (SOA)DPA TCP 40
PI30092 Maximum Cell TCP () 100
PI30093 Average Cell TCP 70
UL TrafficPI30029 Handover Blocking Rate 05
KPI RTWP (in busy hour) -98 dBm
Code
C301320153 Number of rejected services DCH no code
50
PI30205 Average Cell HSUPA Users 12
PI30172 Cell Average HSDPA Users 16
CE
PI301830006 Maximum use Ratio of Uplink NodeB CE
60
PI301830010 Maximum use Ratio of Downlink NodeB CE
60
ZTE Confidential Proprietary copy 2012 ZTE CORPORATION All rights reserved 48
UMTS KPI Optimization Analysis Guide Internal Use Only
451 Resource Indicator Optimization Flowchart
Figure 4-15 Resource indicator optimization flowchart
ZTE Confidential Proprietary copy 2012 ZTE CORPORATION All rights reserved 49
UMTS KPI Optimization Analysis Guide Internal Use Only
Extract performance data
TOP Ncell filtering
Analyze a single cell
1 Check NE alarms
2 Associate emergencies
3 Compare parameter
configurations
4 Associate indicators
5 Locate the fault
comprehensive ly
Exist or not
Handle alarms
Solved or not
Yes
是
End
No
No
Exist or not
Handle emergencies
Solved or not
Yes
No
No
Exist or not
Correct wrong parameter
configurations
Solved or not
Yes
No
No
List related indicator counters
Code resource indicators
CE resource indicators
TCPadmission
reject counter
C301320150
Solved or not
Yes
Yes
No
Drive Test+RNC signaling
trace
Yes
Counter related to TCP limit
Cell TX power
indicators
30090 3009130092 3009330166 3016730168 3016930170 30171
30163301643016530075
30223302243045030451
Yes
Yes
ZTE Confidential Proprietary copy 2012 ZTE CORPORATION All rights reserved 50
UMTS KPI Optimization Analysis Guide Internal Use Only
452 Code Resource Optimization
The statistics of Number of rejected services and DCH no code the average code resource usage rate and the number of the HSDPA subscribers can be used to judge whether the code resource in a cell is limited If the code resource is limited you can adjust the code resource allocation to alleviate the situation
Based on the system algorithm when Formula 1 is satisfied you can add an HS-PDSCH when Formula 2 is satisfied then an HS-PDSCH is deleted
Formula 1 OcuRateNoHspdsch + OcuRateHspdsch + DpchCodeHy + 32 lt= 512
Formula 2 OcuRateNoHspdsch + OcuRateHspdsch + CodeUptHyA gt 512
OcuRateHspdschHSPDSCH means the number of the codes of SF=512 blocked by the HS-PDSCH OcuRateNoHspdsch means the number of codes of SF=512 blocked by other channels DpchCodeHy means the number of codes of SF=512 reserved for the DPCH and CodeUptHyA is the threshold to decide whether to delete the HSPDSCH
Therefore to ensure the access of the R99 subscribers you can make some adjustment according to Table 4-6 when the code resource is limited though the HSDPA rate may decrease
Table 4-6 Adjusting Code Resource Allocation
AbbreviationParameter
nameRange
and stepCurrent value
Update value
Remark
DpchCodeHy DPCH Code Hysteresis
0512 16 28
To decrease the number of rejected services for DCH no code
CodeUptHyACode Update Hysteresis A
0512 16 28
To decrease the number of rejected services for DCH no code
453 Monitoring CE Resource
The CE resource is mainly monitored through the maximum UE uplinkdownlink usage rate If there is any problem you can solve it by controlling the load or adding more boards
ZTE Confidential Proprietary copy 2012 ZTE CORPORATION All rights reserved 51
UMTS KPI Optimization Analysis Guide Internal Use Only
454 Optimization of Power Control
4541 Monitoring and Optimizing Downlink Power Control
Limited TCP in busy hours will not only increase access failures and call drops in the local cell but also increase soft handover failures and call drops in the neighboring cells Number of rejected services and DCH downlink TCP limit are intuitive KPIs to judge whether TCP is limited Although limited uplink capacity and massive UE moves in the rush hours may also cause call drops the limited TCP is absolutely a key factor
Based on the system algorithm MinHsdpaPower (MinHspaPwrRto) + NoHsPower gtNode B if the safety threshold is used (MinHsdpaPower means the power reserved for HSPA) then it will activate the downlink rate downgrade algorithm flow for the congestion (lower the downlink DCH rate) Although the rate downgrade can ensure access of some subscribers it is an irregular action and will degrade the performance
455 Speeding up Rate Downgrade
Considering that the cells with heavy load reject more access requests you can speed up the rate downgrade during the resource congestion to release the resources as soon as possible and avoid call drops caused by access failures (this method is only applicable to the cells with many PS service users but not those with only CS service users) Table 4-7 is an example of the parameter modification for the rate downgrade
Table 4-7 Example of Parameter Modification for Rate Downgrade
Abbreviation Parameter nameRange and
stepCurrent value
Update value
Remark
UlDnMaxStg Maximum Number of Degraded Uplink Load Steps Every Time
[1 8] 1 2 Downgrade from 384 Kbps to 16 Kbps
DlDnMaxStg Maximum Number of Degraded Downlink Load Steps Every Time
[1 8] 1 3 Downgrade from 384 Kbps to 8 Kbps
456 Monitoring and Optimizing Uplink Capacity
Handover Blocking Rate and RTWP can reflect the uplink capacity of the cell Because interference may also increase RTWP this factor should be distinguished during the RTWP monitoring Another effective indicator is the voice service erl If a cell has over 20 erls in busy hours you should pay special attention to it
ZTE Confidential Proprietary copy 2012 ZTE CORPORATION All rights reserved 52
UMTS KPI Optimization Analysis Guide Internal Use Only
457 Optimization of Uplink Capacity at the Whole Network Level
Case The uplink capacity was limited in a large number of sites after the cutover and the symptoms are a sharp rise of RTWP and a high call drop rate during the rush hours
After the following parameters were modified as shown in Table 4-8 the problem was solved
Table 4-8 Example of Power Control Parameter Modification
AbbreviationParameter
nameRange
Current value
Update value
ULINITSIRUplink Initial SIR target (dB)
UL 34 K136 K signaling UL 122 K AMR
4-5 35
ULMAXSIRMaximum Uplink SIR target (dB)
UL 34 K136 K signaling UL 122 K AMR
15 10
UlSirTargDnStepUplink SIR Target Down Step Size (dB)
UL 34 K136 K signaling UL 122 K AMR
01 02
458 Optimization of Uplink Capacity for a Single Cell
A lot of optimization measures can be taken to bring down the rising RTWP However with increasing subscribers the capacity may still be limited in some area while further modification of SirTarget will obviously degrade the call quality of the whole network and undermine the subscribersrsquo perception In this case you can adjust the power control parameters for a single site that has heavy traffic in the following way add one set of DivPc parameters and use this set of parameters only for this site
Case Table 4-9 shows an example of the power control parameter modification After this modification the call drop rate in the site with heavy traffic decreased to one quarter of the original one
Table 4-9 Example of Power Control Parameter Modification for Heavy-Traffic Cell
SRVTYPE ULINITSIR ULMAXSIR ULMINSIR
0 35-gt15 100-gt35 20-gt10
104 40-gt20 150-gt50 05-gt0
28 35-gt15 100-gt35 05-gt0
50 60-gt20 150-gt50 20-gt0
54 60-gt20 150-gt50 20-gt0
ZTE Confidential Proprietary copy 2012 ZTE CORPORATION All rights reserved 53
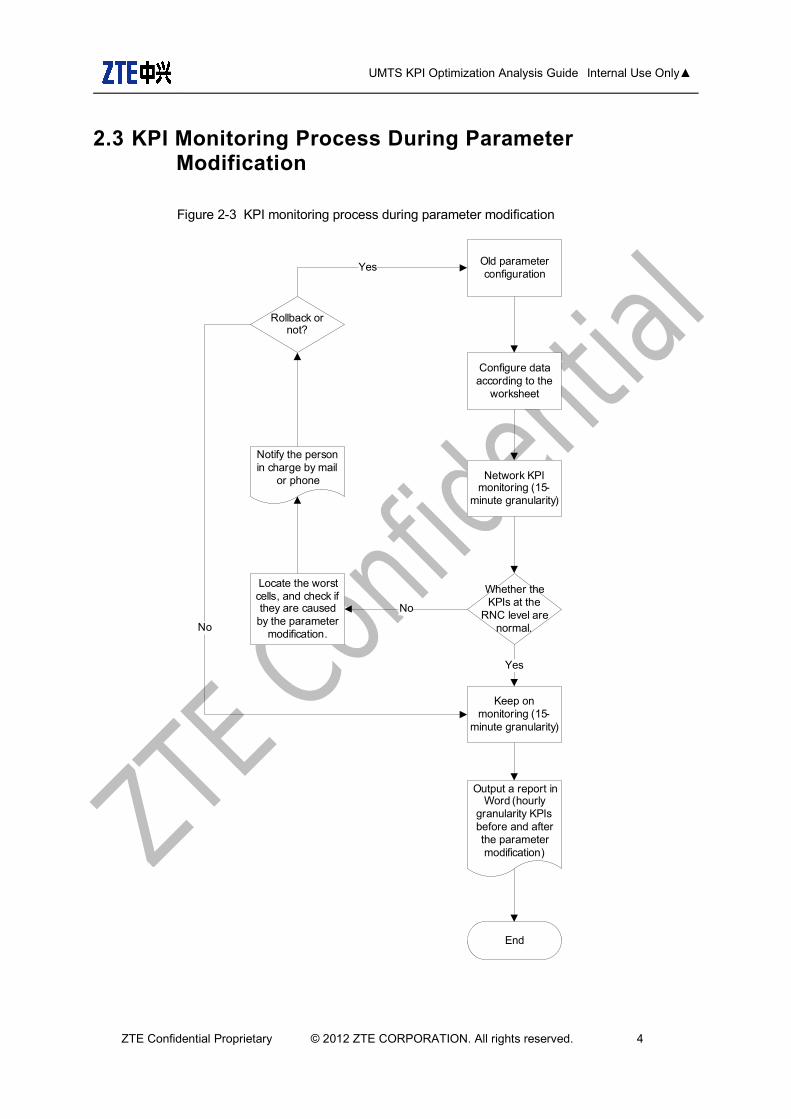
UMTS KPI Optimization Analysis Guide Internal Use Only
23 KPI Monitoring Process During Parameter Modification
Figure 2-3 KPI monitoring process during parameter modification
Old parameter configuration
Configure data according to the
worksheet
Network KPI monitoring (15-
minute granularity)
Whether the KPIs at the
RNC level are normal
Keep on monitoring (15-
minute granularity)
Output a report in Word (hourly
granularity KPIs before and after the parameter modification)
End
Yes
Notify the person in charge by mail
or phone
Rollback or not
Locate the worst cells and check if they are caused
by the parameter modification
No
Yes
No
ZTE Confidential Proprietary copy 2012 ZTE CORPORATION All rights reserved 4
Network KPI monitoring
( 15 minutes time granularity)
UMTS KPI Optimization Analysis Guide Internal Use Only
24 KPI Monitoring During RNC or NodeB Version Upgrade
Figure 2-4 KPI monitoring workflow during RNC or NodeB version upgrade
ZTE Confidential Proprietary copy 2012 ZTE CORPORATION All rights reserved 5
Yes
No
No
End
Locate the worst cells Determine whether they are related with the version update
Yes
Network KPI monitoring
( 15 minutes time granularity)
Execute the worksheet to
upgrade version
Output formal Word report (Compare the hourly granularity KPIs before and after the parameter modification and output the result every hour)
Whether the RNC-level
KPI is normal
Keep on monitoring (15 minutes granularity)
Send mail to or call the person in charge
Rollback or not
Current version
UMTS KPI Optimization Analysis Guide Internal Use Only
25 KPI Monitoring During Cutover
For the network on which the equipment needs to be replaced (for instance HongKong CSL network for which we replaced Nokiarsquos equipment with ZTErsquos) after the network optimization is completed the subscribers on the existing network should be cut over to our network gradually During the cutover there will be subscribers registering on our network constantly which will cause load increase on the network In this case we should watch KPI changes closely The monitoring process items method and report are the same as those described in section 24 ldquoKPI Monitoring During RNC or NodeB VersionUpgraderdquo Please read it for reference
3 KPI Analysis Methods
31 KPI Analysis Methods
Different network problems require different performance analysis methods Choose one or more appropriate methods after learning the running state of the existing network and the problems with it Common analysis methods are as follows
TOP N worst cells method Based on the traffic statistics indicators we care about (such as the call drop rate connection rate and soft handoff failure rate) choose N worst cells whose average indicator values in the peak hours or of the whole day are the lowest as the target of fault analysis and optimization Or prioritize objects of optimization against these indicator values
Time tendency chart method Tendency chart of indicator change is commonly used in the traffic analysis The analysis engineer can work out an hourly daily or weekly tendency chart of one or more indicators of the whole network a cluster or a single cell and find out the change rule of traffic statistics indicators
Regional location method The change of network performance indicators often occurs in some regions The indicators in these regions may be worsened by traffic increase traffic mode change radio environment change faults with a small number of stations or uplinkdownlink interference which will therefore affect the performance indicators of the whole network By comparing the network performance indicators before and after the change we can mark out the station or the sector with the greatest indicator change on an electronic map and take these problem regions as the analysis focus
Comparison method A single traffic statistics indicator may be affected by many factors While some factors change others may not Choose a proper object for comparison to confirm the existence of problems and then analyze the causes of the problems When examining an indicator do not care whether the absolute indicator value is high or low only pay more attention to whether the value is high or low compared to other indicators instead
ZTE Confidential Proprietary copy 2012 ZTE CORPORATION All rights reserved 6
UMTS KPI Optimization Analysis Guide Internal Use Only
311 TOP N Worst Cells Method
During the whole process of KPI optimization analysis TOP N worst cells analysis method is the most effective one which can be used throughout the whole optimization phase By focusing on the TOP N worst cells you can solve the major problems with the network Abnormal call drop events may happen every day and these events may represent problems of a kind After solving the problems with TOP N cells you can solve the problems of the same kind Therefore focusing on TOP N cells is one of the most effective ways to solve problems
TOP N worst cells analysis method is applicable to the optimization analysis of all the indicators Choose TOP N worst cells according to a certain threshold which varies depending on different indicators N stands for the number of the worst cells When the worst cells are too many to be worked on the number of the worst cells can be decreased so that you can focus on them TOP N cells analysis method includes the following steps
Step 1 Screen out TOP N cells according to the condition of the indicators you care about
Step 2 Conduct a health check for TOP N cells Check whether there are any problems with transmission or boards and check whether the worst cells are caused by external abrupt incidents such as terrible weather gatherings or holiday (because during gatherings and holidays the traffic is usually heavy)
Step 3 Check the radio parameters configuration of these cells the radius of these cells and their neighboring cells and compare them with the normal cells
Step 4 Export the indicator relevant most closely with the indicators you care about and analyze it to find the problem indirectly
For instance one day CS call drop rate of a whole network was high We analyzed the problem by the TOP N cells analysis method
Step 1 Screen out TOP N cells according to the condition of the indicators you care about
We used the CNO KPI analysis function to screen out TOP N cells (other tools can be also used) and selected 10 cells with the highest CS call drop rate
Table 3-1 List of CS TOP N Worst Cells
Index Cell RNS subnet ID Cell IDCall drop
rate CS AMRNumber of call
drop voice
1 ZBL1U-AI-1 (201) 12911 4158 553
2 ZBL1U-AI-3 (201) 12913 3955 545
3HKE1U-5H-1
(203) 30461 1556 370
ZTE Confidential Proprietary copy 2012 ZTE CORPORATION All rights reserved 7
UMTS KPI Optimization Analysis Guide Internal Use Only
Index Cell RNS subnet ID Cell IDCall drop
rate CS AMRNumber of call
drop voice
4HKE1U-5H-3
(203) 30463 1581 360
5LAK1U-9M-3
(202) 11063 339 282
6 HIC1U-9R-1 RNC101(101) 10891 226 216
7LAK1U-9M-1
(202) 11061 249 215
8EBP1U-9R-3
RNC101(101) 12823 230 205
9SRS1U-5H-1
RNC102-CSL(102)
12091 392 169
10HRM1U-6R-1
RNC102-CSL(102)
20671 341 167
Step 2 Check the transmission and hardware of the TOP N cells and check whether they are caused by external abrupt incidents such as terrible whether gatherings or holidays when traffic is usually heavy
And then we conducted a health check for each cell and paid attention to routine alarms and BPC board problems We found there were broken associations in some HKE sites
Step 3 Check the radio parameters configuration of these cells the radius of these cells and their neighboring cells and compare them with the normal cells
(1)Problem with the cell radius After the check we found the cell radius of the LAK site was 25 km Because the LAK site was situated by the sea and the antenna was placed very high the radius of 25 km was far from enough So we changed the cell radius to 10 km and the problem of high call drop rate was thus solved
(2)Problem with configuration HIC site is an indoor POI site The RRU RxTx port and the RRU Rx port were configured reversely which is the cause of high call drop rate After modifying HIC we found that signals of the second RRU were received by the Rx port So we changed the configuration of the RxTx port and the Rx port the problem of high call drop rate was thus solved
Figure 3-5 RF configuration at HIC site
Figure 3-6 Antenna energy distribution at HIC site
ZTE Confidential Proprietary copy 2012 ZTE CORPORATION All rights reserved 8
UMTS KPI Optimization Analysis Guide Internal Use Only
Step 4 Export the indicator relevant most closely with the indicators you care about and analyze it to find the problem indirectly
Table 3-2 Indicators Related with CS Call Drop
Index Cell
RAB release number for Iu connection
release request by UTRAN for CS domain in
cell radio connection with UE lost
RAB release number for Iu connection
release request by UTRAN for CS domain in cell failure in
the radio Interface
procedure
RAB release number for Iu connection
release request by
UTRAN for CS domain in
cell release due to
overload control
RAB release number for Iu connection
release request by
UTRAN for CS domain in
cell unspecified
failure
Average cell freq RTWP (dbm)
1ZBL1U-AI-1
482 43 0 29 -104177
2ZBL1U-AI-3
473 40 0 33 -104125
3HKE1U-5H-1
346 16 0 8 -105908
4HKE1U-5H-3
330 18 0 13 -1060777
5LAK1U-9M-3
69 196 0 18 -1031906
6HIC1U-9R-1
100 100 0 16 -1015404
7 LAK1U- 64 131 0 20 -1031934
ZTE Confidential Proprietary copy 2012 ZTE CORPORATION All rights reserved 9
UMTS KPI Optimization Analysis Guide Internal Use Only
Index Cell
RAB release number for Iu connection
release request by UTRAN for CS domain in
cell radio connection with UE lost
RAB release number for Iu connection
release request by UTRAN for CS domain in cell failure in
the radio Interface
procedure
RAB release number for Iu connection
release request by
UTRAN for CS domain in
cell release due to
overload control
RAB release number for Iu connection
release request by
UTRAN for CS domain in
cell unspecified
failure
Average cell freq RTWP (dbm)
9M-1
8EBP1U-9R-3
98 90 0 17 -101413
9SRS1U-5H-1
87 59 0 22 -1043528
10HRM1U-6R-1
42 111 0 13 -1027697
32 Basic KPI Analysis Skills
Be able to use the KPI statistics tool and the analysis tool
Use tools to learn about the running state of the whole network quickly and screen out TOP N worst cells quickly
Use different analysis tools to find problems from different aspects and locate the problem quickly
Understand the signaling process and basic principle
In the process of abnormity location keep a clear aim in mind and be able to apply the process and basic principle to check the other relevant indicators rapidly to facilitate the analysis
Be familiar with the process and basic principle and be able to make logical association between abnormal KPI problems and network problems (such as the coverage problem and the interference problem) Be able to determine the problem nature according to the abnormal KPI and then choose the appropriate tool to analyze the problem in depth
Performance analysis requires engineers to understand basic signaling process be familiar with the protocol stacks of standard interfaces and know relevant algorithms to realize the product functions Engineers should at least have a concept about the various algorithms If the analysis of a commercial network involves some algorithms engineers should study these algorithms in depth
ZTE Confidential Proprietary copy 2012 ZTE CORPORATION All rights reserved 10
UMTS KPI Optimization Analysis Guide Internal Use Only
321 KPI Monitoring Tools
minus Network management tool NetNumenT31 count KPI original data alarm data radio parameter configuration in cells and parameter configuration on the earth
minus KPI daily report generating tool classify key indicators according to a certain condition and screen out the worst cells
322 KPI Analysis Tools
minus CNO Tool CNO tool has the KPI analysis function So using it you can screen out the worst cells according to various conditions and point out the corresponding counter of an indicator
minus SignalTrace Trace the signaling (RNL signaling and RNL signaling) of RNC interfaces which includes the Iu interface the Iur interface the Iub interface and the Uu interface (the signaling flow between RNC and UE at RRC layer) And RNL signaling trace is a common way for locating the KPI problem Being able to trace the RNC signaling is a basic requirement for the on-site KPI optimization engineers and the network optimization and maintenance engineers This signaling tracing tool is very powerful which can trace signaling according to the UE cell and IMSI in the KPI analysis According to the UE cell it can trace the signaling of multiple subscribers while according to IMSI it can trace the signaling of only one subscriber However if the RRC connection is not established yet signaling cannot be traced That is because only when RRC connection has been established can the RNC obtain the subscriberrsquos IMSI from the CN
minus RNC ASS Log ASS log is usually applied when there is abnormity and RNC signaling is out of trace In this case use ASS log to analyze the signaling before and after the abnormity occurs Abnormity can be queried according to IMSI or cell ID ASS log can be also used to collect various abnormities
minus NodeB LMT NodeB local operation and maintenance tool Apart from all the operation functions of the OMCB this tool can collect more detailed information about cells and UE NodeB local maintenance terminals include EOMS EFMS DMS and PMS
minus NodeB Abnormity Probe On the site of WCDMA commercial office NodeB abnormity probe is an effective tool to monitor the running state of the NodeB Every module of NodeB can record the abnormal information automatically which makes it easy to locate problems However this method requires professional knowledge such as knowledge about the function and interface of each module or board If the on-site engineers cannot make the simple analysis they can just obtain the abnormity probe and send it to the RampD engineers at the rear side The abnormities reported on the NodeB will be stored at the OMCB server according to different RNCs To conduct NodeB
ZTE Confidential Proprietary copy 2012 ZTE CORPORATION All rights reserved 11
UMTS KPI Optimization Analysis Guide Internal Use Only
abnormity probe analysis you need to download abnormity probe files from different OMCB servers and then use the abnormity probe tool to make a comprehensive analysis
minus CTS Tool CTS is a tool developed by the CN department which can trace signaling in depth according to IMSI and trace signaling across RNCs So this is particularly suitable to trace VIP subscribers In this case CTS is easier to use than SignalTrace which can only trace signaling of RNCs one by one CTS can trace the interactive signaling between network elements (NEs) within the CN as well as the signaling of the Iu interface and the Uu interface This kind of signaling tracing is what we called in-depth tracing The work principle of CTS is to set up an IMSI task on the CTS server and send it to the CN front side which will then send this task to each CN module via the interfaces dedicated to the CN modules and the RNC and then each module after receiving the signaling related to the IMSI task will send the signaling back to the CTS server via the CN front side The interfaces mentioned above are private interfaces so this tool can only support our own CN and RNC CTS signaling can be checked and analyzed with an offline tool but the offline tool does not work very well because of the lack of continuous optimization and perfection
minus UE log DT test is also an important auxiliary way in analyzing KPI indicators There are many problems that cannot be located by tracing signaling at the network side and can only be located by the use of UE log The commonly used drive test software includes QXDMAPEX (QCAT) CNTCAN and TEMS CNTCAN and TEMS are often used for network optimization For the use of CNTCAN please refer to the corresponding help file and the instruction document publicly released by the Network Optimization Tool Department QXDM and the analysis tool APEX (QCAT) provided by Qualcomm is very powerful which have contributed a lot for the stability and maturity of our system for many years
33 General Process of KPI Optimization Analysis
Basic analyzing ideas
KPI optimization is a process to find and solve problems KPI optimization during the operation and maintenance stage is mainly to pick out the performance data that needs special attention from the OMC classify these performance data and then compare the value of these data with that required by the operator If the value of an indicator is lower than the operatorrsquos requirement analyze this indicator and find out the factor that affect the indicator and then propose a solution to the operator If the values are higher than the operatorrsquos requirement therersquos no need to pay special attention to them
KPI analysis is a process from the whole to the part
Step 1 Check the key indicators from the view of the whole network If there is not any
ZTE Confidential Proprietary copy 2012 ZTE CORPORATION All rights reserved 12
UMTS KPI Optimization Analysis Guide Internal Use Only
problem just ignore them Otherwise try to locate the RNC NE that has the problem
Step 2 Analyze the indicators of the corresponding RNC to find out the RNC whose indicators have the problem
Step 3 Analyze the indicators of the cell under the problem RNC to find out the worst cells or TOP N cells If the indicators of all the cells under the RNC are tend to be low it is a common problem probably caused by parameter configuration And then check whether the radio parameter configuration in the cells under this RNC is the same as that in the cells under the normal RNCs
Step 4 Make a comprehensive analysis on the KPIs alarms DT test data and customer complains of the worst cells to find out a solution
Analysis method
After learning the KPI analysis ideas we must know some common KPI analysis methods to rule out causes of problems from the obvious ones to the hidden ones
For example we found that the TCP code words were strictly limited at eight sites near a park and the call drop rate rose suddenly How to solve this problem
Method one First we checked whether the alarms transmission and boards of these sites were normal After they are proved all normal we sent some engineers to the site to do test And meanwhile we traced the RNC signaling at the OMC It turned out that the test result was normal and the indicators of these sites of that day did not have any problem and code words were not limited And later we knew from the news that there was a big gathering of about one million people at the park at that moment Until then we came to know that the congestion was caused by too many users using the network at the same time
Method two First because the eight sites went worse all of a sudden it was unlikely that the problem lied in the hardware Then we checked whether the radio parameters had been modified the day before The result is no worksheet had been issued to modify those parameters and no alarm was found at those sites Therefore we excluded the possibility of hardware problem Then we checked the traffic trend graph of the last few days (over seven days) and found that the high call drop rate might be caused by high traffic The graph showed that traffic of each site rose suddenly on the day before Thus we came to the conclusion that this was an abnormal abrupt event which may have been caused by a gathering And later we were told that there was a big gathering at the park So we were assured the code words limitation and high call drop rate at the eight sites were caused by too many subscribers using the network at the same time
By comparing the two methods above we can find that although the first one (sending engineers to the site without the consideration of abnormal events) is commonly used it is inefficient and costs more resource The second method (analyzing the problem by the means of exclusion and association) is more efficient From this case we would like to emphasize that KPI analysis is a process of problem exclusion Using the comprehensive
ZTE Confidential Proprietary copy 2012 ZTE CORPORATION All rights reserved 13
UMTS KPI Optimization Analysis Guide Internal Use Only
methods (like Method One) at the first brush may be making a detour
minus Exclusion method Check the alarms on the OMC to learn about the state of the RNC NodeB BPC board and the transmission If there are obvious broken link in transmission or hardware problem the cause of the problem is easy to locate
minus Incident association If the problem is with a great number of sites take abrupt incidents into account such as large-scale gathering terrible weather of incorrect operation These incidents will put influence of different levels and ranges on the network indicators
minus Comparison of radio parameters If some site goes wrong in a sudden check whether the radio parameter configuration of this site is consistent with that of other normal sites If not change it as that of the normal sites because the indicator decrease may be caused by an incorrect modification of radio parameters
minus Relevant indicators association If a certain indicator is in poor condition check its relevant indicators and find the common problem from these relevant indicators
minus Comprehensive problem location When the above reasons are excluded use DT data KPI data RNC signaling analysis data to locate the problem with indicators comprehensively
ZTE Confidential Proprietary copy 2012 ZTE CORPORATION All rights reserved 14
UMTS KPI Optimization Analysis Guide Internal Use Only
Figure 3-7 KPI optimization analysis process
StartPick out
performance indexes
RNC index abnormal
Equipment alarms exist
Deal with equipment alarms
RNC index recovers
Common problem with the
worst cells
Transmission softwarehardware version wireless
parameter configuration
CNRNC Transmission
Hardware Software Interference
Wireless parameters
Time range
Abrupt and self-curable abnormality
helliphellip
Analyze and record causes
Suggestion about improvement
Common problems analysis
Problem resolved
Successful call
Call drop Soft handover
23G alternate operation
PS rate helliphellip
Deal with the relevant problem
Indexes normal
End
Climate change holidays assembly
transmission interruption power
fault and so on
Y
N
Y
Y
N
Y
N
Abnormal indexes analysis in one cell
Y
N
N
N
Y
N
Y
Show TOPN abnormal cells
and their locations
If the problem is proved to be equipment bug or system problem after
several attempts feed it back to RampD dept
ZTE Confidential Proprietary copy 2012 ZTE CORPORATION All rights reserved 15
UMTS KPI Optimization Analysis Guide Internal Use Only
4 KPI Optimization Analysis This chapter mainly demonstrates how to analyze the indicator problems from the aspect of OMC data and provides flowcharts for KPI optimization The detailed analyzing method and cases of every special subject can be checked in the optimization guides of all the subjects
41 CS Call Drop Optimization
The CS call drop rate is the most important indicator in KPI optimization
411 Definition of Call Drop
After checking the signaling on the Uu interface at the UE side the engineer can judge the situation a call drop if the Uu interface message satisfies one of the following three conditions during the calling process (in connection)
RNC Release is not received but the UE condition changes from CELL_DCH to IDLE
RRC Release is received and the released cause value is Not Normal
One of the following three messages mdash CC Disconnect CC Release Complete and CC Release mdash is received and the released cause value is Not Normal Clearing or Not Normal Unspecified
In a board sense the call drop includes the call drop rates of CN and UTRAN The call drop of UTRAN includes the following two aspects
After the successful service establishment RNC sends the RAB Release Request to CN
After the successful service establishment RNC sends the IU Release Request to CN Later RNC receives the IU Release Command from CN
Note that RAN call drop statistics which is defined from the aspect of lu interface signaling means the launching times of RAB Release Request and lu Release Request of RNC And the DT call drop statistics is defined from the aspects of the Uu interface message non-access stratum message and cause value RAN call drop statistics and DT call drop statistics are not exactly the same
ZTE Confidential Proprietary copy 2012 ZTE CORPORATION All rights reserved 16
UMTS KPI Optimization Analysis Guide Internal Use Only
412 CS Call Drop Analysis Flowchart
Figure 4-8 CS call drop analysis flowchart
ZTE Confidential Proprietary copy 2012 ZTE CORPORATION All rights reserved 17
UMTS KPI Optimization Analysis Guide Internal Use Only
Extract performance data
CS TOP Ncell filtering
Analyze a single cell
1 Check NE alarms
2 Associate emergencies
3 Compare parameter
configurations
4 Associate indicators
5 Locate the fault
comprehensively
Exist or not
Handle alarms
Solved or not
Yes
Yes
End
No
No
Exist or not
Handle emergencies
Solved or not
Yes
No
No
Exist or not
Correct wrong parameter
configurations
Solved or not
Yes
No
No
List related indicator counters
Call-drop-related
countersRTWP
Handover success rate
Traffic volume
Resource limit indicators
Checkamp analysis of
interference
Optimizationanalysis of
handover failures
Optimization analysis of
resource limitCall-drop-
related counters
C301230362C301230363C301230365C301230315C301230316C301230318C301230319C301230322C301230323
Solved or not
Yes
Yes
No
Drive Test+RNC signaling
trace
Yes
ZTE Confidential Proprietary copy 2012 ZTE CORPORATION All rights reserved 18
UMTS KPI Optimization Analysis Guide Internal Use Only
42 PS Call Drop Optimization
421 Optimization Flowchart
Figure 4-9 PS call drop optimization flowchart
ZTE Confidential Proprietary copy 2012 ZTE CORPORATION All rights reserved 19
UMTS KPI Optimization Analysis Guide Internal Use Only
Extract performance data
PS TOP Ncell filtering
Analyze a single cell
1 Check NE alarms
2 Associate emergencies
3 Compare parameter
configurations
4 Associate indicators
5 Locate the fault
comprehensive ly
Exist or not
Handle alarms
Solved or not
Yes
Yes
End
No
No
Exist or not
Handle emergencies
Solved or not
Yes
No
No
Exist or not
Correct wrong parameter
configurations
Solved or not
Yes
No
No
List related indicator counters
Call -drop-related
countersRTWP
Handover success rate
Traffic volume
Resource limit indicators
Check amp analysis of interference
Optimizationanalysis of
handover failures
Optimization analysis of
resource limitCall -drop-
related counters
C301230372C301230373C301230375C301230330C301230332C301230333C301230334C301230337C301230338
Solved or not
Yes
Yes
No
Drive Test +RNC signaling
trace
Yes
ZTE Confidential Proprietary copy 2012 ZTE CORPORATION All rights reserved 20
UMTS KPI Optimization Analysis Guide Internal Use Only
43 Optimization of Accessibility Indicators
Accessibility performance includes the success rate of RRC connection setup and the success rate of CSPS RAB assignment These two kinds of KPIs play important roles in the network optimization and directly influence the success rate of CSPS service establishment In this document this kind of problems are found from the aspect of OMC data and solved through parameter optimization
431 Definition of Access Failure
For the mobile originated call in the CS domain the access failure event means that the UE sends RRC REQUEST and IE establish cause is Originating Conversational Call but alerting of the direct transfer message is not received
The relevant events are defined as follows in the access failure stage
RRC connection setup failure After considering the resending times and the waiting time the UE sends RRC CONNECTION REQUEST and does not receive the response from RNC or RRC CONNECTION REJECT delivered by RNC
Initial direct transfer and security mode establishment failure After sending RRC CONNECTION SETUP COMPLETE the UE does not send NAS SETUP
RAB assignment failure After receiving CALL PROCEEDING the UE does not receive RB SETUP delivered by RNC Or the UE replies with RB SETUP FAIL after receiving RB SETUP Or the UE receives DISCONNECT with the cause value not being Normal Release after receiving RB SETUP At this time the UE has not reported RB SETUP CMP
Failure after RAB assignment After the UE sends RB SETUP COMPLETE the originating UE receives DISCONNECTRELEASE from CN Or the UE waits CONNECT or ALERTING overtime and launches the Call Clearing process Or the UE becomes IDLE before receiving Alerting and starts to receive the system message
For the mobile terminated in the CS domain the access failure event means that the terminating UE receives the paging of paging type 1 and does not send RRC CONNECTION REQUEST with the cause value being Terminating Conversational Call Or the UE does not send the alerting of direct transfer message to CN after sending RRC CONNECTION REQUEST
The relevant events are defined as follows in the access failure stage
RRC connection setup failure After sending RRC CONNECTION REQUEST the UE does not receive the response from RNC or RRC CONNECTION REJECT delivered by RNC
Initial direct transfer and security mode establishment failure After sending RRC
ZTE Confidential Proprietary copy 2012 ZTE CORPORATION All rights reserved 21
UMTS KPI Optimization Analysis Guide Internal Use Only
CONNECTION SETUP COMPLETE the UE does not receive the SETUP direct transfer message Or the UE sends RELEASE COMPLETE Or the UE receives DISCONNECT from CN
RAB assignment failure The UE does not receive RB SETUP delivered by RNC after sending CALL CONFIRM Or the UE replies with RB SETUP FAIL after receiving RB SETUP Or the UE receives DISCONNECT with the cause value not being Normal Release after receiving RB SETUP At this time the UE has not reported RB SETUP CMP
Failure after RAB assignment After the UE sends RB SETUP COMPLETE the terminating UE receives DISCONNECTRELEASE from CN
432 Analysis on RRC Connection Failures
The problem of RRC connection setup failure can be analyzed through the UE signaling flow and RNC single-user tracing The RRC connection setup includes the following steps
The UE sends RRC Connection Request through the RACH channel
RNC sends RRC Connection Setup through the FACH channel
The UE sends RRC Connection Setup Complete through the dedicated uplink channel after the downlink dedicated channel is established and synchronized
RRC connection setup failures are always caused by following issues
Uplink RACH problem
Problem about downlink FACH power allocation proportion
Parameter reselection problem of the cell
Low downlink dedicated initial transmitting power
Uplink initial power control problem
Congestion
Equipment malfunctions
Among these issues the problems of uplink RACH downlink FACH power allocation proportion parameter reselection of the cell and equipment malfunctions appear more frequently
ZTE Confidential Proprietary copy 2012 ZTE CORPORATION All rights reserved 22
UMTS KPI Optimization Analysis Guide Internal Use Only
4321 Analysis Flowchart of RRC Connection Setup Failures
Figure 4-10 Analysis flowchart of RRC connection setup failures
ZTE Confidential Proprietary copy 2012 ZTE CORPORATION All rights reserved 23
UMTS KPI Optimization Analysis Guide Internal Use Only
Extract performance data
TOP Ncell filtering
Analyze a single cell
1 Check NE alarms
2 Associate emergencies
3 Compare parameter
configurations
4 Associate indicators
5 Locate the fault
comprehensive ly
Exist or not
Handle alarms
Solved or not
Yes
Yes
End
No
No
Exist or not
Handle emergencies
Solved or not
Yes
No
No
Exist or not
Correct wrong parameter
configurations
Solved or not
Yes
No
No
List related indicator counters
Counters related to RRC setup
failuresRTWP
Resource limit
indicators
Checkamp analysis of interference
Optimization analysis of
resource limitCounters related
to RRC setup failures
C301480485C301480486C301480487C301480489C301480490C301480491C301481288C301481289C301481337C301481338C301481339C301481407C301481408
Solved or not
Yes
Yes
No
Drive Test+RNC signaling
trace
Yes
ZTE Confidential Proprietary copy 2012 ZTE CORPORATION All rights reserved 24
UMTS KPI Optimization Analysis Guide Internal Use Only
4322 UE sends RRC Connection Request but RNC does not receive it
If the EcIo of downlink CPICH is relatively low it is the problem of coverage
If the EcIo of downlink CPICH is not very low (for example the value is larger than -14 dB) Usually it is the problem of RACH and the following issues may cause the problem
minus The power of Preamble does not rise to a required value and the rising times of Preamble should be increased
minus The output power of UE is lower than the required value which is caused by poor UE performance In this case the UE should be changed
minus The NodeB equipment has a standing wave and the engineer should check whether NodeB has any SWR alarm
minus The radius of the cell is set improperly If the radius parameter of the cell is set too small the NodeB can not synchronize the UE beyond the range of the radius and the access fails This problem often happens in the places with large coverage such as the rural areas and the suburbs
4323 RNC delivers RRC Connection Reject after receiving RRC Setup Request
When RRC Connection Reject appears the engineer should check the specific reject cause value Usually there are two kinds of causes
The CPU load of RNC control plane board is too heavy and more boards should be added
DCH and FACH admission is rejected However this situation does not always happen
4324 UE does not receive RRC Connection Setup delivered by RNC
This problem may be caused by the following reasons
Poor coverage
Improper parameters of cell selection and reselection
Checking method The engineer should check the EcIo of CPICH If the value is lower than -12 dB (EcIo is -12 dB by default) and there is no cell of better quality in the monitor set the cause of this problem is poor coverage If there is better cell in the monitor set cell reselection may cause this problem
Poor coverage can be improved by coverage enhancement such as adding some sites to cover the places without signal coverage and adjusting the engineering parameters If the coverage can not be improved the engineer can enhance the FACH power according to
ZTE Confidential Proprietary copy 2012 ZTE CORPORATION All rights reserved 25
UMTS KPI Optimization Analysis Guide Internal Use Only
the PCPICH EcIo coverage of the current network For example if all the pilot EcIo values are larger than -12 dB in the coverage area the power proportion of the common channel should be configured on the basis of the situation that the EcIo value is larger than -12 dB And so the success rate of the idle UE assessment can be ensured
As for the access problem caused by cell selection and reselection the engineer can speed up the cell selection and reselection by adjusting the cell selection and reselection parameters and the problem of RRC connection setup failure caused by improper cell selection and reselection parameters can be solved
Note
The RRC Connection Setup message is borne by FACH RRC Connection Request sent by the UE is received by UTRAN at the preamble of PRACH and then it is sent from the RACH channel based on the current preamble power And the transmit power of preamble can rise all the time until the response is received (There is a limitation for the maximum number of preamble retransmissions) Therefore in the areas with poor coverage the RACH coverage and FACH coverage may become unbalanced and as a result UTRAN can receive RRC Connection Request sent by the UE but the UE can not receive RRC Connection Setup sent by RNC
4325 UE receives RRC Connection Setup and does not send RRC Setup Complete
If the downlink signal quality is normal this problem may be caused by the abnormal condition of the cell phone
Another reason of this problem may be the downlink synchronization failure caused by the low initial power of downlink dedicated channel You can solve this problem by adjusting the service downlink EbNo
4326 RNC does not receive RRC Setup Complete sent by UE
Because the uplink initial power control may increase the UE transmit power this kind of problem seldom appears If it appears the engineer can increase the Constant Value of the dedicated channel properly to raise the uplink DPCCH initial transmission power of the UE
At the same time this problem is also relevant with the uplink SIR initial target value configuration because this value may affect the uplink initial synchronization at the initial stage of link setup If the value of the parameter is set too large there will be too much uplink inference brought by the initial setup of the link If the value is set too small the uplink synchronization will take longer time and the initial synchronization may even fail This parameter is an RNC-level parameter which has a great influence on network performance Therefore the engineer should be cautious while adjusting this parameter
ZTE Confidential Proprietary copy 2012 ZTE CORPORATION All rights reserved 26
UMTS KPI Optimization Analysis Guide Internal Use Only
Note
RRC Connection Setup Complete is sent through uplink DPCH and the UE calculates the initial power of uplink DPCCH according to the received IErdquoDPCCH_Power_offsetrdquo and the measured CPICH_RSCP value
DPCCH_Initial_power = DPCCH_Power_offset - CPICH_RSCP
DPCCH_Power_offset = Primary CPICH DL TX Power + UL Interference + Constant Value The Constant Value can be configured in the OMC If this value is set too small the UE may not have enough power to send RRC Connection Setup Complete
433 Analysis on RABRB Setup Failures
When RAB or RB setup fails RNC will send RAB Assignment Fail in the RAB Assignment Response signaling The engineer can find out the specific failure reason from the failure cause value carried in relevant cells The reasons for common RABRB setup failures include
RNC directly rejecting RAB Setup Request because of wrong parameter configuration
Admission reject
RAB setup failure because the UE fails to respond to RB Setup Request
RAB setup failure because the Uu interface fails to set up RB
ZTE Confidential Proprietary copy 2012 ZTE CORPORATION All rights reserved 27
UMTS KPI Optimization Analysis Guide Internal Use Only
4331 Analysis Flowchart of RAB Setup Failures
Figure 4-11 Analysis flowchart of RAB setup failures
ZTE Confidential Proprietary copy 2012 ZTE CORPORATION All rights reserved 28
UMTS KPI Optimization Analysis Guide Internal Use Only
Extract performance data
TOP Ncell filtering
Analyze a single cell
1 Check NE alarms
2 Associate emergencies
3 Compare parameter
configurations
4 Associate indicators
5 Locate the fault
comprehensively
Exist or not
Handle alarms
Solved or not
Yes
Yes
End
No
No
Exist or not
Handle emergencies
Solved or not
Yes
No
No
Exist or not
Correct wrong parameter
configurations
Solved or not
Yes
No
No
List related indicator counters
Counters related to RAB setup failures RTWP
Resource limit
indicators
Checkamp analysis of interference
Optimization analysis of
resource limitCounters related to RAB setup failures
CS domain PS domainC301230290 C301230302C301230291 C301230303C301230292 C301230304C301230293 C301230305C301230294 C301230306C301230295 C301230307C301230296 C301230308C301230297 C301230309C301230298 C301230310C301230299 C301230311C301230300 C301230312C301230301 C301230313
Solved or not
Yes
Yes
No
Drive Test+RNC signaling
trace
Yes
ZTE Confidential Proprietary copy 2012 ZTE CORPORATION All rights reserved 29
UMTS KPI Optimization Analysis Guide Internal Use Only
4332 RNC Directly Rejecting RAB Setup Request Because Of Wrong Parameter Configuration
The case that RNC responds with RAB Setup Failure directly is seldom caused by invalid parameter configuration in the business network Usually this case is caused by special operations of the special users
The main scenario is that the subscription information of the userrsquos PS service is beyond the capability of the UE which leads to the direct refusal from RNC For example a special userrsquos subscription rates of uplink and downlink are 384 K but the maximum uplink rate of the UE is only 64 K The maximum uplink and downlink rates of the QoS message used for activating PDP set by the AT command or mobile terminal software used by the user are 384 K so the RNC will find the maximum uplink rate is beyond the UErsquos capability directly reply with RAB Setup Failure and will not launch the RB setup process when it receives RAB Assignment Request
After the RAB setup fails because the parameter configuration is beyond the UErsquos capability SGSN will negotiate again to launch the new RAB assignment until the UE has the capability to support the assignment and the RAB assignment is finished For the users the PDP activation is still successful and the actual maximum rate is the maximum rate the UE can support
However if the minimum guaranteed bit rate required by the QoS setting in the UErsquos PDP activation request is beyond the UErsquos capability though the network negotiates a lower rate to accept the UErsquos PDP activation request the UE will launch the request of deactivating PDP when it finds that the rate negotiated by the network in PDP activation accept request is lower than the minimum guaranteed bit rate and finally the PDP activation can not be completed
4333 Admission Reject
For the non-HSDPA user if there are insufficient system resources (including power channel code lub transmission resource and CE) the call establishment failure will be caused by the admission reject At this time it is necessary to check the network load code resource lub transmission resource and CE resource occupation to make sure the congestion is caused by the limitation of a certain kind of resource What is more the engineer should plan the corresponding expansion method
If the cell does not support the HSDPA service the R99 user admission is judged according to the fixed R99 admission threshold If the cell supports the HSDPA service and the HSDPA and R99 dynamic power is allocated the uplink admission of non-HSDPA is judged based on RTWP or the equivalent user number If the uplink load is too heavy the non-HSDPA user admission will also fail
If the bandwidth configuration on the lub interface is insufficient the lub interface will reject the R99 data service activation because of limited bandwidth
ZTE Confidential Proprietary copy 2012 ZTE CORPORATION All rights reserved 30
UMTS KPI Optimization Analysis Guide Internal Use Only
The admission control of the NodeB Credit resource is similar to the power admission control Whether the remaining Credit can support the currently requested service or not can be judged according to the spectrum spreading factor of the new access user According to the condition of the RAB Downsizing Switch RNC will deal with the issue in the corresponding way
For the HSDPA user in the dynamic power allocation mode besides the mentioned system resources such as the power channel code lub transmission resource and CE the admission reject should take into consideration whether the number of H users supported by NodeB and the number of H users supported by the cell are over the regulated threshold or not into consideration
For the HSDPA user when the bandwidth configuration on lub interface is insufficient the admission reject will not happen but the rate will be reduced What is more the AAL2PATHs of HSDPA and R99 are configured respectively and the HSDPA AAL2PATH must be configured to the HSDPA_RT or HSDPA_NRT type If the HSDPA AAL2PATH is configured to RT or NRT of R99 AAL2PATH type the RAB assignment failure will not happen but RNC will establish the HSDPA service as R99 384 Kbps
For the downlink power admission
Besides whether the R99 service load is over the non-HSDPA service threshold DCH service should take into consideration whether non-HSDPA power and HSDPA GBP (the minimum power needed for the guaranteed bit rate) are over the general power threshold of the cell
For the HSDPA service it is necessary to check whether the throughput rate provided by the cell is over the sum of all the usersrsquo GBR thresholds or whether the GBPs of the stream service and the background service are over the HSDPA power of the cell At the same time whether the non-HSDPA power and the HSDPA GBP (the minimum power needed for the guaranteed bit rate) are over the overall power threshold of the cell should be also taken into consideration
For the lub admission
For the DCH service the admission is made according to the multiplication of the peak rate and the service activation factor
For HSDPA service the admission is made according to the GBR
If the lub exceeds the congestion threshold the DCCC rate reduction will be triggered And if the RLC_AM retransmission rate is over a certain threshold the Iub Overbooking switch can be opened to trigger the TF which limits R99 or to reduce the rate of HSDPA service by a certain factor
ZTE Confidential Proprietary copy 2012 ZTE CORPORATION All rights reserved 31
UMTS KPI Optimization Analysis Guide Internal Use Only
4334 RAB Setup Failure Because the UE Fails to Respond to RB Setup
The UE fails to respond to RB setup mainly because of the userrsquos operation
Take the following cases as examples
When the user already has had the downlink 12 K data service he receives RB Setup Request of the VP service (either the originated call in the VP domain or the terminated call in the VP domain) Because the UE does not support the VP and high-speed PS service in the downlink at the same time it directly replies with RB Setup Failure and the cause value is unsupported configuration
Compared with the WCDMA subscriber originating the VP service the terminating subscriber resides in the GSM network and so it does not support the VP service After RNC receives RAB Assignment Request the core network will deliver the Disconnect command right after call proceeding and the cause value is Bearer capability not authorized At this time the UE has just received the RB SETUP command and has no enough time to finish the RB setup So the UE will reply with RB Setup Failure after it receives the Disconnect command and the RNC will reply with RAB Setup Failure with the cause value being failure in radio interface procedure
4335 RAB Setup Failure Because the Uu Interface Fails to Set Up RB
RNC sends the Radio Bearer Setup command to the UE but fails to receive Radio Bearer Setup Compete This kind of situation (RB setup failure) often appears in the cells with weak signals There are two causes of weak signals one is that the UE does not reside in the best server to launch the access and the other is poor coverage
If the UE does not reside in the best server to launch the access it will hope to enter the best server through active set update in the RB setup process (At the same time the fast signal change will drastically weaken the signals in the cell) but the active set update can only be processed after the RB setup is completed because the procedures can not be processed alternately (Neither the network nor the terminal supports it) Therefore RB can only be set up in the cell with weak signals and the setup is easy to fail As for this situation the starting threshold and speed of co-frequency cell reselection should be increased to make the UE reside in the best server and launch the access as soon as possible
RB setup failure may be caused by the poor downlinkuplink coverage If the failure is caused by downlink coverage the UE can not receive the Radio Bearer Setup command which may be caused by the uplink interference and this can be fixed through checking RTWP The poor downlink coverage is partly caused by the bad UE demodulation performance and other causes should be solved by RF optimization
ZTE Confidential Proprietary copy 2012 ZTE CORPORATION All rights reserved 32
UMTS KPI Optimization Analysis Guide Internal Use Only
44 Optimization of Mobility Indicators
Mobility indicators mainly fall into three categories mdash soft handovers hard handovers and inter-RAT handovers The handover problems usually happen in the following cases
The best server changes too fast or there is no best server due to pilot pollution
The handover is not prompt or there are pingpong handovers due to improper parameter configuration
Adjust the engineering parameters for antennas in areas with severe pilot pollution And adjust the handover parameters such as the values of 1A 1B CIO TTT (time to trigger) Hysteresis and so on to solve the problem that the handover is not prompt or there are pingpong handovers This section tries to solve this kind of problems through OMC data analysis and parameter optimization
441 Optimization of Soft Handovers
Missed neighboring cell configuration pilot pollution improper soft handover parameter configuration and equipment malfunctions are the major causes of soft handover failures To confirm the problems the field DTs are required
ZTE Confidential Proprietary copy 2012 ZTE CORPORATION All rights reserved 33
UMTS KPI Optimization Analysis Guide Internal Use Only
4411 Soft Handover Optimization Flowchart
Figure 4-12 Soft handover optimization flowchart
ZTE Confidential Proprietary copy 2012 ZTE CORPORATION All rights reserved 34
UMTS KPI Optimization Analysis Guide Internal Use Only
Extract performance data
TOP Ncell filtering
Analyze a single cell
1 Check NE alarms
2 Associate emergencies
3 Compare parameter
configurations
4 Associate indicators
5 Locate the fault
comprehensive ly
Exist or not
Handle alarms
Solved or not
Yes
Yes
End
No
No
Exist or not
Handle emergencies
Solved or not
Yes
No
No
Exist or not
Correct wrong parameter
configurations
Solved or not
Yes
No
No
List related indicator counters
RTWPResource
limit indicators
Checkamp analysis of interference
Optimization analysis of
resource limitCounters related to intra-frequency
handover failures
C301391101 C301390593C301391102 C301390594C301391103 C301390595C301390586 C301390596C301390587 C301390597C301390588 C301390598C301390589 C301390599C301390590 C301390600C301390591 C301390601C301390592 C301390602
Solved or not
Yes
Yes
No
Drive Test+RNC signaling
trace
Yes
Counters related to soft handover
failures
30055 3005630057 3005830059 3006030061 30062
Cell hand-inhand-out indicators
ZTE Confidential Proprietary copy 2012 ZTE CORPORATION All rights reserved 35
UMTS KPI Optimization Analysis Guide Internal Use Only
4412 Checking Missed Neighboring Cell Configuration
Generally speaking most of the call drops at the beginning of the optimization are caused by missed neighboring cell configuration The following methods are often used to judge whether the call drops are caused by missed configuration of co-frequency neighboring cells
Observe the active set EcIo information recorded by the UE and the Best Server EcIo information recorded by the Scanner before the call drop If the former record is very bad but the latter record is very good then check whether the Best Server scrambling code recorded by the Scanner appears in the latest list of the neighboring cells under intra-frequency measurement control If it does not then the call drop is caused by missed neighboring cell configuration
If the UE re-accesses immediately after the call drop and the cell scrambling codes during the UE reaccess and those during the call drop are different then the call drop may also be caused by missed neighboring cell configuration You can confirm it through measurement control (look backwards from the message of the call drop event for the latest intra-frequency measurement control message and check the neighboring cell list of this message)
Some UE may report the Detected Set information If the corresponding scrambling code appears in the Detected Set information before the call drop then the call drop is caused by missed neighboring cell configuration
4413 Checking Pilot Pollution
Definition of pilot pollution Excessive strong pilot signals exist at a certain point but none of them is strong enough to be the best server To form pilot pollution the following points in this definition should be satisfied
Strong pilot signal The absolute pilot signal strength is used to judge whether the pilot signal is a strong one The pilot signal strength can be evaluated through the pilot RSCP If the pilot RSCP exceeds a threshold it is considered a strong pilot signal The formula is
AbsoluteRSCPThRSCPCPICH __ gt
Excessive The number of pilot signals is used to judge whether there are excessive pilot signals at a certain point If the number exceeds a threshold it is regarded that excessive pilot signals exist at this point The formula is
NThNumberCPICH gt_
None of them is strong enough to be the best server The relative strength of a pilot signal is a key factor in judging whether the pilot signal is strong enough Based on the above definition and formulae if the difference between the strength of the
ZTE Confidential Proprietary copy 2012 ZTE CORPORATION All rights reserved 36
UMTS KPI Optimization Analysis Guide Internal Use Only
strongest pilot signal and that of the )1( +NTh strongest pilot signal at this point is
less than a threshold it is regarded that there is no pilot signal strong enough to be the best server at this point The formula is
lativeRSCPthThbest ThRSCPCPICHRSCPCPICHN Re_)1( )__( ltminus +
According to the above description it is regarded that pilot pollution exists if the following conditions are both satisfied
The number of pilot signals that meet the condition
AbsoluteRSCPThRSCPCPICH __ gt is more than NTh
lativeRSCPthThbest ThRSCPCPICHRSCPCPICHN Re_)1( )__( ltminus +
For example during the network optimization suppose
dBmTh AbsoluteRSCP 95_ minus= 3=NTh and dBTh lativeRSCP 5Re_ = if the following
conditions are both satisfied then it is regarded that pilot pollution exists
The number of the pilot signals that meet the condition
dBmRSCPCPICH 95_ minusgt is more than 3
dBRSCPCPICHRSCPCPICH thbest 5)__( 4 ltminus
4414 Adjusting Soft Handover Algorithm Parameters
You can solve the following kinds of problems by adjusting handover algorithm parameters
1 The handover is not prompt
From the perspective of the CS service signaling flow the symptom of this problem is that the UE cannot receive Active Set Update (physical channel reallocation in the case of the intra-frequency hard handover) because after the UE reports the measurement report the source cell has a fast reduction in EcIo When the RNC sends Active Set Update the UE has closed the transmitter due to the loss of downlink synchronization Viewed from the UE side it cannot receive Active Set Update In the PS services if the UE cannot receive Active Set Update or TRB resets before the handover the handover will also fail
From the perspective of signals the following phenomena may accompany this problem
ZTE Confidential Proprietary copy 2012 ZTE CORPORATION All rights reserved 37
UMTS KPI Optimization Analysis Guide Internal Use Only
minus Corner effect EcIo of the source cell decreases drastically and EcIo of the target cell increases sharply (very high when it appears)
minus Fast fading EcIo of the source cell decreases quickly for a while and then increases and EcIo of the target cell increases for a short while
2 Pingpong handovers The following phenomena may accompany this problem
The best server changes quickly Two or more cells take turns to be the best server But as the best server none of the cells can last long though they has good RSCPs and EcIos
There is no best server There are multiple cells Their RSCPs are normal and similar to each other But EcIo of every cell is very bad
From the perspective of the signaling flow Event 1A is reported immediately after one cell is deleted Because the UE cannot receive Active Set Update from the RNC the handover fails
4415 Equipment Malfunctions
First check the alarm console to see whether there are abnormal alarms and analyze the message traces at the same time Find out in which step the soft handover fails Check the failure message and contact the local product maintaining engineer to confirm whether the equipment has malfunctions
4416 Solutions
Corresponding adjustments should be taken for the confirmed problems
Handover failures caused by pilot pollution Adjust the engineering parameters of a certain antenna to set this antenna as the best server in this interfered location If the power of one of its sectors is reduced then Io of the pilot pollution area will decrease even if the powers of other pilots are not adjusted EcIo will also increase Thereby the EcIo differences with other scrambling codes in the active set will become larger and pilot pollution will be eliminated Through a lot of research ZTE has proved that the reduction in the pilot transmit power will not change cell capacity greatly If condition allows new base stations can be added to cover this area
Equipment malfunctions Consult the customer service engineers and ask them to help check whether there are alarms and whether the transport layer is abnormal If there are alarms coordinate with the customer service engineers and the engineering personnel to solve the problems
Call drops because the handovers are not prompt
ZTE Confidential Proprietary copy 2012 ZTE CORPORATION All rights reserved 38
UMTS KPI Optimization Analysis Guide Internal Use Only
minus Adjust the antenna to expand the handover zone
minus Configure the Event 1A handover parameters to make the handover easier to happen
minus Increase CIO to make the handover happen earlier in the target cell The sum of CIO and the actually measured value is used for judging the UE events including the UE intra-frequency handover CIO helps shift the cell border in the handover algorithm If CIO is configured with a larger value the handover will be easier to happen and there will be more UE in the soft-handover status but more resources will be occupied If CIO is configured with a smaller value the soft handover will be more difficult to happen and the receiving quality may be impaired A CIO of about 5dB is quite good for eliminating the fast fading and the corner effect but this configuration has some side effects such as the increase of handover proportion
Call drops caused by pingpong handovers Adjust the antenna to form a best server in its coverage zone or set the Event 1B handover parameters (increase the threshold of Event 1B the Event 1B hysteresis or the time to trigger Event 1B) to increase the difficulty in deleting the active set
442 Optimization of Hard Handovers
4421 Classification of Hard handovers
Hard handovers mainly fall into two classifications
Intra-frequency hard handovers The intra-frequency hard handover is triggered only when the intra-frequency softsofter handover cannot be performed and it is applicable to the following circumstances
minus Inter-RNC intra-frequency cell handovers when there is no Iur interface
minus Insufficient Iur interface resources though there is the Iur interface
minus Handovers controlled by the threshold of the PS service rate in the handover cell
The intra-frequency softsofter handovers can not be performed (intra-frequency hard handover should be triggered) in the following scenarios
minus When the intra-frequency handover happens the UE is using the transmit diversity in the active set cell but the target cell does not support the transmit diversity
minus The intra-frequency measurement report does not contain OFF and TM of the
ZTE Confidential Proprietary copy 2012 ZTE CORPORATION All rights reserved 39
UMTS KPI Optimization Analysis Guide Internal Use Only
target cell
minus When the intra-frequency handover happens between RNCs the Iur interface is unavailable
minus The UE performs the multiuser detection in the active set cell but the target cell does not support the multiuser detection
minus The target cell and the original cell belong to different classifications (The cells of R99 R5+R99 and R6+R5+R99 belong to the same classification while the cells of R5 and R6+R5 belong to another classification)
Inter-frequency hard handovers The inter-frequency hard handover means a UE connection is handed over from a cell of a UTRAN frequency to a cell of another frequency Many factors including the radio quality the load and the speed of the moving UE may trigger inter-frequency hard handovers
For example the radio quality triggers the inter-frequency hard handover in the following way
When the quality of the UE radio frequency becomes lower the inter-frequency measurement will be triggered and according to the measurement result the UE connection will be handed over to a better frequency
ZTE Confidential Proprietary copy 2012 ZTE CORPORATION All rights reserved 40
UMTS KPI Optimization Analysis Guide Internal Use Only
4422 Hard Handover Optimization Flowchart
Figure 4-13 Hard handover optimization flowchart
ZTE Confidential Proprietary copy 2012 ZTE CORPORATION All rights reserved 41
UMTS KPI Optimization Analysis Guide Internal Use Only
Extract performance data
TOP Ncell filtering
Analyze a single cell
1 Check NE alarms
2 Associate emergencies
3 Compare parameter
configurations
4 Associate indicators
5 Locate the fault
comprehensive ly
Exist or not
Handle alarms
Solved or not
Yes
Yes
End
No
Exist or not
Handle emergencies
Solved or not
YesNo
Exist or not
Correct wrong parameter
configurations
Solved or not
Yes
No
No
List related indicator counters
RTWPResource
limit indicators
Checkamp analysis of interference
Optimization analysis of
resource limit
Counters related to inter-frequency handover failures
C301110489 C301110516C301110499 C301110517C301110500 C301110518C301110501 C301110519C301110502 C301110520C301110503 C301110521C301110504 C301110522C301110505 C301110523
Solved or not
Yes
Yes
No
Drive Test+RNC signaling
trace
Yes
Counters related to hard handover
failures
30041 3004230043 3004430045 3004630047 30048
Cell hand-inhand-out indicators
NoNo
ZTE Confidential Proprietary copy 2012 ZTE CORPORATION All rights reserved 42
UMTS KPI Optimization Analysis Guide Internal Use Only
4423 Hard Handover Optimization Methods
The optimization flow for the hard handover is similar to that of the soft handover The major differences are in the parameter optimization To optimize intra-frequency hard handovers you can properly reduce the Event 1D hysteresis and the time to trigger Event 1D according to the real radio environment to ensure timely handovers
Inter-frequency coverage is often applied to some special scenarios such as indoor coverage and tested through CQT The method of judging whether there is missed configuration of the inter-frequency neighboring cell is almost the same as that of the co-frequency neighboring cell when a call drop occurs the UE fails to measure or report the inter-frequency neighboring cell after the call drop the UE resides in the inter-frequency neighboring cell again
The common hard handover problems are
1 The handover is not prompt The common symptoms are frequent call drops in the hard handovers when the UE moves
Solutions
Increase the threshold of activating the compressing mode The compressing mode is usually activated before the inter-frequency handover or the inter-RAT handover and it is used to measure the quality of the inter-frequency or inter-RAT cell You can set a threshold of the CPICH RSCP or EcIo to activate the compressing mode And the RSCP is widely used
minus Requirements on setting the threshold of activating the compressing mode Before the cell quality becomes low enough to cause a call drop the signal of the target cell should be measured and reported and the handover should be performed
minus Requirement on setting the threshold of deactivating the compression mode Frequent activationdeactivation of the compression mode should be avoided
Increase CIOs of the inter-frequency cell pair
Reduce the threshold of triggering the target frequency handover under the inter-frequency coverage
2 There are pingpong handovers
Solution Increase the hard handover hysteresis and the time to trigger the event
ZTE Confidential Proprietary copy 2012 ZTE CORPORATION All rights reserved 43
UMTS KPI Optimization Analysis Guide Internal Use Only
443 Optimization of Inter-RAT Handovers
4431 Configuring Basic Inter-RAT Parameters
Most of the inter-RAT handover failures are caused by incomplete parameter configuration The following parameters need special attention
Complete RNC parameter configuration for the GSM neighboring cell The 2G system shall provide the 3G system with the correct radio parameters based on negotiation mdash MCC MNC LAC ID (CI) NCC BCC frequency band indicator (900 or 1800) and BCCH
Table 4-3 Parameters That 2G Shall Provide to 3G
MCC MNC LACIDCI
NCC BCCFrequency
band indicator
BCCH
460 2 202 193 0 0 900 102
Complete GSM BSC parameter configuration for the WCDMA neighboring cell The 3G system shall provide the 2G system with the correct radio parameters based on negotiation mdash MCC MNC LAC RNC ID cell ID (C_ID) downlink frequency scrambling code and RAC
Table 4-4 Parameters That 3G Shall Provide to 2G
MCC MNC LACRNC
IDCell IDC_ID
Downlink frequency
Scrambling code
RAC
460 3 20 18 51 10787 51 20
According to the current strategy of one-way inter-RAT handovers if the parameter configuration is complete one probable cause of the inter-RAT handover failure is that the handover is not prompt The common parameter adjustment is to increase CIO the threshold to activatedeactivate the compressing mode and the threshold to trigger the WCDMA-to-GSM handover at the same time
Call drops during the inter-RAT handovers between WCDMA and GSM may be caused by
minus Inconsistent data configuration at the GSM side and the WCDMA side after GSM modifies the configuration data but does not inform WCDMA
minus Missed configuration of neighboring cells which can be solved by the correct configuration of neighboring cells
minus Too fast signal changes
ZTE Confidential Proprietary copy 2012 ZTE CORPORATION All rights reserved 44
UMTS KPI Optimization Analysis Guide Internal Use Only
minus Pingpong reselection
minus Faults with the UE for example the UE fails to respond to the handover or report the inter-RAT measurement report
minus Changes of the best server during the physical channel reallocation
minus Wrong LAC configuration which can be located through data configuration check
ZTE Confidential Proprietary copy 2012 ZTE CORPORATION All rights reserved 45
UMTS KPI Optimization Analysis Guide Internal Use Only
4432 Inter-RAT Handover Optimization Flowchart
Figure 4-14 Inter-RAT handover optimization flowchart
ZTE Confidential Proprietary copy 2012 ZTE CORPORATION All rights reserved 46
UMTS KPI Optimization Analysis Guide Internal Use Only
Extract performance data
TOP Ncell filtering
Analyze a single cell
1 Check NE alarms
2 Associate emergencies
3 Compare parameter
configurations
4 Associate indicators
5 Locate the fault
comprehensive ly
Exist or not
Handle alarms
Solved or not
Yes
Yes
End
No
No
Exist or not
Handle emergencies
Solved or not
Yes
No
No
Exist or not
Correct wrong parameter
configurations
Solved or not
Yes
No
No
List related indicator counters
RTWPResource
limit indicators
Checkamp analysis of interference
Optimization analysis of
resource limitCounters related to inter-RAT handover failures
C301130667 C301130681C301130668 C301130682C301130669 C301130690C301130670 C301130691C301130671 C301130692C301130672 C301130693C301130673 C301130694C301130674 C301130696C301130675 C301130697C301130677 C301130698C301130678 C301130699C301130679 C301130700
C301130680
Solved or not
Yes
Yes
No
Drive Test+RNC signaling
trace
Yes
Counters related to inter-RAT handover
failures
Cell hand-inhand-out indicators
30049 3005030051 3005230053 30054
ZTE Confidential Proprietary copy 2012 ZTE CORPORATION All rights reserved 47
UMTS KPI Optimization Analysis Guide Internal Use Only
45 Optimization of Resource Indicators
The resource indicators directly reflect the system capacity Increasing subscribers will consume more system resources and some resources may be limited for example the code resource may be limited the TCP access request may be rejected and the CE resource usage rate may exceed the threshold Limited system resources have a negative influence on the whole-network indicators and the subscribersrsquo perception for example call drops may frequently happen and more TCP access requests may be rejected during the voice services
Table 4-5 Resource KPIs and Alarm Thresholds
Resource type KPI No and nameAlarm
threshold
TCP
C301320150 Number of rejected services DCH downlink TCP limit
50
PI30167 Average non-HS (SOA) (SOA)DPA TCP 40
PI30092 Maximum Cell TCP () 100
PI30093 Average Cell TCP 70
UL TrafficPI30029 Handover Blocking Rate 05
KPI RTWP (in busy hour) -98 dBm
Code
C301320153 Number of rejected services DCH no code
50
PI30205 Average Cell HSUPA Users 12
PI30172 Cell Average HSDPA Users 16
CE
PI301830006 Maximum use Ratio of Uplink NodeB CE
60
PI301830010 Maximum use Ratio of Downlink NodeB CE
60
ZTE Confidential Proprietary copy 2012 ZTE CORPORATION All rights reserved 48
UMTS KPI Optimization Analysis Guide Internal Use Only
451 Resource Indicator Optimization Flowchart
Figure 4-15 Resource indicator optimization flowchart
ZTE Confidential Proprietary copy 2012 ZTE CORPORATION All rights reserved 49
UMTS KPI Optimization Analysis Guide Internal Use Only
Extract performance data
TOP Ncell filtering
Analyze a single cell
1 Check NE alarms
2 Associate emergencies
3 Compare parameter
configurations
4 Associate indicators
5 Locate the fault
comprehensive ly
Exist or not
Handle alarms
Solved or not
Yes
是
End
No
No
Exist or not
Handle emergencies
Solved or not
Yes
No
No
Exist or not
Correct wrong parameter
configurations
Solved or not
Yes
No
No
List related indicator counters
Code resource indicators
CE resource indicators
TCPadmission
reject counter
C301320150
Solved or not
Yes
Yes
No
Drive Test+RNC signaling
trace
Yes
Counter related to TCP limit
Cell TX power
indicators
30090 3009130092 3009330166 3016730168 3016930170 30171
30163301643016530075
30223302243045030451
Yes
Yes
ZTE Confidential Proprietary copy 2012 ZTE CORPORATION All rights reserved 50
UMTS KPI Optimization Analysis Guide Internal Use Only
452 Code Resource Optimization
The statistics of Number of rejected services and DCH no code the average code resource usage rate and the number of the HSDPA subscribers can be used to judge whether the code resource in a cell is limited If the code resource is limited you can adjust the code resource allocation to alleviate the situation
Based on the system algorithm when Formula 1 is satisfied you can add an HS-PDSCH when Formula 2 is satisfied then an HS-PDSCH is deleted
Formula 1 OcuRateNoHspdsch + OcuRateHspdsch + DpchCodeHy + 32 lt= 512
Formula 2 OcuRateNoHspdsch + OcuRateHspdsch + CodeUptHyA gt 512
OcuRateHspdschHSPDSCH means the number of the codes of SF=512 blocked by the HS-PDSCH OcuRateNoHspdsch means the number of codes of SF=512 blocked by other channels DpchCodeHy means the number of codes of SF=512 reserved for the DPCH and CodeUptHyA is the threshold to decide whether to delete the HSPDSCH
Therefore to ensure the access of the R99 subscribers you can make some adjustment according to Table 4-6 when the code resource is limited though the HSDPA rate may decrease
Table 4-6 Adjusting Code Resource Allocation
AbbreviationParameter
nameRange
and stepCurrent value
Update value
Remark
DpchCodeHy DPCH Code Hysteresis
0512 16 28
To decrease the number of rejected services for DCH no code
CodeUptHyACode Update Hysteresis A
0512 16 28
To decrease the number of rejected services for DCH no code
453 Monitoring CE Resource
The CE resource is mainly monitored through the maximum UE uplinkdownlink usage rate If there is any problem you can solve it by controlling the load or adding more boards
ZTE Confidential Proprietary copy 2012 ZTE CORPORATION All rights reserved 51
UMTS KPI Optimization Analysis Guide Internal Use Only
454 Optimization of Power Control
4541 Monitoring and Optimizing Downlink Power Control
Limited TCP in busy hours will not only increase access failures and call drops in the local cell but also increase soft handover failures and call drops in the neighboring cells Number of rejected services and DCH downlink TCP limit are intuitive KPIs to judge whether TCP is limited Although limited uplink capacity and massive UE moves in the rush hours may also cause call drops the limited TCP is absolutely a key factor
Based on the system algorithm MinHsdpaPower (MinHspaPwrRto) + NoHsPower gtNode B if the safety threshold is used (MinHsdpaPower means the power reserved for HSPA) then it will activate the downlink rate downgrade algorithm flow for the congestion (lower the downlink DCH rate) Although the rate downgrade can ensure access of some subscribers it is an irregular action and will degrade the performance
455 Speeding up Rate Downgrade
Considering that the cells with heavy load reject more access requests you can speed up the rate downgrade during the resource congestion to release the resources as soon as possible and avoid call drops caused by access failures (this method is only applicable to the cells with many PS service users but not those with only CS service users) Table 4-7 is an example of the parameter modification for the rate downgrade
Table 4-7 Example of Parameter Modification for Rate Downgrade
Abbreviation Parameter nameRange and
stepCurrent value
Update value
Remark
UlDnMaxStg Maximum Number of Degraded Uplink Load Steps Every Time
[1 8] 1 2 Downgrade from 384 Kbps to 16 Kbps
DlDnMaxStg Maximum Number of Degraded Downlink Load Steps Every Time
[1 8] 1 3 Downgrade from 384 Kbps to 8 Kbps
456 Monitoring and Optimizing Uplink Capacity
Handover Blocking Rate and RTWP can reflect the uplink capacity of the cell Because interference may also increase RTWP this factor should be distinguished during the RTWP monitoring Another effective indicator is the voice service erl If a cell has over 20 erls in busy hours you should pay special attention to it
ZTE Confidential Proprietary copy 2012 ZTE CORPORATION All rights reserved 52
UMTS KPI Optimization Analysis Guide Internal Use Only
457 Optimization of Uplink Capacity at the Whole Network Level
Case The uplink capacity was limited in a large number of sites after the cutover and the symptoms are a sharp rise of RTWP and a high call drop rate during the rush hours
After the following parameters were modified as shown in Table 4-8 the problem was solved
Table 4-8 Example of Power Control Parameter Modification
AbbreviationParameter
nameRange
Current value
Update value
ULINITSIRUplink Initial SIR target (dB)
UL 34 K136 K signaling UL 122 K AMR
4-5 35
ULMAXSIRMaximum Uplink SIR target (dB)
UL 34 K136 K signaling UL 122 K AMR
15 10
UlSirTargDnStepUplink SIR Target Down Step Size (dB)
UL 34 K136 K signaling UL 122 K AMR
01 02
458 Optimization of Uplink Capacity for a Single Cell
A lot of optimization measures can be taken to bring down the rising RTWP However with increasing subscribers the capacity may still be limited in some area while further modification of SirTarget will obviously degrade the call quality of the whole network and undermine the subscribersrsquo perception In this case you can adjust the power control parameters for a single site that has heavy traffic in the following way add one set of DivPc parameters and use this set of parameters only for this site
Case Table 4-9 shows an example of the power control parameter modification After this modification the call drop rate in the site with heavy traffic decreased to one quarter of the original one
Table 4-9 Example of Power Control Parameter Modification for Heavy-Traffic Cell
SRVTYPE ULINITSIR ULMAXSIR ULMINSIR
0 35-gt15 100-gt35 20-gt10
104 40-gt20 150-gt50 05-gt0
28 35-gt15 100-gt35 05-gt0
50 60-gt20 150-gt50 20-gt0
54 60-gt20 150-gt50 20-gt0
ZTE Confidential Proprietary copy 2012 ZTE CORPORATION All rights reserved 53
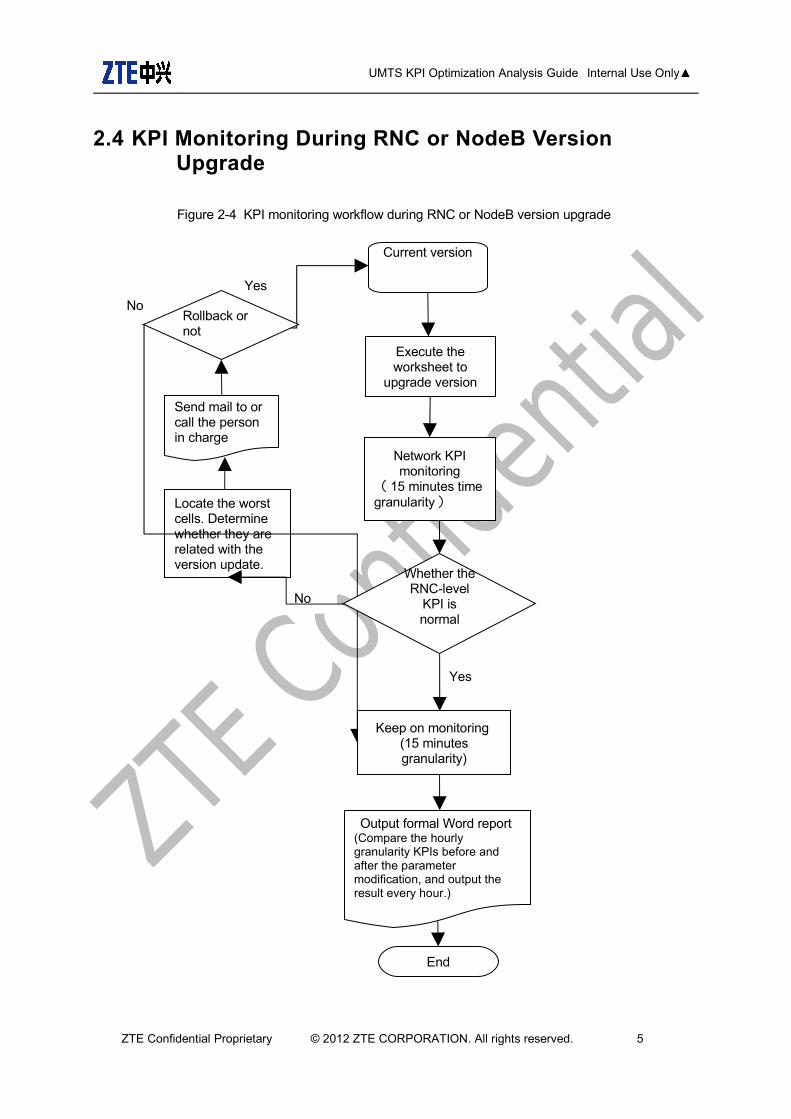
UMTS KPI Optimization Analysis Guide Internal Use Only
24 KPI Monitoring During RNC or NodeB Version Upgrade
Figure 2-4 KPI monitoring workflow during RNC or NodeB version upgrade
ZTE Confidential Proprietary copy 2012 ZTE CORPORATION All rights reserved 5
Yes
No
No
End
Locate the worst cells Determine whether they are related with the version update
Yes
Network KPI monitoring
( 15 minutes time granularity)
Execute the worksheet to
upgrade version
Output formal Word report (Compare the hourly granularity KPIs before and after the parameter modification and output the result every hour)
Whether the RNC-level
KPI is normal
Keep on monitoring (15 minutes granularity)
Send mail to or call the person in charge
Rollback or not
Current version
UMTS KPI Optimization Analysis Guide Internal Use Only
25 KPI Monitoring During Cutover
For the network on which the equipment needs to be replaced (for instance HongKong CSL network for which we replaced Nokiarsquos equipment with ZTErsquos) after the network optimization is completed the subscribers on the existing network should be cut over to our network gradually During the cutover there will be subscribers registering on our network constantly which will cause load increase on the network In this case we should watch KPI changes closely The monitoring process items method and report are the same as those described in section 24 ldquoKPI Monitoring During RNC or NodeB VersionUpgraderdquo Please read it for reference
3 KPI Analysis Methods
31 KPI Analysis Methods
Different network problems require different performance analysis methods Choose one or more appropriate methods after learning the running state of the existing network and the problems with it Common analysis methods are as follows
TOP N worst cells method Based on the traffic statistics indicators we care about (such as the call drop rate connection rate and soft handoff failure rate) choose N worst cells whose average indicator values in the peak hours or of the whole day are the lowest as the target of fault analysis and optimization Or prioritize objects of optimization against these indicator values
Time tendency chart method Tendency chart of indicator change is commonly used in the traffic analysis The analysis engineer can work out an hourly daily or weekly tendency chart of one or more indicators of the whole network a cluster or a single cell and find out the change rule of traffic statistics indicators
Regional location method The change of network performance indicators often occurs in some regions The indicators in these regions may be worsened by traffic increase traffic mode change radio environment change faults with a small number of stations or uplinkdownlink interference which will therefore affect the performance indicators of the whole network By comparing the network performance indicators before and after the change we can mark out the station or the sector with the greatest indicator change on an electronic map and take these problem regions as the analysis focus
Comparison method A single traffic statistics indicator may be affected by many factors While some factors change others may not Choose a proper object for comparison to confirm the existence of problems and then analyze the causes of the problems When examining an indicator do not care whether the absolute indicator value is high or low only pay more attention to whether the value is high or low compared to other indicators instead
ZTE Confidential Proprietary copy 2012 ZTE CORPORATION All rights reserved 6
UMTS KPI Optimization Analysis Guide Internal Use Only
311 TOP N Worst Cells Method
During the whole process of KPI optimization analysis TOP N worst cells analysis method is the most effective one which can be used throughout the whole optimization phase By focusing on the TOP N worst cells you can solve the major problems with the network Abnormal call drop events may happen every day and these events may represent problems of a kind After solving the problems with TOP N cells you can solve the problems of the same kind Therefore focusing on TOP N cells is one of the most effective ways to solve problems
TOP N worst cells analysis method is applicable to the optimization analysis of all the indicators Choose TOP N worst cells according to a certain threshold which varies depending on different indicators N stands for the number of the worst cells When the worst cells are too many to be worked on the number of the worst cells can be decreased so that you can focus on them TOP N cells analysis method includes the following steps
Step 1 Screen out TOP N cells according to the condition of the indicators you care about
Step 2 Conduct a health check for TOP N cells Check whether there are any problems with transmission or boards and check whether the worst cells are caused by external abrupt incidents such as terrible weather gatherings or holiday (because during gatherings and holidays the traffic is usually heavy)
Step 3 Check the radio parameters configuration of these cells the radius of these cells and their neighboring cells and compare them with the normal cells
Step 4 Export the indicator relevant most closely with the indicators you care about and analyze it to find the problem indirectly
For instance one day CS call drop rate of a whole network was high We analyzed the problem by the TOP N cells analysis method
Step 1 Screen out TOP N cells according to the condition of the indicators you care about
We used the CNO KPI analysis function to screen out TOP N cells (other tools can be also used) and selected 10 cells with the highest CS call drop rate
Table 3-1 List of CS TOP N Worst Cells
Index Cell RNS subnet ID Cell IDCall drop
rate CS AMRNumber of call
drop voice
1 ZBL1U-AI-1 (201) 12911 4158 553
2 ZBL1U-AI-3 (201) 12913 3955 545
3HKE1U-5H-1
(203) 30461 1556 370
ZTE Confidential Proprietary copy 2012 ZTE CORPORATION All rights reserved 7
UMTS KPI Optimization Analysis Guide Internal Use Only
Index Cell RNS subnet ID Cell IDCall drop
rate CS AMRNumber of call
drop voice
4HKE1U-5H-3
(203) 30463 1581 360
5LAK1U-9M-3
(202) 11063 339 282
6 HIC1U-9R-1 RNC101(101) 10891 226 216
7LAK1U-9M-1
(202) 11061 249 215
8EBP1U-9R-3
RNC101(101) 12823 230 205
9SRS1U-5H-1
RNC102-CSL(102)
12091 392 169
10HRM1U-6R-1
RNC102-CSL(102)
20671 341 167
Step 2 Check the transmission and hardware of the TOP N cells and check whether they are caused by external abrupt incidents such as terrible whether gatherings or holidays when traffic is usually heavy
And then we conducted a health check for each cell and paid attention to routine alarms and BPC board problems We found there were broken associations in some HKE sites
Step 3 Check the radio parameters configuration of these cells the radius of these cells and their neighboring cells and compare them with the normal cells
(1)Problem with the cell radius After the check we found the cell radius of the LAK site was 25 km Because the LAK site was situated by the sea and the antenna was placed very high the radius of 25 km was far from enough So we changed the cell radius to 10 km and the problem of high call drop rate was thus solved
(2)Problem with configuration HIC site is an indoor POI site The RRU RxTx port and the RRU Rx port were configured reversely which is the cause of high call drop rate After modifying HIC we found that signals of the second RRU were received by the Rx port So we changed the configuration of the RxTx port and the Rx port the problem of high call drop rate was thus solved
Figure 3-5 RF configuration at HIC site
Figure 3-6 Antenna energy distribution at HIC site
ZTE Confidential Proprietary copy 2012 ZTE CORPORATION All rights reserved 8
UMTS KPI Optimization Analysis Guide Internal Use Only
Step 4 Export the indicator relevant most closely with the indicators you care about and analyze it to find the problem indirectly
Table 3-2 Indicators Related with CS Call Drop
Index Cell
RAB release number for Iu connection
release request by UTRAN for CS domain in
cell radio connection with UE lost
RAB release number for Iu connection
release request by UTRAN for CS domain in cell failure in
the radio Interface
procedure
RAB release number for Iu connection
release request by
UTRAN for CS domain in
cell release due to
overload control
RAB release number for Iu connection
release request by
UTRAN for CS domain in
cell unspecified
failure
Average cell freq RTWP (dbm)
1ZBL1U-AI-1
482 43 0 29 -104177
2ZBL1U-AI-3
473 40 0 33 -104125
3HKE1U-5H-1
346 16 0 8 -105908
4HKE1U-5H-3
330 18 0 13 -1060777
5LAK1U-9M-3
69 196 0 18 -1031906
6HIC1U-9R-1
100 100 0 16 -1015404
7 LAK1U- 64 131 0 20 -1031934
ZTE Confidential Proprietary copy 2012 ZTE CORPORATION All rights reserved 9
UMTS KPI Optimization Analysis Guide Internal Use Only
Index Cell
RAB release number for Iu connection
release request by UTRAN for CS domain in
cell radio connection with UE lost
RAB release number for Iu connection
release request by UTRAN for CS domain in cell failure in
the radio Interface
procedure
RAB release number for Iu connection
release request by
UTRAN for CS domain in
cell release due to
overload control
RAB release number for Iu connection
release request by
UTRAN for CS domain in
cell unspecified
failure
Average cell freq RTWP (dbm)
9M-1
8EBP1U-9R-3
98 90 0 17 -101413
9SRS1U-5H-1
87 59 0 22 -1043528
10HRM1U-6R-1
42 111 0 13 -1027697
32 Basic KPI Analysis Skills
Be able to use the KPI statistics tool and the analysis tool
Use tools to learn about the running state of the whole network quickly and screen out TOP N worst cells quickly
Use different analysis tools to find problems from different aspects and locate the problem quickly
Understand the signaling process and basic principle
In the process of abnormity location keep a clear aim in mind and be able to apply the process and basic principle to check the other relevant indicators rapidly to facilitate the analysis
Be familiar with the process and basic principle and be able to make logical association between abnormal KPI problems and network problems (such as the coverage problem and the interference problem) Be able to determine the problem nature according to the abnormal KPI and then choose the appropriate tool to analyze the problem in depth
Performance analysis requires engineers to understand basic signaling process be familiar with the protocol stacks of standard interfaces and know relevant algorithms to realize the product functions Engineers should at least have a concept about the various algorithms If the analysis of a commercial network involves some algorithms engineers should study these algorithms in depth
ZTE Confidential Proprietary copy 2012 ZTE CORPORATION All rights reserved 10
UMTS KPI Optimization Analysis Guide Internal Use Only
321 KPI Monitoring Tools
minus Network management tool NetNumenT31 count KPI original data alarm data radio parameter configuration in cells and parameter configuration on the earth
minus KPI daily report generating tool classify key indicators according to a certain condition and screen out the worst cells
322 KPI Analysis Tools
minus CNO Tool CNO tool has the KPI analysis function So using it you can screen out the worst cells according to various conditions and point out the corresponding counter of an indicator
minus SignalTrace Trace the signaling (RNL signaling and RNL signaling) of RNC interfaces which includes the Iu interface the Iur interface the Iub interface and the Uu interface (the signaling flow between RNC and UE at RRC layer) And RNL signaling trace is a common way for locating the KPI problem Being able to trace the RNC signaling is a basic requirement for the on-site KPI optimization engineers and the network optimization and maintenance engineers This signaling tracing tool is very powerful which can trace signaling according to the UE cell and IMSI in the KPI analysis According to the UE cell it can trace the signaling of multiple subscribers while according to IMSI it can trace the signaling of only one subscriber However if the RRC connection is not established yet signaling cannot be traced That is because only when RRC connection has been established can the RNC obtain the subscriberrsquos IMSI from the CN
minus RNC ASS Log ASS log is usually applied when there is abnormity and RNC signaling is out of trace In this case use ASS log to analyze the signaling before and after the abnormity occurs Abnormity can be queried according to IMSI or cell ID ASS log can be also used to collect various abnormities
minus NodeB LMT NodeB local operation and maintenance tool Apart from all the operation functions of the OMCB this tool can collect more detailed information about cells and UE NodeB local maintenance terminals include EOMS EFMS DMS and PMS
minus NodeB Abnormity Probe On the site of WCDMA commercial office NodeB abnormity probe is an effective tool to monitor the running state of the NodeB Every module of NodeB can record the abnormal information automatically which makes it easy to locate problems However this method requires professional knowledge such as knowledge about the function and interface of each module or board If the on-site engineers cannot make the simple analysis they can just obtain the abnormity probe and send it to the RampD engineers at the rear side The abnormities reported on the NodeB will be stored at the OMCB server according to different RNCs To conduct NodeB
ZTE Confidential Proprietary copy 2012 ZTE CORPORATION All rights reserved 11
UMTS KPI Optimization Analysis Guide Internal Use Only
abnormity probe analysis you need to download abnormity probe files from different OMCB servers and then use the abnormity probe tool to make a comprehensive analysis
minus CTS Tool CTS is a tool developed by the CN department which can trace signaling in depth according to IMSI and trace signaling across RNCs So this is particularly suitable to trace VIP subscribers In this case CTS is easier to use than SignalTrace which can only trace signaling of RNCs one by one CTS can trace the interactive signaling between network elements (NEs) within the CN as well as the signaling of the Iu interface and the Uu interface This kind of signaling tracing is what we called in-depth tracing The work principle of CTS is to set up an IMSI task on the CTS server and send it to the CN front side which will then send this task to each CN module via the interfaces dedicated to the CN modules and the RNC and then each module after receiving the signaling related to the IMSI task will send the signaling back to the CTS server via the CN front side The interfaces mentioned above are private interfaces so this tool can only support our own CN and RNC CTS signaling can be checked and analyzed with an offline tool but the offline tool does not work very well because of the lack of continuous optimization and perfection
minus UE log DT test is also an important auxiliary way in analyzing KPI indicators There are many problems that cannot be located by tracing signaling at the network side and can only be located by the use of UE log The commonly used drive test software includes QXDMAPEX (QCAT) CNTCAN and TEMS CNTCAN and TEMS are often used for network optimization For the use of CNTCAN please refer to the corresponding help file and the instruction document publicly released by the Network Optimization Tool Department QXDM and the analysis tool APEX (QCAT) provided by Qualcomm is very powerful which have contributed a lot for the stability and maturity of our system for many years
33 General Process of KPI Optimization Analysis
Basic analyzing ideas
KPI optimization is a process to find and solve problems KPI optimization during the operation and maintenance stage is mainly to pick out the performance data that needs special attention from the OMC classify these performance data and then compare the value of these data with that required by the operator If the value of an indicator is lower than the operatorrsquos requirement analyze this indicator and find out the factor that affect the indicator and then propose a solution to the operator If the values are higher than the operatorrsquos requirement therersquos no need to pay special attention to them
KPI analysis is a process from the whole to the part
Step 1 Check the key indicators from the view of the whole network If there is not any
ZTE Confidential Proprietary copy 2012 ZTE CORPORATION All rights reserved 12
UMTS KPI Optimization Analysis Guide Internal Use Only
problem just ignore them Otherwise try to locate the RNC NE that has the problem
Step 2 Analyze the indicators of the corresponding RNC to find out the RNC whose indicators have the problem
Step 3 Analyze the indicators of the cell under the problem RNC to find out the worst cells or TOP N cells If the indicators of all the cells under the RNC are tend to be low it is a common problem probably caused by parameter configuration And then check whether the radio parameter configuration in the cells under this RNC is the same as that in the cells under the normal RNCs
Step 4 Make a comprehensive analysis on the KPIs alarms DT test data and customer complains of the worst cells to find out a solution
Analysis method
After learning the KPI analysis ideas we must know some common KPI analysis methods to rule out causes of problems from the obvious ones to the hidden ones
For example we found that the TCP code words were strictly limited at eight sites near a park and the call drop rate rose suddenly How to solve this problem
Method one First we checked whether the alarms transmission and boards of these sites were normal After they are proved all normal we sent some engineers to the site to do test And meanwhile we traced the RNC signaling at the OMC It turned out that the test result was normal and the indicators of these sites of that day did not have any problem and code words were not limited And later we knew from the news that there was a big gathering of about one million people at the park at that moment Until then we came to know that the congestion was caused by too many users using the network at the same time
Method two First because the eight sites went worse all of a sudden it was unlikely that the problem lied in the hardware Then we checked whether the radio parameters had been modified the day before The result is no worksheet had been issued to modify those parameters and no alarm was found at those sites Therefore we excluded the possibility of hardware problem Then we checked the traffic trend graph of the last few days (over seven days) and found that the high call drop rate might be caused by high traffic The graph showed that traffic of each site rose suddenly on the day before Thus we came to the conclusion that this was an abnormal abrupt event which may have been caused by a gathering And later we were told that there was a big gathering at the park So we were assured the code words limitation and high call drop rate at the eight sites were caused by too many subscribers using the network at the same time
By comparing the two methods above we can find that although the first one (sending engineers to the site without the consideration of abnormal events) is commonly used it is inefficient and costs more resource The second method (analyzing the problem by the means of exclusion and association) is more efficient From this case we would like to emphasize that KPI analysis is a process of problem exclusion Using the comprehensive
ZTE Confidential Proprietary copy 2012 ZTE CORPORATION All rights reserved 13
UMTS KPI Optimization Analysis Guide Internal Use Only
methods (like Method One) at the first brush may be making a detour
minus Exclusion method Check the alarms on the OMC to learn about the state of the RNC NodeB BPC board and the transmission If there are obvious broken link in transmission or hardware problem the cause of the problem is easy to locate
minus Incident association If the problem is with a great number of sites take abrupt incidents into account such as large-scale gathering terrible weather of incorrect operation These incidents will put influence of different levels and ranges on the network indicators
minus Comparison of radio parameters If some site goes wrong in a sudden check whether the radio parameter configuration of this site is consistent with that of other normal sites If not change it as that of the normal sites because the indicator decrease may be caused by an incorrect modification of radio parameters
minus Relevant indicators association If a certain indicator is in poor condition check its relevant indicators and find the common problem from these relevant indicators
minus Comprehensive problem location When the above reasons are excluded use DT data KPI data RNC signaling analysis data to locate the problem with indicators comprehensively
ZTE Confidential Proprietary copy 2012 ZTE CORPORATION All rights reserved 14
UMTS KPI Optimization Analysis Guide Internal Use Only
Figure 3-7 KPI optimization analysis process
StartPick out
performance indexes
RNC index abnormal
Equipment alarms exist
Deal with equipment alarms
RNC index recovers
Common problem with the
worst cells
Transmission softwarehardware version wireless
parameter configuration
CNRNC Transmission
Hardware Software Interference
Wireless parameters
Time range
Abrupt and self-curable abnormality
helliphellip
Analyze and record causes
Suggestion about improvement
Common problems analysis
Problem resolved
Successful call
Call drop Soft handover
23G alternate operation
PS rate helliphellip
Deal with the relevant problem
Indexes normal
End
Climate change holidays assembly
transmission interruption power
fault and so on
Y
N
Y
Y
N
Y
N
Abnormal indexes analysis in one cell
Y
N
N
N
Y
N
Y
Show TOPN abnormal cells
and their locations
If the problem is proved to be equipment bug or system problem after
several attempts feed it back to RampD dept
ZTE Confidential Proprietary copy 2012 ZTE CORPORATION All rights reserved 15
UMTS KPI Optimization Analysis Guide Internal Use Only
4 KPI Optimization Analysis This chapter mainly demonstrates how to analyze the indicator problems from the aspect of OMC data and provides flowcharts for KPI optimization The detailed analyzing method and cases of every special subject can be checked in the optimization guides of all the subjects
41 CS Call Drop Optimization
The CS call drop rate is the most important indicator in KPI optimization
411 Definition of Call Drop
After checking the signaling on the Uu interface at the UE side the engineer can judge the situation a call drop if the Uu interface message satisfies one of the following three conditions during the calling process (in connection)
RNC Release is not received but the UE condition changes from CELL_DCH to IDLE
RRC Release is received and the released cause value is Not Normal
One of the following three messages mdash CC Disconnect CC Release Complete and CC Release mdash is received and the released cause value is Not Normal Clearing or Not Normal Unspecified
In a board sense the call drop includes the call drop rates of CN and UTRAN The call drop of UTRAN includes the following two aspects
After the successful service establishment RNC sends the RAB Release Request to CN
After the successful service establishment RNC sends the IU Release Request to CN Later RNC receives the IU Release Command from CN
Note that RAN call drop statistics which is defined from the aspect of lu interface signaling means the launching times of RAB Release Request and lu Release Request of RNC And the DT call drop statistics is defined from the aspects of the Uu interface message non-access stratum message and cause value RAN call drop statistics and DT call drop statistics are not exactly the same
ZTE Confidential Proprietary copy 2012 ZTE CORPORATION All rights reserved 16
UMTS KPI Optimization Analysis Guide Internal Use Only
412 CS Call Drop Analysis Flowchart
Figure 4-8 CS call drop analysis flowchart
ZTE Confidential Proprietary copy 2012 ZTE CORPORATION All rights reserved 17
UMTS KPI Optimization Analysis Guide Internal Use Only
Extract performance data
CS TOP Ncell filtering
Analyze a single cell
1 Check NE alarms
2 Associate emergencies
3 Compare parameter
configurations
4 Associate indicators
5 Locate the fault
comprehensively
Exist or not
Handle alarms
Solved or not
Yes
Yes
End
No
No
Exist or not
Handle emergencies
Solved or not
Yes
No
No
Exist or not
Correct wrong parameter
configurations
Solved or not
Yes
No
No
List related indicator counters
Call-drop-related
countersRTWP
Handover success rate
Traffic volume
Resource limit indicators
Checkamp analysis of
interference
Optimizationanalysis of
handover failures
Optimization analysis of
resource limitCall-drop-
related counters
C301230362C301230363C301230365C301230315C301230316C301230318C301230319C301230322C301230323
Solved or not
Yes
Yes
No
Drive Test+RNC signaling
trace
Yes
ZTE Confidential Proprietary copy 2012 ZTE CORPORATION All rights reserved 18
UMTS KPI Optimization Analysis Guide Internal Use Only
42 PS Call Drop Optimization
421 Optimization Flowchart
Figure 4-9 PS call drop optimization flowchart
ZTE Confidential Proprietary copy 2012 ZTE CORPORATION All rights reserved 19
UMTS KPI Optimization Analysis Guide Internal Use Only
Extract performance data
PS TOP Ncell filtering
Analyze a single cell
1 Check NE alarms
2 Associate emergencies
3 Compare parameter
configurations
4 Associate indicators
5 Locate the fault
comprehensive ly
Exist or not
Handle alarms
Solved or not
Yes
Yes
End
No
No
Exist or not
Handle emergencies
Solved or not
Yes
No
No
Exist or not
Correct wrong parameter
configurations
Solved or not
Yes
No
No
List related indicator counters
Call -drop-related
countersRTWP
Handover success rate
Traffic volume
Resource limit indicators
Check amp analysis of interference
Optimizationanalysis of
handover failures
Optimization analysis of
resource limitCall -drop-
related counters
C301230372C301230373C301230375C301230330C301230332C301230333C301230334C301230337C301230338
Solved or not
Yes
Yes
No
Drive Test +RNC signaling
trace
Yes
ZTE Confidential Proprietary copy 2012 ZTE CORPORATION All rights reserved 20
UMTS KPI Optimization Analysis Guide Internal Use Only
43 Optimization of Accessibility Indicators
Accessibility performance includes the success rate of RRC connection setup and the success rate of CSPS RAB assignment These two kinds of KPIs play important roles in the network optimization and directly influence the success rate of CSPS service establishment In this document this kind of problems are found from the aspect of OMC data and solved through parameter optimization
431 Definition of Access Failure
For the mobile originated call in the CS domain the access failure event means that the UE sends RRC REQUEST and IE establish cause is Originating Conversational Call but alerting of the direct transfer message is not received
The relevant events are defined as follows in the access failure stage
RRC connection setup failure After considering the resending times and the waiting time the UE sends RRC CONNECTION REQUEST and does not receive the response from RNC or RRC CONNECTION REJECT delivered by RNC
Initial direct transfer and security mode establishment failure After sending RRC CONNECTION SETUP COMPLETE the UE does not send NAS SETUP
RAB assignment failure After receiving CALL PROCEEDING the UE does not receive RB SETUP delivered by RNC Or the UE replies with RB SETUP FAIL after receiving RB SETUP Or the UE receives DISCONNECT with the cause value not being Normal Release after receiving RB SETUP At this time the UE has not reported RB SETUP CMP
Failure after RAB assignment After the UE sends RB SETUP COMPLETE the originating UE receives DISCONNECTRELEASE from CN Or the UE waits CONNECT or ALERTING overtime and launches the Call Clearing process Or the UE becomes IDLE before receiving Alerting and starts to receive the system message
For the mobile terminated in the CS domain the access failure event means that the terminating UE receives the paging of paging type 1 and does not send RRC CONNECTION REQUEST with the cause value being Terminating Conversational Call Or the UE does not send the alerting of direct transfer message to CN after sending RRC CONNECTION REQUEST
The relevant events are defined as follows in the access failure stage
RRC connection setup failure After sending RRC CONNECTION REQUEST the UE does not receive the response from RNC or RRC CONNECTION REJECT delivered by RNC
Initial direct transfer and security mode establishment failure After sending RRC
ZTE Confidential Proprietary copy 2012 ZTE CORPORATION All rights reserved 21
UMTS KPI Optimization Analysis Guide Internal Use Only
CONNECTION SETUP COMPLETE the UE does not receive the SETUP direct transfer message Or the UE sends RELEASE COMPLETE Or the UE receives DISCONNECT from CN
RAB assignment failure The UE does not receive RB SETUP delivered by RNC after sending CALL CONFIRM Or the UE replies with RB SETUP FAIL after receiving RB SETUP Or the UE receives DISCONNECT with the cause value not being Normal Release after receiving RB SETUP At this time the UE has not reported RB SETUP CMP
Failure after RAB assignment After the UE sends RB SETUP COMPLETE the terminating UE receives DISCONNECTRELEASE from CN
432 Analysis on RRC Connection Failures
The problem of RRC connection setup failure can be analyzed through the UE signaling flow and RNC single-user tracing The RRC connection setup includes the following steps
The UE sends RRC Connection Request through the RACH channel
RNC sends RRC Connection Setup through the FACH channel
The UE sends RRC Connection Setup Complete through the dedicated uplink channel after the downlink dedicated channel is established and synchronized
RRC connection setup failures are always caused by following issues
Uplink RACH problem
Problem about downlink FACH power allocation proportion
Parameter reselection problem of the cell
Low downlink dedicated initial transmitting power
Uplink initial power control problem
Congestion
Equipment malfunctions
Among these issues the problems of uplink RACH downlink FACH power allocation proportion parameter reselection of the cell and equipment malfunctions appear more frequently
ZTE Confidential Proprietary copy 2012 ZTE CORPORATION All rights reserved 22
UMTS KPI Optimization Analysis Guide Internal Use Only
4321 Analysis Flowchart of RRC Connection Setup Failures
Figure 4-10 Analysis flowchart of RRC connection setup failures
ZTE Confidential Proprietary copy 2012 ZTE CORPORATION All rights reserved 23
UMTS KPI Optimization Analysis Guide Internal Use Only
Extract performance data
TOP Ncell filtering
Analyze a single cell
1 Check NE alarms
2 Associate emergencies
3 Compare parameter
configurations
4 Associate indicators
5 Locate the fault
comprehensive ly
Exist or not
Handle alarms
Solved or not
Yes
Yes
End
No
No
Exist or not
Handle emergencies
Solved or not
Yes
No
No
Exist or not
Correct wrong parameter
configurations
Solved or not
Yes
No
No
List related indicator counters
Counters related to RRC setup
failuresRTWP
Resource limit
indicators
Checkamp analysis of interference
Optimization analysis of
resource limitCounters related
to RRC setup failures
C301480485C301480486C301480487C301480489C301480490C301480491C301481288C301481289C301481337C301481338C301481339C301481407C301481408
Solved or not
Yes
Yes
No
Drive Test+RNC signaling
trace
Yes
ZTE Confidential Proprietary copy 2012 ZTE CORPORATION All rights reserved 24
UMTS KPI Optimization Analysis Guide Internal Use Only
4322 UE sends RRC Connection Request but RNC does not receive it
If the EcIo of downlink CPICH is relatively low it is the problem of coverage
If the EcIo of downlink CPICH is not very low (for example the value is larger than -14 dB) Usually it is the problem of RACH and the following issues may cause the problem
minus The power of Preamble does not rise to a required value and the rising times of Preamble should be increased
minus The output power of UE is lower than the required value which is caused by poor UE performance In this case the UE should be changed
minus The NodeB equipment has a standing wave and the engineer should check whether NodeB has any SWR alarm
minus The radius of the cell is set improperly If the radius parameter of the cell is set too small the NodeB can not synchronize the UE beyond the range of the radius and the access fails This problem often happens in the places with large coverage such as the rural areas and the suburbs
4323 RNC delivers RRC Connection Reject after receiving RRC Setup Request
When RRC Connection Reject appears the engineer should check the specific reject cause value Usually there are two kinds of causes
The CPU load of RNC control plane board is too heavy and more boards should be added
DCH and FACH admission is rejected However this situation does not always happen
4324 UE does not receive RRC Connection Setup delivered by RNC
This problem may be caused by the following reasons
Poor coverage
Improper parameters of cell selection and reselection
Checking method The engineer should check the EcIo of CPICH If the value is lower than -12 dB (EcIo is -12 dB by default) and there is no cell of better quality in the monitor set the cause of this problem is poor coverage If there is better cell in the monitor set cell reselection may cause this problem
Poor coverage can be improved by coverage enhancement such as adding some sites to cover the places without signal coverage and adjusting the engineering parameters If the coverage can not be improved the engineer can enhance the FACH power according to
ZTE Confidential Proprietary copy 2012 ZTE CORPORATION All rights reserved 25
UMTS KPI Optimization Analysis Guide Internal Use Only
the PCPICH EcIo coverage of the current network For example if all the pilot EcIo values are larger than -12 dB in the coverage area the power proportion of the common channel should be configured on the basis of the situation that the EcIo value is larger than -12 dB And so the success rate of the idle UE assessment can be ensured
As for the access problem caused by cell selection and reselection the engineer can speed up the cell selection and reselection by adjusting the cell selection and reselection parameters and the problem of RRC connection setup failure caused by improper cell selection and reselection parameters can be solved
Note
The RRC Connection Setup message is borne by FACH RRC Connection Request sent by the UE is received by UTRAN at the preamble of PRACH and then it is sent from the RACH channel based on the current preamble power And the transmit power of preamble can rise all the time until the response is received (There is a limitation for the maximum number of preamble retransmissions) Therefore in the areas with poor coverage the RACH coverage and FACH coverage may become unbalanced and as a result UTRAN can receive RRC Connection Request sent by the UE but the UE can not receive RRC Connection Setup sent by RNC
4325 UE receives RRC Connection Setup and does not send RRC Setup Complete
If the downlink signal quality is normal this problem may be caused by the abnormal condition of the cell phone
Another reason of this problem may be the downlink synchronization failure caused by the low initial power of downlink dedicated channel You can solve this problem by adjusting the service downlink EbNo
4326 RNC does not receive RRC Setup Complete sent by UE
Because the uplink initial power control may increase the UE transmit power this kind of problem seldom appears If it appears the engineer can increase the Constant Value of the dedicated channel properly to raise the uplink DPCCH initial transmission power of the UE
At the same time this problem is also relevant with the uplink SIR initial target value configuration because this value may affect the uplink initial synchronization at the initial stage of link setup If the value of the parameter is set too large there will be too much uplink inference brought by the initial setup of the link If the value is set too small the uplink synchronization will take longer time and the initial synchronization may even fail This parameter is an RNC-level parameter which has a great influence on network performance Therefore the engineer should be cautious while adjusting this parameter
ZTE Confidential Proprietary copy 2012 ZTE CORPORATION All rights reserved 26
UMTS KPI Optimization Analysis Guide Internal Use Only
Note
RRC Connection Setup Complete is sent through uplink DPCH and the UE calculates the initial power of uplink DPCCH according to the received IErdquoDPCCH_Power_offsetrdquo and the measured CPICH_RSCP value
DPCCH_Initial_power = DPCCH_Power_offset - CPICH_RSCP
DPCCH_Power_offset = Primary CPICH DL TX Power + UL Interference + Constant Value The Constant Value can be configured in the OMC If this value is set too small the UE may not have enough power to send RRC Connection Setup Complete
433 Analysis on RABRB Setup Failures
When RAB or RB setup fails RNC will send RAB Assignment Fail in the RAB Assignment Response signaling The engineer can find out the specific failure reason from the failure cause value carried in relevant cells The reasons for common RABRB setup failures include
RNC directly rejecting RAB Setup Request because of wrong parameter configuration
Admission reject
RAB setup failure because the UE fails to respond to RB Setup Request
RAB setup failure because the Uu interface fails to set up RB
ZTE Confidential Proprietary copy 2012 ZTE CORPORATION All rights reserved 27
UMTS KPI Optimization Analysis Guide Internal Use Only
4331 Analysis Flowchart of RAB Setup Failures
Figure 4-11 Analysis flowchart of RAB setup failures
ZTE Confidential Proprietary copy 2012 ZTE CORPORATION All rights reserved 28
UMTS KPI Optimization Analysis Guide Internal Use Only
Extract performance data
TOP Ncell filtering
Analyze a single cell
1 Check NE alarms
2 Associate emergencies
3 Compare parameter
configurations
4 Associate indicators
5 Locate the fault
comprehensively
Exist or not
Handle alarms
Solved or not
Yes
Yes
End
No
No
Exist or not
Handle emergencies
Solved or not
Yes
No
No
Exist or not
Correct wrong parameter
configurations
Solved or not
Yes
No
No
List related indicator counters
Counters related to RAB setup failures RTWP
Resource limit
indicators
Checkamp analysis of interference
Optimization analysis of
resource limitCounters related to RAB setup failures
CS domain PS domainC301230290 C301230302C301230291 C301230303C301230292 C301230304C301230293 C301230305C301230294 C301230306C301230295 C301230307C301230296 C301230308C301230297 C301230309C301230298 C301230310C301230299 C301230311C301230300 C301230312C301230301 C301230313
Solved or not
Yes
Yes
No
Drive Test+RNC signaling
trace
Yes
ZTE Confidential Proprietary copy 2012 ZTE CORPORATION All rights reserved 29
UMTS KPI Optimization Analysis Guide Internal Use Only
4332 RNC Directly Rejecting RAB Setup Request Because Of Wrong Parameter Configuration
The case that RNC responds with RAB Setup Failure directly is seldom caused by invalid parameter configuration in the business network Usually this case is caused by special operations of the special users
The main scenario is that the subscription information of the userrsquos PS service is beyond the capability of the UE which leads to the direct refusal from RNC For example a special userrsquos subscription rates of uplink and downlink are 384 K but the maximum uplink rate of the UE is only 64 K The maximum uplink and downlink rates of the QoS message used for activating PDP set by the AT command or mobile terminal software used by the user are 384 K so the RNC will find the maximum uplink rate is beyond the UErsquos capability directly reply with RAB Setup Failure and will not launch the RB setup process when it receives RAB Assignment Request
After the RAB setup fails because the parameter configuration is beyond the UErsquos capability SGSN will negotiate again to launch the new RAB assignment until the UE has the capability to support the assignment and the RAB assignment is finished For the users the PDP activation is still successful and the actual maximum rate is the maximum rate the UE can support
However if the minimum guaranteed bit rate required by the QoS setting in the UErsquos PDP activation request is beyond the UErsquos capability though the network negotiates a lower rate to accept the UErsquos PDP activation request the UE will launch the request of deactivating PDP when it finds that the rate negotiated by the network in PDP activation accept request is lower than the minimum guaranteed bit rate and finally the PDP activation can not be completed
4333 Admission Reject
For the non-HSDPA user if there are insufficient system resources (including power channel code lub transmission resource and CE) the call establishment failure will be caused by the admission reject At this time it is necessary to check the network load code resource lub transmission resource and CE resource occupation to make sure the congestion is caused by the limitation of a certain kind of resource What is more the engineer should plan the corresponding expansion method
If the cell does not support the HSDPA service the R99 user admission is judged according to the fixed R99 admission threshold If the cell supports the HSDPA service and the HSDPA and R99 dynamic power is allocated the uplink admission of non-HSDPA is judged based on RTWP or the equivalent user number If the uplink load is too heavy the non-HSDPA user admission will also fail
If the bandwidth configuration on the lub interface is insufficient the lub interface will reject the R99 data service activation because of limited bandwidth
ZTE Confidential Proprietary copy 2012 ZTE CORPORATION All rights reserved 30
UMTS KPI Optimization Analysis Guide Internal Use Only
The admission control of the NodeB Credit resource is similar to the power admission control Whether the remaining Credit can support the currently requested service or not can be judged according to the spectrum spreading factor of the new access user According to the condition of the RAB Downsizing Switch RNC will deal with the issue in the corresponding way
For the HSDPA user in the dynamic power allocation mode besides the mentioned system resources such as the power channel code lub transmission resource and CE the admission reject should take into consideration whether the number of H users supported by NodeB and the number of H users supported by the cell are over the regulated threshold or not into consideration
For the HSDPA user when the bandwidth configuration on lub interface is insufficient the admission reject will not happen but the rate will be reduced What is more the AAL2PATHs of HSDPA and R99 are configured respectively and the HSDPA AAL2PATH must be configured to the HSDPA_RT or HSDPA_NRT type If the HSDPA AAL2PATH is configured to RT or NRT of R99 AAL2PATH type the RAB assignment failure will not happen but RNC will establish the HSDPA service as R99 384 Kbps
For the downlink power admission
Besides whether the R99 service load is over the non-HSDPA service threshold DCH service should take into consideration whether non-HSDPA power and HSDPA GBP (the minimum power needed for the guaranteed bit rate) are over the general power threshold of the cell
For the HSDPA service it is necessary to check whether the throughput rate provided by the cell is over the sum of all the usersrsquo GBR thresholds or whether the GBPs of the stream service and the background service are over the HSDPA power of the cell At the same time whether the non-HSDPA power and the HSDPA GBP (the minimum power needed for the guaranteed bit rate) are over the overall power threshold of the cell should be also taken into consideration
For the lub admission
For the DCH service the admission is made according to the multiplication of the peak rate and the service activation factor
For HSDPA service the admission is made according to the GBR
If the lub exceeds the congestion threshold the DCCC rate reduction will be triggered And if the RLC_AM retransmission rate is over a certain threshold the Iub Overbooking switch can be opened to trigger the TF which limits R99 or to reduce the rate of HSDPA service by a certain factor
ZTE Confidential Proprietary copy 2012 ZTE CORPORATION All rights reserved 31
UMTS KPI Optimization Analysis Guide Internal Use Only
4334 RAB Setup Failure Because the UE Fails to Respond to RB Setup
The UE fails to respond to RB setup mainly because of the userrsquos operation
Take the following cases as examples
When the user already has had the downlink 12 K data service he receives RB Setup Request of the VP service (either the originated call in the VP domain or the terminated call in the VP domain) Because the UE does not support the VP and high-speed PS service in the downlink at the same time it directly replies with RB Setup Failure and the cause value is unsupported configuration
Compared with the WCDMA subscriber originating the VP service the terminating subscriber resides in the GSM network and so it does not support the VP service After RNC receives RAB Assignment Request the core network will deliver the Disconnect command right after call proceeding and the cause value is Bearer capability not authorized At this time the UE has just received the RB SETUP command and has no enough time to finish the RB setup So the UE will reply with RB Setup Failure after it receives the Disconnect command and the RNC will reply with RAB Setup Failure with the cause value being failure in radio interface procedure
4335 RAB Setup Failure Because the Uu Interface Fails to Set Up RB
RNC sends the Radio Bearer Setup command to the UE but fails to receive Radio Bearer Setup Compete This kind of situation (RB setup failure) often appears in the cells with weak signals There are two causes of weak signals one is that the UE does not reside in the best server to launch the access and the other is poor coverage
If the UE does not reside in the best server to launch the access it will hope to enter the best server through active set update in the RB setup process (At the same time the fast signal change will drastically weaken the signals in the cell) but the active set update can only be processed after the RB setup is completed because the procedures can not be processed alternately (Neither the network nor the terminal supports it) Therefore RB can only be set up in the cell with weak signals and the setup is easy to fail As for this situation the starting threshold and speed of co-frequency cell reselection should be increased to make the UE reside in the best server and launch the access as soon as possible
RB setup failure may be caused by the poor downlinkuplink coverage If the failure is caused by downlink coverage the UE can not receive the Radio Bearer Setup command which may be caused by the uplink interference and this can be fixed through checking RTWP The poor downlink coverage is partly caused by the bad UE demodulation performance and other causes should be solved by RF optimization
ZTE Confidential Proprietary copy 2012 ZTE CORPORATION All rights reserved 32
UMTS KPI Optimization Analysis Guide Internal Use Only
44 Optimization of Mobility Indicators
Mobility indicators mainly fall into three categories mdash soft handovers hard handovers and inter-RAT handovers The handover problems usually happen in the following cases
The best server changes too fast or there is no best server due to pilot pollution
The handover is not prompt or there are pingpong handovers due to improper parameter configuration
Adjust the engineering parameters for antennas in areas with severe pilot pollution And adjust the handover parameters such as the values of 1A 1B CIO TTT (time to trigger) Hysteresis and so on to solve the problem that the handover is not prompt or there are pingpong handovers This section tries to solve this kind of problems through OMC data analysis and parameter optimization
441 Optimization of Soft Handovers
Missed neighboring cell configuration pilot pollution improper soft handover parameter configuration and equipment malfunctions are the major causes of soft handover failures To confirm the problems the field DTs are required
ZTE Confidential Proprietary copy 2012 ZTE CORPORATION All rights reserved 33
UMTS KPI Optimization Analysis Guide Internal Use Only
4411 Soft Handover Optimization Flowchart
Figure 4-12 Soft handover optimization flowchart
ZTE Confidential Proprietary copy 2012 ZTE CORPORATION All rights reserved 34
UMTS KPI Optimization Analysis Guide Internal Use Only
Extract performance data
TOP Ncell filtering
Analyze a single cell
1 Check NE alarms
2 Associate emergencies
3 Compare parameter
configurations
4 Associate indicators
5 Locate the fault
comprehensive ly
Exist or not
Handle alarms
Solved or not
Yes
Yes
End
No
No
Exist or not
Handle emergencies
Solved or not
Yes
No
No
Exist or not
Correct wrong parameter
configurations
Solved or not
Yes
No
No
List related indicator counters
RTWPResource
limit indicators
Checkamp analysis of interference
Optimization analysis of
resource limitCounters related to intra-frequency
handover failures
C301391101 C301390593C301391102 C301390594C301391103 C301390595C301390586 C301390596C301390587 C301390597C301390588 C301390598C301390589 C301390599C301390590 C301390600C301390591 C301390601C301390592 C301390602
Solved or not
Yes
Yes
No
Drive Test+RNC signaling
trace
Yes
Counters related to soft handover
failures
30055 3005630057 3005830059 3006030061 30062
Cell hand-inhand-out indicators
ZTE Confidential Proprietary copy 2012 ZTE CORPORATION All rights reserved 35
UMTS KPI Optimization Analysis Guide Internal Use Only
4412 Checking Missed Neighboring Cell Configuration
Generally speaking most of the call drops at the beginning of the optimization are caused by missed neighboring cell configuration The following methods are often used to judge whether the call drops are caused by missed configuration of co-frequency neighboring cells
Observe the active set EcIo information recorded by the UE and the Best Server EcIo information recorded by the Scanner before the call drop If the former record is very bad but the latter record is very good then check whether the Best Server scrambling code recorded by the Scanner appears in the latest list of the neighboring cells under intra-frequency measurement control If it does not then the call drop is caused by missed neighboring cell configuration
If the UE re-accesses immediately after the call drop and the cell scrambling codes during the UE reaccess and those during the call drop are different then the call drop may also be caused by missed neighboring cell configuration You can confirm it through measurement control (look backwards from the message of the call drop event for the latest intra-frequency measurement control message and check the neighboring cell list of this message)
Some UE may report the Detected Set information If the corresponding scrambling code appears in the Detected Set information before the call drop then the call drop is caused by missed neighboring cell configuration
4413 Checking Pilot Pollution
Definition of pilot pollution Excessive strong pilot signals exist at a certain point but none of them is strong enough to be the best server To form pilot pollution the following points in this definition should be satisfied
Strong pilot signal The absolute pilot signal strength is used to judge whether the pilot signal is a strong one The pilot signal strength can be evaluated through the pilot RSCP If the pilot RSCP exceeds a threshold it is considered a strong pilot signal The formula is
AbsoluteRSCPThRSCPCPICH __ gt
Excessive The number of pilot signals is used to judge whether there are excessive pilot signals at a certain point If the number exceeds a threshold it is regarded that excessive pilot signals exist at this point The formula is
NThNumberCPICH gt_
None of them is strong enough to be the best server The relative strength of a pilot signal is a key factor in judging whether the pilot signal is strong enough Based on the above definition and formulae if the difference between the strength of the
ZTE Confidential Proprietary copy 2012 ZTE CORPORATION All rights reserved 36
UMTS KPI Optimization Analysis Guide Internal Use Only
strongest pilot signal and that of the )1( +NTh strongest pilot signal at this point is
less than a threshold it is regarded that there is no pilot signal strong enough to be the best server at this point The formula is
lativeRSCPthThbest ThRSCPCPICHRSCPCPICHN Re_)1( )__( ltminus +
According to the above description it is regarded that pilot pollution exists if the following conditions are both satisfied
The number of pilot signals that meet the condition
AbsoluteRSCPThRSCPCPICH __ gt is more than NTh
lativeRSCPthThbest ThRSCPCPICHRSCPCPICHN Re_)1( )__( ltminus +
For example during the network optimization suppose
dBmTh AbsoluteRSCP 95_ minus= 3=NTh and dBTh lativeRSCP 5Re_ = if the following
conditions are both satisfied then it is regarded that pilot pollution exists
The number of the pilot signals that meet the condition
dBmRSCPCPICH 95_ minusgt is more than 3
dBRSCPCPICHRSCPCPICH thbest 5)__( 4 ltminus
4414 Adjusting Soft Handover Algorithm Parameters
You can solve the following kinds of problems by adjusting handover algorithm parameters
1 The handover is not prompt
From the perspective of the CS service signaling flow the symptom of this problem is that the UE cannot receive Active Set Update (physical channel reallocation in the case of the intra-frequency hard handover) because after the UE reports the measurement report the source cell has a fast reduction in EcIo When the RNC sends Active Set Update the UE has closed the transmitter due to the loss of downlink synchronization Viewed from the UE side it cannot receive Active Set Update In the PS services if the UE cannot receive Active Set Update or TRB resets before the handover the handover will also fail
From the perspective of signals the following phenomena may accompany this problem
ZTE Confidential Proprietary copy 2012 ZTE CORPORATION All rights reserved 37
UMTS KPI Optimization Analysis Guide Internal Use Only
minus Corner effect EcIo of the source cell decreases drastically and EcIo of the target cell increases sharply (very high when it appears)
minus Fast fading EcIo of the source cell decreases quickly for a while and then increases and EcIo of the target cell increases for a short while
2 Pingpong handovers The following phenomena may accompany this problem
The best server changes quickly Two or more cells take turns to be the best server But as the best server none of the cells can last long though they has good RSCPs and EcIos
There is no best server There are multiple cells Their RSCPs are normal and similar to each other But EcIo of every cell is very bad
From the perspective of the signaling flow Event 1A is reported immediately after one cell is deleted Because the UE cannot receive Active Set Update from the RNC the handover fails
4415 Equipment Malfunctions
First check the alarm console to see whether there are abnormal alarms and analyze the message traces at the same time Find out in which step the soft handover fails Check the failure message and contact the local product maintaining engineer to confirm whether the equipment has malfunctions
4416 Solutions
Corresponding adjustments should be taken for the confirmed problems
Handover failures caused by pilot pollution Adjust the engineering parameters of a certain antenna to set this antenna as the best server in this interfered location If the power of one of its sectors is reduced then Io of the pilot pollution area will decrease even if the powers of other pilots are not adjusted EcIo will also increase Thereby the EcIo differences with other scrambling codes in the active set will become larger and pilot pollution will be eliminated Through a lot of research ZTE has proved that the reduction in the pilot transmit power will not change cell capacity greatly If condition allows new base stations can be added to cover this area
Equipment malfunctions Consult the customer service engineers and ask them to help check whether there are alarms and whether the transport layer is abnormal If there are alarms coordinate with the customer service engineers and the engineering personnel to solve the problems
Call drops because the handovers are not prompt
ZTE Confidential Proprietary copy 2012 ZTE CORPORATION All rights reserved 38
UMTS KPI Optimization Analysis Guide Internal Use Only
minus Adjust the antenna to expand the handover zone
minus Configure the Event 1A handover parameters to make the handover easier to happen
minus Increase CIO to make the handover happen earlier in the target cell The sum of CIO and the actually measured value is used for judging the UE events including the UE intra-frequency handover CIO helps shift the cell border in the handover algorithm If CIO is configured with a larger value the handover will be easier to happen and there will be more UE in the soft-handover status but more resources will be occupied If CIO is configured with a smaller value the soft handover will be more difficult to happen and the receiving quality may be impaired A CIO of about 5dB is quite good for eliminating the fast fading and the corner effect but this configuration has some side effects such as the increase of handover proportion
Call drops caused by pingpong handovers Adjust the antenna to form a best server in its coverage zone or set the Event 1B handover parameters (increase the threshold of Event 1B the Event 1B hysteresis or the time to trigger Event 1B) to increase the difficulty in deleting the active set
442 Optimization of Hard Handovers
4421 Classification of Hard handovers
Hard handovers mainly fall into two classifications
Intra-frequency hard handovers The intra-frequency hard handover is triggered only when the intra-frequency softsofter handover cannot be performed and it is applicable to the following circumstances
minus Inter-RNC intra-frequency cell handovers when there is no Iur interface
minus Insufficient Iur interface resources though there is the Iur interface
minus Handovers controlled by the threshold of the PS service rate in the handover cell
The intra-frequency softsofter handovers can not be performed (intra-frequency hard handover should be triggered) in the following scenarios
minus When the intra-frequency handover happens the UE is using the transmit diversity in the active set cell but the target cell does not support the transmit diversity
minus The intra-frequency measurement report does not contain OFF and TM of the
ZTE Confidential Proprietary copy 2012 ZTE CORPORATION All rights reserved 39
UMTS KPI Optimization Analysis Guide Internal Use Only
target cell
minus When the intra-frequency handover happens between RNCs the Iur interface is unavailable
minus The UE performs the multiuser detection in the active set cell but the target cell does not support the multiuser detection
minus The target cell and the original cell belong to different classifications (The cells of R99 R5+R99 and R6+R5+R99 belong to the same classification while the cells of R5 and R6+R5 belong to another classification)
Inter-frequency hard handovers The inter-frequency hard handover means a UE connection is handed over from a cell of a UTRAN frequency to a cell of another frequency Many factors including the radio quality the load and the speed of the moving UE may trigger inter-frequency hard handovers
For example the radio quality triggers the inter-frequency hard handover in the following way
When the quality of the UE radio frequency becomes lower the inter-frequency measurement will be triggered and according to the measurement result the UE connection will be handed over to a better frequency
ZTE Confidential Proprietary copy 2012 ZTE CORPORATION All rights reserved 40
UMTS KPI Optimization Analysis Guide Internal Use Only
4422 Hard Handover Optimization Flowchart
Figure 4-13 Hard handover optimization flowchart
ZTE Confidential Proprietary copy 2012 ZTE CORPORATION All rights reserved 41
UMTS KPI Optimization Analysis Guide Internal Use Only
Extract performance data
TOP Ncell filtering
Analyze a single cell
1 Check NE alarms
2 Associate emergencies
3 Compare parameter
configurations
4 Associate indicators
5 Locate the fault
comprehensive ly
Exist or not
Handle alarms
Solved or not
Yes
Yes
End
No
Exist or not
Handle emergencies
Solved or not
YesNo
Exist or not
Correct wrong parameter
configurations
Solved or not
Yes
No
No
List related indicator counters
RTWPResource
limit indicators
Checkamp analysis of interference
Optimization analysis of
resource limit
Counters related to inter-frequency handover failures
C301110489 C301110516C301110499 C301110517C301110500 C301110518C301110501 C301110519C301110502 C301110520C301110503 C301110521C301110504 C301110522C301110505 C301110523
Solved or not
Yes
Yes
No
Drive Test+RNC signaling
trace
Yes
Counters related to hard handover
failures
30041 3004230043 3004430045 3004630047 30048
Cell hand-inhand-out indicators
NoNo
ZTE Confidential Proprietary copy 2012 ZTE CORPORATION All rights reserved 42
UMTS KPI Optimization Analysis Guide Internal Use Only
4423 Hard Handover Optimization Methods
The optimization flow for the hard handover is similar to that of the soft handover The major differences are in the parameter optimization To optimize intra-frequency hard handovers you can properly reduce the Event 1D hysteresis and the time to trigger Event 1D according to the real radio environment to ensure timely handovers
Inter-frequency coverage is often applied to some special scenarios such as indoor coverage and tested through CQT The method of judging whether there is missed configuration of the inter-frequency neighboring cell is almost the same as that of the co-frequency neighboring cell when a call drop occurs the UE fails to measure or report the inter-frequency neighboring cell after the call drop the UE resides in the inter-frequency neighboring cell again
The common hard handover problems are
1 The handover is not prompt The common symptoms are frequent call drops in the hard handovers when the UE moves
Solutions
Increase the threshold of activating the compressing mode The compressing mode is usually activated before the inter-frequency handover or the inter-RAT handover and it is used to measure the quality of the inter-frequency or inter-RAT cell You can set a threshold of the CPICH RSCP or EcIo to activate the compressing mode And the RSCP is widely used
minus Requirements on setting the threshold of activating the compressing mode Before the cell quality becomes low enough to cause a call drop the signal of the target cell should be measured and reported and the handover should be performed
minus Requirement on setting the threshold of deactivating the compression mode Frequent activationdeactivation of the compression mode should be avoided
Increase CIOs of the inter-frequency cell pair
Reduce the threshold of triggering the target frequency handover under the inter-frequency coverage
2 There are pingpong handovers
Solution Increase the hard handover hysteresis and the time to trigger the event
ZTE Confidential Proprietary copy 2012 ZTE CORPORATION All rights reserved 43
UMTS KPI Optimization Analysis Guide Internal Use Only
443 Optimization of Inter-RAT Handovers
4431 Configuring Basic Inter-RAT Parameters
Most of the inter-RAT handover failures are caused by incomplete parameter configuration The following parameters need special attention
Complete RNC parameter configuration for the GSM neighboring cell The 2G system shall provide the 3G system with the correct radio parameters based on negotiation mdash MCC MNC LAC ID (CI) NCC BCC frequency band indicator (900 or 1800) and BCCH
Table 4-3 Parameters That 2G Shall Provide to 3G
MCC MNC LACIDCI
NCC BCCFrequency
band indicator
BCCH
460 2 202 193 0 0 900 102
Complete GSM BSC parameter configuration for the WCDMA neighboring cell The 3G system shall provide the 2G system with the correct radio parameters based on negotiation mdash MCC MNC LAC RNC ID cell ID (C_ID) downlink frequency scrambling code and RAC
Table 4-4 Parameters That 3G Shall Provide to 2G
MCC MNC LACRNC
IDCell IDC_ID
Downlink frequency
Scrambling code
RAC
460 3 20 18 51 10787 51 20
According to the current strategy of one-way inter-RAT handovers if the parameter configuration is complete one probable cause of the inter-RAT handover failure is that the handover is not prompt The common parameter adjustment is to increase CIO the threshold to activatedeactivate the compressing mode and the threshold to trigger the WCDMA-to-GSM handover at the same time
Call drops during the inter-RAT handovers between WCDMA and GSM may be caused by
minus Inconsistent data configuration at the GSM side and the WCDMA side after GSM modifies the configuration data but does not inform WCDMA
minus Missed configuration of neighboring cells which can be solved by the correct configuration of neighboring cells
minus Too fast signal changes
ZTE Confidential Proprietary copy 2012 ZTE CORPORATION All rights reserved 44
UMTS KPI Optimization Analysis Guide Internal Use Only
minus Pingpong reselection
minus Faults with the UE for example the UE fails to respond to the handover or report the inter-RAT measurement report
minus Changes of the best server during the physical channel reallocation
minus Wrong LAC configuration which can be located through data configuration check
ZTE Confidential Proprietary copy 2012 ZTE CORPORATION All rights reserved 45
UMTS KPI Optimization Analysis Guide Internal Use Only
4432 Inter-RAT Handover Optimization Flowchart
Figure 4-14 Inter-RAT handover optimization flowchart
ZTE Confidential Proprietary copy 2012 ZTE CORPORATION All rights reserved 46
UMTS KPI Optimization Analysis Guide Internal Use Only
Extract performance data
TOP Ncell filtering
Analyze a single cell
1 Check NE alarms
2 Associate emergencies
3 Compare parameter
configurations
4 Associate indicators
5 Locate the fault
comprehensive ly
Exist or not
Handle alarms
Solved or not
Yes
Yes
End
No
No
Exist or not
Handle emergencies
Solved or not
Yes
No
No
Exist or not
Correct wrong parameter
configurations
Solved or not
Yes
No
No
List related indicator counters
RTWPResource
limit indicators
Checkamp analysis of interference
Optimization analysis of
resource limitCounters related to inter-RAT handover failures
C301130667 C301130681C301130668 C301130682C301130669 C301130690C301130670 C301130691C301130671 C301130692C301130672 C301130693C301130673 C301130694C301130674 C301130696C301130675 C301130697C301130677 C301130698C301130678 C301130699C301130679 C301130700
C301130680
Solved or not
Yes
Yes
No
Drive Test+RNC signaling
trace
Yes
Counters related to inter-RAT handover
failures
Cell hand-inhand-out indicators
30049 3005030051 3005230053 30054
ZTE Confidential Proprietary copy 2012 ZTE CORPORATION All rights reserved 47
UMTS KPI Optimization Analysis Guide Internal Use Only
45 Optimization of Resource Indicators
The resource indicators directly reflect the system capacity Increasing subscribers will consume more system resources and some resources may be limited for example the code resource may be limited the TCP access request may be rejected and the CE resource usage rate may exceed the threshold Limited system resources have a negative influence on the whole-network indicators and the subscribersrsquo perception for example call drops may frequently happen and more TCP access requests may be rejected during the voice services
Table 4-5 Resource KPIs and Alarm Thresholds
Resource type KPI No and nameAlarm
threshold
TCP
C301320150 Number of rejected services DCH downlink TCP limit
50
PI30167 Average non-HS (SOA) (SOA)DPA TCP 40
PI30092 Maximum Cell TCP () 100
PI30093 Average Cell TCP 70
UL TrafficPI30029 Handover Blocking Rate 05
KPI RTWP (in busy hour) -98 dBm
Code
C301320153 Number of rejected services DCH no code
50
PI30205 Average Cell HSUPA Users 12
PI30172 Cell Average HSDPA Users 16
CE
PI301830006 Maximum use Ratio of Uplink NodeB CE
60
PI301830010 Maximum use Ratio of Downlink NodeB CE
60
ZTE Confidential Proprietary copy 2012 ZTE CORPORATION All rights reserved 48
UMTS KPI Optimization Analysis Guide Internal Use Only
451 Resource Indicator Optimization Flowchart
Figure 4-15 Resource indicator optimization flowchart
ZTE Confidential Proprietary copy 2012 ZTE CORPORATION All rights reserved 49
UMTS KPI Optimization Analysis Guide Internal Use Only
Extract performance data
TOP Ncell filtering
Analyze a single cell
1 Check NE alarms
2 Associate emergencies
3 Compare parameter
configurations
4 Associate indicators
5 Locate the fault
comprehensive ly
Exist or not
Handle alarms
Solved or not
Yes
是
End
No
No
Exist or not
Handle emergencies
Solved or not
Yes
No
No
Exist or not
Correct wrong parameter
configurations
Solved or not
Yes
No
No
List related indicator counters
Code resource indicators
CE resource indicators
TCPadmission
reject counter
C301320150
Solved or not
Yes
Yes
No
Drive Test+RNC signaling
trace
Yes
Counter related to TCP limit
Cell TX power
indicators
30090 3009130092 3009330166 3016730168 3016930170 30171
30163301643016530075
30223302243045030451
Yes
Yes
ZTE Confidential Proprietary copy 2012 ZTE CORPORATION All rights reserved 50
UMTS KPI Optimization Analysis Guide Internal Use Only
452 Code Resource Optimization
The statistics of Number of rejected services and DCH no code the average code resource usage rate and the number of the HSDPA subscribers can be used to judge whether the code resource in a cell is limited If the code resource is limited you can adjust the code resource allocation to alleviate the situation
Based on the system algorithm when Formula 1 is satisfied you can add an HS-PDSCH when Formula 2 is satisfied then an HS-PDSCH is deleted
Formula 1 OcuRateNoHspdsch + OcuRateHspdsch + DpchCodeHy + 32 lt= 512
Formula 2 OcuRateNoHspdsch + OcuRateHspdsch + CodeUptHyA gt 512
OcuRateHspdschHSPDSCH means the number of the codes of SF=512 blocked by the HS-PDSCH OcuRateNoHspdsch means the number of codes of SF=512 blocked by other channels DpchCodeHy means the number of codes of SF=512 reserved for the DPCH and CodeUptHyA is the threshold to decide whether to delete the HSPDSCH
Therefore to ensure the access of the R99 subscribers you can make some adjustment according to Table 4-6 when the code resource is limited though the HSDPA rate may decrease
Table 4-6 Adjusting Code Resource Allocation
AbbreviationParameter
nameRange
and stepCurrent value
Update value
Remark
DpchCodeHy DPCH Code Hysteresis
0512 16 28
To decrease the number of rejected services for DCH no code
CodeUptHyACode Update Hysteresis A
0512 16 28
To decrease the number of rejected services for DCH no code
453 Monitoring CE Resource
The CE resource is mainly monitored through the maximum UE uplinkdownlink usage rate If there is any problem you can solve it by controlling the load or adding more boards
ZTE Confidential Proprietary copy 2012 ZTE CORPORATION All rights reserved 51
UMTS KPI Optimization Analysis Guide Internal Use Only
454 Optimization of Power Control
4541 Monitoring and Optimizing Downlink Power Control
Limited TCP in busy hours will not only increase access failures and call drops in the local cell but also increase soft handover failures and call drops in the neighboring cells Number of rejected services and DCH downlink TCP limit are intuitive KPIs to judge whether TCP is limited Although limited uplink capacity and massive UE moves in the rush hours may also cause call drops the limited TCP is absolutely a key factor
Based on the system algorithm MinHsdpaPower (MinHspaPwrRto) + NoHsPower gtNode B if the safety threshold is used (MinHsdpaPower means the power reserved for HSPA) then it will activate the downlink rate downgrade algorithm flow for the congestion (lower the downlink DCH rate) Although the rate downgrade can ensure access of some subscribers it is an irregular action and will degrade the performance
455 Speeding up Rate Downgrade
Considering that the cells with heavy load reject more access requests you can speed up the rate downgrade during the resource congestion to release the resources as soon as possible and avoid call drops caused by access failures (this method is only applicable to the cells with many PS service users but not those with only CS service users) Table 4-7 is an example of the parameter modification for the rate downgrade
Table 4-7 Example of Parameter Modification for Rate Downgrade
Abbreviation Parameter nameRange and
stepCurrent value
Update value
Remark
UlDnMaxStg Maximum Number of Degraded Uplink Load Steps Every Time
[1 8] 1 2 Downgrade from 384 Kbps to 16 Kbps
DlDnMaxStg Maximum Number of Degraded Downlink Load Steps Every Time
[1 8] 1 3 Downgrade from 384 Kbps to 8 Kbps
456 Monitoring and Optimizing Uplink Capacity
Handover Blocking Rate and RTWP can reflect the uplink capacity of the cell Because interference may also increase RTWP this factor should be distinguished during the RTWP monitoring Another effective indicator is the voice service erl If a cell has over 20 erls in busy hours you should pay special attention to it
ZTE Confidential Proprietary copy 2012 ZTE CORPORATION All rights reserved 52
UMTS KPI Optimization Analysis Guide Internal Use Only
457 Optimization of Uplink Capacity at the Whole Network Level
Case The uplink capacity was limited in a large number of sites after the cutover and the symptoms are a sharp rise of RTWP and a high call drop rate during the rush hours
After the following parameters were modified as shown in Table 4-8 the problem was solved
Table 4-8 Example of Power Control Parameter Modification
AbbreviationParameter
nameRange
Current value
Update value
ULINITSIRUplink Initial SIR target (dB)
UL 34 K136 K signaling UL 122 K AMR
4-5 35
ULMAXSIRMaximum Uplink SIR target (dB)
UL 34 K136 K signaling UL 122 K AMR
15 10
UlSirTargDnStepUplink SIR Target Down Step Size (dB)
UL 34 K136 K signaling UL 122 K AMR
01 02
458 Optimization of Uplink Capacity for a Single Cell
A lot of optimization measures can be taken to bring down the rising RTWP However with increasing subscribers the capacity may still be limited in some area while further modification of SirTarget will obviously degrade the call quality of the whole network and undermine the subscribersrsquo perception In this case you can adjust the power control parameters for a single site that has heavy traffic in the following way add one set of DivPc parameters and use this set of parameters only for this site
Case Table 4-9 shows an example of the power control parameter modification After this modification the call drop rate in the site with heavy traffic decreased to one quarter of the original one
Table 4-9 Example of Power Control Parameter Modification for Heavy-Traffic Cell
SRVTYPE ULINITSIR ULMAXSIR ULMINSIR
0 35-gt15 100-gt35 20-gt10
104 40-gt20 150-gt50 05-gt0
28 35-gt15 100-gt35 05-gt0
50 60-gt20 150-gt50 20-gt0
54 60-gt20 150-gt50 20-gt0
ZTE Confidential Proprietary copy 2012 ZTE CORPORATION All rights reserved 53
UMTS KPI Optimization Analysis Guide Internal Use Only
25 KPI Monitoring During Cutover
For the network on which the equipment needs to be replaced (for instance HongKong CSL network for which we replaced Nokiarsquos equipment with ZTErsquos) after the network optimization is completed the subscribers on the existing network should be cut over to our network gradually During the cutover there will be subscribers registering on our network constantly which will cause load increase on the network In this case we should watch KPI changes closely The monitoring process items method and report are the same as those described in section 24 ldquoKPI Monitoring During RNC or NodeB VersionUpgraderdquo Please read it for reference
3 KPI Analysis Methods
31 KPI Analysis Methods
Different network problems require different performance analysis methods Choose one or more appropriate methods after learning the running state of the existing network and the problems with it Common analysis methods are as follows
TOP N worst cells method Based on the traffic statistics indicators we care about (such as the call drop rate connection rate and soft handoff failure rate) choose N worst cells whose average indicator values in the peak hours or of the whole day are the lowest as the target of fault analysis and optimization Or prioritize objects of optimization against these indicator values
Time tendency chart method Tendency chart of indicator change is commonly used in the traffic analysis The analysis engineer can work out an hourly daily or weekly tendency chart of one or more indicators of the whole network a cluster or a single cell and find out the change rule of traffic statistics indicators
Regional location method The change of network performance indicators often occurs in some regions The indicators in these regions may be worsened by traffic increase traffic mode change radio environment change faults with a small number of stations or uplinkdownlink interference which will therefore affect the performance indicators of the whole network By comparing the network performance indicators before and after the change we can mark out the station or the sector with the greatest indicator change on an electronic map and take these problem regions as the analysis focus
Comparison method A single traffic statistics indicator may be affected by many factors While some factors change others may not Choose a proper object for comparison to confirm the existence of problems and then analyze the causes of the problems When examining an indicator do not care whether the absolute indicator value is high or low only pay more attention to whether the value is high or low compared to other indicators instead
ZTE Confidential Proprietary copy 2012 ZTE CORPORATION All rights reserved 6
UMTS KPI Optimization Analysis Guide Internal Use Only
311 TOP N Worst Cells Method
During the whole process of KPI optimization analysis TOP N worst cells analysis method is the most effective one which can be used throughout the whole optimization phase By focusing on the TOP N worst cells you can solve the major problems with the network Abnormal call drop events may happen every day and these events may represent problems of a kind After solving the problems with TOP N cells you can solve the problems of the same kind Therefore focusing on TOP N cells is one of the most effective ways to solve problems
TOP N worst cells analysis method is applicable to the optimization analysis of all the indicators Choose TOP N worst cells according to a certain threshold which varies depending on different indicators N stands for the number of the worst cells When the worst cells are too many to be worked on the number of the worst cells can be decreased so that you can focus on them TOP N cells analysis method includes the following steps
Step 1 Screen out TOP N cells according to the condition of the indicators you care about
Step 2 Conduct a health check for TOP N cells Check whether there are any problems with transmission or boards and check whether the worst cells are caused by external abrupt incidents such as terrible weather gatherings or holiday (because during gatherings and holidays the traffic is usually heavy)
Step 3 Check the radio parameters configuration of these cells the radius of these cells and their neighboring cells and compare them with the normal cells
Step 4 Export the indicator relevant most closely with the indicators you care about and analyze it to find the problem indirectly
For instance one day CS call drop rate of a whole network was high We analyzed the problem by the TOP N cells analysis method
Step 1 Screen out TOP N cells according to the condition of the indicators you care about
We used the CNO KPI analysis function to screen out TOP N cells (other tools can be also used) and selected 10 cells with the highest CS call drop rate
Table 3-1 List of CS TOP N Worst Cells
Index Cell RNS subnet ID Cell IDCall drop
rate CS AMRNumber of call
drop voice
1 ZBL1U-AI-1 (201) 12911 4158 553
2 ZBL1U-AI-3 (201) 12913 3955 545
3HKE1U-5H-1
(203) 30461 1556 370
ZTE Confidential Proprietary copy 2012 ZTE CORPORATION All rights reserved 7
UMTS KPI Optimization Analysis Guide Internal Use Only
Index Cell RNS subnet ID Cell IDCall drop
rate CS AMRNumber of call
drop voice
4HKE1U-5H-3
(203) 30463 1581 360
5LAK1U-9M-3
(202) 11063 339 282
6 HIC1U-9R-1 RNC101(101) 10891 226 216
7LAK1U-9M-1
(202) 11061 249 215
8EBP1U-9R-3
RNC101(101) 12823 230 205
9SRS1U-5H-1
RNC102-CSL(102)
12091 392 169
10HRM1U-6R-1
RNC102-CSL(102)
20671 341 167
Step 2 Check the transmission and hardware of the TOP N cells and check whether they are caused by external abrupt incidents such as terrible whether gatherings or holidays when traffic is usually heavy
And then we conducted a health check for each cell and paid attention to routine alarms and BPC board problems We found there were broken associations in some HKE sites
Step 3 Check the radio parameters configuration of these cells the radius of these cells and their neighboring cells and compare them with the normal cells
(1)Problem with the cell radius After the check we found the cell radius of the LAK site was 25 km Because the LAK site was situated by the sea and the antenna was placed very high the radius of 25 km was far from enough So we changed the cell radius to 10 km and the problem of high call drop rate was thus solved
(2)Problem with configuration HIC site is an indoor POI site The RRU RxTx port and the RRU Rx port were configured reversely which is the cause of high call drop rate After modifying HIC we found that signals of the second RRU were received by the Rx port So we changed the configuration of the RxTx port and the Rx port the problem of high call drop rate was thus solved
Figure 3-5 RF configuration at HIC site
Figure 3-6 Antenna energy distribution at HIC site
ZTE Confidential Proprietary copy 2012 ZTE CORPORATION All rights reserved 8
UMTS KPI Optimization Analysis Guide Internal Use Only
Step 4 Export the indicator relevant most closely with the indicators you care about and analyze it to find the problem indirectly
Table 3-2 Indicators Related with CS Call Drop
Index Cell
RAB release number for Iu connection
release request by UTRAN for CS domain in
cell radio connection with UE lost
RAB release number for Iu connection
release request by UTRAN for CS domain in cell failure in
the radio Interface
procedure
RAB release number for Iu connection
release request by
UTRAN for CS domain in
cell release due to
overload control
RAB release number for Iu connection
release request by
UTRAN for CS domain in
cell unspecified
failure
Average cell freq RTWP (dbm)
1ZBL1U-AI-1
482 43 0 29 -104177
2ZBL1U-AI-3
473 40 0 33 -104125
3HKE1U-5H-1
346 16 0 8 -105908
4HKE1U-5H-3
330 18 0 13 -1060777
5LAK1U-9M-3
69 196 0 18 -1031906
6HIC1U-9R-1
100 100 0 16 -1015404
7 LAK1U- 64 131 0 20 -1031934
ZTE Confidential Proprietary copy 2012 ZTE CORPORATION All rights reserved 9
UMTS KPI Optimization Analysis Guide Internal Use Only
Index Cell
RAB release number for Iu connection
release request by UTRAN for CS domain in
cell radio connection with UE lost
RAB release number for Iu connection
release request by UTRAN for CS domain in cell failure in
the radio Interface
procedure
RAB release number for Iu connection
release request by
UTRAN for CS domain in
cell release due to
overload control
RAB release number for Iu connection
release request by
UTRAN for CS domain in
cell unspecified
failure
Average cell freq RTWP (dbm)
9M-1
8EBP1U-9R-3
98 90 0 17 -101413
9SRS1U-5H-1
87 59 0 22 -1043528
10HRM1U-6R-1
42 111 0 13 -1027697
32 Basic KPI Analysis Skills
Be able to use the KPI statistics tool and the analysis tool
Use tools to learn about the running state of the whole network quickly and screen out TOP N worst cells quickly
Use different analysis tools to find problems from different aspects and locate the problem quickly
Understand the signaling process and basic principle
In the process of abnormity location keep a clear aim in mind and be able to apply the process and basic principle to check the other relevant indicators rapidly to facilitate the analysis
Be familiar with the process and basic principle and be able to make logical association between abnormal KPI problems and network problems (such as the coverage problem and the interference problem) Be able to determine the problem nature according to the abnormal KPI and then choose the appropriate tool to analyze the problem in depth
Performance analysis requires engineers to understand basic signaling process be familiar with the protocol stacks of standard interfaces and know relevant algorithms to realize the product functions Engineers should at least have a concept about the various algorithms If the analysis of a commercial network involves some algorithms engineers should study these algorithms in depth
ZTE Confidential Proprietary copy 2012 ZTE CORPORATION All rights reserved 10
UMTS KPI Optimization Analysis Guide Internal Use Only
321 KPI Monitoring Tools
minus Network management tool NetNumenT31 count KPI original data alarm data radio parameter configuration in cells and parameter configuration on the earth
minus KPI daily report generating tool classify key indicators according to a certain condition and screen out the worst cells
322 KPI Analysis Tools
minus CNO Tool CNO tool has the KPI analysis function So using it you can screen out the worst cells according to various conditions and point out the corresponding counter of an indicator
minus SignalTrace Trace the signaling (RNL signaling and RNL signaling) of RNC interfaces which includes the Iu interface the Iur interface the Iub interface and the Uu interface (the signaling flow between RNC and UE at RRC layer) And RNL signaling trace is a common way for locating the KPI problem Being able to trace the RNC signaling is a basic requirement for the on-site KPI optimization engineers and the network optimization and maintenance engineers This signaling tracing tool is very powerful which can trace signaling according to the UE cell and IMSI in the KPI analysis According to the UE cell it can trace the signaling of multiple subscribers while according to IMSI it can trace the signaling of only one subscriber However if the RRC connection is not established yet signaling cannot be traced That is because only when RRC connection has been established can the RNC obtain the subscriberrsquos IMSI from the CN
minus RNC ASS Log ASS log is usually applied when there is abnormity and RNC signaling is out of trace In this case use ASS log to analyze the signaling before and after the abnormity occurs Abnormity can be queried according to IMSI or cell ID ASS log can be also used to collect various abnormities
minus NodeB LMT NodeB local operation and maintenance tool Apart from all the operation functions of the OMCB this tool can collect more detailed information about cells and UE NodeB local maintenance terminals include EOMS EFMS DMS and PMS
minus NodeB Abnormity Probe On the site of WCDMA commercial office NodeB abnormity probe is an effective tool to monitor the running state of the NodeB Every module of NodeB can record the abnormal information automatically which makes it easy to locate problems However this method requires professional knowledge such as knowledge about the function and interface of each module or board If the on-site engineers cannot make the simple analysis they can just obtain the abnormity probe and send it to the RampD engineers at the rear side The abnormities reported on the NodeB will be stored at the OMCB server according to different RNCs To conduct NodeB
ZTE Confidential Proprietary copy 2012 ZTE CORPORATION All rights reserved 11
UMTS KPI Optimization Analysis Guide Internal Use Only
abnormity probe analysis you need to download abnormity probe files from different OMCB servers and then use the abnormity probe tool to make a comprehensive analysis
minus CTS Tool CTS is a tool developed by the CN department which can trace signaling in depth according to IMSI and trace signaling across RNCs So this is particularly suitable to trace VIP subscribers In this case CTS is easier to use than SignalTrace which can only trace signaling of RNCs one by one CTS can trace the interactive signaling between network elements (NEs) within the CN as well as the signaling of the Iu interface and the Uu interface This kind of signaling tracing is what we called in-depth tracing The work principle of CTS is to set up an IMSI task on the CTS server and send it to the CN front side which will then send this task to each CN module via the interfaces dedicated to the CN modules and the RNC and then each module after receiving the signaling related to the IMSI task will send the signaling back to the CTS server via the CN front side The interfaces mentioned above are private interfaces so this tool can only support our own CN and RNC CTS signaling can be checked and analyzed with an offline tool but the offline tool does not work very well because of the lack of continuous optimization and perfection
minus UE log DT test is also an important auxiliary way in analyzing KPI indicators There are many problems that cannot be located by tracing signaling at the network side and can only be located by the use of UE log The commonly used drive test software includes QXDMAPEX (QCAT) CNTCAN and TEMS CNTCAN and TEMS are often used for network optimization For the use of CNTCAN please refer to the corresponding help file and the instruction document publicly released by the Network Optimization Tool Department QXDM and the analysis tool APEX (QCAT) provided by Qualcomm is very powerful which have contributed a lot for the stability and maturity of our system for many years
33 General Process of KPI Optimization Analysis
Basic analyzing ideas
KPI optimization is a process to find and solve problems KPI optimization during the operation and maintenance stage is mainly to pick out the performance data that needs special attention from the OMC classify these performance data and then compare the value of these data with that required by the operator If the value of an indicator is lower than the operatorrsquos requirement analyze this indicator and find out the factor that affect the indicator and then propose a solution to the operator If the values are higher than the operatorrsquos requirement therersquos no need to pay special attention to them
KPI analysis is a process from the whole to the part
Step 1 Check the key indicators from the view of the whole network If there is not any
ZTE Confidential Proprietary copy 2012 ZTE CORPORATION All rights reserved 12
UMTS KPI Optimization Analysis Guide Internal Use Only
problem just ignore them Otherwise try to locate the RNC NE that has the problem
Step 2 Analyze the indicators of the corresponding RNC to find out the RNC whose indicators have the problem
Step 3 Analyze the indicators of the cell under the problem RNC to find out the worst cells or TOP N cells If the indicators of all the cells under the RNC are tend to be low it is a common problem probably caused by parameter configuration And then check whether the radio parameter configuration in the cells under this RNC is the same as that in the cells under the normal RNCs
Step 4 Make a comprehensive analysis on the KPIs alarms DT test data and customer complains of the worst cells to find out a solution
Analysis method
After learning the KPI analysis ideas we must know some common KPI analysis methods to rule out causes of problems from the obvious ones to the hidden ones
For example we found that the TCP code words were strictly limited at eight sites near a park and the call drop rate rose suddenly How to solve this problem
Method one First we checked whether the alarms transmission and boards of these sites were normal After they are proved all normal we sent some engineers to the site to do test And meanwhile we traced the RNC signaling at the OMC It turned out that the test result was normal and the indicators of these sites of that day did not have any problem and code words were not limited And later we knew from the news that there was a big gathering of about one million people at the park at that moment Until then we came to know that the congestion was caused by too many users using the network at the same time
Method two First because the eight sites went worse all of a sudden it was unlikely that the problem lied in the hardware Then we checked whether the radio parameters had been modified the day before The result is no worksheet had been issued to modify those parameters and no alarm was found at those sites Therefore we excluded the possibility of hardware problem Then we checked the traffic trend graph of the last few days (over seven days) and found that the high call drop rate might be caused by high traffic The graph showed that traffic of each site rose suddenly on the day before Thus we came to the conclusion that this was an abnormal abrupt event which may have been caused by a gathering And later we were told that there was a big gathering at the park So we were assured the code words limitation and high call drop rate at the eight sites were caused by too many subscribers using the network at the same time
By comparing the two methods above we can find that although the first one (sending engineers to the site without the consideration of abnormal events) is commonly used it is inefficient and costs more resource The second method (analyzing the problem by the means of exclusion and association) is more efficient From this case we would like to emphasize that KPI analysis is a process of problem exclusion Using the comprehensive
ZTE Confidential Proprietary copy 2012 ZTE CORPORATION All rights reserved 13
UMTS KPI Optimization Analysis Guide Internal Use Only
methods (like Method One) at the first brush may be making a detour
minus Exclusion method Check the alarms on the OMC to learn about the state of the RNC NodeB BPC board and the transmission If there are obvious broken link in transmission or hardware problem the cause of the problem is easy to locate
minus Incident association If the problem is with a great number of sites take abrupt incidents into account such as large-scale gathering terrible weather of incorrect operation These incidents will put influence of different levels and ranges on the network indicators
minus Comparison of radio parameters If some site goes wrong in a sudden check whether the radio parameter configuration of this site is consistent with that of other normal sites If not change it as that of the normal sites because the indicator decrease may be caused by an incorrect modification of radio parameters
minus Relevant indicators association If a certain indicator is in poor condition check its relevant indicators and find the common problem from these relevant indicators
minus Comprehensive problem location When the above reasons are excluded use DT data KPI data RNC signaling analysis data to locate the problem with indicators comprehensively
ZTE Confidential Proprietary copy 2012 ZTE CORPORATION All rights reserved 14
UMTS KPI Optimization Analysis Guide Internal Use Only
Figure 3-7 KPI optimization analysis process
StartPick out
performance indexes
RNC index abnormal
Equipment alarms exist
Deal with equipment alarms
RNC index recovers
Common problem with the
worst cells
Transmission softwarehardware version wireless
parameter configuration
CNRNC Transmission
Hardware Software Interference
Wireless parameters
Time range
Abrupt and self-curable abnormality
helliphellip
Analyze and record causes
Suggestion about improvement
Common problems analysis
Problem resolved
Successful call
Call drop Soft handover
23G alternate operation
PS rate helliphellip
Deal with the relevant problem
Indexes normal
End
Climate change holidays assembly
transmission interruption power
fault and so on
Y
N
Y
Y
N
Y
N
Abnormal indexes analysis in one cell
Y
N
N
N
Y
N
Y
Show TOPN abnormal cells
and their locations
If the problem is proved to be equipment bug or system problem after
several attempts feed it back to RampD dept
ZTE Confidential Proprietary copy 2012 ZTE CORPORATION All rights reserved 15
UMTS KPI Optimization Analysis Guide Internal Use Only
4 KPI Optimization Analysis This chapter mainly demonstrates how to analyze the indicator problems from the aspect of OMC data and provides flowcharts for KPI optimization The detailed analyzing method and cases of every special subject can be checked in the optimization guides of all the subjects
41 CS Call Drop Optimization
The CS call drop rate is the most important indicator in KPI optimization
411 Definition of Call Drop
After checking the signaling on the Uu interface at the UE side the engineer can judge the situation a call drop if the Uu interface message satisfies one of the following three conditions during the calling process (in connection)
RNC Release is not received but the UE condition changes from CELL_DCH to IDLE
RRC Release is received and the released cause value is Not Normal
One of the following three messages mdash CC Disconnect CC Release Complete and CC Release mdash is received and the released cause value is Not Normal Clearing or Not Normal Unspecified
In a board sense the call drop includes the call drop rates of CN and UTRAN The call drop of UTRAN includes the following two aspects
After the successful service establishment RNC sends the RAB Release Request to CN
After the successful service establishment RNC sends the IU Release Request to CN Later RNC receives the IU Release Command from CN
Note that RAN call drop statistics which is defined from the aspect of lu interface signaling means the launching times of RAB Release Request and lu Release Request of RNC And the DT call drop statistics is defined from the aspects of the Uu interface message non-access stratum message and cause value RAN call drop statistics and DT call drop statistics are not exactly the same
ZTE Confidential Proprietary copy 2012 ZTE CORPORATION All rights reserved 16
UMTS KPI Optimization Analysis Guide Internal Use Only
412 CS Call Drop Analysis Flowchart
Figure 4-8 CS call drop analysis flowchart
ZTE Confidential Proprietary copy 2012 ZTE CORPORATION All rights reserved 17
UMTS KPI Optimization Analysis Guide Internal Use Only
Extract performance data
CS TOP Ncell filtering
Analyze a single cell
1 Check NE alarms
2 Associate emergencies
3 Compare parameter
configurations
4 Associate indicators
5 Locate the fault
comprehensively
Exist or not
Handle alarms
Solved or not
Yes
Yes
End
No
No
Exist or not
Handle emergencies
Solved or not
Yes
No
No
Exist or not
Correct wrong parameter
configurations
Solved or not
Yes
No
No
List related indicator counters
Call-drop-related
countersRTWP
Handover success rate
Traffic volume
Resource limit indicators
Checkamp analysis of
interference
Optimizationanalysis of
handover failures
Optimization analysis of
resource limitCall-drop-
related counters
C301230362C301230363C301230365C301230315C301230316C301230318C301230319C301230322C301230323
Solved or not
Yes
Yes
No
Drive Test+RNC signaling
trace
Yes
ZTE Confidential Proprietary copy 2012 ZTE CORPORATION All rights reserved 18
UMTS KPI Optimization Analysis Guide Internal Use Only
42 PS Call Drop Optimization
421 Optimization Flowchart
Figure 4-9 PS call drop optimization flowchart
ZTE Confidential Proprietary copy 2012 ZTE CORPORATION All rights reserved 19
UMTS KPI Optimization Analysis Guide Internal Use Only
Extract performance data
PS TOP Ncell filtering
Analyze a single cell
1 Check NE alarms
2 Associate emergencies
3 Compare parameter
configurations
4 Associate indicators
5 Locate the fault
comprehensive ly
Exist or not
Handle alarms
Solved or not
Yes
Yes
End
No
No
Exist or not
Handle emergencies
Solved or not
Yes
No
No
Exist or not
Correct wrong parameter
configurations
Solved or not
Yes
No
No
List related indicator counters
Call -drop-related
countersRTWP
Handover success rate
Traffic volume
Resource limit indicators
Check amp analysis of interference
Optimizationanalysis of
handover failures
Optimization analysis of
resource limitCall -drop-
related counters
C301230372C301230373C301230375C301230330C301230332C301230333C301230334C301230337C301230338
Solved or not
Yes
Yes
No
Drive Test +RNC signaling
trace
Yes
ZTE Confidential Proprietary copy 2012 ZTE CORPORATION All rights reserved 20
UMTS KPI Optimization Analysis Guide Internal Use Only
43 Optimization of Accessibility Indicators
Accessibility performance includes the success rate of RRC connection setup and the success rate of CSPS RAB assignment These two kinds of KPIs play important roles in the network optimization and directly influence the success rate of CSPS service establishment In this document this kind of problems are found from the aspect of OMC data and solved through parameter optimization
431 Definition of Access Failure
For the mobile originated call in the CS domain the access failure event means that the UE sends RRC REQUEST and IE establish cause is Originating Conversational Call but alerting of the direct transfer message is not received
The relevant events are defined as follows in the access failure stage
RRC connection setup failure After considering the resending times and the waiting time the UE sends RRC CONNECTION REQUEST and does not receive the response from RNC or RRC CONNECTION REJECT delivered by RNC
Initial direct transfer and security mode establishment failure After sending RRC CONNECTION SETUP COMPLETE the UE does not send NAS SETUP
RAB assignment failure After receiving CALL PROCEEDING the UE does not receive RB SETUP delivered by RNC Or the UE replies with RB SETUP FAIL after receiving RB SETUP Or the UE receives DISCONNECT with the cause value not being Normal Release after receiving RB SETUP At this time the UE has not reported RB SETUP CMP
Failure after RAB assignment After the UE sends RB SETUP COMPLETE the originating UE receives DISCONNECTRELEASE from CN Or the UE waits CONNECT or ALERTING overtime and launches the Call Clearing process Or the UE becomes IDLE before receiving Alerting and starts to receive the system message
For the mobile terminated in the CS domain the access failure event means that the terminating UE receives the paging of paging type 1 and does not send RRC CONNECTION REQUEST with the cause value being Terminating Conversational Call Or the UE does not send the alerting of direct transfer message to CN after sending RRC CONNECTION REQUEST
The relevant events are defined as follows in the access failure stage
RRC connection setup failure After sending RRC CONNECTION REQUEST the UE does not receive the response from RNC or RRC CONNECTION REJECT delivered by RNC
Initial direct transfer and security mode establishment failure After sending RRC
ZTE Confidential Proprietary copy 2012 ZTE CORPORATION All rights reserved 21
UMTS KPI Optimization Analysis Guide Internal Use Only
CONNECTION SETUP COMPLETE the UE does not receive the SETUP direct transfer message Or the UE sends RELEASE COMPLETE Or the UE receives DISCONNECT from CN
RAB assignment failure The UE does not receive RB SETUP delivered by RNC after sending CALL CONFIRM Or the UE replies with RB SETUP FAIL after receiving RB SETUP Or the UE receives DISCONNECT with the cause value not being Normal Release after receiving RB SETUP At this time the UE has not reported RB SETUP CMP
Failure after RAB assignment After the UE sends RB SETUP COMPLETE the terminating UE receives DISCONNECTRELEASE from CN
432 Analysis on RRC Connection Failures
The problem of RRC connection setup failure can be analyzed through the UE signaling flow and RNC single-user tracing The RRC connection setup includes the following steps
The UE sends RRC Connection Request through the RACH channel
RNC sends RRC Connection Setup through the FACH channel
The UE sends RRC Connection Setup Complete through the dedicated uplink channel after the downlink dedicated channel is established and synchronized
RRC connection setup failures are always caused by following issues
Uplink RACH problem
Problem about downlink FACH power allocation proportion
Parameter reselection problem of the cell
Low downlink dedicated initial transmitting power
Uplink initial power control problem
Congestion
Equipment malfunctions
Among these issues the problems of uplink RACH downlink FACH power allocation proportion parameter reselection of the cell and equipment malfunctions appear more frequently
ZTE Confidential Proprietary copy 2012 ZTE CORPORATION All rights reserved 22
UMTS KPI Optimization Analysis Guide Internal Use Only
4321 Analysis Flowchart of RRC Connection Setup Failures
Figure 4-10 Analysis flowchart of RRC connection setup failures
ZTE Confidential Proprietary copy 2012 ZTE CORPORATION All rights reserved 23
UMTS KPI Optimization Analysis Guide Internal Use Only
Extract performance data
TOP Ncell filtering
Analyze a single cell
1 Check NE alarms
2 Associate emergencies
3 Compare parameter
configurations
4 Associate indicators
5 Locate the fault
comprehensive ly
Exist or not
Handle alarms
Solved or not
Yes
Yes
End
No
No
Exist or not
Handle emergencies
Solved or not
Yes
No
No
Exist or not
Correct wrong parameter
configurations
Solved or not
Yes
No
No
List related indicator counters
Counters related to RRC setup
failuresRTWP
Resource limit
indicators
Checkamp analysis of interference
Optimization analysis of
resource limitCounters related
to RRC setup failures
C301480485C301480486C301480487C301480489C301480490C301480491C301481288C301481289C301481337C301481338C301481339C301481407C301481408
Solved or not
Yes
Yes
No
Drive Test+RNC signaling
trace
Yes
ZTE Confidential Proprietary copy 2012 ZTE CORPORATION All rights reserved 24
UMTS KPI Optimization Analysis Guide Internal Use Only
4322 UE sends RRC Connection Request but RNC does not receive it
If the EcIo of downlink CPICH is relatively low it is the problem of coverage
If the EcIo of downlink CPICH is not very low (for example the value is larger than -14 dB) Usually it is the problem of RACH and the following issues may cause the problem
minus The power of Preamble does not rise to a required value and the rising times of Preamble should be increased
minus The output power of UE is lower than the required value which is caused by poor UE performance In this case the UE should be changed
minus The NodeB equipment has a standing wave and the engineer should check whether NodeB has any SWR alarm
minus The radius of the cell is set improperly If the radius parameter of the cell is set too small the NodeB can not synchronize the UE beyond the range of the radius and the access fails This problem often happens in the places with large coverage such as the rural areas and the suburbs
4323 RNC delivers RRC Connection Reject after receiving RRC Setup Request
When RRC Connection Reject appears the engineer should check the specific reject cause value Usually there are two kinds of causes
The CPU load of RNC control plane board is too heavy and more boards should be added
DCH and FACH admission is rejected However this situation does not always happen
4324 UE does not receive RRC Connection Setup delivered by RNC
This problem may be caused by the following reasons
Poor coverage
Improper parameters of cell selection and reselection
Checking method The engineer should check the EcIo of CPICH If the value is lower than -12 dB (EcIo is -12 dB by default) and there is no cell of better quality in the monitor set the cause of this problem is poor coverage If there is better cell in the monitor set cell reselection may cause this problem
Poor coverage can be improved by coverage enhancement such as adding some sites to cover the places without signal coverage and adjusting the engineering parameters If the coverage can not be improved the engineer can enhance the FACH power according to
ZTE Confidential Proprietary copy 2012 ZTE CORPORATION All rights reserved 25
UMTS KPI Optimization Analysis Guide Internal Use Only
the PCPICH EcIo coverage of the current network For example if all the pilot EcIo values are larger than -12 dB in the coverage area the power proportion of the common channel should be configured on the basis of the situation that the EcIo value is larger than -12 dB And so the success rate of the idle UE assessment can be ensured
As for the access problem caused by cell selection and reselection the engineer can speed up the cell selection and reselection by adjusting the cell selection and reselection parameters and the problem of RRC connection setup failure caused by improper cell selection and reselection parameters can be solved
Note
The RRC Connection Setup message is borne by FACH RRC Connection Request sent by the UE is received by UTRAN at the preamble of PRACH and then it is sent from the RACH channel based on the current preamble power And the transmit power of preamble can rise all the time until the response is received (There is a limitation for the maximum number of preamble retransmissions) Therefore in the areas with poor coverage the RACH coverage and FACH coverage may become unbalanced and as a result UTRAN can receive RRC Connection Request sent by the UE but the UE can not receive RRC Connection Setup sent by RNC
4325 UE receives RRC Connection Setup and does not send RRC Setup Complete
If the downlink signal quality is normal this problem may be caused by the abnormal condition of the cell phone
Another reason of this problem may be the downlink synchronization failure caused by the low initial power of downlink dedicated channel You can solve this problem by adjusting the service downlink EbNo
4326 RNC does not receive RRC Setup Complete sent by UE
Because the uplink initial power control may increase the UE transmit power this kind of problem seldom appears If it appears the engineer can increase the Constant Value of the dedicated channel properly to raise the uplink DPCCH initial transmission power of the UE
At the same time this problem is also relevant with the uplink SIR initial target value configuration because this value may affect the uplink initial synchronization at the initial stage of link setup If the value of the parameter is set too large there will be too much uplink inference brought by the initial setup of the link If the value is set too small the uplink synchronization will take longer time and the initial synchronization may even fail This parameter is an RNC-level parameter which has a great influence on network performance Therefore the engineer should be cautious while adjusting this parameter
ZTE Confidential Proprietary copy 2012 ZTE CORPORATION All rights reserved 26
UMTS KPI Optimization Analysis Guide Internal Use Only
Note
RRC Connection Setup Complete is sent through uplink DPCH and the UE calculates the initial power of uplink DPCCH according to the received IErdquoDPCCH_Power_offsetrdquo and the measured CPICH_RSCP value
DPCCH_Initial_power = DPCCH_Power_offset - CPICH_RSCP
DPCCH_Power_offset = Primary CPICH DL TX Power + UL Interference + Constant Value The Constant Value can be configured in the OMC If this value is set too small the UE may not have enough power to send RRC Connection Setup Complete
433 Analysis on RABRB Setup Failures
When RAB or RB setup fails RNC will send RAB Assignment Fail in the RAB Assignment Response signaling The engineer can find out the specific failure reason from the failure cause value carried in relevant cells The reasons for common RABRB setup failures include
RNC directly rejecting RAB Setup Request because of wrong parameter configuration
Admission reject
RAB setup failure because the UE fails to respond to RB Setup Request
RAB setup failure because the Uu interface fails to set up RB
ZTE Confidential Proprietary copy 2012 ZTE CORPORATION All rights reserved 27
UMTS KPI Optimization Analysis Guide Internal Use Only
4331 Analysis Flowchart of RAB Setup Failures
Figure 4-11 Analysis flowchart of RAB setup failures
ZTE Confidential Proprietary copy 2012 ZTE CORPORATION All rights reserved 28
UMTS KPI Optimization Analysis Guide Internal Use Only
Extract performance data
TOP Ncell filtering
Analyze a single cell
1 Check NE alarms
2 Associate emergencies
3 Compare parameter
configurations
4 Associate indicators
5 Locate the fault
comprehensively
Exist or not
Handle alarms
Solved or not
Yes
Yes
End
No
No
Exist or not
Handle emergencies
Solved or not
Yes
No
No
Exist or not
Correct wrong parameter
configurations
Solved or not
Yes
No
No
List related indicator counters
Counters related to RAB setup failures RTWP
Resource limit
indicators
Checkamp analysis of interference
Optimization analysis of
resource limitCounters related to RAB setup failures
CS domain PS domainC301230290 C301230302C301230291 C301230303C301230292 C301230304C301230293 C301230305C301230294 C301230306C301230295 C301230307C301230296 C301230308C301230297 C301230309C301230298 C301230310C301230299 C301230311C301230300 C301230312C301230301 C301230313
Solved or not
Yes
Yes
No
Drive Test+RNC signaling
trace
Yes
ZTE Confidential Proprietary copy 2012 ZTE CORPORATION All rights reserved 29
UMTS KPI Optimization Analysis Guide Internal Use Only
4332 RNC Directly Rejecting RAB Setup Request Because Of Wrong Parameter Configuration
The case that RNC responds with RAB Setup Failure directly is seldom caused by invalid parameter configuration in the business network Usually this case is caused by special operations of the special users
The main scenario is that the subscription information of the userrsquos PS service is beyond the capability of the UE which leads to the direct refusal from RNC For example a special userrsquos subscription rates of uplink and downlink are 384 K but the maximum uplink rate of the UE is only 64 K The maximum uplink and downlink rates of the QoS message used for activating PDP set by the AT command or mobile terminal software used by the user are 384 K so the RNC will find the maximum uplink rate is beyond the UErsquos capability directly reply with RAB Setup Failure and will not launch the RB setup process when it receives RAB Assignment Request
After the RAB setup fails because the parameter configuration is beyond the UErsquos capability SGSN will negotiate again to launch the new RAB assignment until the UE has the capability to support the assignment and the RAB assignment is finished For the users the PDP activation is still successful and the actual maximum rate is the maximum rate the UE can support
However if the minimum guaranteed bit rate required by the QoS setting in the UErsquos PDP activation request is beyond the UErsquos capability though the network negotiates a lower rate to accept the UErsquos PDP activation request the UE will launch the request of deactivating PDP when it finds that the rate negotiated by the network in PDP activation accept request is lower than the minimum guaranteed bit rate and finally the PDP activation can not be completed
4333 Admission Reject
For the non-HSDPA user if there are insufficient system resources (including power channel code lub transmission resource and CE) the call establishment failure will be caused by the admission reject At this time it is necessary to check the network load code resource lub transmission resource and CE resource occupation to make sure the congestion is caused by the limitation of a certain kind of resource What is more the engineer should plan the corresponding expansion method
If the cell does not support the HSDPA service the R99 user admission is judged according to the fixed R99 admission threshold If the cell supports the HSDPA service and the HSDPA and R99 dynamic power is allocated the uplink admission of non-HSDPA is judged based on RTWP or the equivalent user number If the uplink load is too heavy the non-HSDPA user admission will also fail
If the bandwidth configuration on the lub interface is insufficient the lub interface will reject the R99 data service activation because of limited bandwidth
ZTE Confidential Proprietary copy 2012 ZTE CORPORATION All rights reserved 30
UMTS KPI Optimization Analysis Guide Internal Use Only
The admission control of the NodeB Credit resource is similar to the power admission control Whether the remaining Credit can support the currently requested service or not can be judged according to the spectrum spreading factor of the new access user According to the condition of the RAB Downsizing Switch RNC will deal with the issue in the corresponding way
For the HSDPA user in the dynamic power allocation mode besides the mentioned system resources such as the power channel code lub transmission resource and CE the admission reject should take into consideration whether the number of H users supported by NodeB and the number of H users supported by the cell are over the regulated threshold or not into consideration
For the HSDPA user when the bandwidth configuration on lub interface is insufficient the admission reject will not happen but the rate will be reduced What is more the AAL2PATHs of HSDPA and R99 are configured respectively and the HSDPA AAL2PATH must be configured to the HSDPA_RT or HSDPA_NRT type If the HSDPA AAL2PATH is configured to RT or NRT of R99 AAL2PATH type the RAB assignment failure will not happen but RNC will establish the HSDPA service as R99 384 Kbps
For the downlink power admission
Besides whether the R99 service load is over the non-HSDPA service threshold DCH service should take into consideration whether non-HSDPA power and HSDPA GBP (the minimum power needed for the guaranteed bit rate) are over the general power threshold of the cell
For the HSDPA service it is necessary to check whether the throughput rate provided by the cell is over the sum of all the usersrsquo GBR thresholds or whether the GBPs of the stream service and the background service are over the HSDPA power of the cell At the same time whether the non-HSDPA power and the HSDPA GBP (the minimum power needed for the guaranteed bit rate) are over the overall power threshold of the cell should be also taken into consideration
For the lub admission
For the DCH service the admission is made according to the multiplication of the peak rate and the service activation factor
For HSDPA service the admission is made according to the GBR
If the lub exceeds the congestion threshold the DCCC rate reduction will be triggered And if the RLC_AM retransmission rate is over a certain threshold the Iub Overbooking switch can be opened to trigger the TF which limits R99 or to reduce the rate of HSDPA service by a certain factor
ZTE Confidential Proprietary copy 2012 ZTE CORPORATION All rights reserved 31
UMTS KPI Optimization Analysis Guide Internal Use Only
4334 RAB Setup Failure Because the UE Fails to Respond to RB Setup
The UE fails to respond to RB setup mainly because of the userrsquos operation
Take the following cases as examples
When the user already has had the downlink 12 K data service he receives RB Setup Request of the VP service (either the originated call in the VP domain or the terminated call in the VP domain) Because the UE does not support the VP and high-speed PS service in the downlink at the same time it directly replies with RB Setup Failure and the cause value is unsupported configuration
Compared with the WCDMA subscriber originating the VP service the terminating subscriber resides in the GSM network and so it does not support the VP service After RNC receives RAB Assignment Request the core network will deliver the Disconnect command right after call proceeding and the cause value is Bearer capability not authorized At this time the UE has just received the RB SETUP command and has no enough time to finish the RB setup So the UE will reply with RB Setup Failure after it receives the Disconnect command and the RNC will reply with RAB Setup Failure with the cause value being failure in radio interface procedure
4335 RAB Setup Failure Because the Uu Interface Fails to Set Up RB
RNC sends the Radio Bearer Setup command to the UE but fails to receive Radio Bearer Setup Compete This kind of situation (RB setup failure) often appears in the cells with weak signals There are two causes of weak signals one is that the UE does not reside in the best server to launch the access and the other is poor coverage
If the UE does not reside in the best server to launch the access it will hope to enter the best server through active set update in the RB setup process (At the same time the fast signal change will drastically weaken the signals in the cell) but the active set update can only be processed after the RB setup is completed because the procedures can not be processed alternately (Neither the network nor the terminal supports it) Therefore RB can only be set up in the cell with weak signals and the setup is easy to fail As for this situation the starting threshold and speed of co-frequency cell reselection should be increased to make the UE reside in the best server and launch the access as soon as possible
RB setup failure may be caused by the poor downlinkuplink coverage If the failure is caused by downlink coverage the UE can not receive the Radio Bearer Setup command which may be caused by the uplink interference and this can be fixed through checking RTWP The poor downlink coverage is partly caused by the bad UE demodulation performance and other causes should be solved by RF optimization
ZTE Confidential Proprietary copy 2012 ZTE CORPORATION All rights reserved 32
UMTS KPI Optimization Analysis Guide Internal Use Only
44 Optimization of Mobility Indicators
Mobility indicators mainly fall into three categories mdash soft handovers hard handovers and inter-RAT handovers The handover problems usually happen in the following cases
The best server changes too fast or there is no best server due to pilot pollution
The handover is not prompt or there are pingpong handovers due to improper parameter configuration
Adjust the engineering parameters for antennas in areas with severe pilot pollution And adjust the handover parameters such as the values of 1A 1B CIO TTT (time to trigger) Hysteresis and so on to solve the problem that the handover is not prompt or there are pingpong handovers This section tries to solve this kind of problems through OMC data analysis and parameter optimization
441 Optimization of Soft Handovers
Missed neighboring cell configuration pilot pollution improper soft handover parameter configuration and equipment malfunctions are the major causes of soft handover failures To confirm the problems the field DTs are required
ZTE Confidential Proprietary copy 2012 ZTE CORPORATION All rights reserved 33
UMTS KPI Optimization Analysis Guide Internal Use Only
4411 Soft Handover Optimization Flowchart
Figure 4-12 Soft handover optimization flowchart
ZTE Confidential Proprietary copy 2012 ZTE CORPORATION All rights reserved 34
UMTS KPI Optimization Analysis Guide Internal Use Only
Extract performance data
TOP Ncell filtering
Analyze a single cell
1 Check NE alarms
2 Associate emergencies
3 Compare parameter
configurations
4 Associate indicators
5 Locate the fault
comprehensive ly
Exist or not
Handle alarms
Solved or not
Yes
Yes
End
No
No
Exist or not
Handle emergencies
Solved or not
Yes
No
No
Exist or not
Correct wrong parameter
configurations
Solved or not
Yes
No
No
List related indicator counters
RTWPResource
limit indicators
Checkamp analysis of interference
Optimization analysis of
resource limitCounters related to intra-frequency
handover failures
C301391101 C301390593C301391102 C301390594C301391103 C301390595C301390586 C301390596C301390587 C301390597C301390588 C301390598C301390589 C301390599C301390590 C301390600C301390591 C301390601C301390592 C301390602
Solved or not
Yes
Yes
No
Drive Test+RNC signaling
trace
Yes
Counters related to soft handover
failures
30055 3005630057 3005830059 3006030061 30062
Cell hand-inhand-out indicators
ZTE Confidential Proprietary copy 2012 ZTE CORPORATION All rights reserved 35
UMTS KPI Optimization Analysis Guide Internal Use Only
4412 Checking Missed Neighboring Cell Configuration
Generally speaking most of the call drops at the beginning of the optimization are caused by missed neighboring cell configuration The following methods are often used to judge whether the call drops are caused by missed configuration of co-frequency neighboring cells
Observe the active set EcIo information recorded by the UE and the Best Server EcIo information recorded by the Scanner before the call drop If the former record is very bad but the latter record is very good then check whether the Best Server scrambling code recorded by the Scanner appears in the latest list of the neighboring cells under intra-frequency measurement control If it does not then the call drop is caused by missed neighboring cell configuration
If the UE re-accesses immediately after the call drop and the cell scrambling codes during the UE reaccess and those during the call drop are different then the call drop may also be caused by missed neighboring cell configuration You can confirm it through measurement control (look backwards from the message of the call drop event for the latest intra-frequency measurement control message and check the neighboring cell list of this message)
Some UE may report the Detected Set information If the corresponding scrambling code appears in the Detected Set information before the call drop then the call drop is caused by missed neighboring cell configuration
4413 Checking Pilot Pollution
Definition of pilot pollution Excessive strong pilot signals exist at a certain point but none of them is strong enough to be the best server To form pilot pollution the following points in this definition should be satisfied
Strong pilot signal The absolute pilot signal strength is used to judge whether the pilot signal is a strong one The pilot signal strength can be evaluated through the pilot RSCP If the pilot RSCP exceeds a threshold it is considered a strong pilot signal The formula is
AbsoluteRSCPThRSCPCPICH __ gt
Excessive The number of pilot signals is used to judge whether there are excessive pilot signals at a certain point If the number exceeds a threshold it is regarded that excessive pilot signals exist at this point The formula is
NThNumberCPICH gt_
None of them is strong enough to be the best server The relative strength of a pilot signal is a key factor in judging whether the pilot signal is strong enough Based on the above definition and formulae if the difference between the strength of the
ZTE Confidential Proprietary copy 2012 ZTE CORPORATION All rights reserved 36
UMTS KPI Optimization Analysis Guide Internal Use Only
strongest pilot signal and that of the )1( +NTh strongest pilot signal at this point is
less than a threshold it is regarded that there is no pilot signal strong enough to be the best server at this point The formula is
lativeRSCPthThbest ThRSCPCPICHRSCPCPICHN Re_)1( )__( ltminus +
According to the above description it is regarded that pilot pollution exists if the following conditions are both satisfied
The number of pilot signals that meet the condition
AbsoluteRSCPThRSCPCPICH __ gt is more than NTh
lativeRSCPthThbest ThRSCPCPICHRSCPCPICHN Re_)1( )__( ltminus +
For example during the network optimization suppose
dBmTh AbsoluteRSCP 95_ minus= 3=NTh and dBTh lativeRSCP 5Re_ = if the following
conditions are both satisfied then it is regarded that pilot pollution exists
The number of the pilot signals that meet the condition
dBmRSCPCPICH 95_ minusgt is more than 3
dBRSCPCPICHRSCPCPICH thbest 5)__( 4 ltminus
4414 Adjusting Soft Handover Algorithm Parameters
You can solve the following kinds of problems by adjusting handover algorithm parameters
1 The handover is not prompt
From the perspective of the CS service signaling flow the symptom of this problem is that the UE cannot receive Active Set Update (physical channel reallocation in the case of the intra-frequency hard handover) because after the UE reports the measurement report the source cell has a fast reduction in EcIo When the RNC sends Active Set Update the UE has closed the transmitter due to the loss of downlink synchronization Viewed from the UE side it cannot receive Active Set Update In the PS services if the UE cannot receive Active Set Update or TRB resets before the handover the handover will also fail
From the perspective of signals the following phenomena may accompany this problem
ZTE Confidential Proprietary copy 2012 ZTE CORPORATION All rights reserved 37
UMTS KPI Optimization Analysis Guide Internal Use Only
minus Corner effect EcIo of the source cell decreases drastically and EcIo of the target cell increases sharply (very high when it appears)
minus Fast fading EcIo of the source cell decreases quickly for a while and then increases and EcIo of the target cell increases for a short while
2 Pingpong handovers The following phenomena may accompany this problem
The best server changes quickly Two or more cells take turns to be the best server But as the best server none of the cells can last long though they has good RSCPs and EcIos
There is no best server There are multiple cells Their RSCPs are normal and similar to each other But EcIo of every cell is very bad
From the perspective of the signaling flow Event 1A is reported immediately after one cell is deleted Because the UE cannot receive Active Set Update from the RNC the handover fails
4415 Equipment Malfunctions
First check the alarm console to see whether there are abnormal alarms and analyze the message traces at the same time Find out in which step the soft handover fails Check the failure message and contact the local product maintaining engineer to confirm whether the equipment has malfunctions
4416 Solutions
Corresponding adjustments should be taken for the confirmed problems
Handover failures caused by pilot pollution Adjust the engineering parameters of a certain antenna to set this antenna as the best server in this interfered location If the power of one of its sectors is reduced then Io of the pilot pollution area will decrease even if the powers of other pilots are not adjusted EcIo will also increase Thereby the EcIo differences with other scrambling codes in the active set will become larger and pilot pollution will be eliminated Through a lot of research ZTE has proved that the reduction in the pilot transmit power will not change cell capacity greatly If condition allows new base stations can be added to cover this area
Equipment malfunctions Consult the customer service engineers and ask them to help check whether there are alarms and whether the transport layer is abnormal If there are alarms coordinate with the customer service engineers and the engineering personnel to solve the problems
Call drops because the handovers are not prompt
ZTE Confidential Proprietary copy 2012 ZTE CORPORATION All rights reserved 38
UMTS KPI Optimization Analysis Guide Internal Use Only
minus Adjust the antenna to expand the handover zone
minus Configure the Event 1A handover parameters to make the handover easier to happen
minus Increase CIO to make the handover happen earlier in the target cell The sum of CIO and the actually measured value is used for judging the UE events including the UE intra-frequency handover CIO helps shift the cell border in the handover algorithm If CIO is configured with a larger value the handover will be easier to happen and there will be more UE in the soft-handover status but more resources will be occupied If CIO is configured with a smaller value the soft handover will be more difficult to happen and the receiving quality may be impaired A CIO of about 5dB is quite good for eliminating the fast fading and the corner effect but this configuration has some side effects such as the increase of handover proportion
Call drops caused by pingpong handovers Adjust the antenna to form a best server in its coverage zone or set the Event 1B handover parameters (increase the threshold of Event 1B the Event 1B hysteresis or the time to trigger Event 1B) to increase the difficulty in deleting the active set
442 Optimization of Hard Handovers
4421 Classification of Hard handovers
Hard handovers mainly fall into two classifications
Intra-frequency hard handovers The intra-frequency hard handover is triggered only when the intra-frequency softsofter handover cannot be performed and it is applicable to the following circumstances
minus Inter-RNC intra-frequency cell handovers when there is no Iur interface
minus Insufficient Iur interface resources though there is the Iur interface
minus Handovers controlled by the threshold of the PS service rate in the handover cell
The intra-frequency softsofter handovers can not be performed (intra-frequency hard handover should be triggered) in the following scenarios
minus When the intra-frequency handover happens the UE is using the transmit diversity in the active set cell but the target cell does not support the transmit diversity
minus The intra-frequency measurement report does not contain OFF and TM of the
ZTE Confidential Proprietary copy 2012 ZTE CORPORATION All rights reserved 39
UMTS KPI Optimization Analysis Guide Internal Use Only
target cell
minus When the intra-frequency handover happens between RNCs the Iur interface is unavailable
minus The UE performs the multiuser detection in the active set cell but the target cell does not support the multiuser detection
minus The target cell and the original cell belong to different classifications (The cells of R99 R5+R99 and R6+R5+R99 belong to the same classification while the cells of R5 and R6+R5 belong to another classification)
Inter-frequency hard handovers The inter-frequency hard handover means a UE connection is handed over from a cell of a UTRAN frequency to a cell of another frequency Many factors including the radio quality the load and the speed of the moving UE may trigger inter-frequency hard handovers
For example the radio quality triggers the inter-frequency hard handover in the following way
When the quality of the UE radio frequency becomes lower the inter-frequency measurement will be triggered and according to the measurement result the UE connection will be handed over to a better frequency
ZTE Confidential Proprietary copy 2012 ZTE CORPORATION All rights reserved 40
UMTS KPI Optimization Analysis Guide Internal Use Only
4422 Hard Handover Optimization Flowchart
Figure 4-13 Hard handover optimization flowchart
ZTE Confidential Proprietary copy 2012 ZTE CORPORATION All rights reserved 41
UMTS KPI Optimization Analysis Guide Internal Use Only
Extract performance data
TOP Ncell filtering
Analyze a single cell
1 Check NE alarms
2 Associate emergencies
3 Compare parameter
configurations
4 Associate indicators
5 Locate the fault
comprehensive ly
Exist or not
Handle alarms
Solved or not
Yes
Yes
End
No
Exist or not
Handle emergencies
Solved or not
YesNo
Exist or not
Correct wrong parameter
configurations
Solved or not
Yes
No
No
List related indicator counters
RTWPResource
limit indicators
Checkamp analysis of interference
Optimization analysis of
resource limit
Counters related to inter-frequency handover failures
C301110489 C301110516C301110499 C301110517C301110500 C301110518C301110501 C301110519C301110502 C301110520C301110503 C301110521C301110504 C301110522C301110505 C301110523
Solved or not
Yes
Yes
No
Drive Test+RNC signaling
trace
Yes
Counters related to hard handover
failures
30041 3004230043 3004430045 3004630047 30048
Cell hand-inhand-out indicators
NoNo
ZTE Confidential Proprietary copy 2012 ZTE CORPORATION All rights reserved 42
UMTS KPI Optimization Analysis Guide Internal Use Only
4423 Hard Handover Optimization Methods
The optimization flow for the hard handover is similar to that of the soft handover The major differences are in the parameter optimization To optimize intra-frequency hard handovers you can properly reduce the Event 1D hysteresis and the time to trigger Event 1D according to the real radio environment to ensure timely handovers
Inter-frequency coverage is often applied to some special scenarios such as indoor coverage and tested through CQT The method of judging whether there is missed configuration of the inter-frequency neighboring cell is almost the same as that of the co-frequency neighboring cell when a call drop occurs the UE fails to measure or report the inter-frequency neighboring cell after the call drop the UE resides in the inter-frequency neighboring cell again
The common hard handover problems are
1 The handover is not prompt The common symptoms are frequent call drops in the hard handovers when the UE moves
Solutions
Increase the threshold of activating the compressing mode The compressing mode is usually activated before the inter-frequency handover or the inter-RAT handover and it is used to measure the quality of the inter-frequency or inter-RAT cell You can set a threshold of the CPICH RSCP or EcIo to activate the compressing mode And the RSCP is widely used
minus Requirements on setting the threshold of activating the compressing mode Before the cell quality becomes low enough to cause a call drop the signal of the target cell should be measured and reported and the handover should be performed
minus Requirement on setting the threshold of deactivating the compression mode Frequent activationdeactivation of the compression mode should be avoided
Increase CIOs of the inter-frequency cell pair
Reduce the threshold of triggering the target frequency handover under the inter-frequency coverage
2 There are pingpong handovers
Solution Increase the hard handover hysteresis and the time to trigger the event
ZTE Confidential Proprietary copy 2012 ZTE CORPORATION All rights reserved 43
UMTS KPI Optimization Analysis Guide Internal Use Only
443 Optimization of Inter-RAT Handovers
4431 Configuring Basic Inter-RAT Parameters
Most of the inter-RAT handover failures are caused by incomplete parameter configuration The following parameters need special attention
Complete RNC parameter configuration for the GSM neighboring cell The 2G system shall provide the 3G system with the correct radio parameters based on negotiation mdash MCC MNC LAC ID (CI) NCC BCC frequency band indicator (900 or 1800) and BCCH
Table 4-3 Parameters That 2G Shall Provide to 3G
MCC MNC LACIDCI
NCC BCCFrequency
band indicator
BCCH
460 2 202 193 0 0 900 102
Complete GSM BSC parameter configuration for the WCDMA neighboring cell The 3G system shall provide the 2G system with the correct radio parameters based on negotiation mdash MCC MNC LAC RNC ID cell ID (C_ID) downlink frequency scrambling code and RAC
Table 4-4 Parameters That 3G Shall Provide to 2G
MCC MNC LACRNC
IDCell IDC_ID
Downlink frequency
Scrambling code
RAC
460 3 20 18 51 10787 51 20
According to the current strategy of one-way inter-RAT handovers if the parameter configuration is complete one probable cause of the inter-RAT handover failure is that the handover is not prompt The common parameter adjustment is to increase CIO the threshold to activatedeactivate the compressing mode and the threshold to trigger the WCDMA-to-GSM handover at the same time
Call drops during the inter-RAT handovers between WCDMA and GSM may be caused by
minus Inconsistent data configuration at the GSM side and the WCDMA side after GSM modifies the configuration data but does not inform WCDMA
minus Missed configuration of neighboring cells which can be solved by the correct configuration of neighboring cells
minus Too fast signal changes
ZTE Confidential Proprietary copy 2012 ZTE CORPORATION All rights reserved 44
UMTS KPI Optimization Analysis Guide Internal Use Only
minus Pingpong reselection
minus Faults with the UE for example the UE fails to respond to the handover or report the inter-RAT measurement report
minus Changes of the best server during the physical channel reallocation
minus Wrong LAC configuration which can be located through data configuration check
ZTE Confidential Proprietary copy 2012 ZTE CORPORATION All rights reserved 45
UMTS KPI Optimization Analysis Guide Internal Use Only
4432 Inter-RAT Handover Optimization Flowchart
Figure 4-14 Inter-RAT handover optimization flowchart
ZTE Confidential Proprietary copy 2012 ZTE CORPORATION All rights reserved 46
UMTS KPI Optimization Analysis Guide Internal Use Only
Extract performance data
TOP Ncell filtering
Analyze a single cell
1 Check NE alarms
2 Associate emergencies
3 Compare parameter
configurations
4 Associate indicators
5 Locate the fault
comprehensive ly
Exist or not
Handle alarms
Solved or not
Yes
Yes
End
No
No
Exist or not
Handle emergencies
Solved or not
Yes
No
No
Exist or not
Correct wrong parameter
configurations
Solved or not
Yes
No
No
List related indicator counters
RTWPResource
limit indicators
Checkamp analysis of interference
Optimization analysis of
resource limitCounters related to inter-RAT handover failures
C301130667 C301130681C301130668 C301130682C301130669 C301130690C301130670 C301130691C301130671 C301130692C301130672 C301130693C301130673 C301130694C301130674 C301130696C301130675 C301130697C301130677 C301130698C301130678 C301130699C301130679 C301130700
C301130680
Solved or not
Yes
Yes
No
Drive Test+RNC signaling
trace
Yes
Counters related to inter-RAT handover
failures
Cell hand-inhand-out indicators
30049 3005030051 3005230053 30054
ZTE Confidential Proprietary copy 2012 ZTE CORPORATION All rights reserved 47
UMTS KPI Optimization Analysis Guide Internal Use Only
45 Optimization of Resource Indicators
The resource indicators directly reflect the system capacity Increasing subscribers will consume more system resources and some resources may be limited for example the code resource may be limited the TCP access request may be rejected and the CE resource usage rate may exceed the threshold Limited system resources have a negative influence on the whole-network indicators and the subscribersrsquo perception for example call drops may frequently happen and more TCP access requests may be rejected during the voice services
Table 4-5 Resource KPIs and Alarm Thresholds
Resource type KPI No and nameAlarm
threshold
TCP
C301320150 Number of rejected services DCH downlink TCP limit
50
PI30167 Average non-HS (SOA) (SOA)DPA TCP 40
PI30092 Maximum Cell TCP () 100
PI30093 Average Cell TCP 70
UL TrafficPI30029 Handover Blocking Rate 05
KPI RTWP (in busy hour) -98 dBm
Code
C301320153 Number of rejected services DCH no code
50
PI30205 Average Cell HSUPA Users 12
PI30172 Cell Average HSDPA Users 16
CE
PI301830006 Maximum use Ratio of Uplink NodeB CE
60
PI301830010 Maximum use Ratio of Downlink NodeB CE
60
ZTE Confidential Proprietary copy 2012 ZTE CORPORATION All rights reserved 48
UMTS KPI Optimization Analysis Guide Internal Use Only
451 Resource Indicator Optimization Flowchart
Figure 4-15 Resource indicator optimization flowchart
ZTE Confidential Proprietary copy 2012 ZTE CORPORATION All rights reserved 49
UMTS KPI Optimization Analysis Guide Internal Use Only
Extract performance data
TOP Ncell filtering
Analyze a single cell
1 Check NE alarms
2 Associate emergencies
3 Compare parameter
configurations
4 Associate indicators
5 Locate the fault
comprehensive ly
Exist or not
Handle alarms
Solved or not
Yes
是
End
No
No
Exist or not
Handle emergencies
Solved or not
Yes
No
No
Exist or not
Correct wrong parameter
configurations
Solved or not
Yes
No
No
List related indicator counters
Code resource indicators
CE resource indicators
TCPadmission
reject counter
C301320150
Solved or not
Yes
Yes
No
Drive Test+RNC signaling
trace
Yes
Counter related to TCP limit
Cell TX power
indicators
30090 3009130092 3009330166 3016730168 3016930170 30171
30163301643016530075
30223302243045030451
Yes
Yes
ZTE Confidential Proprietary copy 2012 ZTE CORPORATION All rights reserved 50
UMTS KPI Optimization Analysis Guide Internal Use Only
452 Code Resource Optimization
The statistics of Number of rejected services and DCH no code the average code resource usage rate and the number of the HSDPA subscribers can be used to judge whether the code resource in a cell is limited If the code resource is limited you can adjust the code resource allocation to alleviate the situation
Based on the system algorithm when Formula 1 is satisfied you can add an HS-PDSCH when Formula 2 is satisfied then an HS-PDSCH is deleted
Formula 1 OcuRateNoHspdsch + OcuRateHspdsch + DpchCodeHy + 32 lt= 512
Formula 2 OcuRateNoHspdsch + OcuRateHspdsch + CodeUptHyA gt 512
OcuRateHspdschHSPDSCH means the number of the codes of SF=512 blocked by the HS-PDSCH OcuRateNoHspdsch means the number of codes of SF=512 blocked by other channels DpchCodeHy means the number of codes of SF=512 reserved for the DPCH and CodeUptHyA is the threshold to decide whether to delete the HSPDSCH
Therefore to ensure the access of the R99 subscribers you can make some adjustment according to Table 4-6 when the code resource is limited though the HSDPA rate may decrease
Table 4-6 Adjusting Code Resource Allocation
AbbreviationParameter
nameRange
and stepCurrent value
Update value
Remark
DpchCodeHy DPCH Code Hysteresis
0512 16 28
To decrease the number of rejected services for DCH no code
CodeUptHyACode Update Hysteresis A
0512 16 28
To decrease the number of rejected services for DCH no code
453 Monitoring CE Resource
The CE resource is mainly monitored through the maximum UE uplinkdownlink usage rate If there is any problem you can solve it by controlling the load or adding more boards
ZTE Confidential Proprietary copy 2012 ZTE CORPORATION All rights reserved 51
UMTS KPI Optimization Analysis Guide Internal Use Only
454 Optimization of Power Control
4541 Monitoring and Optimizing Downlink Power Control
Limited TCP in busy hours will not only increase access failures and call drops in the local cell but also increase soft handover failures and call drops in the neighboring cells Number of rejected services and DCH downlink TCP limit are intuitive KPIs to judge whether TCP is limited Although limited uplink capacity and massive UE moves in the rush hours may also cause call drops the limited TCP is absolutely a key factor
Based on the system algorithm MinHsdpaPower (MinHspaPwrRto) + NoHsPower gtNode B if the safety threshold is used (MinHsdpaPower means the power reserved for HSPA) then it will activate the downlink rate downgrade algorithm flow for the congestion (lower the downlink DCH rate) Although the rate downgrade can ensure access of some subscribers it is an irregular action and will degrade the performance
455 Speeding up Rate Downgrade
Considering that the cells with heavy load reject more access requests you can speed up the rate downgrade during the resource congestion to release the resources as soon as possible and avoid call drops caused by access failures (this method is only applicable to the cells with many PS service users but not those with only CS service users) Table 4-7 is an example of the parameter modification for the rate downgrade
Table 4-7 Example of Parameter Modification for Rate Downgrade
Abbreviation Parameter nameRange and
stepCurrent value
Update value
Remark
UlDnMaxStg Maximum Number of Degraded Uplink Load Steps Every Time
[1 8] 1 2 Downgrade from 384 Kbps to 16 Kbps
DlDnMaxStg Maximum Number of Degraded Downlink Load Steps Every Time
[1 8] 1 3 Downgrade from 384 Kbps to 8 Kbps
456 Monitoring and Optimizing Uplink Capacity
Handover Blocking Rate and RTWP can reflect the uplink capacity of the cell Because interference may also increase RTWP this factor should be distinguished during the RTWP monitoring Another effective indicator is the voice service erl If a cell has over 20 erls in busy hours you should pay special attention to it
ZTE Confidential Proprietary copy 2012 ZTE CORPORATION All rights reserved 52
UMTS KPI Optimization Analysis Guide Internal Use Only
457 Optimization of Uplink Capacity at the Whole Network Level
Case The uplink capacity was limited in a large number of sites after the cutover and the symptoms are a sharp rise of RTWP and a high call drop rate during the rush hours
After the following parameters were modified as shown in Table 4-8 the problem was solved
Table 4-8 Example of Power Control Parameter Modification
AbbreviationParameter
nameRange
Current value
Update value
ULINITSIRUplink Initial SIR target (dB)
UL 34 K136 K signaling UL 122 K AMR
4-5 35
ULMAXSIRMaximum Uplink SIR target (dB)
UL 34 K136 K signaling UL 122 K AMR
15 10
UlSirTargDnStepUplink SIR Target Down Step Size (dB)
UL 34 K136 K signaling UL 122 K AMR
01 02
458 Optimization of Uplink Capacity for a Single Cell
A lot of optimization measures can be taken to bring down the rising RTWP However with increasing subscribers the capacity may still be limited in some area while further modification of SirTarget will obviously degrade the call quality of the whole network and undermine the subscribersrsquo perception In this case you can adjust the power control parameters for a single site that has heavy traffic in the following way add one set of DivPc parameters and use this set of parameters only for this site
Case Table 4-9 shows an example of the power control parameter modification After this modification the call drop rate in the site with heavy traffic decreased to one quarter of the original one
Table 4-9 Example of Power Control Parameter Modification for Heavy-Traffic Cell
SRVTYPE ULINITSIR ULMAXSIR ULMINSIR
0 35-gt15 100-gt35 20-gt10
104 40-gt20 150-gt50 05-gt0
28 35-gt15 100-gt35 05-gt0
50 60-gt20 150-gt50 20-gt0
54 60-gt20 150-gt50 20-gt0
ZTE Confidential Proprietary copy 2012 ZTE CORPORATION All rights reserved 53
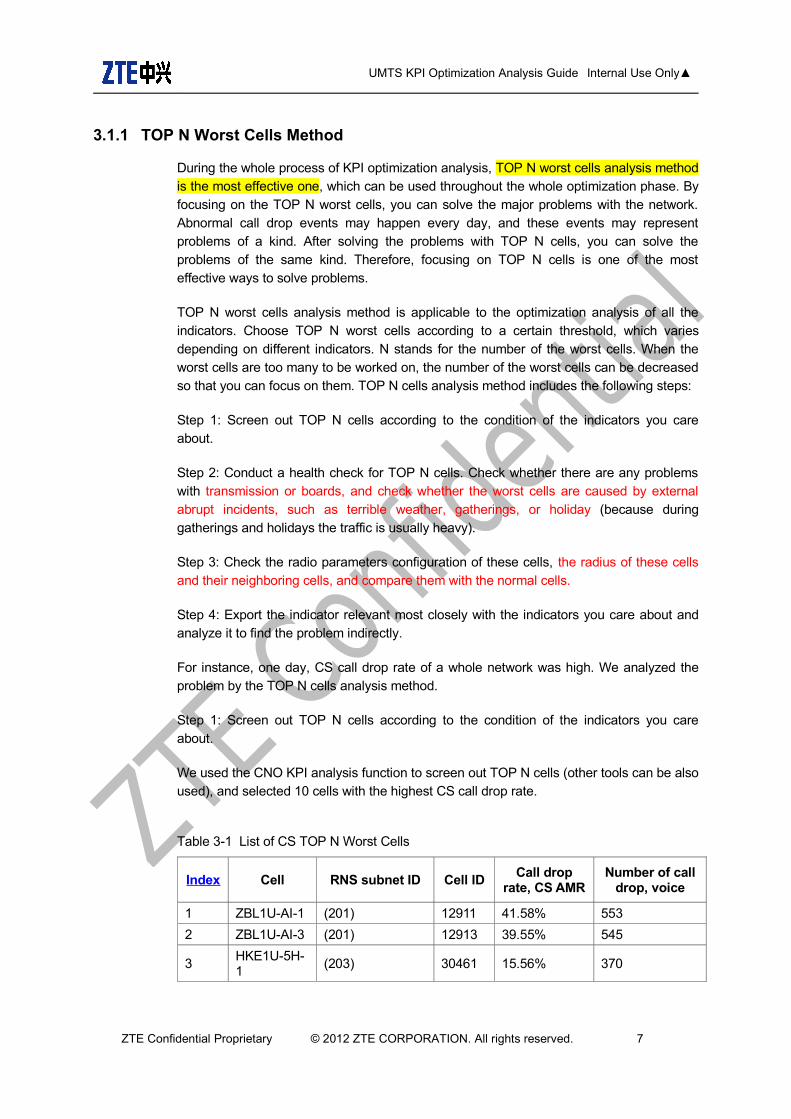
UMTS KPI Optimization Analysis Guide Internal Use Only
311 TOP N Worst Cells Method
During the whole process of KPI optimization analysis TOP N worst cells analysis method is the most effective one which can be used throughout the whole optimization phase By focusing on the TOP N worst cells you can solve the major problems with the network Abnormal call drop events may happen every day and these events may represent problems of a kind After solving the problems with TOP N cells you can solve the problems of the same kind Therefore focusing on TOP N cells is one of the most effective ways to solve problems
TOP N worst cells analysis method is applicable to the optimization analysis of all the indicators Choose TOP N worst cells according to a certain threshold which varies depending on different indicators N stands for the number of the worst cells When the worst cells are too many to be worked on the number of the worst cells can be decreased so that you can focus on them TOP N cells analysis method includes the following steps
Step 1 Screen out TOP N cells according to the condition of the indicators you care about
Step 2 Conduct a health check for TOP N cells Check whether there are any problems with transmission or boards and check whether the worst cells are caused by external abrupt incidents such as terrible weather gatherings or holiday (because during gatherings and holidays the traffic is usually heavy)
Step 3 Check the radio parameters configuration of these cells the radius of these cells and their neighboring cells and compare them with the normal cells
Step 4 Export the indicator relevant most closely with the indicators you care about and analyze it to find the problem indirectly
For instance one day CS call drop rate of a whole network was high We analyzed the problem by the TOP N cells analysis method
Step 1 Screen out TOP N cells according to the condition of the indicators you care about
We used the CNO KPI analysis function to screen out TOP N cells (other tools can be also used) and selected 10 cells with the highest CS call drop rate
Table 3-1 List of CS TOP N Worst Cells
Index Cell RNS subnet ID Cell IDCall drop
rate CS AMRNumber of call
drop voice
1 ZBL1U-AI-1 (201) 12911 4158 553
2 ZBL1U-AI-3 (201) 12913 3955 545
3HKE1U-5H-1
(203) 30461 1556 370
ZTE Confidential Proprietary copy 2012 ZTE CORPORATION All rights reserved 7
UMTS KPI Optimization Analysis Guide Internal Use Only
Index Cell RNS subnet ID Cell IDCall drop
rate CS AMRNumber of call
drop voice
4HKE1U-5H-3
(203) 30463 1581 360
5LAK1U-9M-3
(202) 11063 339 282
6 HIC1U-9R-1 RNC101(101) 10891 226 216
7LAK1U-9M-1
(202) 11061 249 215
8EBP1U-9R-3
RNC101(101) 12823 230 205
9SRS1U-5H-1
RNC102-CSL(102)
12091 392 169
10HRM1U-6R-1
RNC102-CSL(102)
20671 341 167
Step 2 Check the transmission and hardware of the TOP N cells and check whether they are caused by external abrupt incidents such as terrible whether gatherings or holidays when traffic is usually heavy
And then we conducted a health check for each cell and paid attention to routine alarms and BPC board problems We found there were broken associations in some HKE sites
Step 3 Check the radio parameters configuration of these cells the radius of these cells and their neighboring cells and compare them with the normal cells
(1)Problem with the cell radius After the check we found the cell radius of the LAK site was 25 km Because the LAK site was situated by the sea and the antenna was placed very high the radius of 25 km was far from enough So we changed the cell radius to 10 km and the problem of high call drop rate was thus solved
(2)Problem with configuration HIC site is an indoor POI site The RRU RxTx port and the RRU Rx port were configured reversely which is the cause of high call drop rate After modifying HIC we found that signals of the second RRU were received by the Rx port So we changed the configuration of the RxTx port and the Rx port the problem of high call drop rate was thus solved
Figure 3-5 RF configuration at HIC site
Figure 3-6 Antenna energy distribution at HIC site
ZTE Confidential Proprietary copy 2012 ZTE CORPORATION All rights reserved 8
UMTS KPI Optimization Analysis Guide Internal Use Only
Step 4 Export the indicator relevant most closely with the indicators you care about and analyze it to find the problem indirectly
Table 3-2 Indicators Related with CS Call Drop
Index Cell
RAB release number for Iu connection
release request by UTRAN for CS domain in
cell radio connection with UE lost
RAB release number for Iu connection
release request by UTRAN for CS domain in cell failure in
the radio Interface
procedure
RAB release number for Iu connection
release request by
UTRAN for CS domain in
cell release due to
overload control
RAB release number for Iu connection
release request by
UTRAN for CS domain in
cell unspecified
failure
Average cell freq RTWP (dbm)
1ZBL1U-AI-1
482 43 0 29 -104177
2ZBL1U-AI-3
473 40 0 33 -104125
3HKE1U-5H-1
346 16 0 8 -105908
4HKE1U-5H-3
330 18 0 13 -1060777
5LAK1U-9M-3
69 196 0 18 -1031906
6HIC1U-9R-1
100 100 0 16 -1015404
7 LAK1U- 64 131 0 20 -1031934
ZTE Confidential Proprietary copy 2012 ZTE CORPORATION All rights reserved 9
UMTS KPI Optimization Analysis Guide Internal Use Only
Index Cell
RAB release number for Iu connection
release request by UTRAN for CS domain in
cell radio connection with UE lost
RAB release number for Iu connection
release request by UTRAN for CS domain in cell failure in
the radio Interface
procedure
RAB release number for Iu connection
release request by
UTRAN for CS domain in
cell release due to
overload control
RAB release number for Iu connection
release request by
UTRAN for CS domain in
cell unspecified
failure
Average cell freq RTWP (dbm)
9M-1
8EBP1U-9R-3
98 90 0 17 -101413
9SRS1U-5H-1
87 59 0 22 -1043528
10HRM1U-6R-1
42 111 0 13 -1027697
32 Basic KPI Analysis Skills
Be able to use the KPI statistics tool and the analysis tool
Use tools to learn about the running state of the whole network quickly and screen out TOP N worst cells quickly
Use different analysis tools to find problems from different aspects and locate the problem quickly
Understand the signaling process and basic principle
In the process of abnormity location keep a clear aim in mind and be able to apply the process and basic principle to check the other relevant indicators rapidly to facilitate the analysis
Be familiar with the process and basic principle and be able to make logical association between abnormal KPI problems and network problems (such as the coverage problem and the interference problem) Be able to determine the problem nature according to the abnormal KPI and then choose the appropriate tool to analyze the problem in depth
Performance analysis requires engineers to understand basic signaling process be familiar with the protocol stacks of standard interfaces and know relevant algorithms to realize the product functions Engineers should at least have a concept about the various algorithms If the analysis of a commercial network involves some algorithms engineers should study these algorithms in depth
ZTE Confidential Proprietary copy 2012 ZTE CORPORATION All rights reserved 10
UMTS KPI Optimization Analysis Guide Internal Use Only
321 KPI Monitoring Tools
minus Network management tool NetNumenT31 count KPI original data alarm data radio parameter configuration in cells and parameter configuration on the earth
minus KPI daily report generating tool classify key indicators according to a certain condition and screen out the worst cells
322 KPI Analysis Tools
minus CNO Tool CNO tool has the KPI analysis function So using it you can screen out the worst cells according to various conditions and point out the corresponding counter of an indicator
minus SignalTrace Trace the signaling (RNL signaling and RNL signaling) of RNC interfaces which includes the Iu interface the Iur interface the Iub interface and the Uu interface (the signaling flow between RNC and UE at RRC layer) And RNL signaling trace is a common way for locating the KPI problem Being able to trace the RNC signaling is a basic requirement for the on-site KPI optimization engineers and the network optimization and maintenance engineers This signaling tracing tool is very powerful which can trace signaling according to the UE cell and IMSI in the KPI analysis According to the UE cell it can trace the signaling of multiple subscribers while according to IMSI it can trace the signaling of only one subscriber However if the RRC connection is not established yet signaling cannot be traced That is because only when RRC connection has been established can the RNC obtain the subscriberrsquos IMSI from the CN
minus RNC ASS Log ASS log is usually applied when there is abnormity and RNC signaling is out of trace In this case use ASS log to analyze the signaling before and after the abnormity occurs Abnormity can be queried according to IMSI or cell ID ASS log can be also used to collect various abnormities
minus NodeB LMT NodeB local operation and maintenance tool Apart from all the operation functions of the OMCB this tool can collect more detailed information about cells and UE NodeB local maintenance terminals include EOMS EFMS DMS and PMS
minus NodeB Abnormity Probe On the site of WCDMA commercial office NodeB abnormity probe is an effective tool to monitor the running state of the NodeB Every module of NodeB can record the abnormal information automatically which makes it easy to locate problems However this method requires professional knowledge such as knowledge about the function and interface of each module or board If the on-site engineers cannot make the simple analysis they can just obtain the abnormity probe and send it to the RampD engineers at the rear side The abnormities reported on the NodeB will be stored at the OMCB server according to different RNCs To conduct NodeB
ZTE Confidential Proprietary copy 2012 ZTE CORPORATION All rights reserved 11
UMTS KPI Optimization Analysis Guide Internal Use Only
abnormity probe analysis you need to download abnormity probe files from different OMCB servers and then use the abnormity probe tool to make a comprehensive analysis
minus CTS Tool CTS is a tool developed by the CN department which can trace signaling in depth according to IMSI and trace signaling across RNCs So this is particularly suitable to trace VIP subscribers In this case CTS is easier to use than SignalTrace which can only trace signaling of RNCs one by one CTS can trace the interactive signaling between network elements (NEs) within the CN as well as the signaling of the Iu interface and the Uu interface This kind of signaling tracing is what we called in-depth tracing The work principle of CTS is to set up an IMSI task on the CTS server and send it to the CN front side which will then send this task to each CN module via the interfaces dedicated to the CN modules and the RNC and then each module after receiving the signaling related to the IMSI task will send the signaling back to the CTS server via the CN front side The interfaces mentioned above are private interfaces so this tool can only support our own CN and RNC CTS signaling can be checked and analyzed with an offline tool but the offline tool does not work very well because of the lack of continuous optimization and perfection
minus UE log DT test is also an important auxiliary way in analyzing KPI indicators There are many problems that cannot be located by tracing signaling at the network side and can only be located by the use of UE log The commonly used drive test software includes QXDMAPEX (QCAT) CNTCAN and TEMS CNTCAN and TEMS are often used for network optimization For the use of CNTCAN please refer to the corresponding help file and the instruction document publicly released by the Network Optimization Tool Department QXDM and the analysis tool APEX (QCAT) provided by Qualcomm is very powerful which have contributed a lot for the stability and maturity of our system for many years
33 General Process of KPI Optimization Analysis
Basic analyzing ideas
KPI optimization is a process to find and solve problems KPI optimization during the operation and maintenance stage is mainly to pick out the performance data that needs special attention from the OMC classify these performance data and then compare the value of these data with that required by the operator If the value of an indicator is lower than the operatorrsquos requirement analyze this indicator and find out the factor that affect the indicator and then propose a solution to the operator If the values are higher than the operatorrsquos requirement therersquos no need to pay special attention to them
KPI analysis is a process from the whole to the part
Step 1 Check the key indicators from the view of the whole network If there is not any
ZTE Confidential Proprietary copy 2012 ZTE CORPORATION All rights reserved 12
UMTS KPI Optimization Analysis Guide Internal Use Only
problem just ignore them Otherwise try to locate the RNC NE that has the problem
Step 2 Analyze the indicators of the corresponding RNC to find out the RNC whose indicators have the problem
Step 3 Analyze the indicators of the cell under the problem RNC to find out the worst cells or TOP N cells If the indicators of all the cells under the RNC are tend to be low it is a common problem probably caused by parameter configuration And then check whether the radio parameter configuration in the cells under this RNC is the same as that in the cells under the normal RNCs
Step 4 Make a comprehensive analysis on the KPIs alarms DT test data and customer complains of the worst cells to find out a solution
Analysis method
After learning the KPI analysis ideas we must know some common KPI analysis methods to rule out causes of problems from the obvious ones to the hidden ones
For example we found that the TCP code words were strictly limited at eight sites near a park and the call drop rate rose suddenly How to solve this problem
Method one First we checked whether the alarms transmission and boards of these sites were normal After they are proved all normal we sent some engineers to the site to do test And meanwhile we traced the RNC signaling at the OMC It turned out that the test result was normal and the indicators of these sites of that day did not have any problem and code words were not limited And later we knew from the news that there was a big gathering of about one million people at the park at that moment Until then we came to know that the congestion was caused by too many users using the network at the same time
Method two First because the eight sites went worse all of a sudden it was unlikely that the problem lied in the hardware Then we checked whether the radio parameters had been modified the day before The result is no worksheet had been issued to modify those parameters and no alarm was found at those sites Therefore we excluded the possibility of hardware problem Then we checked the traffic trend graph of the last few days (over seven days) and found that the high call drop rate might be caused by high traffic The graph showed that traffic of each site rose suddenly on the day before Thus we came to the conclusion that this was an abnormal abrupt event which may have been caused by a gathering And later we were told that there was a big gathering at the park So we were assured the code words limitation and high call drop rate at the eight sites were caused by too many subscribers using the network at the same time
By comparing the two methods above we can find that although the first one (sending engineers to the site without the consideration of abnormal events) is commonly used it is inefficient and costs more resource The second method (analyzing the problem by the means of exclusion and association) is more efficient From this case we would like to emphasize that KPI analysis is a process of problem exclusion Using the comprehensive
ZTE Confidential Proprietary copy 2012 ZTE CORPORATION All rights reserved 13
UMTS KPI Optimization Analysis Guide Internal Use Only
methods (like Method One) at the first brush may be making a detour
minus Exclusion method Check the alarms on the OMC to learn about the state of the RNC NodeB BPC board and the transmission If there are obvious broken link in transmission or hardware problem the cause of the problem is easy to locate
minus Incident association If the problem is with a great number of sites take abrupt incidents into account such as large-scale gathering terrible weather of incorrect operation These incidents will put influence of different levels and ranges on the network indicators
minus Comparison of radio parameters If some site goes wrong in a sudden check whether the radio parameter configuration of this site is consistent with that of other normal sites If not change it as that of the normal sites because the indicator decrease may be caused by an incorrect modification of radio parameters
minus Relevant indicators association If a certain indicator is in poor condition check its relevant indicators and find the common problem from these relevant indicators
minus Comprehensive problem location When the above reasons are excluded use DT data KPI data RNC signaling analysis data to locate the problem with indicators comprehensively
ZTE Confidential Proprietary copy 2012 ZTE CORPORATION All rights reserved 14
UMTS KPI Optimization Analysis Guide Internal Use Only
Figure 3-7 KPI optimization analysis process
StartPick out
performance indexes
RNC index abnormal
Equipment alarms exist
Deal with equipment alarms
RNC index recovers
Common problem with the
worst cells
Transmission softwarehardware version wireless
parameter configuration
CNRNC Transmission
Hardware Software Interference
Wireless parameters
Time range
Abrupt and self-curable abnormality
helliphellip
Analyze and record causes
Suggestion about improvement
Common problems analysis
Problem resolved
Successful call
Call drop Soft handover
23G alternate operation
PS rate helliphellip
Deal with the relevant problem
Indexes normal
End
Climate change holidays assembly
transmission interruption power
fault and so on
Y
N
Y
Y
N
Y
N
Abnormal indexes analysis in one cell
Y
N
N
N
Y
N
Y
Show TOPN abnormal cells
and their locations
If the problem is proved to be equipment bug or system problem after
several attempts feed it back to RampD dept
ZTE Confidential Proprietary copy 2012 ZTE CORPORATION All rights reserved 15
UMTS KPI Optimization Analysis Guide Internal Use Only
4 KPI Optimization Analysis This chapter mainly demonstrates how to analyze the indicator problems from the aspect of OMC data and provides flowcharts for KPI optimization The detailed analyzing method and cases of every special subject can be checked in the optimization guides of all the subjects
41 CS Call Drop Optimization
The CS call drop rate is the most important indicator in KPI optimization
411 Definition of Call Drop
After checking the signaling on the Uu interface at the UE side the engineer can judge the situation a call drop if the Uu interface message satisfies one of the following three conditions during the calling process (in connection)
RNC Release is not received but the UE condition changes from CELL_DCH to IDLE
RRC Release is received and the released cause value is Not Normal
One of the following three messages mdash CC Disconnect CC Release Complete and CC Release mdash is received and the released cause value is Not Normal Clearing or Not Normal Unspecified
In a board sense the call drop includes the call drop rates of CN and UTRAN The call drop of UTRAN includes the following two aspects
After the successful service establishment RNC sends the RAB Release Request to CN
After the successful service establishment RNC sends the IU Release Request to CN Later RNC receives the IU Release Command from CN
Note that RAN call drop statistics which is defined from the aspect of lu interface signaling means the launching times of RAB Release Request and lu Release Request of RNC And the DT call drop statistics is defined from the aspects of the Uu interface message non-access stratum message and cause value RAN call drop statistics and DT call drop statistics are not exactly the same
ZTE Confidential Proprietary copy 2012 ZTE CORPORATION All rights reserved 16
UMTS KPI Optimization Analysis Guide Internal Use Only
412 CS Call Drop Analysis Flowchart
Figure 4-8 CS call drop analysis flowchart
ZTE Confidential Proprietary copy 2012 ZTE CORPORATION All rights reserved 17
UMTS KPI Optimization Analysis Guide Internal Use Only
Extract performance data
CS TOP Ncell filtering
Analyze a single cell
1 Check NE alarms
2 Associate emergencies
3 Compare parameter
configurations
4 Associate indicators
5 Locate the fault
comprehensively
Exist or not
Handle alarms
Solved or not
Yes
Yes
End
No
No
Exist or not
Handle emergencies
Solved or not
Yes
No
No
Exist or not
Correct wrong parameter
configurations
Solved or not
Yes
No
No
List related indicator counters
Call-drop-related
countersRTWP
Handover success rate
Traffic volume
Resource limit indicators
Checkamp analysis of
interference
Optimizationanalysis of
handover failures
Optimization analysis of
resource limitCall-drop-
related counters
C301230362C301230363C301230365C301230315C301230316C301230318C301230319C301230322C301230323
Solved or not
Yes
Yes
No
Drive Test+RNC signaling
trace
Yes
ZTE Confidential Proprietary copy 2012 ZTE CORPORATION All rights reserved 18
UMTS KPI Optimization Analysis Guide Internal Use Only
42 PS Call Drop Optimization
421 Optimization Flowchart
Figure 4-9 PS call drop optimization flowchart
ZTE Confidential Proprietary copy 2012 ZTE CORPORATION All rights reserved 19
UMTS KPI Optimization Analysis Guide Internal Use Only
Extract performance data
PS TOP Ncell filtering
Analyze a single cell
1 Check NE alarms
2 Associate emergencies
3 Compare parameter
configurations
4 Associate indicators
5 Locate the fault
comprehensive ly
Exist or not
Handle alarms
Solved or not
Yes
Yes
End
No
No
Exist or not
Handle emergencies
Solved or not
Yes
No
No
Exist or not
Correct wrong parameter
configurations
Solved or not
Yes
No
No
List related indicator counters
Call -drop-related
countersRTWP
Handover success rate
Traffic volume
Resource limit indicators
Check amp analysis of interference
Optimizationanalysis of
handover failures
Optimization analysis of
resource limitCall -drop-
related counters
C301230372C301230373C301230375C301230330C301230332C301230333C301230334C301230337C301230338
Solved or not
Yes
Yes
No
Drive Test +RNC signaling
trace
Yes
ZTE Confidential Proprietary copy 2012 ZTE CORPORATION All rights reserved 20
UMTS KPI Optimization Analysis Guide Internal Use Only
43 Optimization of Accessibility Indicators
Accessibility performance includes the success rate of RRC connection setup and the success rate of CSPS RAB assignment These two kinds of KPIs play important roles in the network optimization and directly influence the success rate of CSPS service establishment In this document this kind of problems are found from the aspect of OMC data and solved through parameter optimization
431 Definition of Access Failure
For the mobile originated call in the CS domain the access failure event means that the UE sends RRC REQUEST and IE establish cause is Originating Conversational Call but alerting of the direct transfer message is not received
The relevant events are defined as follows in the access failure stage
RRC connection setup failure After considering the resending times and the waiting time the UE sends RRC CONNECTION REQUEST and does not receive the response from RNC or RRC CONNECTION REJECT delivered by RNC
Initial direct transfer and security mode establishment failure After sending RRC CONNECTION SETUP COMPLETE the UE does not send NAS SETUP
RAB assignment failure After receiving CALL PROCEEDING the UE does not receive RB SETUP delivered by RNC Or the UE replies with RB SETUP FAIL after receiving RB SETUP Or the UE receives DISCONNECT with the cause value not being Normal Release after receiving RB SETUP At this time the UE has not reported RB SETUP CMP
Failure after RAB assignment After the UE sends RB SETUP COMPLETE the originating UE receives DISCONNECTRELEASE from CN Or the UE waits CONNECT or ALERTING overtime and launches the Call Clearing process Or the UE becomes IDLE before receiving Alerting and starts to receive the system message
For the mobile terminated in the CS domain the access failure event means that the terminating UE receives the paging of paging type 1 and does not send RRC CONNECTION REQUEST with the cause value being Terminating Conversational Call Or the UE does not send the alerting of direct transfer message to CN after sending RRC CONNECTION REQUEST
The relevant events are defined as follows in the access failure stage
RRC connection setup failure After sending RRC CONNECTION REQUEST the UE does not receive the response from RNC or RRC CONNECTION REJECT delivered by RNC
Initial direct transfer and security mode establishment failure After sending RRC
ZTE Confidential Proprietary copy 2012 ZTE CORPORATION All rights reserved 21
UMTS KPI Optimization Analysis Guide Internal Use Only
CONNECTION SETUP COMPLETE the UE does not receive the SETUP direct transfer message Or the UE sends RELEASE COMPLETE Or the UE receives DISCONNECT from CN
RAB assignment failure The UE does not receive RB SETUP delivered by RNC after sending CALL CONFIRM Or the UE replies with RB SETUP FAIL after receiving RB SETUP Or the UE receives DISCONNECT with the cause value not being Normal Release after receiving RB SETUP At this time the UE has not reported RB SETUP CMP
Failure after RAB assignment After the UE sends RB SETUP COMPLETE the terminating UE receives DISCONNECTRELEASE from CN
432 Analysis on RRC Connection Failures
The problem of RRC connection setup failure can be analyzed through the UE signaling flow and RNC single-user tracing The RRC connection setup includes the following steps
The UE sends RRC Connection Request through the RACH channel
RNC sends RRC Connection Setup through the FACH channel
The UE sends RRC Connection Setup Complete through the dedicated uplink channel after the downlink dedicated channel is established and synchronized
RRC connection setup failures are always caused by following issues
Uplink RACH problem
Problem about downlink FACH power allocation proportion
Parameter reselection problem of the cell
Low downlink dedicated initial transmitting power
Uplink initial power control problem
Congestion
Equipment malfunctions
Among these issues the problems of uplink RACH downlink FACH power allocation proportion parameter reselection of the cell and equipment malfunctions appear more frequently
ZTE Confidential Proprietary copy 2012 ZTE CORPORATION All rights reserved 22
UMTS KPI Optimization Analysis Guide Internal Use Only
4321 Analysis Flowchart of RRC Connection Setup Failures
Figure 4-10 Analysis flowchart of RRC connection setup failures
ZTE Confidential Proprietary copy 2012 ZTE CORPORATION All rights reserved 23
UMTS KPI Optimization Analysis Guide Internal Use Only
Extract performance data
TOP Ncell filtering
Analyze a single cell
1 Check NE alarms
2 Associate emergencies
3 Compare parameter
configurations
4 Associate indicators
5 Locate the fault
comprehensive ly
Exist or not
Handle alarms
Solved or not
Yes
Yes
End
No
No
Exist or not
Handle emergencies
Solved or not
Yes
No
No
Exist or not
Correct wrong parameter
configurations
Solved or not
Yes
No
No
List related indicator counters
Counters related to RRC setup
failuresRTWP
Resource limit
indicators
Checkamp analysis of interference
Optimization analysis of
resource limitCounters related
to RRC setup failures
C301480485C301480486C301480487C301480489C301480490C301480491C301481288C301481289C301481337C301481338C301481339C301481407C301481408
Solved or not
Yes
Yes
No
Drive Test+RNC signaling
trace
Yes
ZTE Confidential Proprietary copy 2012 ZTE CORPORATION All rights reserved 24
UMTS KPI Optimization Analysis Guide Internal Use Only
4322 UE sends RRC Connection Request but RNC does not receive it
If the EcIo of downlink CPICH is relatively low it is the problem of coverage
If the EcIo of downlink CPICH is not very low (for example the value is larger than -14 dB) Usually it is the problem of RACH and the following issues may cause the problem
minus The power of Preamble does not rise to a required value and the rising times of Preamble should be increased
minus The output power of UE is lower than the required value which is caused by poor UE performance In this case the UE should be changed
minus The NodeB equipment has a standing wave and the engineer should check whether NodeB has any SWR alarm
minus The radius of the cell is set improperly If the radius parameter of the cell is set too small the NodeB can not synchronize the UE beyond the range of the radius and the access fails This problem often happens in the places with large coverage such as the rural areas and the suburbs
4323 RNC delivers RRC Connection Reject after receiving RRC Setup Request
When RRC Connection Reject appears the engineer should check the specific reject cause value Usually there are two kinds of causes
The CPU load of RNC control plane board is too heavy and more boards should be added
DCH and FACH admission is rejected However this situation does not always happen
4324 UE does not receive RRC Connection Setup delivered by RNC
This problem may be caused by the following reasons
Poor coverage
Improper parameters of cell selection and reselection
Checking method The engineer should check the EcIo of CPICH If the value is lower than -12 dB (EcIo is -12 dB by default) and there is no cell of better quality in the monitor set the cause of this problem is poor coverage If there is better cell in the monitor set cell reselection may cause this problem
Poor coverage can be improved by coverage enhancement such as adding some sites to cover the places without signal coverage and adjusting the engineering parameters If the coverage can not be improved the engineer can enhance the FACH power according to
ZTE Confidential Proprietary copy 2012 ZTE CORPORATION All rights reserved 25
UMTS KPI Optimization Analysis Guide Internal Use Only
the PCPICH EcIo coverage of the current network For example if all the pilot EcIo values are larger than -12 dB in the coverage area the power proportion of the common channel should be configured on the basis of the situation that the EcIo value is larger than -12 dB And so the success rate of the idle UE assessment can be ensured
As for the access problem caused by cell selection and reselection the engineer can speed up the cell selection and reselection by adjusting the cell selection and reselection parameters and the problem of RRC connection setup failure caused by improper cell selection and reselection parameters can be solved
Note
The RRC Connection Setup message is borne by FACH RRC Connection Request sent by the UE is received by UTRAN at the preamble of PRACH and then it is sent from the RACH channel based on the current preamble power And the transmit power of preamble can rise all the time until the response is received (There is a limitation for the maximum number of preamble retransmissions) Therefore in the areas with poor coverage the RACH coverage and FACH coverage may become unbalanced and as a result UTRAN can receive RRC Connection Request sent by the UE but the UE can not receive RRC Connection Setup sent by RNC
4325 UE receives RRC Connection Setup and does not send RRC Setup Complete
If the downlink signal quality is normal this problem may be caused by the abnormal condition of the cell phone
Another reason of this problem may be the downlink synchronization failure caused by the low initial power of downlink dedicated channel You can solve this problem by adjusting the service downlink EbNo
4326 RNC does not receive RRC Setup Complete sent by UE
Because the uplink initial power control may increase the UE transmit power this kind of problem seldom appears If it appears the engineer can increase the Constant Value of the dedicated channel properly to raise the uplink DPCCH initial transmission power of the UE
At the same time this problem is also relevant with the uplink SIR initial target value configuration because this value may affect the uplink initial synchronization at the initial stage of link setup If the value of the parameter is set too large there will be too much uplink inference brought by the initial setup of the link If the value is set too small the uplink synchronization will take longer time and the initial synchronization may even fail This parameter is an RNC-level parameter which has a great influence on network performance Therefore the engineer should be cautious while adjusting this parameter
ZTE Confidential Proprietary copy 2012 ZTE CORPORATION All rights reserved 26
UMTS KPI Optimization Analysis Guide Internal Use Only
Note
RRC Connection Setup Complete is sent through uplink DPCH and the UE calculates the initial power of uplink DPCCH according to the received IErdquoDPCCH_Power_offsetrdquo and the measured CPICH_RSCP value
DPCCH_Initial_power = DPCCH_Power_offset - CPICH_RSCP
DPCCH_Power_offset = Primary CPICH DL TX Power + UL Interference + Constant Value The Constant Value can be configured in the OMC If this value is set too small the UE may not have enough power to send RRC Connection Setup Complete
433 Analysis on RABRB Setup Failures
When RAB or RB setup fails RNC will send RAB Assignment Fail in the RAB Assignment Response signaling The engineer can find out the specific failure reason from the failure cause value carried in relevant cells The reasons for common RABRB setup failures include
RNC directly rejecting RAB Setup Request because of wrong parameter configuration
Admission reject
RAB setup failure because the UE fails to respond to RB Setup Request
RAB setup failure because the Uu interface fails to set up RB
ZTE Confidential Proprietary copy 2012 ZTE CORPORATION All rights reserved 27
UMTS KPI Optimization Analysis Guide Internal Use Only
4331 Analysis Flowchart of RAB Setup Failures
Figure 4-11 Analysis flowchart of RAB setup failures
ZTE Confidential Proprietary copy 2012 ZTE CORPORATION All rights reserved 28
UMTS KPI Optimization Analysis Guide Internal Use Only
Extract performance data
TOP Ncell filtering
Analyze a single cell
1 Check NE alarms
2 Associate emergencies
3 Compare parameter
configurations
4 Associate indicators
5 Locate the fault
comprehensively
Exist or not
Handle alarms
Solved or not
Yes
Yes
End
No
No
Exist or not
Handle emergencies
Solved or not
Yes
No
No
Exist or not
Correct wrong parameter
configurations
Solved or not
Yes
No
No
List related indicator counters
Counters related to RAB setup failures RTWP
Resource limit
indicators
Checkamp analysis of interference
Optimization analysis of
resource limitCounters related to RAB setup failures
CS domain PS domainC301230290 C301230302C301230291 C301230303C301230292 C301230304C301230293 C301230305C301230294 C301230306C301230295 C301230307C301230296 C301230308C301230297 C301230309C301230298 C301230310C301230299 C301230311C301230300 C301230312C301230301 C301230313
Solved or not
Yes
Yes
No
Drive Test+RNC signaling
trace
Yes
ZTE Confidential Proprietary copy 2012 ZTE CORPORATION All rights reserved 29
UMTS KPI Optimization Analysis Guide Internal Use Only
4332 RNC Directly Rejecting RAB Setup Request Because Of Wrong Parameter Configuration
The case that RNC responds with RAB Setup Failure directly is seldom caused by invalid parameter configuration in the business network Usually this case is caused by special operations of the special users
The main scenario is that the subscription information of the userrsquos PS service is beyond the capability of the UE which leads to the direct refusal from RNC For example a special userrsquos subscription rates of uplink and downlink are 384 K but the maximum uplink rate of the UE is only 64 K The maximum uplink and downlink rates of the QoS message used for activating PDP set by the AT command or mobile terminal software used by the user are 384 K so the RNC will find the maximum uplink rate is beyond the UErsquos capability directly reply with RAB Setup Failure and will not launch the RB setup process when it receives RAB Assignment Request
After the RAB setup fails because the parameter configuration is beyond the UErsquos capability SGSN will negotiate again to launch the new RAB assignment until the UE has the capability to support the assignment and the RAB assignment is finished For the users the PDP activation is still successful and the actual maximum rate is the maximum rate the UE can support
However if the minimum guaranteed bit rate required by the QoS setting in the UErsquos PDP activation request is beyond the UErsquos capability though the network negotiates a lower rate to accept the UErsquos PDP activation request the UE will launch the request of deactivating PDP when it finds that the rate negotiated by the network in PDP activation accept request is lower than the minimum guaranteed bit rate and finally the PDP activation can not be completed
4333 Admission Reject
For the non-HSDPA user if there are insufficient system resources (including power channel code lub transmission resource and CE) the call establishment failure will be caused by the admission reject At this time it is necessary to check the network load code resource lub transmission resource and CE resource occupation to make sure the congestion is caused by the limitation of a certain kind of resource What is more the engineer should plan the corresponding expansion method
If the cell does not support the HSDPA service the R99 user admission is judged according to the fixed R99 admission threshold If the cell supports the HSDPA service and the HSDPA and R99 dynamic power is allocated the uplink admission of non-HSDPA is judged based on RTWP or the equivalent user number If the uplink load is too heavy the non-HSDPA user admission will also fail
If the bandwidth configuration on the lub interface is insufficient the lub interface will reject the R99 data service activation because of limited bandwidth
ZTE Confidential Proprietary copy 2012 ZTE CORPORATION All rights reserved 30
UMTS KPI Optimization Analysis Guide Internal Use Only
The admission control of the NodeB Credit resource is similar to the power admission control Whether the remaining Credit can support the currently requested service or not can be judged according to the spectrum spreading factor of the new access user According to the condition of the RAB Downsizing Switch RNC will deal with the issue in the corresponding way
For the HSDPA user in the dynamic power allocation mode besides the mentioned system resources such as the power channel code lub transmission resource and CE the admission reject should take into consideration whether the number of H users supported by NodeB and the number of H users supported by the cell are over the regulated threshold or not into consideration
For the HSDPA user when the bandwidth configuration on lub interface is insufficient the admission reject will not happen but the rate will be reduced What is more the AAL2PATHs of HSDPA and R99 are configured respectively and the HSDPA AAL2PATH must be configured to the HSDPA_RT or HSDPA_NRT type If the HSDPA AAL2PATH is configured to RT or NRT of R99 AAL2PATH type the RAB assignment failure will not happen but RNC will establish the HSDPA service as R99 384 Kbps
For the downlink power admission
Besides whether the R99 service load is over the non-HSDPA service threshold DCH service should take into consideration whether non-HSDPA power and HSDPA GBP (the minimum power needed for the guaranteed bit rate) are over the general power threshold of the cell
For the HSDPA service it is necessary to check whether the throughput rate provided by the cell is over the sum of all the usersrsquo GBR thresholds or whether the GBPs of the stream service and the background service are over the HSDPA power of the cell At the same time whether the non-HSDPA power and the HSDPA GBP (the minimum power needed for the guaranteed bit rate) are over the overall power threshold of the cell should be also taken into consideration
For the lub admission
For the DCH service the admission is made according to the multiplication of the peak rate and the service activation factor
For HSDPA service the admission is made according to the GBR
If the lub exceeds the congestion threshold the DCCC rate reduction will be triggered And if the RLC_AM retransmission rate is over a certain threshold the Iub Overbooking switch can be opened to trigger the TF which limits R99 or to reduce the rate of HSDPA service by a certain factor
ZTE Confidential Proprietary copy 2012 ZTE CORPORATION All rights reserved 31
UMTS KPI Optimization Analysis Guide Internal Use Only
4334 RAB Setup Failure Because the UE Fails to Respond to RB Setup
The UE fails to respond to RB setup mainly because of the userrsquos operation
Take the following cases as examples
When the user already has had the downlink 12 K data service he receives RB Setup Request of the VP service (either the originated call in the VP domain or the terminated call in the VP domain) Because the UE does not support the VP and high-speed PS service in the downlink at the same time it directly replies with RB Setup Failure and the cause value is unsupported configuration
Compared with the WCDMA subscriber originating the VP service the terminating subscriber resides in the GSM network and so it does not support the VP service After RNC receives RAB Assignment Request the core network will deliver the Disconnect command right after call proceeding and the cause value is Bearer capability not authorized At this time the UE has just received the RB SETUP command and has no enough time to finish the RB setup So the UE will reply with RB Setup Failure after it receives the Disconnect command and the RNC will reply with RAB Setup Failure with the cause value being failure in radio interface procedure
4335 RAB Setup Failure Because the Uu Interface Fails to Set Up RB
RNC sends the Radio Bearer Setup command to the UE but fails to receive Radio Bearer Setup Compete This kind of situation (RB setup failure) often appears in the cells with weak signals There are two causes of weak signals one is that the UE does not reside in the best server to launch the access and the other is poor coverage
If the UE does not reside in the best server to launch the access it will hope to enter the best server through active set update in the RB setup process (At the same time the fast signal change will drastically weaken the signals in the cell) but the active set update can only be processed after the RB setup is completed because the procedures can not be processed alternately (Neither the network nor the terminal supports it) Therefore RB can only be set up in the cell with weak signals and the setup is easy to fail As for this situation the starting threshold and speed of co-frequency cell reselection should be increased to make the UE reside in the best server and launch the access as soon as possible
RB setup failure may be caused by the poor downlinkuplink coverage If the failure is caused by downlink coverage the UE can not receive the Radio Bearer Setup command which may be caused by the uplink interference and this can be fixed through checking RTWP The poor downlink coverage is partly caused by the bad UE demodulation performance and other causes should be solved by RF optimization
ZTE Confidential Proprietary copy 2012 ZTE CORPORATION All rights reserved 32
UMTS KPI Optimization Analysis Guide Internal Use Only
44 Optimization of Mobility Indicators
Mobility indicators mainly fall into three categories mdash soft handovers hard handovers and inter-RAT handovers The handover problems usually happen in the following cases
The best server changes too fast or there is no best server due to pilot pollution
The handover is not prompt or there are pingpong handovers due to improper parameter configuration
Adjust the engineering parameters for antennas in areas with severe pilot pollution And adjust the handover parameters such as the values of 1A 1B CIO TTT (time to trigger) Hysteresis and so on to solve the problem that the handover is not prompt or there are pingpong handovers This section tries to solve this kind of problems through OMC data analysis and parameter optimization
441 Optimization of Soft Handovers
Missed neighboring cell configuration pilot pollution improper soft handover parameter configuration and equipment malfunctions are the major causes of soft handover failures To confirm the problems the field DTs are required
ZTE Confidential Proprietary copy 2012 ZTE CORPORATION All rights reserved 33
UMTS KPI Optimization Analysis Guide Internal Use Only
4411 Soft Handover Optimization Flowchart
Figure 4-12 Soft handover optimization flowchart
ZTE Confidential Proprietary copy 2012 ZTE CORPORATION All rights reserved 34
UMTS KPI Optimization Analysis Guide Internal Use Only
Extract performance data
TOP Ncell filtering
Analyze a single cell
1 Check NE alarms
2 Associate emergencies
3 Compare parameter
configurations
4 Associate indicators
5 Locate the fault
comprehensive ly
Exist or not
Handle alarms
Solved or not
Yes
Yes
End
No
No
Exist or not
Handle emergencies
Solved or not
Yes
No
No
Exist or not
Correct wrong parameter
configurations
Solved or not
Yes
No
No
List related indicator counters
RTWPResource
limit indicators
Checkamp analysis of interference
Optimization analysis of
resource limitCounters related to intra-frequency
handover failures
C301391101 C301390593C301391102 C301390594C301391103 C301390595C301390586 C301390596C301390587 C301390597C301390588 C301390598C301390589 C301390599C301390590 C301390600C301390591 C301390601C301390592 C301390602
Solved or not
Yes
Yes
No
Drive Test+RNC signaling
trace
Yes
Counters related to soft handover
failures
30055 3005630057 3005830059 3006030061 30062
Cell hand-inhand-out indicators
ZTE Confidential Proprietary copy 2012 ZTE CORPORATION All rights reserved 35
UMTS KPI Optimization Analysis Guide Internal Use Only
4412 Checking Missed Neighboring Cell Configuration
Generally speaking most of the call drops at the beginning of the optimization are caused by missed neighboring cell configuration The following methods are often used to judge whether the call drops are caused by missed configuration of co-frequency neighboring cells
Observe the active set EcIo information recorded by the UE and the Best Server EcIo information recorded by the Scanner before the call drop If the former record is very bad but the latter record is very good then check whether the Best Server scrambling code recorded by the Scanner appears in the latest list of the neighboring cells under intra-frequency measurement control If it does not then the call drop is caused by missed neighboring cell configuration
If the UE re-accesses immediately after the call drop and the cell scrambling codes during the UE reaccess and those during the call drop are different then the call drop may also be caused by missed neighboring cell configuration You can confirm it through measurement control (look backwards from the message of the call drop event for the latest intra-frequency measurement control message and check the neighboring cell list of this message)
Some UE may report the Detected Set information If the corresponding scrambling code appears in the Detected Set information before the call drop then the call drop is caused by missed neighboring cell configuration
4413 Checking Pilot Pollution
Definition of pilot pollution Excessive strong pilot signals exist at a certain point but none of them is strong enough to be the best server To form pilot pollution the following points in this definition should be satisfied
Strong pilot signal The absolute pilot signal strength is used to judge whether the pilot signal is a strong one The pilot signal strength can be evaluated through the pilot RSCP If the pilot RSCP exceeds a threshold it is considered a strong pilot signal The formula is
AbsoluteRSCPThRSCPCPICH __ gt
Excessive The number of pilot signals is used to judge whether there are excessive pilot signals at a certain point If the number exceeds a threshold it is regarded that excessive pilot signals exist at this point The formula is
NThNumberCPICH gt_
None of them is strong enough to be the best server The relative strength of a pilot signal is a key factor in judging whether the pilot signal is strong enough Based on the above definition and formulae if the difference between the strength of the
ZTE Confidential Proprietary copy 2012 ZTE CORPORATION All rights reserved 36
UMTS KPI Optimization Analysis Guide Internal Use Only
strongest pilot signal and that of the )1( +NTh strongest pilot signal at this point is
less than a threshold it is regarded that there is no pilot signal strong enough to be the best server at this point The formula is
lativeRSCPthThbest ThRSCPCPICHRSCPCPICHN Re_)1( )__( ltminus +
According to the above description it is regarded that pilot pollution exists if the following conditions are both satisfied
The number of pilot signals that meet the condition
AbsoluteRSCPThRSCPCPICH __ gt is more than NTh
lativeRSCPthThbest ThRSCPCPICHRSCPCPICHN Re_)1( )__( ltminus +
For example during the network optimization suppose
dBmTh AbsoluteRSCP 95_ minus= 3=NTh and dBTh lativeRSCP 5Re_ = if the following
conditions are both satisfied then it is regarded that pilot pollution exists
The number of the pilot signals that meet the condition
dBmRSCPCPICH 95_ minusgt is more than 3
dBRSCPCPICHRSCPCPICH thbest 5)__( 4 ltminus
4414 Adjusting Soft Handover Algorithm Parameters
You can solve the following kinds of problems by adjusting handover algorithm parameters
1 The handover is not prompt
From the perspective of the CS service signaling flow the symptom of this problem is that the UE cannot receive Active Set Update (physical channel reallocation in the case of the intra-frequency hard handover) because after the UE reports the measurement report the source cell has a fast reduction in EcIo When the RNC sends Active Set Update the UE has closed the transmitter due to the loss of downlink synchronization Viewed from the UE side it cannot receive Active Set Update In the PS services if the UE cannot receive Active Set Update or TRB resets before the handover the handover will also fail
From the perspective of signals the following phenomena may accompany this problem
ZTE Confidential Proprietary copy 2012 ZTE CORPORATION All rights reserved 37
UMTS KPI Optimization Analysis Guide Internal Use Only
minus Corner effect EcIo of the source cell decreases drastically and EcIo of the target cell increases sharply (very high when it appears)
minus Fast fading EcIo of the source cell decreases quickly for a while and then increases and EcIo of the target cell increases for a short while
2 Pingpong handovers The following phenomena may accompany this problem
The best server changes quickly Two or more cells take turns to be the best server But as the best server none of the cells can last long though they has good RSCPs and EcIos
There is no best server There are multiple cells Their RSCPs are normal and similar to each other But EcIo of every cell is very bad
From the perspective of the signaling flow Event 1A is reported immediately after one cell is deleted Because the UE cannot receive Active Set Update from the RNC the handover fails
4415 Equipment Malfunctions
First check the alarm console to see whether there are abnormal alarms and analyze the message traces at the same time Find out in which step the soft handover fails Check the failure message and contact the local product maintaining engineer to confirm whether the equipment has malfunctions
4416 Solutions
Corresponding adjustments should be taken for the confirmed problems
Handover failures caused by pilot pollution Adjust the engineering parameters of a certain antenna to set this antenna as the best server in this interfered location If the power of one of its sectors is reduced then Io of the pilot pollution area will decrease even if the powers of other pilots are not adjusted EcIo will also increase Thereby the EcIo differences with other scrambling codes in the active set will become larger and pilot pollution will be eliminated Through a lot of research ZTE has proved that the reduction in the pilot transmit power will not change cell capacity greatly If condition allows new base stations can be added to cover this area
Equipment malfunctions Consult the customer service engineers and ask them to help check whether there are alarms and whether the transport layer is abnormal If there are alarms coordinate with the customer service engineers and the engineering personnel to solve the problems
Call drops because the handovers are not prompt
ZTE Confidential Proprietary copy 2012 ZTE CORPORATION All rights reserved 38
UMTS KPI Optimization Analysis Guide Internal Use Only
minus Adjust the antenna to expand the handover zone
minus Configure the Event 1A handover parameters to make the handover easier to happen
minus Increase CIO to make the handover happen earlier in the target cell The sum of CIO and the actually measured value is used for judging the UE events including the UE intra-frequency handover CIO helps shift the cell border in the handover algorithm If CIO is configured with a larger value the handover will be easier to happen and there will be more UE in the soft-handover status but more resources will be occupied If CIO is configured with a smaller value the soft handover will be more difficult to happen and the receiving quality may be impaired A CIO of about 5dB is quite good for eliminating the fast fading and the corner effect but this configuration has some side effects such as the increase of handover proportion
Call drops caused by pingpong handovers Adjust the antenna to form a best server in its coverage zone or set the Event 1B handover parameters (increase the threshold of Event 1B the Event 1B hysteresis or the time to trigger Event 1B) to increase the difficulty in deleting the active set
442 Optimization of Hard Handovers
4421 Classification of Hard handovers
Hard handovers mainly fall into two classifications
Intra-frequency hard handovers The intra-frequency hard handover is triggered only when the intra-frequency softsofter handover cannot be performed and it is applicable to the following circumstances
minus Inter-RNC intra-frequency cell handovers when there is no Iur interface
minus Insufficient Iur interface resources though there is the Iur interface
minus Handovers controlled by the threshold of the PS service rate in the handover cell
The intra-frequency softsofter handovers can not be performed (intra-frequency hard handover should be triggered) in the following scenarios
minus When the intra-frequency handover happens the UE is using the transmit diversity in the active set cell but the target cell does not support the transmit diversity
minus The intra-frequency measurement report does not contain OFF and TM of the
ZTE Confidential Proprietary copy 2012 ZTE CORPORATION All rights reserved 39
UMTS KPI Optimization Analysis Guide Internal Use Only
target cell
minus When the intra-frequency handover happens between RNCs the Iur interface is unavailable
minus The UE performs the multiuser detection in the active set cell but the target cell does not support the multiuser detection
minus The target cell and the original cell belong to different classifications (The cells of R99 R5+R99 and R6+R5+R99 belong to the same classification while the cells of R5 and R6+R5 belong to another classification)
Inter-frequency hard handovers The inter-frequency hard handover means a UE connection is handed over from a cell of a UTRAN frequency to a cell of another frequency Many factors including the radio quality the load and the speed of the moving UE may trigger inter-frequency hard handovers
For example the radio quality triggers the inter-frequency hard handover in the following way
When the quality of the UE radio frequency becomes lower the inter-frequency measurement will be triggered and according to the measurement result the UE connection will be handed over to a better frequency
ZTE Confidential Proprietary copy 2012 ZTE CORPORATION All rights reserved 40
UMTS KPI Optimization Analysis Guide Internal Use Only
4422 Hard Handover Optimization Flowchart
Figure 4-13 Hard handover optimization flowchart
ZTE Confidential Proprietary copy 2012 ZTE CORPORATION All rights reserved 41
UMTS KPI Optimization Analysis Guide Internal Use Only
Extract performance data
TOP Ncell filtering
Analyze a single cell
1 Check NE alarms
2 Associate emergencies
3 Compare parameter
configurations
4 Associate indicators
5 Locate the fault
comprehensive ly
Exist or not
Handle alarms
Solved or not
Yes
Yes
End
No
Exist or not
Handle emergencies
Solved or not
YesNo
Exist or not
Correct wrong parameter
configurations
Solved or not
Yes
No
No
List related indicator counters
RTWPResource
limit indicators
Checkamp analysis of interference
Optimization analysis of
resource limit
Counters related to inter-frequency handover failures
C301110489 C301110516C301110499 C301110517C301110500 C301110518C301110501 C301110519C301110502 C301110520C301110503 C301110521C301110504 C301110522C301110505 C301110523
Solved or not
Yes
Yes
No
Drive Test+RNC signaling
trace
Yes
Counters related to hard handover
failures
30041 3004230043 3004430045 3004630047 30048
Cell hand-inhand-out indicators
NoNo
ZTE Confidential Proprietary copy 2012 ZTE CORPORATION All rights reserved 42
UMTS KPI Optimization Analysis Guide Internal Use Only
4423 Hard Handover Optimization Methods
The optimization flow for the hard handover is similar to that of the soft handover The major differences are in the parameter optimization To optimize intra-frequency hard handovers you can properly reduce the Event 1D hysteresis and the time to trigger Event 1D according to the real radio environment to ensure timely handovers
Inter-frequency coverage is often applied to some special scenarios such as indoor coverage and tested through CQT The method of judging whether there is missed configuration of the inter-frequency neighboring cell is almost the same as that of the co-frequency neighboring cell when a call drop occurs the UE fails to measure or report the inter-frequency neighboring cell after the call drop the UE resides in the inter-frequency neighboring cell again
The common hard handover problems are
1 The handover is not prompt The common symptoms are frequent call drops in the hard handovers when the UE moves
Solutions
Increase the threshold of activating the compressing mode The compressing mode is usually activated before the inter-frequency handover or the inter-RAT handover and it is used to measure the quality of the inter-frequency or inter-RAT cell You can set a threshold of the CPICH RSCP or EcIo to activate the compressing mode And the RSCP is widely used
minus Requirements on setting the threshold of activating the compressing mode Before the cell quality becomes low enough to cause a call drop the signal of the target cell should be measured and reported and the handover should be performed
minus Requirement on setting the threshold of deactivating the compression mode Frequent activationdeactivation of the compression mode should be avoided
Increase CIOs of the inter-frequency cell pair
Reduce the threshold of triggering the target frequency handover under the inter-frequency coverage
2 There are pingpong handovers
Solution Increase the hard handover hysteresis and the time to trigger the event
ZTE Confidential Proprietary copy 2012 ZTE CORPORATION All rights reserved 43
UMTS KPI Optimization Analysis Guide Internal Use Only
443 Optimization of Inter-RAT Handovers
4431 Configuring Basic Inter-RAT Parameters
Most of the inter-RAT handover failures are caused by incomplete parameter configuration The following parameters need special attention
Complete RNC parameter configuration for the GSM neighboring cell The 2G system shall provide the 3G system with the correct radio parameters based on negotiation mdash MCC MNC LAC ID (CI) NCC BCC frequency band indicator (900 or 1800) and BCCH
Table 4-3 Parameters That 2G Shall Provide to 3G
MCC MNC LACIDCI
NCC BCCFrequency
band indicator
BCCH
460 2 202 193 0 0 900 102
Complete GSM BSC parameter configuration for the WCDMA neighboring cell The 3G system shall provide the 2G system with the correct radio parameters based on negotiation mdash MCC MNC LAC RNC ID cell ID (C_ID) downlink frequency scrambling code and RAC
Table 4-4 Parameters That 3G Shall Provide to 2G
MCC MNC LACRNC
IDCell IDC_ID
Downlink frequency
Scrambling code
RAC
460 3 20 18 51 10787 51 20
According to the current strategy of one-way inter-RAT handovers if the parameter configuration is complete one probable cause of the inter-RAT handover failure is that the handover is not prompt The common parameter adjustment is to increase CIO the threshold to activatedeactivate the compressing mode and the threshold to trigger the WCDMA-to-GSM handover at the same time
Call drops during the inter-RAT handovers between WCDMA and GSM may be caused by
minus Inconsistent data configuration at the GSM side and the WCDMA side after GSM modifies the configuration data but does not inform WCDMA
minus Missed configuration of neighboring cells which can be solved by the correct configuration of neighboring cells
minus Too fast signal changes
ZTE Confidential Proprietary copy 2012 ZTE CORPORATION All rights reserved 44
UMTS KPI Optimization Analysis Guide Internal Use Only
minus Pingpong reselection
minus Faults with the UE for example the UE fails to respond to the handover or report the inter-RAT measurement report
minus Changes of the best server during the physical channel reallocation
minus Wrong LAC configuration which can be located through data configuration check
ZTE Confidential Proprietary copy 2012 ZTE CORPORATION All rights reserved 45
UMTS KPI Optimization Analysis Guide Internal Use Only
4432 Inter-RAT Handover Optimization Flowchart
Figure 4-14 Inter-RAT handover optimization flowchart
ZTE Confidential Proprietary copy 2012 ZTE CORPORATION All rights reserved 46
UMTS KPI Optimization Analysis Guide Internal Use Only
Extract performance data
TOP Ncell filtering
Analyze a single cell
1 Check NE alarms
2 Associate emergencies
3 Compare parameter
configurations
4 Associate indicators
5 Locate the fault
comprehensive ly
Exist or not
Handle alarms
Solved or not
Yes
Yes
End
No
No
Exist or not
Handle emergencies
Solved or not
Yes
No
No
Exist or not
Correct wrong parameter
configurations
Solved or not
Yes
No
No
List related indicator counters
RTWPResource
limit indicators
Checkamp analysis of interference
Optimization analysis of
resource limitCounters related to inter-RAT handover failures
C301130667 C301130681C301130668 C301130682C301130669 C301130690C301130670 C301130691C301130671 C301130692C301130672 C301130693C301130673 C301130694C301130674 C301130696C301130675 C301130697C301130677 C301130698C301130678 C301130699C301130679 C301130700
C301130680
Solved or not
Yes
Yes
No
Drive Test+RNC signaling
trace
Yes
Counters related to inter-RAT handover
failures
Cell hand-inhand-out indicators
30049 3005030051 3005230053 30054
ZTE Confidential Proprietary copy 2012 ZTE CORPORATION All rights reserved 47
UMTS KPI Optimization Analysis Guide Internal Use Only
45 Optimization of Resource Indicators
The resource indicators directly reflect the system capacity Increasing subscribers will consume more system resources and some resources may be limited for example the code resource may be limited the TCP access request may be rejected and the CE resource usage rate may exceed the threshold Limited system resources have a negative influence on the whole-network indicators and the subscribersrsquo perception for example call drops may frequently happen and more TCP access requests may be rejected during the voice services
Table 4-5 Resource KPIs and Alarm Thresholds
Resource type KPI No and nameAlarm
threshold
TCP
C301320150 Number of rejected services DCH downlink TCP limit
50
PI30167 Average non-HS (SOA) (SOA)DPA TCP 40
PI30092 Maximum Cell TCP () 100
PI30093 Average Cell TCP 70
UL TrafficPI30029 Handover Blocking Rate 05
KPI RTWP (in busy hour) -98 dBm
Code
C301320153 Number of rejected services DCH no code
50
PI30205 Average Cell HSUPA Users 12
PI30172 Cell Average HSDPA Users 16
CE
PI301830006 Maximum use Ratio of Uplink NodeB CE
60
PI301830010 Maximum use Ratio of Downlink NodeB CE
60
ZTE Confidential Proprietary copy 2012 ZTE CORPORATION All rights reserved 48
UMTS KPI Optimization Analysis Guide Internal Use Only
451 Resource Indicator Optimization Flowchart
Figure 4-15 Resource indicator optimization flowchart
ZTE Confidential Proprietary copy 2012 ZTE CORPORATION All rights reserved 49
UMTS KPI Optimization Analysis Guide Internal Use Only
Extract performance data
TOP Ncell filtering
Analyze a single cell
1 Check NE alarms
2 Associate emergencies
3 Compare parameter
configurations
4 Associate indicators
5 Locate the fault
comprehensive ly
Exist or not
Handle alarms
Solved or not
Yes
是
End
No
No
Exist or not
Handle emergencies
Solved or not
Yes
No
No
Exist or not
Correct wrong parameter
configurations
Solved or not
Yes
No
No
List related indicator counters
Code resource indicators
CE resource indicators
TCPadmission
reject counter
C301320150
Solved or not
Yes
Yes
No
Drive Test+RNC signaling
trace
Yes
Counter related to TCP limit
Cell TX power
indicators
30090 3009130092 3009330166 3016730168 3016930170 30171
30163301643016530075
30223302243045030451
Yes
Yes
ZTE Confidential Proprietary copy 2012 ZTE CORPORATION All rights reserved 50
UMTS KPI Optimization Analysis Guide Internal Use Only
452 Code Resource Optimization
The statistics of Number of rejected services and DCH no code the average code resource usage rate and the number of the HSDPA subscribers can be used to judge whether the code resource in a cell is limited If the code resource is limited you can adjust the code resource allocation to alleviate the situation
Based on the system algorithm when Formula 1 is satisfied you can add an HS-PDSCH when Formula 2 is satisfied then an HS-PDSCH is deleted
Formula 1 OcuRateNoHspdsch + OcuRateHspdsch + DpchCodeHy + 32 lt= 512
Formula 2 OcuRateNoHspdsch + OcuRateHspdsch + CodeUptHyA gt 512
OcuRateHspdschHSPDSCH means the number of the codes of SF=512 blocked by the HS-PDSCH OcuRateNoHspdsch means the number of codes of SF=512 blocked by other channels DpchCodeHy means the number of codes of SF=512 reserved for the DPCH and CodeUptHyA is the threshold to decide whether to delete the HSPDSCH
Therefore to ensure the access of the R99 subscribers you can make some adjustment according to Table 4-6 when the code resource is limited though the HSDPA rate may decrease
Table 4-6 Adjusting Code Resource Allocation
AbbreviationParameter
nameRange
and stepCurrent value
Update value
Remark
DpchCodeHy DPCH Code Hysteresis
0512 16 28
To decrease the number of rejected services for DCH no code
CodeUptHyACode Update Hysteresis A
0512 16 28
To decrease the number of rejected services for DCH no code
453 Monitoring CE Resource
The CE resource is mainly monitored through the maximum UE uplinkdownlink usage rate If there is any problem you can solve it by controlling the load or adding more boards
ZTE Confidential Proprietary copy 2012 ZTE CORPORATION All rights reserved 51
UMTS KPI Optimization Analysis Guide Internal Use Only
454 Optimization of Power Control
4541 Monitoring and Optimizing Downlink Power Control
Limited TCP in busy hours will not only increase access failures and call drops in the local cell but also increase soft handover failures and call drops in the neighboring cells Number of rejected services and DCH downlink TCP limit are intuitive KPIs to judge whether TCP is limited Although limited uplink capacity and massive UE moves in the rush hours may also cause call drops the limited TCP is absolutely a key factor
Based on the system algorithm MinHsdpaPower (MinHspaPwrRto) + NoHsPower gtNode B if the safety threshold is used (MinHsdpaPower means the power reserved for HSPA) then it will activate the downlink rate downgrade algorithm flow for the congestion (lower the downlink DCH rate) Although the rate downgrade can ensure access of some subscribers it is an irregular action and will degrade the performance
455 Speeding up Rate Downgrade
Considering that the cells with heavy load reject more access requests you can speed up the rate downgrade during the resource congestion to release the resources as soon as possible and avoid call drops caused by access failures (this method is only applicable to the cells with many PS service users but not those with only CS service users) Table 4-7 is an example of the parameter modification for the rate downgrade
Table 4-7 Example of Parameter Modification for Rate Downgrade
Abbreviation Parameter nameRange and
stepCurrent value
Update value
Remark
UlDnMaxStg Maximum Number of Degraded Uplink Load Steps Every Time
[1 8] 1 2 Downgrade from 384 Kbps to 16 Kbps
DlDnMaxStg Maximum Number of Degraded Downlink Load Steps Every Time
[1 8] 1 3 Downgrade from 384 Kbps to 8 Kbps
456 Monitoring and Optimizing Uplink Capacity
Handover Blocking Rate and RTWP can reflect the uplink capacity of the cell Because interference may also increase RTWP this factor should be distinguished during the RTWP monitoring Another effective indicator is the voice service erl If a cell has over 20 erls in busy hours you should pay special attention to it
ZTE Confidential Proprietary copy 2012 ZTE CORPORATION All rights reserved 52
UMTS KPI Optimization Analysis Guide Internal Use Only
457 Optimization of Uplink Capacity at the Whole Network Level
Case The uplink capacity was limited in a large number of sites after the cutover and the symptoms are a sharp rise of RTWP and a high call drop rate during the rush hours
After the following parameters were modified as shown in Table 4-8 the problem was solved
Table 4-8 Example of Power Control Parameter Modification
AbbreviationParameter
nameRange
Current value
Update value
ULINITSIRUplink Initial SIR target (dB)
UL 34 K136 K signaling UL 122 K AMR
4-5 35
ULMAXSIRMaximum Uplink SIR target (dB)
UL 34 K136 K signaling UL 122 K AMR
15 10
UlSirTargDnStepUplink SIR Target Down Step Size (dB)
UL 34 K136 K signaling UL 122 K AMR
01 02
458 Optimization of Uplink Capacity for a Single Cell
A lot of optimization measures can be taken to bring down the rising RTWP However with increasing subscribers the capacity may still be limited in some area while further modification of SirTarget will obviously degrade the call quality of the whole network and undermine the subscribersrsquo perception In this case you can adjust the power control parameters for a single site that has heavy traffic in the following way add one set of DivPc parameters and use this set of parameters only for this site
Case Table 4-9 shows an example of the power control parameter modification After this modification the call drop rate in the site with heavy traffic decreased to one quarter of the original one
Table 4-9 Example of Power Control Parameter Modification for Heavy-Traffic Cell
SRVTYPE ULINITSIR ULMAXSIR ULMINSIR
0 35-gt15 100-gt35 20-gt10
104 40-gt20 150-gt50 05-gt0
28 35-gt15 100-gt35 05-gt0
50 60-gt20 150-gt50 20-gt0
54 60-gt20 150-gt50 20-gt0
ZTE Confidential Proprietary copy 2012 ZTE CORPORATION All rights reserved 53
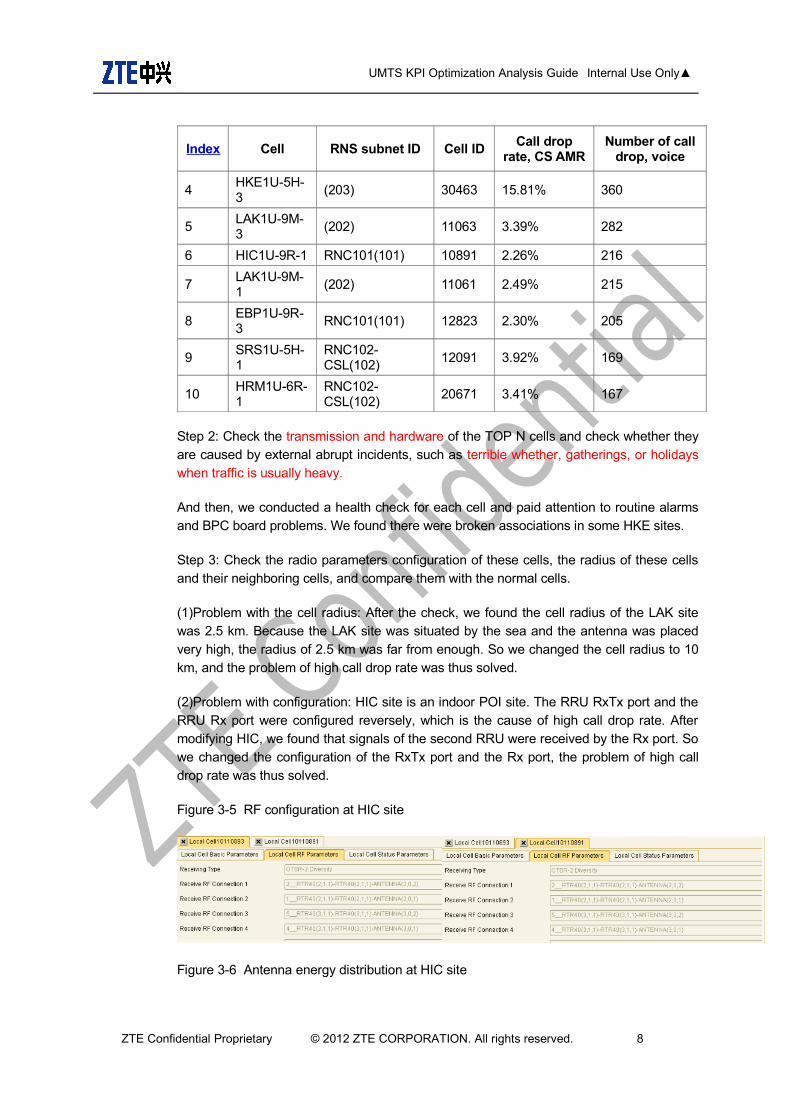
UMTS KPI Optimization Analysis Guide Internal Use Only
Index Cell RNS subnet ID Cell IDCall drop
rate CS AMRNumber of call
drop voice
4HKE1U-5H-3
(203) 30463 1581 360
5LAK1U-9M-3
(202) 11063 339 282
6 HIC1U-9R-1 RNC101(101) 10891 226 216
7LAK1U-9M-1
(202) 11061 249 215
8EBP1U-9R-3
RNC101(101) 12823 230 205
9SRS1U-5H-1
RNC102-CSL(102)
12091 392 169
10HRM1U-6R-1
RNC102-CSL(102)
20671 341 167
Step 2 Check the transmission and hardware of the TOP N cells and check whether they are caused by external abrupt incidents such as terrible whether gatherings or holidays when traffic is usually heavy
And then we conducted a health check for each cell and paid attention to routine alarms and BPC board problems We found there were broken associations in some HKE sites
Step 3 Check the radio parameters configuration of these cells the radius of these cells and their neighboring cells and compare them with the normal cells
(1)Problem with the cell radius After the check we found the cell radius of the LAK site was 25 km Because the LAK site was situated by the sea and the antenna was placed very high the radius of 25 km was far from enough So we changed the cell radius to 10 km and the problem of high call drop rate was thus solved
(2)Problem with configuration HIC site is an indoor POI site The RRU RxTx port and the RRU Rx port were configured reversely which is the cause of high call drop rate After modifying HIC we found that signals of the second RRU were received by the Rx port So we changed the configuration of the RxTx port and the Rx port the problem of high call drop rate was thus solved
Figure 3-5 RF configuration at HIC site
Figure 3-6 Antenna energy distribution at HIC site
ZTE Confidential Proprietary copy 2012 ZTE CORPORATION All rights reserved 8
UMTS KPI Optimization Analysis Guide Internal Use Only
Step 4 Export the indicator relevant most closely with the indicators you care about and analyze it to find the problem indirectly
Table 3-2 Indicators Related with CS Call Drop
Index Cell
RAB release number for Iu connection
release request by UTRAN for CS domain in
cell radio connection with UE lost
RAB release number for Iu connection
release request by UTRAN for CS domain in cell failure in
the radio Interface
procedure
RAB release number for Iu connection
release request by
UTRAN for CS domain in
cell release due to
overload control
RAB release number for Iu connection
release request by
UTRAN for CS domain in
cell unspecified
failure
Average cell freq RTWP (dbm)
1ZBL1U-AI-1
482 43 0 29 -104177
2ZBL1U-AI-3
473 40 0 33 -104125
3HKE1U-5H-1
346 16 0 8 -105908
4HKE1U-5H-3
330 18 0 13 -1060777
5LAK1U-9M-3
69 196 0 18 -1031906
6HIC1U-9R-1
100 100 0 16 -1015404
7 LAK1U- 64 131 0 20 -1031934
ZTE Confidential Proprietary copy 2012 ZTE CORPORATION All rights reserved 9
UMTS KPI Optimization Analysis Guide Internal Use Only
Index Cell
RAB release number for Iu connection
release request by UTRAN for CS domain in
cell radio connection with UE lost
RAB release number for Iu connection
release request by UTRAN for CS domain in cell failure in
the radio Interface
procedure
RAB release number for Iu connection
release request by
UTRAN for CS domain in
cell release due to
overload control
RAB release number for Iu connection
release request by
UTRAN for CS domain in
cell unspecified
failure
Average cell freq RTWP (dbm)
9M-1
8EBP1U-9R-3
98 90 0 17 -101413
9SRS1U-5H-1
87 59 0 22 -1043528
10HRM1U-6R-1
42 111 0 13 -1027697
32 Basic KPI Analysis Skills
Be able to use the KPI statistics tool and the analysis tool
Use tools to learn about the running state of the whole network quickly and screen out TOP N worst cells quickly
Use different analysis tools to find problems from different aspects and locate the problem quickly
Understand the signaling process and basic principle
In the process of abnormity location keep a clear aim in mind and be able to apply the process and basic principle to check the other relevant indicators rapidly to facilitate the analysis
Be familiar with the process and basic principle and be able to make logical association between abnormal KPI problems and network problems (such as the coverage problem and the interference problem) Be able to determine the problem nature according to the abnormal KPI and then choose the appropriate tool to analyze the problem in depth
Performance analysis requires engineers to understand basic signaling process be familiar with the protocol stacks of standard interfaces and know relevant algorithms to realize the product functions Engineers should at least have a concept about the various algorithms If the analysis of a commercial network involves some algorithms engineers should study these algorithms in depth
ZTE Confidential Proprietary copy 2012 ZTE CORPORATION All rights reserved 10
UMTS KPI Optimization Analysis Guide Internal Use Only
321 KPI Monitoring Tools
minus Network management tool NetNumenT31 count KPI original data alarm data radio parameter configuration in cells and parameter configuration on the earth
minus KPI daily report generating tool classify key indicators according to a certain condition and screen out the worst cells
322 KPI Analysis Tools
minus CNO Tool CNO tool has the KPI analysis function So using it you can screen out the worst cells according to various conditions and point out the corresponding counter of an indicator
minus SignalTrace Trace the signaling (RNL signaling and RNL signaling) of RNC interfaces which includes the Iu interface the Iur interface the Iub interface and the Uu interface (the signaling flow between RNC and UE at RRC layer) And RNL signaling trace is a common way for locating the KPI problem Being able to trace the RNC signaling is a basic requirement for the on-site KPI optimization engineers and the network optimization and maintenance engineers This signaling tracing tool is very powerful which can trace signaling according to the UE cell and IMSI in the KPI analysis According to the UE cell it can trace the signaling of multiple subscribers while according to IMSI it can trace the signaling of only one subscriber However if the RRC connection is not established yet signaling cannot be traced That is because only when RRC connection has been established can the RNC obtain the subscriberrsquos IMSI from the CN
minus RNC ASS Log ASS log is usually applied when there is abnormity and RNC signaling is out of trace In this case use ASS log to analyze the signaling before and after the abnormity occurs Abnormity can be queried according to IMSI or cell ID ASS log can be also used to collect various abnormities
minus NodeB LMT NodeB local operation and maintenance tool Apart from all the operation functions of the OMCB this tool can collect more detailed information about cells and UE NodeB local maintenance terminals include EOMS EFMS DMS and PMS
minus NodeB Abnormity Probe On the site of WCDMA commercial office NodeB abnormity probe is an effective tool to monitor the running state of the NodeB Every module of NodeB can record the abnormal information automatically which makes it easy to locate problems However this method requires professional knowledge such as knowledge about the function and interface of each module or board If the on-site engineers cannot make the simple analysis they can just obtain the abnormity probe and send it to the RampD engineers at the rear side The abnormities reported on the NodeB will be stored at the OMCB server according to different RNCs To conduct NodeB
ZTE Confidential Proprietary copy 2012 ZTE CORPORATION All rights reserved 11
UMTS KPI Optimization Analysis Guide Internal Use Only
abnormity probe analysis you need to download abnormity probe files from different OMCB servers and then use the abnormity probe tool to make a comprehensive analysis
minus CTS Tool CTS is a tool developed by the CN department which can trace signaling in depth according to IMSI and trace signaling across RNCs So this is particularly suitable to trace VIP subscribers In this case CTS is easier to use than SignalTrace which can only trace signaling of RNCs one by one CTS can trace the interactive signaling between network elements (NEs) within the CN as well as the signaling of the Iu interface and the Uu interface This kind of signaling tracing is what we called in-depth tracing The work principle of CTS is to set up an IMSI task on the CTS server and send it to the CN front side which will then send this task to each CN module via the interfaces dedicated to the CN modules and the RNC and then each module after receiving the signaling related to the IMSI task will send the signaling back to the CTS server via the CN front side The interfaces mentioned above are private interfaces so this tool can only support our own CN and RNC CTS signaling can be checked and analyzed with an offline tool but the offline tool does not work very well because of the lack of continuous optimization and perfection
minus UE log DT test is also an important auxiliary way in analyzing KPI indicators There are many problems that cannot be located by tracing signaling at the network side and can only be located by the use of UE log The commonly used drive test software includes QXDMAPEX (QCAT) CNTCAN and TEMS CNTCAN and TEMS are often used for network optimization For the use of CNTCAN please refer to the corresponding help file and the instruction document publicly released by the Network Optimization Tool Department QXDM and the analysis tool APEX (QCAT) provided by Qualcomm is very powerful which have contributed a lot for the stability and maturity of our system for many years
33 General Process of KPI Optimization Analysis
Basic analyzing ideas
KPI optimization is a process to find and solve problems KPI optimization during the operation and maintenance stage is mainly to pick out the performance data that needs special attention from the OMC classify these performance data and then compare the value of these data with that required by the operator If the value of an indicator is lower than the operatorrsquos requirement analyze this indicator and find out the factor that affect the indicator and then propose a solution to the operator If the values are higher than the operatorrsquos requirement therersquos no need to pay special attention to them
KPI analysis is a process from the whole to the part
Step 1 Check the key indicators from the view of the whole network If there is not any
ZTE Confidential Proprietary copy 2012 ZTE CORPORATION All rights reserved 12
UMTS KPI Optimization Analysis Guide Internal Use Only
problem just ignore them Otherwise try to locate the RNC NE that has the problem
Step 2 Analyze the indicators of the corresponding RNC to find out the RNC whose indicators have the problem
Step 3 Analyze the indicators of the cell under the problem RNC to find out the worst cells or TOP N cells If the indicators of all the cells under the RNC are tend to be low it is a common problem probably caused by parameter configuration And then check whether the radio parameter configuration in the cells under this RNC is the same as that in the cells under the normal RNCs
Step 4 Make a comprehensive analysis on the KPIs alarms DT test data and customer complains of the worst cells to find out a solution
Analysis method
After learning the KPI analysis ideas we must know some common KPI analysis methods to rule out causes of problems from the obvious ones to the hidden ones
For example we found that the TCP code words were strictly limited at eight sites near a park and the call drop rate rose suddenly How to solve this problem
Method one First we checked whether the alarms transmission and boards of these sites were normal After they are proved all normal we sent some engineers to the site to do test And meanwhile we traced the RNC signaling at the OMC It turned out that the test result was normal and the indicators of these sites of that day did not have any problem and code words were not limited And later we knew from the news that there was a big gathering of about one million people at the park at that moment Until then we came to know that the congestion was caused by too many users using the network at the same time
Method two First because the eight sites went worse all of a sudden it was unlikely that the problem lied in the hardware Then we checked whether the radio parameters had been modified the day before The result is no worksheet had been issued to modify those parameters and no alarm was found at those sites Therefore we excluded the possibility of hardware problem Then we checked the traffic trend graph of the last few days (over seven days) and found that the high call drop rate might be caused by high traffic The graph showed that traffic of each site rose suddenly on the day before Thus we came to the conclusion that this was an abnormal abrupt event which may have been caused by a gathering And later we were told that there was a big gathering at the park So we were assured the code words limitation and high call drop rate at the eight sites were caused by too many subscribers using the network at the same time
By comparing the two methods above we can find that although the first one (sending engineers to the site without the consideration of abnormal events) is commonly used it is inefficient and costs more resource The second method (analyzing the problem by the means of exclusion and association) is more efficient From this case we would like to emphasize that KPI analysis is a process of problem exclusion Using the comprehensive
ZTE Confidential Proprietary copy 2012 ZTE CORPORATION All rights reserved 13
UMTS KPI Optimization Analysis Guide Internal Use Only
methods (like Method One) at the first brush may be making a detour
minus Exclusion method Check the alarms on the OMC to learn about the state of the RNC NodeB BPC board and the transmission If there are obvious broken link in transmission or hardware problem the cause of the problem is easy to locate
minus Incident association If the problem is with a great number of sites take abrupt incidents into account such as large-scale gathering terrible weather of incorrect operation These incidents will put influence of different levels and ranges on the network indicators
minus Comparison of radio parameters If some site goes wrong in a sudden check whether the radio parameter configuration of this site is consistent with that of other normal sites If not change it as that of the normal sites because the indicator decrease may be caused by an incorrect modification of radio parameters
minus Relevant indicators association If a certain indicator is in poor condition check its relevant indicators and find the common problem from these relevant indicators
minus Comprehensive problem location When the above reasons are excluded use DT data KPI data RNC signaling analysis data to locate the problem with indicators comprehensively
ZTE Confidential Proprietary copy 2012 ZTE CORPORATION All rights reserved 14
UMTS KPI Optimization Analysis Guide Internal Use Only
Figure 3-7 KPI optimization analysis process
StartPick out
performance indexes
RNC index abnormal
Equipment alarms exist
Deal with equipment alarms
RNC index recovers
Common problem with the
worst cells
Transmission softwarehardware version wireless
parameter configuration
CNRNC Transmission
Hardware Software Interference
Wireless parameters
Time range
Abrupt and self-curable abnormality
helliphellip
Analyze and record causes
Suggestion about improvement
Common problems analysis
Problem resolved
Successful call
Call drop Soft handover
23G alternate operation
PS rate helliphellip
Deal with the relevant problem
Indexes normal
End
Climate change holidays assembly
transmission interruption power
fault and so on
Y
N
Y
Y
N
Y
N
Abnormal indexes analysis in one cell
Y
N
N
N
Y
N
Y
Show TOPN abnormal cells
and their locations
If the problem is proved to be equipment bug or system problem after
several attempts feed it back to RampD dept
ZTE Confidential Proprietary copy 2012 ZTE CORPORATION All rights reserved 15
UMTS KPI Optimization Analysis Guide Internal Use Only
4 KPI Optimization Analysis This chapter mainly demonstrates how to analyze the indicator problems from the aspect of OMC data and provides flowcharts for KPI optimization The detailed analyzing method and cases of every special subject can be checked in the optimization guides of all the subjects
41 CS Call Drop Optimization
The CS call drop rate is the most important indicator in KPI optimization
411 Definition of Call Drop
After checking the signaling on the Uu interface at the UE side the engineer can judge the situation a call drop if the Uu interface message satisfies one of the following three conditions during the calling process (in connection)
RNC Release is not received but the UE condition changes from CELL_DCH to IDLE
RRC Release is received and the released cause value is Not Normal
One of the following three messages mdash CC Disconnect CC Release Complete and CC Release mdash is received and the released cause value is Not Normal Clearing or Not Normal Unspecified
In a board sense the call drop includes the call drop rates of CN and UTRAN The call drop of UTRAN includes the following two aspects
After the successful service establishment RNC sends the RAB Release Request to CN
After the successful service establishment RNC sends the IU Release Request to CN Later RNC receives the IU Release Command from CN
Note that RAN call drop statistics which is defined from the aspect of lu interface signaling means the launching times of RAB Release Request and lu Release Request of RNC And the DT call drop statistics is defined from the aspects of the Uu interface message non-access stratum message and cause value RAN call drop statistics and DT call drop statistics are not exactly the same
ZTE Confidential Proprietary copy 2012 ZTE CORPORATION All rights reserved 16
UMTS KPI Optimization Analysis Guide Internal Use Only
412 CS Call Drop Analysis Flowchart
Figure 4-8 CS call drop analysis flowchart
ZTE Confidential Proprietary copy 2012 ZTE CORPORATION All rights reserved 17
UMTS KPI Optimization Analysis Guide Internal Use Only
Extract performance data
CS TOP Ncell filtering
Analyze a single cell
1 Check NE alarms
2 Associate emergencies
3 Compare parameter
configurations
4 Associate indicators
5 Locate the fault
comprehensively
Exist or not
Handle alarms
Solved or not
Yes
Yes
End
No
No
Exist or not
Handle emergencies
Solved or not
Yes
No
No
Exist or not
Correct wrong parameter
configurations
Solved or not
Yes
No
No
List related indicator counters
Call-drop-related
countersRTWP
Handover success rate
Traffic volume
Resource limit indicators
Checkamp analysis of
interference
Optimizationanalysis of
handover failures
Optimization analysis of
resource limitCall-drop-
related counters
C301230362C301230363C301230365C301230315C301230316C301230318C301230319C301230322C301230323
Solved or not
Yes
Yes
No
Drive Test+RNC signaling
trace
Yes
ZTE Confidential Proprietary copy 2012 ZTE CORPORATION All rights reserved 18
UMTS KPI Optimization Analysis Guide Internal Use Only
42 PS Call Drop Optimization
421 Optimization Flowchart
Figure 4-9 PS call drop optimization flowchart
ZTE Confidential Proprietary copy 2012 ZTE CORPORATION All rights reserved 19
UMTS KPI Optimization Analysis Guide Internal Use Only
Extract performance data
PS TOP Ncell filtering
Analyze a single cell
1 Check NE alarms
2 Associate emergencies
3 Compare parameter
configurations
4 Associate indicators
5 Locate the fault
comprehensive ly
Exist or not
Handle alarms
Solved or not
Yes
Yes
End
No
No
Exist or not
Handle emergencies
Solved or not
Yes
No
No
Exist or not
Correct wrong parameter
configurations
Solved or not
Yes
No
No
List related indicator counters
Call -drop-related
countersRTWP
Handover success rate
Traffic volume
Resource limit indicators
Check amp analysis of interference
Optimizationanalysis of
handover failures
Optimization analysis of
resource limitCall -drop-
related counters
C301230372C301230373C301230375C301230330C301230332C301230333C301230334C301230337C301230338
Solved or not
Yes
Yes
No
Drive Test +RNC signaling
trace
Yes
ZTE Confidential Proprietary copy 2012 ZTE CORPORATION All rights reserved 20
UMTS KPI Optimization Analysis Guide Internal Use Only
43 Optimization of Accessibility Indicators
Accessibility performance includes the success rate of RRC connection setup and the success rate of CSPS RAB assignment These two kinds of KPIs play important roles in the network optimization and directly influence the success rate of CSPS service establishment In this document this kind of problems are found from the aspect of OMC data and solved through parameter optimization
431 Definition of Access Failure
For the mobile originated call in the CS domain the access failure event means that the UE sends RRC REQUEST and IE establish cause is Originating Conversational Call but alerting of the direct transfer message is not received
The relevant events are defined as follows in the access failure stage
RRC connection setup failure After considering the resending times and the waiting time the UE sends RRC CONNECTION REQUEST and does not receive the response from RNC or RRC CONNECTION REJECT delivered by RNC
Initial direct transfer and security mode establishment failure After sending RRC CONNECTION SETUP COMPLETE the UE does not send NAS SETUP
RAB assignment failure After receiving CALL PROCEEDING the UE does not receive RB SETUP delivered by RNC Or the UE replies with RB SETUP FAIL after receiving RB SETUP Or the UE receives DISCONNECT with the cause value not being Normal Release after receiving RB SETUP At this time the UE has not reported RB SETUP CMP
Failure after RAB assignment After the UE sends RB SETUP COMPLETE the originating UE receives DISCONNECTRELEASE from CN Or the UE waits CONNECT or ALERTING overtime and launches the Call Clearing process Or the UE becomes IDLE before receiving Alerting and starts to receive the system message
For the mobile terminated in the CS domain the access failure event means that the terminating UE receives the paging of paging type 1 and does not send RRC CONNECTION REQUEST with the cause value being Terminating Conversational Call Or the UE does not send the alerting of direct transfer message to CN after sending RRC CONNECTION REQUEST
The relevant events are defined as follows in the access failure stage
RRC connection setup failure After sending RRC CONNECTION REQUEST the UE does not receive the response from RNC or RRC CONNECTION REJECT delivered by RNC
Initial direct transfer and security mode establishment failure After sending RRC
ZTE Confidential Proprietary copy 2012 ZTE CORPORATION All rights reserved 21
UMTS KPI Optimization Analysis Guide Internal Use Only
CONNECTION SETUP COMPLETE the UE does not receive the SETUP direct transfer message Or the UE sends RELEASE COMPLETE Or the UE receives DISCONNECT from CN
RAB assignment failure The UE does not receive RB SETUP delivered by RNC after sending CALL CONFIRM Or the UE replies with RB SETUP FAIL after receiving RB SETUP Or the UE receives DISCONNECT with the cause value not being Normal Release after receiving RB SETUP At this time the UE has not reported RB SETUP CMP
Failure after RAB assignment After the UE sends RB SETUP COMPLETE the terminating UE receives DISCONNECTRELEASE from CN
432 Analysis on RRC Connection Failures
The problem of RRC connection setup failure can be analyzed through the UE signaling flow and RNC single-user tracing The RRC connection setup includes the following steps
The UE sends RRC Connection Request through the RACH channel
RNC sends RRC Connection Setup through the FACH channel
The UE sends RRC Connection Setup Complete through the dedicated uplink channel after the downlink dedicated channel is established and synchronized
RRC connection setup failures are always caused by following issues
Uplink RACH problem
Problem about downlink FACH power allocation proportion
Parameter reselection problem of the cell
Low downlink dedicated initial transmitting power
Uplink initial power control problem
Congestion
Equipment malfunctions
Among these issues the problems of uplink RACH downlink FACH power allocation proportion parameter reselection of the cell and equipment malfunctions appear more frequently
ZTE Confidential Proprietary copy 2012 ZTE CORPORATION All rights reserved 22
UMTS KPI Optimization Analysis Guide Internal Use Only
4321 Analysis Flowchart of RRC Connection Setup Failures
Figure 4-10 Analysis flowchart of RRC connection setup failures
ZTE Confidential Proprietary copy 2012 ZTE CORPORATION All rights reserved 23
UMTS KPI Optimization Analysis Guide Internal Use Only
Extract performance data
TOP Ncell filtering
Analyze a single cell
1 Check NE alarms
2 Associate emergencies
3 Compare parameter
configurations
4 Associate indicators
5 Locate the fault
comprehensive ly
Exist or not
Handle alarms
Solved or not
Yes
Yes
End
No
No
Exist or not
Handle emergencies
Solved or not
Yes
No
No
Exist or not
Correct wrong parameter
configurations
Solved or not
Yes
No
No
List related indicator counters
Counters related to RRC setup
failuresRTWP
Resource limit
indicators
Checkamp analysis of interference
Optimization analysis of
resource limitCounters related
to RRC setup failures
C301480485C301480486C301480487C301480489C301480490C301480491C301481288C301481289C301481337C301481338C301481339C301481407C301481408
Solved or not
Yes
Yes
No
Drive Test+RNC signaling
trace
Yes
ZTE Confidential Proprietary copy 2012 ZTE CORPORATION All rights reserved 24
UMTS KPI Optimization Analysis Guide Internal Use Only
4322 UE sends RRC Connection Request but RNC does not receive it
If the EcIo of downlink CPICH is relatively low it is the problem of coverage
If the EcIo of downlink CPICH is not very low (for example the value is larger than -14 dB) Usually it is the problem of RACH and the following issues may cause the problem
minus The power of Preamble does not rise to a required value and the rising times of Preamble should be increased
minus The output power of UE is lower than the required value which is caused by poor UE performance In this case the UE should be changed
minus The NodeB equipment has a standing wave and the engineer should check whether NodeB has any SWR alarm
minus The radius of the cell is set improperly If the radius parameter of the cell is set too small the NodeB can not synchronize the UE beyond the range of the radius and the access fails This problem often happens in the places with large coverage such as the rural areas and the suburbs
4323 RNC delivers RRC Connection Reject after receiving RRC Setup Request
When RRC Connection Reject appears the engineer should check the specific reject cause value Usually there are two kinds of causes
The CPU load of RNC control plane board is too heavy and more boards should be added
DCH and FACH admission is rejected However this situation does not always happen
4324 UE does not receive RRC Connection Setup delivered by RNC
This problem may be caused by the following reasons
Poor coverage
Improper parameters of cell selection and reselection
Checking method The engineer should check the EcIo of CPICH If the value is lower than -12 dB (EcIo is -12 dB by default) and there is no cell of better quality in the monitor set the cause of this problem is poor coverage If there is better cell in the monitor set cell reselection may cause this problem
Poor coverage can be improved by coverage enhancement such as adding some sites to cover the places without signal coverage and adjusting the engineering parameters If the coverage can not be improved the engineer can enhance the FACH power according to
ZTE Confidential Proprietary copy 2012 ZTE CORPORATION All rights reserved 25
UMTS KPI Optimization Analysis Guide Internal Use Only
the PCPICH EcIo coverage of the current network For example if all the pilot EcIo values are larger than -12 dB in the coverage area the power proportion of the common channel should be configured on the basis of the situation that the EcIo value is larger than -12 dB And so the success rate of the idle UE assessment can be ensured
As for the access problem caused by cell selection and reselection the engineer can speed up the cell selection and reselection by adjusting the cell selection and reselection parameters and the problem of RRC connection setup failure caused by improper cell selection and reselection parameters can be solved
Note
The RRC Connection Setup message is borne by FACH RRC Connection Request sent by the UE is received by UTRAN at the preamble of PRACH and then it is sent from the RACH channel based on the current preamble power And the transmit power of preamble can rise all the time until the response is received (There is a limitation for the maximum number of preamble retransmissions) Therefore in the areas with poor coverage the RACH coverage and FACH coverage may become unbalanced and as a result UTRAN can receive RRC Connection Request sent by the UE but the UE can not receive RRC Connection Setup sent by RNC
4325 UE receives RRC Connection Setup and does not send RRC Setup Complete
If the downlink signal quality is normal this problem may be caused by the abnormal condition of the cell phone
Another reason of this problem may be the downlink synchronization failure caused by the low initial power of downlink dedicated channel You can solve this problem by adjusting the service downlink EbNo
4326 RNC does not receive RRC Setup Complete sent by UE
Because the uplink initial power control may increase the UE transmit power this kind of problem seldom appears If it appears the engineer can increase the Constant Value of the dedicated channel properly to raise the uplink DPCCH initial transmission power of the UE
At the same time this problem is also relevant with the uplink SIR initial target value configuration because this value may affect the uplink initial synchronization at the initial stage of link setup If the value of the parameter is set too large there will be too much uplink inference brought by the initial setup of the link If the value is set too small the uplink synchronization will take longer time and the initial synchronization may even fail This parameter is an RNC-level parameter which has a great influence on network performance Therefore the engineer should be cautious while adjusting this parameter
ZTE Confidential Proprietary copy 2012 ZTE CORPORATION All rights reserved 26
UMTS KPI Optimization Analysis Guide Internal Use Only
Note
RRC Connection Setup Complete is sent through uplink DPCH and the UE calculates the initial power of uplink DPCCH according to the received IErdquoDPCCH_Power_offsetrdquo and the measured CPICH_RSCP value
DPCCH_Initial_power = DPCCH_Power_offset - CPICH_RSCP
DPCCH_Power_offset = Primary CPICH DL TX Power + UL Interference + Constant Value The Constant Value can be configured in the OMC If this value is set too small the UE may not have enough power to send RRC Connection Setup Complete
433 Analysis on RABRB Setup Failures
When RAB or RB setup fails RNC will send RAB Assignment Fail in the RAB Assignment Response signaling The engineer can find out the specific failure reason from the failure cause value carried in relevant cells The reasons for common RABRB setup failures include
RNC directly rejecting RAB Setup Request because of wrong parameter configuration
Admission reject
RAB setup failure because the UE fails to respond to RB Setup Request
RAB setup failure because the Uu interface fails to set up RB
ZTE Confidential Proprietary copy 2012 ZTE CORPORATION All rights reserved 27
UMTS KPI Optimization Analysis Guide Internal Use Only
4331 Analysis Flowchart of RAB Setup Failures
Figure 4-11 Analysis flowchart of RAB setup failures
ZTE Confidential Proprietary copy 2012 ZTE CORPORATION All rights reserved 28
UMTS KPI Optimization Analysis Guide Internal Use Only
Extract performance data
TOP Ncell filtering
Analyze a single cell
1 Check NE alarms
2 Associate emergencies
3 Compare parameter
configurations
4 Associate indicators
5 Locate the fault
comprehensively
Exist or not
Handle alarms
Solved or not
Yes
Yes
End
No
No
Exist or not
Handle emergencies
Solved or not
Yes
No
No
Exist or not
Correct wrong parameter
configurations
Solved or not
Yes
No
No
List related indicator counters
Counters related to RAB setup failures RTWP
Resource limit
indicators
Checkamp analysis of interference
Optimization analysis of
resource limitCounters related to RAB setup failures
CS domain PS domainC301230290 C301230302C301230291 C301230303C301230292 C301230304C301230293 C301230305C301230294 C301230306C301230295 C301230307C301230296 C301230308C301230297 C301230309C301230298 C301230310C301230299 C301230311C301230300 C301230312C301230301 C301230313
Solved or not
Yes
Yes
No
Drive Test+RNC signaling
trace
Yes
ZTE Confidential Proprietary copy 2012 ZTE CORPORATION All rights reserved 29
UMTS KPI Optimization Analysis Guide Internal Use Only
4332 RNC Directly Rejecting RAB Setup Request Because Of Wrong Parameter Configuration
The case that RNC responds with RAB Setup Failure directly is seldom caused by invalid parameter configuration in the business network Usually this case is caused by special operations of the special users
The main scenario is that the subscription information of the userrsquos PS service is beyond the capability of the UE which leads to the direct refusal from RNC For example a special userrsquos subscription rates of uplink and downlink are 384 K but the maximum uplink rate of the UE is only 64 K The maximum uplink and downlink rates of the QoS message used for activating PDP set by the AT command or mobile terminal software used by the user are 384 K so the RNC will find the maximum uplink rate is beyond the UErsquos capability directly reply with RAB Setup Failure and will not launch the RB setup process when it receives RAB Assignment Request
After the RAB setup fails because the parameter configuration is beyond the UErsquos capability SGSN will negotiate again to launch the new RAB assignment until the UE has the capability to support the assignment and the RAB assignment is finished For the users the PDP activation is still successful and the actual maximum rate is the maximum rate the UE can support
However if the minimum guaranteed bit rate required by the QoS setting in the UErsquos PDP activation request is beyond the UErsquos capability though the network negotiates a lower rate to accept the UErsquos PDP activation request the UE will launch the request of deactivating PDP when it finds that the rate negotiated by the network in PDP activation accept request is lower than the minimum guaranteed bit rate and finally the PDP activation can not be completed
4333 Admission Reject
For the non-HSDPA user if there are insufficient system resources (including power channel code lub transmission resource and CE) the call establishment failure will be caused by the admission reject At this time it is necessary to check the network load code resource lub transmission resource and CE resource occupation to make sure the congestion is caused by the limitation of a certain kind of resource What is more the engineer should plan the corresponding expansion method
If the cell does not support the HSDPA service the R99 user admission is judged according to the fixed R99 admission threshold If the cell supports the HSDPA service and the HSDPA and R99 dynamic power is allocated the uplink admission of non-HSDPA is judged based on RTWP or the equivalent user number If the uplink load is too heavy the non-HSDPA user admission will also fail
If the bandwidth configuration on the lub interface is insufficient the lub interface will reject the R99 data service activation because of limited bandwidth
ZTE Confidential Proprietary copy 2012 ZTE CORPORATION All rights reserved 30
UMTS KPI Optimization Analysis Guide Internal Use Only
The admission control of the NodeB Credit resource is similar to the power admission control Whether the remaining Credit can support the currently requested service or not can be judged according to the spectrum spreading factor of the new access user According to the condition of the RAB Downsizing Switch RNC will deal with the issue in the corresponding way
For the HSDPA user in the dynamic power allocation mode besides the mentioned system resources such as the power channel code lub transmission resource and CE the admission reject should take into consideration whether the number of H users supported by NodeB and the number of H users supported by the cell are over the regulated threshold or not into consideration
For the HSDPA user when the bandwidth configuration on lub interface is insufficient the admission reject will not happen but the rate will be reduced What is more the AAL2PATHs of HSDPA and R99 are configured respectively and the HSDPA AAL2PATH must be configured to the HSDPA_RT or HSDPA_NRT type If the HSDPA AAL2PATH is configured to RT or NRT of R99 AAL2PATH type the RAB assignment failure will not happen but RNC will establish the HSDPA service as R99 384 Kbps
For the downlink power admission
Besides whether the R99 service load is over the non-HSDPA service threshold DCH service should take into consideration whether non-HSDPA power and HSDPA GBP (the minimum power needed for the guaranteed bit rate) are over the general power threshold of the cell
For the HSDPA service it is necessary to check whether the throughput rate provided by the cell is over the sum of all the usersrsquo GBR thresholds or whether the GBPs of the stream service and the background service are over the HSDPA power of the cell At the same time whether the non-HSDPA power and the HSDPA GBP (the minimum power needed for the guaranteed bit rate) are over the overall power threshold of the cell should be also taken into consideration
For the lub admission
For the DCH service the admission is made according to the multiplication of the peak rate and the service activation factor
For HSDPA service the admission is made according to the GBR
If the lub exceeds the congestion threshold the DCCC rate reduction will be triggered And if the RLC_AM retransmission rate is over a certain threshold the Iub Overbooking switch can be opened to trigger the TF which limits R99 or to reduce the rate of HSDPA service by a certain factor
ZTE Confidential Proprietary copy 2012 ZTE CORPORATION All rights reserved 31
UMTS KPI Optimization Analysis Guide Internal Use Only
4334 RAB Setup Failure Because the UE Fails to Respond to RB Setup
The UE fails to respond to RB setup mainly because of the userrsquos operation
Take the following cases as examples
When the user already has had the downlink 12 K data service he receives RB Setup Request of the VP service (either the originated call in the VP domain or the terminated call in the VP domain) Because the UE does not support the VP and high-speed PS service in the downlink at the same time it directly replies with RB Setup Failure and the cause value is unsupported configuration
Compared with the WCDMA subscriber originating the VP service the terminating subscriber resides in the GSM network and so it does not support the VP service After RNC receives RAB Assignment Request the core network will deliver the Disconnect command right after call proceeding and the cause value is Bearer capability not authorized At this time the UE has just received the RB SETUP command and has no enough time to finish the RB setup So the UE will reply with RB Setup Failure after it receives the Disconnect command and the RNC will reply with RAB Setup Failure with the cause value being failure in radio interface procedure
4335 RAB Setup Failure Because the Uu Interface Fails to Set Up RB
RNC sends the Radio Bearer Setup command to the UE but fails to receive Radio Bearer Setup Compete This kind of situation (RB setup failure) often appears in the cells with weak signals There are two causes of weak signals one is that the UE does not reside in the best server to launch the access and the other is poor coverage
If the UE does not reside in the best server to launch the access it will hope to enter the best server through active set update in the RB setup process (At the same time the fast signal change will drastically weaken the signals in the cell) but the active set update can only be processed after the RB setup is completed because the procedures can not be processed alternately (Neither the network nor the terminal supports it) Therefore RB can only be set up in the cell with weak signals and the setup is easy to fail As for this situation the starting threshold and speed of co-frequency cell reselection should be increased to make the UE reside in the best server and launch the access as soon as possible
RB setup failure may be caused by the poor downlinkuplink coverage If the failure is caused by downlink coverage the UE can not receive the Radio Bearer Setup command which may be caused by the uplink interference and this can be fixed through checking RTWP The poor downlink coverage is partly caused by the bad UE demodulation performance and other causes should be solved by RF optimization
ZTE Confidential Proprietary copy 2012 ZTE CORPORATION All rights reserved 32
UMTS KPI Optimization Analysis Guide Internal Use Only
44 Optimization of Mobility Indicators
Mobility indicators mainly fall into three categories mdash soft handovers hard handovers and inter-RAT handovers The handover problems usually happen in the following cases
The best server changes too fast or there is no best server due to pilot pollution
The handover is not prompt or there are pingpong handovers due to improper parameter configuration
Adjust the engineering parameters for antennas in areas with severe pilot pollution And adjust the handover parameters such as the values of 1A 1B CIO TTT (time to trigger) Hysteresis and so on to solve the problem that the handover is not prompt or there are pingpong handovers This section tries to solve this kind of problems through OMC data analysis and parameter optimization
441 Optimization of Soft Handovers
Missed neighboring cell configuration pilot pollution improper soft handover parameter configuration and equipment malfunctions are the major causes of soft handover failures To confirm the problems the field DTs are required
ZTE Confidential Proprietary copy 2012 ZTE CORPORATION All rights reserved 33
UMTS KPI Optimization Analysis Guide Internal Use Only
4411 Soft Handover Optimization Flowchart
Figure 4-12 Soft handover optimization flowchart
ZTE Confidential Proprietary copy 2012 ZTE CORPORATION All rights reserved 34
UMTS KPI Optimization Analysis Guide Internal Use Only
Extract performance data
TOP Ncell filtering
Analyze a single cell
1 Check NE alarms
2 Associate emergencies
3 Compare parameter
configurations
4 Associate indicators
5 Locate the fault
comprehensive ly
Exist or not
Handle alarms
Solved or not
Yes
Yes
End
No
No
Exist or not
Handle emergencies
Solved or not
Yes
No
No
Exist or not
Correct wrong parameter
configurations
Solved or not
Yes
No
No
List related indicator counters
RTWPResource
limit indicators
Checkamp analysis of interference
Optimization analysis of
resource limitCounters related to intra-frequency
handover failures
C301391101 C301390593C301391102 C301390594C301391103 C301390595C301390586 C301390596C301390587 C301390597C301390588 C301390598C301390589 C301390599C301390590 C301390600C301390591 C301390601C301390592 C301390602
Solved or not
Yes
Yes
No
Drive Test+RNC signaling
trace
Yes
Counters related to soft handover
failures
30055 3005630057 3005830059 3006030061 30062
Cell hand-inhand-out indicators
ZTE Confidential Proprietary copy 2012 ZTE CORPORATION All rights reserved 35
UMTS KPI Optimization Analysis Guide Internal Use Only
4412 Checking Missed Neighboring Cell Configuration
Generally speaking most of the call drops at the beginning of the optimization are caused by missed neighboring cell configuration The following methods are often used to judge whether the call drops are caused by missed configuration of co-frequency neighboring cells
Observe the active set EcIo information recorded by the UE and the Best Server EcIo information recorded by the Scanner before the call drop If the former record is very bad but the latter record is very good then check whether the Best Server scrambling code recorded by the Scanner appears in the latest list of the neighboring cells under intra-frequency measurement control If it does not then the call drop is caused by missed neighboring cell configuration
If the UE re-accesses immediately after the call drop and the cell scrambling codes during the UE reaccess and those during the call drop are different then the call drop may also be caused by missed neighboring cell configuration You can confirm it through measurement control (look backwards from the message of the call drop event for the latest intra-frequency measurement control message and check the neighboring cell list of this message)
Some UE may report the Detected Set information If the corresponding scrambling code appears in the Detected Set information before the call drop then the call drop is caused by missed neighboring cell configuration
4413 Checking Pilot Pollution
Definition of pilot pollution Excessive strong pilot signals exist at a certain point but none of them is strong enough to be the best server To form pilot pollution the following points in this definition should be satisfied
Strong pilot signal The absolute pilot signal strength is used to judge whether the pilot signal is a strong one The pilot signal strength can be evaluated through the pilot RSCP If the pilot RSCP exceeds a threshold it is considered a strong pilot signal The formula is
AbsoluteRSCPThRSCPCPICH __ gt
Excessive The number of pilot signals is used to judge whether there are excessive pilot signals at a certain point If the number exceeds a threshold it is regarded that excessive pilot signals exist at this point The formula is
NThNumberCPICH gt_
None of them is strong enough to be the best server The relative strength of a pilot signal is a key factor in judging whether the pilot signal is strong enough Based on the above definition and formulae if the difference between the strength of the
ZTE Confidential Proprietary copy 2012 ZTE CORPORATION All rights reserved 36
UMTS KPI Optimization Analysis Guide Internal Use Only
strongest pilot signal and that of the )1( +NTh strongest pilot signal at this point is
less than a threshold it is regarded that there is no pilot signal strong enough to be the best server at this point The formula is
lativeRSCPthThbest ThRSCPCPICHRSCPCPICHN Re_)1( )__( ltminus +
According to the above description it is regarded that pilot pollution exists if the following conditions are both satisfied
The number of pilot signals that meet the condition
AbsoluteRSCPThRSCPCPICH __ gt is more than NTh
lativeRSCPthThbest ThRSCPCPICHRSCPCPICHN Re_)1( )__( ltminus +
For example during the network optimization suppose
dBmTh AbsoluteRSCP 95_ minus= 3=NTh and dBTh lativeRSCP 5Re_ = if the following
conditions are both satisfied then it is regarded that pilot pollution exists
The number of the pilot signals that meet the condition
dBmRSCPCPICH 95_ minusgt is more than 3
dBRSCPCPICHRSCPCPICH thbest 5)__( 4 ltminus
4414 Adjusting Soft Handover Algorithm Parameters
You can solve the following kinds of problems by adjusting handover algorithm parameters
1 The handover is not prompt
From the perspective of the CS service signaling flow the symptom of this problem is that the UE cannot receive Active Set Update (physical channel reallocation in the case of the intra-frequency hard handover) because after the UE reports the measurement report the source cell has a fast reduction in EcIo When the RNC sends Active Set Update the UE has closed the transmitter due to the loss of downlink synchronization Viewed from the UE side it cannot receive Active Set Update In the PS services if the UE cannot receive Active Set Update or TRB resets before the handover the handover will also fail
From the perspective of signals the following phenomena may accompany this problem
ZTE Confidential Proprietary copy 2012 ZTE CORPORATION All rights reserved 37
UMTS KPI Optimization Analysis Guide Internal Use Only
minus Corner effect EcIo of the source cell decreases drastically and EcIo of the target cell increases sharply (very high when it appears)
minus Fast fading EcIo of the source cell decreases quickly for a while and then increases and EcIo of the target cell increases for a short while
2 Pingpong handovers The following phenomena may accompany this problem
The best server changes quickly Two or more cells take turns to be the best server But as the best server none of the cells can last long though they has good RSCPs and EcIos
There is no best server There are multiple cells Their RSCPs are normal and similar to each other But EcIo of every cell is very bad
From the perspective of the signaling flow Event 1A is reported immediately after one cell is deleted Because the UE cannot receive Active Set Update from the RNC the handover fails
4415 Equipment Malfunctions
First check the alarm console to see whether there are abnormal alarms and analyze the message traces at the same time Find out in which step the soft handover fails Check the failure message and contact the local product maintaining engineer to confirm whether the equipment has malfunctions
4416 Solutions
Corresponding adjustments should be taken for the confirmed problems
Handover failures caused by pilot pollution Adjust the engineering parameters of a certain antenna to set this antenna as the best server in this interfered location If the power of one of its sectors is reduced then Io of the pilot pollution area will decrease even if the powers of other pilots are not adjusted EcIo will also increase Thereby the EcIo differences with other scrambling codes in the active set will become larger and pilot pollution will be eliminated Through a lot of research ZTE has proved that the reduction in the pilot transmit power will not change cell capacity greatly If condition allows new base stations can be added to cover this area
Equipment malfunctions Consult the customer service engineers and ask them to help check whether there are alarms and whether the transport layer is abnormal If there are alarms coordinate with the customer service engineers and the engineering personnel to solve the problems
Call drops because the handovers are not prompt
ZTE Confidential Proprietary copy 2012 ZTE CORPORATION All rights reserved 38
UMTS KPI Optimization Analysis Guide Internal Use Only
minus Adjust the antenna to expand the handover zone
minus Configure the Event 1A handover parameters to make the handover easier to happen
minus Increase CIO to make the handover happen earlier in the target cell The sum of CIO and the actually measured value is used for judging the UE events including the UE intra-frequency handover CIO helps shift the cell border in the handover algorithm If CIO is configured with a larger value the handover will be easier to happen and there will be more UE in the soft-handover status but more resources will be occupied If CIO is configured with a smaller value the soft handover will be more difficult to happen and the receiving quality may be impaired A CIO of about 5dB is quite good for eliminating the fast fading and the corner effect but this configuration has some side effects such as the increase of handover proportion
Call drops caused by pingpong handovers Adjust the antenna to form a best server in its coverage zone or set the Event 1B handover parameters (increase the threshold of Event 1B the Event 1B hysteresis or the time to trigger Event 1B) to increase the difficulty in deleting the active set
442 Optimization of Hard Handovers
4421 Classification of Hard handovers
Hard handovers mainly fall into two classifications
Intra-frequency hard handovers The intra-frequency hard handover is triggered only when the intra-frequency softsofter handover cannot be performed and it is applicable to the following circumstances
minus Inter-RNC intra-frequency cell handovers when there is no Iur interface
minus Insufficient Iur interface resources though there is the Iur interface
minus Handovers controlled by the threshold of the PS service rate in the handover cell
The intra-frequency softsofter handovers can not be performed (intra-frequency hard handover should be triggered) in the following scenarios
minus When the intra-frequency handover happens the UE is using the transmit diversity in the active set cell but the target cell does not support the transmit diversity
minus The intra-frequency measurement report does not contain OFF and TM of the
ZTE Confidential Proprietary copy 2012 ZTE CORPORATION All rights reserved 39
UMTS KPI Optimization Analysis Guide Internal Use Only
target cell
minus When the intra-frequency handover happens between RNCs the Iur interface is unavailable
minus The UE performs the multiuser detection in the active set cell but the target cell does not support the multiuser detection
minus The target cell and the original cell belong to different classifications (The cells of R99 R5+R99 and R6+R5+R99 belong to the same classification while the cells of R5 and R6+R5 belong to another classification)
Inter-frequency hard handovers The inter-frequency hard handover means a UE connection is handed over from a cell of a UTRAN frequency to a cell of another frequency Many factors including the radio quality the load and the speed of the moving UE may trigger inter-frequency hard handovers
For example the radio quality triggers the inter-frequency hard handover in the following way
When the quality of the UE radio frequency becomes lower the inter-frequency measurement will be triggered and according to the measurement result the UE connection will be handed over to a better frequency
ZTE Confidential Proprietary copy 2012 ZTE CORPORATION All rights reserved 40
UMTS KPI Optimization Analysis Guide Internal Use Only
4422 Hard Handover Optimization Flowchart
Figure 4-13 Hard handover optimization flowchart
ZTE Confidential Proprietary copy 2012 ZTE CORPORATION All rights reserved 41
UMTS KPI Optimization Analysis Guide Internal Use Only
Extract performance data
TOP Ncell filtering
Analyze a single cell
1 Check NE alarms
2 Associate emergencies
3 Compare parameter
configurations
4 Associate indicators
5 Locate the fault
comprehensive ly
Exist or not
Handle alarms
Solved or not
Yes
Yes
End
No
Exist or not
Handle emergencies
Solved or not
YesNo
Exist or not
Correct wrong parameter
configurations
Solved or not
Yes
No
No
List related indicator counters
RTWPResource
limit indicators
Checkamp analysis of interference
Optimization analysis of
resource limit
Counters related to inter-frequency handover failures
C301110489 C301110516C301110499 C301110517C301110500 C301110518C301110501 C301110519C301110502 C301110520C301110503 C301110521C301110504 C301110522C301110505 C301110523
Solved or not
Yes
Yes
No
Drive Test+RNC signaling
trace
Yes
Counters related to hard handover
failures
30041 3004230043 3004430045 3004630047 30048
Cell hand-inhand-out indicators
NoNo
ZTE Confidential Proprietary copy 2012 ZTE CORPORATION All rights reserved 42
UMTS KPI Optimization Analysis Guide Internal Use Only
4423 Hard Handover Optimization Methods
The optimization flow for the hard handover is similar to that of the soft handover The major differences are in the parameter optimization To optimize intra-frequency hard handovers you can properly reduce the Event 1D hysteresis and the time to trigger Event 1D according to the real radio environment to ensure timely handovers
Inter-frequency coverage is often applied to some special scenarios such as indoor coverage and tested through CQT The method of judging whether there is missed configuration of the inter-frequency neighboring cell is almost the same as that of the co-frequency neighboring cell when a call drop occurs the UE fails to measure or report the inter-frequency neighboring cell after the call drop the UE resides in the inter-frequency neighboring cell again
The common hard handover problems are
1 The handover is not prompt The common symptoms are frequent call drops in the hard handovers when the UE moves
Solutions
Increase the threshold of activating the compressing mode The compressing mode is usually activated before the inter-frequency handover or the inter-RAT handover and it is used to measure the quality of the inter-frequency or inter-RAT cell You can set a threshold of the CPICH RSCP or EcIo to activate the compressing mode And the RSCP is widely used
minus Requirements on setting the threshold of activating the compressing mode Before the cell quality becomes low enough to cause a call drop the signal of the target cell should be measured and reported and the handover should be performed
minus Requirement on setting the threshold of deactivating the compression mode Frequent activationdeactivation of the compression mode should be avoided
Increase CIOs of the inter-frequency cell pair
Reduce the threshold of triggering the target frequency handover under the inter-frequency coverage
2 There are pingpong handovers
Solution Increase the hard handover hysteresis and the time to trigger the event
ZTE Confidential Proprietary copy 2012 ZTE CORPORATION All rights reserved 43
UMTS KPI Optimization Analysis Guide Internal Use Only
443 Optimization of Inter-RAT Handovers
4431 Configuring Basic Inter-RAT Parameters
Most of the inter-RAT handover failures are caused by incomplete parameter configuration The following parameters need special attention
Complete RNC parameter configuration for the GSM neighboring cell The 2G system shall provide the 3G system with the correct radio parameters based on negotiation mdash MCC MNC LAC ID (CI) NCC BCC frequency band indicator (900 or 1800) and BCCH
Table 4-3 Parameters That 2G Shall Provide to 3G
MCC MNC LACIDCI
NCC BCCFrequency
band indicator
BCCH
460 2 202 193 0 0 900 102
Complete GSM BSC parameter configuration for the WCDMA neighboring cell The 3G system shall provide the 2G system with the correct radio parameters based on negotiation mdash MCC MNC LAC RNC ID cell ID (C_ID) downlink frequency scrambling code and RAC
Table 4-4 Parameters That 3G Shall Provide to 2G
MCC MNC LACRNC
IDCell IDC_ID
Downlink frequency
Scrambling code
RAC
460 3 20 18 51 10787 51 20
According to the current strategy of one-way inter-RAT handovers if the parameter configuration is complete one probable cause of the inter-RAT handover failure is that the handover is not prompt The common parameter adjustment is to increase CIO the threshold to activatedeactivate the compressing mode and the threshold to trigger the WCDMA-to-GSM handover at the same time
Call drops during the inter-RAT handovers between WCDMA and GSM may be caused by
minus Inconsistent data configuration at the GSM side and the WCDMA side after GSM modifies the configuration data but does not inform WCDMA
minus Missed configuration of neighboring cells which can be solved by the correct configuration of neighboring cells
minus Too fast signal changes
ZTE Confidential Proprietary copy 2012 ZTE CORPORATION All rights reserved 44
UMTS KPI Optimization Analysis Guide Internal Use Only
minus Pingpong reselection
minus Faults with the UE for example the UE fails to respond to the handover or report the inter-RAT measurement report
minus Changes of the best server during the physical channel reallocation
minus Wrong LAC configuration which can be located through data configuration check
ZTE Confidential Proprietary copy 2012 ZTE CORPORATION All rights reserved 45
UMTS KPI Optimization Analysis Guide Internal Use Only
4432 Inter-RAT Handover Optimization Flowchart
Figure 4-14 Inter-RAT handover optimization flowchart
ZTE Confidential Proprietary copy 2012 ZTE CORPORATION All rights reserved 46
UMTS KPI Optimization Analysis Guide Internal Use Only
Extract performance data
TOP Ncell filtering
Analyze a single cell
1 Check NE alarms
2 Associate emergencies
3 Compare parameter
configurations
4 Associate indicators
5 Locate the fault
comprehensive ly
Exist or not
Handle alarms
Solved or not
Yes
Yes
End
No
No
Exist or not
Handle emergencies
Solved or not
Yes
No
No
Exist or not
Correct wrong parameter
configurations
Solved or not
Yes
No
No
List related indicator counters
RTWPResource
limit indicators
Checkamp analysis of interference
Optimization analysis of
resource limitCounters related to inter-RAT handover failures
C301130667 C301130681C301130668 C301130682C301130669 C301130690C301130670 C301130691C301130671 C301130692C301130672 C301130693C301130673 C301130694C301130674 C301130696C301130675 C301130697C301130677 C301130698C301130678 C301130699C301130679 C301130700
C301130680
Solved or not
Yes
Yes
No
Drive Test+RNC signaling
trace
Yes
Counters related to inter-RAT handover
failures
Cell hand-inhand-out indicators
30049 3005030051 3005230053 30054
ZTE Confidential Proprietary copy 2012 ZTE CORPORATION All rights reserved 47
UMTS KPI Optimization Analysis Guide Internal Use Only
45 Optimization of Resource Indicators
The resource indicators directly reflect the system capacity Increasing subscribers will consume more system resources and some resources may be limited for example the code resource may be limited the TCP access request may be rejected and the CE resource usage rate may exceed the threshold Limited system resources have a negative influence on the whole-network indicators and the subscribersrsquo perception for example call drops may frequently happen and more TCP access requests may be rejected during the voice services
Table 4-5 Resource KPIs and Alarm Thresholds
Resource type KPI No and nameAlarm
threshold
TCP
C301320150 Number of rejected services DCH downlink TCP limit
50
PI30167 Average non-HS (SOA) (SOA)DPA TCP 40
PI30092 Maximum Cell TCP () 100
PI30093 Average Cell TCP 70
UL TrafficPI30029 Handover Blocking Rate 05
KPI RTWP (in busy hour) -98 dBm
Code
C301320153 Number of rejected services DCH no code
50
PI30205 Average Cell HSUPA Users 12
PI30172 Cell Average HSDPA Users 16
CE
PI301830006 Maximum use Ratio of Uplink NodeB CE
60
PI301830010 Maximum use Ratio of Downlink NodeB CE
60
ZTE Confidential Proprietary copy 2012 ZTE CORPORATION All rights reserved 48
UMTS KPI Optimization Analysis Guide Internal Use Only
451 Resource Indicator Optimization Flowchart
Figure 4-15 Resource indicator optimization flowchart
ZTE Confidential Proprietary copy 2012 ZTE CORPORATION All rights reserved 49
UMTS KPI Optimization Analysis Guide Internal Use Only
Extract performance data
TOP Ncell filtering
Analyze a single cell
1 Check NE alarms
2 Associate emergencies
3 Compare parameter
configurations
4 Associate indicators
5 Locate the fault
comprehensive ly
Exist or not
Handle alarms
Solved or not
Yes
是
End
No
No
Exist or not
Handle emergencies
Solved or not
Yes
No
No
Exist or not
Correct wrong parameter
configurations
Solved or not
Yes
No
No
List related indicator counters
Code resource indicators
CE resource indicators
TCPadmission
reject counter
C301320150
Solved or not
Yes
Yes
No
Drive Test+RNC signaling
trace
Yes
Counter related to TCP limit
Cell TX power
indicators
30090 3009130092 3009330166 3016730168 3016930170 30171
30163301643016530075
30223302243045030451
Yes
Yes
ZTE Confidential Proprietary copy 2012 ZTE CORPORATION All rights reserved 50
UMTS KPI Optimization Analysis Guide Internal Use Only
452 Code Resource Optimization
The statistics of Number of rejected services and DCH no code the average code resource usage rate and the number of the HSDPA subscribers can be used to judge whether the code resource in a cell is limited If the code resource is limited you can adjust the code resource allocation to alleviate the situation
Based on the system algorithm when Formula 1 is satisfied you can add an HS-PDSCH when Formula 2 is satisfied then an HS-PDSCH is deleted
Formula 1 OcuRateNoHspdsch + OcuRateHspdsch + DpchCodeHy + 32 lt= 512
Formula 2 OcuRateNoHspdsch + OcuRateHspdsch + CodeUptHyA gt 512
OcuRateHspdschHSPDSCH means the number of the codes of SF=512 blocked by the HS-PDSCH OcuRateNoHspdsch means the number of codes of SF=512 blocked by other channels DpchCodeHy means the number of codes of SF=512 reserved for the DPCH and CodeUptHyA is the threshold to decide whether to delete the HSPDSCH
Therefore to ensure the access of the R99 subscribers you can make some adjustment according to Table 4-6 when the code resource is limited though the HSDPA rate may decrease
Table 4-6 Adjusting Code Resource Allocation
AbbreviationParameter
nameRange
and stepCurrent value
Update value
Remark
DpchCodeHy DPCH Code Hysteresis
0512 16 28
To decrease the number of rejected services for DCH no code
CodeUptHyACode Update Hysteresis A
0512 16 28
To decrease the number of rejected services for DCH no code
453 Monitoring CE Resource
The CE resource is mainly monitored through the maximum UE uplinkdownlink usage rate If there is any problem you can solve it by controlling the load or adding more boards
ZTE Confidential Proprietary copy 2012 ZTE CORPORATION All rights reserved 51
UMTS KPI Optimization Analysis Guide Internal Use Only
454 Optimization of Power Control
4541 Monitoring and Optimizing Downlink Power Control
Limited TCP in busy hours will not only increase access failures and call drops in the local cell but also increase soft handover failures and call drops in the neighboring cells Number of rejected services and DCH downlink TCP limit are intuitive KPIs to judge whether TCP is limited Although limited uplink capacity and massive UE moves in the rush hours may also cause call drops the limited TCP is absolutely a key factor
Based on the system algorithm MinHsdpaPower (MinHspaPwrRto) + NoHsPower gtNode B if the safety threshold is used (MinHsdpaPower means the power reserved for HSPA) then it will activate the downlink rate downgrade algorithm flow for the congestion (lower the downlink DCH rate) Although the rate downgrade can ensure access of some subscribers it is an irregular action and will degrade the performance
455 Speeding up Rate Downgrade
Considering that the cells with heavy load reject more access requests you can speed up the rate downgrade during the resource congestion to release the resources as soon as possible and avoid call drops caused by access failures (this method is only applicable to the cells with many PS service users but not those with only CS service users) Table 4-7 is an example of the parameter modification for the rate downgrade
Table 4-7 Example of Parameter Modification for Rate Downgrade
Abbreviation Parameter nameRange and
stepCurrent value
Update value
Remark
UlDnMaxStg Maximum Number of Degraded Uplink Load Steps Every Time
[1 8] 1 2 Downgrade from 384 Kbps to 16 Kbps
DlDnMaxStg Maximum Number of Degraded Downlink Load Steps Every Time
[1 8] 1 3 Downgrade from 384 Kbps to 8 Kbps
456 Monitoring and Optimizing Uplink Capacity
Handover Blocking Rate and RTWP can reflect the uplink capacity of the cell Because interference may also increase RTWP this factor should be distinguished during the RTWP monitoring Another effective indicator is the voice service erl If a cell has over 20 erls in busy hours you should pay special attention to it
ZTE Confidential Proprietary copy 2012 ZTE CORPORATION All rights reserved 52
UMTS KPI Optimization Analysis Guide Internal Use Only
457 Optimization of Uplink Capacity at the Whole Network Level
Case The uplink capacity was limited in a large number of sites after the cutover and the symptoms are a sharp rise of RTWP and a high call drop rate during the rush hours
After the following parameters were modified as shown in Table 4-8 the problem was solved
Table 4-8 Example of Power Control Parameter Modification
AbbreviationParameter
nameRange
Current value
Update value
ULINITSIRUplink Initial SIR target (dB)
UL 34 K136 K signaling UL 122 K AMR
4-5 35
ULMAXSIRMaximum Uplink SIR target (dB)
UL 34 K136 K signaling UL 122 K AMR
15 10
UlSirTargDnStepUplink SIR Target Down Step Size (dB)
UL 34 K136 K signaling UL 122 K AMR
01 02
458 Optimization of Uplink Capacity for a Single Cell
A lot of optimization measures can be taken to bring down the rising RTWP However with increasing subscribers the capacity may still be limited in some area while further modification of SirTarget will obviously degrade the call quality of the whole network and undermine the subscribersrsquo perception In this case you can adjust the power control parameters for a single site that has heavy traffic in the following way add one set of DivPc parameters and use this set of parameters only for this site
Case Table 4-9 shows an example of the power control parameter modification After this modification the call drop rate in the site with heavy traffic decreased to one quarter of the original one
Table 4-9 Example of Power Control Parameter Modification for Heavy-Traffic Cell
SRVTYPE ULINITSIR ULMAXSIR ULMINSIR
0 35-gt15 100-gt35 20-gt10
104 40-gt20 150-gt50 05-gt0
28 35-gt15 100-gt35 05-gt0
50 60-gt20 150-gt50 20-gt0
54 60-gt20 150-gt50 20-gt0
ZTE Confidential Proprietary copy 2012 ZTE CORPORATION All rights reserved 53
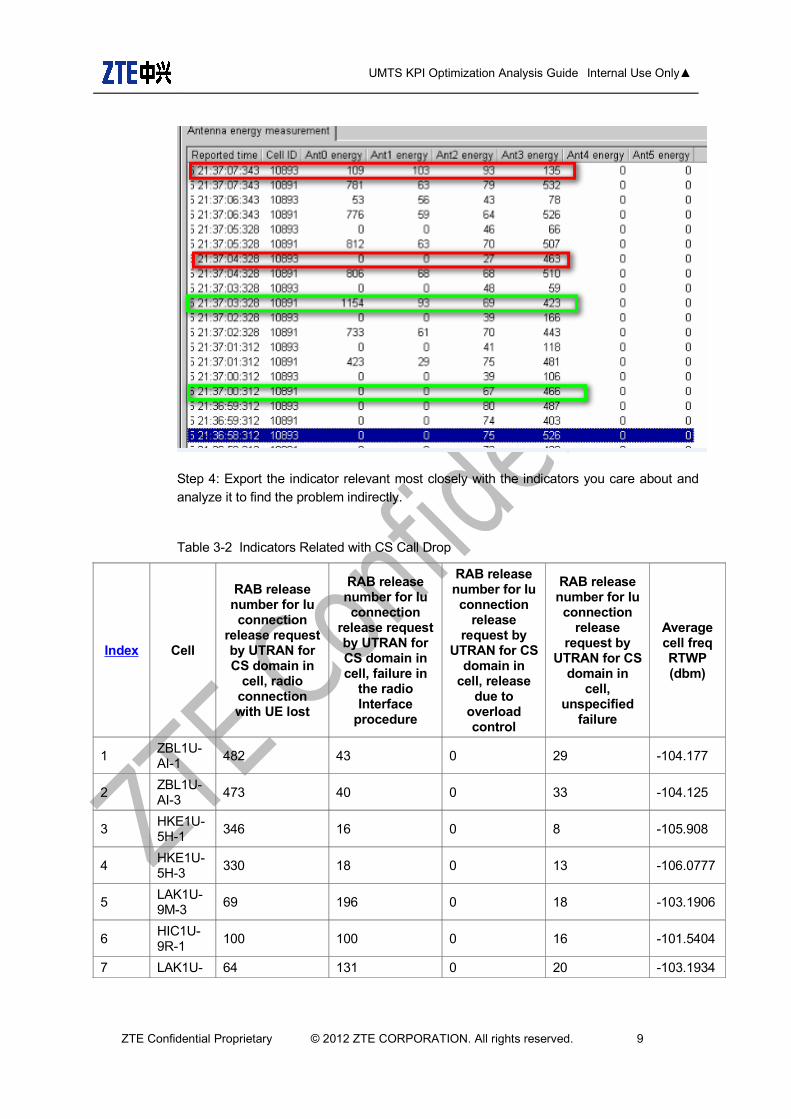
UMTS KPI Optimization Analysis Guide Internal Use Only
Step 4 Export the indicator relevant most closely with the indicators you care about and analyze it to find the problem indirectly
Table 3-2 Indicators Related with CS Call Drop
Index Cell
RAB release number for Iu connection
release request by UTRAN for CS domain in
cell radio connection with UE lost
RAB release number for Iu connection
release request by UTRAN for CS domain in cell failure in
the radio Interface
procedure
RAB release number for Iu connection
release request by
UTRAN for CS domain in
cell release due to
overload control
RAB release number for Iu connection
release request by
UTRAN for CS domain in
cell unspecified
failure
Average cell freq RTWP (dbm)
1ZBL1U-AI-1
482 43 0 29 -104177
2ZBL1U-AI-3
473 40 0 33 -104125
3HKE1U-5H-1
346 16 0 8 -105908
4HKE1U-5H-3
330 18 0 13 -1060777
5LAK1U-9M-3
69 196 0 18 -1031906
6HIC1U-9R-1
100 100 0 16 -1015404
7 LAK1U- 64 131 0 20 -1031934
ZTE Confidential Proprietary copy 2012 ZTE CORPORATION All rights reserved 9
UMTS KPI Optimization Analysis Guide Internal Use Only
Index Cell
RAB release number for Iu connection
release request by UTRAN for CS domain in
cell radio connection with UE lost
RAB release number for Iu connection
release request by UTRAN for CS domain in cell failure in
the radio Interface
procedure
RAB release number for Iu connection
release request by
UTRAN for CS domain in
cell release due to
overload control
RAB release number for Iu connection
release request by
UTRAN for CS domain in
cell unspecified
failure
Average cell freq RTWP (dbm)
9M-1
8EBP1U-9R-3
98 90 0 17 -101413
9SRS1U-5H-1
87 59 0 22 -1043528
10HRM1U-6R-1
42 111 0 13 -1027697
32 Basic KPI Analysis Skills
Be able to use the KPI statistics tool and the analysis tool
Use tools to learn about the running state of the whole network quickly and screen out TOP N worst cells quickly
Use different analysis tools to find problems from different aspects and locate the problem quickly
Understand the signaling process and basic principle
In the process of abnormity location keep a clear aim in mind and be able to apply the process and basic principle to check the other relevant indicators rapidly to facilitate the analysis
Be familiar with the process and basic principle and be able to make logical association between abnormal KPI problems and network problems (such as the coverage problem and the interference problem) Be able to determine the problem nature according to the abnormal KPI and then choose the appropriate tool to analyze the problem in depth
Performance analysis requires engineers to understand basic signaling process be familiar with the protocol stacks of standard interfaces and know relevant algorithms to realize the product functions Engineers should at least have a concept about the various algorithms If the analysis of a commercial network involves some algorithms engineers should study these algorithms in depth
ZTE Confidential Proprietary copy 2012 ZTE CORPORATION All rights reserved 10
UMTS KPI Optimization Analysis Guide Internal Use Only
321 KPI Monitoring Tools
minus Network management tool NetNumenT31 count KPI original data alarm data radio parameter configuration in cells and parameter configuration on the earth
minus KPI daily report generating tool classify key indicators according to a certain condition and screen out the worst cells
322 KPI Analysis Tools
minus CNO Tool CNO tool has the KPI analysis function So using it you can screen out the worst cells according to various conditions and point out the corresponding counter of an indicator
minus SignalTrace Trace the signaling (RNL signaling and RNL signaling) of RNC interfaces which includes the Iu interface the Iur interface the Iub interface and the Uu interface (the signaling flow between RNC and UE at RRC layer) And RNL signaling trace is a common way for locating the KPI problem Being able to trace the RNC signaling is a basic requirement for the on-site KPI optimization engineers and the network optimization and maintenance engineers This signaling tracing tool is very powerful which can trace signaling according to the UE cell and IMSI in the KPI analysis According to the UE cell it can trace the signaling of multiple subscribers while according to IMSI it can trace the signaling of only one subscriber However if the RRC connection is not established yet signaling cannot be traced That is because only when RRC connection has been established can the RNC obtain the subscriberrsquos IMSI from the CN
minus RNC ASS Log ASS log is usually applied when there is abnormity and RNC signaling is out of trace In this case use ASS log to analyze the signaling before and after the abnormity occurs Abnormity can be queried according to IMSI or cell ID ASS log can be also used to collect various abnormities
minus NodeB LMT NodeB local operation and maintenance tool Apart from all the operation functions of the OMCB this tool can collect more detailed information about cells and UE NodeB local maintenance terminals include EOMS EFMS DMS and PMS
minus NodeB Abnormity Probe On the site of WCDMA commercial office NodeB abnormity probe is an effective tool to monitor the running state of the NodeB Every module of NodeB can record the abnormal information automatically which makes it easy to locate problems However this method requires professional knowledge such as knowledge about the function and interface of each module or board If the on-site engineers cannot make the simple analysis they can just obtain the abnormity probe and send it to the RampD engineers at the rear side The abnormities reported on the NodeB will be stored at the OMCB server according to different RNCs To conduct NodeB
ZTE Confidential Proprietary copy 2012 ZTE CORPORATION All rights reserved 11
UMTS KPI Optimization Analysis Guide Internal Use Only
abnormity probe analysis you need to download abnormity probe files from different OMCB servers and then use the abnormity probe tool to make a comprehensive analysis
minus CTS Tool CTS is a tool developed by the CN department which can trace signaling in depth according to IMSI and trace signaling across RNCs So this is particularly suitable to trace VIP subscribers In this case CTS is easier to use than SignalTrace which can only trace signaling of RNCs one by one CTS can trace the interactive signaling between network elements (NEs) within the CN as well as the signaling of the Iu interface and the Uu interface This kind of signaling tracing is what we called in-depth tracing The work principle of CTS is to set up an IMSI task on the CTS server and send it to the CN front side which will then send this task to each CN module via the interfaces dedicated to the CN modules and the RNC and then each module after receiving the signaling related to the IMSI task will send the signaling back to the CTS server via the CN front side The interfaces mentioned above are private interfaces so this tool can only support our own CN and RNC CTS signaling can be checked and analyzed with an offline tool but the offline tool does not work very well because of the lack of continuous optimization and perfection
minus UE log DT test is also an important auxiliary way in analyzing KPI indicators There are many problems that cannot be located by tracing signaling at the network side and can only be located by the use of UE log The commonly used drive test software includes QXDMAPEX (QCAT) CNTCAN and TEMS CNTCAN and TEMS are often used for network optimization For the use of CNTCAN please refer to the corresponding help file and the instruction document publicly released by the Network Optimization Tool Department QXDM and the analysis tool APEX (QCAT) provided by Qualcomm is very powerful which have contributed a lot for the stability and maturity of our system for many years
33 General Process of KPI Optimization Analysis
Basic analyzing ideas
KPI optimization is a process to find and solve problems KPI optimization during the operation and maintenance stage is mainly to pick out the performance data that needs special attention from the OMC classify these performance data and then compare the value of these data with that required by the operator If the value of an indicator is lower than the operatorrsquos requirement analyze this indicator and find out the factor that affect the indicator and then propose a solution to the operator If the values are higher than the operatorrsquos requirement therersquos no need to pay special attention to them
KPI analysis is a process from the whole to the part
Step 1 Check the key indicators from the view of the whole network If there is not any
ZTE Confidential Proprietary copy 2012 ZTE CORPORATION All rights reserved 12
UMTS KPI Optimization Analysis Guide Internal Use Only
problem just ignore them Otherwise try to locate the RNC NE that has the problem
Step 2 Analyze the indicators of the corresponding RNC to find out the RNC whose indicators have the problem
Step 3 Analyze the indicators of the cell under the problem RNC to find out the worst cells or TOP N cells If the indicators of all the cells under the RNC are tend to be low it is a common problem probably caused by parameter configuration And then check whether the radio parameter configuration in the cells under this RNC is the same as that in the cells under the normal RNCs
Step 4 Make a comprehensive analysis on the KPIs alarms DT test data and customer complains of the worst cells to find out a solution
Analysis method
After learning the KPI analysis ideas we must know some common KPI analysis methods to rule out causes of problems from the obvious ones to the hidden ones
For example we found that the TCP code words were strictly limited at eight sites near a park and the call drop rate rose suddenly How to solve this problem
Method one First we checked whether the alarms transmission and boards of these sites were normal After they are proved all normal we sent some engineers to the site to do test And meanwhile we traced the RNC signaling at the OMC It turned out that the test result was normal and the indicators of these sites of that day did not have any problem and code words were not limited And later we knew from the news that there was a big gathering of about one million people at the park at that moment Until then we came to know that the congestion was caused by too many users using the network at the same time
Method two First because the eight sites went worse all of a sudden it was unlikely that the problem lied in the hardware Then we checked whether the radio parameters had been modified the day before The result is no worksheet had been issued to modify those parameters and no alarm was found at those sites Therefore we excluded the possibility of hardware problem Then we checked the traffic trend graph of the last few days (over seven days) and found that the high call drop rate might be caused by high traffic The graph showed that traffic of each site rose suddenly on the day before Thus we came to the conclusion that this was an abnormal abrupt event which may have been caused by a gathering And later we were told that there was a big gathering at the park So we were assured the code words limitation and high call drop rate at the eight sites were caused by too many subscribers using the network at the same time
By comparing the two methods above we can find that although the first one (sending engineers to the site without the consideration of abnormal events) is commonly used it is inefficient and costs more resource The second method (analyzing the problem by the means of exclusion and association) is more efficient From this case we would like to emphasize that KPI analysis is a process of problem exclusion Using the comprehensive
ZTE Confidential Proprietary copy 2012 ZTE CORPORATION All rights reserved 13
UMTS KPI Optimization Analysis Guide Internal Use Only
methods (like Method One) at the first brush may be making a detour
minus Exclusion method Check the alarms on the OMC to learn about the state of the RNC NodeB BPC board and the transmission If there are obvious broken link in transmission or hardware problem the cause of the problem is easy to locate
minus Incident association If the problem is with a great number of sites take abrupt incidents into account such as large-scale gathering terrible weather of incorrect operation These incidents will put influence of different levels and ranges on the network indicators
minus Comparison of radio parameters If some site goes wrong in a sudden check whether the radio parameter configuration of this site is consistent with that of other normal sites If not change it as that of the normal sites because the indicator decrease may be caused by an incorrect modification of radio parameters
minus Relevant indicators association If a certain indicator is in poor condition check its relevant indicators and find the common problem from these relevant indicators
minus Comprehensive problem location When the above reasons are excluded use DT data KPI data RNC signaling analysis data to locate the problem with indicators comprehensively
ZTE Confidential Proprietary copy 2012 ZTE CORPORATION All rights reserved 14
UMTS KPI Optimization Analysis Guide Internal Use Only
Figure 3-7 KPI optimization analysis process
StartPick out
performance indexes
RNC index abnormal
Equipment alarms exist
Deal with equipment alarms
RNC index recovers
Common problem with the
worst cells
Transmission softwarehardware version wireless
parameter configuration
CNRNC Transmission
Hardware Software Interference
Wireless parameters
Time range
Abrupt and self-curable abnormality
helliphellip
Analyze and record causes
Suggestion about improvement
Common problems analysis
Problem resolved
Successful call
Call drop Soft handover
23G alternate operation
PS rate helliphellip
Deal with the relevant problem
Indexes normal
End
Climate change holidays assembly
transmission interruption power
fault and so on
Y
N
Y
Y
N
Y
N
Abnormal indexes analysis in one cell
Y
N
N
N
Y
N
Y
Show TOPN abnormal cells
and their locations
If the problem is proved to be equipment bug or system problem after
several attempts feed it back to RampD dept
ZTE Confidential Proprietary copy 2012 ZTE CORPORATION All rights reserved 15
UMTS KPI Optimization Analysis Guide Internal Use Only
4 KPI Optimization Analysis This chapter mainly demonstrates how to analyze the indicator problems from the aspect of OMC data and provides flowcharts for KPI optimization The detailed analyzing method and cases of every special subject can be checked in the optimization guides of all the subjects
41 CS Call Drop Optimization
The CS call drop rate is the most important indicator in KPI optimization
411 Definition of Call Drop
After checking the signaling on the Uu interface at the UE side the engineer can judge the situation a call drop if the Uu interface message satisfies one of the following three conditions during the calling process (in connection)
RNC Release is not received but the UE condition changes from CELL_DCH to IDLE
RRC Release is received and the released cause value is Not Normal
One of the following three messages mdash CC Disconnect CC Release Complete and CC Release mdash is received and the released cause value is Not Normal Clearing or Not Normal Unspecified
In a board sense the call drop includes the call drop rates of CN and UTRAN The call drop of UTRAN includes the following two aspects
After the successful service establishment RNC sends the RAB Release Request to CN
After the successful service establishment RNC sends the IU Release Request to CN Later RNC receives the IU Release Command from CN
Note that RAN call drop statistics which is defined from the aspect of lu interface signaling means the launching times of RAB Release Request and lu Release Request of RNC And the DT call drop statistics is defined from the aspects of the Uu interface message non-access stratum message and cause value RAN call drop statistics and DT call drop statistics are not exactly the same
ZTE Confidential Proprietary copy 2012 ZTE CORPORATION All rights reserved 16
UMTS KPI Optimization Analysis Guide Internal Use Only
412 CS Call Drop Analysis Flowchart
Figure 4-8 CS call drop analysis flowchart
ZTE Confidential Proprietary copy 2012 ZTE CORPORATION All rights reserved 17
UMTS KPI Optimization Analysis Guide Internal Use Only
Extract performance data
CS TOP Ncell filtering
Analyze a single cell
1 Check NE alarms
2 Associate emergencies
3 Compare parameter
configurations
4 Associate indicators
5 Locate the fault
comprehensively
Exist or not
Handle alarms
Solved or not
Yes
Yes
End
No
No
Exist or not
Handle emergencies
Solved or not
Yes
No
No
Exist or not
Correct wrong parameter
configurations
Solved or not
Yes
No
No
List related indicator counters
Call-drop-related
countersRTWP
Handover success rate
Traffic volume
Resource limit indicators
Checkamp analysis of
interference
Optimizationanalysis of
handover failures
Optimization analysis of
resource limitCall-drop-
related counters
C301230362C301230363C301230365C301230315C301230316C301230318C301230319C301230322C301230323
Solved or not
Yes
Yes
No
Drive Test+RNC signaling
trace
Yes
ZTE Confidential Proprietary copy 2012 ZTE CORPORATION All rights reserved 18
UMTS KPI Optimization Analysis Guide Internal Use Only
42 PS Call Drop Optimization
421 Optimization Flowchart
Figure 4-9 PS call drop optimization flowchart
ZTE Confidential Proprietary copy 2012 ZTE CORPORATION All rights reserved 19
UMTS KPI Optimization Analysis Guide Internal Use Only
Extract performance data
PS TOP Ncell filtering
Analyze a single cell
1 Check NE alarms
2 Associate emergencies
3 Compare parameter
configurations
4 Associate indicators
5 Locate the fault
comprehensive ly
Exist or not
Handle alarms
Solved or not
Yes
Yes
End
No
No
Exist or not
Handle emergencies
Solved or not
Yes
No
No
Exist or not
Correct wrong parameter
configurations
Solved or not
Yes
No
No
List related indicator counters
Call -drop-related
countersRTWP
Handover success rate
Traffic volume
Resource limit indicators
Check amp analysis of interference
Optimizationanalysis of
handover failures
Optimization analysis of
resource limitCall -drop-
related counters
C301230372C301230373C301230375C301230330C301230332C301230333C301230334C301230337C301230338
Solved or not
Yes
Yes
No
Drive Test +RNC signaling
trace
Yes
ZTE Confidential Proprietary copy 2012 ZTE CORPORATION All rights reserved 20
UMTS KPI Optimization Analysis Guide Internal Use Only
43 Optimization of Accessibility Indicators
Accessibility performance includes the success rate of RRC connection setup and the success rate of CSPS RAB assignment These two kinds of KPIs play important roles in the network optimization and directly influence the success rate of CSPS service establishment In this document this kind of problems are found from the aspect of OMC data and solved through parameter optimization
431 Definition of Access Failure
For the mobile originated call in the CS domain the access failure event means that the UE sends RRC REQUEST and IE establish cause is Originating Conversational Call but alerting of the direct transfer message is not received
The relevant events are defined as follows in the access failure stage
RRC connection setup failure After considering the resending times and the waiting time the UE sends RRC CONNECTION REQUEST and does not receive the response from RNC or RRC CONNECTION REJECT delivered by RNC
Initial direct transfer and security mode establishment failure After sending RRC CONNECTION SETUP COMPLETE the UE does not send NAS SETUP
RAB assignment failure After receiving CALL PROCEEDING the UE does not receive RB SETUP delivered by RNC Or the UE replies with RB SETUP FAIL after receiving RB SETUP Or the UE receives DISCONNECT with the cause value not being Normal Release after receiving RB SETUP At this time the UE has not reported RB SETUP CMP
Failure after RAB assignment After the UE sends RB SETUP COMPLETE the originating UE receives DISCONNECTRELEASE from CN Or the UE waits CONNECT or ALERTING overtime and launches the Call Clearing process Or the UE becomes IDLE before receiving Alerting and starts to receive the system message
For the mobile terminated in the CS domain the access failure event means that the terminating UE receives the paging of paging type 1 and does not send RRC CONNECTION REQUEST with the cause value being Terminating Conversational Call Or the UE does not send the alerting of direct transfer message to CN after sending RRC CONNECTION REQUEST
The relevant events are defined as follows in the access failure stage
RRC connection setup failure After sending RRC CONNECTION REQUEST the UE does not receive the response from RNC or RRC CONNECTION REJECT delivered by RNC
Initial direct transfer and security mode establishment failure After sending RRC
ZTE Confidential Proprietary copy 2012 ZTE CORPORATION All rights reserved 21
UMTS KPI Optimization Analysis Guide Internal Use Only
CONNECTION SETUP COMPLETE the UE does not receive the SETUP direct transfer message Or the UE sends RELEASE COMPLETE Or the UE receives DISCONNECT from CN
RAB assignment failure The UE does not receive RB SETUP delivered by RNC after sending CALL CONFIRM Or the UE replies with RB SETUP FAIL after receiving RB SETUP Or the UE receives DISCONNECT with the cause value not being Normal Release after receiving RB SETUP At this time the UE has not reported RB SETUP CMP
Failure after RAB assignment After the UE sends RB SETUP COMPLETE the terminating UE receives DISCONNECTRELEASE from CN
432 Analysis on RRC Connection Failures
The problem of RRC connection setup failure can be analyzed through the UE signaling flow and RNC single-user tracing The RRC connection setup includes the following steps
The UE sends RRC Connection Request through the RACH channel
RNC sends RRC Connection Setup through the FACH channel
The UE sends RRC Connection Setup Complete through the dedicated uplink channel after the downlink dedicated channel is established and synchronized
RRC connection setup failures are always caused by following issues
Uplink RACH problem
Problem about downlink FACH power allocation proportion
Parameter reselection problem of the cell
Low downlink dedicated initial transmitting power
Uplink initial power control problem
Congestion
Equipment malfunctions
Among these issues the problems of uplink RACH downlink FACH power allocation proportion parameter reselection of the cell and equipment malfunctions appear more frequently
ZTE Confidential Proprietary copy 2012 ZTE CORPORATION All rights reserved 22
UMTS KPI Optimization Analysis Guide Internal Use Only
4321 Analysis Flowchart of RRC Connection Setup Failures
Figure 4-10 Analysis flowchart of RRC connection setup failures
ZTE Confidential Proprietary copy 2012 ZTE CORPORATION All rights reserved 23
UMTS KPI Optimization Analysis Guide Internal Use Only
Extract performance data
TOP Ncell filtering
Analyze a single cell
1 Check NE alarms
2 Associate emergencies
3 Compare parameter
configurations
4 Associate indicators
5 Locate the fault
comprehensive ly
Exist or not
Handle alarms
Solved or not
Yes
Yes
End
No
No
Exist or not
Handle emergencies
Solved or not
Yes
No
No
Exist or not
Correct wrong parameter
configurations
Solved or not
Yes
No
No
List related indicator counters
Counters related to RRC setup
failuresRTWP
Resource limit
indicators
Checkamp analysis of interference
Optimization analysis of
resource limitCounters related
to RRC setup failures
C301480485C301480486C301480487C301480489C301480490C301480491C301481288C301481289C301481337C301481338C301481339C301481407C301481408
Solved or not
Yes
Yes
No
Drive Test+RNC signaling
trace
Yes
ZTE Confidential Proprietary copy 2012 ZTE CORPORATION All rights reserved 24
UMTS KPI Optimization Analysis Guide Internal Use Only
4322 UE sends RRC Connection Request but RNC does not receive it
If the EcIo of downlink CPICH is relatively low it is the problem of coverage
If the EcIo of downlink CPICH is not very low (for example the value is larger than -14 dB) Usually it is the problem of RACH and the following issues may cause the problem
minus The power of Preamble does not rise to a required value and the rising times of Preamble should be increased
minus The output power of UE is lower than the required value which is caused by poor UE performance In this case the UE should be changed
minus The NodeB equipment has a standing wave and the engineer should check whether NodeB has any SWR alarm
minus The radius of the cell is set improperly If the radius parameter of the cell is set too small the NodeB can not synchronize the UE beyond the range of the radius and the access fails This problem often happens in the places with large coverage such as the rural areas and the suburbs
4323 RNC delivers RRC Connection Reject after receiving RRC Setup Request
When RRC Connection Reject appears the engineer should check the specific reject cause value Usually there are two kinds of causes
The CPU load of RNC control plane board is too heavy and more boards should be added
DCH and FACH admission is rejected However this situation does not always happen
4324 UE does not receive RRC Connection Setup delivered by RNC
This problem may be caused by the following reasons
Poor coverage
Improper parameters of cell selection and reselection
Checking method The engineer should check the EcIo of CPICH If the value is lower than -12 dB (EcIo is -12 dB by default) and there is no cell of better quality in the monitor set the cause of this problem is poor coverage If there is better cell in the monitor set cell reselection may cause this problem
Poor coverage can be improved by coverage enhancement such as adding some sites to cover the places without signal coverage and adjusting the engineering parameters If the coverage can not be improved the engineer can enhance the FACH power according to
ZTE Confidential Proprietary copy 2012 ZTE CORPORATION All rights reserved 25
UMTS KPI Optimization Analysis Guide Internal Use Only
the PCPICH EcIo coverage of the current network For example if all the pilot EcIo values are larger than -12 dB in the coverage area the power proportion of the common channel should be configured on the basis of the situation that the EcIo value is larger than -12 dB And so the success rate of the idle UE assessment can be ensured
As for the access problem caused by cell selection and reselection the engineer can speed up the cell selection and reselection by adjusting the cell selection and reselection parameters and the problem of RRC connection setup failure caused by improper cell selection and reselection parameters can be solved
Note
The RRC Connection Setup message is borne by FACH RRC Connection Request sent by the UE is received by UTRAN at the preamble of PRACH and then it is sent from the RACH channel based on the current preamble power And the transmit power of preamble can rise all the time until the response is received (There is a limitation for the maximum number of preamble retransmissions) Therefore in the areas with poor coverage the RACH coverage and FACH coverage may become unbalanced and as a result UTRAN can receive RRC Connection Request sent by the UE but the UE can not receive RRC Connection Setup sent by RNC
4325 UE receives RRC Connection Setup and does not send RRC Setup Complete
If the downlink signal quality is normal this problem may be caused by the abnormal condition of the cell phone
Another reason of this problem may be the downlink synchronization failure caused by the low initial power of downlink dedicated channel You can solve this problem by adjusting the service downlink EbNo
4326 RNC does not receive RRC Setup Complete sent by UE
Because the uplink initial power control may increase the UE transmit power this kind of problem seldom appears If it appears the engineer can increase the Constant Value of the dedicated channel properly to raise the uplink DPCCH initial transmission power of the UE
At the same time this problem is also relevant with the uplink SIR initial target value configuration because this value may affect the uplink initial synchronization at the initial stage of link setup If the value of the parameter is set too large there will be too much uplink inference brought by the initial setup of the link If the value is set too small the uplink synchronization will take longer time and the initial synchronization may even fail This parameter is an RNC-level parameter which has a great influence on network performance Therefore the engineer should be cautious while adjusting this parameter
ZTE Confidential Proprietary copy 2012 ZTE CORPORATION All rights reserved 26
UMTS KPI Optimization Analysis Guide Internal Use Only
Note
RRC Connection Setup Complete is sent through uplink DPCH and the UE calculates the initial power of uplink DPCCH according to the received IErdquoDPCCH_Power_offsetrdquo and the measured CPICH_RSCP value
DPCCH_Initial_power = DPCCH_Power_offset - CPICH_RSCP
DPCCH_Power_offset = Primary CPICH DL TX Power + UL Interference + Constant Value The Constant Value can be configured in the OMC If this value is set too small the UE may not have enough power to send RRC Connection Setup Complete
433 Analysis on RABRB Setup Failures
When RAB or RB setup fails RNC will send RAB Assignment Fail in the RAB Assignment Response signaling The engineer can find out the specific failure reason from the failure cause value carried in relevant cells The reasons for common RABRB setup failures include
RNC directly rejecting RAB Setup Request because of wrong parameter configuration
Admission reject
RAB setup failure because the UE fails to respond to RB Setup Request
RAB setup failure because the Uu interface fails to set up RB
ZTE Confidential Proprietary copy 2012 ZTE CORPORATION All rights reserved 27
UMTS KPI Optimization Analysis Guide Internal Use Only
4331 Analysis Flowchart of RAB Setup Failures
Figure 4-11 Analysis flowchart of RAB setup failures
ZTE Confidential Proprietary copy 2012 ZTE CORPORATION All rights reserved 28
UMTS KPI Optimization Analysis Guide Internal Use Only
Extract performance data
TOP Ncell filtering
Analyze a single cell
1 Check NE alarms
2 Associate emergencies
3 Compare parameter
configurations
4 Associate indicators
5 Locate the fault
comprehensively
Exist or not
Handle alarms
Solved or not
Yes
Yes
End
No
No
Exist or not
Handle emergencies
Solved or not
Yes
No
No
Exist or not
Correct wrong parameter
configurations
Solved or not
Yes
No
No
List related indicator counters
Counters related to RAB setup failures RTWP
Resource limit
indicators
Checkamp analysis of interference
Optimization analysis of
resource limitCounters related to RAB setup failures
CS domain PS domainC301230290 C301230302C301230291 C301230303C301230292 C301230304C301230293 C301230305C301230294 C301230306C301230295 C301230307C301230296 C301230308C301230297 C301230309C301230298 C301230310C301230299 C301230311C301230300 C301230312C301230301 C301230313
Solved or not
Yes
Yes
No
Drive Test+RNC signaling
trace
Yes
ZTE Confidential Proprietary copy 2012 ZTE CORPORATION All rights reserved 29
UMTS KPI Optimization Analysis Guide Internal Use Only
4332 RNC Directly Rejecting RAB Setup Request Because Of Wrong Parameter Configuration
The case that RNC responds with RAB Setup Failure directly is seldom caused by invalid parameter configuration in the business network Usually this case is caused by special operations of the special users
The main scenario is that the subscription information of the userrsquos PS service is beyond the capability of the UE which leads to the direct refusal from RNC For example a special userrsquos subscription rates of uplink and downlink are 384 K but the maximum uplink rate of the UE is only 64 K The maximum uplink and downlink rates of the QoS message used for activating PDP set by the AT command or mobile terminal software used by the user are 384 K so the RNC will find the maximum uplink rate is beyond the UErsquos capability directly reply with RAB Setup Failure and will not launch the RB setup process when it receives RAB Assignment Request
After the RAB setup fails because the parameter configuration is beyond the UErsquos capability SGSN will negotiate again to launch the new RAB assignment until the UE has the capability to support the assignment and the RAB assignment is finished For the users the PDP activation is still successful and the actual maximum rate is the maximum rate the UE can support
However if the minimum guaranteed bit rate required by the QoS setting in the UErsquos PDP activation request is beyond the UErsquos capability though the network negotiates a lower rate to accept the UErsquos PDP activation request the UE will launch the request of deactivating PDP when it finds that the rate negotiated by the network in PDP activation accept request is lower than the minimum guaranteed bit rate and finally the PDP activation can not be completed
4333 Admission Reject
For the non-HSDPA user if there are insufficient system resources (including power channel code lub transmission resource and CE) the call establishment failure will be caused by the admission reject At this time it is necessary to check the network load code resource lub transmission resource and CE resource occupation to make sure the congestion is caused by the limitation of a certain kind of resource What is more the engineer should plan the corresponding expansion method
If the cell does not support the HSDPA service the R99 user admission is judged according to the fixed R99 admission threshold If the cell supports the HSDPA service and the HSDPA and R99 dynamic power is allocated the uplink admission of non-HSDPA is judged based on RTWP or the equivalent user number If the uplink load is too heavy the non-HSDPA user admission will also fail
If the bandwidth configuration on the lub interface is insufficient the lub interface will reject the R99 data service activation because of limited bandwidth
ZTE Confidential Proprietary copy 2012 ZTE CORPORATION All rights reserved 30
UMTS KPI Optimization Analysis Guide Internal Use Only
The admission control of the NodeB Credit resource is similar to the power admission control Whether the remaining Credit can support the currently requested service or not can be judged according to the spectrum spreading factor of the new access user According to the condition of the RAB Downsizing Switch RNC will deal with the issue in the corresponding way
For the HSDPA user in the dynamic power allocation mode besides the mentioned system resources such as the power channel code lub transmission resource and CE the admission reject should take into consideration whether the number of H users supported by NodeB and the number of H users supported by the cell are over the regulated threshold or not into consideration
For the HSDPA user when the bandwidth configuration on lub interface is insufficient the admission reject will not happen but the rate will be reduced What is more the AAL2PATHs of HSDPA and R99 are configured respectively and the HSDPA AAL2PATH must be configured to the HSDPA_RT or HSDPA_NRT type If the HSDPA AAL2PATH is configured to RT or NRT of R99 AAL2PATH type the RAB assignment failure will not happen but RNC will establish the HSDPA service as R99 384 Kbps
For the downlink power admission
Besides whether the R99 service load is over the non-HSDPA service threshold DCH service should take into consideration whether non-HSDPA power and HSDPA GBP (the minimum power needed for the guaranteed bit rate) are over the general power threshold of the cell
For the HSDPA service it is necessary to check whether the throughput rate provided by the cell is over the sum of all the usersrsquo GBR thresholds or whether the GBPs of the stream service and the background service are over the HSDPA power of the cell At the same time whether the non-HSDPA power and the HSDPA GBP (the minimum power needed for the guaranteed bit rate) are over the overall power threshold of the cell should be also taken into consideration
For the lub admission
For the DCH service the admission is made according to the multiplication of the peak rate and the service activation factor
For HSDPA service the admission is made according to the GBR
If the lub exceeds the congestion threshold the DCCC rate reduction will be triggered And if the RLC_AM retransmission rate is over a certain threshold the Iub Overbooking switch can be opened to trigger the TF which limits R99 or to reduce the rate of HSDPA service by a certain factor
ZTE Confidential Proprietary copy 2012 ZTE CORPORATION All rights reserved 31
UMTS KPI Optimization Analysis Guide Internal Use Only
4334 RAB Setup Failure Because the UE Fails to Respond to RB Setup
The UE fails to respond to RB setup mainly because of the userrsquos operation
Take the following cases as examples
When the user already has had the downlink 12 K data service he receives RB Setup Request of the VP service (either the originated call in the VP domain or the terminated call in the VP domain) Because the UE does not support the VP and high-speed PS service in the downlink at the same time it directly replies with RB Setup Failure and the cause value is unsupported configuration
Compared with the WCDMA subscriber originating the VP service the terminating subscriber resides in the GSM network and so it does not support the VP service After RNC receives RAB Assignment Request the core network will deliver the Disconnect command right after call proceeding and the cause value is Bearer capability not authorized At this time the UE has just received the RB SETUP command and has no enough time to finish the RB setup So the UE will reply with RB Setup Failure after it receives the Disconnect command and the RNC will reply with RAB Setup Failure with the cause value being failure in radio interface procedure
4335 RAB Setup Failure Because the Uu Interface Fails to Set Up RB
RNC sends the Radio Bearer Setup command to the UE but fails to receive Radio Bearer Setup Compete This kind of situation (RB setup failure) often appears in the cells with weak signals There are two causes of weak signals one is that the UE does not reside in the best server to launch the access and the other is poor coverage
If the UE does not reside in the best server to launch the access it will hope to enter the best server through active set update in the RB setup process (At the same time the fast signal change will drastically weaken the signals in the cell) but the active set update can only be processed after the RB setup is completed because the procedures can not be processed alternately (Neither the network nor the terminal supports it) Therefore RB can only be set up in the cell with weak signals and the setup is easy to fail As for this situation the starting threshold and speed of co-frequency cell reselection should be increased to make the UE reside in the best server and launch the access as soon as possible
RB setup failure may be caused by the poor downlinkuplink coverage If the failure is caused by downlink coverage the UE can not receive the Radio Bearer Setup command which may be caused by the uplink interference and this can be fixed through checking RTWP The poor downlink coverage is partly caused by the bad UE demodulation performance and other causes should be solved by RF optimization
ZTE Confidential Proprietary copy 2012 ZTE CORPORATION All rights reserved 32
UMTS KPI Optimization Analysis Guide Internal Use Only
44 Optimization of Mobility Indicators
Mobility indicators mainly fall into three categories mdash soft handovers hard handovers and inter-RAT handovers The handover problems usually happen in the following cases
The best server changes too fast or there is no best server due to pilot pollution
The handover is not prompt or there are pingpong handovers due to improper parameter configuration
Adjust the engineering parameters for antennas in areas with severe pilot pollution And adjust the handover parameters such as the values of 1A 1B CIO TTT (time to trigger) Hysteresis and so on to solve the problem that the handover is not prompt or there are pingpong handovers This section tries to solve this kind of problems through OMC data analysis and parameter optimization
441 Optimization of Soft Handovers
Missed neighboring cell configuration pilot pollution improper soft handover parameter configuration and equipment malfunctions are the major causes of soft handover failures To confirm the problems the field DTs are required
ZTE Confidential Proprietary copy 2012 ZTE CORPORATION All rights reserved 33
UMTS KPI Optimization Analysis Guide Internal Use Only
4411 Soft Handover Optimization Flowchart
Figure 4-12 Soft handover optimization flowchart
ZTE Confidential Proprietary copy 2012 ZTE CORPORATION All rights reserved 34
UMTS KPI Optimization Analysis Guide Internal Use Only
Extract performance data
TOP Ncell filtering
Analyze a single cell
1 Check NE alarms
2 Associate emergencies
3 Compare parameter
configurations
4 Associate indicators
5 Locate the fault
comprehensive ly
Exist or not
Handle alarms
Solved or not
Yes
Yes
End
No
No
Exist or not
Handle emergencies
Solved or not
Yes
No
No
Exist or not
Correct wrong parameter
configurations
Solved or not
Yes
No
No
List related indicator counters
RTWPResource
limit indicators
Checkamp analysis of interference
Optimization analysis of
resource limitCounters related to intra-frequency
handover failures
C301391101 C301390593C301391102 C301390594C301391103 C301390595C301390586 C301390596C301390587 C301390597C301390588 C301390598C301390589 C301390599C301390590 C301390600C301390591 C301390601C301390592 C301390602
Solved or not
Yes
Yes
No
Drive Test+RNC signaling
trace
Yes
Counters related to soft handover
failures
30055 3005630057 3005830059 3006030061 30062
Cell hand-inhand-out indicators
ZTE Confidential Proprietary copy 2012 ZTE CORPORATION All rights reserved 35
UMTS KPI Optimization Analysis Guide Internal Use Only
4412 Checking Missed Neighboring Cell Configuration
Generally speaking most of the call drops at the beginning of the optimization are caused by missed neighboring cell configuration The following methods are often used to judge whether the call drops are caused by missed configuration of co-frequency neighboring cells
Observe the active set EcIo information recorded by the UE and the Best Server EcIo information recorded by the Scanner before the call drop If the former record is very bad but the latter record is very good then check whether the Best Server scrambling code recorded by the Scanner appears in the latest list of the neighboring cells under intra-frequency measurement control If it does not then the call drop is caused by missed neighboring cell configuration
If the UE re-accesses immediately after the call drop and the cell scrambling codes during the UE reaccess and those during the call drop are different then the call drop may also be caused by missed neighboring cell configuration You can confirm it through measurement control (look backwards from the message of the call drop event for the latest intra-frequency measurement control message and check the neighboring cell list of this message)
Some UE may report the Detected Set information If the corresponding scrambling code appears in the Detected Set information before the call drop then the call drop is caused by missed neighboring cell configuration
4413 Checking Pilot Pollution
Definition of pilot pollution Excessive strong pilot signals exist at a certain point but none of them is strong enough to be the best server To form pilot pollution the following points in this definition should be satisfied
Strong pilot signal The absolute pilot signal strength is used to judge whether the pilot signal is a strong one The pilot signal strength can be evaluated through the pilot RSCP If the pilot RSCP exceeds a threshold it is considered a strong pilot signal The formula is
AbsoluteRSCPThRSCPCPICH __ gt
Excessive The number of pilot signals is used to judge whether there are excessive pilot signals at a certain point If the number exceeds a threshold it is regarded that excessive pilot signals exist at this point The formula is
NThNumberCPICH gt_
None of them is strong enough to be the best server The relative strength of a pilot signal is a key factor in judging whether the pilot signal is strong enough Based on the above definition and formulae if the difference between the strength of the
ZTE Confidential Proprietary copy 2012 ZTE CORPORATION All rights reserved 36
UMTS KPI Optimization Analysis Guide Internal Use Only
strongest pilot signal and that of the )1( +NTh strongest pilot signal at this point is
less than a threshold it is regarded that there is no pilot signal strong enough to be the best server at this point The formula is
lativeRSCPthThbest ThRSCPCPICHRSCPCPICHN Re_)1( )__( ltminus +
According to the above description it is regarded that pilot pollution exists if the following conditions are both satisfied
The number of pilot signals that meet the condition
AbsoluteRSCPThRSCPCPICH __ gt is more than NTh
lativeRSCPthThbest ThRSCPCPICHRSCPCPICHN Re_)1( )__( ltminus +
For example during the network optimization suppose
dBmTh AbsoluteRSCP 95_ minus= 3=NTh and dBTh lativeRSCP 5Re_ = if the following
conditions are both satisfied then it is regarded that pilot pollution exists
The number of the pilot signals that meet the condition
dBmRSCPCPICH 95_ minusgt is more than 3
dBRSCPCPICHRSCPCPICH thbest 5)__( 4 ltminus
4414 Adjusting Soft Handover Algorithm Parameters
You can solve the following kinds of problems by adjusting handover algorithm parameters
1 The handover is not prompt
From the perspective of the CS service signaling flow the symptom of this problem is that the UE cannot receive Active Set Update (physical channel reallocation in the case of the intra-frequency hard handover) because after the UE reports the measurement report the source cell has a fast reduction in EcIo When the RNC sends Active Set Update the UE has closed the transmitter due to the loss of downlink synchronization Viewed from the UE side it cannot receive Active Set Update In the PS services if the UE cannot receive Active Set Update or TRB resets before the handover the handover will also fail
From the perspective of signals the following phenomena may accompany this problem
ZTE Confidential Proprietary copy 2012 ZTE CORPORATION All rights reserved 37
UMTS KPI Optimization Analysis Guide Internal Use Only
minus Corner effect EcIo of the source cell decreases drastically and EcIo of the target cell increases sharply (very high when it appears)
minus Fast fading EcIo of the source cell decreases quickly for a while and then increases and EcIo of the target cell increases for a short while
2 Pingpong handovers The following phenomena may accompany this problem
The best server changes quickly Two or more cells take turns to be the best server But as the best server none of the cells can last long though they has good RSCPs and EcIos
There is no best server There are multiple cells Their RSCPs are normal and similar to each other But EcIo of every cell is very bad
From the perspective of the signaling flow Event 1A is reported immediately after one cell is deleted Because the UE cannot receive Active Set Update from the RNC the handover fails
4415 Equipment Malfunctions
First check the alarm console to see whether there are abnormal alarms and analyze the message traces at the same time Find out in which step the soft handover fails Check the failure message and contact the local product maintaining engineer to confirm whether the equipment has malfunctions
4416 Solutions
Corresponding adjustments should be taken for the confirmed problems
Handover failures caused by pilot pollution Adjust the engineering parameters of a certain antenna to set this antenna as the best server in this interfered location If the power of one of its sectors is reduced then Io of the pilot pollution area will decrease even if the powers of other pilots are not adjusted EcIo will also increase Thereby the EcIo differences with other scrambling codes in the active set will become larger and pilot pollution will be eliminated Through a lot of research ZTE has proved that the reduction in the pilot transmit power will not change cell capacity greatly If condition allows new base stations can be added to cover this area
Equipment malfunctions Consult the customer service engineers and ask them to help check whether there are alarms and whether the transport layer is abnormal If there are alarms coordinate with the customer service engineers and the engineering personnel to solve the problems
Call drops because the handovers are not prompt
ZTE Confidential Proprietary copy 2012 ZTE CORPORATION All rights reserved 38
UMTS KPI Optimization Analysis Guide Internal Use Only
minus Adjust the antenna to expand the handover zone
minus Configure the Event 1A handover parameters to make the handover easier to happen
minus Increase CIO to make the handover happen earlier in the target cell The sum of CIO and the actually measured value is used for judging the UE events including the UE intra-frequency handover CIO helps shift the cell border in the handover algorithm If CIO is configured with a larger value the handover will be easier to happen and there will be more UE in the soft-handover status but more resources will be occupied If CIO is configured with a smaller value the soft handover will be more difficult to happen and the receiving quality may be impaired A CIO of about 5dB is quite good for eliminating the fast fading and the corner effect but this configuration has some side effects such as the increase of handover proportion
Call drops caused by pingpong handovers Adjust the antenna to form a best server in its coverage zone or set the Event 1B handover parameters (increase the threshold of Event 1B the Event 1B hysteresis or the time to trigger Event 1B) to increase the difficulty in deleting the active set
442 Optimization of Hard Handovers
4421 Classification of Hard handovers
Hard handovers mainly fall into two classifications
Intra-frequency hard handovers The intra-frequency hard handover is triggered only when the intra-frequency softsofter handover cannot be performed and it is applicable to the following circumstances
minus Inter-RNC intra-frequency cell handovers when there is no Iur interface
minus Insufficient Iur interface resources though there is the Iur interface
minus Handovers controlled by the threshold of the PS service rate in the handover cell
The intra-frequency softsofter handovers can not be performed (intra-frequency hard handover should be triggered) in the following scenarios
minus When the intra-frequency handover happens the UE is using the transmit diversity in the active set cell but the target cell does not support the transmit diversity
minus The intra-frequency measurement report does not contain OFF and TM of the
ZTE Confidential Proprietary copy 2012 ZTE CORPORATION All rights reserved 39
UMTS KPI Optimization Analysis Guide Internal Use Only
target cell
minus When the intra-frequency handover happens between RNCs the Iur interface is unavailable
minus The UE performs the multiuser detection in the active set cell but the target cell does not support the multiuser detection
minus The target cell and the original cell belong to different classifications (The cells of R99 R5+R99 and R6+R5+R99 belong to the same classification while the cells of R5 and R6+R5 belong to another classification)
Inter-frequency hard handovers The inter-frequency hard handover means a UE connection is handed over from a cell of a UTRAN frequency to a cell of another frequency Many factors including the radio quality the load and the speed of the moving UE may trigger inter-frequency hard handovers
For example the radio quality triggers the inter-frequency hard handover in the following way
When the quality of the UE radio frequency becomes lower the inter-frequency measurement will be triggered and according to the measurement result the UE connection will be handed over to a better frequency
ZTE Confidential Proprietary copy 2012 ZTE CORPORATION All rights reserved 40
UMTS KPI Optimization Analysis Guide Internal Use Only
4422 Hard Handover Optimization Flowchart
Figure 4-13 Hard handover optimization flowchart
ZTE Confidential Proprietary copy 2012 ZTE CORPORATION All rights reserved 41
UMTS KPI Optimization Analysis Guide Internal Use Only
Extract performance data
TOP Ncell filtering
Analyze a single cell
1 Check NE alarms
2 Associate emergencies
3 Compare parameter
configurations
4 Associate indicators
5 Locate the fault
comprehensive ly
Exist or not
Handle alarms
Solved or not
Yes
Yes
End
No
Exist or not
Handle emergencies
Solved or not
YesNo
Exist or not
Correct wrong parameter
configurations
Solved or not
Yes
No
No
List related indicator counters
RTWPResource
limit indicators
Checkamp analysis of interference
Optimization analysis of
resource limit
Counters related to inter-frequency handover failures
C301110489 C301110516C301110499 C301110517C301110500 C301110518C301110501 C301110519C301110502 C301110520C301110503 C301110521C301110504 C301110522C301110505 C301110523
Solved or not
Yes
Yes
No
Drive Test+RNC signaling
trace
Yes
Counters related to hard handover
failures
30041 3004230043 3004430045 3004630047 30048
Cell hand-inhand-out indicators
NoNo
ZTE Confidential Proprietary copy 2012 ZTE CORPORATION All rights reserved 42
UMTS KPI Optimization Analysis Guide Internal Use Only
4423 Hard Handover Optimization Methods
The optimization flow for the hard handover is similar to that of the soft handover The major differences are in the parameter optimization To optimize intra-frequency hard handovers you can properly reduce the Event 1D hysteresis and the time to trigger Event 1D according to the real radio environment to ensure timely handovers
Inter-frequency coverage is often applied to some special scenarios such as indoor coverage and tested through CQT The method of judging whether there is missed configuration of the inter-frequency neighboring cell is almost the same as that of the co-frequency neighboring cell when a call drop occurs the UE fails to measure or report the inter-frequency neighboring cell after the call drop the UE resides in the inter-frequency neighboring cell again
The common hard handover problems are
1 The handover is not prompt The common symptoms are frequent call drops in the hard handovers when the UE moves
Solutions
Increase the threshold of activating the compressing mode The compressing mode is usually activated before the inter-frequency handover or the inter-RAT handover and it is used to measure the quality of the inter-frequency or inter-RAT cell You can set a threshold of the CPICH RSCP or EcIo to activate the compressing mode And the RSCP is widely used
minus Requirements on setting the threshold of activating the compressing mode Before the cell quality becomes low enough to cause a call drop the signal of the target cell should be measured and reported and the handover should be performed
minus Requirement on setting the threshold of deactivating the compression mode Frequent activationdeactivation of the compression mode should be avoided
Increase CIOs of the inter-frequency cell pair
Reduce the threshold of triggering the target frequency handover under the inter-frequency coverage
2 There are pingpong handovers
Solution Increase the hard handover hysteresis and the time to trigger the event
ZTE Confidential Proprietary copy 2012 ZTE CORPORATION All rights reserved 43
UMTS KPI Optimization Analysis Guide Internal Use Only
443 Optimization of Inter-RAT Handovers
4431 Configuring Basic Inter-RAT Parameters
Most of the inter-RAT handover failures are caused by incomplete parameter configuration The following parameters need special attention
Complete RNC parameter configuration for the GSM neighboring cell The 2G system shall provide the 3G system with the correct radio parameters based on negotiation mdash MCC MNC LAC ID (CI) NCC BCC frequency band indicator (900 or 1800) and BCCH
Table 4-3 Parameters That 2G Shall Provide to 3G
MCC MNC LACIDCI
NCC BCCFrequency
band indicator
BCCH
460 2 202 193 0 0 900 102
Complete GSM BSC parameter configuration for the WCDMA neighboring cell The 3G system shall provide the 2G system with the correct radio parameters based on negotiation mdash MCC MNC LAC RNC ID cell ID (C_ID) downlink frequency scrambling code and RAC
Table 4-4 Parameters That 3G Shall Provide to 2G
MCC MNC LACRNC
IDCell IDC_ID
Downlink frequency
Scrambling code
RAC
460 3 20 18 51 10787 51 20
According to the current strategy of one-way inter-RAT handovers if the parameter configuration is complete one probable cause of the inter-RAT handover failure is that the handover is not prompt The common parameter adjustment is to increase CIO the threshold to activatedeactivate the compressing mode and the threshold to trigger the WCDMA-to-GSM handover at the same time
Call drops during the inter-RAT handovers between WCDMA and GSM may be caused by
minus Inconsistent data configuration at the GSM side and the WCDMA side after GSM modifies the configuration data but does not inform WCDMA
minus Missed configuration of neighboring cells which can be solved by the correct configuration of neighboring cells
minus Too fast signal changes
ZTE Confidential Proprietary copy 2012 ZTE CORPORATION All rights reserved 44
UMTS KPI Optimization Analysis Guide Internal Use Only
minus Pingpong reselection
minus Faults with the UE for example the UE fails to respond to the handover or report the inter-RAT measurement report
minus Changes of the best server during the physical channel reallocation
minus Wrong LAC configuration which can be located through data configuration check
ZTE Confidential Proprietary copy 2012 ZTE CORPORATION All rights reserved 45
UMTS KPI Optimization Analysis Guide Internal Use Only
4432 Inter-RAT Handover Optimization Flowchart
Figure 4-14 Inter-RAT handover optimization flowchart
ZTE Confidential Proprietary copy 2012 ZTE CORPORATION All rights reserved 46
UMTS KPI Optimization Analysis Guide Internal Use Only
Extract performance data
TOP Ncell filtering
Analyze a single cell
1 Check NE alarms
2 Associate emergencies
3 Compare parameter
configurations
4 Associate indicators
5 Locate the fault
comprehensive ly
Exist or not
Handle alarms
Solved or not
Yes
Yes
End
No
No
Exist or not
Handle emergencies
Solved or not
Yes
No
No
Exist or not
Correct wrong parameter
configurations
Solved or not
Yes
No
No
List related indicator counters
RTWPResource
limit indicators
Checkamp analysis of interference
Optimization analysis of
resource limitCounters related to inter-RAT handover failures
C301130667 C301130681C301130668 C301130682C301130669 C301130690C301130670 C301130691C301130671 C301130692C301130672 C301130693C301130673 C301130694C301130674 C301130696C301130675 C301130697C301130677 C301130698C301130678 C301130699C301130679 C301130700
C301130680
Solved or not
Yes
Yes
No
Drive Test+RNC signaling
trace
Yes
Counters related to inter-RAT handover
failures
Cell hand-inhand-out indicators
30049 3005030051 3005230053 30054
ZTE Confidential Proprietary copy 2012 ZTE CORPORATION All rights reserved 47
UMTS KPI Optimization Analysis Guide Internal Use Only
45 Optimization of Resource Indicators
The resource indicators directly reflect the system capacity Increasing subscribers will consume more system resources and some resources may be limited for example the code resource may be limited the TCP access request may be rejected and the CE resource usage rate may exceed the threshold Limited system resources have a negative influence on the whole-network indicators and the subscribersrsquo perception for example call drops may frequently happen and more TCP access requests may be rejected during the voice services
Table 4-5 Resource KPIs and Alarm Thresholds
Resource type KPI No and nameAlarm
threshold
TCP
C301320150 Number of rejected services DCH downlink TCP limit
50
PI30167 Average non-HS (SOA) (SOA)DPA TCP 40
PI30092 Maximum Cell TCP () 100
PI30093 Average Cell TCP 70
UL TrafficPI30029 Handover Blocking Rate 05
KPI RTWP (in busy hour) -98 dBm
Code
C301320153 Number of rejected services DCH no code
50
PI30205 Average Cell HSUPA Users 12
PI30172 Cell Average HSDPA Users 16
CE
PI301830006 Maximum use Ratio of Uplink NodeB CE
60
PI301830010 Maximum use Ratio of Downlink NodeB CE
60
ZTE Confidential Proprietary copy 2012 ZTE CORPORATION All rights reserved 48
UMTS KPI Optimization Analysis Guide Internal Use Only
451 Resource Indicator Optimization Flowchart
Figure 4-15 Resource indicator optimization flowchart
ZTE Confidential Proprietary copy 2012 ZTE CORPORATION All rights reserved 49
UMTS KPI Optimization Analysis Guide Internal Use Only
Extract performance data
TOP Ncell filtering
Analyze a single cell
1 Check NE alarms
2 Associate emergencies
3 Compare parameter
configurations
4 Associate indicators
5 Locate the fault
comprehensive ly
Exist or not
Handle alarms
Solved or not
Yes
是
End
No
No
Exist or not
Handle emergencies
Solved or not
Yes
No
No
Exist or not
Correct wrong parameter
configurations
Solved or not
Yes
No
No
List related indicator counters
Code resource indicators
CE resource indicators
TCPadmission
reject counter
C301320150
Solved or not
Yes
Yes
No
Drive Test+RNC signaling
trace
Yes
Counter related to TCP limit
Cell TX power
indicators
30090 3009130092 3009330166 3016730168 3016930170 30171
30163301643016530075
30223302243045030451
Yes
Yes
ZTE Confidential Proprietary copy 2012 ZTE CORPORATION All rights reserved 50
UMTS KPI Optimization Analysis Guide Internal Use Only
452 Code Resource Optimization
The statistics of Number of rejected services and DCH no code the average code resource usage rate and the number of the HSDPA subscribers can be used to judge whether the code resource in a cell is limited If the code resource is limited you can adjust the code resource allocation to alleviate the situation
Based on the system algorithm when Formula 1 is satisfied you can add an HS-PDSCH when Formula 2 is satisfied then an HS-PDSCH is deleted
Formula 1 OcuRateNoHspdsch + OcuRateHspdsch + DpchCodeHy + 32 lt= 512
Formula 2 OcuRateNoHspdsch + OcuRateHspdsch + CodeUptHyA gt 512
OcuRateHspdschHSPDSCH means the number of the codes of SF=512 blocked by the HS-PDSCH OcuRateNoHspdsch means the number of codes of SF=512 blocked by other channels DpchCodeHy means the number of codes of SF=512 reserved for the DPCH and CodeUptHyA is the threshold to decide whether to delete the HSPDSCH
Therefore to ensure the access of the R99 subscribers you can make some adjustment according to Table 4-6 when the code resource is limited though the HSDPA rate may decrease
Table 4-6 Adjusting Code Resource Allocation
AbbreviationParameter
nameRange
and stepCurrent value
Update value
Remark
DpchCodeHy DPCH Code Hysteresis
0512 16 28
To decrease the number of rejected services for DCH no code
CodeUptHyACode Update Hysteresis A
0512 16 28
To decrease the number of rejected services for DCH no code
453 Monitoring CE Resource
The CE resource is mainly monitored through the maximum UE uplinkdownlink usage rate If there is any problem you can solve it by controlling the load or adding more boards
ZTE Confidential Proprietary copy 2012 ZTE CORPORATION All rights reserved 51
UMTS KPI Optimization Analysis Guide Internal Use Only
454 Optimization of Power Control
4541 Monitoring and Optimizing Downlink Power Control
Limited TCP in busy hours will not only increase access failures and call drops in the local cell but also increase soft handover failures and call drops in the neighboring cells Number of rejected services and DCH downlink TCP limit are intuitive KPIs to judge whether TCP is limited Although limited uplink capacity and massive UE moves in the rush hours may also cause call drops the limited TCP is absolutely a key factor
Based on the system algorithm MinHsdpaPower (MinHspaPwrRto) + NoHsPower gtNode B if the safety threshold is used (MinHsdpaPower means the power reserved for HSPA) then it will activate the downlink rate downgrade algorithm flow for the congestion (lower the downlink DCH rate) Although the rate downgrade can ensure access of some subscribers it is an irregular action and will degrade the performance
455 Speeding up Rate Downgrade
Considering that the cells with heavy load reject more access requests you can speed up the rate downgrade during the resource congestion to release the resources as soon as possible and avoid call drops caused by access failures (this method is only applicable to the cells with many PS service users but not those with only CS service users) Table 4-7 is an example of the parameter modification for the rate downgrade
Table 4-7 Example of Parameter Modification for Rate Downgrade
Abbreviation Parameter nameRange and
stepCurrent value
Update value
Remark
UlDnMaxStg Maximum Number of Degraded Uplink Load Steps Every Time
[1 8] 1 2 Downgrade from 384 Kbps to 16 Kbps
DlDnMaxStg Maximum Number of Degraded Downlink Load Steps Every Time
[1 8] 1 3 Downgrade from 384 Kbps to 8 Kbps
456 Monitoring and Optimizing Uplink Capacity
Handover Blocking Rate and RTWP can reflect the uplink capacity of the cell Because interference may also increase RTWP this factor should be distinguished during the RTWP monitoring Another effective indicator is the voice service erl If a cell has over 20 erls in busy hours you should pay special attention to it
ZTE Confidential Proprietary copy 2012 ZTE CORPORATION All rights reserved 52
UMTS KPI Optimization Analysis Guide Internal Use Only
457 Optimization of Uplink Capacity at the Whole Network Level
Case The uplink capacity was limited in a large number of sites after the cutover and the symptoms are a sharp rise of RTWP and a high call drop rate during the rush hours
After the following parameters were modified as shown in Table 4-8 the problem was solved
Table 4-8 Example of Power Control Parameter Modification
AbbreviationParameter
nameRange
Current value
Update value
ULINITSIRUplink Initial SIR target (dB)
UL 34 K136 K signaling UL 122 K AMR
4-5 35
ULMAXSIRMaximum Uplink SIR target (dB)
UL 34 K136 K signaling UL 122 K AMR
15 10
UlSirTargDnStepUplink SIR Target Down Step Size (dB)
UL 34 K136 K signaling UL 122 K AMR
01 02
458 Optimization of Uplink Capacity for a Single Cell
A lot of optimization measures can be taken to bring down the rising RTWP However with increasing subscribers the capacity may still be limited in some area while further modification of SirTarget will obviously degrade the call quality of the whole network and undermine the subscribersrsquo perception In this case you can adjust the power control parameters for a single site that has heavy traffic in the following way add one set of DivPc parameters and use this set of parameters only for this site
Case Table 4-9 shows an example of the power control parameter modification After this modification the call drop rate in the site with heavy traffic decreased to one quarter of the original one
Table 4-9 Example of Power Control Parameter Modification for Heavy-Traffic Cell
SRVTYPE ULINITSIR ULMAXSIR ULMINSIR
0 35-gt15 100-gt35 20-gt10
104 40-gt20 150-gt50 05-gt0
28 35-gt15 100-gt35 05-gt0
50 60-gt20 150-gt50 20-gt0
54 60-gt20 150-gt50 20-gt0
ZTE Confidential Proprietary copy 2012 ZTE CORPORATION All rights reserved 53
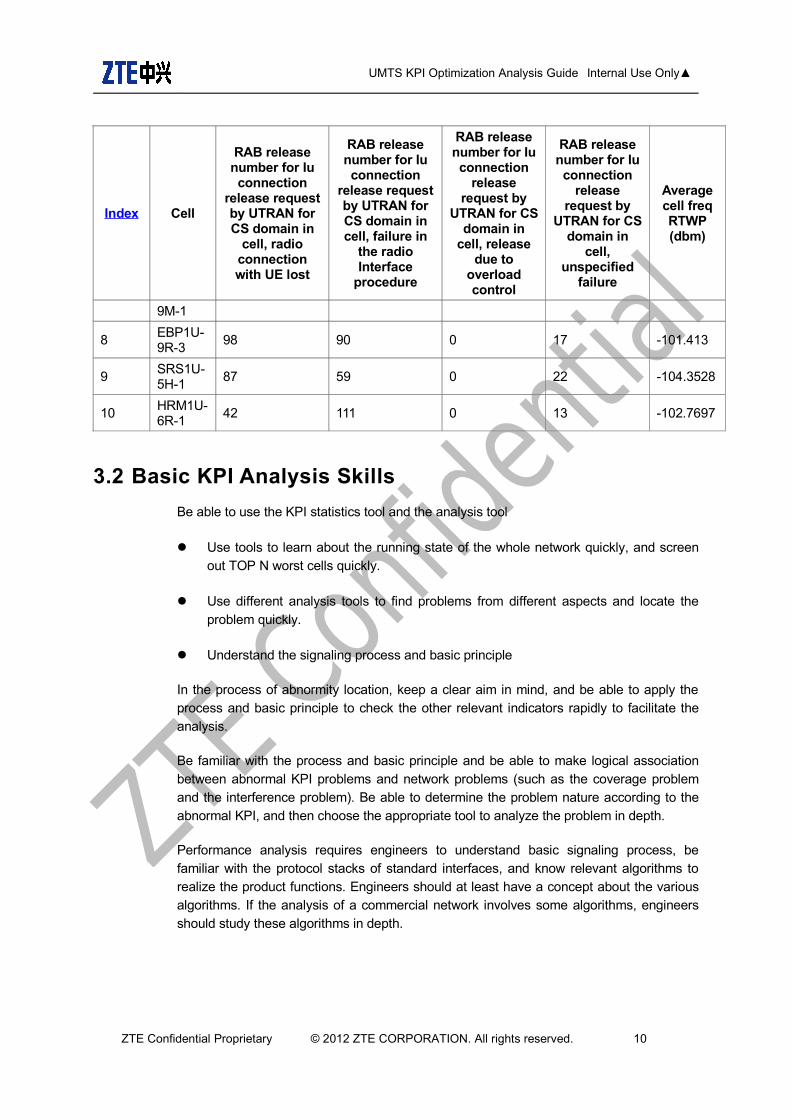
UMTS KPI Optimization Analysis Guide Internal Use Only
Index Cell
RAB release number for Iu connection
release request by UTRAN for CS domain in
cell radio connection with UE lost
RAB release number for Iu connection
release request by UTRAN for CS domain in cell failure in
the radio Interface
procedure
RAB release number for Iu connection
release request by
UTRAN for CS domain in
cell release due to
overload control
RAB release number for Iu connection
release request by
UTRAN for CS domain in
cell unspecified
failure
Average cell freq RTWP (dbm)
9M-1
8EBP1U-9R-3
98 90 0 17 -101413
9SRS1U-5H-1
87 59 0 22 -1043528
10HRM1U-6R-1
42 111 0 13 -1027697
32 Basic KPI Analysis Skills
Be able to use the KPI statistics tool and the analysis tool
Use tools to learn about the running state of the whole network quickly and screen out TOP N worst cells quickly
Use different analysis tools to find problems from different aspects and locate the problem quickly
Understand the signaling process and basic principle
In the process of abnormity location keep a clear aim in mind and be able to apply the process and basic principle to check the other relevant indicators rapidly to facilitate the analysis
Be familiar with the process and basic principle and be able to make logical association between abnormal KPI problems and network problems (such as the coverage problem and the interference problem) Be able to determine the problem nature according to the abnormal KPI and then choose the appropriate tool to analyze the problem in depth
Performance analysis requires engineers to understand basic signaling process be familiar with the protocol stacks of standard interfaces and know relevant algorithms to realize the product functions Engineers should at least have a concept about the various algorithms If the analysis of a commercial network involves some algorithms engineers should study these algorithms in depth
ZTE Confidential Proprietary copy 2012 ZTE CORPORATION All rights reserved 10
UMTS KPI Optimization Analysis Guide Internal Use Only
321 KPI Monitoring Tools
minus Network management tool NetNumenT31 count KPI original data alarm data radio parameter configuration in cells and parameter configuration on the earth
minus KPI daily report generating tool classify key indicators according to a certain condition and screen out the worst cells
322 KPI Analysis Tools
minus CNO Tool CNO tool has the KPI analysis function So using it you can screen out the worst cells according to various conditions and point out the corresponding counter of an indicator
minus SignalTrace Trace the signaling (RNL signaling and RNL signaling) of RNC interfaces which includes the Iu interface the Iur interface the Iub interface and the Uu interface (the signaling flow between RNC and UE at RRC layer) And RNL signaling trace is a common way for locating the KPI problem Being able to trace the RNC signaling is a basic requirement for the on-site KPI optimization engineers and the network optimization and maintenance engineers This signaling tracing tool is very powerful which can trace signaling according to the UE cell and IMSI in the KPI analysis According to the UE cell it can trace the signaling of multiple subscribers while according to IMSI it can trace the signaling of only one subscriber However if the RRC connection is not established yet signaling cannot be traced That is because only when RRC connection has been established can the RNC obtain the subscriberrsquos IMSI from the CN
minus RNC ASS Log ASS log is usually applied when there is abnormity and RNC signaling is out of trace In this case use ASS log to analyze the signaling before and after the abnormity occurs Abnormity can be queried according to IMSI or cell ID ASS log can be also used to collect various abnormities
minus NodeB LMT NodeB local operation and maintenance tool Apart from all the operation functions of the OMCB this tool can collect more detailed information about cells and UE NodeB local maintenance terminals include EOMS EFMS DMS and PMS
minus NodeB Abnormity Probe On the site of WCDMA commercial office NodeB abnormity probe is an effective tool to monitor the running state of the NodeB Every module of NodeB can record the abnormal information automatically which makes it easy to locate problems However this method requires professional knowledge such as knowledge about the function and interface of each module or board If the on-site engineers cannot make the simple analysis they can just obtain the abnormity probe and send it to the RampD engineers at the rear side The abnormities reported on the NodeB will be stored at the OMCB server according to different RNCs To conduct NodeB
ZTE Confidential Proprietary copy 2012 ZTE CORPORATION All rights reserved 11
UMTS KPI Optimization Analysis Guide Internal Use Only
abnormity probe analysis you need to download abnormity probe files from different OMCB servers and then use the abnormity probe tool to make a comprehensive analysis
minus CTS Tool CTS is a tool developed by the CN department which can trace signaling in depth according to IMSI and trace signaling across RNCs So this is particularly suitable to trace VIP subscribers In this case CTS is easier to use than SignalTrace which can only trace signaling of RNCs one by one CTS can trace the interactive signaling between network elements (NEs) within the CN as well as the signaling of the Iu interface and the Uu interface This kind of signaling tracing is what we called in-depth tracing The work principle of CTS is to set up an IMSI task on the CTS server and send it to the CN front side which will then send this task to each CN module via the interfaces dedicated to the CN modules and the RNC and then each module after receiving the signaling related to the IMSI task will send the signaling back to the CTS server via the CN front side The interfaces mentioned above are private interfaces so this tool can only support our own CN and RNC CTS signaling can be checked and analyzed with an offline tool but the offline tool does not work very well because of the lack of continuous optimization and perfection
minus UE log DT test is also an important auxiliary way in analyzing KPI indicators There are many problems that cannot be located by tracing signaling at the network side and can only be located by the use of UE log The commonly used drive test software includes QXDMAPEX (QCAT) CNTCAN and TEMS CNTCAN and TEMS are often used for network optimization For the use of CNTCAN please refer to the corresponding help file and the instruction document publicly released by the Network Optimization Tool Department QXDM and the analysis tool APEX (QCAT) provided by Qualcomm is very powerful which have contributed a lot for the stability and maturity of our system for many years
33 General Process of KPI Optimization Analysis
Basic analyzing ideas
KPI optimization is a process to find and solve problems KPI optimization during the operation and maintenance stage is mainly to pick out the performance data that needs special attention from the OMC classify these performance data and then compare the value of these data with that required by the operator If the value of an indicator is lower than the operatorrsquos requirement analyze this indicator and find out the factor that affect the indicator and then propose a solution to the operator If the values are higher than the operatorrsquos requirement therersquos no need to pay special attention to them
KPI analysis is a process from the whole to the part
Step 1 Check the key indicators from the view of the whole network If there is not any
ZTE Confidential Proprietary copy 2012 ZTE CORPORATION All rights reserved 12
UMTS KPI Optimization Analysis Guide Internal Use Only
problem just ignore them Otherwise try to locate the RNC NE that has the problem
Step 2 Analyze the indicators of the corresponding RNC to find out the RNC whose indicators have the problem
Step 3 Analyze the indicators of the cell under the problem RNC to find out the worst cells or TOP N cells If the indicators of all the cells under the RNC are tend to be low it is a common problem probably caused by parameter configuration And then check whether the radio parameter configuration in the cells under this RNC is the same as that in the cells under the normal RNCs
Step 4 Make a comprehensive analysis on the KPIs alarms DT test data and customer complains of the worst cells to find out a solution
Analysis method
After learning the KPI analysis ideas we must know some common KPI analysis methods to rule out causes of problems from the obvious ones to the hidden ones
For example we found that the TCP code words were strictly limited at eight sites near a park and the call drop rate rose suddenly How to solve this problem
Method one First we checked whether the alarms transmission and boards of these sites were normal After they are proved all normal we sent some engineers to the site to do test And meanwhile we traced the RNC signaling at the OMC It turned out that the test result was normal and the indicators of these sites of that day did not have any problem and code words were not limited And later we knew from the news that there was a big gathering of about one million people at the park at that moment Until then we came to know that the congestion was caused by too many users using the network at the same time
Method two First because the eight sites went worse all of a sudden it was unlikely that the problem lied in the hardware Then we checked whether the radio parameters had been modified the day before The result is no worksheet had been issued to modify those parameters and no alarm was found at those sites Therefore we excluded the possibility of hardware problem Then we checked the traffic trend graph of the last few days (over seven days) and found that the high call drop rate might be caused by high traffic The graph showed that traffic of each site rose suddenly on the day before Thus we came to the conclusion that this was an abnormal abrupt event which may have been caused by a gathering And later we were told that there was a big gathering at the park So we were assured the code words limitation and high call drop rate at the eight sites were caused by too many subscribers using the network at the same time
By comparing the two methods above we can find that although the first one (sending engineers to the site without the consideration of abnormal events) is commonly used it is inefficient and costs more resource The second method (analyzing the problem by the means of exclusion and association) is more efficient From this case we would like to emphasize that KPI analysis is a process of problem exclusion Using the comprehensive
ZTE Confidential Proprietary copy 2012 ZTE CORPORATION All rights reserved 13
UMTS KPI Optimization Analysis Guide Internal Use Only
methods (like Method One) at the first brush may be making a detour
minus Exclusion method Check the alarms on the OMC to learn about the state of the RNC NodeB BPC board and the transmission If there are obvious broken link in transmission or hardware problem the cause of the problem is easy to locate
minus Incident association If the problem is with a great number of sites take abrupt incidents into account such as large-scale gathering terrible weather of incorrect operation These incidents will put influence of different levels and ranges on the network indicators
minus Comparison of radio parameters If some site goes wrong in a sudden check whether the radio parameter configuration of this site is consistent with that of other normal sites If not change it as that of the normal sites because the indicator decrease may be caused by an incorrect modification of radio parameters
minus Relevant indicators association If a certain indicator is in poor condition check its relevant indicators and find the common problem from these relevant indicators
minus Comprehensive problem location When the above reasons are excluded use DT data KPI data RNC signaling analysis data to locate the problem with indicators comprehensively
ZTE Confidential Proprietary copy 2012 ZTE CORPORATION All rights reserved 14
UMTS KPI Optimization Analysis Guide Internal Use Only
Figure 3-7 KPI optimization analysis process
StartPick out
performance indexes
RNC index abnormal
Equipment alarms exist
Deal with equipment alarms
RNC index recovers
Common problem with the
worst cells
Transmission softwarehardware version wireless
parameter configuration
CNRNC Transmission
Hardware Software Interference
Wireless parameters
Time range
Abrupt and self-curable abnormality
helliphellip
Analyze and record causes
Suggestion about improvement
Common problems analysis
Problem resolved
Successful call
Call drop Soft handover
23G alternate operation
PS rate helliphellip
Deal with the relevant problem
Indexes normal
End
Climate change holidays assembly
transmission interruption power
fault and so on
Y
N
Y
Y
N
Y
N
Abnormal indexes analysis in one cell
Y
N
N
N
Y
N
Y
Show TOPN abnormal cells
and their locations
If the problem is proved to be equipment bug or system problem after
several attempts feed it back to RampD dept
ZTE Confidential Proprietary copy 2012 ZTE CORPORATION All rights reserved 15
UMTS KPI Optimization Analysis Guide Internal Use Only
4 KPI Optimization Analysis This chapter mainly demonstrates how to analyze the indicator problems from the aspect of OMC data and provides flowcharts for KPI optimization The detailed analyzing method and cases of every special subject can be checked in the optimization guides of all the subjects
41 CS Call Drop Optimization
The CS call drop rate is the most important indicator in KPI optimization
411 Definition of Call Drop
After checking the signaling on the Uu interface at the UE side the engineer can judge the situation a call drop if the Uu interface message satisfies one of the following three conditions during the calling process (in connection)
RNC Release is not received but the UE condition changes from CELL_DCH to IDLE
RRC Release is received and the released cause value is Not Normal
One of the following three messages mdash CC Disconnect CC Release Complete and CC Release mdash is received and the released cause value is Not Normal Clearing or Not Normal Unspecified
In a board sense the call drop includes the call drop rates of CN and UTRAN The call drop of UTRAN includes the following two aspects
After the successful service establishment RNC sends the RAB Release Request to CN
After the successful service establishment RNC sends the IU Release Request to CN Later RNC receives the IU Release Command from CN
Note that RAN call drop statistics which is defined from the aspect of lu interface signaling means the launching times of RAB Release Request and lu Release Request of RNC And the DT call drop statistics is defined from the aspects of the Uu interface message non-access stratum message and cause value RAN call drop statistics and DT call drop statistics are not exactly the same
ZTE Confidential Proprietary copy 2012 ZTE CORPORATION All rights reserved 16
UMTS KPI Optimization Analysis Guide Internal Use Only
412 CS Call Drop Analysis Flowchart
Figure 4-8 CS call drop analysis flowchart
ZTE Confidential Proprietary copy 2012 ZTE CORPORATION All rights reserved 17
UMTS KPI Optimization Analysis Guide Internal Use Only
Extract performance data
CS TOP Ncell filtering
Analyze a single cell
1 Check NE alarms
2 Associate emergencies
3 Compare parameter
configurations
4 Associate indicators
5 Locate the fault
comprehensively
Exist or not
Handle alarms
Solved or not
Yes
Yes
End
No
No
Exist or not
Handle emergencies
Solved or not
Yes
No
No
Exist or not
Correct wrong parameter
configurations
Solved or not
Yes
No
No
List related indicator counters
Call-drop-related
countersRTWP
Handover success rate
Traffic volume
Resource limit indicators
Checkamp analysis of
interference
Optimizationanalysis of
handover failures
Optimization analysis of
resource limitCall-drop-
related counters
C301230362C301230363C301230365C301230315C301230316C301230318C301230319C301230322C301230323
Solved or not
Yes
Yes
No
Drive Test+RNC signaling
trace
Yes
ZTE Confidential Proprietary copy 2012 ZTE CORPORATION All rights reserved 18
UMTS KPI Optimization Analysis Guide Internal Use Only
42 PS Call Drop Optimization
421 Optimization Flowchart
Figure 4-9 PS call drop optimization flowchart
ZTE Confidential Proprietary copy 2012 ZTE CORPORATION All rights reserved 19
UMTS KPI Optimization Analysis Guide Internal Use Only
Extract performance data
PS TOP Ncell filtering
Analyze a single cell
1 Check NE alarms
2 Associate emergencies
3 Compare parameter
configurations
4 Associate indicators
5 Locate the fault
comprehensive ly
Exist or not
Handle alarms
Solved or not
Yes
Yes
End
No
No
Exist or not
Handle emergencies
Solved or not
Yes
No
No
Exist or not
Correct wrong parameter
configurations
Solved or not
Yes
No
No
List related indicator counters
Call -drop-related
countersRTWP
Handover success rate
Traffic volume
Resource limit indicators
Check amp analysis of interference
Optimizationanalysis of
handover failures
Optimization analysis of
resource limitCall -drop-
related counters
C301230372C301230373C301230375C301230330C301230332C301230333C301230334C301230337C301230338
Solved or not
Yes
Yes
No
Drive Test +RNC signaling
trace
Yes
ZTE Confidential Proprietary copy 2012 ZTE CORPORATION All rights reserved 20
UMTS KPI Optimization Analysis Guide Internal Use Only
43 Optimization of Accessibility Indicators
Accessibility performance includes the success rate of RRC connection setup and the success rate of CSPS RAB assignment These two kinds of KPIs play important roles in the network optimization and directly influence the success rate of CSPS service establishment In this document this kind of problems are found from the aspect of OMC data and solved through parameter optimization
431 Definition of Access Failure
For the mobile originated call in the CS domain the access failure event means that the UE sends RRC REQUEST and IE establish cause is Originating Conversational Call but alerting of the direct transfer message is not received
The relevant events are defined as follows in the access failure stage
RRC connection setup failure After considering the resending times and the waiting time the UE sends RRC CONNECTION REQUEST and does not receive the response from RNC or RRC CONNECTION REJECT delivered by RNC
Initial direct transfer and security mode establishment failure After sending RRC CONNECTION SETUP COMPLETE the UE does not send NAS SETUP
RAB assignment failure After receiving CALL PROCEEDING the UE does not receive RB SETUP delivered by RNC Or the UE replies with RB SETUP FAIL after receiving RB SETUP Or the UE receives DISCONNECT with the cause value not being Normal Release after receiving RB SETUP At this time the UE has not reported RB SETUP CMP
Failure after RAB assignment After the UE sends RB SETUP COMPLETE the originating UE receives DISCONNECTRELEASE from CN Or the UE waits CONNECT or ALERTING overtime and launches the Call Clearing process Or the UE becomes IDLE before receiving Alerting and starts to receive the system message
For the mobile terminated in the CS domain the access failure event means that the terminating UE receives the paging of paging type 1 and does not send RRC CONNECTION REQUEST with the cause value being Terminating Conversational Call Or the UE does not send the alerting of direct transfer message to CN after sending RRC CONNECTION REQUEST
The relevant events are defined as follows in the access failure stage
RRC connection setup failure After sending RRC CONNECTION REQUEST the UE does not receive the response from RNC or RRC CONNECTION REJECT delivered by RNC
Initial direct transfer and security mode establishment failure After sending RRC
ZTE Confidential Proprietary copy 2012 ZTE CORPORATION All rights reserved 21
UMTS KPI Optimization Analysis Guide Internal Use Only
CONNECTION SETUP COMPLETE the UE does not receive the SETUP direct transfer message Or the UE sends RELEASE COMPLETE Or the UE receives DISCONNECT from CN
RAB assignment failure The UE does not receive RB SETUP delivered by RNC after sending CALL CONFIRM Or the UE replies with RB SETUP FAIL after receiving RB SETUP Or the UE receives DISCONNECT with the cause value not being Normal Release after receiving RB SETUP At this time the UE has not reported RB SETUP CMP
Failure after RAB assignment After the UE sends RB SETUP COMPLETE the terminating UE receives DISCONNECTRELEASE from CN
432 Analysis on RRC Connection Failures
The problem of RRC connection setup failure can be analyzed through the UE signaling flow and RNC single-user tracing The RRC connection setup includes the following steps
The UE sends RRC Connection Request through the RACH channel
RNC sends RRC Connection Setup through the FACH channel
The UE sends RRC Connection Setup Complete through the dedicated uplink channel after the downlink dedicated channel is established and synchronized
RRC connection setup failures are always caused by following issues
Uplink RACH problem
Problem about downlink FACH power allocation proportion
Parameter reselection problem of the cell
Low downlink dedicated initial transmitting power
Uplink initial power control problem
Congestion
Equipment malfunctions
Among these issues the problems of uplink RACH downlink FACH power allocation proportion parameter reselection of the cell and equipment malfunctions appear more frequently
ZTE Confidential Proprietary copy 2012 ZTE CORPORATION All rights reserved 22
UMTS KPI Optimization Analysis Guide Internal Use Only
4321 Analysis Flowchart of RRC Connection Setup Failures
Figure 4-10 Analysis flowchart of RRC connection setup failures
ZTE Confidential Proprietary copy 2012 ZTE CORPORATION All rights reserved 23
UMTS KPI Optimization Analysis Guide Internal Use Only
Extract performance data
TOP Ncell filtering
Analyze a single cell
1 Check NE alarms
2 Associate emergencies
3 Compare parameter
configurations
4 Associate indicators
5 Locate the fault
comprehensive ly
Exist or not
Handle alarms
Solved or not
Yes
Yes
End
No
No
Exist or not
Handle emergencies
Solved or not
Yes
No
No
Exist or not
Correct wrong parameter
configurations
Solved or not
Yes
No
No
List related indicator counters
Counters related to RRC setup
failuresRTWP
Resource limit
indicators
Checkamp analysis of interference
Optimization analysis of
resource limitCounters related
to RRC setup failures
C301480485C301480486C301480487C301480489C301480490C301480491C301481288C301481289C301481337C301481338C301481339C301481407C301481408
Solved or not
Yes
Yes
No
Drive Test+RNC signaling
trace
Yes
ZTE Confidential Proprietary copy 2012 ZTE CORPORATION All rights reserved 24
UMTS KPI Optimization Analysis Guide Internal Use Only
4322 UE sends RRC Connection Request but RNC does not receive it
If the EcIo of downlink CPICH is relatively low it is the problem of coverage
If the EcIo of downlink CPICH is not very low (for example the value is larger than -14 dB) Usually it is the problem of RACH and the following issues may cause the problem
minus The power of Preamble does not rise to a required value and the rising times of Preamble should be increased
minus The output power of UE is lower than the required value which is caused by poor UE performance In this case the UE should be changed
minus The NodeB equipment has a standing wave and the engineer should check whether NodeB has any SWR alarm
minus The radius of the cell is set improperly If the radius parameter of the cell is set too small the NodeB can not synchronize the UE beyond the range of the radius and the access fails This problem often happens in the places with large coverage such as the rural areas and the suburbs
4323 RNC delivers RRC Connection Reject after receiving RRC Setup Request
When RRC Connection Reject appears the engineer should check the specific reject cause value Usually there are two kinds of causes
The CPU load of RNC control plane board is too heavy and more boards should be added
DCH and FACH admission is rejected However this situation does not always happen
4324 UE does not receive RRC Connection Setup delivered by RNC
This problem may be caused by the following reasons
Poor coverage
Improper parameters of cell selection and reselection
Checking method The engineer should check the EcIo of CPICH If the value is lower than -12 dB (EcIo is -12 dB by default) and there is no cell of better quality in the monitor set the cause of this problem is poor coverage If there is better cell in the monitor set cell reselection may cause this problem
Poor coverage can be improved by coverage enhancement such as adding some sites to cover the places without signal coverage and adjusting the engineering parameters If the coverage can not be improved the engineer can enhance the FACH power according to
ZTE Confidential Proprietary copy 2012 ZTE CORPORATION All rights reserved 25
UMTS KPI Optimization Analysis Guide Internal Use Only
the PCPICH EcIo coverage of the current network For example if all the pilot EcIo values are larger than -12 dB in the coverage area the power proportion of the common channel should be configured on the basis of the situation that the EcIo value is larger than -12 dB And so the success rate of the idle UE assessment can be ensured
As for the access problem caused by cell selection and reselection the engineer can speed up the cell selection and reselection by adjusting the cell selection and reselection parameters and the problem of RRC connection setup failure caused by improper cell selection and reselection parameters can be solved
Note
The RRC Connection Setup message is borne by FACH RRC Connection Request sent by the UE is received by UTRAN at the preamble of PRACH and then it is sent from the RACH channel based on the current preamble power And the transmit power of preamble can rise all the time until the response is received (There is a limitation for the maximum number of preamble retransmissions) Therefore in the areas with poor coverage the RACH coverage and FACH coverage may become unbalanced and as a result UTRAN can receive RRC Connection Request sent by the UE but the UE can not receive RRC Connection Setup sent by RNC
4325 UE receives RRC Connection Setup and does not send RRC Setup Complete
If the downlink signal quality is normal this problem may be caused by the abnormal condition of the cell phone
Another reason of this problem may be the downlink synchronization failure caused by the low initial power of downlink dedicated channel You can solve this problem by adjusting the service downlink EbNo
4326 RNC does not receive RRC Setup Complete sent by UE
Because the uplink initial power control may increase the UE transmit power this kind of problem seldom appears If it appears the engineer can increase the Constant Value of the dedicated channel properly to raise the uplink DPCCH initial transmission power of the UE
At the same time this problem is also relevant with the uplink SIR initial target value configuration because this value may affect the uplink initial synchronization at the initial stage of link setup If the value of the parameter is set too large there will be too much uplink inference brought by the initial setup of the link If the value is set too small the uplink synchronization will take longer time and the initial synchronization may even fail This parameter is an RNC-level parameter which has a great influence on network performance Therefore the engineer should be cautious while adjusting this parameter
ZTE Confidential Proprietary copy 2012 ZTE CORPORATION All rights reserved 26
UMTS KPI Optimization Analysis Guide Internal Use Only
Note
RRC Connection Setup Complete is sent through uplink DPCH and the UE calculates the initial power of uplink DPCCH according to the received IErdquoDPCCH_Power_offsetrdquo and the measured CPICH_RSCP value
DPCCH_Initial_power = DPCCH_Power_offset - CPICH_RSCP
DPCCH_Power_offset = Primary CPICH DL TX Power + UL Interference + Constant Value The Constant Value can be configured in the OMC If this value is set too small the UE may not have enough power to send RRC Connection Setup Complete
433 Analysis on RABRB Setup Failures
When RAB or RB setup fails RNC will send RAB Assignment Fail in the RAB Assignment Response signaling The engineer can find out the specific failure reason from the failure cause value carried in relevant cells The reasons for common RABRB setup failures include
RNC directly rejecting RAB Setup Request because of wrong parameter configuration
Admission reject
RAB setup failure because the UE fails to respond to RB Setup Request
RAB setup failure because the Uu interface fails to set up RB
ZTE Confidential Proprietary copy 2012 ZTE CORPORATION All rights reserved 27
UMTS KPI Optimization Analysis Guide Internal Use Only
4331 Analysis Flowchart of RAB Setup Failures
Figure 4-11 Analysis flowchart of RAB setup failures
ZTE Confidential Proprietary copy 2012 ZTE CORPORATION All rights reserved 28
UMTS KPI Optimization Analysis Guide Internal Use Only
Extract performance data
TOP Ncell filtering
Analyze a single cell
1 Check NE alarms
2 Associate emergencies
3 Compare parameter
configurations
4 Associate indicators
5 Locate the fault
comprehensively
Exist or not
Handle alarms
Solved or not
Yes
Yes
End
No
No
Exist or not
Handle emergencies
Solved or not
Yes
No
No
Exist or not
Correct wrong parameter
configurations
Solved or not
Yes
No
No
List related indicator counters
Counters related to RAB setup failures RTWP
Resource limit
indicators
Checkamp analysis of interference
Optimization analysis of
resource limitCounters related to RAB setup failures
CS domain PS domainC301230290 C301230302C301230291 C301230303C301230292 C301230304C301230293 C301230305C301230294 C301230306C301230295 C301230307C301230296 C301230308C301230297 C301230309C301230298 C301230310C301230299 C301230311C301230300 C301230312C301230301 C301230313
Solved or not
Yes
Yes
No
Drive Test+RNC signaling
trace
Yes
ZTE Confidential Proprietary copy 2012 ZTE CORPORATION All rights reserved 29
UMTS KPI Optimization Analysis Guide Internal Use Only
4332 RNC Directly Rejecting RAB Setup Request Because Of Wrong Parameter Configuration
The case that RNC responds with RAB Setup Failure directly is seldom caused by invalid parameter configuration in the business network Usually this case is caused by special operations of the special users
The main scenario is that the subscription information of the userrsquos PS service is beyond the capability of the UE which leads to the direct refusal from RNC For example a special userrsquos subscription rates of uplink and downlink are 384 K but the maximum uplink rate of the UE is only 64 K The maximum uplink and downlink rates of the QoS message used for activating PDP set by the AT command or mobile terminal software used by the user are 384 K so the RNC will find the maximum uplink rate is beyond the UErsquos capability directly reply with RAB Setup Failure and will not launch the RB setup process when it receives RAB Assignment Request
After the RAB setup fails because the parameter configuration is beyond the UErsquos capability SGSN will negotiate again to launch the new RAB assignment until the UE has the capability to support the assignment and the RAB assignment is finished For the users the PDP activation is still successful and the actual maximum rate is the maximum rate the UE can support
However if the minimum guaranteed bit rate required by the QoS setting in the UErsquos PDP activation request is beyond the UErsquos capability though the network negotiates a lower rate to accept the UErsquos PDP activation request the UE will launch the request of deactivating PDP when it finds that the rate negotiated by the network in PDP activation accept request is lower than the minimum guaranteed bit rate and finally the PDP activation can not be completed
4333 Admission Reject
For the non-HSDPA user if there are insufficient system resources (including power channel code lub transmission resource and CE) the call establishment failure will be caused by the admission reject At this time it is necessary to check the network load code resource lub transmission resource and CE resource occupation to make sure the congestion is caused by the limitation of a certain kind of resource What is more the engineer should plan the corresponding expansion method
If the cell does not support the HSDPA service the R99 user admission is judged according to the fixed R99 admission threshold If the cell supports the HSDPA service and the HSDPA and R99 dynamic power is allocated the uplink admission of non-HSDPA is judged based on RTWP or the equivalent user number If the uplink load is too heavy the non-HSDPA user admission will also fail
If the bandwidth configuration on the lub interface is insufficient the lub interface will reject the R99 data service activation because of limited bandwidth
ZTE Confidential Proprietary copy 2012 ZTE CORPORATION All rights reserved 30
UMTS KPI Optimization Analysis Guide Internal Use Only
The admission control of the NodeB Credit resource is similar to the power admission control Whether the remaining Credit can support the currently requested service or not can be judged according to the spectrum spreading factor of the new access user According to the condition of the RAB Downsizing Switch RNC will deal with the issue in the corresponding way
For the HSDPA user in the dynamic power allocation mode besides the mentioned system resources such as the power channel code lub transmission resource and CE the admission reject should take into consideration whether the number of H users supported by NodeB and the number of H users supported by the cell are over the regulated threshold or not into consideration
For the HSDPA user when the bandwidth configuration on lub interface is insufficient the admission reject will not happen but the rate will be reduced What is more the AAL2PATHs of HSDPA and R99 are configured respectively and the HSDPA AAL2PATH must be configured to the HSDPA_RT or HSDPA_NRT type If the HSDPA AAL2PATH is configured to RT or NRT of R99 AAL2PATH type the RAB assignment failure will not happen but RNC will establish the HSDPA service as R99 384 Kbps
For the downlink power admission
Besides whether the R99 service load is over the non-HSDPA service threshold DCH service should take into consideration whether non-HSDPA power and HSDPA GBP (the minimum power needed for the guaranteed bit rate) are over the general power threshold of the cell
For the HSDPA service it is necessary to check whether the throughput rate provided by the cell is over the sum of all the usersrsquo GBR thresholds or whether the GBPs of the stream service and the background service are over the HSDPA power of the cell At the same time whether the non-HSDPA power and the HSDPA GBP (the minimum power needed for the guaranteed bit rate) are over the overall power threshold of the cell should be also taken into consideration
For the lub admission
For the DCH service the admission is made according to the multiplication of the peak rate and the service activation factor
For HSDPA service the admission is made according to the GBR
If the lub exceeds the congestion threshold the DCCC rate reduction will be triggered And if the RLC_AM retransmission rate is over a certain threshold the Iub Overbooking switch can be opened to trigger the TF which limits R99 or to reduce the rate of HSDPA service by a certain factor
ZTE Confidential Proprietary copy 2012 ZTE CORPORATION All rights reserved 31
UMTS KPI Optimization Analysis Guide Internal Use Only
4334 RAB Setup Failure Because the UE Fails to Respond to RB Setup
The UE fails to respond to RB setup mainly because of the userrsquos operation
Take the following cases as examples
When the user already has had the downlink 12 K data service he receives RB Setup Request of the VP service (either the originated call in the VP domain or the terminated call in the VP domain) Because the UE does not support the VP and high-speed PS service in the downlink at the same time it directly replies with RB Setup Failure and the cause value is unsupported configuration
Compared with the WCDMA subscriber originating the VP service the terminating subscriber resides in the GSM network and so it does not support the VP service After RNC receives RAB Assignment Request the core network will deliver the Disconnect command right after call proceeding and the cause value is Bearer capability not authorized At this time the UE has just received the RB SETUP command and has no enough time to finish the RB setup So the UE will reply with RB Setup Failure after it receives the Disconnect command and the RNC will reply with RAB Setup Failure with the cause value being failure in radio interface procedure
4335 RAB Setup Failure Because the Uu Interface Fails to Set Up RB
RNC sends the Radio Bearer Setup command to the UE but fails to receive Radio Bearer Setup Compete This kind of situation (RB setup failure) often appears in the cells with weak signals There are two causes of weak signals one is that the UE does not reside in the best server to launch the access and the other is poor coverage
If the UE does not reside in the best server to launch the access it will hope to enter the best server through active set update in the RB setup process (At the same time the fast signal change will drastically weaken the signals in the cell) but the active set update can only be processed after the RB setup is completed because the procedures can not be processed alternately (Neither the network nor the terminal supports it) Therefore RB can only be set up in the cell with weak signals and the setup is easy to fail As for this situation the starting threshold and speed of co-frequency cell reselection should be increased to make the UE reside in the best server and launch the access as soon as possible
RB setup failure may be caused by the poor downlinkuplink coverage If the failure is caused by downlink coverage the UE can not receive the Radio Bearer Setup command which may be caused by the uplink interference and this can be fixed through checking RTWP The poor downlink coverage is partly caused by the bad UE demodulation performance and other causes should be solved by RF optimization
ZTE Confidential Proprietary copy 2012 ZTE CORPORATION All rights reserved 32
UMTS KPI Optimization Analysis Guide Internal Use Only
44 Optimization of Mobility Indicators
Mobility indicators mainly fall into three categories mdash soft handovers hard handovers and inter-RAT handovers The handover problems usually happen in the following cases
The best server changes too fast or there is no best server due to pilot pollution
The handover is not prompt or there are pingpong handovers due to improper parameter configuration
Adjust the engineering parameters for antennas in areas with severe pilot pollution And adjust the handover parameters such as the values of 1A 1B CIO TTT (time to trigger) Hysteresis and so on to solve the problem that the handover is not prompt or there are pingpong handovers This section tries to solve this kind of problems through OMC data analysis and parameter optimization
441 Optimization of Soft Handovers
Missed neighboring cell configuration pilot pollution improper soft handover parameter configuration and equipment malfunctions are the major causes of soft handover failures To confirm the problems the field DTs are required
ZTE Confidential Proprietary copy 2012 ZTE CORPORATION All rights reserved 33
UMTS KPI Optimization Analysis Guide Internal Use Only
4411 Soft Handover Optimization Flowchart
Figure 4-12 Soft handover optimization flowchart
ZTE Confidential Proprietary copy 2012 ZTE CORPORATION All rights reserved 34
UMTS KPI Optimization Analysis Guide Internal Use Only
Extract performance data
TOP Ncell filtering
Analyze a single cell
1 Check NE alarms
2 Associate emergencies
3 Compare parameter
configurations
4 Associate indicators
5 Locate the fault
comprehensive ly
Exist or not
Handle alarms
Solved or not
Yes
Yes
End
No
No
Exist or not
Handle emergencies
Solved or not
Yes
No
No
Exist or not
Correct wrong parameter
configurations
Solved or not
Yes
No
No
List related indicator counters
RTWPResource
limit indicators
Checkamp analysis of interference
Optimization analysis of
resource limitCounters related to intra-frequency
handover failures
C301391101 C301390593C301391102 C301390594C301391103 C301390595C301390586 C301390596C301390587 C301390597C301390588 C301390598C301390589 C301390599C301390590 C301390600C301390591 C301390601C301390592 C301390602
Solved or not
Yes
Yes
No
Drive Test+RNC signaling
trace
Yes
Counters related to soft handover
failures
30055 3005630057 3005830059 3006030061 30062
Cell hand-inhand-out indicators
ZTE Confidential Proprietary copy 2012 ZTE CORPORATION All rights reserved 35
UMTS KPI Optimization Analysis Guide Internal Use Only
4412 Checking Missed Neighboring Cell Configuration
Generally speaking most of the call drops at the beginning of the optimization are caused by missed neighboring cell configuration The following methods are often used to judge whether the call drops are caused by missed configuration of co-frequency neighboring cells
Observe the active set EcIo information recorded by the UE and the Best Server EcIo information recorded by the Scanner before the call drop If the former record is very bad but the latter record is very good then check whether the Best Server scrambling code recorded by the Scanner appears in the latest list of the neighboring cells under intra-frequency measurement control If it does not then the call drop is caused by missed neighboring cell configuration
If the UE re-accesses immediately after the call drop and the cell scrambling codes during the UE reaccess and those during the call drop are different then the call drop may also be caused by missed neighboring cell configuration You can confirm it through measurement control (look backwards from the message of the call drop event for the latest intra-frequency measurement control message and check the neighboring cell list of this message)
Some UE may report the Detected Set information If the corresponding scrambling code appears in the Detected Set information before the call drop then the call drop is caused by missed neighboring cell configuration
4413 Checking Pilot Pollution
Definition of pilot pollution Excessive strong pilot signals exist at a certain point but none of them is strong enough to be the best server To form pilot pollution the following points in this definition should be satisfied
Strong pilot signal The absolute pilot signal strength is used to judge whether the pilot signal is a strong one The pilot signal strength can be evaluated through the pilot RSCP If the pilot RSCP exceeds a threshold it is considered a strong pilot signal The formula is
AbsoluteRSCPThRSCPCPICH __ gt
Excessive The number of pilot signals is used to judge whether there are excessive pilot signals at a certain point If the number exceeds a threshold it is regarded that excessive pilot signals exist at this point The formula is
NThNumberCPICH gt_
None of them is strong enough to be the best server The relative strength of a pilot signal is a key factor in judging whether the pilot signal is strong enough Based on the above definition and formulae if the difference between the strength of the
ZTE Confidential Proprietary copy 2012 ZTE CORPORATION All rights reserved 36
UMTS KPI Optimization Analysis Guide Internal Use Only
strongest pilot signal and that of the )1( +NTh strongest pilot signal at this point is
less than a threshold it is regarded that there is no pilot signal strong enough to be the best server at this point The formula is
lativeRSCPthThbest ThRSCPCPICHRSCPCPICHN Re_)1( )__( ltminus +
According to the above description it is regarded that pilot pollution exists if the following conditions are both satisfied
The number of pilot signals that meet the condition
AbsoluteRSCPThRSCPCPICH __ gt is more than NTh
lativeRSCPthThbest ThRSCPCPICHRSCPCPICHN Re_)1( )__( ltminus +
For example during the network optimization suppose
dBmTh AbsoluteRSCP 95_ minus= 3=NTh and dBTh lativeRSCP 5Re_ = if the following
conditions are both satisfied then it is regarded that pilot pollution exists
The number of the pilot signals that meet the condition
dBmRSCPCPICH 95_ minusgt is more than 3
dBRSCPCPICHRSCPCPICH thbest 5)__( 4 ltminus
4414 Adjusting Soft Handover Algorithm Parameters
You can solve the following kinds of problems by adjusting handover algorithm parameters
1 The handover is not prompt
From the perspective of the CS service signaling flow the symptom of this problem is that the UE cannot receive Active Set Update (physical channel reallocation in the case of the intra-frequency hard handover) because after the UE reports the measurement report the source cell has a fast reduction in EcIo When the RNC sends Active Set Update the UE has closed the transmitter due to the loss of downlink synchronization Viewed from the UE side it cannot receive Active Set Update In the PS services if the UE cannot receive Active Set Update or TRB resets before the handover the handover will also fail
From the perspective of signals the following phenomena may accompany this problem
ZTE Confidential Proprietary copy 2012 ZTE CORPORATION All rights reserved 37
UMTS KPI Optimization Analysis Guide Internal Use Only
minus Corner effect EcIo of the source cell decreases drastically and EcIo of the target cell increases sharply (very high when it appears)
minus Fast fading EcIo of the source cell decreases quickly for a while and then increases and EcIo of the target cell increases for a short while
2 Pingpong handovers The following phenomena may accompany this problem
The best server changes quickly Two or more cells take turns to be the best server But as the best server none of the cells can last long though they has good RSCPs and EcIos
There is no best server There are multiple cells Their RSCPs are normal and similar to each other But EcIo of every cell is very bad
From the perspective of the signaling flow Event 1A is reported immediately after one cell is deleted Because the UE cannot receive Active Set Update from the RNC the handover fails
4415 Equipment Malfunctions
First check the alarm console to see whether there are abnormal alarms and analyze the message traces at the same time Find out in which step the soft handover fails Check the failure message and contact the local product maintaining engineer to confirm whether the equipment has malfunctions
4416 Solutions
Corresponding adjustments should be taken for the confirmed problems
Handover failures caused by pilot pollution Adjust the engineering parameters of a certain antenna to set this antenna as the best server in this interfered location If the power of one of its sectors is reduced then Io of the pilot pollution area will decrease even if the powers of other pilots are not adjusted EcIo will also increase Thereby the EcIo differences with other scrambling codes in the active set will become larger and pilot pollution will be eliminated Through a lot of research ZTE has proved that the reduction in the pilot transmit power will not change cell capacity greatly If condition allows new base stations can be added to cover this area
Equipment malfunctions Consult the customer service engineers and ask them to help check whether there are alarms and whether the transport layer is abnormal If there are alarms coordinate with the customer service engineers and the engineering personnel to solve the problems
Call drops because the handovers are not prompt
ZTE Confidential Proprietary copy 2012 ZTE CORPORATION All rights reserved 38
UMTS KPI Optimization Analysis Guide Internal Use Only
minus Adjust the antenna to expand the handover zone
minus Configure the Event 1A handover parameters to make the handover easier to happen
minus Increase CIO to make the handover happen earlier in the target cell The sum of CIO and the actually measured value is used for judging the UE events including the UE intra-frequency handover CIO helps shift the cell border in the handover algorithm If CIO is configured with a larger value the handover will be easier to happen and there will be more UE in the soft-handover status but more resources will be occupied If CIO is configured with a smaller value the soft handover will be more difficult to happen and the receiving quality may be impaired A CIO of about 5dB is quite good for eliminating the fast fading and the corner effect but this configuration has some side effects such as the increase of handover proportion
Call drops caused by pingpong handovers Adjust the antenna to form a best server in its coverage zone or set the Event 1B handover parameters (increase the threshold of Event 1B the Event 1B hysteresis or the time to trigger Event 1B) to increase the difficulty in deleting the active set
442 Optimization of Hard Handovers
4421 Classification of Hard handovers
Hard handovers mainly fall into two classifications
Intra-frequency hard handovers The intra-frequency hard handover is triggered only when the intra-frequency softsofter handover cannot be performed and it is applicable to the following circumstances
minus Inter-RNC intra-frequency cell handovers when there is no Iur interface
minus Insufficient Iur interface resources though there is the Iur interface
minus Handovers controlled by the threshold of the PS service rate in the handover cell
The intra-frequency softsofter handovers can not be performed (intra-frequency hard handover should be triggered) in the following scenarios
minus When the intra-frequency handover happens the UE is using the transmit diversity in the active set cell but the target cell does not support the transmit diversity
minus The intra-frequency measurement report does not contain OFF and TM of the
ZTE Confidential Proprietary copy 2012 ZTE CORPORATION All rights reserved 39
UMTS KPI Optimization Analysis Guide Internal Use Only
target cell
minus When the intra-frequency handover happens between RNCs the Iur interface is unavailable
minus The UE performs the multiuser detection in the active set cell but the target cell does not support the multiuser detection
minus The target cell and the original cell belong to different classifications (The cells of R99 R5+R99 and R6+R5+R99 belong to the same classification while the cells of R5 and R6+R5 belong to another classification)
Inter-frequency hard handovers The inter-frequency hard handover means a UE connection is handed over from a cell of a UTRAN frequency to a cell of another frequency Many factors including the radio quality the load and the speed of the moving UE may trigger inter-frequency hard handovers
For example the radio quality triggers the inter-frequency hard handover in the following way
When the quality of the UE radio frequency becomes lower the inter-frequency measurement will be triggered and according to the measurement result the UE connection will be handed over to a better frequency
ZTE Confidential Proprietary copy 2012 ZTE CORPORATION All rights reserved 40
UMTS KPI Optimization Analysis Guide Internal Use Only
4422 Hard Handover Optimization Flowchart
Figure 4-13 Hard handover optimization flowchart
ZTE Confidential Proprietary copy 2012 ZTE CORPORATION All rights reserved 41
UMTS KPI Optimization Analysis Guide Internal Use Only
Extract performance data
TOP Ncell filtering
Analyze a single cell
1 Check NE alarms
2 Associate emergencies
3 Compare parameter
configurations
4 Associate indicators
5 Locate the fault
comprehensive ly
Exist or not
Handle alarms
Solved or not
Yes
Yes
End
No
Exist or not
Handle emergencies
Solved or not
YesNo
Exist or not
Correct wrong parameter
configurations
Solved or not
Yes
No
No
List related indicator counters
RTWPResource
limit indicators
Checkamp analysis of interference
Optimization analysis of
resource limit
Counters related to inter-frequency handover failures
C301110489 C301110516C301110499 C301110517C301110500 C301110518C301110501 C301110519C301110502 C301110520C301110503 C301110521C301110504 C301110522C301110505 C301110523
Solved or not
Yes
Yes
No
Drive Test+RNC signaling
trace
Yes
Counters related to hard handover
failures
30041 3004230043 3004430045 3004630047 30048
Cell hand-inhand-out indicators
NoNo
ZTE Confidential Proprietary copy 2012 ZTE CORPORATION All rights reserved 42
UMTS KPI Optimization Analysis Guide Internal Use Only
4423 Hard Handover Optimization Methods
The optimization flow for the hard handover is similar to that of the soft handover The major differences are in the parameter optimization To optimize intra-frequency hard handovers you can properly reduce the Event 1D hysteresis and the time to trigger Event 1D according to the real radio environment to ensure timely handovers
Inter-frequency coverage is often applied to some special scenarios such as indoor coverage and tested through CQT The method of judging whether there is missed configuration of the inter-frequency neighboring cell is almost the same as that of the co-frequency neighboring cell when a call drop occurs the UE fails to measure or report the inter-frequency neighboring cell after the call drop the UE resides in the inter-frequency neighboring cell again
The common hard handover problems are
1 The handover is not prompt The common symptoms are frequent call drops in the hard handovers when the UE moves
Solutions
Increase the threshold of activating the compressing mode The compressing mode is usually activated before the inter-frequency handover or the inter-RAT handover and it is used to measure the quality of the inter-frequency or inter-RAT cell You can set a threshold of the CPICH RSCP or EcIo to activate the compressing mode And the RSCP is widely used
minus Requirements on setting the threshold of activating the compressing mode Before the cell quality becomes low enough to cause a call drop the signal of the target cell should be measured and reported and the handover should be performed
minus Requirement on setting the threshold of deactivating the compression mode Frequent activationdeactivation of the compression mode should be avoided
Increase CIOs of the inter-frequency cell pair
Reduce the threshold of triggering the target frequency handover under the inter-frequency coverage
2 There are pingpong handovers
Solution Increase the hard handover hysteresis and the time to trigger the event
ZTE Confidential Proprietary copy 2012 ZTE CORPORATION All rights reserved 43
UMTS KPI Optimization Analysis Guide Internal Use Only
443 Optimization of Inter-RAT Handovers
4431 Configuring Basic Inter-RAT Parameters
Most of the inter-RAT handover failures are caused by incomplete parameter configuration The following parameters need special attention
Complete RNC parameter configuration for the GSM neighboring cell The 2G system shall provide the 3G system with the correct radio parameters based on negotiation mdash MCC MNC LAC ID (CI) NCC BCC frequency band indicator (900 or 1800) and BCCH
Table 4-3 Parameters That 2G Shall Provide to 3G
MCC MNC LACIDCI
NCC BCCFrequency
band indicator
BCCH
460 2 202 193 0 0 900 102
Complete GSM BSC parameter configuration for the WCDMA neighboring cell The 3G system shall provide the 2G system with the correct radio parameters based on negotiation mdash MCC MNC LAC RNC ID cell ID (C_ID) downlink frequency scrambling code and RAC
Table 4-4 Parameters That 3G Shall Provide to 2G
MCC MNC LACRNC
IDCell IDC_ID
Downlink frequency
Scrambling code
RAC
460 3 20 18 51 10787 51 20
According to the current strategy of one-way inter-RAT handovers if the parameter configuration is complete one probable cause of the inter-RAT handover failure is that the handover is not prompt The common parameter adjustment is to increase CIO the threshold to activatedeactivate the compressing mode and the threshold to trigger the WCDMA-to-GSM handover at the same time
Call drops during the inter-RAT handovers between WCDMA and GSM may be caused by
minus Inconsistent data configuration at the GSM side and the WCDMA side after GSM modifies the configuration data but does not inform WCDMA
minus Missed configuration of neighboring cells which can be solved by the correct configuration of neighboring cells
minus Too fast signal changes
ZTE Confidential Proprietary copy 2012 ZTE CORPORATION All rights reserved 44
UMTS KPI Optimization Analysis Guide Internal Use Only
minus Pingpong reselection
minus Faults with the UE for example the UE fails to respond to the handover or report the inter-RAT measurement report
minus Changes of the best server during the physical channel reallocation
minus Wrong LAC configuration which can be located through data configuration check
ZTE Confidential Proprietary copy 2012 ZTE CORPORATION All rights reserved 45
UMTS KPI Optimization Analysis Guide Internal Use Only
4432 Inter-RAT Handover Optimization Flowchart
Figure 4-14 Inter-RAT handover optimization flowchart
ZTE Confidential Proprietary copy 2012 ZTE CORPORATION All rights reserved 46
UMTS KPI Optimization Analysis Guide Internal Use Only
Extract performance data
TOP Ncell filtering
Analyze a single cell
1 Check NE alarms
2 Associate emergencies
3 Compare parameter
configurations
4 Associate indicators
5 Locate the fault
comprehensive ly
Exist or not
Handle alarms
Solved or not
Yes
Yes
End
No
No
Exist or not
Handle emergencies
Solved or not
Yes
No
No
Exist or not
Correct wrong parameter
configurations
Solved or not
Yes
No
No
List related indicator counters
RTWPResource
limit indicators
Checkamp analysis of interference
Optimization analysis of
resource limitCounters related to inter-RAT handover failures
C301130667 C301130681C301130668 C301130682C301130669 C301130690C301130670 C301130691C301130671 C301130692C301130672 C301130693C301130673 C301130694C301130674 C301130696C301130675 C301130697C301130677 C301130698C301130678 C301130699C301130679 C301130700
C301130680
Solved or not
Yes
Yes
No
Drive Test+RNC signaling
trace
Yes
Counters related to inter-RAT handover
failures
Cell hand-inhand-out indicators
30049 3005030051 3005230053 30054
ZTE Confidential Proprietary copy 2012 ZTE CORPORATION All rights reserved 47
UMTS KPI Optimization Analysis Guide Internal Use Only
45 Optimization of Resource Indicators
The resource indicators directly reflect the system capacity Increasing subscribers will consume more system resources and some resources may be limited for example the code resource may be limited the TCP access request may be rejected and the CE resource usage rate may exceed the threshold Limited system resources have a negative influence on the whole-network indicators and the subscribersrsquo perception for example call drops may frequently happen and more TCP access requests may be rejected during the voice services
Table 4-5 Resource KPIs and Alarm Thresholds
Resource type KPI No and nameAlarm
threshold
TCP
C301320150 Number of rejected services DCH downlink TCP limit
50
PI30167 Average non-HS (SOA) (SOA)DPA TCP 40
PI30092 Maximum Cell TCP () 100
PI30093 Average Cell TCP 70
UL TrafficPI30029 Handover Blocking Rate 05
KPI RTWP (in busy hour) -98 dBm
Code
C301320153 Number of rejected services DCH no code
50
PI30205 Average Cell HSUPA Users 12
PI30172 Cell Average HSDPA Users 16
CE
PI301830006 Maximum use Ratio of Uplink NodeB CE
60
PI301830010 Maximum use Ratio of Downlink NodeB CE
60
ZTE Confidential Proprietary copy 2012 ZTE CORPORATION All rights reserved 48
UMTS KPI Optimization Analysis Guide Internal Use Only
451 Resource Indicator Optimization Flowchart
Figure 4-15 Resource indicator optimization flowchart
ZTE Confidential Proprietary copy 2012 ZTE CORPORATION All rights reserved 49
UMTS KPI Optimization Analysis Guide Internal Use Only
Extract performance data
TOP Ncell filtering
Analyze a single cell
1 Check NE alarms
2 Associate emergencies
3 Compare parameter
configurations
4 Associate indicators
5 Locate the fault
comprehensive ly
Exist or not
Handle alarms
Solved or not
Yes
是
End
No
No
Exist or not
Handle emergencies
Solved or not
Yes
No
No
Exist or not
Correct wrong parameter
configurations
Solved or not
Yes
No
No
List related indicator counters
Code resource indicators
CE resource indicators
TCPadmission
reject counter
C301320150
Solved or not
Yes
Yes
No
Drive Test+RNC signaling
trace
Yes
Counter related to TCP limit
Cell TX power
indicators
30090 3009130092 3009330166 3016730168 3016930170 30171
30163301643016530075
30223302243045030451
Yes
Yes
ZTE Confidential Proprietary copy 2012 ZTE CORPORATION All rights reserved 50
UMTS KPI Optimization Analysis Guide Internal Use Only
452 Code Resource Optimization
The statistics of Number of rejected services and DCH no code the average code resource usage rate and the number of the HSDPA subscribers can be used to judge whether the code resource in a cell is limited If the code resource is limited you can adjust the code resource allocation to alleviate the situation
Based on the system algorithm when Formula 1 is satisfied you can add an HS-PDSCH when Formula 2 is satisfied then an HS-PDSCH is deleted
Formula 1 OcuRateNoHspdsch + OcuRateHspdsch + DpchCodeHy + 32 lt= 512
Formula 2 OcuRateNoHspdsch + OcuRateHspdsch + CodeUptHyA gt 512
OcuRateHspdschHSPDSCH means the number of the codes of SF=512 blocked by the HS-PDSCH OcuRateNoHspdsch means the number of codes of SF=512 blocked by other channels DpchCodeHy means the number of codes of SF=512 reserved for the DPCH and CodeUptHyA is the threshold to decide whether to delete the HSPDSCH
Therefore to ensure the access of the R99 subscribers you can make some adjustment according to Table 4-6 when the code resource is limited though the HSDPA rate may decrease
Table 4-6 Adjusting Code Resource Allocation
AbbreviationParameter
nameRange
and stepCurrent value
Update value
Remark
DpchCodeHy DPCH Code Hysteresis
0512 16 28
To decrease the number of rejected services for DCH no code
CodeUptHyACode Update Hysteresis A
0512 16 28
To decrease the number of rejected services for DCH no code
453 Monitoring CE Resource
The CE resource is mainly monitored through the maximum UE uplinkdownlink usage rate If there is any problem you can solve it by controlling the load or adding more boards
ZTE Confidential Proprietary copy 2012 ZTE CORPORATION All rights reserved 51
UMTS KPI Optimization Analysis Guide Internal Use Only
454 Optimization of Power Control
4541 Monitoring and Optimizing Downlink Power Control
Limited TCP in busy hours will not only increase access failures and call drops in the local cell but also increase soft handover failures and call drops in the neighboring cells Number of rejected services and DCH downlink TCP limit are intuitive KPIs to judge whether TCP is limited Although limited uplink capacity and massive UE moves in the rush hours may also cause call drops the limited TCP is absolutely a key factor
Based on the system algorithm MinHsdpaPower (MinHspaPwrRto) + NoHsPower gtNode B if the safety threshold is used (MinHsdpaPower means the power reserved for HSPA) then it will activate the downlink rate downgrade algorithm flow for the congestion (lower the downlink DCH rate) Although the rate downgrade can ensure access of some subscribers it is an irregular action and will degrade the performance
455 Speeding up Rate Downgrade
Considering that the cells with heavy load reject more access requests you can speed up the rate downgrade during the resource congestion to release the resources as soon as possible and avoid call drops caused by access failures (this method is only applicable to the cells with many PS service users but not those with only CS service users) Table 4-7 is an example of the parameter modification for the rate downgrade
Table 4-7 Example of Parameter Modification for Rate Downgrade
Abbreviation Parameter nameRange and
stepCurrent value
Update value
Remark
UlDnMaxStg Maximum Number of Degraded Uplink Load Steps Every Time
[1 8] 1 2 Downgrade from 384 Kbps to 16 Kbps
DlDnMaxStg Maximum Number of Degraded Downlink Load Steps Every Time
[1 8] 1 3 Downgrade from 384 Kbps to 8 Kbps
456 Monitoring and Optimizing Uplink Capacity
Handover Blocking Rate and RTWP can reflect the uplink capacity of the cell Because interference may also increase RTWP this factor should be distinguished during the RTWP monitoring Another effective indicator is the voice service erl If a cell has over 20 erls in busy hours you should pay special attention to it
ZTE Confidential Proprietary copy 2012 ZTE CORPORATION All rights reserved 52
UMTS KPI Optimization Analysis Guide Internal Use Only
457 Optimization of Uplink Capacity at the Whole Network Level
Case The uplink capacity was limited in a large number of sites after the cutover and the symptoms are a sharp rise of RTWP and a high call drop rate during the rush hours
After the following parameters were modified as shown in Table 4-8 the problem was solved
Table 4-8 Example of Power Control Parameter Modification
AbbreviationParameter
nameRange
Current value
Update value
ULINITSIRUplink Initial SIR target (dB)
UL 34 K136 K signaling UL 122 K AMR
4-5 35
ULMAXSIRMaximum Uplink SIR target (dB)
UL 34 K136 K signaling UL 122 K AMR
15 10
UlSirTargDnStepUplink SIR Target Down Step Size (dB)
UL 34 K136 K signaling UL 122 K AMR
01 02
458 Optimization of Uplink Capacity for a Single Cell
A lot of optimization measures can be taken to bring down the rising RTWP However with increasing subscribers the capacity may still be limited in some area while further modification of SirTarget will obviously degrade the call quality of the whole network and undermine the subscribersrsquo perception In this case you can adjust the power control parameters for a single site that has heavy traffic in the following way add one set of DivPc parameters and use this set of parameters only for this site
Case Table 4-9 shows an example of the power control parameter modification After this modification the call drop rate in the site with heavy traffic decreased to one quarter of the original one
Table 4-9 Example of Power Control Parameter Modification for Heavy-Traffic Cell
SRVTYPE ULINITSIR ULMAXSIR ULMINSIR
0 35-gt15 100-gt35 20-gt10
104 40-gt20 150-gt50 05-gt0
28 35-gt15 100-gt35 05-gt0
50 60-gt20 150-gt50 20-gt0
54 60-gt20 150-gt50 20-gt0
ZTE Confidential Proprietary copy 2012 ZTE CORPORATION All rights reserved 53
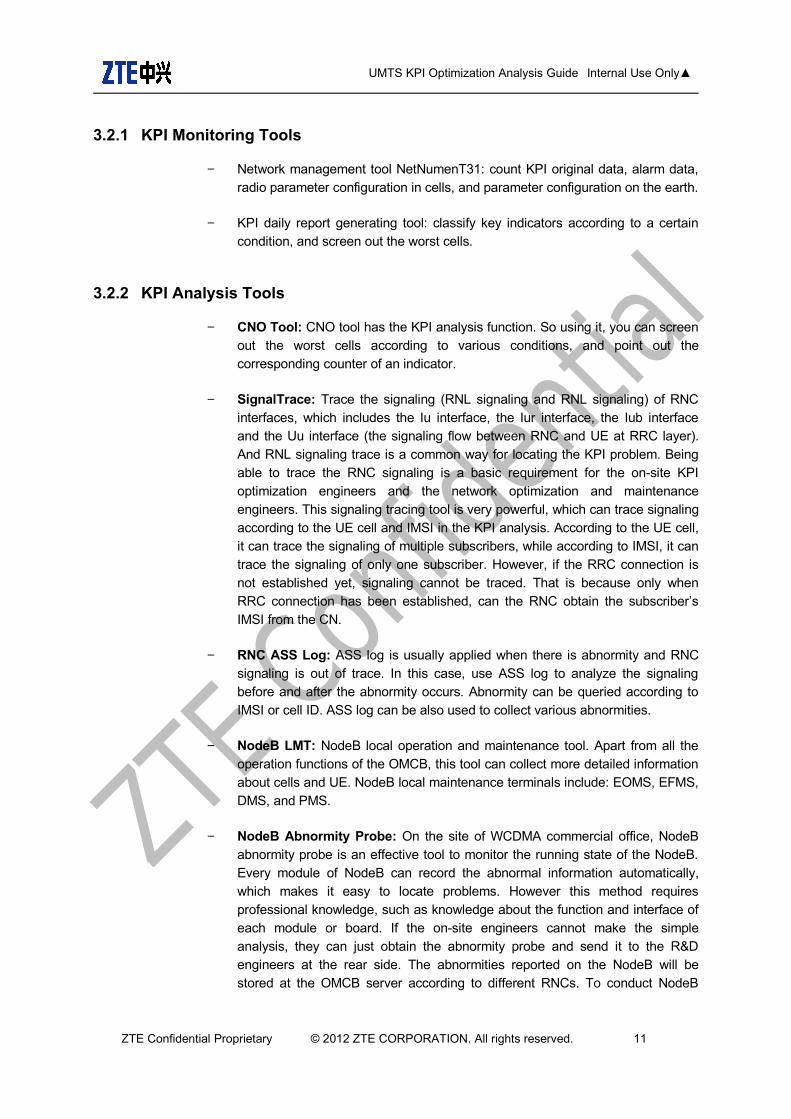
UMTS KPI Optimization Analysis Guide Internal Use Only
321 KPI Monitoring Tools
minus Network management tool NetNumenT31 count KPI original data alarm data radio parameter configuration in cells and parameter configuration on the earth
minus KPI daily report generating tool classify key indicators according to a certain condition and screen out the worst cells
322 KPI Analysis Tools
minus CNO Tool CNO tool has the KPI analysis function So using it you can screen out the worst cells according to various conditions and point out the corresponding counter of an indicator
minus SignalTrace Trace the signaling (RNL signaling and RNL signaling) of RNC interfaces which includes the Iu interface the Iur interface the Iub interface and the Uu interface (the signaling flow between RNC and UE at RRC layer) And RNL signaling trace is a common way for locating the KPI problem Being able to trace the RNC signaling is a basic requirement for the on-site KPI optimization engineers and the network optimization and maintenance engineers This signaling tracing tool is very powerful which can trace signaling according to the UE cell and IMSI in the KPI analysis According to the UE cell it can trace the signaling of multiple subscribers while according to IMSI it can trace the signaling of only one subscriber However if the RRC connection is not established yet signaling cannot be traced That is because only when RRC connection has been established can the RNC obtain the subscriberrsquos IMSI from the CN
minus RNC ASS Log ASS log is usually applied when there is abnormity and RNC signaling is out of trace In this case use ASS log to analyze the signaling before and after the abnormity occurs Abnormity can be queried according to IMSI or cell ID ASS log can be also used to collect various abnormities
minus NodeB LMT NodeB local operation and maintenance tool Apart from all the operation functions of the OMCB this tool can collect more detailed information about cells and UE NodeB local maintenance terminals include EOMS EFMS DMS and PMS
minus NodeB Abnormity Probe On the site of WCDMA commercial office NodeB abnormity probe is an effective tool to monitor the running state of the NodeB Every module of NodeB can record the abnormal information automatically which makes it easy to locate problems However this method requires professional knowledge such as knowledge about the function and interface of each module or board If the on-site engineers cannot make the simple analysis they can just obtain the abnormity probe and send it to the RampD engineers at the rear side The abnormities reported on the NodeB will be stored at the OMCB server according to different RNCs To conduct NodeB
ZTE Confidential Proprietary copy 2012 ZTE CORPORATION All rights reserved 11
UMTS KPI Optimization Analysis Guide Internal Use Only
abnormity probe analysis you need to download abnormity probe files from different OMCB servers and then use the abnormity probe tool to make a comprehensive analysis
minus CTS Tool CTS is a tool developed by the CN department which can trace signaling in depth according to IMSI and trace signaling across RNCs So this is particularly suitable to trace VIP subscribers In this case CTS is easier to use than SignalTrace which can only trace signaling of RNCs one by one CTS can trace the interactive signaling between network elements (NEs) within the CN as well as the signaling of the Iu interface and the Uu interface This kind of signaling tracing is what we called in-depth tracing The work principle of CTS is to set up an IMSI task on the CTS server and send it to the CN front side which will then send this task to each CN module via the interfaces dedicated to the CN modules and the RNC and then each module after receiving the signaling related to the IMSI task will send the signaling back to the CTS server via the CN front side The interfaces mentioned above are private interfaces so this tool can only support our own CN and RNC CTS signaling can be checked and analyzed with an offline tool but the offline tool does not work very well because of the lack of continuous optimization and perfection
minus UE log DT test is also an important auxiliary way in analyzing KPI indicators There are many problems that cannot be located by tracing signaling at the network side and can only be located by the use of UE log The commonly used drive test software includes QXDMAPEX (QCAT) CNTCAN and TEMS CNTCAN and TEMS are often used for network optimization For the use of CNTCAN please refer to the corresponding help file and the instruction document publicly released by the Network Optimization Tool Department QXDM and the analysis tool APEX (QCAT) provided by Qualcomm is very powerful which have contributed a lot for the stability and maturity of our system for many years
33 General Process of KPI Optimization Analysis
Basic analyzing ideas
KPI optimization is a process to find and solve problems KPI optimization during the operation and maintenance stage is mainly to pick out the performance data that needs special attention from the OMC classify these performance data and then compare the value of these data with that required by the operator If the value of an indicator is lower than the operatorrsquos requirement analyze this indicator and find out the factor that affect the indicator and then propose a solution to the operator If the values are higher than the operatorrsquos requirement therersquos no need to pay special attention to them
KPI analysis is a process from the whole to the part
Step 1 Check the key indicators from the view of the whole network If there is not any
ZTE Confidential Proprietary copy 2012 ZTE CORPORATION All rights reserved 12
UMTS KPI Optimization Analysis Guide Internal Use Only
problem just ignore them Otherwise try to locate the RNC NE that has the problem
Step 2 Analyze the indicators of the corresponding RNC to find out the RNC whose indicators have the problem
Step 3 Analyze the indicators of the cell under the problem RNC to find out the worst cells or TOP N cells If the indicators of all the cells under the RNC are tend to be low it is a common problem probably caused by parameter configuration And then check whether the radio parameter configuration in the cells under this RNC is the same as that in the cells under the normal RNCs
Step 4 Make a comprehensive analysis on the KPIs alarms DT test data and customer complains of the worst cells to find out a solution
Analysis method
After learning the KPI analysis ideas we must know some common KPI analysis methods to rule out causes of problems from the obvious ones to the hidden ones
For example we found that the TCP code words were strictly limited at eight sites near a park and the call drop rate rose suddenly How to solve this problem
Method one First we checked whether the alarms transmission and boards of these sites were normal After they are proved all normal we sent some engineers to the site to do test And meanwhile we traced the RNC signaling at the OMC It turned out that the test result was normal and the indicators of these sites of that day did not have any problem and code words were not limited And later we knew from the news that there was a big gathering of about one million people at the park at that moment Until then we came to know that the congestion was caused by too many users using the network at the same time
Method two First because the eight sites went worse all of a sudden it was unlikely that the problem lied in the hardware Then we checked whether the radio parameters had been modified the day before The result is no worksheet had been issued to modify those parameters and no alarm was found at those sites Therefore we excluded the possibility of hardware problem Then we checked the traffic trend graph of the last few days (over seven days) and found that the high call drop rate might be caused by high traffic The graph showed that traffic of each site rose suddenly on the day before Thus we came to the conclusion that this was an abnormal abrupt event which may have been caused by a gathering And later we were told that there was a big gathering at the park So we were assured the code words limitation and high call drop rate at the eight sites were caused by too many subscribers using the network at the same time
By comparing the two methods above we can find that although the first one (sending engineers to the site without the consideration of abnormal events) is commonly used it is inefficient and costs more resource The second method (analyzing the problem by the means of exclusion and association) is more efficient From this case we would like to emphasize that KPI analysis is a process of problem exclusion Using the comprehensive
ZTE Confidential Proprietary copy 2012 ZTE CORPORATION All rights reserved 13
UMTS KPI Optimization Analysis Guide Internal Use Only
methods (like Method One) at the first brush may be making a detour
minus Exclusion method Check the alarms on the OMC to learn about the state of the RNC NodeB BPC board and the transmission If there are obvious broken link in transmission or hardware problem the cause of the problem is easy to locate
minus Incident association If the problem is with a great number of sites take abrupt incidents into account such as large-scale gathering terrible weather of incorrect operation These incidents will put influence of different levels and ranges on the network indicators
minus Comparison of radio parameters If some site goes wrong in a sudden check whether the radio parameter configuration of this site is consistent with that of other normal sites If not change it as that of the normal sites because the indicator decrease may be caused by an incorrect modification of radio parameters
minus Relevant indicators association If a certain indicator is in poor condition check its relevant indicators and find the common problem from these relevant indicators
minus Comprehensive problem location When the above reasons are excluded use DT data KPI data RNC signaling analysis data to locate the problem with indicators comprehensively
ZTE Confidential Proprietary copy 2012 ZTE CORPORATION All rights reserved 14
UMTS KPI Optimization Analysis Guide Internal Use Only
Figure 3-7 KPI optimization analysis process
StartPick out
performance indexes
RNC index abnormal
Equipment alarms exist
Deal with equipment alarms
RNC index recovers
Common problem with the
worst cells
Transmission softwarehardware version wireless
parameter configuration
CNRNC Transmission
Hardware Software Interference
Wireless parameters
Time range
Abrupt and self-curable abnormality
helliphellip
Analyze and record causes
Suggestion about improvement
Common problems analysis
Problem resolved
Successful call
Call drop Soft handover
23G alternate operation
PS rate helliphellip
Deal with the relevant problem
Indexes normal
End
Climate change holidays assembly
transmission interruption power
fault and so on
Y
N
Y
Y
N
Y
N
Abnormal indexes analysis in one cell
Y
N
N
N
Y
N
Y
Show TOPN abnormal cells
and their locations
If the problem is proved to be equipment bug or system problem after
several attempts feed it back to RampD dept
ZTE Confidential Proprietary copy 2012 ZTE CORPORATION All rights reserved 15
UMTS KPI Optimization Analysis Guide Internal Use Only
4 KPI Optimization Analysis This chapter mainly demonstrates how to analyze the indicator problems from the aspect of OMC data and provides flowcharts for KPI optimization The detailed analyzing method and cases of every special subject can be checked in the optimization guides of all the subjects
41 CS Call Drop Optimization
The CS call drop rate is the most important indicator in KPI optimization
411 Definition of Call Drop
After checking the signaling on the Uu interface at the UE side the engineer can judge the situation a call drop if the Uu interface message satisfies one of the following three conditions during the calling process (in connection)
RNC Release is not received but the UE condition changes from CELL_DCH to IDLE
RRC Release is received and the released cause value is Not Normal
One of the following three messages mdash CC Disconnect CC Release Complete and CC Release mdash is received and the released cause value is Not Normal Clearing or Not Normal Unspecified
In a board sense the call drop includes the call drop rates of CN and UTRAN The call drop of UTRAN includes the following two aspects
After the successful service establishment RNC sends the RAB Release Request to CN
After the successful service establishment RNC sends the IU Release Request to CN Later RNC receives the IU Release Command from CN
Note that RAN call drop statistics which is defined from the aspect of lu interface signaling means the launching times of RAB Release Request and lu Release Request of RNC And the DT call drop statistics is defined from the aspects of the Uu interface message non-access stratum message and cause value RAN call drop statistics and DT call drop statistics are not exactly the same
ZTE Confidential Proprietary copy 2012 ZTE CORPORATION All rights reserved 16
UMTS KPI Optimization Analysis Guide Internal Use Only
412 CS Call Drop Analysis Flowchart
Figure 4-8 CS call drop analysis flowchart
ZTE Confidential Proprietary copy 2012 ZTE CORPORATION All rights reserved 17
UMTS KPI Optimization Analysis Guide Internal Use Only
Extract performance data
CS TOP Ncell filtering
Analyze a single cell
1 Check NE alarms
2 Associate emergencies
3 Compare parameter
configurations
4 Associate indicators
5 Locate the fault
comprehensively
Exist or not
Handle alarms
Solved or not
Yes
Yes
End
No
No
Exist or not
Handle emergencies
Solved or not
Yes
No
No
Exist or not
Correct wrong parameter
configurations
Solved or not
Yes
No
No
List related indicator counters
Call-drop-related
countersRTWP
Handover success rate
Traffic volume
Resource limit indicators
Checkamp analysis of
interference
Optimizationanalysis of
handover failures
Optimization analysis of
resource limitCall-drop-
related counters
C301230362C301230363C301230365C301230315C301230316C301230318C301230319C301230322C301230323
Solved or not
Yes
Yes
No
Drive Test+RNC signaling
trace
Yes
ZTE Confidential Proprietary copy 2012 ZTE CORPORATION All rights reserved 18
UMTS KPI Optimization Analysis Guide Internal Use Only
42 PS Call Drop Optimization
421 Optimization Flowchart
Figure 4-9 PS call drop optimization flowchart
ZTE Confidential Proprietary copy 2012 ZTE CORPORATION All rights reserved 19
UMTS KPI Optimization Analysis Guide Internal Use Only
Extract performance data
PS TOP Ncell filtering
Analyze a single cell
1 Check NE alarms
2 Associate emergencies
3 Compare parameter
configurations
4 Associate indicators
5 Locate the fault
comprehensive ly
Exist or not
Handle alarms
Solved or not
Yes
Yes
End
No
No
Exist or not
Handle emergencies
Solved or not
Yes
No
No
Exist or not
Correct wrong parameter
configurations
Solved or not
Yes
No
No
List related indicator counters
Call -drop-related
countersRTWP
Handover success rate
Traffic volume
Resource limit indicators
Check amp analysis of interference
Optimizationanalysis of
handover failures
Optimization analysis of
resource limitCall -drop-
related counters
C301230372C301230373C301230375C301230330C301230332C301230333C301230334C301230337C301230338
Solved or not
Yes
Yes
No
Drive Test +RNC signaling
trace
Yes
ZTE Confidential Proprietary copy 2012 ZTE CORPORATION All rights reserved 20
UMTS KPI Optimization Analysis Guide Internal Use Only
43 Optimization of Accessibility Indicators
Accessibility performance includes the success rate of RRC connection setup and the success rate of CSPS RAB assignment These two kinds of KPIs play important roles in the network optimization and directly influence the success rate of CSPS service establishment In this document this kind of problems are found from the aspect of OMC data and solved through parameter optimization
431 Definition of Access Failure
For the mobile originated call in the CS domain the access failure event means that the UE sends RRC REQUEST and IE establish cause is Originating Conversational Call but alerting of the direct transfer message is not received
The relevant events are defined as follows in the access failure stage
RRC connection setup failure After considering the resending times and the waiting time the UE sends RRC CONNECTION REQUEST and does not receive the response from RNC or RRC CONNECTION REJECT delivered by RNC
Initial direct transfer and security mode establishment failure After sending RRC CONNECTION SETUP COMPLETE the UE does not send NAS SETUP
RAB assignment failure After receiving CALL PROCEEDING the UE does not receive RB SETUP delivered by RNC Or the UE replies with RB SETUP FAIL after receiving RB SETUP Or the UE receives DISCONNECT with the cause value not being Normal Release after receiving RB SETUP At this time the UE has not reported RB SETUP CMP
Failure after RAB assignment After the UE sends RB SETUP COMPLETE the originating UE receives DISCONNECTRELEASE from CN Or the UE waits CONNECT or ALERTING overtime and launches the Call Clearing process Or the UE becomes IDLE before receiving Alerting and starts to receive the system message
For the mobile terminated in the CS domain the access failure event means that the terminating UE receives the paging of paging type 1 and does not send RRC CONNECTION REQUEST with the cause value being Terminating Conversational Call Or the UE does not send the alerting of direct transfer message to CN after sending RRC CONNECTION REQUEST
The relevant events are defined as follows in the access failure stage
RRC connection setup failure After sending RRC CONNECTION REQUEST the UE does not receive the response from RNC or RRC CONNECTION REJECT delivered by RNC
Initial direct transfer and security mode establishment failure After sending RRC
ZTE Confidential Proprietary copy 2012 ZTE CORPORATION All rights reserved 21
UMTS KPI Optimization Analysis Guide Internal Use Only
CONNECTION SETUP COMPLETE the UE does not receive the SETUP direct transfer message Or the UE sends RELEASE COMPLETE Or the UE receives DISCONNECT from CN
RAB assignment failure The UE does not receive RB SETUP delivered by RNC after sending CALL CONFIRM Or the UE replies with RB SETUP FAIL after receiving RB SETUP Or the UE receives DISCONNECT with the cause value not being Normal Release after receiving RB SETUP At this time the UE has not reported RB SETUP CMP
Failure after RAB assignment After the UE sends RB SETUP COMPLETE the terminating UE receives DISCONNECTRELEASE from CN
432 Analysis on RRC Connection Failures
The problem of RRC connection setup failure can be analyzed through the UE signaling flow and RNC single-user tracing The RRC connection setup includes the following steps
The UE sends RRC Connection Request through the RACH channel
RNC sends RRC Connection Setup through the FACH channel
The UE sends RRC Connection Setup Complete through the dedicated uplink channel after the downlink dedicated channel is established and synchronized
RRC connection setup failures are always caused by following issues
Uplink RACH problem
Problem about downlink FACH power allocation proportion
Parameter reselection problem of the cell
Low downlink dedicated initial transmitting power
Uplink initial power control problem
Congestion
Equipment malfunctions
Among these issues the problems of uplink RACH downlink FACH power allocation proportion parameter reselection of the cell and equipment malfunctions appear more frequently
ZTE Confidential Proprietary copy 2012 ZTE CORPORATION All rights reserved 22
UMTS KPI Optimization Analysis Guide Internal Use Only
4321 Analysis Flowchart of RRC Connection Setup Failures
Figure 4-10 Analysis flowchart of RRC connection setup failures
ZTE Confidential Proprietary copy 2012 ZTE CORPORATION All rights reserved 23
UMTS KPI Optimization Analysis Guide Internal Use Only
Extract performance data
TOP Ncell filtering
Analyze a single cell
1 Check NE alarms
2 Associate emergencies
3 Compare parameter
configurations
4 Associate indicators
5 Locate the fault
comprehensive ly
Exist or not
Handle alarms
Solved or not
Yes
Yes
End
No
No
Exist or not
Handle emergencies
Solved or not
Yes
No
No
Exist or not
Correct wrong parameter
configurations
Solved or not
Yes
No
No
List related indicator counters
Counters related to RRC setup
failuresRTWP
Resource limit
indicators
Checkamp analysis of interference
Optimization analysis of
resource limitCounters related
to RRC setup failures
C301480485C301480486C301480487C301480489C301480490C301480491C301481288C301481289C301481337C301481338C301481339C301481407C301481408
Solved or not
Yes
Yes
No
Drive Test+RNC signaling
trace
Yes
ZTE Confidential Proprietary copy 2012 ZTE CORPORATION All rights reserved 24
UMTS KPI Optimization Analysis Guide Internal Use Only
4322 UE sends RRC Connection Request but RNC does not receive it
If the EcIo of downlink CPICH is relatively low it is the problem of coverage
If the EcIo of downlink CPICH is not very low (for example the value is larger than -14 dB) Usually it is the problem of RACH and the following issues may cause the problem
minus The power of Preamble does not rise to a required value and the rising times of Preamble should be increased
minus The output power of UE is lower than the required value which is caused by poor UE performance In this case the UE should be changed
minus The NodeB equipment has a standing wave and the engineer should check whether NodeB has any SWR alarm
minus The radius of the cell is set improperly If the radius parameter of the cell is set too small the NodeB can not synchronize the UE beyond the range of the radius and the access fails This problem often happens in the places with large coverage such as the rural areas and the suburbs
4323 RNC delivers RRC Connection Reject after receiving RRC Setup Request
When RRC Connection Reject appears the engineer should check the specific reject cause value Usually there are two kinds of causes
The CPU load of RNC control plane board is too heavy and more boards should be added
DCH and FACH admission is rejected However this situation does not always happen
4324 UE does not receive RRC Connection Setup delivered by RNC
This problem may be caused by the following reasons
Poor coverage
Improper parameters of cell selection and reselection
Checking method The engineer should check the EcIo of CPICH If the value is lower than -12 dB (EcIo is -12 dB by default) and there is no cell of better quality in the monitor set the cause of this problem is poor coverage If there is better cell in the monitor set cell reselection may cause this problem
Poor coverage can be improved by coverage enhancement such as adding some sites to cover the places without signal coverage and adjusting the engineering parameters If the coverage can not be improved the engineer can enhance the FACH power according to
ZTE Confidential Proprietary copy 2012 ZTE CORPORATION All rights reserved 25
UMTS KPI Optimization Analysis Guide Internal Use Only
the PCPICH EcIo coverage of the current network For example if all the pilot EcIo values are larger than -12 dB in the coverage area the power proportion of the common channel should be configured on the basis of the situation that the EcIo value is larger than -12 dB And so the success rate of the idle UE assessment can be ensured
As for the access problem caused by cell selection and reselection the engineer can speed up the cell selection and reselection by adjusting the cell selection and reselection parameters and the problem of RRC connection setup failure caused by improper cell selection and reselection parameters can be solved
Note
The RRC Connection Setup message is borne by FACH RRC Connection Request sent by the UE is received by UTRAN at the preamble of PRACH and then it is sent from the RACH channel based on the current preamble power And the transmit power of preamble can rise all the time until the response is received (There is a limitation for the maximum number of preamble retransmissions) Therefore in the areas with poor coverage the RACH coverage and FACH coverage may become unbalanced and as a result UTRAN can receive RRC Connection Request sent by the UE but the UE can not receive RRC Connection Setup sent by RNC
4325 UE receives RRC Connection Setup and does not send RRC Setup Complete
If the downlink signal quality is normal this problem may be caused by the abnormal condition of the cell phone
Another reason of this problem may be the downlink synchronization failure caused by the low initial power of downlink dedicated channel You can solve this problem by adjusting the service downlink EbNo
4326 RNC does not receive RRC Setup Complete sent by UE
Because the uplink initial power control may increase the UE transmit power this kind of problem seldom appears If it appears the engineer can increase the Constant Value of the dedicated channel properly to raise the uplink DPCCH initial transmission power of the UE
At the same time this problem is also relevant with the uplink SIR initial target value configuration because this value may affect the uplink initial synchronization at the initial stage of link setup If the value of the parameter is set too large there will be too much uplink inference brought by the initial setup of the link If the value is set too small the uplink synchronization will take longer time and the initial synchronization may even fail This parameter is an RNC-level parameter which has a great influence on network performance Therefore the engineer should be cautious while adjusting this parameter
ZTE Confidential Proprietary copy 2012 ZTE CORPORATION All rights reserved 26
UMTS KPI Optimization Analysis Guide Internal Use Only
Note
RRC Connection Setup Complete is sent through uplink DPCH and the UE calculates the initial power of uplink DPCCH according to the received IErdquoDPCCH_Power_offsetrdquo and the measured CPICH_RSCP value
DPCCH_Initial_power = DPCCH_Power_offset - CPICH_RSCP
DPCCH_Power_offset = Primary CPICH DL TX Power + UL Interference + Constant Value The Constant Value can be configured in the OMC If this value is set too small the UE may not have enough power to send RRC Connection Setup Complete
433 Analysis on RABRB Setup Failures
When RAB or RB setup fails RNC will send RAB Assignment Fail in the RAB Assignment Response signaling The engineer can find out the specific failure reason from the failure cause value carried in relevant cells The reasons for common RABRB setup failures include
RNC directly rejecting RAB Setup Request because of wrong parameter configuration
Admission reject
RAB setup failure because the UE fails to respond to RB Setup Request
RAB setup failure because the Uu interface fails to set up RB
ZTE Confidential Proprietary copy 2012 ZTE CORPORATION All rights reserved 27
UMTS KPI Optimization Analysis Guide Internal Use Only
4331 Analysis Flowchart of RAB Setup Failures
Figure 4-11 Analysis flowchart of RAB setup failures
ZTE Confidential Proprietary copy 2012 ZTE CORPORATION All rights reserved 28
UMTS KPI Optimization Analysis Guide Internal Use Only
Extract performance data
TOP Ncell filtering
Analyze a single cell
1 Check NE alarms
2 Associate emergencies
3 Compare parameter
configurations
4 Associate indicators
5 Locate the fault
comprehensively
Exist or not
Handle alarms
Solved or not
Yes
Yes
End
No
No
Exist or not
Handle emergencies
Solved or not
Yes
No
No
Exist or not
Correct wrong parameter
configurations
Solved or not
Yes
No
No
List related indicator counters
Counters related to RAB setup failures RTWP
Resource limit
indicators
Checkamp analysis of interference
Optimization analysis of
resource limitCounters related to RAB setup failures
CS domain PS domainC301230290 C301230302C301230291 C301230303C301230292 C301230304C301230293 C301230305C301230294 C301230306C301230295 C301230307C301230296 C301230308C301230297 C301230309C301230298 C301230310C301230299 C301230311C301230300 C301230312C301230301 C301230313
Solved or not
Yes
Yes
No
Drive Test+RNC signaling
trace
Yes
ZTE Confidential Proprietary copy 2012 ZTE CORPORATION All rights reserved 29
UMTS KPI Optimization Analysis Guide Internal Use Only
4332 RNC Directly Rejecting RAB Setup Request Because Of Wrong Parameter Configuration
The case that RNC responds with RAB Setup Failure directly is seldom caused by invalid parameter configuration in the business network Usually this case is caused by special operations of the special users
The main scenario is that the subscription information of the userrsquos PS service is beyond the capability of the UE which leads to the direct refusal from RNC For example a special userrsquos subscription rates of uplink and downlink are 384 K but the maximum uplink rate of the UE is only 64 K The maximum uplink and downlink rates of the QoS message used for activating PDP set by the AT command or mobile terminal software used by the user are 384 K so the RNC will find the maximum uplink rate is beyond the UErsquos capability directly reply with RAB Setup Failure and will not launch the RB setup process when it receives RAB Assignment Request
After the RAB setup fails because the parameter configuration is beyond the UErsquos capability SGSN will negotiate again to launch the new RAB assignment until the UE has the capability to support the assignment and the RAB assignment is finished For the users the PDP activation is still successful and the actual maximum rate is the maximum rate the UE can support
However if the minimum guaranteed bit rate required by the QoS setting in the UErsquos PDP activation request is beyond the UErsquos capability though the network negotiates a lower rate to accept the UErsquos PDP activation request the UE will launch the request of deactivating PDP when it finds that the rate negotiated by the network in PDP activation accept request is lower than the minimum guaranteed bit rate and finally the PDP activation can not be completed
4333 Admission Reject
For the non-HSDPA user if there are insufficient system resources (including power channel code lub transmission resource and CE) the call establishment failure will be caused by the admission reject At this time it is necessary to check the network load code resource lub transmission resource and CE resource occupation to make sure the congestion is caused by the limitation of a certain kind of resource What is more the engineer should plan the corresponding expansion method
If the cell does not support the HSDPA service the R99 user admission is judged according to the fixed R99 admission threshold If the cell supports the HSDPA service and the HSDPA and R99 dynamic power is allocated the uplink admission of non-HSDPA is judged based on RTWP or the equivalent user number If the uplink load is too heavy the non-HSDPA user admission will also fail
If the bandwidth configuration on the lub interface is insufficient the lub interface will reject the R99 data service activation because of limited bandwidth
ZTE Confidential Proprietary copy 2012 ZTE CORPORATION All rights reserved 30
UMTS KPI Optimization Analysis Guide Internal Use Only
The admission control of the NodeB Credit resource is similar to the power admission control Whether the remaining Credit can support the currently requested service or not can be judged according to the spectrum spreading factor of the new access user According to the condition of the RAB Downsizing Switch RNC will deal with the issue in the corresponding way
For the HSDPA user in the dynamic power allocation mode besides the mentioned system resources such as the power channel code lub transmission resource and CE the admission reject should take into consideration whether the number of H users supported by NodeB and the number of H users supported by the cell are over the regulated threshold or not into consideration
For the HSDPA user when the bandwidth configuration on lub interface is insufficient the admission reject will not happen but the rate will be reduced What is more the AAL2PATHs of HSDPA and R99 are configured respectively and the HSDPA AAL2PATH must be configured to the HSDPA_RT or HSDPA_NRT type If the HSDPA AAL2PATH is configured to RT or NRT of R99 AAL2PATH type the RAB assignment failure will not happen but RNC will establish the HSDPA service as R99 384 Kbps
For the downlink power admission
Besides whether the R99 service load is over the non-HSDPA service threshold DCH service should take into consideration whether non-HSDPA power and HSDPA GBP (the minimum power needed for the guaranteed bit rate) are over the general power threshold of the cell
For the HSDPA service it is necessary to check whether the throughput rate provided by the cell is over the sum of all the usersrsquo GBR thresholds or whether the GBPs of the stream service and the background service are over the HSDPA power of the cell At the same time whether the non-HSDPA power and the HSDPA GBP (the minimum power needed for the guaranteed bit rate) are over the overall power threshold of the cell should be also taken into consideration
For the lub admission
For the DCH service the admission is made according to the multiplication of the peak rate and the service activation factor
For HSDPA service the admission is made according to the GBR
If the lub exceeds the congestion threshold the DCCC rate reduction will be triggered And if the RLC_AM retransmission rate is over a certain threshold the Iub Overbooking switch can be opened to trigger the TF which limits R99 or to reduce the rate of HSDPA service by a certain factor
ZTE Confidential Proprietary copy 2012 ZTE CORPORATION All rights reserved 31
UMTS KPI Optimization Analysis Guide Internal Use Only
4334 RAB Setup Failure Because the UE Fails to Respond to RB Setup
The UE fails to respond to RB setup mainly because of the userrsquos operation
Take the following cases as examples
When the user already has had the downlink 12 K data service he receives RB Setup Request of the VP service (either the originated call in the VP domain or the terminated call in the VP domain) Because the UE does not support the VP and high-speed PS service in the downlink at the same time it directly replies with RB Setup Failure and the cause value is unsupported configuration
Compared with the WCDMA subscriber originating the VP service the terminating subscriber resides in the GSM network and so it does not support the VP service After RNC receives RAB Assignment Request the core network will deliver the Disconnect command right after call proceeding and the cause value is Bearer capability not authorized At this time the UE has just received the RB SETUP command and has no enough time to finish the RB setup So the UE will reply with RB Setup Failure after it receives the Disconnect command and the RNC will reply with RAB Setup Failure with the cause value being failure in radio interface procedure
4335 RAB Setup Failure Because the Uu Interface Fails to Set Up RB
RNC sends the Radio Bearer Setup command to the UE but fails to receive Radio Bearer Setup Compete This kind of situation (RB setup failure) often appears in the cells with weak signals There are two causes of weak signals one is that the UE does not reside in the best server to launch the access and the other is poor coverage
If the UE does not reside in the best server to launch the access it will hope to enter the best server through active set update in the RB setup process (At the same time the fast signal change will drastically weaken the signals in the cell) but the active set update can only be processed after the RB setup is completed because the procedures can not be processed alternately (Neither the network nor the terminal supports it) Therefore RB can only be set up in the cell with weak signals and the setup is easy to fail As for this situation the starting threshold and speed of co-frequency cell reselection should be increased to make the UE reside in the best server and launch the access as soon as possible
RB setup failure may be caused by the poor downlinkuplink coverage If the failure is caused by downlink coverage the UE can not receive the Radio Bearer Setup command which may be caused by the uplink interference and this can be fixed through checking RTWP The poor downlink coverage is partly caused by the bad UE demodulation performance and other causes should be solved by RF optimization
ZTE Confidential Proprietary copy 2012 ZTE CORPORATION All rights reserved 32
UMTS KPI Optimization Analysis Guide Internal Use Only
44 Optimization of Mobility Indicators
Mobility indicators mainly fall into three categories mdash soft handovers hard handovers and inter-RAT handovers The handover problems usually happen in the following cases
The best server changes too fast or there is no best server due to pilot pollution
The handover is not prompt or there are pingpong handovers due to improper parameter configuration
Adjust the engineering parameters for antennas in areas with severe pilot pollution And adjust the handover parameters such as the values of 1A 1B CIO TTT (time to trigger) Hysteresis and so on to solve the problem that the handover is not prompt or there are pingpong handovers This section tries to solve this kind of problems through OMC data analysis and parameter optimization
441 Optimization of Soft Handovers
Missed neighboring cell configuration pilot pollution improper soft handover parameter configuration and equipment malfunctions are the major causes of soft handover failures To confirm the problems the field DTs are required
ZTE Confidential Proprietary copy 2012 ZTE CORPORATION All rights reserved 33
UMTS KPI Optimization Analysis Guide Internal Use Only
4411 Soft Handover Optimization Flowchart
Figure 4-12 Soft handover optimization flowchart
ZTE Confidential Proprietary copy 2012 ZTE CORPORATION All rights reserved 34
UMTS KPI Optimization Analysis Guide Internal Use Only
Extract performance data
TOP Ncell filtering
Analyze a single cell
1 Check NE alarms
2 Associate emergencies
3 Compare parameter
configurations
4 Associate indicators
5 Locate the fault
comprehensive ly
Exist or not
Handle alarms
Solved or not
Yes
Yes
End
No
No
Exist or not
Handle emergencies
Solved or not
Yes
No
No
Exist or not
Correct wrong parameter
configurations
Solved or not
Yes
No
No
List related indicator counters
RTWPResource
limit indicators
Checkamp analysis of interference
Optimization analysis of
resource limitCounters related to intra-frequency
handover failures
C301391101 C301390593C301391102 C301390594C301391103 C301390595C301390586 C301390596C301390587 C301390597C301390588 C301390598C301390589 C301390599C301390590 C301390600C301390591 C301390601C301390592 C301390602
Solved or not
Yes
Yes
No
Drive Test+RNC signaling
trace
Yes
Counters related to soft handover
failures
30055 3005630057 3005830059 3006030061 30062
Cell hand-inhand-out indicators
ZTE Confidential Proprietary copy 2012 ZTE CORPORATION All rights reserved 35
UMTS KPI Optimization Analysis Guide Internal Use Only
4412 Checking Missed Neighboring Cell Configuration
Generally speaking most of the call drops at the beginning of the optimization are caused by missed neighboring cell configuration The following methods are often used to judge whether the call drops are caused by missed configuration of co-frequency neighboring cells
Observe the active set EcIo information recorded by the UE and the Best Server EcIo information recorded by the Scanner before the call drop If the former record is very bad but the latter record is very good then check whether the Best Server scrambling code recorded by the Scanner appears in the latest list of the neighboring cells under intra-frequency measurement control If it does not then the call drop is caused by missed neighboring cell configuration
If the UE re-accesses immediately after the call drop and the cell scrambling codes during the UE reaccess and those during the call drop are different then the call drop may also be caused by missed neighboring cell configuration You can confirm it through measurement control (look backwards from the message of the call drop event for the latest intra-frequency measurement control message and check the neighboring cell list of this message)
Some UE may report the Detected Set information If the corresponding scrambling code appears in the Detected Set information before the call drop then the call drop is caused by missed neighboring cell configuration
4413 Checking Pilot Pollution
Definition of pilot pollution Excessive strong pilot signals exist at a certain point but none of them is strong enough to be the best server To form pilot pollution the following points in this definition should be satisfied
Strong pilot signal The absolute pilot signal strength is used to judge whether the pilot signal is a strong one The pilot signal strength can be evaluated through the pilot RSCP If the pilot RSCP exceeds a threshold it is considered a strong pilot signal The formula is
AbsoluteRSCPThRSCPCPICH __ gt
Excessive The number of pilot signals is used to judge whether there are excessive pilot signals at a certain point If the number exceeds a threshold it is regarded that excessive pilot signals exist at this point The formula is
NThNumberCPICH gt_
None of them is strong enough to be the best server The relative strength of a pilot signal is a key factor in judging whether the pilot signal is strong enough Based on the above definition and formulae if the difference between the strength of the
ZTE Confidential Proprietary copy 2012 ZTE CORPORATION All rights reserved 36
UMTS KPI Optimization Analysis Guide Internal Use Only
strongest pilot signal and that of the )1( +NTh strongest pilot signal at this point is
less than a threshold it is regarded that there is no pilot signal strong enough to be the best server at this point The formula is
lativeRSCPthThbest ThRSCPCPICHRSCPCPICHN Re_)1( )__( ltminus +
According to the above description it is regarded that pilot pollution exists if the following conditions are both satisfied
The number of pilot signals that meet the condition
AbsoluteRSCPThRSCPCPICH __ gt is more than NTh
lativeRSCPthThbest ThRSCPCPICHRSCPCPICHN Re_)1( )__( ltminus +
For example during the network optimization suppose
dBmTh AbsoluteRSCP 95_ minus= 3=NTh and dBTh lativeRSCP 5Re_ = if the following
conditions are both satisfied then it is regarded that pilot pollution exists
The number of the pilot signals that meet the condition
dBmRSCPCPICH 95_ minusgt is more than 3
dBRSCPCPICHRSCPCPICH thbest 5)__( 4 ltminus
4414 Adjusting Soft Handover Algorithm Parameters
You can solve the following kinds of problems by adjusting handover algorithm parameters
1 The handover is not prompt
From the perspective of the CS service signaling flow the symptom of this problem is that the UE cannot receive Active Set Update (physical channel reallocation in the case of the intra-frequency hard handover) because after the UE reports the measurement report the source cell has a fast reduction in EcIo When the RNC sends Active Set Update the UE has closed the transmitter due to the loss of downlink synchronization Viewed from the UE side it cannot receive Active Set Update In the PS services if the UE cannot receive Active Set Update or TRB resets before the handover the handover will also fail
From the perspective of signals the following phenomena may accompany this problem
ZTE Confidential Proprietary copy 2012 ZTE CORPORATION All rights reserved 37
UMTS KPI Optimization Analysis Guide Internal Use Only
minus Corner effect EcIo of the source cell decreases drastically and EcIo of the target cell increases sharply (very high when it appears)
minus Fast fading EcIo of the source cell decreases quickly for a while and then increases and EcIo of the target cell increases for a short while
2 Pingpong handovers The following phenomena may accompany this problem
The best server changes quickly Two or more cells take turns to be the best server But as the best server none of the cells can last long though they has good RSCPs and EcIos
There is no best server There are multiple cells Their RSCPs are normal and similar to each other But EcIo of every cell is very bad
From the perspective of the signaling flow Event 1A is reported immediately after one cell is deleted Because the UE cannot receive Active Set Update from the RNC the handover fails
4415 Equipment Malfunctions
First check the alarm console to see whether there are abnormal alarms and analyze the message traces at the same time Find out in which step the soft handover fails Check the failure message and contact the local product maintaining engineer to confirm whether the equipment has malfunctions
4416 Solutions
Corresponding adjustments should be taken for the confirmed problems
Handover failures caused by pilot pollution Adjust the engineering parameters of a certain antenna to set this antenna as the best server in this interfered location If the power of one of its sectors is reduced then Io of the pilot pollution area will decrease even if the powers of other pilots are not adjusted EcIo will also increase Thereby the EcIo differences with other scrambling codes in the active set will become larger and pilot pollution will be eliminated Through a lot of research ZTE has proved that the reduction in the pilot transmit power will not change cell capacity greatly If condition allows new base stations can be added to cover this area
Equipment malfunctions Consult the customer service engineers and ask them to help check whether there are alarms and whether the transport layer is abnormal If there are alarms coordinate with the customer service engineers and the engineering personnel to solve the problems
Call drops because the handovers are not prompt
ZTE Confidential Proprietary copy 2012 ZTE CORPORATION All rights reserved 38
UMTS KPI Optimization Analysis Guide Internal Use Only
minus Adjust the antenna to expand the handover zone
minus Configure the Event 1A handover parameters to make the handover easier to happen
minus Increase CIO to make the handover happen earlier in the target cell The sum of CIO and the actually measured value is used for judging the UE events including the UE intra-frequency handover CIO helps shift the cell border in the handover algorithm If CIO is configured with a larger value the handover will be easier to happen and there will be more UE in the soft-handover status but more resources will be occupied If CIO is configured with a smaller value the soft handover will be more difficult to happen and the receiving quality may be impaired A CIO of about 5dB is quite good for eliminating the fast fading and the corner effect but this configuration has some side effects such as the increase of handover proportion
Call drops caused by pingpong handovers Adjust the antenna to form a best server in its coverage zone or set the Event 1B handover parameters (increase the threshold of Event 1B the Event 1B hysteresis or the time to trigger Event 1B) to increase the difficulty in deleting the active set
442 Optimization of Hard Handovers
4421 Classification of Hard handovers
Hard handovers mainly fall into two classifications
Intra-frequency hard handovers The intra-frequency hard handover is triggered only when the intra-frequency softsofter handover cannot be performed and it is applicable to the following circumstances
minus Inter-RNC intra-frequency cell handovers when there is no Iur interface
minus Insufficient Iur interface resources though there is the Iur interface
minus Handovers controlled by the threshold of the PS service rate in the handover cell
The intra-frequency softsofter handovers can not be performed (intra-frequency hard handover should be triggered) in the following scenarios
minus When the intra-frequency handover happens the UE is using the transmit diversity in the active set cell but the target cell does not support the transmit diversity
minus The intra-frequency measurement report does not contain OFF and TM of the
ZTE Confidential Proprietary copy 2012 ZTE CORPORATION All rights reserved 39
UMTS KPI Optimization Analysis Guide Internal Use Only
target cell
minus When the intra-frequency handover happens between RNCs the Iur interface is unavailable
minus The UE performs the multiuser detection in the active set cell but the target cell does not support the multiuser detection
minus The target cell and the original cell belong to different classifications (The cells of R99 R5+R99 and R6+R5+R99 belong to the same classification while the cells of R5 and R6+R5 belong to another classification)
Inter-frequency hard handovers The inter-frequency hard handover means a UE connection is handed over from a cell of a UTRAN frequency to a cell of another frequency Many factors including the radio quality the load and the speed of the moving UE may trigger inter-frequency hard handovers
For example the radio quality triggers the inter-frequency hard handover in the following way
When the quality of the UE radio frequency becomes lower the inter-frequency measurement will be triggered and according to the measurement result the UE connection will be handed over to a better frequency
ZTE Confidential Proprietary copy 2012 ZTE CORPORATION All rights reserved 40
UMTS KPI Optimization Analysis Guide Internal Use Only
4422 Hard Handover Optimization Flowchart
Figure 4-13 Hard handover optimization flowchart
ZTE Confidential Proprietary copy 2012 ZTE CORPORATION All rights reserved 41
UMTS KPI Optimization Analysis Guide Internal Use Only
Extract performance data
TOP Ncell filtering
Analyze a single cell
1 Check NE alarms
2 Associate emergencies
3 Compare parameter
configurations
4 Associate indicators
5 Locate the fault
comprehensive ly
Exist or not
Handle alarms
Solved or not
Yes
Yes
End
No
Exist or not
Handle emergencies
Solved or not
YesNo
Exist or not
Correct wrong parameter
configurations
Solved or not
Yes
No
No
List related indicator counters
RTWPResource
limit indicators
Checkamp analysis of interference
Optimization analysis of
resource limit
Counters related to inter-frequency handover failures
C301110489 C301110516C301110499 C301110517C301110500 C301110518C301110501 C301110519C301110502 C301110520C301110503 C301110521C301110504 C301110522C301110505 C301110523
Solved or not
Yes
Yes
No
Drive Test+RNC signaling
trace
Yes
Counters related to hard handover
failures
30041 3004230043 3004430045 3004630047 30048
Cell hand-inhand-out indicators
NoNo
ZTE Confidential Proprietary copy 2012 ZTE CORPORATION All rights reserved 42
UMTS KPI Optimization Analysis Guide Internal Use Only
4423 Hard Handover Optimization Methods
The optimization flow for the hard handover is similar to that of the soft handover The major differences are in the parameter optimization To optimize intra-frequency hard handovers you can properly reduce the Event 1D hysteresis and the time to trigger Event 1D according to the real radio environment to ensure timely handovers
Inter-frequency coverage is often applied to some special scenarios such as indoor coverage and tested through CQT The method of judging whether there is missed configuration of the inter-frequency neighboring cell is almost the same as that of the co-frequency neighboring cell when a call drop occurs the UE fails to measure or report the inter-frequency neighboring cell after the call drop the UE resides in the inter-frequency neighboring cell again
The common hard handover problems are
1 The handover is not prompt The common symptoms are frequent call drops in the hard handovers when the UE moves
Solutions
Increase the threshold of activating the compressing mode The compressing mode is usually activated before the inter-frequency handover or the inter-RAT handover and it is used to measure the quality of the inter-frequency or inter-RAT cell You can set a threshold of the CPICH RSCP or EcIo to activate the compressing mode And the RSCP is widely used
minus Requirements on setting the threshold of activating the compressing mode Before the cell quality becomes low enough to cause a call drop the signal of the target cell should be measured and reported and the handover should be performed
minus Requirement on setting the threshold of deactivating the compression mode Frequent activationdeactivation of the compression mode should be avoided
Increase CIOs of the inter-frequency cell pair
Reduce the threshold of triggering the target frequency handover under the inter-frequency coverage
2 There are pingpong handovers
Solution Increase the hard handover hysteresis and the time to trigger the event
ZTE Confidential Proprietary copy 2012 ZTE CORPORATION All rights reserved 43
UMTS KPI Optimization Analysis Guide Internal Use Only
443 Optimization of Inter-RAT Handovers
4431 Configuring Basic Inter-RAT Parameters
Most of the inter-RAT handover failures are caused by incomplete parameter configuration The following parameters need special attention
Complete RNC parameter configuration for the GSM neighboring cell The 2G system shall provide the 3G system with the correct radio parameters based on negotiation mdash MCC MNC LAC ID (CI) NCC BCC frequency band indicator (900 or 1800) and BCCH
Table 4-3 Parameters That 2G Shall Provide to 3G
MCC MNC LACIDCI
NCC BCCFrequency
band indicator
BCCH
460 2 202 193 0 0 900 102
Complete GSM BSC parameter configuration for the WCDMA neighboring cell The 3G system shall provide the 2G system with the correct radio parameters based on negotiation mdash MCC MNC LAC RNC ID cell ID (C_ID) downlink frequency scrambling code and RAC
Table 4-4 Parameters That 3G Shall Provide to 2G
MCC MNC LACRNC
IDCell IDC_ID
Downlink frequency
Scrambling code
RAC
460 3 20 18 51 10787 51 20
According to the current strategy of one-way inter-RAT handovers if the parameter configuration is complete one probable cause of the inter-RAT handover failure is that the handover is not prompt The common parameter adjustment is to increase CIO the threshold to activatedeactivate the compressing mode and the threshold to trigger the WCDMA-to-GSM handover at the same time
Call drops during the inter-RAT handovers between WCDMA and GSM may be caused by
minus Inconsistent data configuration at the GSM side and the WCDMA side after GSM modifies the configuration data but does not inform WCDMA
minus Missed configuration of neighboring cells which can be solved by the correct configuration of neighboring cells
minus Too fast signal changes
ZTE Confidential Proprietary copy 2012 ZTE CORPORATION All rights reserved 44
UMTS KPI Optimization Analysis Guide Internal Use Only
minus Pingpong reselection
minus Faults with the UE for example the UE fails to respond to the handover or report the inter-RAT measurement report
minus Changes of the best server during the physical channel reallocation
minus Wrong LAC configuration which can be located through data configuration check
ZTE Confidential Proprietary copy 2012 ZTE CORPORATION All rights reserved 45
UMTS KPI Optimization Analysis Guide Internal Use Only
4432 Inter-RAT Handover Optimization Flowchart
Figure 4-14 Inter-RAT handover optimization flowchart
ZTE Confidential Proprietary copy 2012 ZTE CORPORATION All rights reserved 46
UMTS KPI Optimization Analysis Guide Internal Use Only
Extract performance data
TOP Ncell filtering
Analyze a single cell
1 Check NE alarms
2 Associate emergencies
3 Compare parameter
configurations
4 Associate indicators
5 Locate the fault
comprehensive ly
Exist or not
Handle alarms
Solved or not
Yes
Yes
End
No
No
Exist or not
Handle emergencies
Solved or not
Yes
No
No
Exist or not
Correct wrong parameter
configurations
Solved or not
Yes
No
No
List related indicator counters
RTWPResource
limit indicators
Checkamp analysis of interference
Optimization analysis of
resource limitCounters related to inter-RAT handover failures
C301130667 C301130681C301130668 C301130682C301130669 C301130690C301130670 C301130691C301130671 C301130692C301130672 C301130693C301130673 C301130694C301130674 C301130696C301130675 C301130697C301130677 C301130698C301130678 C301130699C301130679 C301130700
C301130680
Solved or not
Yes
Yes
No
Drive Test+RNC signaling
trace
Yes
Counters related to inter-RAT handover
failures
Cell hand-inhand-out indicators
30049 3005030051 3005230053 30054
ZTE Confidential Proprietary copy 2012 ZTE CORPORATION All rights reserved 47
UMTS KPI Optimization Analysis Guide Internal Use Only
45 Optimization of Resource Indicators
The resource indicators directly reflect the system capacity Increasing subscribers will consume more system resources and some resources may be limited for example the code resource may be limited the TCP access request may be rejected and the CE resource usage rate may exceed the threshold Limited system resources have a negative influence on the whole-network indicators and the subscribersrsquo perception for example call drops may frequently happen and more TCP access requests may be rejected during the voice services
Table 4-5 Resource KPIs and Alarm Thresholds
Resource type KPI No and nameAlarm
threshold
TCP
C301320150 Number of rejected services DCH downlink TCP limit
50
PI30167 Average non-HS (SOA) (SOA)DPA TCP 40
PI30092 Maximum Cell TCP () 100
PI30093 Average Cell TCP 70
UL TrafficPI30029 Handover Blocking Rate 05
KPI RTWP (in busy hour) -98 dBm
Code
C301320153 Number of rejected services DCH no code
50
PI30205 Average Cell HSUPA Users 12
PI30172 Cell Average HSDPA Users 16
CE
PI301830006 Maximum use Ratio of Uplink NodeB CE
60
PI301830010 Maximum use Ratio of Downlink NodeB CE
60
ZTE Confidential Proprietary copy 2012 ZTE CORPORATION All rights reserved 48
UMTS KPI Optimization Analysis Guide Internal Use Only
451 Resource Indicator Optimization Flowchart
Figure 4-15 Resource indicator optimization flowchart
ZTE Confidential Proprietary copy 2012 ZTE CORPORATION All rights reserved 49
UMTS KPI Optimization Analysis Guide Internal Use Only
Extract performance data
TOP Ncell filtering
Analyze a single cell
1 Check NE alarms
2 Associate emergencies
3 Compare parameter
configurations
4 Associate indicators
5 Locate the fault
comprehensive ly
Exist or not
Handle alarms
Solved or not
Yes
是
End
No
No
Exist or not
Handle emergencies
Solved or not
Yes
No
No
Exist or not
Correct wrong parameter
configurations
Solved or not
Yes
No
No
List related indicator counters
Code resource indicators
CE resource indicators
TCPadmission
reject counter
C301320150
Solved or not
Yes
Yes
No
Drive Test+RNC signaling
trace
Yes
Counter related to TCP limit
Cell TX power
indicators
30090 3009130092 3009330166 3016730168 3016930170 30171
30163301643016530075
30223302243045030451
Yes
Yes
ZTE Confidential Proprietary copy 2012 ZTE CORPORATION All rights reserved 50
UMTS KPI Optimization Analysis Guide Internal Use Only
452 Code Resource Optimization
The statistics of Number of rejected services and DCH no code the average code resource usage rate and the number of the HSDPA subscribers can be used to judge whether the code resource in a cell is limited If the code resource is limited you can adjust the code resource allocation to alleviate the situation
Based on the system algorithm when Formula 1 is satisfied you can add an HS-PDSCH when Formula 2 is satisfied then an HS-PDSCH is deleted
Formula 1 OcuRateNoHspdsch + OcuRateHspdsch + DpchCodeHy + 32 lt= 512
Formula 2 OcuRateNoHspdsch + OcuRateHspdsch + CodeUptHyA gt 512
OcuRateHspdschHSPDSCH means the number of the codes of SF=512 blocked by the HS-PDSCH OcuRateNoHspdsch means the number of codes of SF=512 blocked by other channels DpchCodeHy means the number of codes of SF=512 reserved for the DPCH and CodeUptHyA is the threshold to decide whether to delete the HSPDSCH
Therefore to ensure the access of the R99 subscribers you can make some adjustment according to Table 4-6 when the code resource is limited though the HSDPA rate may decrease
Table 4-6 Adjusting Code Resource Allocation
AbbreviationParameter
nameRange
and stepCurrent value
Update value
Remark
DpchCodeHy DPCH Code Hysteresis
0512 16 28
To decrease the number of rejected services for DCH no code
CodeUptHyACode Update Hysteresis A
0512 16 28
To decrease the number of rejected services for DCH no code
453 Monitoring CE Resource
The CE resource is mainly monitored through the maximum UE uplinkdownlink usage rate If there is any problem you can solve it by controlling the load or adding more boards
ZTE Confidential Proprietary copy 2012 ZTE CORPORATION All rights reserved 51
UMTS KPI Optimization Analysis Guide Internal Use Only
454 Optimization of Power Control
4541 Monitoring and Optimizing Downlink Power Control
Limited TCP in busy hours will not only increase access failures and call drops in the local cell but also increase soft handover failures and call drops in the neighboring cells Number of rejected services and DCH downlink TCP limit are intuitive KPIs to judge whether TCP is limited Although limited uplink capacity and massive UE moves in the rush hours may also cause call drops the limited TCP is absolutely a key factor
Based on the system algorithm MinHsdpaPower (MinHspaPwrRto) + NoHsPower gtNode B if the safety threshold is used (MinHsdpaPower means the power reserved for HSPA) then it will activate the downlink rate downgrade algorithm flow for the congestion (lower the downlink DCH rate) Although the rate downgrade can ensure access of some subscribers it is an irregular action and will degrade the performance
455 Speeding up Rate Downgrade
Considering that the cells with heavy load reject more access requests you can speed up the rate downgrade during the resource congestion to release the resources as soon as possible and avoid call drops caused by access failures (this method is only applicable to the cells with many PS service users but not those with only CS service users) Table 4-7 is an example of the parameter modification for the rate downgrade
Table 4-7 Example of Parameter Modification for Rate Downgrade
Abbreviation Parameter nameRange and
stepCurrent value
Update value
Remark
UlDnMaxStg Maximum Number of Degraded Uplink Load Steps Every Time
[1 8] 1 2 Downgrade from 384 Kbps to 16 Kbps
DlDnMaxStg Maximum Number of Degraded Downlink Load Steps Every Time
[1 8] 1 3 Downgrade from 384 Kbps to 8 Kbps
456 Monitoring and Optimizing Uplink Capacity
Handover Blocking Rate and RTWP can reflect the uplink capacity of the cell Because interference may also increase RTWP this factor should be distinguished during the RTWP monitoring Another effective indicator is the voice service erl If a cell has over 20 erls in busy hours you should pay special attention to it
ZTE Confidential Proprietary copy 2012 ZTE CORPORATION All rights reserved 52
UMTS KPI Optimization Analysis Guide Internal Use Only
457 Optimization of Uplink Capacity at the Whole Network Level
Case The uplink capacity was limited in a large number of sites after the cutover and the symptoms are a sharp rise of RTWP and a high call drop rate during the rush hours
After the following parameters were modified as shown in Table 4-8 the problem was solved
Table 4-8 Example of Power Control Parameter Modification
AbbreviationParameter
nameRange
Current value
Update value
ULINITSIRUplink Initial SIR target (dB)
UL 34 K136 K signaling UL 122 K AMR
4-5 35
ULMAXSIRMaximum Uplink SIR target (dB)
UL 34 K136 K signaling UL 122 K AMR
15 10
UlSirTargDnStepUplink SIR Target Down Step Size (dB)
UL 34 K136 K signaling UL 122 K AMR
01 02
458 Optimization of Uplink Capacity for a Single Cell
A lot of optimization measures can be taken to bring down the rising RTWP However with increasing subscribers the capacity may still be limited in some area while further modification of SirTarget will obviously degrade the call quality of the whole network and undermine the subscribersrsquo perception In this case you can adjust the power control parameters for a single site that has heavy traffic in the following way add one set of DivPc parameters and use this set of parameters only for this site
Case Table 4-9 shows an example of the power control parameter modification After this modification the call drop rate in the site with heavy traffic decreased to one quarter of the original one
Table 4-9 Example of Power Control Parameter Modification for Heavy-Traffic Cell
SRVTYPE ULINITSIR ULMAXSIR ULMINSIR
0 35-gt15 100-gt35 20-gt10
104 40-gt20 150-gt50 05-gt0
28 35-gt15 100-gt35 05-gt0
50 60-gt20 150-gt50 20-gt0
54 60-gt20 150-gt50 20-gt0
ZTE Confidential Proprietary copy 2012 ZTE CORPORATION All rights reserved 53
UMTS KPI Optimization Analysis Guide Internal Use Only
methods (like Method One) at the first brush may be making a detour
minus Exclusion method Check the alarms on the OMC to learn about the state of the RNC NodeB BPC board and the transmission If there are obvious broken link in transmission or hardware problem the cause of the problem is easy to locate
minus Incident association If the problem is with a great number of sites take abrupt incidents into account such as large-scale gathering terrible weather of incorrect operation These incidents will put influence of different levels and ranges on the network indicators
minus Comparison of radio parameters If some site goes wrong in a sudden check whether the radio parameter configuration of this site is consistent with that of other normal sites If not change it as that of the normal sites because the indicator decrease may be caused by an incorrect modification of radio parameters
minus Relevant indicators association If a certain indicator is in poor condition check its relevant indicators and find the common problem from these relevant indicators
minus Comprehensive problem location When the above reasons are excluded use DT data KPI data RNC signaling analysis data to locate the problem with indicators comprehensively
ZTE Confidential Proprietary copy 2012 ZTE CORPORATION All rights reserved 14
UMTS KPI Optimization Analysis Guide Internal Use Only
Figure 3-7 KPI optimization analysis process
StartPick out
performance indexes
RNC index abnormal
Equipment alarms exist
Deal with equipment alarms
RNC index recovers
Common problem with the
worst cells
Transmission softwarehardware version wireless
parameter configuration
CNRNC Transmission
Hardware Software Interference
Wireless parameters
Time range
Abrupt and self-curable abnormality
helliphellip
Analyze and record causes
Suggestion about improvement
Common problems analysis
Problem resolved
Successful call
Call drop Soft handover
23G alternate operation
PS rate helliphellip
Deal with the relevant problem
Indexes normal
End
Climate change holidays assembly
transmission interruption power
fault and so on
Y
N
Y
Y
N
Y
N
Abnormal indexes analysis in one cell
Y
N
N
N
Y
N
Y
Show TOPN abnormal cells
and their locations
If the problem is proved to be equipment bug or system problem after
several attempts feed it back to RampD dept
ZTE Confidential Proprietary copy 2012 ZTE CORPORATION All rights reserved 15
UMTS KPI Optimization Analysis Guide Internal Use Only
4 KPI Optimization Analysis This chapter mainly demonstrates how to analyze the indicator problems from the aspect of OMC data and provides flowcharts for KPI optimization The detailed analyzing method and cases of every special subject can be checked in the optimization guides of all the subjects
41 CS Call Drop Optimization
The CS call drop rate is the most important indicator in KPI optimization
411 Definition of Call Drop
After checking the signaling on the Uu interface at the UE side the engineer can judge the situation a call drop if the Uu interface message satisfies one of the following three conditions during the calling process (in connection)
RNC Release is not received but the UE condition changes from CELL_DCH to IDLE
RRC Release is received and the released cause value is Not Normal
One of the following three messages mdash CC Disconnect CC Release Complete and CC Release mdash is received and the released cause value is Not Normal Clearing or Not Normal Unspecified
In a board sense the call drop includes the call drop rates of CN and UTRAN The call drop of UTRAN includes the following two aspects
After the successful service establishment RNC sends the RAB Release Request to CN
After the successful service establishment RNC sends the IU Release Request to CN Later RNC receives the IU Release Command from CN
Note that RAN call drop statistics which is defined from the aspect of lu interface signaling means the launching times of RAB Release Request and lu Release Request of RNC And the DT call drop statistics is defined from the aspects of the Uu interface message non-access stratum message and cause value RAN call drop statistics and DT call drop statistics are not exactly the same
ZTE Confidential Proprietary copy 2012 ZTE CORPORATION All rights reserved 16
UMTS KPI Optimization Analysis Guide Internal Use Only
412 CS Call Drop Analysis Flowchart
Figure 4-8 CS call drop analysis flowchart
ZTE Confidential Proprietary copy 2012 ZTE CORPORATION All rights reserved 17
UMTS KPI Optimization Analysis Guide Internal Use Only
Extract performance data
CS TOP Ncell filtering
Analyze a single cell
1 Check NE alarms
2 Associate emergencies
3 Compare parameter
configurations
4 Associate indicators
5 Locate the fault
comprehensively
Exist or not
Handle alarms
Solved or not
Yes
Yes
End
No
No
Exist or not
Handle emergencies
Solved or not
Yes
No
No
Exist or not
Correct wrong parameter
configurations
Solved or not
Yes
No
No
List related indicator counters
Call-drop-related
countersRTWP
Handover success rate
Traffic volume
Resource limit indicators
Checkamp analysis of
interference
Optimizationanalysis of
handover failures
Optimization analysis of
resource limitCall-drop-
related counters
C301230362C301230363C301230365C301230315C301230316C301230318C301230319C301230322C301230323
Solved or not
Yes
Yes
No
Drive Test+RNC signaling
trace
Yes
ZTE Confidential Proprietary copy 2012 ZTE CORPORATION All rights reserved 18
UMTS KPI Optimization Analysis Guide Internal Use Only
42 PS Call Drop Optimization
421 Optimization Flowchart
Figure 4-9 PS call drop optimization flowchart
ZTE Confidential Proprietary copy 2012 ZTE CORPORATION All rights reserved 19
UMTS KPI Optimization Analysis Guide Internal Use Only
Extract performance data
PS TOP Ncell filtering
Analyze a single cell
1 Check NE alarms
2 Associate emergencies
3 Compare parameter
configurations
4 Associate indicators
5 Locate the fault
comprehensive ly
Exist or not
Handle alarms
Solved or not
Yes
Yes
End
No
No
Exist or not
Handle emergencies
Solved or not
Yes
No
No
Exist or not
Correct wrong parameter
configurations
Solved or not
Yes
No
No
List related indicator counters
Call -drop-related
countersRTWP
Handover success rate
Traffic volume
Resource limit indicators
Check amp analysis of interference
Optimizationanalysis of
handover failures
Optimization analysis of
resource limitCall -drop-
related counters
C301230372C301230373C301230375C301230330C301230332C301230333C301230334C301230337C301230338
Solved or not
Yes
Yes
No
Drive Test +RNC signaling
trace
Yes
ZTE Confidential Proprietary copy 2012 ZTE CORPORATION All rights reserved 20
UMTS KPI Optimization Analysis Guide Internal Use Only
43 Optimization of Accessibility Indicators
Accessibility performance includes the success rate of RRC connection setup and the success rate of CSPS RAB assignment These two kinds of KPIs play important roles in the network optimization and directly influence the success rate of CSPS service establishment In this document this kind of problems are found from the aspect of OMC data and solved through parameter optimization
431 Definition of Access Failure
For the mobile originated call in the CS domain the access failure event means that the UE sends RRC REQUEST and IE establish cause is Originating Conversational Call but alerting of the direct transfer message is not received
The relevant events are defined as follows in the access failure stage
RRC connection setup failure After considering the resending times and the waiting time the UE sends RRC CONNECTION REQUEST and does not receive the response from RNC or RRC CONNECTION REJECT delivered by RNC
Initial direct transfer and security mode establishment failure After sending RRC CONNECTION SETUP COMPLETE the UE does not send NAS SETUP
RAB assignment failure After receiving CALL PROCEEDING the UE does not receive RB SETUP delivered by RNC Or the UE replies with RB SETUP FAIL after receiving RB SETUP Or the UE receives DISCONNECT with the cause value not being Normal Release after receiving RB SETUP At this time the UE has not reported RB SETUP CMP
Failure after RAB assignment After the UE sends RB SETUP COMPLETE the originating UE receives DISCONNECTRELEASE from CN Or the UE waits CONNECT or ALERTING overtime and launches the Call Clearing process Or the UE becomes IDLE before receiving Alerting and starts to receive the system message
For the mobile terminated in the CS domain the access failure event means that the terminating UE receives the paging of paging type 1 and does not send RRC CONNECTION REQUEST with the cause value being Terminating Conversational Call Or the UE does not send the alerting of direct transfer message to CN after sending RRC CONNECTION REQUEST
The relevant events are defined as follows in the access failure stage
RRC connection setup failure After sending RRC CONNECTION REQUEST the UE does not receive the response from RNC or RRC CONNECTION REJECT delivered by RNC
Initial direct transfer and security mode establishment failure After sending RRC
ZTE Confidential Proprietary copy 2012 ZTE CORPORATION All rights reserved 21
UMTS KPI Optimization Analysis Guide Internal Use Only
CONNECTION SETUP COMPLETE the UE does not receive the SETUP direct transfer message Or the UE sends RELEASE COMPLETE Or the UE receives DISCONNECT from CN
RAB assignment failure The UE does not receive RB SETUP delivered by RNC after sending CALL CONFIRM Or the UE replies with RB SETUP FAIL after receiving RB SETUP Or the UE receives DISCONNECT with the cause value not being Normal Release after receiving RB SETUP At this time the UE has not reported RB SETUP CMP
Failure after RAB assignment After the UE sends RB SETUP COMPLETE the terminating UE receives DISCONNECTRELEASE from CN
432 Analysis on RRC Connection Failures
The problem of RRC connection setup failure can be analyzed through the UE signaling flow and RNC single-user tracing The RRC connection setup includes the following steps
The UE sends RRC Connection Request through the RACH channel
RNC sends RRC Connection Setup through the FACH channel
The UE sends RRC Connection Setup Complete through the dedicated uplink channel after the downlink dedicated channel is established and synchronized
RRC connection setup failures are always caused by following issues
Uplink RACH problem
Problem about downlink FACH power allocation proportion
Parameter reselection problem of the cell
Low downlink dedicated initial transmitting power
Uplink initial power control problem
Congestion
Equipment malfunctions
Among these issues the problems of uplink RACH downlink FACH power allocation proportion parameter reselection of the cell and equipment malfunctions appear more frequently
ZTE Confidential Proprietary copy 2012 ZTE CORPORATION All rights reserved 22
UMTS KPI Optimization Analysis Guide Internal Use Only
4321 Analysis Flowchart of RRC Connection Setup Failures
Figure 4-10 Analysis flowchart of RRC connection setup failures
ZTE Confidential Proprietary copy 2012 ZTE CORPORATION All rights reserved 23
UMTS KPI Optimization Analysis Guide Internal Use Only
Extract performance data
TOP Ncell filtering
Analyze a single cell
1 Check NE alarms
2 Associate emergencies
3 Compare parameter
configurations
4 Associate indicators
5 Locate the fault
comprehensive ly
Exist or not
Handle alarms
Solved or not
Yes
Yes
End
No
No
Exist or not
Handle emergencies
Solved or not
Yes
No
No
Exist or not
Correct wrong parameter
configurations
Solved or not
Yes
No
No
List related indicator counters
Counters related to RRC setup
failuresRTWP
Resource limit
indicators
Checkamp analysis of interference
Optimization analysis of
resource limitCounters related
to RRC setup failures
C301480485C301480486C301480487C301480489C301480490C301480491C301481288C301481289C301481337C301481338C301481339C301481407C301481408
Solved or not
Yes
Yes
No
Drive Test+RNC signaling
trace
Yes
ZTE Confidential Proprietary copy 2012 ZTE CORPORATION All rights reserved 24
UMTS KPI Optimization Analysis Guide Internal Use Only
4322 UE sends RRC Connection Request but RNC does not receive it
If the EcIo of downlink CPICH is relatively low it is the problem of coverage
If the EcIo of downlink CPICH is not very low (for example the value is larger than -14 dB) Usually it is the problem of RACH and the following issues may cause the problem
minus The power of Preamble does not rise to a required value and the rising times of Preamble should be increased
minus The output power of UE is lower than the required value which is caused by poor UE performance In this case the UE should be changed
minus The NodeB equipment has a standing wave and the engineer should check whether NodeB has any SWR alarm
minus The radius of the cell is set improperly If the radius parameter of the cell is set too small the NodeB can not synchronize the UE beyond the range of the radius and the access fails This problem often happens in the places with large coverage such as the rural areas and the suburbs
4323 RNC delivers RRC Connection Reject after receiving RRC Setup Request
When RRC Connection Reject appears the engineer should check the specific reject cause value Usually there are two kinds of causes
The CPU load of RNC control plane board is too heavy and more boards should be added
DCH and FACH admission is rejected However this situation does not always happen
4324 UE does not receive RRC Connection Setup delivered by RNC
This problem may be caused by the following reasons
Poor coverage
Improper parameters of cell selection and reselection
Checking method The engineer should check the EcIo of CPICH If the value is lower than -12 dB (EcIo is -12 dB by default) and there is no cell of better quality in the monitor set the cause of this problem is poor coverage If there is better cell in the monitor set cell reselection may cause this problem
Poor coverage can be improved by coverage enhancement such as adding some sites to cover the places without signal coverage and adjusting the engineering parameters If the coverage can not be improved the engineer can enhance the FACH power according to
ZTE Confidential Proprietary copy 2012 ZTE CORPORATION All rights reserved 25
UMTS KPI Optimization Analysis Guide Internal Use Only
the PCPICH EcIo coverage of the current network For example if all the pilot EcIo values are larger than -12 dB in the coverage area the power proportion of the common channel should be configured on the basis of the situation that the EcIo value is larger than -12 dB And so the success rate of the idle UE assessment can be ensured
As for the access problem caused by cell selection and reselection the engineer can speed up the cell selection and reselection by adjusting the cell selection and reselection parameters and the problem of RRC connection setup failure caused by improper cell selection and reselection parameters can be solved
Note
The RRC Connection Setup message is borne by FACH RRC Connection Request sent by the UE is received by UTRAN at the preamble of PRACH and then it is sent from the RACH channel based on the current preamble power And the transmit power of preamble can rise all the time until the response is received (There is a limitation for the maximum number of preamble retransmissions) Therefore in the areas with poor coverage the RACH coverage and FACH coverage may become unbalanced and as a result UTRAN can receive RRC Connection Request sent by the UE but the UE can not receive RRC Connection Setup sent by RNC
4325 UE receives RRC Connection Setup and does not send RRC Setup Complete
If the downlink signal quality is normal this problem may be caused by the abnormal condition of the cell phone
Another reason of this problem may be the downlink synchronization failure caused by the low initial power of downlink dedicated channel You can solve this problem by adjusting the service downlink EbNo
4326 RNC does not receive RRC Setup Complete sent by UE
Because the uplink initial power control may increase the UE transmit power this kind of problem seldom appears If it appears the engineer can increase the Constant Value of the dedicated channel properly to raise the uplink DPCCH initial transmission power of the UE
At the same time this problem is also relevant with the uplink SIR initial target value configuration because this value may affect the uplink initial synchronization at the initial stage of link setup If the value of the parameter is set too large there will be too much uplink inference brought by the initial setup of the link If the value is set too small the uplink synchronization will take longer time and the initial synchronization may even fail This parameter is an RNC-level parameter which has a great influence on network performance Therefore the engineer should be cautious while adjusting this parameter
ZTE Confidential Proprietary copy 2012 ZTE CORPORATION All rights reserved 26
UMTS KPI Optimization Analysis Guide Internal Use Only
Note
RRC Connection Setup Complete is sent through uplink DPCH and the UE calculates the initial power of uplink DPCCH according to the received IErdquoDPCCH_Power_offsetrdquo and the measured CPICH_RSCP value
DPCCH_Initial_power = DPCCH_Power_offset - CPICH_RSCP
DPCCH_Power_offset = Primary CPICH DL TX Power + UL Interference + Constant Value The Constant Value can be configured in the OMC If this value is set too small the UE may not have enough power to send RRC Connection Setup Complete
433 Analysis on RABRB Setup Failures
When RAB or RB setup fails RNC will send RAB Assignment Fail in the RAB Assignment Response signaling The engineer can find out the specific failure reason from the failure cause value carried in relevant cells The reasons for common RABRB setup failures include
RNC directly rejecting RAB Setup Request because of wrong parameter configuration
Admission reject
RAB setup failure because the UE fails to respond to RB Setup Request
RAB setup failure because the Uu interface fails to set up RB
ZTE Confidential Proprietary copy 2012 ZTE CORPORATION All rights reserved 27
UMTS KPI Optimization Analysis Guide Internal Use Only
4331 Analysis Flowchart of RAB Setup Failures
Figure 4-11 Analysis flowchart of RAB setup failures
ZTE Confidential Proprietary copy 2012 ZTE CORPORATION All rights reserved 28
UMTS KPI Optimization Analysis Guide Internal Use Only
Extract performance data
TOP Ncell filtering
Analyze a single cell
1 Check NE alarms
2 Associate emergencies
3 Compare parameter
configurations
4 Associate indicators
5 Locate the fault
comprehensively
Exist or not
Handle alarms
Solved or not
Yes
Yes
End
No
No
Exist or not
Handle emergencies
Solved or not
Yes
No
No
Exist or not
Correct wrong parameter
configurations
Solved or not
Yes
No
No
List related indicator counters
Counters related to RAB setup failures RTWP
Resource limit
indicators
Checkamp analysis of interference
Optimization analysis of
resource limitCounters related to RAB setup failures
CS domain PS domainC301230290 C301230302C301230291 C301230303C301230292 C301230304C301230293 C301230305C301230294 C301230306C301230295 C301230307C301230296 C301230308C301230297 C301230309C301230298 C301230310C301230299 C301230311C301230300 C301230312C301230301 C301230313
Solved or not
Yes
Yes
No
Drive Test+RNC signaling
trace
Yes
ZTE Confidential Proprietary copy 2012 ZTE CORPORATION All rights reserved 29
UMTS KPI Optimization Analysis Guide Internal Use Only
4332 RNC Directly Rejecting RAB Setup Request Because Of Wrong Parameter Configuration
The case that RNC responds with RAB Setup Failure directly is seldom caused by invalid parameter configuration in the business network Usually this case is caused by special operations of the special users
The main scenario is that the subscription information of the userrsquos PS service is beyond the capability of the UE which leads to the direct refusal from RNC For example a special userrsquos subscription rates of uplink and downlink are 384 K but the maximum uplink rate of the UE is only 64 K The maximum uplink and downlink rates of the QoS message used for activating PDP set by the AT command or mobile terminal software used by the user are 384 K so the RNC will find the maximum uplink rate is beyond the UErsquos capability directly reply with RAB Setup Failure and will not launch the RB setup process when it receives RAB Assignment Request
After the RAB setup fails because the parameter configuration is beyond the UErsquos capability SGSN will negotiate again to launch the new RAB assignment until the UE has the capability to support the assignment and the RAB assignment is finished For the users the PDP activation is still successful and the actual maximum rate is the maximum rate the UE can support
However if the minimum guaranteed bit rate required by the QoS setting in the UErsquos PDP activation request is beyond the UErsquos capability though the network negotiates a lower rate to accept the UErsquos PDP activation request the UE will launch the request of deactivating PDP when it finds that the rate negotiated by the network in PDP activation accept request is lower than the minimum guaranteed bit rate and finally the PDP activation can not be completed
4333 Admission Reject
For the non-HSDPA user if there are insufficient system resources (including power channel code lub transmission resource and CE) the call establishment failure will be caused by the admission reject At this time it is necessary to check the network load code resource lub transmission resource and CE resource occupation to make sure the congestion is caused by the limitation of a certain kind of resource What is more the engineer should plan the corresponding expansion method
If the cell does not support the HSDPA service the R99 user admission is judged according to the fixed R99 admission threshold If the cell supports the HSDPA service and the HSDPA and R99 dynamic power is allocated the uplink admission of non-HSDPA is judged based on RTWP or the equivalent user number If the uplink load is too heavy the non-HSDPA user admission will also fail
If the bandwidth configuration on the lub interface is insufficient the lub interface will reject the R99 data service activation because of limited bandwidth
ZTE Confidential Proprietary copy 2012 ZTE CORPORATION All rights reserved 30
UMTS KPI Optimization Analysis Guide Internal Use Only
The admission control of the NodeB Credit resource is similar to the power admission control Whether the remaining Credit can support the currently requested service or not can be judged according to the spectrum spreading factor of the new access user According to the condition of the RAB Downsizing Switch RNC will deal with the issue in the corresponding way
For the HSDPA user in the dynamic power allocation mode besides the mentioned system resources such as the power channel code lub transmission resource and CE the admission reject should take into consideration whether the number of H users supported by NodeB and the number of H users supported by the cell are over the regulated threshold or not into consideration
For the HSDPA user when the bandwidth configuration on lub interface is insufficient the admission reject will not happen but the rate will be reduced What is more the AAL2PATHs of HSDPA and R99 are configured respectively and the HSDPA AAL2PATH must be configured to the HSDPA_RT or HSDPA_NRT type If the HSDPA AAL2PATH is configured to RT or NRT of R99 AAL2PATH type the RAB assignment failure will not happen but RNC will establish the HSDPA service as R99 384 Kbps
For the downlink power admission
Besides whether the R99 service load is over the non-HSDPA service threshold DCH service should take into consideration whether non-HSDPA power and HSDPA GBP (the minimum power needed for the guaranteed bit rate) are over the general power threshold of the cell
For the HSDPA service it is necessary to check whether the throughput rate provided by the cell is over the sum of all the usersrsquo GBR thresholds or whether the GBPs of the stream service and the background service are over the HSDPA power of the cell At the same time whether the non-HSDPA power and the HSDPA GBP (the minimum power needed for the guaranteed bit rate) are over the overall power threshold of the cell should be also taken into consideration
For the lub admission
For the DCH service the admission is made according to the multiplication of the peak rate and the service activation factor
For HSDPA service the admission is made according to the GBR
If the lub exceeds the congestion threshold the DCCC rate reduction will be triggered And if the RLC_AM retransmission rate is over a certain threshold the Iub Overbooking switch can be opened to trigger the TF which limits R99 or to reduce the rate of HSDPA service by a certain factor
ZTE Confidential Proprietary copy 2012 ZTE CORPORATION All rights reserved 31
UMTS KPI Optimization Analysis Guide Internal Use Only
4334 RAB Setup Failure Because the UE Fails to Respond to RB Setup
The UE fails to respond to RB setup mainly because of the userrsquos operation
Take the following cases as examples
When the user already has had the downlink 12 K data service he receives RB Setup Request of the VP service (either the originated call in the VP domain or the terminated call in the VP domain) Because the UE does not support the VP and high-speed PS service in the downlink at the same time it directly replies with RB Setup Failure and the cause value is unsupported configuration
Compared with the WCDMA subscriber originating the VP service the terminating subscriber resides in the GSM network and so it does not support the VP service After RNC receives RAB Assignment Request the core network will deliver the Disconnect command right after call proceeding and the cause value is Bearer capability not authorized At this time the UE has just received the RB SETUP command and has no enough time to finish the RB setup So the UE will reply with RB Setup Failure after it receives the Disconnect command and the RNC will reply with RAB Setup Failure with the cause value being failure in radio interface procedure
4335 RAB Setup Failure Because the Uu Interface Fails to Set Up RB
RNC sends the Radio Bearer Setup command to the UE but fails to receive Radio Bearer Setup Compete This kind of situation (RB setup failure) often appears in the cells with weak signals There are two causes of weak signals one is that the UE does not reside in the best server to launch the access and the other is poor coverage
If the UE does not reside in the best server to launch the access it will hope to enter the best server through active set update in the RB setup process (At the same time the fast signal change will drastically weaken the signals in the cell) but the active set update can only be processed after the RB setup is completed because the procedures can not be processed alternately (Neither the network nor the terminal supports it) Therefore RB can only be set up in the cell with weak signals and the setup is easy to fail As for this situation the starting threshold and speed of co-frequency cell reselection should be increased to make the UE reside in the best server and launch the access as soon as possible
RB setup failure may be caused by the poor downlinkuplink coverage If the failure is caused by downlink coverage the UE can not receive the Radio Bearer Setup command which may be caused by the uplink interference and this can be fixed through checking RTWP The poor downlink coverage is partly caused by the bad UE demodulation performance and other causes should be solved by RF optimization
ZTE Confidential Proprietary copy 2012 ZTE CORPORATION All rights reserved 32
UMTS KPI Optimization Analysis Guide Internal Use Only
44 Optimization of Mobility Indicators
Mobility indicators mainly fall into three categories mdash soft handovers hard handovers and inter-RAT handovers The handover problems usually happen in the following cases
The best server changes too fast or there is no best server due to pilot pollution
The handover is not prompt or there are pingpong handovers due to improper parameter configuration
Adjust the engineering parameters for antennas in areas with severe pilot pollution And adjust the handover parameters such as the values of 1A 1B CIO TTT (time to trigger) Hysteresis and so on to solve the problem that the handover is not prompt or there are pingpong handovers This section tries to solve this kind of problems through OMC data analysis and parameter optimization
441 Optimization of Soft Handovers
Missed neighboring cell configuration pilot pollution improper soft handover parameter configuration and equipment malfunctions are the major causes of soft handover failures To confirm the problems the field DTs are required
ZTE Confidential Proprietary copy 2012 ZTE CORPORATION All rights reserved 33
UMTS KPI Optimization Analysis Guide Internal Use Only
4411 Soft Handover Optimization Flowchart
Figure 4-12 Soft handover optimization flowchart
ZTE Confidential Proprietary copy 2012 ZTE CORPORATION All rights reserved 34
UMTS KPI Optimization Analysis Guide Internal Use Only
Extract performance data
TOP Ncell filtering
Analyze a single cell
1 Check NE alarms
2 Associate emergencies
3 Compare parameter
configurations
4 Associate indicators
5 Locate the fault
comprehensive ly
Exist or not
Handle alarms
Solved or not
Yes
Yes
End
No
No
Exist or not
Handle emergencies
Solved or not
Yes
No
No
Exist or not
Correct wrong parameter
configurations
Solved or not
Yes
No
No
List related indicator counters
RTWPResource
limit indicators
Checkamp analysis of interference
Optimization analysis of
resource limitCounters related to intra-frequency
handover failures
C301391101 C301390593C301391102 C301390594C301391103 C301390595C301390586 C301390596C301390587 C301390597C301390588 C301390598C301390589 C301390599C301390590 C301390600C301390591 C301390601C301390592 C301390602
Solved or not
Yes
Yes
No
Drive Test+RNC signaling
trace
Yes
Counters related to soft handover
failures
30055 3005630057 3005830059 3006030061 30062
Cell hand-inhand-out indicators
ZTE Confidential Proprietary copy 2012 ZTE CORPORATION All rights reserved 35
UMTS KPI Optimization Analysis Guide Internal Use Only
4412 Checking Missed Neighboring Cell Configuration
Generally speaking most of the call drops at the beginning of the optimization are caused by missed neighboring cell configuration The following methods are often used to judge whether the call drops are caused by missed configuration of co-frequency neighboring cells
Observe the active set EcIo information recorded by the UE and the Best Server EcIo information recorded by the Scanner before the call drop If the former record is very bad but the latter record is very good then check whether the Best Server scrambling code recorded by the Scanner appears in the latest list of the neighboring cells under intra-frequency measurement control If it does not then the call drop is caused by missed neighboring cell configuration
If the UE re-accesses immediately after the call drop and the cell scrambling codes during the UE reaccess and those during the call drop are different then the call drop may also be caused by missed neighboring cell configuration You can confirm it through measurement control (look backwards from the message of the call drop event for the latest intra-frequency measurement control message and check the neighboring cell list of this message)
Some UE may report the Detected Set information If the corresponding scrambling code appears in the Detected Set information before the call drop then the call drop is caused by missed neighboring cell configuration
4413 Checking Pilot Pollution
Definition of pilot pollution Excessive strong pilot signals exist at a certain point but none of them is strong enough to be the best server To form pilot pollution the following points in this definition should be satisfied
Strong pilot signal The absolute pilot signal strength is used to judge whether the pilot signal is a strong one The pilot signal strength can be evaluated through the pilot RSCP If the pilot RSCP exceeds a threshold it is considered a strong pilot signal The formula is
AbsoluteRSCPThRSCPCPICH __ gt
Excessive The number of pilot signals is used to judge whether there are excessive pilot signals at a certain point If the number exceeds a threshold it is regarded that excessive pilot signals exist at this point The formula is
NThNumberCPICH gt_
None of them is strong enough to be the best server The relative strength of a pilot signal is a key factor in judging whether the pilot signal is strong enough Based on the above definition and formulae if the difference between the strength of the
ZTE Confidential Proprietary copy 2012 ZTE CORPORATION All rights reserved 36
UMTS KPI Optimization Analysis Guide Internal Use Only
strongest pilot signal and that of the )1( +NTh strongest pilot signal at this point is
less than a threshold it is regarded that there is no pilot signal strong enough to be the best server at this point The formula is
lativeRSCPthThbest ThRSCPCPICHRSCPCPICHN Re_)1( )__( ltminus +
According to the above description it is regarded that pilot pollution exists if the following conditions are both satisfied
The number of pilot signals that meet the condition
AbsoluteRSCPThRSCPCPICH __ gt is more than NTh
lativeRSCPthThbest ThRSCPCPICHRSCPCPICHN Re_)1( )__( ltminus +
For example during the network optimization suppose
dBmTh AbsoluteRSCP 95_ minus= 3=NTh and dBTh lativeRSCP 5Re_ = if the following
conditions are both satisfied then it is regarded that pilot pollution exists
The number of the pilot signals that meet the condition
dBmRSCPCPICH 95_ minusgt is more than 3
dBRSCPCPICHRSCPCPICH thbest 5)__( 4 ltminus
4414 Adjusting Soft Handover Algorithm Parameters
You can solve the following kinds of problems by adjusting handover algorithm parameters
1 The handover is not prompt
From the perspective of the CS service signaling flow the symptom of this problem is that the UE cannot receive Active Set Update (physical channel reallocation in the case of the intra-frequency hard handover) because after the UE reports the measurement report the source cell has a fast reduction in EcIo When the RNC sends Active Set Update the UE has closed the transmitter due to the loss of downlink synchronization Viewed from the UE side it cannot receive Active Set Update In the PS services if the UE cannot receive Active Set Update or TRB resets before the handover the handover will also fail
From the perspective of signals the following phenomena may accompany this problem
ZTE Confidential Proprietary copy 2012 ZTE CORPORATION All rights reserved 37
UMTS KPI Optimization Analysis Guide Internal Use Only
minus Corner effect EcIo of the source cell decreases drastically and EcIo of the target cell increases sharply (very high when it appears)
minus Fast fading EcIo of the source cell decreases quickly for a while and then increases and EcIo of the target cell increases for a short while
2 Pingpong handovers The following phenomena may accompany this problem
The best server changes quickly Two or more cells take turns to be the best server But as the best server none of the cells can last long though they has good RSCPs and EcIos
There is no best server There are multiple cells Their RSCPs are normal and similar to each other But EcIo of every cell is very bad
From the perspective of the signaling flow Event 1A is reported immediately after one cell is deleted Because the UE cannot receive Active Set Update from the RNC the handover fails
4415 Equipment Malfunctions
First check the alarm console to see whether there are abnormal alarms and analyze the message traces at the same time Find out in which step the soft handover fails Check the failure message and contact the local product maintaining engineer to confirm whether the equipment has malfunctions
4416 Solutions
Corresponding adjustments should be taken for the confirmed problems
Handover failures caused by pilot pollution Adjust the engineering parameters of a certain antenna to set this antenna as the best server in this interfered location If the power of one of its sectors is reduced then Io of the pilot pollution area will decrease even if the powers of other pilots are not adjusted EcIo will also increase Thereby the EcIo differences with other scrambling codes in the active set will become larger and pilot pollution will be eliminated Through a lot of research ZTE has proved that the reduction in the pilot transmit power will not change cell capacity greatly If condition allows new base stations can be added to cover this area
Equipment malfunctions Consult the customer service engineers and ask them to help check whether there are alarms and whether the transport layer is abnormal If there are alarms coordinate with the customer service engineers and the engineering personnel to solve the problems
Call drops because the handovers are not prompt
ZTE Confidential Proprietary copy 2012 ZTE CORPORATION All rights reserved 38
UMTS KPI Optimization Analysis Guide Internal Use Only
minus Adjust the antenna to expand the handover zone
minus Configure the Event 1A handover parameters to make the handover easier to happen
minus Increase CIO to make the handover happen earlier in the target cell The sum of CIO and the actually measured value is used for judging the UE events including the UE intra-frequency handover CIO helps shift the cell border in the handover algorithm If CIO is configured with a larger value the handover will be easier to happen and there will be more UE in the soft-handover status but more resources will be occupied If CIO is configured with a smaller value the soft handover will be more difficult to happen and the receiving quality may be impaired A CIO of about 5dB is quite good for eliminating the fast fading and the corner effect but this configuration has some side effects such as the increase of handover proportion
Call drops caused by pingpong handovers Adjust the antenna to form a best server in its coverage zone or set the Event 1B handover parameters (increase the threshold of Event 1B the Event 1B hysteresis or the time to trigger Event 1B) to increase the difficulty in deleting the active set
442 Optimization of Hard Handovers
4421 Classification of Hard handovers
Hard handovers mainly fall into two classifications
Intra-frequency hard handovers The intra-frequency hard handover is triggered only when the intra-frequency softsofter handover cannot be performed and it is applicable to the following circumstances
minus Inter-RNC intra-frequency cell handovers when there is no Iur interface
minus Insufficient Iur interface resources though there is the Iur interface
minus Handovers controlled by the threshold of the PS service rate in the handover cell
The intra-frequency softsofter handovers can not be performed (intra-frequency hard handover should be triggered) in the following scenarios
minus When the intra-frequency handover happens the UE is using the transmit diversity in the active set cell but the target cell does not support the transmit diversity
minus The intra-frequency measurement report does not contain OFF and TM of the
ZTE Confidential Proprietary copy 2012 ZTE CORPORATION All rights reserved 39
UMTS KPI Optimization Analysis Guide Internal Use Only
target cell
minus When the intra-frequency handover happens between RNCs the Iur interface is unavailable
minus The UE performs the multiuser detection in the active set cell but the target cell does not support the multiuser detection
minus The target cell and the original cell belong to different classifications (The cells of R99 R5+R99 and R6+R5+R99 belong to the same classification while the cells of R5 and R6+R5 belong to another classification)
Inter-frequency hard handovers The inter-frequency hard handover means a UE connection is handed over from a cell of a UTRAN frequency to a cell of another frequency Many factors including the radio quality the load and the speed of the moving UE may trigger inter-frequency hard handovers
For example the radio quality triggers the inter-frequency hard handover in the following way
When the quality of the UE radio frequency becomes lower the inter-frequency measurement will be triggered and according to the measurement result the UE connection will be handed over to a better frequency
ZTE Confidential Proprietary copy 2012 ZTE CORPORATION All rights reserved 40
UMTS KPI Optimization Analysis Guide Internal Use Only
4422 Hard Handover Optimization Flowchart
Figure 4-13 Hard handover optimization flowchart
ZTE Confidential Proprietary copy 2012 ZTE CORPORATION All rights reserved 41
UMTS KPI Optimization Analysis Guide Internal Use Only
Extract performance data
TOP Ncell filtering
Analyze a single cell
1 Check NE alarms
2 Associate emergencies
3 Compare parameter
configurations
4 Associate indicators
5 Locate the fault
comprehensive ly
Exist or not
Handle alarms
Solved or not
Yes
Yes
End
No
Exist or not
Handle emergencies
Solved or not
YesNo
Exist or not
Correct wrong parameter
configurations
Solved or not
Yes
No
No
List related indicator counters
RTWPResource
limit indicators
Checkamp analysis of interference
Optimization analysis of
resource limit
Counters related to inter-frequency handover failures
C301110489 C301110516C301110499 C301110517C301110500 C301110518C301110501 C301110519C301110502 C301110520C301110503 C301110521C301110504 C301110522C301110505 C301110523
Solved or not
Yes
Yes
No
Drive Test+RNC signaling
trace
Yes
Counters related to hard handover
failures
30041 3004230043 3004430045 3004630047 30048
Cell hand-inhand-out indicators
NoNo
ZTE Confidential Proprietary copy 2012 ZTE CORPORATION All rights reserved 42
UMTS KPI Optimization Analysis Guide Internal Use Only
4423 Hard Handover Optimization Methods
The optimization flow for the hard handover is similar to that of the soft handover The major differences are in the parameter optimization To optimize intra-frequency hard handovers you can properly reduce the Event 1D hysteresis and the time to trigger Event 1D according to the real radio environment to ensure timely handovers
Inter-frequency coverage is often applied to some special scenarios such as indoor coverage and tested through CQT The method of judging whether there is missed configuration of the inter-frequency neighboring cell is almost the same as that of the co-frequency neighboring cell when a call drop occurs the UE fails to measure or report the inter-frequency neighboring cell after the call drop the UE resides in the inter-frequency neighboring cell again
The common hard handover problems are
1 The handover is not prompt The common symptoms are frequent call drops in the hard handovers when the UE moves
Solutions
Increase the threshold of activating the compressing mode The compressing mode is usually activated before the inter-frequency handover or the inter-RAT handover and it is used to measure the quality of the inter-frequency or inter-RAT cell You can set a threshold of the CPICH RSCP or EcIo to activate the compressing mode And the RSCP is widely used
minus Requirements on setting the threshold of activating the compressing mode Before the cell quality becomes low enough to cause a call drop the signal of the target cell should be measured and reported and the handover should be performed
minus Requirement on setting the threshold of deactivating the compression mode Frequent activationdeactivation of the compression mode should be avoided
Increase CIOs of the inter-frequency cell pair
Reduce the threshold of triggering the target frequency handover under the inter-frequency coverage
2 There are pingpong handovers
Solution Increase the hard handover hysteresis and the time to trigger the event
ZTE Confidential Proprietary copy 2012 ZTE CORPORATION All rights reserved 43
UMTS KPI Optimization Analysis Guide Internal Use Only
443 Optimization of Inter-RAT Handovers
4431 Configuring Basic Inter-RAT Parameters
Most of the inter-RAT handover failures are caused by incomplete parameter configuration The following parameters need special attention
Complete RNC parameter configuration for the GSM neighboring cell The 2G system shall provide the 3G system with the correct radio parameters based on negotiation mdash MCC MNC LAC ID (CI) NCC BCC frequency band indicator (900 or 1800) and BCCH
Table 4-3 Parameters That 2G Shall Provide to 3G
MCC MNC LACIDCI
NCC BCCFrequency
band indicator
BCCH
460 2 202 193 0 0 900 102
Complete GSM BSC parameter configuration for the WCDMA neighboring cell The 3G system shall provide the 2G system with the correct radio parameters based on negotiation mdash MCC MNC LAC RNC ID cell ID (C_ID) downlink frequency scrambling code and RAC
Table 4-4 Parameters That 3G Shall Provide to 2G
MCC MNC LACRNC
IDCell IDC_ID
Downlink frequency
Scrambling code
RAC
460 3 20 18 51 10787 51 20
According to the current strategy of one-way inter-RAT handovers if the parameter configuration is complete one probable cause of the inter-RAT handover failure is that the handover is not prompt The common parameter adjustment is to increase CIO the threshold to activatedeactivate the compressing mode and the threshold to trigger the WCDMA-to-GSM handover at the same time
Call drops during the inter-RAT handovers between WCDMA and GSM may be caused by
minus Inconsistent data configuration at the GSM side and the WCDMA side after GSM modifies the configuration data but does not inform WCDMA
minus Missed configuration of neighboring cells which can be solved by the correct configuration of neighboring cells
minus Too fast signal changes
ZTE Confidential Proprietary copy 2012 ZTE CORPORATION All rights reserved 44
UMTS KPI Optimization Analysis Guide Internal Use Only
minus Pingpong reselection
minus Faults with the UE for example the UE fails to respond to the handover or report the inter-RAT measurement report
minus Changes of the best server during the physical channel reallocation
minus Wrong LAC configuration which can be located through data configuration check
ZTE Confidential Proprietary copy 2012 ZTE CORPORATION All rights reserved 45
UMTS KPI Optimization Analysis Guide Internal Use Only
4432 Inter-RAT Handover Optimization Flowchart
Figure 4-14 Inter-RAT handover optimization flowchart
ZTE Confidential Proprietary copy 2012 ZTE CORPORATION All rights reserved 46
UMTS KPI Optimization Analysis Guide Internal Use Only
Extract performance data
TOP Ncell filtering
Analyze a single cell
1 Check NE alarms
2 Associate emergencies
3 Compare parameter
configurations
4 Associate indicators
5 Locate the fault
comprehensive ly
Exist or not
Handle alarms
Solved or not
Yes
Yes
End
No
No
Exist or not
Handle emergencies
Solved or not
Yes
No
No
Exist or not
Correct wrong parameter
configurations
Solved or not
Yes
No
No
List related indicator counters
RTWPResource
limit indicators
Checkamp analysis of interference
Optimization analysis of
resource limitCounters related to inter-RAT handover failures
C301130667 C301130681C301130668 C301130682C301130669 C301130690C301130670 C301130691C301130671 C301130692C301130672 C301130693C301130673 C301130694C301130674 C301130696C301130675 C301130697C301130677 C301130698C301130678 C301130699C301130679 C301130700
C301130680
Solved or not
Yes
Yes
No
Drive Test+RNC signaling
trace
Yes
Counters related to inter-RAT handover
failures
Cell hand-inhand-out indicators
30049 3005030051 3005230053 30054
ZTE Confidential Proprietary copy 2012 ZTE CORPORATION All rights reserved 47
UMTS KPI Optimization Analysis Guide Internal Use Only
45 Optimization of Resource Indicators
The resource indicators directly reflect the system capacity Increasing subscribers will consume more system resources and some resources may be limited for example the code resource may be limited the TCP access request may be rejected and the CE resource usage rate may exceed the threshold Limited system resources have a negative influence on the whole-network indicators and the subscribersrsquo perception for example call drops may frequently happen and more TCP access requests may be rejected during the voice services
Table 4-5 Resource KPIs and Alarm Thresholds
Resource type KPI No and nameAlarm
threshold
TCP
C301320150 Number of rejected services DCH downlink TCP limit
50
PI30167 Average non-HS (SOA) (SOA)DPA TCP 40
PI30092 Maximum Cell TCP () 100
PI30093 Average Cell TCP 70
UL TrafficPI30029 Handover Blocking Rate 05
KPI RTWP (in busy hour) -98 dBm
Code
C301320153 Number of rejected services DCH no code
50
PI30205 Average Cell HSUPA Users 12
PI30172 Cell Average HSDPA Users 16
CE
PI301830006 Maximum use Ratio of Uplink NodeB CE
60
PI301830010 Maximum use Ratio of Downlink NodeB CE
60
ZTE Confidential Proprietary copy 2012 ZTE CORPORATION All rights reserved 48
UMTS KPI Optimization Analysis Guide Internal Use Only
451 Resource Indicator Optimization Flowchart
Figure 4-15 Resource indicator optimization flowchart
ZTE Confidential Proprietary copy 2012 ZTE CORPORATION All rights reserved 49
UMTS KPI Optimization Analysis Guide Internal Use Only
Extract performance data
TOP Ncell filtering
Analyze a single cell
1 Check NE alarms
2 Associate emergencies
3 Compare parameter
configurations
4 Associate indicators
5 Locate the fault
comprehensive ly
Exist or not
Handle alarms
Solved or not
Yes
是
End
No
No
Exist or not
Handle emergencies
Solved or not
Yes
No
No
Exist or not
Correct wrong parameter
configurations
Solved or not
Yes
No
No
List related indicator counters
Code resource indicators
CE resource indicators
TCPadmission
reject counter
C301320150
Solved or not
Yes
Yes
No
Drive Test+RNC signaling
trace
Yes
Counter related to TCP limit
Cell TX power
indicators
30090 3009130092 3009330166 3016730168 3016930170 30171
30163301643016530075
30223302243045030451
Yes
Yes
ZTE Confidential Proprietary copy 2012 ZTE CORPORATION All rights reserved 50
UMTS KPI Optimization Analysis Guide Internal Use Only
452 Code Resource Optimization
The statistics of Number of rejected services and DCH no code the average code resource usage rate and the number of the HSDPA subscribers can be used to judge whether the code resource in a cell is limited If the code resource is limited you can adjust the code resource allocation to alleviate the situation
Based on the system algorithm when Formula 1 is satisfied you can add an HS-PDSCH when Formula 2 is satisfied then an HS-PDSCH is deleted
Formula 1 OcuRateNoHspdsch + OcuRateHspdsch + DpchCodeHy + 32 lt= 512
Formula 2 OcuRateNoHspdsch + OcuRateHspdsch + CodeUptHyA gt 512
OcuRateHspdschHSPDSCH means the number of the codes of SF=512 blocked by the HS-PDSCH OcuRateNoHspdsch means the number of codes of SF=512 blocked by other channels DpchCodeHy means the number of codes of SF=512 reserved for the DPCH and CodeUptHyA is the threshold to decide whether to delete the HSPDSCH
Therefore to ensure the access of the R99 subscribers you can make some adjustment according to Table 4-6 when the code resource is limited though the HSDPA rate may decrease
Table 4-6 Adjusting Code Resource Allocation
AbbreviationParameter
nameRange
and stepCurrent value
Update value
Remark
DpchCodeHy DPCH Code Hysteresis
0512 16 28
To decrease the number of rejected services for DCH no code
CodeUptHyACode Update Hysteresis A
0512 16 28
To decrease the number of rejected services for DCH no code
453 Monitoring CE Resource
The CE resource is mainly monitored through the maximum UE uplinkdownlink usage rate If there is any problem you can solve it by controlling the load or adding more boards
ZTE Confidential Proprietary copy 2012 ZTE CORPORATION All rights reserved 51
UMTS KPI Optimization Analysis Guide Internal Use Only
454 Optimization of Power Control
4541 Monitoring and Optimizing Downlink Power Control
Limited TCP in busy hours will not only increase access failures and call drops in the local cell but also increase soft handover failures and call drops in the neighboring cells Number of rejected services and DCH downlink TCP limit are intuitive KPIs to judge whether TCP is limited Although limited uplink capacity and massive UE moves in the rush hours may also cause call drops the limited TCP is absolutely a key factor
Based on the system algorithm MinHsdpaPower (MinHspaPwrRto) + NoHsPower gtNode B if the safety threshold is used (MinHsdpaPower means the power reserved for HSPA) then it will activate the downlink rate downgrade algorithm flow for the congestion (lower the downlink DCH rate) Although the rate downgrade can ensure access of some subscribers it is an irregular action and will degrade the performance
455 Speeding up Rate Downgrade
Considering that the cells with heavy load reject more access requests you can speed up the rate downgrade during the resource congestion to release the resources as soon as possible and avoid call drops caused by access failures (this method is only applicable to the cells with many PS service users but not those with only CS service users) Table 4-7 is an example of the parameter modification for the rate downgrade
Table 4-7 Example of Parameter Modification for Rate Downgrade
Abbreviation Parameter nameRange and
stepCurrent value
Update value
Remark
UlDnMaxStg Maximum Number of Degraded Uplink Load Steps Every Time
[1 8] 1 2 Downgrade from 384 Kbps to 16 Kbps
DlDnMaxStg Maximum Number of Degraded Downlink Load Steps Every Time
[1 8] 1 3 Downgrade from 384 Kbps to 8 Kbps
456 Monitoring and Optimizing Uplink Capacity
Handover Blocking Rate and RTWP can reflect the uplink capacity of the cell Because interference may also increase RTWP this factor should be distinguished during the RTWP monitoring Another effective indicator is the voice service erl If a cell has over 20 erls in busy hours you should pay special attention to it
ZTE Confidential Proprietary copy 2012 ZTE CORPORATION All rights reserved 52
UMTS KPI Optimization Analysis Guide Internal Use Only
457 Optimization of Uplink Capacity at the Whole Network Level
Case The uplink capacity was limited in a large number of sites after the cutover and the symptoms are a sharp rise of RTWP and a high call drop rate during the rush hours
After the following parameters were modified as shown in Table 4-8 the problem was solved
Table 4-8 Example of Power Control Parameter Modification
AbbreviationParameter
nameRange
Current value
Update value
ULINITSIRUplink Initial SIR target (dB)
UL 34 K136 K signaling UL 122 K AMR
4-5 35
ULMAXSIRMaximum Uplink SIR target (dB)
UL 34 K136 K signaling UL 122 K AMR
15 10
UlSirTargDnStepUplink SIR Target Down Step Size (dB)
UL 34 K136 K signaling UL 122 K AMR
01 02
458 Optimization of Uplink Capacity for a Single Cell
A lot of optimization measures can be taken to bring down the rising RTWP However with increasing subscribers the capacity may still be limited in some area while further modification of SirTarget will obviously degrade the call quality of the whole network and undermine the subscribersrsquo perception In this case you can adjust the power control parameters for a single site that has heavy traffic in the following way add one set of DivPc parameters and use this set of parameters only for this site
Case Table 4-9 shows an example of the power control parameter modification After this modification the call drop rate in the site with heavy traffic decreased to one quarter of the original one
Table 4-9 Example of Power Control Parameter Modification for Heavy-Traffic Cell
SRVTYPE ULINITSIR ULMAXSIR ULMINSIR
0 35-gt15 100-gt35 20-gt10
104 40-gt20 150-gt50 05-gt0
28 35-gt15 100-gt35 05-gt0
50 60-gt20 150-gt50 20-gt0
54 60-gt20 150-gt50 20-gt0
ZTE Confidential Proprietary copy 2012 ZTE CORPORATION All rights reserved 53
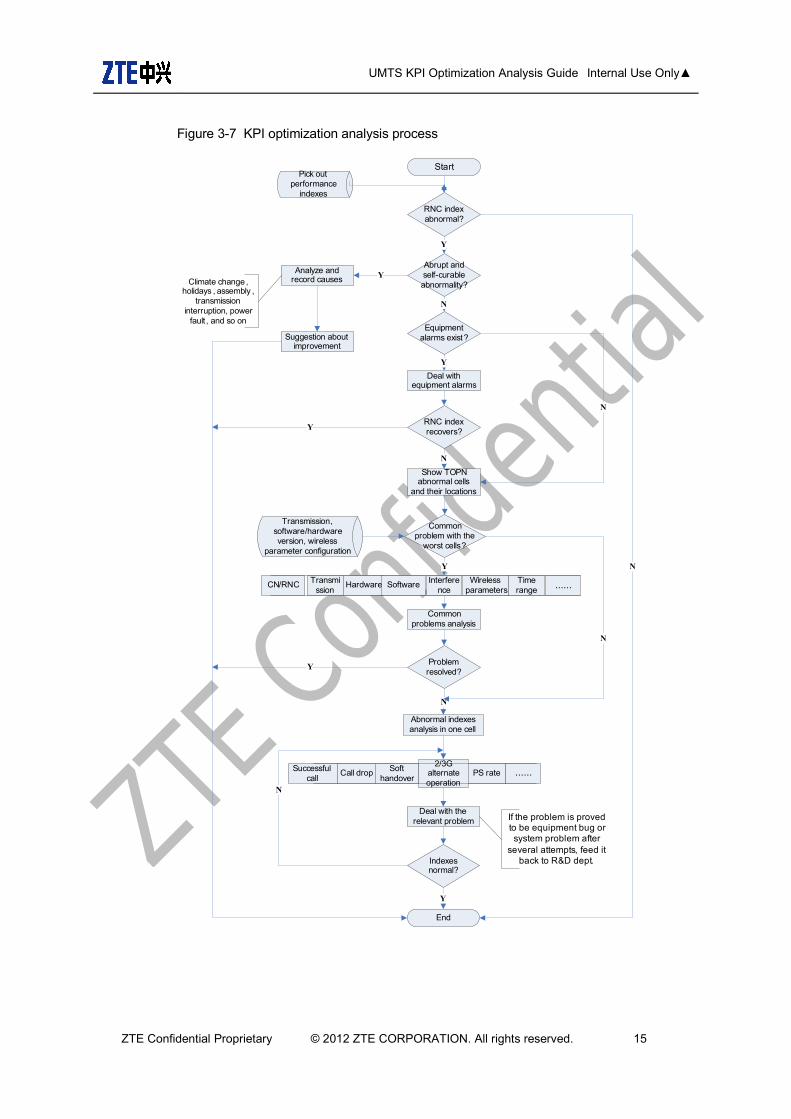
UMTS KPI Optimization Analysis Guide Internal Use Only
Figure 3-7 KPI optimization analysis process
StartPick out
performance indexes
RNC index abnormal
Equipment alarms exist
Deal with equipment alarms
RNC index recovers
Common problem with the
worst cells
Transmission softwarehardware version wireless
parameter configuration
CNRNC Transmission
Hardware Software Interference
Wireless parameters
Time range
Abrupt and self-curable abnormality
helliphellip
Analyze and record causes
Suggestion about improvement
Common problems analysis
Problem resolved
Successful call
Call drop Soft handover
23G alternate operation
PS rate helliphellip
Deal with the relevant problem
Indexes normal
End
Climate change holidays assembly
transmission interruption power
fault and so on
Y
N
Y
Y
N
Y
N
Abnormal indexes analysis in one cell
Y
N
N
N
Y
N
Y
Show TOPN abnormal cells
and their locations
If the problem is proved to be equipment bug or system problem after
several attempts feed it back to RampD dept
ZTE Confidential Proprietary copy 2012 ZTE CORPORATION All rights reserved 15
UMTS KPI Optimization Analysis Guide Internal Use Only
4 KPI Optimization Analysis This chapter mainly demonstrates how to analyze the indicator problems from the aspect of OMC data and provides flowcharts for KPI optimization The detailed analyzing method and cases of every special subject can be checked in the optimization guides of all the subjects
41 CS Call Drop Optimization
The CS call drop rate is the most important indicator in KPI optimization
411 Definition of Call Drop
After checking the signaling on the Uu interface at the UE side the engineer can judge the situation a call drop if the Uu interface message satisfies one of the following three conditions during the calling process (in connection)
RNC Release is not received but the UE condition changes from CELL_DCH to IDLE
RRC Release is received and the released cause value is Not Normal
One of the following three messages mdash CC Disconnect CC Release Complete and CC Release mdash is received and the released cause value is Not Normal Clearing or Not Normal Unspecified
In a board sense the call drop includes the call drop rates of CN and UTRAN The call drop of UTRAN includes the following two aspects
After the successful service establishment RNC sends the RAB Release Request to CN
After the successful service establishment RNC sends the IU Release Request to CN Later RNC receives the IU Release Command from CN
Note that RAN call drop statistics which is defined from the aspect of lu interface signaling means the launching times of RAB Release Request and lu Release Request of RNC And the DT call drop statistics is defined from the aspects of the Uu interface message non-access stratum message and cause value RAN call drop statistics and DT call drop statistics are not exactly the same
ZTE Confidential Proprietary copy 2012 ZTE CORPORATION All rights reserved 16
UMTS KPI Optimization Analysis Guide Internal Use Only
412 CS Call Drop Analysis Flowchart
Figure 4-8 CS call drop analysis flowchart
ZTE Confidential Proprietary copy 2012 ZTE CORPORATION All rights reserved 17
UMTS KPI Optimization Analysis Guide Internal Use Only
Extract performance data
CS TOP Ncell filtering
Analyze a single cell
1 Check NE alarms
2 Associate emergencies
3 Compare parameter
configurations
4 Associate indicators
5 Locate the fault
comprehensively
Exist or not
Handle alarms
Solved or not
Yes
Yes
End
No
No
Exist or not
Handle emergencies
Solved or not
Yes
No
No
Exist or not
Correct wrong parameter
configurations
Solved or not
Yes
No
No
List related indicator counters
Call-drop-related
countersRTWP
Handover success rate
Traffic volume
Resource limit indicators
Checkamp analysis of
interference
Optimizationanalysis of
handover failures
Optimization analysis of
resource limitCall-drop-
related counters
C301230362C301230363C301230365C301230315C301230316C301230318C301230319C301230322C301230323
Solved or not
Yes
Yes
No
Drive Test+RNC signaling
trace
Yes
ZTE Confidential Proprietary copy 2012 ZTE CORPORATION All rights reserved 18
UMTS KPI Optimization Analysis Guide Internal Use Only
42 PS Call Drop Optimization
421 Optimization Flowchart
Figure 4-9 PS call drop optimization flowchart
ZTE Confidential Proprietary copy 2012 ZTE CORPORATION All rights reserved 19
UMTS KPI Optimization Analysis Guide Internal Use Only
Extract performance data
PS TOP Ncell filtering
Analyze a single cell
1 Check NE alarms
2 Associate emergencies
3 Compare parameter
configurations
4 Associate indicators
5 Locate the fault
comprehensive ly
Exist or not
Handle alarms
Solved or not
Yes
Yes
End
No
No
Exist or not
Handle emergencies
Solved or not
Yes
No
No
Exist or not
Correct wrong parameter
configurations
Solved or not
Yes
No
No
List related indicator counters
Call -drop-related
countersRTWP
Handover success rate
Traffic volume
Resource limit indicators
Check amp analysis of interference
Optimizationanalysis of
handover failures
Optimization analysis of
resource limitCall -drop-
related counters
C301230372C301230373C301230375C301230330C301230332C301230333C301230334C301230337C301230338
Solved or not
Yes
Yes
No
Drive Test +RNC signaling
trace
Yes
ZTE Confidential Proprietary copy 2012 ZTE CORPORATION All rights reserved 20
UMTS KPI Optimization Analysis Guide Internal Use Only
43 Optimization of Accessibility Indicators
Accessibility performance includes the success rate of RRC connection setup and the success rate of CSPS RAB assignment These two kinds of KPIs play important roles in the network optimization and directly influence the success rate of CSPS service establishment In this document this kind of problems are found from the aspect of OMC data and solved through parameter optimization
431 Definition of Access Failure
For the mobile originated call in the CS domain the access failure event means that the UE sends RRC REQUEST and IE establish cause is Originating Conversational Call but alerting of the direct transfer message is not received
The relevant events are defined as follows in the access failure stage
RRC connection setup failure After considering the resending times and the waiting time the UE sends RRC CONNECTION REQUEST and does not receive the response from RNC or RRC CONNECTION REJECT delivered by RNC
Initial direct transfer and security mode establishment failure After sending RRC CONNECTION SETUP COMPLETE the UE does not send NAS SETUP
RAB assignment failure After receiving CALL PROCEEDING the UE does not receive RB SETUP delivered by RNC Or the UE replies with RB SETUP FAIL after receiving RB SETUP Or the UE receives DISCONNECT with the cause value not being Normal Release after receiving RB SETUP At this time the UE has not reported RB SETUP CMP
Failure after RAB assignment After the UE sends RB SETUP COMPLETE the originating UE receives DISCONNECTRELEASE from CN Or the UE waits CONNECT or ALERTING overtime and launches the Call Clearing process Or the UE becomes IDLE before receiving Alerting and starts to receive the system message
For the mobile terminated in the CS domain the access failure event means that the terminating UE receives the paging of paging type 1 and does not send RRC CONNECTION REQUEST with the cause value being Terminating Conversational Call Or the UE does not send the alerting of direct transfer message to CN after sending RRC CONNECTION REQUEST
The relevant events are defined as follows in the access failure stage
RRC connection setup failure After sending RRC CONNECTION REQUEST the UE does not receive the response from RNC or RRC CONNECTION REJECT delivered by RNC
Initial direct transfer and security mode establishment failure After sending RRC
ZTE Confidential Proprietary copy 2012 ZTE CORPORATION All rights reserved 21
UMTS KPI Optimization Analysis Guide Internal Use Only
CONNECTION SETUP COMPLETE the UE does not receive the SETUP direct transfer message Or the UE sends RELEASE COMPLETE Or the UE receives DISCONNECT from CN
RAB assignment failure The UE does not receive RB SETUP delivered by RNC after sending CALL CONFIRM Or the UE replies with RB SETUP FAIL after receiving RB SETUP Or the UE receives DISCONNECT with the cause value not being Normal Release after receiving RB SETUP At this time the UE has not reported RB SETUP CMP
Failure after RAB assignment After the UE sends RB SETUP COMPLETE the terminating UE receives DISCONNECTRELEASE from CN
432 Analysis on RRC Connection Failures
The problem of RRC connection setup failure can be analyzed through the UE signaling flow and RNC single-user tracing The RRC connection setup includes the following steps
The UE sends RRC Connection Request through the RACH channel
RNC sends RRC Connection Setup through the FACH channel
The UE sends RRC Connection Setup Complete through the dedicated uplink channel after the downlink dedicated channel is established and synchronized
RRC connection setup failures are always caused by following issues
Uplink RACH problem
Problem about downlink FACH power allocation proportion
Parameter reselection problem of the cell
Low downlink dedicated initial transmitting power
Uplink initial power control problem
Congestion
Equipment malfunctions
Among these issues the problems of uplink RACH downlink FACH power allocation proportion parameter reselection of the cell and equipment malfunctions appear more frequently
ZTE Confidential Proprietary copy 2012 ZTE CORPORATION All rights reserved 22
UMTS KPI Optimization Analysis Guide Internal Use Only
4321 Analysis Flowchart of RRC Connection Setup Failures
Figure 4-10 Analysis flowchart of RRC connection setup failures
ZTE Confidential Proprietary copy 2012 ZTE CORPORATION All rights reserved 23
UMTS KPI Optimization Analysis Guide Internal Use Only
Extract performance data
TOP Ncell filtering
Analyze a single cell
1 Check NE alarms
2 Associate emergencies
3 Compare parameter
configurations
4 Associate indicators
5 Locate the fault
comprehensive ly
Exist or not
Handle alarms
Solved or not
Yes
Yes
End
No
No
Exist or not
Handle emergencies
Solved or not
Yes
No
No
Exist or not
Correct wrong parameter
configurations
Solved or not
Yes
No
No
List related indicator counters
Counters related to RRC setup
failuresRTWP
Resource limit
indicators
Checkamp analysis of interference
Optimization analysis of
resource limitCounters related
to RRC setup failures
C301480485C301480486C301480487C301480489C301480490C301480491C301481288C301481289C301481337C301481338C301481339C301481407C301481408
Solved or not
Yes
Yes
No
Drive Test+RNC signaling
trace
Yes
ZTE Confidential Proprietary copy 2012 ZTE CORPORATION All rights reserved 24
UMTS KPI Optimization Analysis Guide Internal Use Only
4322 UE sends RRC Connection Request but RNC does not receive it
If the EcIo of downlink CPICH is relatively low it is the problem of coverage
If the EcIo of downlink CPICH is not very low (for example the value is larger than -14 dB) Usually it is the problem of RACH and the following issues may cause the problem
minus The power of Preamble does not rise to a required value and the rising times of Preamble should be increased
minus The output power of UE is lower than the required value which is caused by poor UE performance In this case the UE should be changed
minus The NodeB equipment has a standing wave and the engineer should check whether NodeB has any SWR alarm
minus The radius of the cell is set improperly If the radius parameter of the cell is set too small the NodeB can not synchronize the UE beyond the range of the radius and the access fails This problem often happens in the places with large coverage such as the rural areas and the suburbs
4323 RNC delivers RRC Connection Reject after receiving RRC Setup Request
When RRC Connection Reject appears the engineer should check the specific reject cause value Usually there are two kinds of causes
The CPU load of RNC control plane board is too heavy and more boards should be added
DCH and FACH admission is rejected However this situation does not always happen
4324 UE does not receive RRC Connection Setup delivered by RNC
This problem may be caused by the following reasons
Poor coverage
Improper parameters of cell selection and reselection
Checking method The engineer should check the EcIo of CPICH If the value is lower than -12 dB (EcIo is -12 dB by default) and there is no cell of better quality in the monitor set the cause of this problem is poor coverage If there is better cell in the monitor set cell reselection may cause this problem
Poor coverage can be improved by coverage enhancement such as adding some sites to cover the places without signal coverage and adjusting the engineering parameters If the coverage can not be improved the engineer can enhance the FACH power according to
ZTE Confidential Proprietary copy 2012 ZTE CORPORATION All rights reserved 25
UMTS KPI Optimization Analysis Guide Internal Use Only
the PCPICH EcIo coverage of the current network For example if all the pilot EcIo values are larger than -12 dB in the coverage area the power proportion of the common channel should be configured on the basis of the situation that the EcIo value is larger than -12 dB And so the success rate of the idle UE assessment can be ensured
As for the access problem caused by cell selection and reselection the engineer can speed up the cell selection and reselection by adjusting the cell selection and reselection parameters and the problem of RRC connection setup failure caused by improper cell selection and reselection parameters can be solved
Note
The RRC Connection Setup message is borne by FACH RRC Connection Request sent by the UE is received by UTRAN at the preamble of PRACH and then it is sent from the RACH channel based on the current preamble power And the transmit power of preamble can rise all the time until the response is received (There is a limitation for the maximum number of preamble retransmissions) Therefore in the areas with poor coverage the RACH coverage and FACH coverage may become unbalanced and as a result UTRAN can receive RRC Connection Request sent by the UE but the UE can not receive RRC Connection Setup sent by RNC
4325 UE receives RRC Connection Setup and does not send RRC Setup Complete
If the downlink signal quality is normal this problem may be caused by the abnormal condition of the cell phone
Another reason of this problem may be the downlink synchronization failure caused by the low initial power of downlink dedicated channel You can solve this problem by adjusting the service downlink EbNo
4326 RNC does not receive RRC Setup Complete sent by UE
Because the uplink initial power control may increase the UE transmit power this kind of problem seldom appears If it appears the engineer can increase the Constant Value of the dedicated channel properly to raise the uplink DPCCH initial transmission power of the UE
At the same time this problem is also relevant with the uplink SIR initial target value configuration because this value may affect the uplink initial synchronization at the initial stage of link setup If the value of the parameter is set too large there will be too much uplink inference brought by the initial setup of the link If the value is set too small the uplink synchronization will take longer time and the initial synchronization may even fail This parameter is an RNC-level parameter which has a great influence on network performance Therefore the engineer should be cautious while adjusting this parameter
ZTE Confidential Proprietary copy 2012 ZTE CORPORATION All rights reserved 26
UMTS KPI Optimization Analysis Guide Internal Use Only
Note
RRC Connection Setup Complete is sent through uplink DPCH and the UE calculates the initial power of uplink DPCCH according to the received IErdquoDPCCH_Power_offsetrdquo and the measured CPICH_RSCP value
DPCCH_Initial_power = DPCCH_Power_offset - CPICH_RSCP
DPCCH_Power_offset = Primary CPICH DL TX Power + UL Interference + Constant Value The Constant Value can be configured in the OMC If this value is set too small the UE may not have enough power to send RRC Connection Setup Complete
433 Analysis on RABRB Setup Failures
When RAB or RB setup fails RNC will send RAB Assignment Fail in the RAB Assignment Response signaling The engineer can find out the specific failure reason from the failure cause value carried in relevant cells The reasons for common RABRB setup failures include
RNC directly rejecting RAB Setup Request because of wrong parameter configuration
Admission reject
RAB setup failure because the UE fails to respond to RB Setup Request
RAB setup failure because the Uu interface fails to set up RB
ZTE Confidential Proprietary copy 2012 ZTE CORPORATION All rights reserved 27
UMTS KPI Optimization Analysis Guide Internal Use Only
4331 Analysis Flowchart of RAB Setup Failures
Figure 4-11 Analysis flowchart of RAB setup failures
ZTE Confidential Proprietary copy 2012 ZTE CORPORATION All rights reserved 28
UMTS KPI Optimization Analysis Guide Internal Use Only
Extract performance data
TOP Ncell filtering
Analyze a single cell
1 Check NE alarms
2 Associate emergencies
3 Compare parameter
configurations
4 Associate indicators
5 Locate the fault
comprehensively
Exist or not
Handle alarms
Solved or not
Yes
Yes
End
No
No
Exist or not
Handle emergencies
Solved or not
Yes
No
No
Exist or not
Correct wrong parameter
configurations
Solved or not
Yes
No
No
List related indicator counters
Counters related to RAB setup failures RTWP
Resource limit
indicators
Checkamp analysis of interference
Optimization analysis of
resource limitCounters related to RAB setup failures
CS domain PS domainC301230290 C301230302C301230291 C301230303C301230292 C301230304C301230293 C301230305C301230294 C301230306C301230295 C301230307C301230296 C301230308C301230297 C301230309C301230298 C301230310C301230299 C301230311C301230300 C301230312C301230301 C301230313
Solved or not
Yes
Yes
No
Drive Test+RNC signaling
trace
Yes
ZTE Confidential Proprietary copy 2012 ZTE CORPORATION All rights reserved 29
UMTS KPI Optimization Analysis Guide Internal Use Only
4332 RNC Directly Rejecting RAB Setup Request Because Of Wrong Parameter Configuration
The case that RNC responds with RAB Setup Failure directly is seldom caused by invalid parameter configuration in the business network Usually this case is caused by special operations of the special users
The main scenario is that the subscription information of the userrsquos PS service is beyond the capability of the UE which leads to the direct refusal from RNC For example a special userrsquos subscription rates of uplink and downlink are 384 K but the maximum uplink rate of the UE is only 64 K The maximum uplink and downlink rates of the QoS message used for activating PDP set by the AT command or mobile terminal software used by the user are 384 K so the RNC will find the maximum uplink rate is beyond the UErsquos capability directly reply with RAB Setup Failure and will not launch the RB setup process when it receives RAB Assignment Request
After the RAB setup fails because the parameter configuration is beyond the UErsquos capability SGSN will negotiate again to launch the new RAB assignment until the UE has the capability to support the assignment and the RAB assignment is finished For the users the PDP activation is still successful and the actual maximum rate is the maximum rate the UE can support
However if the minimum guaranteed bit rate required by the QoS setting in the UErsquos PDP activation request is beyond the UErsquos capability though the network negotiates a lower rate to accept the UErsquos PDP activation request the UE will launch the request of deactivating PDP when it finds that the rate negotiated by the network in PDP activation accept request is lower than the minimum guaranteed bit rate and finally the PDP activation can not be completed
4333 Admission Reject
For the non-HSDPA user if there are insufficient system resources (including power channel code lub transmission resource and CE) the call establishment failure will be caused by the admission reject At this time it is necessary to check the network load code resource lub transmission resource and CE resource occupation to make sure the congestion is caused by the limitation of a certain kind of resource What is more the engineer should plan the corresponding expansion method
If the cell does not support the HSDPA service the R99 user admission is judged according to the fixed R99 admission threshold If the cell supports the HSDPA service and the HSDPA and R99 dynamic power is allocated the uplink admission of non-HSDPA is judged based on RTWP or the equivalent user number If the uplink load is too heavy the non-HSDPA user admission will also fail
If the bandwidth configuration on the lub interface is insufficient the lub interface will reject the R99 data service activation because of limited bandwidth
ZTE Confidential Proprietary copy 2012 ZTE CORPORATION All rights reserved 30
UMTS KPI Optimization Analysis Guide Internal Use Only
The admission control of the NodeB Credit resource is similar to the power admission control Whether the remaining Credit can support the currently requested service or not can be judged according to the spectrum spreading factor of the new access user According to the condition of the RAB Downsizing Switch RNC will deal with the issue in the corresponding way
For the HSDPA user in the dynamic power allocation mode besides the mentioned system resources such as the power channel code lub transmission resource and CE the admission reject should take into consideration whether the number of H users supported by NodeB and the number of H users supported by the cell are over the regulated threshold or not into consideration
For the HSDPA user when the bandwidth configuration on lub interface is insufficient the admission reject will not happen but the rate will be reduced What is more the AAL2PATHs of HSDPA and R99 are configured respectively and the HSDPA AAL2PATH must be configured to the HSDPA_RT or HSDPA_NRT type If the HSDPA AAL2PATH is configured to RT or NRT of R99 AAL2PATH type the RAB assignment failure will not happen but RNC will establish the HSDPA service as R99 384 Kbps
For the downlink power admission
Besides whether the R99 service load is over the non-HSDPA service threshold DCH service should take into consideration whether non-HSDPA power and HSDPA GBP (the minimum power needed for the guaranteed bit rate) are over the general power threshold of the cell
For the HSDPA service it is necessary to check whether the throughput rate provided by the cell is over the sum of all the usersrsquo GBR thresholds or whether the GBPs of the stream service and the background service are over the HSDPA power of the cell At the same time whether the non-HSDPA power and the HSDPA GBP (the minimum power needed for the guaranteed bit rate) are over the overall power threshold of the cell should be also taken into consideration
For the lub admission
For the DCH service the admission is made according to the multiplication of the peak rate and the service activation factor
For HSDPA service the admission is made according to the GBR
If the lub exceeds the congestion threshold the DCCC rate reduction will be triggered And if the RLC_AM retransmission rate is over a certain threshold the Iub Overbooking switch can be opened to trigger the TF which limits R99 or to reduce the rate of HSDPA service by a certain factor
ZTE Confidential Proprietary copy 2012 ZTE CORPORATION All rights reserved 31
UMTS KPI Optimization Analysis Guide Internal Use Only
4334 RAB Setup Failure Because the UE Fails to Respond to RB Setup
The UE fails to respond to RB setup mainly because of the userrsquos operation
Take the following cases as examples
When the user already has had the downlink 12 K data service he receives RB Setup Request of the VP service (either the originated call in the VP domain or the terminated call in the VP domain) Because the UE does not support the VP and high-speed PS service in the downlink at the same time it directly replies with RB Setup Failure and the cause value is unsupported configuration
Compared with the WCDMA subscriber originating the VP service the terminating subscriber resides in the GSM network and so it does not support the VP service After RNC receives RAB Assignment Request the core network will deliver the Disconnect command right after call proceeding and the cause value is Bearer capability not authorized At this time the UE has just received the RB SETUP command and has no enough time to finish the RB setup So the UE will reply with RB Setup Failure after it receives the Disconnect command and the RNC will reply with RAB Setup Failure with the cause value being failure in radio interface procedure
4335 RAB Setup Failure Because the Uu Interface Fails to Set Up RB
RNC sends the Radio Bearer Setup command to the UE but fails to receive Radio Bearer Setup Compete This kind of situation (RB setup failure) often appears in the cells with weak signals There are two causes of weak signals one is that the UE does not reside in the best server to launch the access and the other is poor coverage
If the UE does not reside in the best server to launch the access it will hope to enter the best server through active set update in the RB setup process (At the same time the fast signal change will drastically weaken the signals in the cell) but the active set update can only be processed after the RB setup is completed because the procedures can not be processed alternately (Neither the network nor the terminal supports it) Therefore RB can only be set up in the cell with weak signals and the setup is easy to fail As for this situation the starting threshold and speed of co-frequency cell reselection should be increased to make the UE reside in the best server and launch the access as soon as possible
RB setup failure may be caused by the poor downlinkuplink coverage If the failure is caused by downlink coverage the UE can not receive the Radio Bearer Setup command which may be caused by the uplink interference and this can be fixed through checking RTWP The poor downlink coverage is partly caused by the bad UE demodulation performance and other causes should be solved by RF optimization
ZTE Confidential Proprietary copy 2012 ZTE CORPORATION All rights reserved 32
UMTS KPI Optimization Analysis Guide Internal Use Only
44 Optimization of Mobility Indicators
Mobility indicators mainly fall into three categories mdash soft handovers hard handovers and inter-RAT handovers The handover problems usually happen in the following cases
The best server changes too fast or there is no best server due to pilot pollution
The handover is not prompt or there are pingpong handovers due to improper parameter configuration
Adjust the engineering parameters for antennas in areas with severe pilot pollution And adjust the handover parameters such as the values of 1A 1B CIO TTT (time to trigger) Hysteresis and so on to solve the problem that the handover is not prompt or there are pingpong handovers This section tries to solve this kind of problems through OMC data analysis and parameter optimization
441 Optimization of Soft Handovers
Missed neighboring cell configuration pilot pollution improper soft handover parameter configuration and equipment malfunctions are the major causes of soft handover failures To confirm the problems the field DTs are required
ZTE Confidential Proprietary copy 2012 ZTE CORPORATION All rights reserved 33
UMTS KPI Optimization Analysis Guide Internal Use Only
4411 Soft Handover Optimization Flowchart
Figure 4-12 Soft handover optimization flowchart
ZTE Confidential Proprietary copy 2012 ZTE CORPORATION All rights reserved 34
UMTS KPI Optimization Analysis Guide Internal Use Only
Extract performance data
TOP Ncell filtering
Analyze a single cell
1 Check NE alarms
2 Associate emergencies
3 Compare parameter
configurations
4 Associate indicators
5 Locate the fault
comprehensive ly
Exist or not
Handle alarms
Solved or not
Yes
Yes
End
No
No
Exist or not
Handle emergencies
Solved or not
Yes
No
No
Exist or not
Correct wrong parameter
configurations
Solved or not
Yes
No
No
List related indicator counters
RTWPResource
limit indicators
Checkamp analysis of interference
Optimization analysis of
resource limitCounters related to intra-frequency
handover failures
C301391101 C301390593C301391102 C301390594C301391103 C301390595C301390586 C301390596C301390587 C301390597C301390588 C301390598C301390589 C301390599C301390590 C301390600C301390591 C301390601C301390592 C301390602
Solved or not
Yes
Yes
No
Drive Test+RNC signaling
trace
Yes
Counters related to soft handover
failures
30055 3005630057 3005830059 3006030061 30062
Cell hand-inhand-out indicators
ZTE Confidential Proprietary copy 2012 ZTE CORPORATION All rights reserved 35
UMTS KPI Optimization Analysis Guide Internal Use Only
4412 Checking Missed Neighboring Cell Configuration
Generally speaking most of the call drops at the beginning of the optimization are caused by missed neighboring cell configuration The following methods are often used to judge whether the call drops are caused by missed configuration of co-frequency neighboring cells
Observe the active set EcIo information recorded by the UE and the Best Server EcIo information recorded by the Scanner before the call drop If the former record is very bad but the latter record is very good then check whether the Best Server scrambling code recorded by the Scanner appears in the latest list of the neighboring cells under intra-frequency measurement control If it does not then the call drop is caused by missed neighboring cell configuration
If the UE re-accesses immediately after the call drop and the cell scrambling codes during the UE reaccess and those during the call drop are different then the call drop may also be caused by missed neighboring cell configuration You can confirm it through measurement control (look backwards from the message of the call drop event for the latest intra-frequency measurement control message and check the neighboring cell list of this message)
Some UE may report the Detected Set information If the corresponding scrambling code appears in the Detected Set information before the call drop then the call drop is caused by missed neighboring cell configuration
4413 Checking Pilot Pollution
Definition of pilot pollution Excessive strong pilot signals exist at a certain point but none of them is strong enough to be the best server To form pilot pollution the following points in this definition should be satisfied
Strong pilot signal The absolute pilot signal strength is used to judge whether the pilot signal is a strong one The pilot signal strength can be evaluated through the pilot RSCP If the pilot RSCP exceeds a threshold it is considered a strong pilot signal The formula is
AbsoluteRSCPThRSCPCPICH __ gt
Excessive The number of pilot signals is used to judge whether there are excessive pilot signals at a certain point If the number exceeds a threshold it is regarded that excessive pilot signals exist at this point The formula is
NThNumberCPICH gt_
None of them is strong enough to be the best server The relative strength of a pilot signal is a key factor in judging whether the pilot signal is strong enough Based on the above definition and formulae if the difference between the strength of the
ZTE Confidential Proprietary copy 2012 ZTE CORPORATION All rights reserved 36
UMTS KPI Optimization Analysis Guide Internal Use Only
strongest pilot signal and that of the )1( +NTh strongest pilot signal at this point is
less than a threshold it is regarded that there is no pilot signal strong enough to be the best server at this point The formula is
lativeRSCPthThbest ThRSCPCPICHRSCPCPICHN Re_)1( )__( ltminus +
According to the above description it is regarded that pilot pollution exists if the following conditions are both satisfied
The number of pilot signals that meet the condition
AbsoluteRSCPThRSCPCPICH __ gt is more than NTh
lativeRSCPthThbest ThRSCPCPICHRSCPCPICHN Re_)1( )__( ltminus +
For example during the network optimization suppose
dBmTh AbsoluteRSCP 95_ minus= 3=NTh and dBTh lativeRSCP 5Re_ = if the following
conditions are both satisfied then it is regarded that pilot pollution exists
The number of the pilot signals that meet the condition
dBmRSCPCPICH 95_ minusgt is more than 3
dBRSCPCPICHRSCPCPICH thbest 5)__( 4 ltminus
4414 Adjusting Soft Handover Algorithm Parameters
You can solve the following kinds of problems by adjusting handover algorithm parameters
1 The handover is not prompt
From the perspective of the CS service signaling flow the symptom of this problem is that the UE cannot receive Active Set Update (physical channel reallocation in the case of the intra-frequency hard handover) because after the UE reports the measurement report the source cell has a fast reduction in EcIo When the RNC sends Active Set Update the UE has closed the transmitter due to the loss of downlink synchronization Viewed from the UE side it cannot receive Active Set Update In the PS services if the UE cannot receive Active Set Update or TRB resets before the handover the handover will also fail
From the perspective of signals the following phenomena may accompany this problem
ZTE Confidential Proprietary copy 2012 ZTE CORPORATION All rights reserved 37
UMTS KPI Optimization Analysis Guide Internal Use Only
minus Corner effect EcIo of the source cell decreases drastically and EcIo of the target cell increases sharply (very high when it appears)
minus Fast fading EcIo of the source cell decreases quickly for a while and then increases and EcIo of the target cell increases for a short while
2 Pingpong handovers The following phenomena may accompany this problem
The best server changes quickly Two or more cells take turns to be the best server But as the best server none of the cells can last long though they has good RSCPs and EcIos
There is no best server There are multiple cells Their RSCPs are normal and similar to each other But EcIo of every cell is very bad
From the perspective of the signaling flow Event 1A is reported immediately after one cell is deleted Because the UE cannot receive Active Set Update from the RNC the handover fails
4415 Equipment Malfunctions
First check the alarm console to see whether there are abnormal alarms and analyze the message traces at the same time Find out in which step the soft handover fails Check the failure message and contact the local product maintaining engineer to confirm whether the equipment has malfunctions
4416 Solutions
Corresponding adjustments should be taken for the confirmed problems
Handover failures caused by pilot pollution Adjust the engineering parameters of a certain antenna to set this antenna as the best server in this interfered location If the power of one of its sectors is reduced then Io of the pilot pollution area will decrease even if the powers of other pilots are not adjusted EcIo will also increase Thereby the EcIo differences with other scrambling codes in the active set will become larger and pilot pollution will be eliminated Through a lot of research ZTE has proved that the reduction in the pilot transmit power will not change cell capacity greatly If condition allows new base stations can be added to cover this area
Equipment malfunctions Consult the customer service engineers and ask them to help check whether there are alarms and whether the transport layer is abnormal If there are alarms coordinate with the customer service engineers and the engineering personnel to solve the problems
Call drops because the handovers are not prompt
ZTE Confidential Proprietary copy 2012 ZTE CORPORATION All rights reserved 38
UMTS KPI Optimization Analysis Guide Internal Use Only
minus Adjust the antenna to expand the handover zone
minus Configure the Event 1A handover parameters to make the handover easier to happen
minus Increase CIO to make the handover happen earlier in the target cell The sum of CIO and the actually measured value is used for judging the UE events including the UE intra-frequency handover CIO helps shift the cell border in the handover algorithm If CIO is configured with a larger value the handover will be easier to happen and there will be more UE in the soft-handover status but more resources will be occupied If CIO is configured with a smaller value the soft handover will be more difficult to happen and the receiving quality may be impaired A CIO of about 5dB is quite good for eliminating the fast fading and the corner effect but this configuration has some side effects such as the increase of handover proportion
Call drops caused by pingpong handovers Adjust the antenna to form a best server in its coverage zone or set the Event 1B handover parameters (increase the threshold of Event 1B the Event 1B hysteresis or the time to trigger Event 1B) to increase the difficulty in deleting the active set
442 Optimization of Hard Handovers
4421 Classification of Hard handovers
Hard handovers mainly fall into two classifications
Intra-frequency hard handovers The intra-frequency hard handover is triggered only when the intra-frequency softsofter handover cannot be performed and it is applicable to the following circumstances
minus Inter-RNC intra-frequency cell handovers when there is no Iur interface
minus Insufficient Iur interface resources though there is the Iur interface
minus Handovers controlled by the threshold of the PS service rate in the handover cell
The intra-frequency softsofter handovers can not be performed (intra-frequency hard handover should be triggered) in the following scenarios
minus When the intra-frequency handover happens the UE is using the transmit diversity in the active set cell but the target cell does not support the transmit diversity
minus The intra-frequency measurement report does not contain OFF and TM of the
ZTE Confidential Proprietary copy 2012 ZTE CORPORATION All rights reserved 39
UMTS KPI Optimization Analysis Guide Internal Use Only
target cell
minus When the intra-frequency handover happens between RNCs the Iur interface is unavailable
minus The UE performs the multiuser detection in the active set cell but the target cell does not support the multiuser detection
minus The target cell and the original cell belong to different classifications (The cells of R99 R5+R99 and R6+R5+R99 belong to the same classification while the cells of R5 and R6+R5 belong to another classification)
Inter-frequency hard handovers The inter-frequency hard handover means a UE connection is handed over from a cell of a UTRAN frequency to a cell of another frequency Many factors including the radio quality the load and the speed of the moving UE may trigger inter-frequency hard handovers
For example the radio quality triggers the inter-frequency hard handover in the following way
When the quality of the UE radio frequency becomes lower the inter-frequency measurement will be triggered and according to the measurement result the UE connection will be handed over to a better frequency
ZTE Confidential Proprietary copy 2012 ZTE CORPORATION All rights reserved 40
UMTS KPI Optimization Analysis Guide Internal Use Only
4422 Hard Handover Optimization Flowchart
Figure 4-13 Hard handover optimization flowchart
ZTE Confidential Proprietary copy 2012 ZTE CORPORATION All rights reserved 41
UMTS KPI Optimization Analysis Guide Internal Use Only
Extract performance data
TOP Ncell filtering
Analyze a single cell
1 Check NE alarms
2 Associate emergencies
3 Compare parameter
configurations
4 Associate indicators
5 Locate the fault
comprehensive ly
Exist or not
Handle alarms
Solved or not
Yes
Yes
End
No
Exist or not
Handle emergencies
Solved or not
YesNo
Exist or not
Correct wrong parameter
configurations
Solved or not
Yes
No
No
List related indicator counters
RTWPResource
limit indicators
Checkamp analysis of interference
Optimization analysis of
resource limit
Counters related to inter-frequency handover failures
C301110489 C301110516C301110499 C301110517C301110500 C301110518C301110501 C301110519C301110502 C301110520C301110503 C301110521C301110504 C301110522C301110505 C301110523
Solved or not
Yes
Yes
No
Drive Test+RNC signaling
trace
Yes
Counters related to hard handover
failures
30041 3004230043 3004430045 3004630047 30048
Cell hand-inhand-out indicators
NoNo
ZTE Confidential Proprietary copy 2012 ZTE CORPORATION All rights reserved 42
UMTS KPI Optimization Analysis Guide Internal Use Only
4423 Hard Handover Optimization Methods
The optimization flow for the hard handover is similar to that of the soft handover The major differences are in the parameter optimization To optimize intra-frequency hard handovers you can properly reduce the Event 1D hysteresis and the time to trigger Event 1D according to the real radio environment to ensure timely handovers
Inter-frequency coverage is often applied to some special scenarios such as indoor coverage and tested through CQT The method of judging whether there is missed configuration of the inter-frequency neighboring cell is almost the same as that of the co-frequency neighboring cell when a call drop occurs the UE fails to measure or report the inter-frequency neighboring cell after the call drop the UE resides in the inter-frequency neighboring cell again
The common hard handover problems are
1 The handover is not prompt The common symptoms are frequent call drops in the hard handovers when the UE moves
Solutions
Increase the threshold of activating the compressing mode The compressing mode is usually activated before the inter-frequency handover or the inter-RAT handover and it is used to measure the quality of the inter-frequency or inter-RAT cell You can set a threshold of the CPICH RSCP or EcIo to activate the compressing mode And the RSCP is widely used
minus Requirements on setting the threshold of activating the compressing mode Before the cell quality becomes low enough to cause a call drop the signal of the target cell should be measured and reported and the handover should be performed
minus Requirement on setting the threshold of deactivating the compression mode Frequent activationdeactivation of the compression mode should be avoided
Increase CIOs of the inter-frequency cell pair
Reduce the threshold of triggering the target frequency handover under the inter-frequency coverage
2 There are pingpong handovers
Solution Increase the hard handover hysteresis and the time to trigger the event
ZTE Confidential Proprietary copy 2012 ZTE CORPORATION All rights reserved 43
UMTS KPI Optimization Analysis Guide Internal Use Only
443 Optimization of Inter-RAT Handovers
4431 Configuring Basic Inter-RAT Parameters
Most of the inter-RAT handover failures are caused by incomplete parameter configuration The following parameters need special attention
Complete RNC parameter configuration for the GSM neighboring cell The 2G system shall provide the 3G system with the correct radio parameters based on negotiation mdash MCC MNC LAC ID (CI) NCC BCC frequency band indicator (900 or 1800) and BCCH
Table 4-3 Parameters That 2G Shall Provide to 3G
MCC MNC LACIDCI
NCC BCCFrequency
band indicator
BCCH
460 2 202 193 0 0 900 102
Complete GSM BSC parameter configuration for the WCDMA neighboring cell The 3G system shall provide the 2G system with the correct radio parameters based on negotiation mdash MCC MNC LAC RNC ID cell ID (C_ID) downlink frequency scrambling code and RAC
Table 4-4 Parameters That 3G Shall Provide to 2G
MCC MNC LACRNC
IDCell IDC_ID
Downlink frequency
Scrambling code
RAC
460 3 20 18 51 10787 51 20
According to the current strategy of one-way inter-RAT handovers if the parameter configuration is complete one probable cause of the inter-RAT handover failure is that the handover is not prompt The common parameter adjustment is to increase CIO the threshold to activatedeactivate the compressing mode and the threshold to trigger the WCDMA-to-GSM handover at the same time
Call drops during the inter-RAT handovers between WCDMA and GSM may be caused by
minus Inconsistent data configuration at the GSM side and the WCDMA side after GSM modifies the configuration data but does not inform WCDMA
minus Missed configuration of neighboring cells which can be solved by the correct configuration of neighboring cells
minus Too fast signal changes
ZTE Confidential Proprietary copy 2012 ZTE CORPORATION All rights reserved 44
UMTS KPI Optimization Analysis Guide Internal Use Only
minus Pingpong reselection
minus Faults with the UE for example the UE fails to respond to the handover or report the inter-RAT measurement report
minus Changes of the best server during the physical channel reallocation
minus Wrong LAC configuration which can be located through data configuration check
ZTE Confidential Proprietary copy 2012 ZTE CORPORATION All rights reserved 45
UMTS KPI Optimization Analysis Guide Internal Use Only
4432 Inter-RAT Handover Optimization Flowchart
Figure 4-14 Inter-RAT handover optimization flowchart
ZTE Confidential Proprietary copy 2012 ZTE CORPORATION All rights reserved 46
UMTS KPI Optimization Analysis Guide Internal Use Only
Extract performance data
TOP Ncell filtering
Analyze a single cell
1 Check NE alarms
2 Associate emergencies
3 Compare parameter
configurations
4 Associate indicators
5 Locate the fault
comprehensive ly
Exist or not
Handle alarms
Solved or not
Yes
Yes
End
No
No
Exist or not
Handle emergencies
Solved or not
Yes
No
No
Exist or not
Correct wrong parameter
configurations
Solved or not
Yes
No
No
List related indicator counters
RTWPResource
limit indicators
Checkamp analysis of interference
Optimization analysis of
resource limitCounters related to inter-RAT handover failures
C301130667 C301130681C301130668 C301130682C301130669 C301130690C301130670 C301130691C301130671 C301130692C301130672 C301130693C301130673 C301130694C301130674 C301130696C301130675 C301130697C301130677 C301130698C301130678 C301130699C301130679 C301130700
C301130680
Solved or not
Yes
Yes
No
Drive Test+RNC signaling
trace
Yes
Counters related to inter-RAT handover
failures
Cell hand-inhand-out indicators
30049 3005030051 3005230053 30054
ZTE Confidential Proprietary copy 2012 ZTE CORPORATION All rights reserved 47
UMTS KPI Optimization Analysis Guide Internal Use Only
45 Optimization of Resource Indicators
The resource indicators directly reflect the system capacity Increasing subscribers will consume more system resources and some resources may be limited for example the code resource may be limited the TCP access request may be rejected and the CE resource usage rate may exceed the threshold Limited system resources have a negative influence on the whole-network indicators and the subscribersrsquo perception for example call drops may frequently happen and more TCP access requests may be rejected during the voice services
Table 4-5 Resource KPIs and Alarm Thresholds
Resource type KPI No and nameAlarm
threshold
TCP
C301320150 Number of rejected services DCH downlink TCP limit
50
PI30167 Average non-HS (SOA) (SOA)DPA TCP 40
PI30092 Maximum Cell TCP () 100
PI30093 Average Cell TCP 70
UL TrafficPI30029 Handover Blocking Rate 05
KPI RTWP (in busy hour) -98 dBm
Code
C301320153 Number of rejected services DCH no code
50
PI30205 Average Cell HSUPA Users 12
PI30172 Cell Average HSDPA Users 16
CE
PI301830006 Maximum use Ratio of Uplink NodeB CE
60
PI301830010 Maximum use Ratio of Downlink NodeB CE
60
ZTE Confidential Proprietary copy 2012 ZTE CORPORATION All rights reserved 48
UMTS KPI Optimization Analysis Guide Internal Use Only
451 Resource Indicator Optimization Flowchart
Figure 4-15 Resource indicator optimization flowchart
ZTE Confidential Proprietary copy 2012 ZTE CORPORATION All rights reserved 49
UMTS KPI Optimization Analysis Guide Internal Use Only
Extract performance data
TOP Ncell filtering
Analyze a single cell
1 Check NE alarms
2 Associate emergencies
3 Compare parameter
configurations
4 Associate indicators
5 Locate the fault
comprehensive ly
Exist or not
Handle alarms
Solved or not
Yes
是
End
No
No
Exist or not
Handle emergencies
Solved or not
Yes
No
No
Exist or not
Correct wrong parameter
configurations
Solved or not
Yes
No
No
List related indicator counters
Code resource indicators
CE resource indicators
TCPadmission
reject counter
C301320150
Solved or not
Yes
Yes
No
Drive Test+RNC signaling
trace
Yes
Counter related to TCP limit
Cell TX power
indicators
30090 3009130092 3009330166 3016730168 3016930170 30171
30163301643016530075
30223302243045030451
Yes
Yes
ZTE Confidential Proprietary copy 2012 ZTE CORPORATION All rights reserved 50
UMTS KPI Optimization Analysis Guide Internal Use Only
452 Code Resource Optimization
The statistics of Number of rejected services and DCH no code the average code resource usage rate and the number of the HSDPA subscribers can be used to judge whether the code resource in a cell is limited If the code resource is limited you can adjust the code resource allocation to alleviate the situation
Based on the system algorithm when Formula 1 is satisfied you can add an HS-PDSCH when Formula 2 is satisfied then an HS-PDSCH is deleted
Formula 1 OcuRateNoHspdsch + OcuRateHspdsch + DpchCodeHy + 32 lt= 512
Formula 2 OcuRateNoHspdsch + OcuRateHspdsch + CodeUptHyA gt 512
OcuRateHspdschHSPDSCH means the number of the codes of SF=512 blocked by the HS-PDSCH OcuRateNoHspdsch means the number of codes of SF=512 blocked by other channels DpchCodeHy means the number of codes of SF=512 reserved for the DPCH and CodeUptHyA is the threshold to decide whether to delete the HSPDSCH
Therefore to ensure the access of the R99 subscribers you can make some adjustment according to Table 4-6 when the code resource is limited though the HSDPA rate may decrease
Table 4-6 Adjusting Code Resource Allocation
AbbreviationParameter
nameRange
and stepCurrent value
Update value
Remark
DpchCodeHy DPCH Code Hysteresis
0512 16 28
To decrease the number of rejected services for DCH no code
CodeUptHyACode Update Hysteresis A
0512 16 28
To decrease the number of rejected services for DCH no code
453 Monitoring CE Resource
The CE resource is mainly monitored through the maximum UE uplinkdownlink usage rate If there is any problem you can solve it by controlling the load or adding more boards
ZTE Confidential Proprietary copy 2012 ZTE CORPORATION All rights reserved 51
UMTS KPI Optimization Analysis Guide Internal Use Only
454 Optimization of Power Control
4541 Monitoring and Optimizing Downlink Power Control
Limited TCP in busy hours will not only increase access failures and call drops in the local cell but also increase soft handover failures and call drops in the neighboring cells Number of rejected services and DCH downlink TCP limit are intuitive KPIs to judge whether TCP is limited Although limited uplink capacity and massive UE moves in the rush hours may also cause call drops the limited TCP is absolutely a key factor
Based on the system algorithm MinHsdpaPower (MinHspaPwrRto) + NoHsPower gtNode B if the safety threshold is used (MinHsdpaPower means the power reserved for HSPA) then it will activate the downlink rate downgrade algorithm flow for the congestion (lower the downlink DCH rate) Although the rate downgrade can ensure access of some subscribers it is an irregular action and will degrade the performance
455 Speeding up Rate Downgrade
Considering that the cells with heavy load reject more access requests you can speed up the rate downgrade during the resource congestion to release the resources as soon as possible and avoid call drops caused by access failures (this method is only applicable to the cells with many PS service users but not those with only CS service users) Table 4-7 is an example of the parameter modification for the rate downgrade
Table 4-7 Example of Parameter Modification for Rate Downgrade
Abbreviation Parameter nameRange and
stepCurrent value
Update value
Remark
UlDnMaxStg Maximum Number of Degraded Uplink Load Steps Every Time
[1 8] 1 2 Downgrade from 384 Kbps to 16 Kbps
DlDnMaxStg Maximum Number of Degraded Downlink Load Steps Every Time
[1 8] 1 3 Downgrade from 384 Kbps to 8 Kbps
456 Monitoring and Optimizing Uplink Capacity
Handover Blocking Rate and RTWP can reflect the uplink capacity of the cell Because interference may also increase RTWP this factor should be distinguished during the RTWP monitoring Another effective indicator is the voice service erl If a cell has over 20 erls in busy hours you should pay special attention to it
ZTE Confidential Proprietary copy 2012 ZTE CORPORATION All rights reserved 52
UMTS KPI Optimization Analysis Guide Internal Use Only
457 Optimization of Uplink Capacity at the Whole Network Level
Case The uplink capacity was limited in a large number of sites after the cutover and the symptoms are a sharp rise of RTWP and a high call drop rate during the rush hours
After the following parameters were modified as shown in Table 4-8 the problem was solved
Table 4-8 Example of Power Control Parameter Modification
AbbreviationParameter
nameRange
Current value
Update value
ULINITSIRUplink Initial SIR target (dB)
UL 34 K136 K signaling UL 122 K AMR
4-5 35
ULMAXSIRMaximum Uplink SIR target (dB)
UL 34 K136 K signaling UL 122 K AMR
15 10
UlSirTargDnStepUplink SIR Target Down Step Size (dB)
UL 34 K136 K signaling UL 122 K AMR
01 02
458 Optimization of Uplink Capacity for a Single Cell
A lot of optimization measures can be taken to bring down the rising RTWP However with increasing subscribers the capacity may still be limited in some area while further modification of SirTarget will obviously degrade the call quality of the whole network and undermine the subscribersrsquo perception In this case you can adjust the power control parameters for a single site that has heavy traffic in the following way add one set of DivPc parameters and use this set of parameters only for this site
Case Table 4-9 shows an example of the power control parameter modification After this modification the call drop rate in the site with heavy traffic decreased to one quarter of the original one
Table 4-9 Example of Power Control Parameter Modification for Heavy-Traffic Cell
SRVTYPE ULINITSIR ULMAXSIR ULMINSIR
0 35-gt15 100-gt35 20-gt10
104 40-gt20 150-gt50 05-gt0
28 35-gt15 100-gt35 05-gt0
50 60-gt20 150-gt50 20-gt0
54 60-gt20 150-gt50 20-gt0
ZTE Confidential Proprietary copy 2012 ZTE CORPORATION All rights reserved 53
UMTS KPI Optimization Analysis Guide Internal Use Only
412 CS Call Drop Analysis Flowchart
Figure 4-8 CS call drop analysis flowchart
ZTE Confidential Proprietary copy 2012 ZTE CORPORATION All rights reserved 17
UMTS KPI Optimization Analysis Guide Internal Use Only
Extract performance data
CS TOP Ncell filtering
Analyze a single cell
1 Check NE alarms
2 Associate emergencies
3 Compare parameter
configurations
4 Associate indicators
5 Locate the fault
comprehensively
Exist or not
Handle alarms
Solved or not
Yes
Yes
End
No
No
Exist or not
Handle emergencies
Solved or not
Yes
No
No
Exist or not
Correct wrong parameter
configurations
Solved or not
Yes
No
No
List related indicator counters
Call-drop-related
countersRTWP
Handover success rate
Traffic volume
Resource limit indicators
Checkamp analysis of
interference
Optimizationanalysis of
handover failures
Optimization analysis of
resource limitCall-drop-
related counters
C301230362C301230363C301230365C301230315C301230316C301230318C301230319C301230322C301230323
Solved or not
Yes
Yes
No
Drive Test+RNC signaling
trace
Yes
ZTE Confidential Proprietary copy 2012 ZTE CORPORATION All rights reserved 18
UMTS KPI Optimization Analysis Guide Internal Use Only
42 PS Call Drop Optimization
421 Optimization Flowchart
Figure 4-9 PS call drop optimization flowchart
ZTE Confidential Proprietary copy 2012 ZTE CORPORATION All rights reserved 19
UMTS KPI Optimization Analysis Guide Internal Use Only
Extract performance data
PS TOP Ncell filtering
Analyze a single cell
1 Check NE alarms
2 Associate emergencies
3 Compare parameter
configurations
4 Associate indicators
5 Locate the fault
comprehensive ly
Exist or not
Handle alarms
Solved or not
Yes
Yes
End
No
No
Exist or not
Handle emergencies
Solved or not
Yes
No
No
Exist or not
Correct wrong parameter
configurations
Solved or not
Yes
No
No
List related indicator counters
Call -drop-related
countersRTWP
Handover success rate
Traffic volume
Resource limit indicators
Check amp analysis of interference
Optimizationanalysis of
handover failures
Optimization analysis of
resource limitCall -drop-
related counters
C301230372C301230373C301230375C301230330C301230332C301230333C301230334C301230337C301230338
Solved or not
Yes
Yes
No
Drive Test +RNC signaling
trace
Yes
ZTE Confidential Proprietary copy 2012 ZTE CORPORATION All rights reserved 20
UMTS KPI Optimization Analysis Guide Internal Use Only
43 Optimization of Accessibility Indicators
Accessibility performance includes the success rate of RRC connection setup and the success rate of CSPS RAB assignment These two kinds of KPIs play important roles in the network optimization and directly influence the success rate of CSPS service establishment In this document this kind of problems are found from the aspect of OMC data and solved through parameter optimization
431 Definition of Access Failure
For the mobile originated call in the CS domain the access failure event means that the UE sends RRC REQUEST and IE establish cause is Originating Conversational Call but alerting of the direct transfer message is not received
The relevant events are defined as follows in the access failure stage
RRC connection setup failure After considering the resending times and the waiting time the UE sends RRC CONNECTION REQUEST and does not receive the response from RNC or RRC CONNECTION REJECT delivered by RNC
Initial direct transfer and security mode establishment failure After sending RRC CONNECTION SETUP COMPLETE the UE does not send NAS SETUP
RAB assignment failure After receiving CALL PROCEEDING the UE does not receive RB SETUP delivered by RNC Or the UE replies with RB SETUP FAIL after receiving RB SETUP Or the UE receives DISCONNECT with the cause value not being Normal Release after receiving RB SETUP At this time the UE has not reported RB SETUP CMP
Failure after RAB assignment After the UE sends RB SETUP COMPLETE the originating UE receives DISCONNECTRELEASE from CN Or the UE waits CONNECT or ALERTING overtime and launches the Call Clearing process Or the UE becomes IDLE before receiving Alerting and starts to receive the system message
For the mobile terminated in the CS domain the access failure event means that the terminating UE receives the paging of paging type 1 and does not send RRC CONNECTION REQUEST with the cause value being Terminating Conversational Call Or the UE does not send the alerting of direct transfer message to CN after sending RRC CONNECTION REQUEST
The relevant events are defined as follows in the access failure stage
RRC connection setup failure After sending RRC CONNECTION REQUEST the UE does not receive the response from RNC or RRC CONNECTION REJECT delivered by RNC
Initial direct transfer and security mode establishment failure After sending RRC
ZTE Confidential Proprietary copy 2012 ZTE CORPORATION All rights reserved 21
UMTS KPI Optimization Analysis Guide Internal Use Only
CONNECTION SETUP COMPLETE the UE does not receive the SETUP direct transfer message Or the UE sends RELEASE COMPLETE Or the UE receives DISCONNECT from CN
RAB assignment failure The UE does not receive RB SETUP delivered by RNC after sending CALL CONFIRM Or the UE replies with RB SETUP FAIL after receiving RB SETUP Or the UE receives DISCONNECT with the cause value not being Normal Release after receiving RB SETUP At this time the UE has not reported RB SETUP CMP
Failure after RAB assignment After the UE sends RB SETUP COMPLETE the terminating UE receives DISCONNECTRELEASE from CN
432 Analysis on RRC Connection Failures
The problem of RRC connection setup failure can be analyzed through the UE signaling flow and RNC single-user tracing The RRC connection setup includes the following steps
The UE sends RRC Connection Request through the RACH channel
RNC sends RRC Connection Setup through the FACH channel
The UE sends RRC Connection Setup Complete through the dedicated uplink channel after the downlink dedicated channel is established and synchronized
RRC connection setup failures are always caused by following issues
Uplink RACH problem
Problem about downlink FACH power allocation proportion
Parameter reselection problem of the cell
Low downlink dedicated initial transmitting power
Uplink initial power control problem
Congestion
Equipment malfunctions
Among these issues the problems of uplink RACH downlink FACH power allocation proportion parameter reselection of the cell and equipment malfunctions appear more frequently
ZTE Confidential Proprietary copy 2012 ZTE CORPORATION All rights reserved 22
UMTS KPI Optimization Analysis Guide Internal Use Only
4321 Analysis Flowchart of RRC Connection Setup Failures
Figure 4-10 Analysis flowchart of RRC connection setup failures
ZTE Confidential Proprietary copy 2012 ZTE CORPORATION All rights reserved 23
UMTS KPI Optimization Analysis Guide Internal Use Only
Extract performance data
TOP Ncell filtering
Analyze a single cell
1 Check NE alarms
2 Associate emergencies
3 Compare parameter
configurations
4 Associate indicators
5 Locate the fault
comprehensive ly
Exist or not
Handle alarms
Solved or not
Yes
Yes
End
No
No
Exist or not
Handle emergencies
Solved or not
Yes
No
No
Exist or not
Correct wrong parameter
configurations
Solved or not
Yes
No
No
List related indicator counters
Counters related to RRC setup
failuresRTWP
Resource limit
indicators
Checkamp analysis of interference
Optimization analysis of
resource limitCounters related
to RRC setup failures
C301480485C301480486C301480487C301480489C301480490C301480491C301481288C301481289C301481337C301481338C301481339C301481407C301481408
Solved or not
Yes
Yes
No
Drive Test+RNC signaling
trace
Yes
ZTE Confidential Proprietary copy 2012 ZTE CORPORATION All rights reserved 24
UMTS KPI Optimization Analysis Guide Internal Use Only
4322 UE sends RRC Connection Request but RNC does not receive it
If the EcIo of downlink CPICH is relatively low it is the problem of coverage
If the EcIo of downlink CPICH is not very low (for example the value is larger than -14 dB) Usually it is the problem of RACH and the following issues may cause the problem
minus The power of Preamble does not rise to a required value and the rising times of Preamble should be increased
minus The output power of UE is lower than the required value which is caused by poor UE performance In this case the UE should be changed
minus The NodeB equipment has a standing wave and the engineer should check whether NodeB has any SWR alarm
minus The radius of the cell is set improperly If the radius parameter of the cell is set too small the NodeB can not synchronize the UE beyond the range of the radius and the access fails This problem often happens in the places with large coverage such as the rural areas and the suburbs
4323 RNC delivers RRC Connection Reject after receiving RRC Setup Request
When RRC Connection Reject appears the engineer should check the specific reject cause value Usually there are two kinds of causes
The CPU load of RNC control plane board is too heavy and more boards should be added
DCH and FACH admission is rejected However this situation does not always happen
4324 UE does not receive RRC Connection Setup delivered by RNC
This problem may be caused by the following reasons
Poor coverage
Improper parameters of cell selection and reselection
Checking method The engineer should check the EcIo of CPICH If the value is lower than -12 dB (EcIo is -12 dB by default) and there is no cell of better quality in the monitor set the cause of this problem is poor coverage If there is better cell in the monitor set cell reselection may cause this problem
Poor coverage can be improved by coverage enhancement such as adding some sites to cover the places without signal coverage and adjusting the engineering parameters If the coverage can not be improved the engineer can enhance the FACH power according to
ZTE Confidential Proprietary copy 2012 ZTE CORPORATION All rights reserved 25
UMTS KPI Optimization Analysis Guide Internal Use Only
the PCPICH EcIo coverage of the current network For example if all the pilot EcIo values are larger than -12 dB in the coverage area the power proportion of the common channel should be configured on the basis of the situation that the EcIo value is larger than -12 dB And so the success rate of the idle UE assessment can be ensured
As for the access problem caused by cell selection and reselection the engineer can speed up the cell selection and reselection by adjusting the cell selection and reselection parameters and the problem of RRC connection setup failure caused by improper cell selection and reselection parameters can be solved
Note
The RRC Connection Setup message is borne by FACH RRC Connection Request sent by the UE is received by UTRAN at the preamble of PRACH and then it is sent from the RACH channel based on the current preamble power And the transmit power of preamble can rise all the time until the response is received (There is a limitation for the maximum number of preamble retransmissions) Therefore in the areas with poor coverage the RACH coverage and FACH coverage may become unbalanced and as a result UTRAN can receive RRC Connection Request sent by the UE but the UE can not receive RRC Connection Setup sent by RNC
4325 UE receives RRC Connection Setup and does not send RRC Setup Complete
If the downlink signal quality is normal this problem may be caused by the abnormal condition of the cell phone
Another reason of this problem may be the downlink synchronization failure caused by the low initial power of downlink dedicated channel You can solve this problem by adjusting the service downlink EbNo
4326 RNC does not receive RRC Setup Complete sent by UE
Because the uplink initial power control may increase the UE transmit power this kind of problem seldom appears If it appears the engineer can increase the Constant Value of the dedicated channel properly to raise the uplink DPCCH initial transmission power of the UE
At the same time this problem is also relevant with the uplink SIR initial target value configuration because this value may affect the uplink initial synchronization at the initial stage of link setup If the value of the parameter is set too large there will be too much uplink inference brought by the initial setup of the link If the value is set too small the uplink synchronization will take longer time and the initial synchronization may even fail This parameter is an RNC-level parameter which has a great influence on network performance Therefore the engineer should be cautious while adjusting this parameter
ZTE Confidential Proprietary copy 2012 ZTE CORPORATION All rights reserved 26
UMTS KPI Optimization Analysis Guide Internal Use Only
Note
RRC Connection Setup Complete is sent through uplink DPCH and the UE calculates the initial power of uplink DPCCH according to the received IErdquoDPCCH_Power_offsetrdquo and the measured CPICH_RSCP value
DPCCH_Initial_power = DPCCH_Power_offset - CPICH_RSCP
DPCCH_Power_offset = Primary CPICH DL TX Power + UL Interference + Constant Value The Constant Value can be configured in the OMC If this value is set too small the UE may not have enough power to send RRC Connection Setup Complete
433 Analysis on RABRB Setup Failures
When RAB or RB setup fails RNC will send RAB Assignment Fail in the RAB Assignment Response signaling The engineer can find out the specific failure reason from the failure cause value carried in relevant cells The reasons for common RABRB setup failures include
RNC directly rejecting RAB Setup Request because of wrong parameter configuration
Admission reject
RAB setup failure because the UE fails to respond to RB Setup Request
RAB setup failure because the Uu interface fails to set up RB
ZTE Confidential Proprietary copy 2012 ZTE CORPORATION All rights reserved 27
UMTS KPI Optimization Analysis Guide Internal Use Only
4331 Analysis Flowchart of RAB Setup Failures
Figure 4-11 Analysis flowchart of RAB setup failures
ZTE Confidential Proprietary copy 2012 ZTE CORPORATION All rights reserved 28
UMTS KPI Optimization Analysis Guide Internal Use Only
Extract performance data
TOP Ncell filtering
Analyze a single cell
1 Check NE alarms
2 Associate emergencies
3 Compare parameter
configurations
4 Associate indicators
5 Locate the fault
comprehensively
Exist or not
Handle alarms
Solved or not
Yes
Yes
End
No
No
Exist or not
Handle emergencies
Solved or not
Yes
No
No
Exist or not
Correct wrong parameter
configurations
Solved or not
Yes
No
No
List related indicator counters
Counters related to RAB setup failures RTWP
Resource limit
indicators
Checkamp analysis of interference
Optimization analysis of
resource limitCounters related to RAB setup failures
CS domain PS domainC301230290 C301230302C301230291 C301230303C301230292 C301230304C301230293 C301230305C301230294 C301230306C301230295 C301230307C301230296 C301230308C301230297 C301230309C301230298 C301230310C301230299 C301230311C301230300 C301230312C301230301 C301230313
Solved or not
Yes
Yes
No
Drive Test+RNC signaling
trace
Yes
ZTE Confidential Proprietary copy 2012 ZTE CORPORATION All rights reserved 29
UMTS KPI Optimization Analysis Guide Internal Use Only
4332 RNC Directly Rejecting RAB Setup Request Because Of Wrong Parameter Configuration
The case that RNC responds with RAB Setup Failure directly is seldom caused by invalid parameter configuration in the business network Usually this case is caused by special operations of the special users
The main scenario is that the subscription information of the userrsquos PS service is beyond the capability of the UE which leads to the direct refusal from RNC For example a special userrsquos subscription rates of uplink and downlink are 384 K but the maximum uplink rate of the UE is only 64 K The maximum uplink and downlink rates of the QoS message used for activating PDP set by the AT command or mobile terminal software used by the user are 384 K so the RNC will find the maximum uplink rate is beyond the UErsquos capability directly reply with RAB Setup Failure and will not launch the RB setup process when it receives RAB Assignment Request
After the RAB setup fails because the parameter configuration is beyond the UErsquos capability SGSN will negotiate again to launch the new RAB assignment until the UE has the capability to support the assignment and the RAB assignment is finished For the users the PDP activation is still successful and the actual maximum rate is the maximum rate the UE can support
However if the minimum guaranteed bit rate required by the QoS setting in the UErsquos PDP activation request is beyond the UErsquos capability though the network negotiates a lower rate to accept the UErsquos PDP activation request the UE will launch the request of deactivating PDP when it finds that the rate negotiated by the network in PDP activation accept request is lower than the minimum guaranteed bit rate and finally the PDP activation can not be completed
4333 Admission Reject
For the non-HSDPA user if there are insufficient system resources (including power channel code lub transmission resource and CE) the call establishment failure will be caused by the admission reject At this time it is necessary to check the network load code resource lub transmission resource and CE resource occupation to make sure the congestion is caused by the limitation of a certain kind of resource What is more the engineer should plan the corresponding expansion method
If the cell does not support the HSDPA service the R99 user admission is judged according to the fixed R99 admission threshold If the cell supports the HSDPA service and the HSDPA and R99 dynamic power is allocated the uplink admission of non-HSDPA is judged based on RTWP or the equivalent user number If the uplink load is too heavy the non-HSDPA user admission will also fail
If the bandwidth configuration on the lub interface is insufficient the lub interface will reject the R99 data service activation because of limited bandwidth
ZTE Confidential Proprietary copy 2012 ZTE CORPORATION All rights reserved 30
UMTS KPI Optimization Analysis Guide Internal Use Only
The admission control of the NodeB Credit resource is similar to the power admission control Whether the remaining Credit can support the currently requested service or not can be judged according to the spectrum spreading factor of the new access user According to the condition of the RAB Downsizing Switch RNC will deal with the issue in the corresponding way
For the HSDPA user in the dynamic power allocation mode besides the mentioned system resources such as the power channel code lub transmission resource and CE the admission reject should take into consideration whether the number of H users supported by NodeB and the number of H users supported by the cell are over the regulated threshold or not into consideration
For the HSDPA user when the bandwidth configuration on lub interface is insufficient the admission reject will not happen but the rate will be reduced What is more the AAL2PATHs of HSDPA and R99 are configured respectively and the HSDPA AAL2PATH must be configured to the HSDPA_RT or HSDPA_NRT type If the HSDPA AAL2PATH is configured to RT or NRT of R99 AAL2PATH type the RAB assignment failure will not happen but RNC will establish the HSDPA service as R99 384 Kbps
For the downlink power admission
Besides whether the R99 service load is over the non-HSDPA service threshold DCH service should take into consideration whether non-HSDPA power and HSDPA GBP (the minimum power needed for the guaranteed bit rate) are over the general power threshold of the cell
For the HSDPA service it is necessary to check whether the throughput rate provided by the cell is over the sum of all the usersrsquo GBR thresholds or whether the GBPs of the stream service and the background service are over the HSDPA power of the cell At the same time whether the non-HSDPA power and the HSDPA GBP (the minimum power needed for the guaranteed bit rate) are over the overall power threshold of the cell should be also taken into consideration
For the lub admission
For the DCH service the admission is made according to the multiplication of the peak rate and the service activation factor
For HSDPA service the admission is made according to the GBR
If the lub exceeds the congestion threshold the DCCC rate reduction will be triggered And if the RLC_AM retransmission rate is over a certain threshold the Iub Overbooking switch can be opened to trigger the TF which limits R99 or to reduce the rate of HSDPA service by a certain factor
ZTE Confidential Proprietary copy 2012 ZTE CORPORATION All rights reserved 31
UMTS KPI Optimization Analysis Guide Internal Use Only
4334 RAB Setup Failure Because the UE Fails to Respond to RB Setup
The UE fails to respond to RB setup mainly because of the userrsquos operation
Take the following cases as examples
When the user already has had the downlink 12 K data service he receives RB Setup Request of the VP service (either the originated call in the VP domain or the terminated call in the VP domain) Because the UE does not support the VP and high-speed PS service in the downlink at the same time it directly replies with RB Setup Failure and the cause value is unsupported configuration
Compared with the WCDMA subscriber originating the VP service the terminating subscriber resides in the GSM network and so it does not support the VP service After RNC receives RAB Assignment Request the core network will deliver the Disconnect command right after call proceeding and the cause value is Bearer capability not authorized At this time the UE has just received the RB SETUP command and has no enough time to finish the RB setup So the UE will reply with RB Setup Failure after it receives the Disconnect command and the RNC will reply with RAB Setup Failure with the cause value being failure in radio interface procedure
4335 RAB Setup Failure Because the Uu Interface Fails to Set Up RB
RNC sends the Radio Bearer Setup command to the UE but fails to receive Radio Bearer Setup Compete This kind of situation (RB setup failure) often appears in the cells with weak signals There are two causes of weak signals one is that the UE does not reside in the best server to launch the access and the other is poor coverage
If the UE does not reside in the best server to launch the access it will hope to enter the best server through active set update in the RB setup process (At the same time the fast signal change will drastically weaken the signals in the cell) but the active set update can only be processed after the RB setup is completed because the procedures can not be processed alternately (Neither the network nor the terminal supports it) Therefore RB can only be set up in the cell with weak signals and the setup is easy to fail As for this situation the starting threshold and speed of co-frequency cell reselection should be increased to make the UE reside in the best server and launch the access as soon as possible
RB setup failure may be caused by the poor downlinkuplink coverage If the failure is caused by downlink coverage the UE can not receive the Radio Bearer Setup command which may be caused by the uplink interference and this can be fixed through checking RTWP The poor downlink coverage is partly caused by the bad UE demodulation performance and other causes should be solved by RF optimization
ZTE Confidential Proprietary copy 2012 ZTE CORPORATION All rights reserved 32
UMTS KPI Optimization Analysis Guide Internal Use Only
44 Optimization of Mobility Indicators
Mobility indicators mainly fall into three categories mdash soft handovers hard handovers and inter-RAT handovers The handover problems usually happen in the following cases
The best server changes too fast or there is no best server due to pilot pollution
The handover is not prompt or there are pingpong handovers due to improper parameter configuration
Adjust the engineering parameters for antennas in areas with severe pilot pollution And adjust the handover parameters such as the values of 1A 1B CIO TTT (time to trigger) Hysteresis and so on to solve the problem that the handover is not prompt or there are pingpong handovers This section tries to solve this kind of problems through OMC data analysis and parameter optimization
441 Optimization of Soft Handovers
Missed neighboring cell configuration pilot pollution improper soft handover parameter configuration and equipment malfunctions are the major causes of soft handover failures To confirm the problems the field DTs are required
ZTE Confidential Proprietary copy 2012 ZTE CORPORATION All rights reserved 33
UMTS KPI Optimization Analysis Guide Internal Use Only
4411 Soft Handover Optimization Flowchart
Figure 4-12 Soft handover optimization flowchart
ZTE Confidential Proprietary copy 2012 ZTE CORPORATION All rights reserved 34
UMTS KPI Optimization Analysis Guide Internal Use Only
Extract performance data
TOP Ncell filtering
Analyze a single cell
1 Check NE alarms
2 Associate emergencies
3 Compare parameter
configurations
4 Associate indicators
5 Locate the fault
comprehensive ly
Exist or not
Handle alarms
Solved or not
Yes
Yes
End
No
No
Exist or not
Handle emergencies
Solved or not
Yes
No
No
Exist or not
Correct wrong parameter
configurations
Solved or not
Yes
No
No
List related indicator counters
RTWPResource
limit indicators
Checkamp analysis of interference
Optimization analysis of
resource limitCounters related to intra-frequency
handover failures
C301391101 C301390593C301391102 C301390594C301391103 C301390595C301390586 C301390596C301390587 C301390597C301390588 C301390598C301390589 C301390599C301390590 C301390600C301390591 C301390601C301390592 C301390602
Solved or not
Yes
Yes
No
Drive Test+RNC signaling
trace
Yes
Counters related to soft handover
failures
30055 3005630057 3005830059 3006030061 30062
Cell hand-inhand-out indicators
ZTE Confidential Proprietary copy 2012 ZTE CORPORATION All rights reserved 35
UMTS KPI Optimization Analysis Guide Internal Use Only
4412 Checking Missed Neighboring Cell Configuration
Generally speaking most of the call drops at the beginning of the optimization are caused by missed neighboring cell configuration The following methods are often used to judge whether the call drops are caused by missed configuration of co-frequency neighboring cells
Observe the active set EcIo information recorded by the UE and the Best Server EcIo information recorded by the Scanner before the call drop If the former record is very bad but the latter record is very good then check whether the Best Server scrambling code recorded by the Scanner appears in the latest list of the neighboring cells under intra-frequency measurement control If it does not then the call drop is caused by missed neighboring cell configuration
If the UE re-accesses immediately after the call drop and the cell scrambling codes during the UE reaccess and those during the call drop are different then the call drop may also be caused by missed neighboring cell configuration You can confirm it through measurement control (look backwards from the message of the call drop event for the latest intra-frequency measurement control message and check the neighboring cell list of this message)
Some UE may report the Detected Set information If the corresponding scrambling code appears in the Detected Set information before the call drop then the call drop is caused by missed neighboring cell configuration
4413 Checking Pilot Pollution
Definition of pilot pollution Excessive strong pilot signals exist at a certain point but none of them is strong enough to be the best server To form pilot pollution the following points in this definition should be satisfied
Strong pilot signal The absolute pilot signal strength is used to judge whether the pilot signal is a strong one The pilot signal strength can be evaluated through the pilot RSCP If the pilot RSCP exceeds a threshold it is considered a strong pilot signal The formula is
AbsoluteRSCPThRSCPCPICH __ gt
Excessive The number of pilot signals is used to judge whether there are excessive pilot signals at a certain point If the number exceeds a threshold it is regarded that excessive pilot signals exist at this point The formula is
NThNumberCPICH gt_
None of them is strong enough to be the best server The relative strength of a pilot signal is a key factor in judging whether the pilot signal is strong enough Based on the above definition and formulae if the difference between the strength of the
ZTE Confidential Proprietary copy 2012 ZTE CORPORATION All rights reserved 36
UMTS KPI Optimization Analysis Guide Internal Use Only
strongest pilot signal and that of the )1( +NTh strongest pilot signal at this point is
less than a threshold it is regarded that there is no pilot signal strong enough to be the best server at this point The formula is
lativeRSCPthThbest ThRSCPCPICHRSCPCPICHN Re_)1( )__( ltminus +
According to the above description it is regarded that pilot pollution exists if the following conditions are both satisfied
The number of pilot signals that meet the condition
AbsoluteRSCPThRSCPCPICH __ gt is more than NTh
lativeRSCPthThbest ThRSCPCPICHRSCPCPICHN Re_)1( )__( ltminus +
For example during the network optimization suppose
dBmTh AbsoluteRSCP 95_ minus= 3=NTh and dBTh lativeRSCP 5Re_ = if the following
conditions are both satisfied then it is regarded that pilot pollution exists
The number of the pilot signals that meet the condition
dBmRSCPCPICH 95_ minusgt is more than 3
dBRSCPCPICHRSCPCPICH thbest 5)__( 4 ltminus
4414 Adjusting Soft Handover Algorithm Parameters
You can solve the following kinds of problems by adjusting handover algorithm parameters
1 The handover is not prompt
From the perspective of the CS service signaling flow the symptom of this problem is that the UE cannot receive Active Set Update (physical channel reallocation in the case of the intra-frequency hard handover) because after the UE reports the measurement report the source cell has a fast reduction in EcIo When the RNC sends Active Set Update the UE has closed the transmitter due to the loss of downlink synchronization Viewed from the UE side it cannot receive Active Set Update In the PS services if the UE cannot receive Active Set Update or TRB resets before the handover the handover will also fail
From the perspective of signals the following phenomena may accompany this problem
ZTE Confidential Proprietary copy 2012 ZTE CORPORATION All rights reserved 37
UMTS KPI Optimization Analysis Guide Internal Use Only
minus Corner effect EcIo of the source cell decreases drastically and EcIo of the target cell increases sharply (very high when it appears)
minus Fast fading EcIo of the source cell decreases quickly for a while and then increases and EcIo of the target cell increases for a short while
2 Pingpong handovers The following phenomena may accompany this problem
The best server changes quickly Two or more cells take turns to be the best server But as the best server none of the cells can last long though they has good RSCPs and EcIos
There is no best server There are multiple cells Their RSCPs are normal and similar to each other But EcIo of every cell is very bad
From the perspective of the signaling flow Event 1A is reported immediately after one cell is deleted Because the UE cannot receive Active Set Update from the RNC the handover fails
4415 Equipment Malfunctions
First check the alarm console to see whether there are abnormal alarms and analyze the message traces at the same time Find out in which step the soft handover fails Check the failure message and contact the local product maintaining engineer to confirm whether the equipment has malfunctions
4416 Solutions
Corresponding adjustments should be taken for the confirmed problems
Handover failures caused by pilot pollution Adjust the engineering parameters of a certain antenna to set this antenna as the best server in this interfered location If the power of one of its sectors is reduced then Io of the pilot pollution area will decrease even if the powers of other pilots are not adjusted EcIo will also increase Thereby the EcIo differences with other scrambling codes in the active set will become larger and pilot pollution will be eliminated Through a lot of research ZTE has proved that the reduction in the pilot transmit power will not change cell capacity greatly If condition allows new base stations can be added to cover this area
Equipment malfunctions Consult the customer service engineers and ask them to help check whether there are alarms and whether the transport layer is abnormal If there are alarms coordinate with the customer service engineers and the engineering personnel to solve the problems
Call drops because the handovers are not prompt
ZTE Confidential Proprietary copy 2012 ZTE CORPORATION All rights reserved 38
UMTS KPI Optimization Analysis Guide Internal Use Only
minus Adjust the antenna to expand the handover zone
minus Configure the Event 1A handover parameters to make the handover easier to happen
minus Increase CIO to make the handover happen earlier in the target cell The sum of CIO and the actually measured value is used for judging the UE events including the UE intra-frequency handover CIO helps shift the cell border in the handover algorithm If CIO is configured with a larger value the handover will be easier to happen and there will be more UE in the soft-handover status but more resources will be occupied If CIO is configured with a smaller value the soft handover will be more difficult to happen and the receiving quality may be impaired A CIO of about 5dB is quite good for eliminating the fast fading and the corner effect but this configuration has some side effects such as the increase of handover proportion
Call drops caused by pingpong handovers Adjust the antenna to form a best server in its coverage zone or set the Event 1B handover parameters (increase the threshold of Event 1B the Event 1B hysteresis or the time to trigger Event 1B) to increase the difficulty in deleting the active set
442 Optimization of Hard Handovers
4421 Classification of Hard handovers
Hard handovers mainly fall into two classifications
Intra-frequency hard handovers The intra-frequency hard handover is triggered only when the intra-frequency softsofter handover cannot be performed and it is applicable to the following circumstances
minus Inter-RNC intra-frequency cell handovers when there is no Iur interface
minus Insufficient Iur interface resources though there is the Iur interface
minus Handovers controlled by the threshold of the PS service rate in the handover cell
The intra-frequency softsofter handovers can not be performed (intra-frequency hard handover should be triggered) in the following scenarios
minus When the intra-frequency handover happens the UE is using the transmit diversity in the active set cell but the target cell does not support the transmit diversity
minus The intra-frequency measurement report does not contain OFF and TM of the
ZTE Confidential Proprietary copy 2012 ZTE CORPORATION All rights reserved 39
UMTS KPI Optimization Analysis Guide Internal Use Only
target cell
minus When the intra-frequency handover happens between RNCs the Iur interface is unavailable
minus The UE performs the multiuser detection in the active set cell but the target cell does not support the multiuser detection
minus The target cell and the original cell belong to different classifications (The cells of R99 R5+R99 and R6+R5+R99 belong to the same classification while the cells of R5 and R6+R5 belong to another classification)
Inter-frequency hard handovers The inter-frequency hard handover means a UE connection is handed over from a cell of a UTRAN frequency to a cell of another frequency Many factors including the radio quality the load and the speed of the moving UE may trigger inter-frequency hard handovers
For example the radio quality triggers the inter-frequency hard handover in the following way
When the quality of the UE radio frequency becomes lower the inter-frequency measurement will be triggered and according to the measurement result the UE connection will be handed over to a better frequency
ZTE Confidential Proprietary copy 2012 ZTE CORPORATION All rights reserved 40
UMTS KPI Optimization Analysis Guide Internal Use Only
4422 Hard Handover Optimization Flowchart
Figure 4-13 Hard handover optimization flowchart
ZTE Confidential Proprietary copy 2012 ZTE CORPORATION All rights reserved 41
UMTS KPI Optimization Analysis Guide Internal Use Only
Extract performance data
TOP Ncell filtering
Analyze a single cell
1 Check NE alarms
2 Associate emergencies
3 Compare parameter
configurations
4 Associate indicators
5 Locate the fault
comprehensive ly
Exist or not
Handle alarms
Solved or not
Yes
Yes
End
No
Exist or not
Handle emergencies
Solved or not
YesNo
Exist or not
Correct wrong parameter
configurations
Solved or not
Yes
No
No
List related indicator counters
RTWPResource
limit indicators
Checkamp analysis of interference
Optimization analysis of
resource limit
Counters related to inter-frequency handover failures
C301110489 C301110516C301110499 C301110517C301110500 C301110518C301110501 C301110519C301110502 C301110520C301110503 C301110521C301110504 C301110522C301110505 C301110523
Solved or not
Yes
Yes
No
Drive Test+RNC signaling
trace
Yes
Counters related to hard handover
failures
30041 3004230043 3004430045 3004630047 30048
Cell hand-inhand-out indicators
NoNo
ZTE Confidential Proprietary copy 2012 ZTE CORPORATION All rights reserved 42
UMTS KPI Optimization Analysis Guide Internal Use Only
4423 Hard Handover Optimization Methods
The optimization flow for the hard handover is similar to that of the soft handover The major differences are in the parameter optimization To optimize intra-frequency hard handovers you can properly reduce the Event 1D hysteresis and the time to trigger Event 1D according to the real radio environment to ensure timely handovers
Inter-frequency coverage is often applied to some special scenarios such as indoor coverage and tested through CQT The method of judging whether there is missed configuration of the inter-frequency neighboring cell is almost the same as that of the co-frequency neighboring cell when a call drop occurs the UE fails to measure or report the inter-frequency neighboring cell after the call drop the UE resides in the inter-frequency neighboring cell again
The common hard handover problems are
1 The handover is not prompt The common symptoms are frequent call drops in the hard handovers when the UE moves
Solutions
Increase the threshold of activating the compressing mode The compressing mode is usually activated before the inter-frequency handover or the inter-RAT handover and it is used to measure the quality of the inter-frequency or inter-RAT cell You can set a threshold of the CPICH RSCP or EcIo to activate the compressing mode And the RSCP is widely used
minus Requirements on setting the threshold of activating the compressing mode Before the cell quality becomes low enough to cause a call drop the signal of the target cell should be measured and reported and the handover should be performed
minus Requirement on setting the threshold of deactivating the compression mode Frequent activationdeactivation of the compression mode should be avoided
Increase CIOs of the inter-frequency cell pair
Reduce the threshold of triggering the target frequency handover under the inter-frequency coverage
2 There are pingpong handovers
Solution Increase the hard handover hysteresis and the time to trigger the event
ZTE Confidential Proprietary copy 2012 ZTE CORPORATION All rights reserved 43
UMTS KPI Optimization Analysis Guide Internal Use Only
443 Optimization of Inter-RAT Handovers
4431 Configuring Basic Inter-RAT Parameters
Most of the inter-RAT handover failures are caused by incomplete parameter configuration The following parameters need special attention
Complete RNC parameter configuration for the GSM neighboring cell The 2G system shall provide the 3G system with the correct radio parameters based on negotiation mdash MCC MNC LAC ID (CI) NCC BCC frequency band indicator (900 or 1800) and BCCH
Table 4-3 Parameters That 2G Shall Provide to 3G
MCC MNC LACIDCI
NCC BCCFrequency
band indicator
BCCH
460 2 202 193 0 0 900 102
Complete GSM BSC parameter configuration for the WCDMA neighboring cell The 3G system shall provide the 2G system with the correct radio parameters based on negotiation mdash MCC MNC LAC RNC ID cell ID (C_ID) downlink frequency scrambling code and RAC
Table 4-4 Parameters That 3G Shall Provide to 2G
MCC MNC LACRNC
IDCell IDC_ID
Downlink frequency
Scrambling code
RAC
460 3 20 18 51 10787 51 20
According to the current strategy of one-way inter-RAT handovers if the parameter configuration is complete one probable cause of the inter-RAT handover failure is that the handover is not prompt The common parameter adjustment is to increase CIO the threshold to activatedeactivate the compressing mode and the threshold to trigger the WCDMA-to-GSM handover at the same time
Call drops during the inter-RAT handovers between WCDMA and GSM may be caused by
minus Inconsistent data configuration at the GSM side and the WCDMA side after GSM modifies the configuration data but does not inform WCDMA
minus Missed configuration of neighboring cells which can be solved by the correct configuration of neighboring cells
minus Too fast signal changes
ZTE Confidential Proprietary copy 2012 ZTE CORPORATION All rights reserved 44
UMTS KPI Optimization Analysis Guide Internal Use Only
minus Pingpong reselection
minus Faults with the UE for example the UE fails to respond to the handover or report the inter-RAT measurement report
minus Changes of the best server during the physical channel reallocation
minus Wrong LAC configuration which can be located through data configuration check
ZTE Confidential Proprietary copy 2012 ZTE CORPORATION All rights reserved 45
UMTS KPI Optimization Analysis Guide Internal Use Only
4432 Inter-RAT Handover Optimization Flowchart
Figure 4-14 Inter-RAT handover optimization flowchart
ZTE Confidential Proprietary copy 2012 ZTE CORPORATION All rights reserved 46
UMTS KPI Optimization Analysis Guide Internal Use Only
Extract performance data
TOP Ncell filtering
Analyze a single cell
1 Check NE alarms
2 Associate emergencies
3 Compare parameter
configurations
4 Associate indicators
5 Locate the fault
comprehensive ly
Exist or not
Handle alarms
Solved or not
Yes
Yes
End
No
No
Exist or not
Handle emergencies
Solved or not
Yes
No
No
Exist or not
Correct wrong parameter
configurations
Solved or not
Yes
No
No
List related indicator counters
RTWPResource
limit indicators
Checkamp analysis of interference
Optimization analysis of
resource limitCounters related to inter-RAT handover failures
C301130667 C301130681C301130668 C301130682C301130669 C301130690C301130670 C301130691C301130671 C301130692C301130672 C301130693C301130673 C301130694C301130674 C301130696C301130675 C301130697C301130677 C301130698C301130678 C301130699C301130679 C301130700
C301130680
Solved or not
Yes
Yes
No
Drive Test+RNC signaling
trace
Yes
Counters related to inter-RAT handover
failures
Cell hand-inhand-out indicators
30049 3005030051 3005230053 30054
ZTE Confidential Proprietary copy 2012 ZTE CORPORATION All rights reserved 47
UMTS KPI Optimization Analysis Guide Internal Use Only
45 Optimization of Resource Indicators
The resource indicators directly reflect the system capacity Increasing subscribers will consume more system resources and some resources may be limited for example the code resource may be limited the TCP access request may be rejected and the CE resource usage rate may exceed the threshold Limited system resources have a negative influence on the whole-network indicators and the subscribersrsquo perception for example call drops may frequently happen and more TCP access requests may be rejected during the voice services
Table 4-5 Resource KPIs and Alarm Thresholds
Resource type KPI No and nameAlarm
threshold
TCP
C301320150 Number of rejected services DCH downlink TCP limit
50
PI30167 Average non-HS (SOA) (SOA)DPA TCP 40
PI30092 Maximum Cell TCP () 100
PI30093 Average Cell TCP 70
UL TrafficPI30029 Handover Blocking Rate 05
KPI RTWP (in busy hour) -98 dBm
Code
C301320153 Number of rejected services DCH no code
50
PI30205 Average Cell HSUPA Users 12
PI30172 Cell Average HSDPA Users 16
CE
PI301830006 Maximum use Ratio of Uplink NodeB CE
60
PI301830010 Maximum use Ratio of Downlink NodeB CE
60
ZTE Confidential Proprietary copy 2012 ZTE CORPORATION All rights reserved 48
UMTS KPI Optimization Analysis Guide Internal Use Only
451 Resource Indicator Optimization Flowchart
Figure 4-15 Resource indicator optimization flowchart
ZTE Confidential Proprietary copy 2012 ZTE CORPORATION All rights reserved 49
UMTS KPI Optimization Analysis Guide Internal Use Only
Extract performance data
TOP Ncell filtering
Analyze a single cell
1 Check NE alarms
2 Associate emergencies
3 Compare parameter
configurations
4 Associate indicators
5 Locate the fault
comprehensive ly
Exist or not
Handle alarms
Solved or not
Yes
是
End
No
No
Exist or not
Handle emergencies
Solved or not
Yes
No
No
Exist or not
Correct wrong parameter
configurations
Solved or not
Yes
No
No
List related indicator counters
Code resource indicators
CE resource indicators
TCPadmission
reject counter
C301320150
Solved or not
Yes
Yes
No
Drive Test+RNC signaling
trace
Yes
Counter related to TCP limit
Cell TX power
indicators
30090 3009130092 3009330166 3016730168 3016930170 30171
30163301643016530075
30223302243045030451
Yes
Yes
ZTE Confidential Proprietary copy 2012 ZTE CORPORATION All rights reserved 50
UMTS KPI Optimization Analysis Guide Internal Use Only
452 Code Resource Optimization
The statistics of Number of rejected services and DCH no code the average code resource usage rate and the number of the HSDPA subscribers can be used to judge whether the code resource in a cell is limited If the code resource is limited you can adjust the code resource allocation to alleviate the situation
Based on the system algorithm when Formula 1 is satisfied you can add an HS-PDSCH when Formula 2 is satisfied then an HS-PDSCH is deleted
Formula 1 OcuRateNoHspdsch + OcuRateHspdsch + DpchCodeHy + 32 lt= 512
Formula 2 OcuRateNoHspdsch + OcuRateHspdsch + CodeUptHyA gt 512
OcuRateHspdschHSPDSCH means the number of the codes of SF=512 blocked by the HS-PDSCH OcuRateNoHspdsch means the number of codes of SF=512 blocked by other channels DpchCodeHy means the number of codes of SF=512 reserved for the DPCH and CodeUptHyA is the threshold to decide whether to delete the HSPDSCH
Therefore to ensure the access of the R99 subscribers you can make some adjustment according to Table 4-6 when the code resource is limited though the HSDPA rate may decrease
Table 4-6 Adjusting Code Resource Allocation
AbbreviationParameter
nameRange
and stepCurrent value
Update value
Remark
DpchCodeHy DPCH Code Hysteresis
0512 16 28
To decrease the number of rejected services for DCH no code
CodeUptHyACode Update Hysteresis A
0512 16 28
To decrease the number of rejected services for DCH no code
453 Monitoring CE Resource
The CE resource is mainly monitored through the maximum UE uplinkdownlink usage rate If there is any problem you can solve it by controlling the load or adding more boards
ZTE Confidential Proprietary copy 2012 ZTE CORPORATION All rights reserved 51
UMTS KPI Optimization Analysis Guide Internal Use Only
454 Optimization of Power Control
4541 Monitoring and Optimizing Downlink Power Control
Limited TCP in busy hours will not only increase access failures and call drops in the local cell but also increase soft handover failures and call drops in the neighboring cells Number of rejected services and DCH downlink TCP limit are intuitive KPIs to judge whether TCP is limited Although limited uplink capacity and massive UE moves in the rush hours may also cause call drops the limited TCP is absolutely a key factor
Based on the system algorithm MinHsdpaPower (MinHspaPwrRto) + NoHsPower gtNode B if the safety threshold is used (MinHsdpaPower means the power reserved for HSPA) then it will activate the downlink rate downgrade algorithm flow for the congestion (lower the downlink DCH rate) Although the rate downgrade can ensure access of some subscribers it is an irregular action and will degrade the performance
455 Speeding up Rate Downgrade
Considering that the cells with heavy load reject more access requests you can speed up the rate downgrade during the resource congestion to release the resources as soon as possible and avoid call drops caused by access failures (this method is only applicable to the cells with many PS service users but not those with only CS service users) Table 4-7 is an example of the parameter modification for the rate downgrade
Table 4-7 Example of Parameter Modification for Rate Downgrade
Abbreviation Parameter nameRange and
stepCurrent value
Update value
Remark
UlDnMaxStg Maximum Number of Degraded Uplink Load Steps Every Time
[1 8] 1 2 Downgrade from 384 Kbps to 16 Kbps
DlDnMaxStg Maximum Number of Degraded Downlink Load Steps Every Time
[1 8] 1 3 Downgrade from 384 Kbps to 8 Kbps
456 Monitoring and Optimizing Uplink Capacity
Handover Blocking Rate and RTWP can reflect the uplink capacity of the cell Because interference may also increase RTWP this factor should be distinguished during the RTWP monitoring Another effective indicator is the voice service erl If a cell has over 20 erls in busy hours you should pay special attention to it
ZTE Confidential Proprietary copy 2012 ZTE CORPORATION All rights reserved 52
UMTS KPI Optimization Analysis Guide Internal Use Only
457 Optimization of Uplink Capacity at the Whole Network Level
Case The uplink capacity was limited in a large number of sites after the cutover and the symptoms are a sharp rise of RTWP and a high call drop rate during the rush hours
After the following parameters were modified as shown in Table 4-8 the problem was solved
Table 4-8 Example of Power Control Parameter Modification
AbbreviationParameter
nameRange
Current value
Update value
ULINITSIRUplink Initial SIR target (dB)
UL 34 K136 K signaling UL 122 K AMR
4-5 35
ULMAXSIRMaximum Uplink SIR target (dB)
UL 34 K136 K signaling UL 122 K AMR
15 10
UlSirTargDnStepUplink SIR Target Down Step Size (dB)
UL 34 K136 K signaling UL 122 K AMR
01 02
458 Optimization of Uplink Capacity for a Single Cell
A lot of optimization measures can be taken to bring down the rising RTWP However with increasing subscribers the capacity may still be limited in some area while further modification of SirTarget will obviously degrade the call quality of the whole network and undermine the subscribersrsquo perception In this case you can adjust the power control parameters for a single site that has heavy traffic in the following way add one set of DivPc parameters and use this set of parameters only for this site
Case Table 4-9 shows an example of the power control parameter modification After this modification the call drop rate in the site with heavy traffic decreased to one quarter of the original one
Table 4-9 Example of Power Control Parameter Modification for Heavy-Traffic Cell
SRVTYPE ULINITSIR ULMAXSIR ULMINSIR
0 35-gt15 100-gt35 20-gt10
104 40-gt20 150-gt50 05-gt0
28 35-gt15 100-gt35 05-gt0
50 60-gt20 150-gt50 20-gt0
54 60-gt20 150-gt50 20-gt0
ZTE Confidential Proprietary copy 2012 ZTE CORPORATION All rights reserved 53
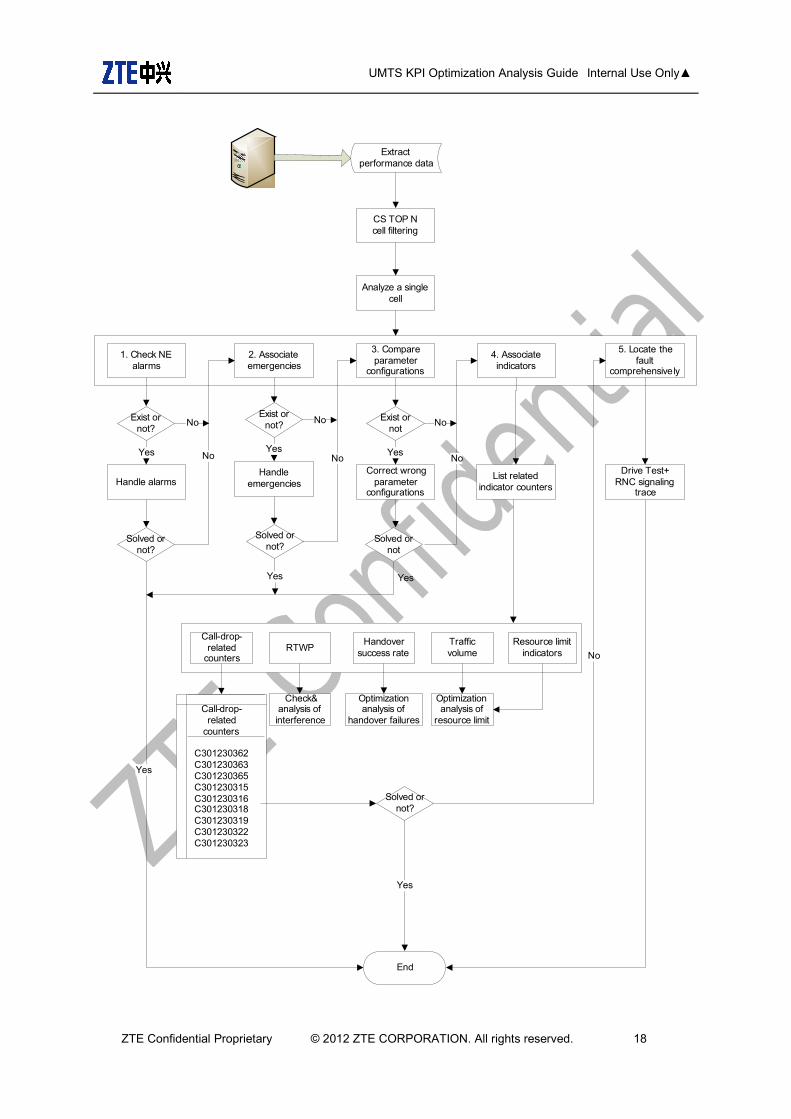
UMTS KPI Optimization Analysis Guide Internal Use Only
Extract performance data
CS TOP Ncell filtering
Analyze a single cell
1 Check NE alarms
2 Associate emergencies
3 Compare parameter
configurations
4 Associate indicators
5 Locate the fault
comprehensively
Exist or not
Handle alarms
Solved or not
Yes
Yes
End
No
No
Exist or not
Handle emergencies
Solved or not
Yes
No
No
Exist or not
Correct wrong parameter
configurations
Solved or not
Yes
No
No
List related indicator counters
Call-drop-related
countersRTWP
Handover success rate
Traffic volume
Resource limit indicators
Checkamp analysis of
interference
Optimizationanalysis of
handover failures
Optimization analysis of
resource limitCall-drop-
related counters
C301230362C301230363C301230365C301230315C301230316C301230318C301230319C301230322C301230323
Solved or not
Yes
Yes
No
Drive Test+RNC signaling
trace
Yes
ZTE Confidential Proprietary copy 2012 ZTE CORPORATION All rights reserved 18
UMTS KPI Optimization Analysis Guide Internal Use Only
42 PS Call Drop Optimization
421 Optimization Flowchart
Figure 4-9 PS call drop optimization flowchart
ZTE Confidential Proprietary copy 2012 ZTE CORPORATION All rights reserved 19
UMTS KPI Optimization Analysis Guide Internal Use Only
Extract performance data
PS TOP Ncell filtering
Analyze a single cell
1 Check NE alarms
2 Associate emergencies
3 Compare parameter
configurations
4 Associate indicators
5 Locate the fault
comprehensive ly
Exist or not
Handle alarms
Solved or not
Yes
Yes
End
No
No
Exist or not
Handle emergencies
Solved or not
Yes
No
No
Exist or not
Correct wrong parameter
configurations
Solved or not
Yes
No
No
List related indicator counters
Call -drop-related
countersRTWP
Handover success rate
Traffic volume
Resource limit indicators
Check amp analysis of interference
Optimizationanalysis of
handover failures
Optimization analysis of
resource limitCall -drop-
related counters
C301230372C301230373C301230375C301230330C301230332C301230333C301230334C301230337C301230338
Solved or not
Yes
Yes
No
Drive Test +RNC signaling
trace
Yes
ZTE Confidential Proprietary copy 2012 ZTE CORPORATION All rights reserved 20
UMTS KPI Optimization Analysis Guide Internal Use Only
43 Optimization of Accessibility Indicators
Accessibility performance includes the success rate of RRC connection setup and the success rate of CSPS RAB assignment These two kinds of KPIs play important roles in the network optimization and directly influence the success rate of CSPS service establishment In this document this kind of problems are found from the aspect of OMC data and solved through parameter optimization
431 Definition of Access Failure
For the mobile originated call in the CS domain the access failure event means that the UE sends RRC REQUEST and IE establish cause is Originating Conversational Call but alerting of the direct transfer message is not received
The relevant events are defined as follows in the access failure stage
RRC connection setup failure After considering the resending times and the waiting time the UE sends RRC CONNECTION REQUEST and does not receive the response from RNC or RRC CONNECTION REJECT delivered by RNC
Initial direct transfer and security mode establishment failure After sending RRC CONNECTION SETUP COMPLETE the UE does not send NAS SETUP
RAB assignment failure After receiving CALL PROCEEDING the UE does not receive RB SETUP delivered by RNC Or the UE replies with RB SETUP FAIL after receiving RB SETUP Or the UE receives DISCONNECT with the cause value not being Normal Release after receiving RB SETUP At this time the UE has not reported RB SETUP CMP
Failure after RAB assignment After the UE sends RB SETUP COMPLETE the originating UE receives DISCONNECTRELEASE from CN Or the UE waits CONNECT or ALERTING overtime and launches the Call Clearing process Or the UE becomes IDLE before receiving Alerting and starts to receive the system message
For the mobile terminated in the CS domain the access failure event means that the terminating UE receives the paging of paging type 1 and does not send RRC CONNECTION REQUEST with the cause value being Terminating Conversational Call Or the UE does not send the alerting of direct transfer message to CN after sending RRC CONNECTION REQUEST
The relevant events are defined as follows in the access failure stage
RRC connection setup failure After sending RRC CONNECTION REQUEST the UE does not receive the response from RNC or RRC CONNECTION REJECT delivered by RNC
Initial direct transfer and security mode establishment failure After sending RRC
ZTE Confidential Proprietary copy 2012 ZTE CORPORATION All rights reserved 21
UMTS KPI Optimization Analysis Guide Internal Use Only
CONNECTION SETUP COMPLETE the UE does not receive the SETUP direct transfer message Or the UE sends RELEASE COMPLETE Or the UE receives DISCONNECT from CN
RAB assignment failure The UE does not receive RB SETUP delivered by RNC after sending CALL CONFIRM Or the UE replies with RB SETUP FAIL after receiving RB SETUP Or the UE receives DISCONNECT with the cause value not being Normal Release after receiving RB SETUP At this time the UE has not reported RB SETUP CMP
Failure after RAB assignment After the UE sends RB SETUP COMPLETE the terminating UE receives DISCONNECTRELEASE from CN
432 Analysis on RRC Connection Failures
The problem of RRC connection setup failure can be analyzed through the UE signaling flow and RNC single-user tracing The RRC connection setup includes the following steps
The UE sends RRC Connection Request through the RACH channel
RNC sends RRC Connection Setup through the FACH channel
The UE sends RRC Connection Setup Complete through the dedicated uplink channel after the downlink dedicated channel is established and synchronized
RRC connection setup failures are always caused by following issues
Uplink RACH problem
Problem about downlink FACH power allocation proportion
Parameter reselection problem of the cell
Low downlink dedicated initial transmitting power
Uplink initial power control problem
Congestion
Equipment malfunctions
Among these issues the problems of uplink RACH downlink FACH power allocation proportion parameter reselection of the cell and equipment malfunctions appear more frequently
ZTE Confidential Proprietary copy 2012 ZTE CORPORATION All rights reserved 22
UMTS KPI Optimization Analysis Guide Internal Use Only
4321 Analysis Flowchart of RRC Connection Setup Failures
Figure 4-10 Analysis flowchart of RRC connection setup failures
ZTE Confidential Proprietary copy 2012 ZTE CORPORATION All rights reserved 23
UMTS KPI Optimization Analysis Guide Internal Use Only
Extract performance data
TOP Ncell filtering
Analyze a single cell
1 Check NE alarms
2 Associate emergencies
3 Compare parameter
configurations
4 Associate indicators
5 Locate the fault
comprehensive ly
Exist or not
Handle alarms
Solved or not
Yes
Yes
End
No
No
Exist or not
Handle emergencies
Solved or not
Yes
No
No
Exist or not
Correct wrong parameter
configurations
Solved or not
Yes
No
No
List related indicator counters
Counters related to RRC setup
failuresRTWP
Resource limit
indicators
Checkamp analysis of interference
Optimization analysis of
resource limitCounters related
to RRC setup failures
C301480485C301480486C301480487C301480489C301480490C301480491C301481288C301481289C301481337C301481338C301481339C301481407C301481408
Solved or not
Yes
Yes
No
Drive Test+RNC signaling
trace
Yes
ZTE Confidential Proprietary copy 2012 ZTE CORPORATION All rights reserved 24
UMTS KPI Optimization Analysis Guide Internal Use Only
4322 UE sends RRC Connection Request but RNC does not receive it
If the EcIo of downlink CPICH is relatively low it is the problem of coverage
If the EcIo of downlink CPICH is not very low (for example the value is larger than -14 dB) Usually it is the problem of RACH and the following issues may cause the problem
minus The power of Preamble does not rise to a required value and the rising times of Preamble should be increased
minus The output power of UE is lower than the required value which is caused by poor UE performance In this case the UE should be changed
minus The NodeB equipment has a standing wave and the engineer should check whether NodeB has any SWR alarm
minus The radius of the cell is set improperly If the radius parameter of the cell is set too small the NodeB can not synchronize the UE beyond the range of the radius and the access fails This problem often happens in the places with large coverage such as the rural areas and the suburbs
4323 RNC delivers RRC Connection Reject after receiving RRC Setup Request
When RRC Connection Reject appears the engineer should check the specific reject cause value Usually there are two kinds of causes
The CPU load of RNC control plane board is too heavy and more boards should be added
DCH and FACH admission is rejected However this situation does not always happen
4324 UE does not receive RRC Connection Setup delivered by RNC
This problem may be caused by the following reasons
Poor coverage
Improper parameters of cell selection and reselection
Checking method The engineer should check the EcIo of CPICH If the value is lower than -12 dB (EcIo is -12 dB by default) and there is no cell of better quality in the monitor set the cause of this problem is poor coverage If there is better cell in the monitor set cell reselection may cause this problem
Poor coverage can be improved by coverage enhancement such as adding some sites to cover the places without signal coverage and adjusting the engineering parameters If the coverage can not be improved the engineer can enhance the FACH power according to
ZTE Confidential Proprietary copy 2012 ZTE CORPORATION All rights reserved 25
UMTS KPI Optimization Analysis Guide Internal Use Only
the PCPICH EcIo coverage of the current network For example if all the pilot EcIo values are larger than -12 dB in the coverage area the power proportion of the common channel should be configured on the basis of the situation that the EcIo value is larger than -12 dB And so the success rate of the idle UE assessment can be ensured
As for the access problem caused by cell selection and reselection the engineer can speed up the cell selection and reselection by adjusting the cell selection and reselection parameters and the problem of RRC connection setup failure caused by improper cell selection and reselection parameters can be solved
Note
The RRC Connection Setup message is borne by FACH RRC Connection Request sent by the UE is received by UTRAN at the preamble of PRACH and then it is sent from the RACH channel based on the current preamble power And the transmit power of preamble can rise all the time until the response is received (There is a limitation for the maximum number of preamble retransmissions) Therefore in the areas with poor coverage the RACH coverage and FACH coverage may become unbalanced and as a result UTRAN can receive RRC Connection Request sent by the UE but the UE can not receive RRC Connection Setup sent by RNC
4325 UE receives RRC Connection Setup and does not send RRC Setup Complete
If the downlink signal quality is normal this problem may be caused by the abnormal condition of the cell phone
Another reason of this problem may be the downlink synchronization failure caused by the low initial power of downlink dedicated channel You can solve this problem by adjusting the service downlink EbNo
4326 RNC does not receive RRC Setup Complete sent by UE
Because the uplink initial power control may increase the UE transmit power this kind of problem seldom appears If it appears the engineer can increase the Constant Value of the dedicated channel properly to raise the uplink DPCCH initial transmission power of the UE
At the same time this problem is also relevant with the uplink SIR initial target value configuration because this value may affect the uplink initial synchronization at the initial stage of link setup If the value of the parameter is set too large there will be too much uplink inference brought by the initial setup of the link If the value is set too small the uplink synchronization will take longer time and the initial synchronization may even fail This parameter is an RNC-level parameter which has a great influence on network performance Therefore the engineer should be cautious while adjusting this parameter
ZTE Confidential Proprietary copy 2012 ZTE CORPORATION All rights reserved 26
UMTS KPI Optimization Analysis Guide Internal Use Only
Note
RRC Connection Setup Complete is sent through uplink DPCH and the UE calculates the initial power of uplink DPCCH according to the received IErdquoDPCCH_Power_offsetrdquo and the measured CPICH_RSCP value
DPCCH_Initial_power = DPCCH_Power_offset - CPICH_RSCP
DPCCH_Power_offset = Primary CPICH DL TX Power + UL Interference + Constant Value The Constant Value can be configured in the OMC If this value is set too small the UE may not have enough power to send RRC Connection Setup Complete
433 Analysis on RABRB Setup Failures
When RAB or RB setup fails RNC will send RAB Assignment Fail in the RAB Assignment Response signaling The engineer can find out the specific failure reason from the failure cause value carried in relevant cells The reasons for common RABRB setup failures include
RNC directly rejecting RAB Setup Request because of wrong parameter configuration
Admission reject
RAB setup failure because the UE fails to respond to RB Setup Request
RAB setup failure because the Uu interface fails to set up RB
ZTE Confidential Proprietary copy 2012 ZTE CORPORATION All rights reserved 27
UMTS KPI Optimization Analysis Guide Internal Use Only
4331 Analysis Flowchart of RAB Setup Failures
Figure 4-11 Analysis flowchart of RAB setup failures
ZTE Confidential Proprietary copy 2012 ZTE CORPORATION All rights reserved 28
UMTS KPI Optimization Analysis Guide Internal Use Only
Extract performance data
TOP Ncell filtering
Analyze a single cell
1 Check NE alarms
2 Associate emergencies
3 Compare parameter
configurations
4 Associate indicators
5 Locate the fault
comprehensively
Exist or not
Handle alarms
Solved or not
Yes
Yes
End
No
No
Exist or not
Handle emergencies
Solved or not
Yes
No
No
Exist or not
Correct wrong parameter
configurations
Solved or not
Yes
No
No
List related indicator counters
Counters related to RAB setup failures RTWP
Resource limit
indicators
Checkamp analysis of interference
Optimization analysis of
resource limitCounters related to RAB setup failures
CS domain PS domainC301230290 C301230302C301230291 C301230303C301230292 C301230304C301230293 C301230305C301230294 C301230306C301230295 C301230307C301230296 C301230308C301230297 C301230309C301230298 C301230310C301230299 C301230311C301230300 C301230312C301230301 C301230313
Solved or not
Yes
Yes
No
Drive Test+RNC signaling
trace
Yes
ZTE Confidential Proprietary copy 2012 ZTE CORPORATION All rights reserved 29
UMTS KPI Optimization Analysis Guide Internal Use Only
4332 RNC Directly Rejecting RAB Setup Request Because Of Wrong Parameter Configuration
The case that RNC responds with RAB Setup Failure directly is seldom caused by invalid parameter configuration in the business network Usually this case is caused by special operations of the special users
The main scenario is that the subscription information of the userrsquos PS service is beyond the capability of the UE which leads to the direct refusal from RNC For example a special userrsquos subscription rates of uplink and downlink are 384 K but the maximum uplink rate of the UE is only 64 K The maximum uplink and downlink rates of the QoS message used for activating PDP set by the AT command or mobile terminal software used by the user are 384 K so the RNC will find the maximum uplink rate is beyond the UErsquos capability directly reply with RAB Setup Failure and will not launch the RB setup process when it receives RAB Assignment Request
After the RAB setup fails because the parameter configuration is beyond the UErsquos capability SGSN will negotiate again to launch the new RAB assignment until the UE has the capability to support the assignment and the RAB assignment is finished For the users the PDP activation is still successful and the actual maximum rate is the maximum rate the UE can support
However if the minimum guaranteed bit rate required by the QoS setting in the UErsquos PDP activation request is beyond the UErsquos capability though the network negotiates a lower rate to accept the UErsquos PDP activation request the UE will launch the request of deactivating PDP when it finds that the rate negotiated by the network in PDP activation accept request is lower than the minimum guaranteed bit rate and finally the PDP activation can not be completed
4333 Admission Reject
For the non-HSDPA user if there are insufficient system resources (including power channel code lub transmission resource and CE) the call establishment failure will be caused by the admission reject At this time it is necessary to check the network load code resource lub transmission resource and CE resource occupation to make sure the congestion is caused by the limitation of a certain kind of resource What is more the engineer should plan the corresponding expansion method
If the cell does not support the HSDPA service the R99 user admission is judged according to the fixed R99 admission threshold If the cell supports the HSDPA service and the HSDPA and R99 dynamic power is allocated the uplink admission of non-HSDPA is judged based on RTWP or the equivalent user number If the uplink load is too heavy the non-HSDPA user admission will also fail
If the bandwidth configuration on the lub interface is insufficient the lub interface will reject the R99 data service activation because of limited bandwidth
ZTE Confidential Proprietary copy 2012 ZTE CORPORATION All rights reserved 30
UMTS KPI Optimization Analysis Guide Internal Use Only
The admission control of the NodeB Credit resource is similar to the power admission control Whether the remaining Credit can support the currently requested service or not can be judged according to the spectrum spreading factor of the new access user According to the condition of the RAB Downsizing Switch RNC will deal with the issue in the corresponding way
For the HSDPA user in the dynamic power allocation mode besides the mentioned system resources such as the power channel code lub transmission resource and CE the admission reject should take into consideration whether the number of H users supported by NodeB and the number of H users supported by the cell are over the regulated threshold or not into consideration
For the HSDPA user when the bandwidth configuration on lub interface is insufficient the admission reject will not happen but the rate will be reduced What is more the AAL2PATHs of HSDPA and R99 are configured respectively and the HSDPA AAL2PATH must be configured to the HSDPA_RT or HSDPA_NRT type If the HSDPA AAL2PATH is configured to RT or NRT of R99 AAL2PATH type the RAB assignment failure will not happen but RNC will establish the HSDPA service as R99 384 Kbps
For the downlink power admission
Besides whether the R99 service load is over the non-HSDPA service threshold DCH service should take into consideration whether non-HSDPA power and HSDPA GBP (the minimum power needed for the guaranteed bit rate) are over the general power threshold of the cell
For the HSDPA service it is necessary to check whether the throughput rate provided by the cell is over the sum of all the usersrsquo GBR thresholds or whether the GBPs of the stream service and the background service are over the HSDPA power of the cell At the same time whether the non-HSDPA power and the HSDPA GBP (the minimum power needed for the guaranteed bit rate) are over the overall power threshold of the cell should be also taken into consideration
For the lub admission
For the DCH service the admission is made according to the multiplication of the peak rate and the service activation factor
For HSDPA service the admission is made according to the GBR
If the lub exceeds the congestion threshold the DCCC rate reduction will be triggered And if the RLC_AM retransmission rate is over a certain threshold the Iub Overbooking switch can be opened to trigger the TF which limits R99 or to reduce the rate of HSDPA service by a certain factor
ZTE Confidential Proprietary copy 2012 ZTE CORPORATION All rights reserved 31
UMTS KPI Optimization Analysis Guide Internal Use Only
4334 RAB Setup Failure Because the UE Fails to Respond to RB Setup
The UE fails to respond to RB setup mainly because of the userrsquos operation
Take the following cases as examples
When the user already has had the downlink 12 K data service he receives RB Setup Request of the VP service (either the originated call in the VP domain or the terminated call in the VP domain) Because the UE does not support the VP and high-speed PS service in the downlink at the same time it directly replies with RB Setup Failure and the cause value is unsupported configuration
Compared with the WCDMA subscriber originating the VP service the terminating subscriber resides in the GSM network and so it does not support the VP service After RNC receives RAB Assignment Request the core network will deliver the Disconnect command right after call proceeding and the cause value is Bearer capability not authorized At this time the UE has just received the RB SETUP command and has no enough time to finish the RB setup So the UE will reply with RB Setup Failure after it receives the Disconnect command and the RNC will reply with RAB Setup Failure with the cause value being failure in radio interface procedure
4335 RAB Setup Failure Because the Uu Interface Fails to Set Up RB
RNC sends the Radio Bearer Setup command to the UE but fails to receive Radio Bearer Setup Compete This kind of situation (RB setup failure) often appears in the cells with weak signals There are two causes of weak signals one is that the UE does not reside in the best server to launch the access and the other is poor coverage
If the UE does not reside in the best server to launch the access it will hope to enter the best server through active set update in the RB setup process (At the same time the fast signal change will drastically weaken the signals in the cell) but the active set update can only be processed after the RB setup is completed because the procedures can not be processed alternately (Neither the network nor the terminal supports it) Therefore RB can only be set up in the cell with weak signals and the setup is easy to fail As for this situation the starting threshold and speed of co-frequency cell reselection should be increased to make the UE reside in the best server and launch the access as soon as possible
RB setup failure may be caused by the poor downlinkuplink coverage If the failure is caused by downlink coverage the UE can not receive the Radio Bearer Setup command which may be caused by the uplink interference and this can be fixed through checking RTWP The poor downlink coverage is partly caused by the bad UE demodulation performance and other causes should be solved by RF optimization
ZTE Confidential Proprietary copy 2012 ZTE CORPORATION All rights reserved 32
UMTS KPI Optimization Analysis Guide Internal Use Only
44 Optimization of Mobility Indicators
Mobility indicators mainly fall into three categories mdash soft handovers hard handovers and inter-RAT handovers The handover problems usually happen in the following cases
The best server changes too fast or there is no best server due to pilot pollution
The handover is not prompt or there are pingpong handovers due to improper parameter configuration
Adjust the engineering parameters for antennas in areas with severe pilot pollution And adjust the handover parameters such as the values of 1A 1B CIO TTT (time to trigger) Hysteresis and so on to solve the problem that the handover is not prompt or there are pingpong handovers This section tries to solve this kind of problems through OMC data analysis and parameter optimization
441 Optimization of Soft Handovers
Missed neighboring cell configuration pilot pollution improper soft handover parameter configuration and equipment malfunctions are the major causes of soft handover failures To confirm the problems the field DTs are required
ZTE Confidential Proprietary copy 2012 ZTE CORPORATION All rights reserved 33
UMTS KPI Optimization Analysis Guide Internal Use Only
4411 Soft Handover Optimization Flowchart
Figure 4-12 Soft handover optimization flowchart
ZTE Confidential Proprietary copy 2012 ZTE CORPORATION All rights reserved 34
UMTS KPI Optimization Analysis Guide Internal Use Only
Extract performance data
TOP Ncell filtering
Analyze a single cell
1 Check NE alarms
2 Associate emergencies
3 Compare parameter
configurations
4 Associate indicators
5 Locate the fault
comprehensive ly
Exist or not
Handle alarms
Solved or not
Yes
Yes
End
No
No
Exist or not
Handle emergencies
Solved or not
Yes
No
No
Exist or not
Correct wrong parameter
configurations
Solved or not
Yes
No
No
List related indicator counters
RTWPResource
limit indicators
Checkamp analysis of interference
Optimization analysis of
resource limitCounters related to intra-frequency
handover failures
C301391101 C301390593C301391102 C301390594C301391103 C301390595C301390586 C301390596C301390587 C301390597C301390588 C301390598C301390589 C301390599C301390590 C301390600C301390591 C301390601C301390592 C301390602
Solved or not
Yes
Yes
No
Drive Test+RNC signaling
trace
Yes
Counters related to soft handover
failures
30055 3005630057 3005830059 3006030061 30062
Cell hand-inhand-out indicators
ZTE Confidential Proprietary copy 2012 ZTE CORPORATION All rights reserved 35
UMTS KPI Optimization Analysis Guide Internal Use Only
4412 Checking Missed Neighboring Cell Configuration
Generally speaking most of the call drops at the beginning of the optimization are caused by missed neighboring cell configuration The following methods are often used to judge whether the call drops are caused by missed configuration of co-frequency neighboring cells
Observe the active set EcIo information recorded by the UE and the Best Server EcIo information recorded by the Scanner before the call drop If the former record is very bad but the latter record is very good then check whether the Best Server scrambling code recorded by the Scanner appears in the latest list of the neighboring cells under intra-frequency measurement control If it does not then the call drop is caused by missed neighboring cell configuration
If the UE re-accesses immediately after the call drop and the cell scrambling codes during the UE reaccess and those during the call drop are different then the call drop may also be caused by missed neighboring cell configuration You can confirm it through measurement control (look backwards from the message of the call drop event for the latest intra-frequency measurement control message and check the neighboring cell list of this message)
Some UE may report the Detected Set information If the corresponding scrambling code appears in the Detected Set information before the call drop then the call drop is caused by missed neighboring cell configuration
4413 Checking Pilot Pollution
Definition of pilot pollution Excessive strong pilot signals exist at a certain point but none of them is strong enough to be the best server To form pilot pollution the following points in this definition should be satisfied
Strong pilot signal The absolute pilot signal strength is used to judge whether the pilot signal is a strong one The pilot signal strength can be evaluated through the pilot RSCP If the pilot RSCP exceeds a threshold it is considered a strong pilot signal The formula is
AbsoluteRSCPThRSCPCPICH __ gt
Excessive The number of pilot signals is used to judge whether there are excessive pilot signals at a certain point If the number exceeds a threshold it is regarded that excessive pilot signals exist at this point The formula is
NThNumberCPICH gt_
None of them is strong enough to be the best server The relative strength of a pilot signal is a key factor in judging whether the pilot signal is strong enough Based on the above definition and formulae if the difference between the strength of the
ZTE Confidential Proprietary copy 2012 ZTE CORPORATION All rights reserved 36
UMTS KPI Optimization Analysis Guide Internal Use Only
strongest pilot signal and that of the )1( +NTh strongest pilot signal at this point is
less than a threshold it is regarded that there is no pilot signal strong enough to be the best server at this point The formula is
lativeRSCPthThbest ThRSCPCPICHRSCPCPICHN Re_)1( )__( ltminus +
According to the above description it is regarded that pilot pollution exists if the following conditions are both satisfied
The number of pilot signals that meet the condition
AbsoluteRSCPThRSCPCPICH __ gt is more than NTh
lativeRSCPthThbest ThRSCPCPICHRSCPCPICHN Re_)1( )__( ltminus +
For example during the network optimization suppose
dBmTh AbsoluteRSCP 95_ minus= 3=NTh and dBTh lativeRSCP 5Re_ = if the following
conditions are both satisfied then it is regarded that pilot pollution exists
The number of the pilot signals that meet the condition
dBmRSCPCPICH 95_ minusgt is more than 3
dBRSCPCPICHRSCPCPICH thbest 5)__( 4 ltminus
4414 Adjusting Soft Handover Algorithm Parameters
You can solve the following kinds of problems by adjusting handover algorithm parameters
1 The handover is not prompt
From the perspective of the CS service signaling flow the symptom of this problem is that the UE cannot receive Active Set Update (physical channel reallocation in the case of the intra-frequency hard handover) because after the UE reports the measurement report the source cell has a fast reduction in EcIo When the RNC sends Active Set Update the UE has closed the transmitter due to the loss of downlink synchronization Viewed from the UE side it cannot receive Active Set Update In the PS services if the UE cannot receive Active Set Update or TRB resets before the handover the handover will also fail
From the perspective of signals the following phenomena may accompany this problem
ZTE Confidential Proprietary copy 2012 ZTE CORPORATION All rights reserved 37
UMTS KPI Optimization Analysis Guide Internal Use Only
minus Corner effect EcIo of the source cell decreases drastically and EcIo of the target cell increases sharply (very high when it appears)
minus Fast fading EcIo of the source cell decreases quickly for a while and then increases and EcIo of the target cell increases for a short while
2 Pingpong handovers The following phenomena may accompany this problem
The best server changes quickly Two or more cells take turns to be the best server But as the best server none of the cells can last long though they has good RSCPs and EcIos
There is no best server There are multiple cells Their RSCPs are normal and similar to each other But EcIo of every cell is very bad
From the perspective of the signaling flow Event 1A is reported immediately after one cell is deleted Because the UE cannot receive Active Set Update from the RNC the handover fails
4415 Equipment Malfunctions
First check the alarm console to see whether there are abnormal alarms and analyze the message traces at the same time Find out in which step the soft handover fails Check the failure message and contact the local product maintaining engineer to confirm whether the equipment has malfunctions
4416 Solutions
Corresponding adjustments should be taken for the confirmed problems
Handover failures caused by pilot pollution Adjust the engineering parameters of a certain antenna to set this antenna as the best server in this interfered location If the power of one of its sectors is reduced then Io of the pilot pollution area will decrease even if the powers of other pilots are not adjusted EcIo will also increase Thereby the EcIo differences with other scrambling codes in the active set will become larger and pilot pollution will be eliminated Through a lot of research ZTE has proved that the reduction in the pilot transmit power will not change cell capacity greatly If condition allows new base stations can be added to cover this area
Equipment malfunctions Consult the customer service engineers and ask them to help check whether there are alarms and whether the transport layer is abnormal If there are alarms coordinate with the customer service engineers and the engineering personnel to solve the problems
Call drops because the handovers are not prompt
ZTE Confidential Proprietary copy 2012 ZTE CORPORATION All rights reserved 38
UMTS KPI Optimization Analysis Guide Internal Use Only
minus Adjust the antenna to expand the handover zone
minus Configure the Event 1A handover parameters to make the handover easier to happen
minus Increase CIO to make the handover happen earlier in the target cell The sum of CIO and the actually measured value is used for judging the UE events including the UE intra-frequency handover CIO helps shift the cell border in the handover algorithm If CIO is configured with a larger value the handover will be easier to happen and there will be more UE in the soft-handover status but more resources will be occupied If CIO is configured with a smaller value the soft handover will be more difficult to happen and the receiving quality may be impaired A CIO of about 5dB is quite good for eliminating the fast fading and the corner effect but this configuration has some side effects such as the increase of handover proportion
Call drops caused by pingpong handovers Adjust the antenna to form a best server in its coverage zone or set the Event 1B handover parameters (increase the threshold of Event 1B the Event 1B hysteresis or the time to trigger Event 1B) to increase the difficulty in deleting the active set
442 Optimization of Hard Handovers
4421 Classification of Hard handovers
Hard handovers mainly fall into two classifications
Intra-frequency hard handovers The intra-frequency hard handover is triggered only when the intra-frequency softsofter handover cannot be performed and it is applicable to the following circumstances
minus Inter-RNC intra-frequency cell handovers when there is no Iur interface
minus Insufficient Iur interface resources though there is the Iur interface
minus Handovers controlled by the threshold of the PS service rate in the handover cell
The intra-frequency softsofter handovers can not be performed (intra-frequency hard handover should be triggered) in the following scenarios
minus When the intra-frequency handover happens the UE is using the transmit diversity in the active set cell but the target cell does not support the transmit diversity
minus The intra-frequency measurement report does not contain OFF and TM of the
ZTE Confidential Proprietary copy 2012 ZTE CORPORATION All rights reserved 39
UMTS KPI Optimization Analysis Guide Internal Use Only
target cell
minus When the intra-frequency handover happens between RNCs the Iur interface is unavailable
minus The UE performs the multiuser detection in the active set cell but the target cell does not support the multiuser detection
minus The target cell and the original cell belong to different classifications (The cells of R99 R5+R99 and R6+R5+R99 belong to the same classification while the cells of R5 and R6+R5 belong to another classification)
Inter-frequency hard handovers The inter-frequency hard handover means a UE connection is handed over from a cell of a UTRAN frequency to a cell of another frequency Many factors including the radio quality the load and the speed of the moving UE may trigger inter-frequency hard handovers
For example the radio quality triggers the inter-frequency hard handover in the following way
When the quality of the UE radio frequency becomes lower the inter-frequency measurement will be triggered and according to the measurement result the UE connection will be handed over to a better frequency
ZTE Confidential Proprietary copy 2012 ZTE CORPORATION All rights reserved 40
UMTS KPI Optimization Analysis Guide Internal Use Only
4422 Hard Handover Optimization Flowchart
Figure 4-13 Hard handover optimization flowchart
ZTE Confidential Proprietary copy 2012 ZTE CORPORATION All rights reserved 41
UMTS KPI Optimization Analysis Guide Internal Use Only
Extract performance data
TOP Ncell filtering
Analyze a single cell
1 Check NE alarms
2 Associate emergencies
3 Compare parameter
configurations
4 Associate indicators
5 Locate the fault
comprehensive ly
Exist or not
Handle alarms
Solved or not
Yes
Yes
End
No
Exist or not
Handle emergencies
Solved or not
YesNo
Exist or not
Correct wrong parameter
configurations
Solved or not
Yes
No
No
List related indicator counters
RTWPResource
limit indicators
Checkamp analysis of interference
Optimization analysis of
resource limit
Counters related to inter-frequency handover failures
C301110489 C301110516C301110499 C301110517C301110500 C301110518C301110501 C301110519C301110502 C301110520C301110503 C301110521C301110504 C301110522C301110505 C301110523
Solved or not
Yes
Yes
No
Drive Test+RNC signaling
trace
Yes
Counters related to hard handover
failures
30041 3004230043 3004430045 3004630047 30048
Cell hand-inhand-out indicators
NoNo
ZTE Confidential Proprietary copy 2012 ZTE CORPORATION All rights reserved 42
UMTS KPI Optimization Analysis Guide Internal Use Only
4423 Hard Handover Optimization Methods
The optimization flow for the hard handover is similar to that of the soft handover The major differences are in the parameter optimization To optimize intra-frequency hard handovers you can properly reduce the Event 1D hysteresis and the time to trigger Event 1D according to the real radio environment to ensure timely handovers
Inter-frequency coverage is often applied to some special scenarios such as indoor coverage and tested through CQT The method of judging whether there is missed configuration of the inter-frequency neighboring cell is almost the same as that of the co-frequency neighboring cell when a call drop occurs the UE fails to measure or report the inter-frequency neighboring cell after the call drop the UE resides in the inter-frequency neighboring cell again
The common hard handover problems are
1 The handover is not prompt The common symptoms are frequent call drops in the hard handovers when the UE moves
Solutions
Increase the threshold of activating the compressing mode The compressing mode is usually activated before the inter-frequency handover or the inter-RAT handover and it is used to measure the quality of the inter-frequency or inter-RAT cell You can set a threshold of the CPICH RSCP or EcIo to activate the compressing mode And the RSCP is widely used
minus Requirements on setting the threshold of activating the compressing mode Before the cell quality becomes low enough to cause a call drop the signal of the target cell should be measured and reported and the handover should be performed
minus Requirement on setting the threshold of deactivating the compression mode Frequent activationdeactivation of the compression mode should be avoided
Increase CIOs of the inter-frequency cell pair
Reduce the threshold of triggering the target frequency handover under the inter-frequency coverage
2 There are pingpong handovers
Solution Increase the hard handover hysteresis and the time to trigger the event
ZTE Confidential Proprietary copy 2012 ZTE CORPORATION All rights reserved 43
UMTS KPI Optimization Analysis Guide Internal Use Only
443 Optimization of Inter-RAT Handovers
4431 Configuring Basic Inter-RAT Parameters
Most of the inter-RAT handover failures are caused by incomplete parameter configuration The following parameters need special attention
Complete RNC parameter configuration for the GSM neighboring cell The 2G system shall provide the 3G system with the correct radio parameters based on negotiation mdash MCC MNC LAC ID (CI) NCC BCC frequency band indicator (900 or 1800) and BCCH
Table 4-3 Parameters That 2G Shall Provide to 3G
MCC MNC LACIDCI
NCC BCCFrequency
band indicator
BCCH
460 2 202 193 0 0 900 102
Complete GSM BSC parameter configuration for the WCDMA neighboring cell The 3G system shall provide the 2G system with the correct radio parameters based on negotiation mdash MCC MNC LAC RNC ID cell ID (C_ID) downlink frequency scrambling code and RAC
Table 4-4 Parameters That 3G Shall Provide to 2G
MCC MNC LACRNC
IDCell IDC_ID
Downlink frequency
Scrambling code
RAC
460 3 20 18 51 10787 51 20
According to the current strategy of one-way inter-RAT handovers if the parameter configuration is complete one probable cause of the inter-RAT handover failure is that the handover is not prompt The common parameter adjustment is to increase CIO the threshold to activatedeactivate the compressing mode and the threshold to trigger the WCDMA-to-GSM handover at the same time
Call drops during the inter-RAT handovers between WCDMA and GSM may be caused by
minus Inconsistent data configuration at the GSM side and the WCDMA side after GSM modifies the configuration data but does not inform WCDMA
minus Missed configuration of neighboring cells which can be solved by the correct configuration of neighboring cells
minus Too fast signal changes
ZTE Confidential Proprietary copy 2012 ZTE CORPORATION All rights reserved 44
UMTS KPI Optimization Analysis Guide Internal Use Only
minus Pingpong reselection
minus Faults with the UE for example the UE fails to respond to the handover or report the inter-RAT measurement report
minus Changes of the best server during the physical channel reallocation
minus Wrong LAC configuration which can be located through data configuration check
ZTE Confidential Proprietary copy 2012 ZTE CORPORATION All rights reserved 45
UMTS KPI Optimization Analysis Guide Internal Use Only
4432 Inter-RAT Handover Optimization Flowchart
Figure 4-14 Inter-RAT handover optimization flowchart
ZTE Confidential Proprietary copy 2012 ZTE CORPORATION All rights reserved 46
UMTS KPI Optimization Analysis Guide Internal Use Only
Extract performance data
TOP Ncell filtering
Analyze a single cell
1 Check NE alarms
2 Associate emergencies
3 Compare parameter
configurations
4 Associate indicators
5 Locate the fault
comprehensive ly
Exist or not
Handle alarms
Solved or not
Yes
Yes
End
No
No
Exist or not
Handle emergencies
Solved or not
Yes
No
No
Exist or not
Correct wrong parameter
configurations
Solved or not
Yes
No
No
List related indicator counters
RTWPResource
limit indicators
Checkamp analysis of interference
Optimization analysis of
resource limitCounters related to inter-RAT handover failures
C301130667 C301130681C301130668 C301130682C301130669 C301130690C301130670 C301130691C301130671 C301130692C301130672 C301130693C301130673 C301130694C301130674 C301130696C301130675 C301130697C301130677 C301130698C301130678 C301130699C301130679 C301130700
C301130680
Solved or not
Yes
Yes
No
Drive Test+RNC signaling
trace
Yes
Counters related to inter-RAT handover
failures
Cell hand-inhand-out indicators
30049 3005030051 3005230053 30054
ZTE Confidential Proprietary copy 2012 ZTE CORPORATION All rights reserved 47
UMTS KPI Optimization Analysis Guide Internal Use Only
45 Optimization of Resource Indicators
The resource indicators directly reflect the system capacity Increasing subscribers will consume more system resources and some resources may be limited for example the code resource may be limited the TCP access request may be rejected and the CE resource usage rate may exceed the threshold Limited system resources have a negative influence on the whole-network indicators and the subscribersrsquo perception for example call drops may frequently happen and more TCP access requests may be rejected during the voice services
Table 4-5 Resource KPIs and Alarm Thresholds
Resource type KPI No and nameAlarm
threshold
TCP
C301320150 Number of rejected services DCH downlink TCP limit
50
PI30167 Average non-HS (SOA) (SOA)DPA TCP 40
PI30092 Maximum Cell TCP () 100
PI30093 Average Cell TCP 70
UL TrafficPI30029 Handover Blocking Rate 05
KPI RTWP (in busy hour) -98 dBm
Code
C301320153 Number of rejected services DCH no code
50
PI30205 Average Cell HSUPA Users 12
PI30172 Cell Average HSDPA Users 16
CE
PI301830006 Maximum use Ratio of Uplink NodeB CE
60
PI301830010 Maximum use Ratio of Downlink NodeB CE
60
ZTE Confidential Proprietary copy 2012 ZTE CORPORATION All rights reserved 48
UMTS KPI Optimization Analysis Guide Internal Use Only
451 Resource Indicator Optimization Flowchart
Figure 4-15 Resource indicator optimization flowchart
ZTE Confidential Proprietary copy 2012 ZTE CORPORATION All rights reserved 49
UMTS KPI Optimization Analysis Guide Internal Use Only
Extract performance data
TOP Ncell filtering
Analyze a single cell
1 Check NE alarms
2 Associate emergencies
3 Compare parameter
configurations
4 Associate indicators
5 Locate the fault
comprehensive ly
Exist or not
Handle alarms
Solved or not
Yes
是
End
No
No
Exist or not
Handle emergencies
Solved or not
Yes
No
No
Exist or not
Correct wrong parameter
configurations
Solved or not
Yes
No
No
List related indicator counters
Code resource indicators
CE resource indicators
TCPadmission
reject counter
C301320150
Solved or not
Yes
Yes
No
Drive Test+RNC signaling
trace
Yes
Counter related to TCP limit
Cell TX power
indicators
30090 3009130092 3009330166 3016730168 3016930170 30171
30163301643016530075
30223302243045030451
Yes
Yes
ZTE Confidential Proprietary copy 2012 ZTE CORPORATION All rights reserved 50
UMTS KPI Optimization Analysis Guide Internal Use Only
452 Code Resource Optimization
The statistics of Number of rejected services and DCH no code the average code resource usage rate and the number of the HSDPA subscribers can be used to judge whether the code resource in a cell is limited If the code resource is limited you can adjust the code resource allocation to alleviate the situation
Based on the system algorithm when Formula 1 is satisfied you can add an HS-PDSCH when Formula 2 is satisfied then an HS-PDSCH is deleted
Formula 1 OcuRateNoHspdsch + OcuRateHspdsch + DpchCodeHy + 32 lt= 512
Formula 2 OcuRateNoHspdsch + OcuRateHspdsch + CodeUptHyA gt 512
OcuRateHspdschHSPDSCH means the number of the codes of SF=512 blocked by the HS-PDSCH OcuRateNoHspdsch means the number of codes of SF=512 blocked by other channels DpchCodeHy means the number of codes of SF=512 reserved for the DPCH and CodeUptHyA is the threshold to decide whether to delete the HSPDSCH
Therefore to ensure the access of the R99 subscribers you can make some adjustment according to Table 4-6 when the code resource is limited though the HSDPA rate may decrease
Table 4-6 Adjusting Code Resource Allocation
AbbreviationParameter
nameRange
and stepCurrent value
Update value
Remark
DpchCodeHy DPCH Code Hysteresis
0512 16 28
To decrease the number of rejected services for DCH no code
CodeUptHyACode Update Hysteresis A
0512 16 28
To decrease the number of rejected services for DCH no code
453 Monitoring CE Resource
The CE resource is mainly monitored through the maximum UE uplinkdownlink usage rate If there is any problem you can solve it by controlling the load or adding more boards
ZTE Confidential Proprietary copy 2012 ZTE CORPORATION All rights reserved 51
UMTS KPI Optimization Analysis Guide Internal Use Only
454 Optimization of Power Control
4541 Monitoring and Optimizing Downlink Power Control
Limited TCP in busy hours will not only increase access failures and call drops in the local cell but also increase soft handover failures and call drops in the neighboring cells Number of rejected services and DCH downlink TCP limit are intuitive KPIs to judge whether TCP is limited Although limited uplink capacity and massive UE moves in the rush hours may also cause call drops the limited TCP is absolutely a key factor
Based on the system algorithm MinHsdpaPower (MinHspaPwrRto) + NoHsPower gtNode B if the safety threshold is used (MinHsdpaPower means the power reserved for HSPA) then it will activate the downlink rate downgrade algorithm flow for the congestion (lower the downlink DCH rate) Although the rate downgrade can ensure access of some subscribers it is an irregular action and will degrade the performance
455 Speeding up Rate Downgrade
Considering that the cells with heavy load reject more access requests you can speed up the rate downgrade during the resource congestion to release the resources as soon as possible and avoid call drops caused by access failures (this method is only applicable to the cells with many PS service users but not those with only CS service users) Table 4-7 is an example of the parameter modification for the rate downgrade
Table 4-7 Example of Parameter Modification for Rate Downgrade
Abbreviation Parameter nameRange and
stepCurrent value
Update value
Remark
UlDnMaxStg Maximum Number of Degraded Uplink Load Steps Every Time
[1 8] 1 2 Downgrade from 384 Kbps to 16 Kbps
DlDnMaxStg Maximum Number of Degraded Downlink Load Steps Every Time
[1 8] 1 3 Downgrade from 384 Kbps to 8 Kbps
456 Monitoring and Optimizing Uplink Capacity
Handover Blocking Rate and RTWP can reflect the uplink capacity of the cell Because interference may also increase RTWP this factor should be distinguished during the RTWP monitoring Another effective indicator is the voice service erl If a cell has over 20 erls in busy hours you should pay special attention to it
ZTE Confidential Proprietary copy 2012 ZTE CORPORATION All rights reserved 52
UMTS KPI Optimization Analysis Guide Internal Use Only
457 Optimization of Uplink Capacity at the Whole Network Level
Case The uplink capacity was limited in a large number of sites after the cutover and the symptoms are a sharp rise of RTWP and a high call drop rate during the rush hours
After the following parameters were modified as shown in Table 4-8 the problem was solved
Table 4-8 Example of Power Control Parameter Modification
AbbreviationParameter
nameRange
Current value
Update value
ULINITSIRUplink Initial SIR target (dB)
UL 34 K136 K signaling UL 122 K AMR
4-5 35
ULMAXSIRMaximum Uplink SIR target (dB)
UL 34 K136 K signaling UL 122 K AMR
15 10
UlSirTargDnStepUplink SIR Target Down Step Size (dB)
UL 34 K136 K signaling UL 122 K AMR
01 02
458 Optimization of Uplink Capacity for a Single Cell
A lot of optimization measures can be taken to bring down the rising RTWP However with increasing subscribers the capacity may still be limited in some area while further modification of SirTarget will obviously degrade the call quality of the whole network and undermine the subscribersrsquo perception In this case you can adjust the power control parameters for a single site that has heavy traffic in the following way add one set of DivPc parameters and use this set of parameters only for this site
Case Table 4-9 shows an example of the power control parameter modification After this modification the call drop rate in the site with heavy traffic decreased to one quarter of the original one
Table 4-9 Example of Power Control Parameter Modification for Heavy-Traffic Cell
SRVTYPE ULINITSIR ULMAXSIR ULMINSIR
0 35-gt15 100-gt35 20-gt10
104 40-gt20 150-gt50 05-gt0
28 35-gt15 100-gt35 05-gt0
50 60-gt20 150-gt50 20-gt0
54 60-gt20 150-gt50 20-gt0
ZTE Confidential Proprietary copy 2012 ZTE CORPORATION All rights reserved 53
UMTS KPI Optimization Analysis Guide Internal Use Only
42 PS Call Drop Optimization
421 Optimization Flowchart
Figure 4-9 PS call drop optimization flowchart
ZTE Confidential Proprietary copy 2012 ZTE CORPORATION All rights reserved 19
UMTS KPI Optimization Analysis Guide Internal Use Only
Extract performance data
PS TOP Ncell filtering
Analyze a single cell
1 Check NE alarms
2 Associate emergencies
3 Compare parameter
configurations
4 Associate indicators
5 Locate the fault
comprehensive ly
Exist or not
Handle alarms
Solved or not
Yes
Yes
End
No
No
Exist or not
Handle emergencies
Solved or not
Yes
No
No
Exist or not
Correct wrong parameter
configurations
Solved or not
Yes
No
No
List related indicator counters
Call -drop-related
countersRTWP
Handover success rate
Traffic volume
Resource limit indicators
Check amp analysis of interference
Optimizationanalysis of
handover failures
Optimization analysis of
resource limitCall -drop-
related counters
C301230372C301230373C301230375C301230330C301230332C301230333C301230334C301230337C301230338
Solved or not
Yes
Yes
No
Drive Test +RNC signaling
trace
Yes
ZTE Confidential Proprietary copy 2012 ZTE CORPORATION All rights reserved 20
UMTS KPI Optimization Analysis Guide Internal Use Only
43 Optimization of Accessibility Indicators
Accessibility performance includes the success rate of RRC connection setup and the success rate of CSPS RAB assignment These two kinds of KPIs play important roles in the network optimization and directly influence the success rate of CSPS service establishment In this document this kind of problems are found from the aspect of OMC data and solved through parameter optimization
431 Definition of Access Failure
For the mobile originated call in the CS domain the access failure event means that the UE sends RRC REQUEST and IE establish cause is Originating Conversational Call but alerting of the direct transfer message is not received
The relevant events are defined as follows in the access failure stage
RRC connection setup failure After considering the resending times and the waiting time the UE sends RRC CONNECTION REQUEST and does not receive the response from RNC or RRC CONNECTION REJECT delivered by RNC
Initial direct transfer and security mode establishment failure After sending RRC CONNECTION SETUP COMPLETE the UE does not send NAS SETUP
RAB assignment failure After receiving CALL PROCEEDING the UE does not receive RB SETUP delivered by RNC Or the UE replies with RB SETUP FAIL after receiving RB SETUP Or the UE receives DISCONNECT with the cause value not being Normal Release after receiving RB SETUP At this time the UE has not reported RB SETUP CMP
Failure after RAB assignment After the UE sends RB SETUP COMPLETE the originating UE receives DISCONNECTRELEASE from CN Or the UE waits CONNECT or ALERTING overtime and launches the Call Clearing process Or the UE becomes IDLE before receiving Alerting and starts to receive the system message
For the mobile terminated in the CS domain the access failure event means that the terminating UE receives the paging of paging type 1 and does not send RRC CONNECTION REQUEST with the cause value being Terminating Conversational Call Or the UE does not send the alerting of direct transfer message to CN after sending RRC CONNECTION REQUEST
The relevant events are defined as follows in the access failure stage
RRC connection setup failure After sending RRC CONNECTION REQUEST the UE does not receive the response from RNC or RRC CONNECTION REJECT delivered by RNC
Initial direct transfer and security mode establishment failure After sending RRC
ZTE Confidential Proprietary copy 2012 ZTE CORPORATION All rights reserved 21
UMTS KPI Optimization Analysis Guide Internal Use Only
CONNECTION SETUP COMPLETE the UE does not receive the SETUP direct transfer message Or the UE sends RELEASE COMPLETE Or the UE receives DISCONNECT from CN
RAB assignment failure The UE does not receive RB SETUP delivered by RNC after sending CALL CONFIRM Or the UE replies with RB SETUP FAIL after receiving RB SETUP Or the UE receives DISCONNECT with the cause value not being Normal Release after receiving RB SETUP At this time the UE has not reported RB SETUP CMP
Failure after RAB assignment After the UE sends RB SETUP COMPLETE the terminating UE receives DISCONNECTRELEASE from CN
432 Analysis on RRC Connection Failures
The problem of RRC connection setup failure can be analyzed through the UE signaling flow and RNC single-user tracing The RRC connection setup includes the following steps
The UE sends RRC Connection Request through the RACH channel
RNC sends RRC Connection Setup through the FACH channel
The UE sends RRC Connection Setup Complete through the dedicated uplink channel after the downlink dedicated channel is established and synchronized
RRC connection setup failures are always caused by following issues
Uplink RACH problem
Problem about downlink FACH power allocation proportion
Parameter reselection problem of the cell
Low downlink dedicated initial transmitting power
Uplink initial power control problem
Congestion
Equipment malfunctions
Among these issues the problems of uplink RACH downlink FACH power allocation proportion parameter reselection of the cell and equipment malfunctions appear more frequently
ZTE Confidential Proprietary copy 2012 ZTE CORPORATION All rights reserved 22
UMTS KPI Optimization Analysis Guide Internal Use Only
4321 Analysis Flowchart of RRC Connection Setup Failures
Figure 4-10 Analysis flowchart of RRC connection setup failures
ZTE Confidential Proprietary copy 2012 ZTE CORPORATION All rights reserved 23
UMTS KPI Optimization Analysis Guide Internal Use Only
Extract performance data
TOP Ncell filtering
Analyze a single cell
1 Check NE alarms
2 Associate emergencies
3 Compare parameter
configurations
4 Associate indicators
5 Locate the fault
comprehensive ly
Exist or not
Handle alarms
Solved or not
Yes
Yes
End
No
No
Exist or not
Handle emergencies
Solved or not
Yes
No
No
Exist or not
Correct wrong parameter
configurations
Solved or not
Yes
No
No
List related indicator counters
Counters related to RRC setup
failuresRTWP
Resource limit
indicators
Checkamp analysis of interference
Optimization analysis of
resource limitCounters related
to RRC setup failures
C301480485C301480486C301480487C301480489C301480490C301480491C301481288C301481289C301481337C301481338C301481339C301481407C301481408
Solved or not
Yes
Yes
No
Drive Test+RNC signaling
trace
Yes
ZTE Confidential Proprietary copy 2012 ZTE CORPORATION All rights reserved 24
UMTS KPI Optimization Analysis Guide Internal Use Only
4322 UE sends RRC Connection Request but RNC does not receive it
If the EcIo of downlink CPICH is relatively low it is the problem of coverage
If the EcIo of downlink CPICH is not very low (for example the value is larger than -14 dB) Usually it is the problem of RACH and the following issues may cause the problem
minus The power of Preamble does not rise to a required value and the rising times of Preamble should be increased
minus The output power of UE is lower than the required value which is caused by poor UE performance In this case the UE should be changed
minus The NodeB equipment has a standing wave and the engineer should check whether NodeB has any SWR alarm
minus The radius of the cell is set improperly If the radius parameter of the cell is set too small the NodeB can not synchronize the UE beyond the range of the radius and the access fails This problem often happens in the places with large coverage such as the rural areas and the suburbs
4323 RNC delivers RRC Connection Reject after receiving RRC Setup Request
When RRC Connection Reject appears the engineer should check the specific reject cause value Usually there are two kinds of causes
The CPU load of RNC control plane board is too heavy and more boards should be added
DCH and FACH admission is rejected However this situation does not always happen
4324 UE does not receive RRC Connection Setup delivered by RNC
This problem may be caused by the following reasons
Poor coverage
Improper parameters of cell selection and reselection
Checking method The engineer should check the EcIo of CPICH If the value is lower than -12 dB (EcIo is -12 dB by default) and there is no cell of better quality in the monitor set the cause of this problem is poor coverage If there is better cell in the monitor set cell reselection may cause this problem
Poor coverage can be improved by coverage enhancement such as adding some sites to cover the places without signal coverage and adjusting the engineering parameters If the coverage can not be improved the engineer can enhance the FACH power according to
ZTE Confidential Proprietary copy 2012 ZTE CORPORATION All rights reserved 25
UMTS KPI Optimization Analysis Guide Internal Use Only
the PCPICH EcIo coverage of the current network For example if all the pilot EcIo values are larger than -12 dB in the coverage area the power proportion of the common channel should be configured on the basis of the situation that the EcIo value is larger than -12 dB And so the success rate of the idle UE assessment can be ensured
As for the access problem caused by cell selection and reselection the engineer can speed up the cell selection and reselection by adjusting the cell selection and reselection parameters and the problem of RRC connection setup failure caused by improper cell selection and reselection parameters can be solved
Note
The RRC Connection Setup message is borne by FACH RRC Connection Request sent by the UE is received by UTRAN at the preamble of PRACH and then it is sent from the RACH channel based on the current preamble power And the transmit power of preamble can rise all the time until the response is received (There is a limitation for the maximum number of preamble retransmissions) Therefore in the areas with poor coverage the RACH coverage and FACH coverage may become unbalanced and as a result UTRAN can receive RRC Connection Request sent by the UE but the UE can not receive RRC Connection Setup sent by RNC
4325 UE receives RRC Connection Setup and does not send RRC Setup Complete
If the downlink signal quality is normal this problem may be caused by the abnormal condition of the cell phone
Another reason of this problem may be the downlink synchronization failure caused by the low initial power of downlink dedicated channel You can solve this problem by adjusting the service downlink EbNo
4326 RNC does not receive RRC Setup Complete sent by UE
Because the uplink initial power control may increase the UE transmit power this kind of problem seldom appears If it appears the engineer can increase the Constant Value of the dedicated channel properly to raise the uplink DPCCH initial transmission power of the UE
At the same time this problem is also relevant with the uplink SIR initial target value configuration because this value may affect the uplink initial synchronization at the initial stage of link setup If the value of the parameter is set too large there will be too much uplink inference brought by the initial setup of the link If the value is set too small the uplink synchronization will take longer time and the initial synchronization may even fail This parameter is an RNC-level parameter which has a great influence on network performance Therefore the engineer should be cautious while adjusting this parameter
ZTE Confidential Proprietary copy 2012 ZTE CORPORATION All rights reserved 26
UMTS KPI Optimization Analysis Guide Internal Use Only
Note
RRC Connection Setup Complete is sent through uplink DPCH and the UE calculates the initial power of uplink DPCCH according to the received IErdquoDPCCH_Power_offsetrdquo and the measured CPICH_RSCP value
DPCCH_Initial_power = DPCCH_Power_offset - CPICH_RSCP
DPCCH_Power_offset = Primary CPICH DL TX Power + UL Interference + Constant Value The Constant Value can be configured in the OMC If this value is set too small the UE may not have enough power to send RRC Connection Setup Complete
433 Analysis on RABRB Setup Failures
When RAB or RB setup fails RNC will send RAB Assignment Fail in the RAB Assignment Response signaling The engineer can find out the specific failure reason from the failure cause value carried in relevant cells The reasons for common RABRB setup failures include
RNC directly rejecting RAB Setup Request because of wrong parameter configuration
Admission reject
RAB setup failure because the UE fails to respond to RB Setup Request
RAB setup failure because the Uu interface fails to set up RB
ZTE Confidential Proprietary copy 2012 ZTE CORPORATION All rights reserved 27
UMTS KPI Optimization Analysis Guide Internal Use Only
4331 Analysis Flowchart of RAB Setup Failures
Figure 4-11 Analysis flowchart of RAB setup failures
ZTE Confidential Proprietary copy 2012 ZTE CORPORATION All rights reserved 28
UMTS KPI Optimization Analysis Guide Internal Use Only
Extract performance data
TOP Ncell filtering
Analyze a single cell
1 Check NE alarms
2 Associate emergencies
3 Compare parameter
configurations
4 Associate indicators
5 Locate the fault
comprehensively
Exist or not
Handle alarms
Solved or not
Yes
Yes
End
No
No
Exist or not
Handle emergencies
Solved or not
Yes
No
No
Exist or not
Correct wrong parameter
configurations
Solved or not
Yes
No
No
List related indicator counters
Counters related to RAB setup failures RTWP
Resource limit
indicators
Checkamp analysis of interference
Optimization analysis of
resource limitCounters related to RAB setup failures
CS domain PS domainC301230290 C301230302C301230291 C301230303C301230292 C301230304C301230293 C301230305C301230294 C301230306C301230295 C301230307C301230296 C301230308C301230297 C301230309C301230298 C301230310C301230299 C301230311C301230300 C301230312C301230301 C301230313
Solved or not
Yes
Yes
No
Drive Test+RNC signaling
trace
Yes
ZTE Confidential Proprietary copy 2012 ZTE CORPORATION All rights reserved 29
UMTS KPI Optimization Analysis Guide Internal Use Only
4332 RNC Directly Rejecting RAB Setup Request Because Of Wrong Parameter Configuration
The case that RNC responds with RAB Setup Failure directly is seldom caused by invalid parameter configuration in the business network Usually this case is caused by special operations of the special users
The main scenario is that the subscription information of the userrsquos PS service is beyond the capability of the UE which leads to the direct refusal from RNC For example a special userrsquos subscription rates of uplink and downlink are 384 K but the maximum uplink rate of the UE is only 64 K The maximum uplink and downlink rates of the QoS message used for activating PDP set by the AT command or mobile terminal software used by the user are 384 K so the RNC will find the maximum uplink rate is beyond the UErsquos capability directly reply with RAB Setup Failure and will not launch the RB setup process when it receives RAB Assignment Request
After the RAB setup fails because the parameter configuration is beyond the UErsquos capability SGSN will negotiate again to launch the new RAB assignment until the UE has the capability to support the assignment and the RAB assignment is finished For the users the PDP activation is still successful and the actual maximum rate is the maximum rate the UE can support
However if the minimum guaranteed bit rate required by the QoS setting in the UErsquos PDP activation request is beyond the UErsquos capability though the network negotiates a lower rate to accept the UErsquos PDP activation request the UE will launch the request of deactivating PDP when it finds that the rate negotiated by the network in PDP activation accept request is lower than the minimum guaranteed bit rate and finally the PDP activation can not be completed
4333 Admission Reject
For the non-HSDPA user if there are insufficient system resources (including power channel code lub transmission resource and CE) the call establishment failure will be caused by the admission reject At this time it is necessary to check the network load code resource lub transmission resource and CE resource occupation to make sure the congestion is caused by the limitation of a certain kind of resource What is more the engineer should plan the corresponding expansion method
If the cell does not support the HSDPA service the R99 user admission is judged according to the fixed R99 admission threshold If the cell supports the HSDPA service and the HSDPA and R99 dynamic power is allocated the uplink admission of non-HSDPA is judged based on RTWP or the equivalent user number If the uplink load is too heavy the non-HSDPA user admission will also fail
If the bandwidth configuration on the lub interface is insufficient the lub interface will reject the R99 data service activation because of limited bandwidth
ZTE Confidential Proprietary copy 2012 ZTE CORPORATION All rights reserved 30
UMTS KPI Optimization Analysis Guide Internal Use Only
The admission control of the NodeB Credit resource is similar to the power admission control Whether the remaining Credit can support the currently requested service or not can be judged according to the spectrum spreading factor of the new access user According to the condition of the RAB Downsizing Switch RNC will deal with the issue in the corresponding way
For the HSDPA user in the dynamic power allocation mode besides the mentioned system resources such as the power channel code lub transmission resource and CE the admission reject should take into consideration whether the number of H users supported by NodeB and the number of H users supported by the cell are over the regulated threshold or not into consideration
For the HSDPA user when the bandwidth configuration on lub interface is insufficient the admission reject will not happen but the rate will be reduced What is more the AAL2PATHs of HSDPA and R99 are configured respectively and the HSDPA AAL2PATH must be configured to the HSDPA_RT or HSDPA_NRT type If the HSDPA AAL2PATH is configured to RT or NRT of R99 AAL2PATH type the RAB assignment failure will not happen but RNC will establish the HSDPA service as R99 384 Kbps
For the downlink power admission
Besides whether the R99 service load is over the non-HSDPA service threshold DCH service should take into consideration whether non-HSDPA power and HSDPA GBP (the minimum power needed for the guaranteed bit rate) are over the general power threshold of the cell
For the HSDPA service it is necessary to check whether the throughput rate provided by the cell is over the sum of all the usersrsquo GBR thresholds or whether the GBPs of the stream service and the background service are over the HSDPA power of the cell At the same time whether the non-HSDPA power and the HSDPA GBP (the minimum power needed for the guaranteed bit rate) are over the overall power threshold of the cell should be also taken into consideration
For the lub admission
For the DCH service the admission is made according to the multiplication of the peak rate and the service activation factor
For HSDPA service the admission is made according to the GBR
If the lub exceeds the congestion threshold the DCCC rate reduction will be triggered And if the RLC_AM retransmission rate is over a certain threshold the Iub Overbooking switch can be opened to trigger the TF which limits R99 or to reduce the rate of HSDPA service by a certain factor
ZTE Confidential Proprietary copy 2012 ZTE CORPORATION All rights reserved 31
UMTS KPI Optimization Analysis Guide Internal Use Only
4334 RAB Setup Failure Because the UE Fails to Respond to RB Setup
The UE fails to respond to RB setup mainly because of the userrsquos operation
Take the following cases as examples
When the user already has had the downlink 12 K data service he receives RB Setup Request of the VP service (either the originated call in the VP domain or the terminated call in the VP domain) Because the UE does not support the VP and high-speed PS service in the downlink at the same time it directly replies with RB Setup Failure and the cause value is unsupported configuration
Compared with the WCDMA subscriber originating the VP service the terminating subscriber resides in the GSM network and so it does not support the VP service After RNC receives RAB Assignment Request the core network will deliver the Disconnect command right after call proceeding and the cause value is Bearer capability not authorized At this time the UE has just received the RB SETUP command and has no enough time to finish the RB setup So the UE will reply with RB Setup Failure after it receives the Disconnect command and the RNC will reply with RAB Setup Failure with the cause value being failure in radio interface procedure
4335 RAB Setup Failure Because the Uu Interface Fails to Set Up RB
RNC sends the Radio Bearer Setup command to the UE but fails to receive Radio Bearer Setup Compete This kind of situation (RB setup failure) often appears in the cells with weak signals There are two causes of weak signals one is that the UE does not reside in the best server to launch the access and the other is poor coverage
If the UE does not reside in the best server to launch the access it will hope to enter the best server through active set update in the RB setup process (At the same time the fast signal change will drastically weaken the signals in the cell) but the active set update can only be processed after the RB setup is completed because the procedures can not be processed alternately (Neither the network nor the terminal supports it) Therefore RB can only be set up in the cell with weak signals and the setup is easy to fail As for this situation the starting threshold and speed of co-frequency cell reselection should be increased to make the UE reside in the best server and launch the access as soon as possible
RB setup failure may be caused by the poor downlinkuplink coverage If the failure is caused by downlink coverage the UE can not receive the Radio Bearer Setup command which may be caused by the uplink interference and this can be fixed through checking RTWP The poor downlink coverage is partly caused by the bad UE demodulation performance and other causes should be solved by RF optimization
ZTE Confidential Proprietary copy 2012 ZTE CORPORATION All rights reserved 32
UMTS KPI Optimization Analysis Guide Internal Use Only
44 Optimization of Mobility Indicators
Mobility indicators mainly fall into three categories mdash soft handovers hard handovers and inter-RAT handovers The handover problems usually happen in the following cases
The best server changes too fast or there is no best server due to pilot pollution
The handover is not prompt or there are pingpong handovers due to improper parameter configuration
Adjust the engineering parameters for antennas in areas with severe pilot pollution And adjust the handover parameters such as the values of 1A 1B CIO TTT (time to trigger) Hysteresis and so on to solve the problem that the handover is not prompt or there are pingpong handovers This section tries to solve this kind of problems through OMC data analysis and parameter optimization
441 Optimization of Soft Handovers
Missed neighboring cell configuration pilot pollution improper soft handover parameter configuration and equipment malfunctions are the major causes of soft handover failures To confirm the problems the field DTs are required
ZTE Confidential Proprietary copy 2012 ZTE CORPORATION All rights reserved 33
UMTS KPI Optimization Analysis Guide Internal Use Only
4411 Soft Handover Optimization Flowchart
Figure 4-12 Soft handover optimization flowchart
ZTE Confidential Proprietary copy 2012 ZTE CORPORATION All rights reserved 34
UMTS KPI Optimization Analysis Guide Internal Use Only
Extract performance data
TOP Ncell filtering
Analyze a single cell
1 Check NE alarms
2 Associate emergencies
3 Compare parameter
configurations
4 Associate indicators
5 Locate the fault
comprehensive ly
Exist or not
Handle alarms
Solved or not
Yes
Yes
End
No
No
Exist or not
Handle emergencies
Solved or not
Yes
No
No
Exist or not
Correct wrong parameter
configurations
Solved or not
Yes
No
No
List related indicator counters
RTWPResource
limit indicators
Checkamp analysis of interference
Optimization analysis of
resource limitCounters related to intra-frequency
handover failures
C301391101 C301390593C301391102 C301390594C301391103 C301390595C301390586 C301390596C301390587 C301390597C301390588 C301390598C301390589 C301390599C301390590 C301390600C301390591 C301390601C301390592 C301390602
Solved or not
Yes
Yes
No
Drive Test+RNC signaling
trace
Yes
Counters related to soft handover
failures
30055 3005630057 3005830059 3006030061 30062
Cell hand-inhand-out indicators
ZTE Confidential Proprietary copy 2012 ZTE CORPORATION All rights reserved 35
UMTS KPI Optimization Analysis Guide Internal Use Only
4412 Checking Missed Neighboring Cell Configuration
Generally speaking most of the call drops at the beginning of the optimization are caused by missed neighboring cell configuration The following methods are often used to judge whether the call drops are caused by missed configuration of co-frequency neighboring cells
Observe the active set EcIo information recorded by the UE and the Best Server EcIo information recorded by the Scanner before the call drop If the former record is very bad but the latter record is very good then check whether the Best Server scrambling code recorded by the Scanner appears in the latest list of the neighboring cells under intra-frequency measurement control If it does not then the call drop is caused by missed neighboring cell configuration
If the UE re-accesses immediately after the call drop and the cell scrambling codes during the UE reaccess and those during the call drop are different then the call drop may also be caused by missed neighboring cell configuration You can confirm it through measurement control (look backwards from the message of the call drop event for the latest intra-frequency measurement control message and check the neighboring cell list of this message)
Some UE may report the Detected Set information If the corresponding scrambling code appears in the Detected Set information before the call drop then the call drop is caused by missed neighboring cell configuration
4413 Checking Pilot Pollution
Definition of pilot pollution Excessive strong pilot signals exist at a certain point but none of them is strong enough to be the best server To form pilot pollution the following points in this definition should be satisfied
Strong pilot signal The absolute pilot signal strength is used to judge whether the pilot signal is a strong one The pilot signal strength can be evaluated through the pilot RSCP If the pilot RSCP exceeds a threshold it is considered a strong pilot signal The formula is
AbsoluteRSCPThRSCPCPICH __ gt
Excessive The number of pilot signals is used to judge whether there are excessive pilot signals at a certain point If the number exceeds a threshold it is regarded that excessive pilot signals exist at this point The formula is
NThNumberCPICH gt_
None of them is strong enough to be the best server The relative strength of a pilot signal is a key factor in judging whether the pilot signal is strong enough Based on the above definition and formulae if the difference between the strength of the
ZTE Confidential Proprietary copy 2012 ZTE CORPORATION All rights reserved 36
UMTS KPI Optimization Analysis Guide Internal Use Only
strongest pilot signal and that of the )1( +NTh strongest pilot signal at this point is
less than a threshold it is regarded that there is no pilot signal strong enough to be the best server at this point The formula is
lativeRSCPthThbest ThRSCPCPICHRSCPCPICHN Re_)1( )__( ltminus +
According to the above description it is regarded that pilot pollution exists if the following conditions are both satisfied
The number of pilot signals that meet the condition
AbsoluteRSCPThRSCPCPICH __ gt is more than NTh
lativeRSCPthThbest ThRSCPCPICHRSCPCPICHN Re_)1( )__( ltminus +
For example during the network optimization suppose
dBmTh AbsoluteRSCP 95_ minus= 3=NTh and dBTh lativeRSCP 5Re_ = if the following
conditions are both satisfied then it is regarded that pilot pollution exists
The number of the pilot signals that meet the condition
dBmRSCPCPICH 95_ minusgt is more than 3
dBRSCPCPICHRSCPCPICH thbest 5)__( 4 ltminus
4414 Adjusting Soft Handover Algorithm Parameters
You can solve the following kinds of problems by adjusting handover algorithm parameters
1 The handover is not prompt
From the perspective of the CS service signaling flow the symptom of this problem is that the UE cannot receive Active Set Update (physical channel reallocation in the case of the intra-frequency hard handover) because after the UE reports the measurement report the source cell has a fast reduction in EcIo When the RNC sends Active Set Update the UE has closed the transmitter due to the loss of downlink synchronization Viewed from the UE side it cannot receive Active Set Update In the PS services if the UE cannot receive Active Set Update or TRB resets before the handover the handover will also fail
From the perspective of signals the following phenomena may accompany this problem
ZTE Confidential Proprietary copy 2012 ZTE CORPORATION All rights reserved 37
UMTS KPI Optimization Analysis Guide Internal Use Only
minus Corner effect EcIo of the source cell decreases drastically and EcIo of the target cell increases sharply (very high when it appears)
minus Fast fading EcIo of the source cell decreases quickly for a while and then increases and EcIo of the target cell increases for a short while
2 Pingpong handovers The following phenomena may accompany this problem
The best server changes quickly Two or more cells take turns to be the best server But as the best server none of the cells can last long though they has good RSCPs and EcIos
There is no best server There are multiple cells Their RSCPs are normal and similar to each other But EcIo of every cell is very bad
From the perspective of the signaling flow Event 1A is reported immediately after one cell is deleted Because the UE cannot receive Active Set Update from the RNC the handover fails
4415 Equipment Malfunctions
First check the alarm console to see whether there are abnormal alarms and analyze the message traces at the same time Find out in which step the soft handover fails Check the failure message and contact the local product maintaining engineer to confirm whether the equipment has malfunctions
4416 Solutions
Corresponding adjustments should be taken for the confirmed problems
Handover failures caused by pilot pollution Adjust the engineering parameters of a certain antenna to set this antenna as the best server in this interfered location If the power of one of its sectors is reduced then Io of the pilot pollution area will decrease even if the powers of other pilots are not adjusted EcIo will also increase Thereby the EcIo differences with other scrambling codes in the active set will become larger and pilot pollution will be eliminated Through a lot of research ZTE has proved that the reduction in the pilot transmit power will not change cell capacity greatly If condition allows new base stations can be added to cover this area
Equipment malfunctions Consult the customer service engineers and ask them to help check whether there are alarms and whether the transport layer is abnormal If there are alarms coordinate with the customer service engineers and the engineering personnel to solve the problems
Call drops because the handovers are not prompt
ZTE Confidential Proprietary copy 2012 ZTE CORPORATION All rights reserved 38
UMTS KPI Optimization Analysis Guide Internal Use Only
minus Adjust the antenna to expand the handover zone
minus Configure the Event 1A handover parameters to make the handover easier to happen
minus Increase CIO to make the handover happen earlier in the target cell The sum of CIO and the actually measured value is used for judging the UE events including the UE intra-frequency handover CIO helps shift the cell border in the handover algorithm If CIO is configured with a larger value the handover will be easier to happen and there will be more UE in the soft-handover status but more resources will be occupied If CIO is configured with a smaller value the soft handover will be more difficult to happen and the receiving quality may be impaired A CIO of about 5dB is quite good for eliminating the fast fading and the corner effect but this configuration has some side effects such as the increase of handover proportion
Call drops caused by pingpong handovers Adjust the antenna to form a best server in its coverage zone or set the Event 1B handover parameters (increase the threshold of Event 1B the Event 1B hysteresis or the time to trigger Event 1B) to increase the difficulty in deleting the active set
442 Optimization of Hard Handovers
4421 Classification of Hard handovers
Hard handovers mainly fall into two classifications
Intra-frequency hard handovers The intra-frequency hard handover is triggered only when the intra-frequency softsofter handover cannot be performed and it is applicable to the following circumstances
minus Inter-RNC intra-frequency cell handovers when there is no Iur interface
minus Insufficient Iur interface resources though there is the Iur interface
minus Handovers controlled by the threshold of the PS service rate in the handover cell
The intra-frequency softsofter handovers can not be performed (intra-frequency hard handover should be triggered) in the following scenarios
minus When the intra-frequency handover happens the UE is using the transmit diversity in the active set cell but the target cell does not support the transmit diversity
minus The intra-frequency measurement report does not contain OFF and TM of the
ZTE Confidential Proprietary copy 2012 ZTE CORPORATION All rights reserved 39
UMTS KPI Optimization Analysis Guide Internal Use Only
target cell
minus When the intra-frequency handover happens between RNCs the Iur interface is unavailable
minus The UE performs the multiuser detection in the active set cell but the target cell does not support the multiuser detection
minus The target cell and the original cell belong to different classifications (The cells of R99 R5+R99 and R6+R5+R99 belong to the same classification while the cells of R5 and R6+R5 belong to another classification)
Inter-frequency hard handovers The inter-frequency hard handover means a UE connection is handed over from a cell of a UTRAN frequency to a cell of another frequency Many factors including the radio quality the load and the speed of the moving UE may trigger inter-frequency hard handovers
For example the radio quality triggers the inter-frequency hard handover in the following way
When the quality of the UE radio frequency becomes lower the inter-frequency measurement will be triggered and according to the measurement result the UE connection will be handed over to a better frequency
ZTE Confidential Proprietary copy 2012 ZTE CORPORATION All rights reserved 40
UMTS KPI Optimization Analysis Guide Internal Use Only
4422 Hard Handover Optimization Flowchart
Figure 4-13 Hard handover optimization flowchart
ZTE Confidential Proprietary copy 2012 ZTE CORPORATION All rights reserved 41
UMTS KPI Optimization Analysis Guide Internal Use Only
Extract performance data
TOP Ncell filtering
Analyze a single cell
1 Check NE alarms
2 Associate emergencies
3 Compare parameter
configurations
4 Associate indicators
5 Locate the fault
comprehensive ly
Exist or not
Handle alarms
Solved or not
Yes
Yes
End
No
Exist or not
Handle emergencies
Solved or not
YesNo
Exist or not
Correct wrong parameter
configurations
Solved or not
Yes
No
No
List related indicator counters
RTWPResource
limit indicators
Checkamp analysis of interference
Optimization analysis of
resource limit
Counters related to inter-frequency handover failures
C301110489 C301110516C301110499 C301110517C301110500 C301110518C301110501 C301110519C301110502 C301110520C301110503 C301110521C301110504 C301110522C301110505 C301110523
Solved or not
Yes
Yes
No
Drive Test+RNC signaling
trace
Yes
Counters related to hard handover
failures
30041 3004230043 3004430045 3004630047 30048
Cell hand-inhand-out indicators
NoNo
ZTE Confidential Proprietary copy 2012 ZTE CORPORATION All rights reserved 42
UMTS KPI Optimization Analysis Guide Internal Use Only
4423 Hard Handover Optimization Methods
The optimization flow for the hard handover is similar to that of the soft handover The major differences are in the parameter optimization To optimize intra-frequency hard handovers you can properly reduce the Event 1D hysteresis and the time to trigger Event 1D according to the real radio environment to ensure timely handovers
Inter-frequency coverage is often applied to some special scenarios such as indoor coverage and tested through CQT The method of judging whether there is missed configuration of the inter-frequency neighboring cell is almost the same as that of the co-frequency neighboring cell when a call drop occurs the UE fails to measure or report the inter-frequency neighboring cell after the call drop the UE resides in the inter-frequency neighboring cell again
The common hard handover problems are
1 The handover is not prompt The common symptoms are frequent call drops in the hard handovers when the UE moves
Solutions
Increase the threshold of activating the compressing mode The compressing mode is usually activated before the inter-frequency handover or the inter-RAT handover and it is used to measure the quality of the inter-frequency or inter-RAT cell You can set a threshold of the CPICH RSCP or EcIo to activate the compressing mode And the RSCP is widely used
minus Requirements on setting the threshold of activating the compressing mode Before the cell quality becomes low enough to cause a call drop the signal of the target cell should be measured and reported and the handover should be performed
minus Requirement on setting the threshold of deactivating the compression mode Frequent activationdeactivation of the compression mode should be avoided
Increase CIOs of the inter-frequency cell pair
Reduce the threshold of triggering the target frequency handover under the inter-frequency coverage
2 There are pingpong handovers
Solution Increase the hard handover hysteresis and the time to trigger the event
ZTE Confidential Proprietary copy 2012 ZTE CORPORATION All rights reserved 43
UMTS KPI Optimization Analysis Guide Internal Use Only
443 Optimization of Inter-RAT Handovers
4431 Configuring Basic Inter-RAT Parameters
Most of the inter-RAT handover failures are caused by incomplete parameter configuration The following parameters need special attention
Complete RNC parameter configuration for the GSM neighboring cell The 2G system shall provide the 3G system with the correct radio parameters based on negotiation mdash MCC MNC LAC ID (CI) NCC BCC frequency band indicator (900 or 1800) and BCCH
Table 4-3 Parameters That 2G Shall Provide to 3G
MCC MNC LACIDCI
NCC BCCFrequency
band indicator
BCCH
460 2 202 193 0 0 900 102
Complete GSM BSC parameter configuration for the WCDMA neighboring cell The 3G system shall provide the 2G system with the correct radio parameters based on negotiation mdash MCC MNC LAC RNC ID cell ID (C_ID) downlink frequency scrambling code and RAC
Table 4-4 Parameters That 3G Shall Provide to 2G
MCC MNC LACRNC
IDCell IDC_ID
Downlink frequency
Scrambling code
RAC
460 3 20 18 51 10787 51 20
According to the current strategy of one-way inter-RAT handovers if the parameter configuration is complete one probable cause of the inter-RAT handover failure is that the handover is not prompt The common parameter adjustment is to increase CIO the threshold to activatedeactivate the compressing mode and the threshold to trigger the WCDMA-to-GSM handover at the same time
Call drops during the inter-RAT handovers between WCDMA and GSM may be caused by
minus Inconsistent data configuration at the GSM side and the WCDMA side after GSM modifies the configuration data but does not inform WCDMA
minus Missed configuration of neighboring cells which can be solved by the correct configuration of neighboring cells
minus Too fast signal changes
ZTE Confidential Proprietary copy 2012 ZTE CORPORATION All rights reserved 44
UMTS KPI Optimization Analysis Guide Internal Use Only
minus Pingpong reselection
minus Faults with the UE for example the UE fails to respond to the handover or report the inter-RAT measurement report
minus Changes of the best server during the physical channel reallocation
minus Wrong LAC configuration which can be located through data configuration check
ZTE Confidential Proprietary copy 2012 ZTE CORPORATION All rights reserved 45
UMTS KPI Optimization Analysis Guide Internal Use Only
4432 Inter-RAT Handover Optimization Flowchart
Figure 4-14 Inter-RAT handover optimization flowchart
ZTE Confidential Proprietary copy 2012 ZTE CORPORATION All rights reserved 46
UMTS KPI Optimization Analysis Guide Internal Use Only
Extract performance data
TOP Ncell filtering
Analyze a single cell
1 Check NE alarms
2 Associate emergencies
3 Compare parameter
configurations
4 Associate indicators
5 Locate the fault
comprehensive ly
Exist or not
Handle alarms
Solved or not
Yes
Yes
End
No
No
Exist or not
Handle emergencies
Solved or not
Yes
No
No
Exist or not
Correct wrong parameter
configurations
Solved or not
Yes
No
No
List related indicator counters
RTWPResource
limit indicators
Checkamp analysis of interference
Optimization analysis of
resource limitCounters related to inter-RAT handover failures
C301130667 C301130681C301130668 C301130682C301130669 C301130690C301130670 C301130691C301130671 C301130692C301130672 C301130693C301130673 C301130694C301130674 C301130696C301130675 C301130697C301130677 C301130698C301130678 C301130699C301130679 C301130700
C301130680
Solved or not
Yes
Yes
No
Drive Test+RNC signaling
trace
Yes
Counters related to inter-RAT handover
failures
Cell hand-inhand-out indicators
30049 3005030051 3005230053 30054
ZTE Confidential Proprietary copy 2012 ZTE CORPORATION All rights reserved 47
UMTS KPI Optimization Analysis Guide Internal Use Only
45 Optimization of Resource Indicators
The resource indicators directly reflect the system capacity Increasing subscribers will consume more system resources and some resources may be limited for example the code resource may be limited the TCP access request may be rejected and the CE resource usage rate may exceed the threshold Limited system resources have a negative influence on the whole-network indicators and the subscribersrsquo perception for example call drops may frequently happen and more TCP access requests may be rejected during the voice services
Table 4-5 Resource KPIs and Alarm Thresholds
Resource type KPI No and nameAlarm
threshold
TCP
C301320150 Number of rejected services DCH downlink TCP limit
50
PI30167 Average non-HS (SOA) (SOA)DPA TCP 40
PI30092 Maximum Cell TCP () 100
PI30093 Average Cell TCP 70
UL TrafficPI30029 Handover Blocking Rate 05
KPI RTWP (in busy hour) -98 dBm
Code
C301320153 Number of rejected services DCH no code
50
PI30205 Average Cell HSUPA Users 12
PI30172 Cell Average HSDPA Users 16
CE
PI301830006 Maximum use Ratio of Uplink NodeB CE
60
PI301830010 Maximum use Ratio of Downlink NodeB CE
60
ZTE Confidential Proprietary copy 2012 ZTE CORPORATION All rights reserved 48
UMTS KPI Optimization Analysis Guide Internal Use Only
451 Resource Indicator Optimization Flowchart
Figure 4-15 Resource indicator optimization flowchart
ZTE Confidential Proprietary copy 2012 ZTE CORPORATION All rights reserved 49
UMTS KPI Optimization Analysis Guide Internal Use Only
Extract performance data
TOP Ncell filtering
Analyze a single cell
1 Check NE alarms
2 Associate emergencies
3 Compare parameter
configurations
4 Associate indicators
5 Locate the fault
comprehensive ly
Exist or not
Handle alarms
Solved or not
Yes
是
End
No
No
Exist or not
Handle emergencies
Solved or not
Yes
No
No
Exist or not
Correct wrong parameter
configurations
Solved or not
Yes
No
No
List related indicator counters
Code resource indicators
CE resource indicators
TCPadmission
reject counter
C301320150
Solved or not
Yes
Yes
No
Drive Test+RNC signaling
trace
Yes
Counter related to TCP limit
Cell TX power
indicators
30090 3009130092 3009330166 3016730168 3016930170 30171
30163301643016530075
30223302243045030451
Yes
Yes
ZTE Confidential Proprietary copy 2012 ZTE CORPORATION All rights reserved 50
UMTS KPI Optimization Analysis Guide Internal Use Only
452 Code Resource Optimization
The statistics of Number of rejected services and DCH no code the average code resource usage rate and the number of the HSDPA subscribers can be used to judge whether the code resource in a cell is limited If the code resource is limited you can adjust the code resource allocation to alleviate the situation
Based on the system algorithm when Formula 1 is satisfied you can add an HS-PDSCH when Formula 2 is satisfied then an HS-PDSCH is deleted
Formula 1 OcuRateNoHspdsch + OcuRateHspdsch + DpchCodeHy + 32 lt= 512
Formula 2 OcuRateNoHspdsch + OcuRateHspdsch + CodeUptHyA gt 512
OcuRateHspdschHSPDSCH means the number of the codes of SF=512 blocked by the HS-PDSCH OcuRateNoHspdsch means the number of codes of SF=512 blocked by other channels DpchCodeHy means the number of codes of SF=512 reserved for the DPCH and CodeUptHyA is the threshold to decide whether to delete the HSPDSCH
Therefore to ensure the access of the R99 subscribers you can make some adjustment according to Table 4-6 when the code resource is limited though the HSDPA rate may decrease
Table 4-6 Adjusting Code Resource Allocation
AbbreviationParameter
nameRange
and stepCurrent value
Update value
Remark
DpchCodeHy DPCH Code Hysteresis
0512 16 28
To decrease the number of rejected services for DCH no code
CodeUptHyACode Update Hysteresis A
0512 16 28
To decrease the number of rejected services for DCH no code
453 Monitoring CE Resource
The CE resource is mainly monitored through the maximum UE uplinkdownlink usage rate If there is any problem you can solve it by controlling the load or adding more boards
ZTE Confidential Proprietary copy 2012 ZTE CORPORATION All rights reserved 51
UMTS KPI Optimization Analysis Guide Internal Use Only
454 Optimization of Power Control
4541 Monitoring and Optimizing Downlink Power Control
Limited TCP in busy hours will not only increase access failures and call drops in the local cell but also increase soft handover failures and call drops in the neighboring cells Number of rejected services and DCH downlink TCP limit are intuitive KPIs to judge whether TCP is limited Although limited uplink capacity and massive UE moves in the rush hours may also cause call drops the limited TCP is absolutely a key factor
Based on the system algorithm MinHsdpaPower (MinHspaPwrRto) + NoHsPower gtNode B if the safety threshold is used (MinHsdpaPower means the power reserved for HSPA) then it will activate the downlink rate downgrade algorithm flow for the congestion (lower the downlink DCH rate) Although the rate downgrade can ensure access of some subscribers it is an irregular action and will degrade the performance
455 Speeding up Rate Downgrade
Considering that the cells with heavy load reject more access requests you can speed up the rate downgrade during the resource congestion to release the resources as soon as possible and avoid call drops caused by access failures (this method is only applicable to the cells with many PS service users but not those with only CS service users) Table 4-7 is an example of the parameter modification for the rate downgrade
Table 4-7 Example of Parameter Modification for Rate Downgrade
Abbreviation Parameter nameRange and
stepCurrent value
Update value
Remark
UlDnMaxStg Maximum Number of Degraded Uplink Load Steps Every Time
[1 8] 1 2 Downgrade from 384 Kbps to 16 Kbps
DlDnMaxStg Maximum Number of Degraded Downlink Load Steps Every Time
[1 8] 1 3 Downgrade from 384 Kbps to 8 Kbps
456 Monitoring and Optimizing Uplink Capacity
Handover Blocking Rate and RTWP can reflect the uplink capacity of the cell Because interference may also increase RTWP this factor should be distinguished during the RTWP monitoring Another effective indicator is the voice service erl If a cell has over 20 erls in busy hours you should pay special attention to it
ZTE Confidential Proprietary copy 2012 ZTE CORPORATION All rights reserved 52
UMTS KPI Optimization Analysis Guide Internal Use Only
457 Optimization of Uplink Capacity at the Whole Network Level
Case The uplink capacity was limited in a large number of sites after the cutover and the symptoms are a sharp rise of RTWP and a high call drop rate during the rush hours
After the following parameters were modified as shown in Table 4-8 the problem was solved
Table 4-8 Example of Power Control Parameter Modification
AbbreviationParameter
nameRange
Current value
Update value
ULINITSIRUplink Initial SIR target (dB)
UL 34 K136 K signaling UL 122 K AMR
4-5 35
ULMAXSIRMaximum Uplink SIR target (dB)
UL 34 K136 K signaling UL 122 K AMR
15 10
UlSirTargDnStepUplink SIR Target Down Step Size (dB)
UL 34 K136 K signaling UL 122 K AMR
01 02
458 Optimization of Uplink Capacity for a Single Cell
A lot of optimization measures can be taken to bring down the rising RTWP However with increasing subscribers the capacity may still be limited in some area while further modification of SirTarget will obviously degrade the call quality of the whole network and undermine the subscribersrsquo perception In this case you can adjust the power control parameters for a single site that has heavy traffic in the following way add one set of DivPc parameters and use this set of parameters only for this site
Case Table 4-9 shows an example of the power control parameter modification After this modification the call drop rate in the site with heavy traffic decreased to one quarter of the original one
Table 4-9 Example of Power Control Parameter Modification for Heavy-Traffic Cell
SRVTYPE ULINITSIR ULMAXSIR ULMINSIR
0 35-gt15 100-gt35 20-gt10
104 40-gt20 150-gt50 05-gt0
28 35-gt15 100-gt35 05-gt0
50 60-gt20 150-gt50 20-gt0
54 60-gt20 150-gt50 20-gt0
ZTE Confidential Proprietary copy 2012 ZTE CORPORATION All rights reserved 53
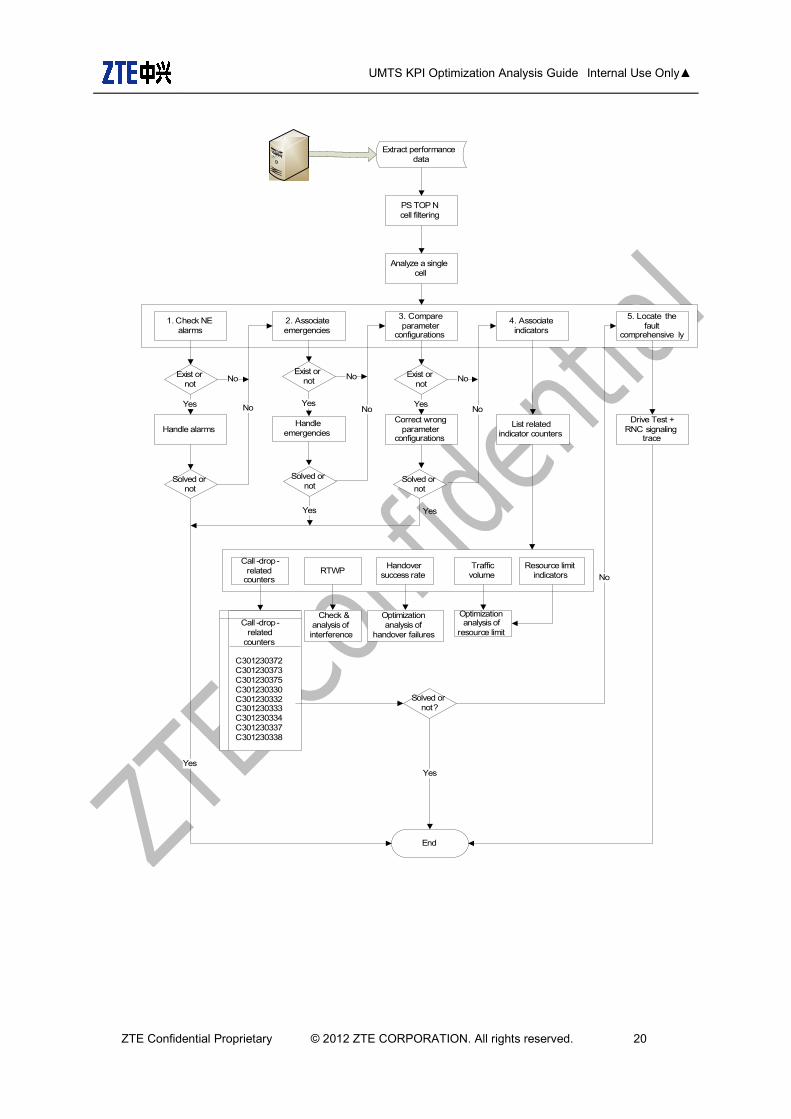
UMTS KPI Optimization Analysis Guide Internal Use Only
Extract performance data
PS TOP Ncell filtering
Analyze a single cell
1 Check NE alarms
2 Associate emergencies
3 Compare parameter
configurations
4 Associate indicators
5 Locate the fault
comprehensive ly
Exist or not
Handle alarms
Solved or not
Yes
Yes
End
No
No
Exist or not
Handle emergencies
Solved or not
Yes
No
No
Exist or not
Correct wrong parameter
configurations
Solved or not
Yes
No
No
List related indicator counters
Call -drop-related
countersRTWP
Handover success rate
Traffic volume
Resource limit indicators
Check amp analysis of interference
Optimizationanalysis of
handover failures
Optimization analysis of
resource limitCall -drop-
related counters
C301230372C301230373C301230375C301230330C301230332C301230333C301230334C301230337C301230338
Solved or not
Yes
Yes
No
Drive Test +RNC signaling
trace
Yes
ZTE Confidential Proprietary copy 2012 ZTE CORPORATION All rights reserved 20
UMTS KPI Optimization Analysis Guide Internal Use Only
43 Optimization of Accessibility Indicators
Accessibility performance includes the success rate of RRC connection setup and the success rate of CSPS RAB assignment These two kinds of KPIs play important roles in the network optimization and directly influence the success rate of CSPS service establishment In this document this kind of problems are found from the aspect of OMC data and solved through parameter optimization
431 Definition of Access Failure
For the mobile originated call in the CS domain the access failure event means that the UE sends RRC REQUEST and IE establish cause is Originating Conversational Call but alerting of the direct transfer message is not received
The relevant events are defined as follows in the access failure stage
RRC connection setup failure After considering the resending times and the waiting time the UE sends RRC CONNECTION REQUEST and does not receive the response from RNC or RRC CONNECTION REJECT delivered by RNC
Initial direct transfer and security mode establishment failure After sending RRC CONNECTION SETUP COMPLETE the UE does not send NAS SETUP
RAB assignment failure After receiving CALL PROCEEDING the UE does not receive RB SETUP delivered by RNC Or the UE replies with RB SETUP FAIL after receiving RB SETUP Or the UE receives DISCONNECT with the cause value not being Normal Release after receiving RB SETUP At this time the UE has not reported RB SETUP CMP
Failure after RAB assignment After the UE sends RB SETUP COMPLETE the originating UE receives DISCONNECTRELEASE from CN Or the UE waits CONNECT or ALERTING overtime and launches the Call Clearing process Or the UE becomes IDLE before receiving Alerting and starts to receive the system message
For the mobile terminated in the CS domain the access failure event means that the terminating UE receives the paging of paging type 1 and does not send RRC CONNECTION REQUEST with the cause value being Terminating Conversational Call Or the UE does not send the alerting of direct transfer message to CN after sending RRC CONNECTION REQUEST
The relevant events are defined as follows in the access failure stage
RRC connection setup failure After sending RRC CONNECTION REQUEST the UE does not receive the response from RNC or RRC CONNECTION REJECT delivered by RNC
Initial direct transfer and security mode establishment failure After sending RRC
ZTE Confidential Proprietary copy 2012 ZTE CORPORATION All rights reserved 21
UMTS KPI Optimization Analysis Guide Internal Use Only
CONNECTION SETUP COMPLETE the UE does not receive the SETUP direct transfer message Or the UE sends RELEASE COMPLETE Or the UE receives DISCONNECT from CN
RAB assignment failure The UE does not receive RB SETUP delivered by RNC after sending CALL CONFIRM Or the UE replies with RB SETUP FAIL after receiving RB SETUP Or the UE receives DISCONNECT with the cause value not being Normal Release after receiving RB SETUP At this time the UE has not reported RB SETUP CMP
Failure after RAB assignment After the UE sends RB SETUP COMPLETE the terminating UE receives DISCONNECTRELEASE from CN
432 Analysis on RRC Connection Failures
The problem of RRC connection setup failure can be analyzed through the UE signaling flow and RNC single-user tracing The RRC connection setup includes the following steps
The UE sends RRC Connection Request through the RACH channel
RNC sends RRC Connection Setup through the FACH channel
The UE sends RRC Connection Setup Complete through the dedicated uplink channel after the downlink dedicated channel is established and synchronized
RRC connection setup failures are always caused by following issues
Uplink RACH problem
Problem about downlink FACH power allocation proportion
Parameter reselection problem of the cell
Low downlink dedicated initial transmitting power
Uplink initial power control problem
Congestion
Equipment malfunctions
Among these issues the problems of uplink RACH downlink FACH power allocation proportion parameter reselection of the cell and equipment malfunctions appear more frequently
ZTE Confidential Proprietary copy 2012 ZTE CORPORATION All rights reserved 22
UMTS KPI Optimization Analysis Guide Internal Use Only
4321 Analysis Flowchart of RRC Connection Setup Failures
Figure 4-10 Analysis flowchart of RRC connection setup failures
ZTE Confidential Proprietary copy 2012 ZTE CORPORATION All rights reserved 23
UMTS KPI Optimization Analysis Guide Internal Use Only
Extract performance data
TOP Ncell filtering
Analyze a single cell
1 Check NE alarms
2 Associate emergencies
3 Compare parameter
configurations
4 Associate indicators
5 Locate the fault
comprehensive ly
Exist or not
Handle alarms
Solved or not
Yes
Yes
End
No
No
Exist or not
Handle emergencies
Solved or not
Yes
No
No
Exist or not
Correct wrong parameter
configurations
Solved or not
Yes
No
No
List related indicator counters
Counters related to RRC setup
failuresRTWP
Resource limit
indicators
Checkamp analysis of interference
Optimization analysis of
resource limitCounters related
to RRC setup failures
C301480485C301480486C301480487C301480489C301480490C301480491C301481288C301481289C301481337C301481338C301481339C301481407C301481408
Solved or not
Yes
Yes
No
Drive Test+RNC signaling
trace
Yes
ZTE Confidential Proprietary copy 2012 ZTE CORPORATION All rights reserved 24
UMTS KPI Optimization Analysis Guide Internal Use Only
4322 UE sends RRC Connection Request but RNC does not receive it
If the EcIo of downlink CPICH is relatively low it is the problem of coverage
If the EcIo of downlink CPICH is not very low (for example the value is larger than -14 dB) Usually it is the problem of RACH and the following issues may cause the problem
minus The power of Preamble does not rise to a required value and the rising times of Preamble should be increased
minus The output power of UE is lower than the required value which is caused by poor UE performance In this case the UE should be changed
minus The NodeB equipment has a standing wave and the engineer should check whether NodeB has any SWR alarm
minus The radius of the cell is set improperly If the radius parameter of the cell is set too small the NodeB can not synchronize the UE beyond the range of the radius and the access fails This problem often happens in the places with large coverage such as the rural areas and the suburbs
4323 RNC delivers RRC Connection Reject after receiving RRC Setup Request
When RRC Connection Reject appears the engineer should check the specific reject cause value Usually there are two kinds of causes
The CPU load of RNC control plane board is too heavy and more boards should be added
DCH and FACH admission is rejected However this situation does not always happen
4324 UE does not receive RRC Connection Setup delivered by RNC
This problem may be caused by the following reasons
Poor coverage
Improper parameters of cell selection and reselection
Checking method The engineer should check the EcIo of CPICH If the value is lower than -12 dB (EcIo is -12 dB by default) and there is no cell of better quality in the monitor set the cause of this problem is poor coverage If there is better cell in the monitor set cell reselection may cause this problem
Poor coverage can be improved by coverage enhancement such as adding some sites to cover the places without signal coverage and adjusting the engineering parameters If the coverage can not be improved the engineer can enhance the FACH power according to
ZTE Confidential Proprietary copy 2012 ZTE CORPORATION All rights reserved 25
UMTS KPI Optimization Analysis Guide Internal Use Only
the PCPICH EcIo coverage of the current network For example if all the pilot EcIo values are larger than -12 dB in the coverage area the power proportion of the common channel should be configured on the basis of the situation that the EcIo value is larger than -12 dB And so the success rate of the idle UE assessment can be ensured
As for the access problem caused by cell selection and reselection the engineer can speed up the cell selection and reselection by adjusting the cell selection and reselection parameters and the problem of RRC connection setup failure caused by improper cell selection and reselection parameters can be solved
Note
The RRC Connection Setup message is borne by FACH RRC Connection Request sent by the UE is received by UTRAN at the preamble of PRACH and then it is sent from the RACH channel based on the current preamble power And the transmit power of preamble can rise all the time until the response is received (There is a limitation for the maximum number of preamble retransmissions) Therefore in the areas with poor coverage the RACH coverage and FACH coverage may become unbalanced and as a result UTRAN can receive RRC Connection Request sent by the UE but the UE can not receive RRC Connection Setup sent by RNC
4325 UE receives RRC Connection Setup and does not send RRC Setup Complete
If the downlink signal quality is normal this problem may be caused by the abnormal condition of the cell phone
Another reason of this problem may be the downlink synchronization failure caused by the low initial power of downlink dedicated channel You can solve this problem by adjusting the service downlink EbNo
4326 RNC does not receive RRC Setup Complete sent by UE
Because the uplink initial power control may increase the UE transmit power this kind of problem seldom appears If it appears the engineer can increase the Constant Value of the dedicated channel properly to raise the uplink DPCCH initial transmission power of the UE
At the same time this problem is also relevant with the uplink SIR initial target value configuration because this value may affect the uplink initial synchronization at the initial stage of link setup If the value of the parameter is set too large there will be too much uplink inference brought by the initial setup of the link If the value is set too small the uplink synchronization will take longer time and the initial synchronization may even fail This parameter is an RNC-level parameter which has a great influence on network performance Therefore the engineer should be cautious while adjusting this parameter
ZTE Confidential Proprietary copy 2012 ZTE CORPORATION All rights reserved 26
UMTS KPI Optimization Analysis Guide Internal Use Only
Note
RRC Connection Setup Complete is sent through uplink DPCH and the UE calculates the initial power of uplink DPCCH according to the received IErdquoDPCCH_Power_offsetrdquo and the measured CPICH_RSCP value
DPCCH_Initial_power = DPCCH_Power_offset - CPICH_RSCP
DPCCH_Power_offset = Primary CPICH DL TX Power + UL Interference + Constant Value The Constant Value can be configured in the OMC If this value is set too small the UE may not have enough power to send RRC Connection Setup Complete
433 Analysis on RABRB Setup Failures
When RAB or RB setup fails RNC will send RAB Assignment Fail in the RAB Assignment Response signaling The engineer can find out the specific failure reason from the failure cause value carried in relevant cells The reasons for common RABRB setup failures include
RNC directly rejecting RAB Setup Request because of wrong parameter configuration
Admission reject
RAB setup failure because the UE fails to respond to RB Setup Request
RAB setup failure because the Uu interface fails to set up RB
ZTE Confidential Proprietary copy 2012 ZTE CORPORATION All rights reserved 27
UMTS KPI Optimization Analysis Guide Internal Use Only
4331 Analysis Flowchart of RAB Setup Failures
Figure 4-11 Analysis flowchart of RAB setup failures
ZTE Confidential Proprietary copy 2012 ZTE CORPORATION All rights reserved 28
UMTS KPI Optimization Analysis Guide Internal Use Only
Extract performance data
TOP Ncell filtering
Analyze a single cell
1 Check NE alarms
2 Associate emergencies
3 Compare parameter
configurations
4 Associate indicators
5 Locate the fault
comprehensively
Exist or not
Handle alarms
Solved or not
Yes
Yes
End
No
No
Exist or not
Handle emergencies
Solved or not
Yes
No
No
Exist or not
Correct wrong parameter
configurations
Solved or not
Yes
No
No
List related indicator counters
Counters related to RAB setup failures RTWP
Resource limit
indicators
Checkamp analysis of interference
Optimization analysis of
resource limitCounters related to RAB setup failures
CS domain PS domainC301230290 C301230302C301230291 C301230303C301230292 C301230304C301230293 C301230305C301230294 C301230306C301230295 C301230307C301230296 C301230308C301230297 C301230309C301230298 C301230310C301230299 C301230311C301230300 C301230312C301230301 C301230313
Solved or not
Yes
Yes
No
Drive Test+RNC signaling
trace
Yes
ZTE Confidential Proprietary copy 2012 ZTE CORPORATION All rights reserved 29
UMTS KPI Optimization Analysis Guide Internal Use Only
4332 RNC Directly Rejecting RAB Setup Request Because Of Wrong Parameter Configuration
The case that RNC responds with RAB Setup Failure directly is seldom caused by invalid parameter configuration in the business network Usually this case is caused by special operations of the special users
The main scenario is that the subscription information of the userrsquos PS service is beyond the capability of the UE which leads to the direct refusal from RNC For example a special userrsquos subscription rates of uplink and downlink are 384 K but the maximum uplink rate of the UE is only 64 K The maximum uplink and downlink rates of the QoS message used for activating PDP set by the AT command or mobile terminal software used by the user are 384 K so the RNC will find the maximum uplink rate is beyond the UErsquos capability directly reply with RAB Setup Failure and will not launch the RB setup process when it receives RAB Assignment Request
After the RAB setup fails because the parameter configuration is beyond the UErsquos capability SGSN will negotiate again to launch the new RAB assignment until the UE has the capability to support the assignment and the RAB assignment is finished For the users the PDP activation is still successful and the actual maximum rate is the maximum rate the UE can support
However if the minimum guaranteed bit rate required by the QoS setting in the UErsquos PDP activation request is beyond the UErsquos capability though the network negotiates a lower rate to accept the UErsquos PDP activation request the UE will launch the request of deactivating PDP when it finds that the rate negotiated by the network in PDP activation accept request is lower than the minimum guaranteed bit rate and finally the PDP activation can not be completed
4333 Admission Reject
For the non-HSDPA user if there are insufficient system resources (including power channel code lub transmission resource and CE) the call establishment failure will be caused by the admission reject At this time it is necessary to check the network load code resource lub transmission resource and CE resource occupation to make sure the congestion is caused by the limitation of a certain kind of resource What is more the engineer should plan the corresponding expansion method
If the cell does not support the HSDPA service the R99 user admission is judged according to the fixed R99 admission threshold If the cell supports the HSDPA service and the HSDPA and R99 dynamic power is allocated the uplink admission of non-HSDPA is judged based on RTWP or the equivalent user number If the uplink load is too heavy the non-HSDPA user admission will also fail
If the bandwidth configuration on the lub interface is insufficient the lub interface will reject the R99 data service activation because of limited bandwidth
ZTE Confidential Proprietary copy 2012 ZTE CORPORATION All rights reserved 30
UMTS KPI Optimization Analysis Guide Internal Use Only
The admission control of the NodeB Credit resource is similar to the power admission control Whether the remaining Credit can support the currently requested service or not can be judged according to the spectrum spreading factor of the new access user According to the condition of the RAB Downsizing Switch RNC will deal with the issue in the corresponding way
For the HSDPA user in the dynamic power allocation mode besides the mentioned system resources such as the power channel code lub transmission resource and CE the admission reject should take into consideration whether the number of H users supported by NodeB and the number of H users supported by the cell are over the regulated threshold or not into consideration
For the HSDPA user when the bandwidth configuration on lub interface is insufficient the admission reject will not happen but the rate will be reduced What is more the AAL2PATHs of HSDPA and R99 are configured respectively and the HSDPA AAL2PATH must be configured to the HSDPA_RT or HSDPA_NRT type If the HSDPA AAL2PATH is configured to RT or NRT of R99 AAL2PATH type the RAB assignment failure will not happen but RNC will establish the HSDPA service as R99 384 Kbps
For the downlink power admission
Besides whether the R99 service load is over the non-HSDPA service threshold DCH service should take into consideration whether non-HSDPA power and HSDPA GBP (the minimum power needed for the guaranteed bit rate) are over the general power threshold of the cell
For the HSDPA service it is necessary to check whether the throughput rate provided by the cell is over the sum of all the usersrsquo GBR thresholds or whether the GBPs of the stream service and the background service are over the HSDPA power of the cell At the same time whether the non-HSDPA power and the HSDPA GBP (the minimum power needed for the guaranteed bit rate) are over the overall power threshold of the cell should be also taken into consideration
For the lub admission
For the DCH service the admission is made according to the multiplication of the peak rate and the service activation factor
For HSDPA service the admission is made according to the GBR
If the lub exceeds the congestion threshold the DCCC rate reduction will be triggered And if the RLC_AM retransmission rate is over a certain threshold the Iub Overbooking switch can be opened to trigger the TF which limits R99 or to reduce the rate of HSDPA service by a certain factor
ZTE Confidential Proprietary copy 2012 ZTE CORPORATION All rights reserved 31
UMTS KPI Optimization Analysis Guide Internal Use Only
4334 RAB Setup Failure Because the UE Fails to Respond to RB Setup
The UE fails to respond to RB setup mainly because of the userrsquos operation
Take the following cases as examples
When the user already has had the downlink 12 K data service he receives RB Setup Request of the VP service (either the originated call in the VP domain or the terminated call in the VP domain) Because the UE does not support the VP and high-speed PS service in the downlink at the same time it directly replies with RB Setup Failure and the cause value is unsupported configuration
Compared with the WCDMA subscriber originating the VP service the terminating subscriber resides in the GSM network and so it does not support the VP service After RNC receives RAB Assignment Request the core network will deliver the Disconnect command right after call proceeding and the cause value is Bearer capability not authorized At this time the UE has just received the RB SETUP command and has no enough time to finish the RB setup So the UE will reply with RB Setup Failure after it receives the Disconnect command and the RNC will reply with RAB Setup Failure with the cause value being failure in radio interface procedure
4335 RAB Setup Failure Because the Uu Interface Fails to Set Up RB
RNC sends the Radio Bearer Setup command to the UE but fails to receive Radio Bearer Setup Compete This kind of situation (RB setup failure) often appears in the cells with weak signals There are two causes of weak signals one is that the UE does not reside in the best server to launch the access and the other is poor coverage
If the UE does not reside in the best server to launch the access it will hope to enter the best server through active set update in the RB setup process (At the same time the fast signal change will drastically weaken the signals in the cell) but the active set update can only be processed after the RB setup is completed because the procedures can not be processed alternately (Neither the network nor the terminal supports it) Therefore RB can only be set up in the cell with weak signals and the setup is easy to fail As for this situation the starting threshold and speed of co-frequency cell reselection should be increased to make the UE reside in the best server and launch the access as soon as possible
RB setup failure may be caused by the poor downlinkuplink coverage If the failure is caused by downlink coverage the UE can not receive the Radio Bearer Setup command which may be caused by the uplink interference and this can be fixed through checking RTWP The poor downlink coverage is partly caused by the bad UE demodulation performance and other causes should be solved by RF optimization
ZTE Confidential Proprietary copy 2012 ZTE CORPORATION All rights reserved 32
UMTS KPI Optimization Analysis Guide Internal Use Only
44 Optimization of Mobility Indicators
Mobility indicators mainly fall into three categories mdash soft handovers hard handovers and inter-RAT handovers The handover problems usually happen in the following cases
The best server changes too fast or there is no best server due to pilot pollution
The handover is not prompt or there are pingpong handovers due to improper parameter configuration
Adjust the engineering parameters for antennas in areas with severe pilot pollution And adjust the handover parameters such as the values of 1A 1B CIO TTT (time to trigger) Hysteresis and so on to solve the problem that the handover is not prompt or there are pingpong handovers This section tries to solve this kind of problems through OMC data analysis and parameter optimization
441 Optimization of Soft Handovers
Missed neighboring cell configuration pilot pollution improper soft handover parameter configuration and equipment malfunctions are the major causes of soft handover failures To confirm the problems the field DTs are required
ZTE Confidential Proprietary copy 2012 ZTE CORPORATION All rights reserved 33
UMTS KPI Optimization Analysis Guide Internal Use Only
4411 Soft Handover Optimization Flowchart
Figure 4-12 Soft handover optimization flowchart
ZTE Confidential Proprietary copy 2012 ZTE CORPORATION All rights reserved 34
UMTS KPI Optimization Analysis Guide Internal Use Only
Extract performance data
TOP Ncell filtering
Analyze a single cell
1 Check NE alarms
2 Associate emergencies
3 Compare parameter
configurations
4 Associate indicators
5 Locate the fault
comprehensive ly
Exist or not
Handle alarms
Solved or not
Yes
Yes
End
No
No
Exist or not
Handle emergencies
Solved or not
Yes
No
No
Exist or not
Correct wrong parameter
configurations
Solved or not
Yes
No
No
List related indicator counters
RTWPResource
limit indicators
Checkamp analysis of interference
Optimization analysis of
resource limitCounters related to intra-frequency
handover failures
C301391101 C301390593C301391102 C301390594C301391103 C301390595C301390586 C301390596C301390587 C301390597C301390588 C301390598C301390589 C301390599C301390590 C301390600C301390591 C301390601C301390592 C301390602
Solved or not
Yes
Yes
No
Drive Test+RNC signaling
trace
Yes
Counters related to soft handover
failures
30055 3005630057 3005830059 3006030061 30062
Cell hand-inhand-out indicators
ZTE Confidential Proprietary copy 2012 ZTE CORPORATION All rights reserved 35
UMTS KPI Optimization Analysis Guide Internal Use Only
4412 Checking Missed Neighboring Cell Configuration
Generally speaking most of the call drops at the beginning of the optimization are caused by missed neighboring cell configuration The following methods are often used to judge whether the call drops are caused by missed configuration of co-frequency neighboring cells
Observe the active set EcIo information recorded by the UE and the Best Server EcIo information recorded by the Scanner before the call drop If the former record is very bad but the latter record is very good then check whether the Best Server scrambling code recorded by the Scanner appears in the latest list of the neighboring cells under intra-frequency measurement control If it does not then the call drop is caused by missed neighboring cell configuration
If the UE re-accesses immediately after the call drop and the cell scrambling codes during the UE reaccess and those during the call drop are different then the call drop may also be caused by missed neighboring cell configuration You can confirm it through measurement control (look backwards from the message of the call drop event for the latest intra-frequency measurement control message and check the neighboring cell list of this message)
Some UE may report the Detected Set information If the corresponding scrambling code appears in the Detected Set information before the call drop then the call drop is caused by missed neighboring cell configuration
4413 Checking Pilot Pollution
Definition of pilot pollution Excessive strong pilot signals exist at a certain point but none of them is strong enough to be the best server To form pilot pollution the following points in this definition should be satisfied
Strong pilot signal The absolute pilot signal strength is used to judge whether the pilot signal is a strong one The pilot signal strength can be evaluated through the pilot RSCP If the pilot RSCP exceeds a threshold it is considered a strong pilot signal The formula is
AbsoluteRSCPThRSCPCPICH __ gt
Excessive The number of pilot signals is used to judge whether there are excessive pilot signals at a certain point If the number exceeds a threshold it is regarded that excessive pilot signals exist at this point The formula is
NThNumberCPICH gt_
None of them is strong enough to be the best server The relative strength of a pilot signal is a key factor in judging whether the pilot signal is strong enough Based on the above definition and formulae if the difference between the strength of the
ZTE Confidential Proprietary copy 2012 ZTE CORPORATION All rights reserved 36
UMTS KPI Optimization Analysis Guide Internal Use Only
strongest pilot signal and that of the )1( +NTh strongest pilot signal at this point is
less than a threshold it is regarded that there is no pilot signal strong enough to be the best server at this point The formula is
lativeRSCPthThbest ThRSCPCPICHRSCPCPICHN Re_)1( )__( ltminus +
According to the above description it is regarded that pilot pollution exists if the following conditions are both satisfied
The number of pilot signals that meet the condition
AbsoluteRSCPThRSCPCPICH __ gt is more than NTh
lativeRSCPthThbest ThRSCPCPICHRSCPCPICHN Re_)1( )__( ltminus +
For example during the network optimization suppose
dBmTh AbsoluteRSCP 95_ minus= 3=NTh and dBTh lativeRSCP 5Re_ = if the following
conditions are both satisfied then it is regarded that pilot pollution exists
The number of the pilot signals that meet the condition
dBmRSCPCPICH 95_ minusgt is more than 3
dBRSCPCPICHRSCPCPICH thbest 5)__( 4 ltminus
4414 Adjusting Soft Handover Algorithm Parameters
You can solve the following kinds of problems by adjusting handover algorithm parameters
1 The handover is not prompt
From the perspective of the CS service signaling flow the symptom of this problem is that the UE cannot receive Active Set Update (physical channel reallocation in the case of the intra-frequency hard handover) because after the UE reports the measurement report the source cell has a fast reduction in EcIo When the RNC sends Active Set Update the UE has closed the transmitter due to the loss of downlink synchronization Viewed from the UE side it cannot receive Active Set Update In the PS services if the UE cannot receive Active Set Update or TRB resets before the handover the handover will also fail
From the perspective of signals the following phenomena may accompany this problem
ZTE Confidential Proprietary copy 2012 ZTE CORPORATION All rights reserved 37
UMTS KPI Optimization Analysis Guide Internal Use Only
minus Corner effect EcIo of the source cell decreases drastically and EcIo of the target cell increases sharply (very high when it appears)
minus Fast fading EcIo of the source cell decreases quickly for a while and then increases and EcIo of the target cell increases for a short while
2 Pingpong handovers The following phenomena may accompany this problem
The best server changes quickly Two or more cells take turns to be the best server But as the best server none of the cells can last long though they has good RSCPs and EcIos
There is no best server There are multiple cells Their RSCPs are normal and similar to each other But EcIo of every cell is very bad
From the perspective of the signaling flow Event 1A is reported immediately after one cell is deleted Because the UE cannot receive Active Set Update from the RNC the handover fails
4415 Equipment Malfunctions
First check the alarm console to see whether there are abnormal alarms and analyze the message traces at the same time Find out in which step the soft handover fails Check the failure message and contact the local product maintaining engineer to confirm whether the equipment has malfunctions
4416 Solutions
Corresponding adjustments should be taken for the confirmed problems
Handover failures caused by pilot pollution Adjust the engineering parameters of a certain antenna to set this antenna as the best server in this interfered location If the power of one of its sectors is reduced then Io of the pilot pollution area will decrease even if the powers of other pilots are not adjusted EcIo will also increase Thereby the EcIo differences with other scrambling codes in the active set will become larger and pilot pollution will be eliminated Through a lot of research ZTE has proved that the reduction in the pilot transmit power will not change cell capacity greatly If condition allows new base stations can be added to cover this area
Equipment malfunctions Consult the customer service engineers and ask them to help check whether there are alarms and whether the transport layer is abnormal If there are alarms coordinate with the customer service engineers and the engineering personnel to solve the problems
Call drops because the handovers are not prompt
ZTE Confidential Proprietary copy 2012 ZTE CORPORATION All rights reserved 38
UMTS KPI Optimization Analysis Guide Internal Use Only
minus Adjust the antenna to expand the handover zone
minus Configure the Event 1A handover parameters to make the handover easier to happen
minus Increase CIO to make the handover happen earlier in the target cell The sum of CIO and the actually measured value is used for judging the UE events including the UE intra-frequency handover CIO helps shift the cell border in the handover algorithm If CIO is configured with a larger value the handover will be easier to happen and there will be more UE in the soft-handover status but more resources will be occupied If CIO is configured with a smaller value the soft handover will be more difficult to happen and the receiving quality may be impaired A CIO of about 5dB is quite good for eliminating the fast fading and the corner effect but this configuration has some side effects such as the increase of handover proportion
Call drops caused by pingpong handovers Adjust the antenna to form a best server in its coverage zone or set the Event 1B handover parameters (increase the threshold of Event 1B the Event 1B hysteresis or the time to trigger Event 1B) to increase the difficulty in deleting the active set
442 Optimization of Hard Handovers
4421 Classification of Hard handovers
Hard handovers mainly fall into two classifications
Intra-frequency hard handovers The intra-frequency hard handover is triggered only when the intra-frequency softsofter handover cannot be performed and it is applicable to the following circumstances
minus Inter-RNC intra-frequency cell handovers when there is no Iur interface
minus Insufficient Iur interface resources though there is the Iur interface
minus Handovers controlled by the threshold of the PS service rate in the handover cell
The intra-frequency softsofter handovers can not be performed (intra-frequency hard handover should be triggered) in the following scenarios
minus When the intra-frequency handover happens the UE is using the transmit diversity in the active set cell but the target cell does not support the transmit diversity
minus The intra-frequency measurement report does not contain OFF and TM of the
ZTE Confidential Proprietary copy 2012 ZTE CORPORATION All rights reserved 39
UMTS KPI Optimization Analysis Guide Internal Use Only
target cell
minus When the intra-frequency handover happens between RNCs the Iur interface is unavailable
minus The UE performs the multiuser detection in the active set cell but the target cell does not support the multiuser detection
minus The target cell and the original cell belong to different classifications (The cells of R99 R5+R99 and R6+R5+R99 belong to the same classification while the cells of R5 and R6+R5 belong to another classification)
Inter-frequency hard handovers The inter-frequency hard handover means a UE connection is handed over from a cell of a UTRAN frequency to a cell of another frequency Many factors including the radio quality the load and the speed of the moving UE may trigger inter-frequency hard handovers
For example the radio quality triggers the inter-frequency hard handover in the following way
When the quality of the UE radio frequency becomes lower the inter-frequency measurement will be triggered and according to the measurement result the UE connection will be handed over to a better frequency
ZTE Confidential Proprietary copy 2012 ZTE CORPORATION All rights reserved 40
UMTS KPI Optimization Analysis Guide Internal Use Only
4422 Hard Handover Optimization Flowchart
Figure 4-13 Hard handover optimization flowchart
ZTE Confidential Proprietary copy 2012 ZTE CORPORATION All rights reserved 41
UMTS KPI Optimization Analysis Guide Internal Use Only
Extract performance data
TOP Ncell filtering
Analyze a single cell
1 Check NE alarms
2 Associate emergencies
3 Compare parameter
configurations
4 Associate indicators
5 Locate the fault
comprehensive ly
Exist or not
Handle alarms
Solved or not
Yes
Yes
End
No
Exist or not
Handle emergencies
Solved or not
YesNo
Exist or not
Correct wrong parameter
configurations
Solved or not
Yes
No
No
List related indicator counters
RTWPResource
limit indicators
Checkamp analysis of interference
Optimization analysis of
resource limit
Counters related to inter-frequency handover failures
C301110489 C301110516C301110499 C301110517C301110500 C301110518C301110501 C301110519C301110502 C301110520C301110503 C301110521C301110504 C301110522C301110505 C301110523
Solved or not
Yes
Yes
No
Drive Test+RNC signaling
trace
Yes
Counters related to hard handover
failures
30041 3004230043 3004430045 3004630047 30048
Cell hand-inhand-out indicators
NoNo
ZTE Confidential Proprietary copy 2012 ZTE CORPORATION All rights reserved 42
UMTS KPI Optimization Analysis Guide Internal Use Only
4423 Hard Handover Optimization Methods
The optimization flow for the hard handover is similar to that of the soft handover The major differences are in the parameter optimization To optimize intra-frequency hard handovers you can properly reduce the Event 1D hysteresis and the time to trigger Event 1D according to the real radio environment to ensure timely handovers
Inter-frequency coverage is often applied to some special scenarios such as indoor coverage and tested through CQT The method of judging whether there is missed configuration of the inter-frequency neighboring cell is almost the same as that of the co-frequency neighboring cell when a call drop occurs the UE fails to measure or report the inter-frequency neighboring cell after the call drop the UE resides in the inter-frequency neighboring cell again
The common hard handover problems are
1 The handover is not prompt The common symptoms are frequent call drops in the hard handovers when the UE moves
Solutions
Increase the threshold of activating the compressing mode The compressing mode is usually activated before the inter-frequency handover or the inter-RAT handover and it is used to measure the quality of the inter-frequency or inter-RAT cell You can set a threshold of the CPICH RSCP or EcIo to activate the compressing mode And the RSCP is widely used
minus Requirements on setting the threshold of activating the compressing mode Before the cell quality becomes low enough to cause a call drop the signal of the target cell should be measured and reported and the handover should be performed
minus Requirement on setting the threshold of deactivating the compression mode Frequent activationdeactivation of the compression mode should be avoided
Increase CIOs of the inter-frequency cell pair
Reduce the threshold of triggering the target frequency handover under the inter-frequency coverage
2 There are pingpong handovers
Solution Increase the hard handover hysteresis and the time to trigger the event
ZTE Confidential Proprietary copy 2012 ZTE CORPORATION All rights reserved 43
UMTS KPI Optimization Analysis Guide Internal Use Only
443 Optimization of Inter-RAT Handovers
4431 Configuring Basic Inter-RAT Parameters
Most of the inter-RAT handover failures are caused by incomplete parameter configuration The following parameters need special attention
Complete RNC parameter configuration for the GSM neighboring cell The 2G system shall provide the 3G system with the correct radio parameters based on negotiation mdash MCC MNC LAC ID (CI) NCC BCC frequency band indicator (900 or 1800) and BCCH
Table 4-3 Parameters That 2G Shall Provide to 3G
MCC MNC LACIDCI
NCC BCCFrequency
band indicator
BCCH
460 2 202 193 0 0 900 102
Complete GSM BSC parameter configuration for the WCDMA neighboring cell The 3G system shall provide the 2G system with the correct radio parameters based on negotiation mdash MCC MNC LAC RNC ID cell ID (C_ID) downlink frequency scrambling code and RAC
Table 4-4 Parameters That 3G Shall Provide to 2G
MCC MNC LACRNC
IDCell IDC_ID
Downlink frequency
Scrambling code
RAC
460 3 20 18 51 10787 51 20
According to the current strategy of one-way inter-RAT handovers if the parameter configuration is complete one probable cause of the inter-RAT handover failure is that the handover is not prompt The common parameter adjustment is to increase CIO the threshold to activatedeactivate the compressing mode and the threshold to trigger the WCDMA-to-GSM handover at the same time
Call drops during the inter-RAT handovers between WCDMA and GSM may be caused by
minus Inconsistent data configuration at the GSM side and the WCDMA side after GSM modifies the configuration data but does not inform WCDMA
minus Missed configuration of neighboring cells which can be solved by the correct configuration of neighboring cells
minus Too fast signal changes
ZTE Confidential Proprietary copy 2012 ZTE CORPORATION All rights reserved 44
UMTS KPI Optimization Analysis Guide Internal Use Only
minus Pingpong reselection
minus Faults with the UE for example the UE fails to respond to the handover or report the inter-RAT measurement report
minus Changes of the best server during the physical channel reallocation
minus Wrong LAC configuration which can be located through data configuration check
ZTE Confidential Proprietary copy 2012 ZTE CORPORATION All rights reserved 45
UMTS KPI Optimization Analysis Guide Internal Use Only
4432 Inter-RAT Handover Optimization Flowchart
Figure 4-14 Inter-RAT handover optimization flowchart
ZTE Confidential Proprietary copy 2012 ZTE CORPORATION All rights reserved 46
UMTS KPI Optimization Analysis Guide Internal Use Only
Extract performance data
TOP Ncell filtering
Analyze a single cell
1 Check NE alarms
2 Associate emergencies
3 Compare parameter
configurations
4 Associate indicators
5 Locate the fault
comprehensive ly
Exist or not
Handle alarms
Solved or not
Yes
Yes
End
No
No
Exist or not
Handle emergencies
Solved or not
Yes
No
No
Exist or not
Correct wrong parameter
configurations
Solved or not
Yes
No
No
List related indicator counters
RTWPResource
limit indicators
Checkamp analysis of interference
Optimization analysis of
resource limitCounters related to inter-RAT handover failures
C301130667 C301130681C301130668 C301130682C301130669 C301130690C301130670 C301130691C301130671 C301130692C301130672 C301130693C301130673 C301130694C301130674 C301130696C301130675 C301130697C301130677 C301130698C301130678 C301130699C301130679 C301130700
C301130680
Solved or not
Yes
Yes
No
Drive Test+RNC signaling
trace
Yes
Counters related to inter-RAT handover
failures
Cell hand-inhand-out indicators
30049 3005030051 3005230053 30054
ZTE Confidential Proprietary copy 2012 ZTE CORPORATION All rights reserved 47
UMTS KPI Optimization Analysis Guide Internal Use Only
45 Optimization of Resource Indicators
The resource indicators directly reflect the system capacity Increasing subscribers will consume more system resources and some resources may be limited for example the code resource may be limited the TCP access request may be rejected and the CE resource usage rate may exceed the threshold Limited system resources have a negative influence on the whole-network indicators and the subscribersrsquo perception for example call drops may frequently happen and more TCP access requests may be rejected during the voice services
Table 4-5 Resource KPIs and Alarm Thresholds
Resource type KPI No and nameAlarm
threshold
TCP
C301320150 Number of rejected services DCH downlink TCP limit
50
PI30167 Average non-HS (SOA) (SOA)DPA TCP 40
PI30092 Maximum Cell TCP () 100
PI30093 Average Cell TCP 70
UL TrafficPI30029 Handover Blocking Rate 05
KPI RTWP (in busy hour) -98 dBm
Code
C301320153 Number of rejected services DCH no code
50
PI30205 Average Cell HSUPA Users 12
PI30172 Cell Average HSDPA Users 16
CE
PI301830006 Maximum use Ratio of Uplink NodeB CE
60
PI301830010 Maximum use Ratio of Downlink NodeB CE
60
ZTE Confidential Proprietary copy 2012 ZTE CORPORATION All rights reserved 48
UMTS KPI Optimization Analysis Guide Internal Use Only
451 Resource Indicator Optimization Flowchart
Figure 4-15 Resource indicator optimization flowchart
ZTE Confidential Proprietary copy 2012 ZTE CORPORATION All rights reserved 49
UMTS KPI Optimization Analysis Guide Internal Use Only
Extract performance data
TOP Ncell filtering
Analyze a single cell
1 Check NE alarms
2 Associate emergencies
3 Compare parameter
configurations
4 Associate indicators
5 Locate the fault
comprehensive ly
Exist or not
Handle alarms
Solved or not
Yes
是
End
No
No
Exist or not
Handle emergencies
Solved or not
Yes
No
No
Exist or not
Correct wrong parameter
configurations
Solved or not
Yes
No
No
List related indicator counters
Code resource indicators
CE resource indicators
TCPadmission
reject counter
C301320150
Solved or not
Yes
Yes
No
Drive Test+RNC signaling
trace
Yes
Counter related to TCP limit
Cell TX power
indicators
30090 3009130092 3009330166 3016730168 3016930170 30171
30163301643016530075
30223302243045030451
Yes
Yes
ZTE Confidential Proprietary copy 2012 ZTE CORPORATION All rights reserved 50
UMTS KPI Optimization Analysis Guide Internal Use Only
452 Code Resource Optimization
The statistics of Number of rejected services and DCH no code the average code resource usage rate and the number of the HSDPA subscribers can be used to judge whether the code resource in a cell is limited If the code resource is limited you can adjust the code resource allocation to alleviate the situation
Based on the system algorithm when Formula 1 is satisfied you can add an HS-PDSCH when Formula 2 is satisfied then an HS-PDSCH is deleted
Formula 1 OcuRateNoHspdsch + OcuRateHspdsch + DpchCodeHy + 32 lt= 512
Formula 2 OcuRateNoHspdsch + OcuRateHspdsch + CodeUptHyA gt 512
OcuRateHspdschHSPDSCH means the number of the codes of SF=512 blocked by the HS-PDSCH OcuRateNoHspdsch means the number of codes of SF=512 blocked by other channels DpchCodeHy means the number of codes of SF=512 reserved for the DPCH and CodeUptHyA is the threshold to decide whether to delete the HSPDSCH
Therefore to ensure the access of the R99 subscribers you can make some adjustment according to Table 4-6 when the code resource is limited though the HSDPA rate may decrease
Table 4-6 Adjusting Code Resource Allocation
AbbreviationParameter
nameRange
and stepCurrent value
Update value
Remark
DpchCodeHy DPCH Code Hysteresis
0512 16 28
To decrease the number of rejected services for DCH no code
CodeUptHyACode Update Hysteresis A
0512 16 28
To decrease the number of rejected services for DCH no code
453 Monitoring CE Resource
The CE resource is mainly monitored through the maximum UE uplinkdownlink usage rate If there is any problem you can solve it by controlling the load or adding more boards
ZTE Confidential Proprietary copy 2012 ZTE CORPORATION All rights reserved 51
UMTS KPI Optimization Analysis Guide Internal Use Only
454 Optimization of Power Control
4541 Monitoring and Optimizing Downlink Power Control
Limited TCP in busy hours will not only increase access failures and call drops in the local cell but also increase soft handover failures and call drops in the neighboring cells Number of rejected services and DCH downlink TCP limit are intuitive KPIs to judge whether TCP is limited Although limited uplink capacity and massive UE moves in the rush hours may also cause call drops the limited TCP is absolutely a key factor
Based on the system algorithm MinHsdpaPower (MinHspaPwrRto) + NoHsPower gtNode B if the safety threshold is used (MinHsdpaPower means the power reserved for HSPA) then it will activate the downlink rate downgrade algorithm flow for the congestion (lower the downlink DCH rate) Although the rate downgrade can ensure access of some subscribers it is an irregular action and will degrade the performance
455 Speeding up Rate Downgrade
Considering that the cells with heavy load reject more access requests you can speed up the rate downgrade during the resource congestion to release the resources as soon as possible and avoid call drops caused by access failures (this method is only applicable to the cells with many PS service users but not those with only CS service users) Table 4-7 is an example of the parameter modification for the rate downgrade
Table 4-7 Example of Parameter Modification for Rate Downgrade
Abbreviation Parameter nameRange and
stepCurrent value
Update value
Remark
UlDnMaxStg Maximum Number of Degraded Uplink Load Steps Every Time
[1 8] 1 2 Downgrade from 384 Kbps to 16 Kbps
DlDnMaxStg Maximum Number of Degraded Downlink Load Steps Every Time
[1 8] 1 3 Downgrade from 384 Kbps to 8 Kbps
456 Monitoring and Optimizing Uplink Capacity
Handover Blocking Rate and RTWP can reflect the uplink capacity of the cell Because interference may also increase RTWP this factor should be distinguished during the RTWP monitoring Another effective indicator is the voice service erl If a cell has over 20 erls in busy hours you should pay special attention to it
ZTE Confidential Proprietary copy 2012 ZTE CORPORATION All rights reserved 52
UMTS KPI Optimization Analysis Guide Internal Use Only
457 Optimization of Uplink Capacity at the Whole Network Level
Case The uplink capacity was limited in a large number of sites after the cutover and the symptoms are a sharp rise of RTWP and a high call drop rate during the rush hours
After the following parameters were modified as shown in Table 4-8 the problem was solved
Table 4-8 Example of Power Control Parameter Modification
AbbreviationParameter
nameRange
Current value
Update value
ULINITSIRUplink Initial SIR target (dB)
UL 34 K136 K signaling UL 122 K AMR
4-5 35
ULMAXSIRMaximum Uplink SIR target (dB)
UL 34 K136 K signaling UL 122 K AMR
15 10
UlSirTargDnStepUplink SIR Target Down Step Size (dB)
UL 34 K136 K signaling UL 122 K AMR
01 02
458 Optimization of Uplink Capacity for a Single Cell
A lot of optimization measures can be taken to bring down the rising RTWP However with increasing subscribers the capacity may still be limited in some area while further modification of SirTarget will obviously degrade the call quality of the whole network and undermine the subscribersrsquo perception In this case you can adjust the power control parameters for a single site that has heavy traffic in the following way add one set of DivPc parameters and use this set of parameters only for this site
Case Table 4-9 shows an example of the power control parameter modification After this modification the call drop rate in the site with heavy traffic decreased to one quarter of the original one
Table 4-9 Example of Power Control Parameter Modification for Heavy-Traffic Cell
SRVTYPE ULINITSIR ULMAXSIR ULMINSIR
0 35-gt15 100-gt35 20-gt10
104 40-gt20 150-gt50 05-gt0
28 35-gt15 100-gt35 05-gt0
50 60-gt20 150-gt50 20-gt0
54 60-gt20 150-gt50 20-gt0
ZTE Confidential Proprietary copy 2012 ZTE CORPORATION All rights reserved 53
UMTS KPI Optimization Analysis Guide Internal Use Only
4321 Analysis Flowchart of RRC Connection Setup Failures
Figure 4-10 Analysis flowchart of RRC connection setup failures
ZTE Confidential Proprietary copy 2012 ZTE CORPORATION All rights reserved 23
UMTS KPI Optimization Analysis Guide Internal Use Only
Extract performance data
TOP Ncell filtering
Analyze a single cell
1 Check NE alarms
2 Associate emergencies
3 Compare parameter
configurations
4 Associate indicators
5 Locate the fault
comprehensive ly
Exist or not
Handle alarms
Solved or not
Yes
Yes
End
No
No
Exist or not
Handle emergencies
Solved or not
Yes
No
No
Exist or not
Correct wrong parameter
configurations
Solved or not
Yes
No
No
List related indicator counters
Counters related to RRC setup
failuresRTWP
Resource limit
indicators
Checkamp analysis of interference
Optimization analysis of
resource limitCounters related
to RRC setup failures
C301480485C301480486C301480487C301480489C301480490C301480491C301481288C301481289C301481337C301481338C301481339C301481407C301481408
Solved or not
Yes
Yes
No
Drive Test+RNC signaling
trace
Yes
ZTE Confidential Proprietary copy 2012 ZTE CORPORATION All rights reserved 24
UMTS KPI Optimization Analysis Guide Internal Use Only
4322 UE sends RRC Connection Request but RNC does not receive it
If the EcIo of downlink CPICH is relatively low it is the problem of coverage
If the EcIo of downlink CPICH is not very low (for example the value is larger than -14 dB) Usually it is the problem of RACH and the following issues may cause the problem
minus The power of Preamble does not rise to a required value and the rising times of Preamble should be increased
minus The output power of UE is lower than the required value which is caused by poor UE performance In this case the UE should be changed
minus The NodeB equipment has a standing wave and the engineer should check whether NodeB has any SWR alarm
minus The radius of the cell is set improperly If the radius parameter of the cell is set too small the NodeB can not synchronize the UE beyond the range of the radius and the access fails This problem often happens in the places with large coverage such as the rural areas and the suburbs
4323 RNC delivers RRC Connection Reject after receiving RRC Setup Request
When RRC Connection Reject appears the engineer should check the specific reject cause value Usually there are two kinds of causes
The CPU load of RNC control plane board is too heavy and more boards should be added
DCH and FACH admission is rejected However this situation does not always happen
4324 UE does not receive RRC Connection Setup delivered by RNC
This problem may be caused by the following reasons
Poor coverage
Improper parameters of cell selection and reselection
Checking method The engineer should check the EcIo of CPICH If the value is lower than -12 dB (EcIo is -12 dB by default) and there is no cell of better quality in the monitor set the cause of this problem is poor coverage If there is better cell in the monitor set cell reselection may cause this problem
Poor coverage can be improved by coverage enhancement such as adding some sites to cover the places without signal coverage and adjusting the engineering parameters If the coverage can not be improved the engineer can enhance the FACH power according to
ZTE Confidential Proprietary copy 2012 ZTE CORPORATION All rights reserved 25
UMTS KPI Optimization Analysis Guide Internal Use Only
the PCPICH EcIo coverage of the current network For example if all the pilot EcIo values are larger than -12 dB in the coverage area the power proportion of the common channel should be configured on the basis of the situation that the EcIo value is larger than -12 dB And so the success rate of the idle UE assessment can be ensured
As for the access problem caused by cell selection and reselection the engineer can speed up the cell selection and reselection by adjusting the cell selection and reselection parameters and the problem of RRC connection setup failure caused by improper cell selection and reselection parameters can be solved
Note
The RRC Connection Setup message is borne by FACH RRC Connection Request sent by the UE is received by UTRAN at the preamble of PRACH and then it is sent from the RACH channel based on the current preamble power And the transmit power of preamble can rise all the time until the response is received (There is a limitation for the maximum number of preamble retransmissions) Therefore in the areas with poor coverage the RACH coverage and FACH coverage may become unbalanced and as a result UTRAN can receive RRC Connection Request sent by the UE but the UE can not receive RRC Connection Setup sent by RNC
4325 UE receives RRC Connection Setup and does not send RRC Setup Complete
If the downlink signal quality is normal this problem may be caused by the abnormal condition of the cell phone
Another reason of this problem may be the downlink synchronization failure caused by the low initial power of downlink dedicated channel You can solve this problem by adjusting the service downlink EbNo
4326 RNC does not receive RRC Setup Complete sent by UE
Because the uplink initial power control may increase the UE transmit power this kind of problem seldom appears If it appears the engineer can increase the Constant Value of the dedicated channel properly to raise the uplink DPCCH initial transmission power of the UE
At the same time this problem is also relevant with the uplink SIR initial target value configuration because this value may affect the uplink initial synchronization at the initial stage of link setup If the value of the parameter is set too large there will be too much uplink inference brought by the initial setup of the link If the value is set too small the uplink synchronization will take longer time and the initial synchronization may even fail This parameter is an RNC-level parameter which has a great influence on network performance Therefore the engineer should be cautious while adjusting this parameter
ZTE Confidential Proprietary copy 2012 ZTE CORPORATION All rights reserved 26
UMTS KPI Optimization Analysis Guide Internal Use Only
Note
RRC Connection Setup Complete is sent through uplink DPCH and the UE calculates the initial power of uplink DPCCH according to the received IErdquoDPCCH_Power_offsetrdquo and the measured CPICH_RSCP value
DPCCH_Initial_power = DPCCH_Power_offset - CPICH_RSCP
DPCCH_Power_offset = Primary CPICH DL TX Power + UL Interference + Constant Value The Constant Value can be configured in the OMC If this value is set too small the UE may not have enough power to send RRC Connection Setup Complete
433 Analysis on RABRB Setup Failures
When RAB or RB setup fails RNC will send RAB Assignment Fail in the RAB Assignment Response signaling The engineer can find out the specific failure reason from the failure cause value carried in relevant cells The reasons for common RABRB setup failures include
RNC directly rejecting RAB Setup Request because of wrong parameter configuration
Admission reject
RAB setup failure because the UE fails to respond to RB Setup Request
RAB setup failure because the Uu interface fails to set up RB
ZTE Confidential Proprietary copy 2012 ZTE CORPORATION All rights reserved 27
UMTS KPI Optimization Analysis Guide Internal Use Only
4331 Analysis Flowchart of RAB Setup Failures
Figure 4-11 Analysis flowchart of RAB setup failures
ZTE Confidential Proprietary copy 2012 ZTE CORPORATION All rights reserved 28
UMTS KPI Optimization Analysis Guide Internal Use Only
Extract performance data
TOP Ncell filtering
Analyze a single cell
1 Check NE alarms
2 Associate emergencies
3 Compare parameter
configurations
4 Associate indicators
5 Locate the fault
comprehensively
Exist or not
Handle alarms
Solved or not
Yes
Yes
End
No
No
Exist or not
Handle emergencies
Solved or not
Yes
No
No
Exist or not
Correct wrong parameter
configurations
Solved or not
Yes
No
No
List related indicator counters
Counters related to RAB setup failures RTWP
Resource limit
indicators
Checkamp analysis of interference
Optimization analysis of
resource limitCounters related to RAB setup failures
CS domain PS domainC301230290 C301230302C301230291 C301230303C301230292 C301230304C301230293 C301230305C301230294 C301230306C301230295 C301230307C301230296 C301230308C301230297 C301230309C301230298 C301230310C301230299 C301230311C301230300 C301230312C301230301 C301230313
Solved or not
Yes
Yes
No
Drive Test+RNC signaling
trace
Yes
ZTE Confidential Proprietary copy 2012 ZTE CORPORATION All rights reserved 29
UMTS KPI Optimization Analysis Guide Internal Use Only
4332 RNC Directly Rejecting RAB Setup Request Because Of Wrong Parameter Configuration
The case that RNC responds with RAB Setup Failure directly is seldom caused by invalid parameter configuration in the business network Usually this case is caused by special operations of the special users
The main scenario is that the subscription information of the userrsquos PS service is beyond the capability of the UE which leads to the direct refusal from RNC For example a special userrsquos subscription rates of uplink and downlink are 384 K but the maximum uplink rate of the UE is only 64 K The maximum uplink and downlink rates of the QoS message used for activating PDP set by the AT command or mobile terminal software used by the user are 384 K so the RNC will find the maximum uplink rate is beyond the UErsquos capability directly reply with RAB Setup Failure and will not launch the RB setup process when it receives RAB Assignment Request
After the RAB setup fails because the parameter configuration is beyond the UErsquos capability SGSN will negotiate again to launch the new RAB assignment until the UE has the capability to support the assignment and the RAB assignment is finished For the users the PDP activation is still successful and the actual maximum rate is the maximum rate the UE can support
However if the minimum guaranteed bit rate required by the QoS setting in the UErsquos PDP activation request is beyond the UErsquos capability though the network negotiates a lower rate to accept the UErsquos PDP activation request the UE will launch the request of deactivating PDP when it finds that the rate negotiated by the network in PDP activation accept request is lower than the minimum guaranteed bit rate and finally the PDP activation can not be completed
4333 Admission Reject
For the non-HSDPA user if there are insufficient system resources (including power channel code lub transmission resource and CE) the call establishment failure will be caused by the admission reject At this time it is necessary to check the network load code resource lub transmission resource and CE resource occupation to make sure the congestion is caused by the limitation of a certain kind of resource What is more the engineer should plan the corresponding expansion method
If the cell does not support the HSDPA service the R99 user admission is judged according to the fixed R99 admission threshold If the cell supports the HSDPA service and the HSDPA and R99 dynamic power is allocated the uplink admission of non-HSDPA is judged based on RTWP or the equivalent user number If the uplink load is too heavy the non-HSDPA user admission will also fail
If the bandwidth configuration on the lub interface is insufficient the lub interface will reject the R99 data service activation because of limited bandwidth
ZTE Confidential Proprietary copy 2012 ZTE CORPORATION All rights reserved 30
UMTS KPI Optimization Analysis Guide Internal Use Only
The admission control of the NodeB Credit resource is similar to the power admission control Whether the remaining Credit can support the currently requested service or not can be judged according to the spectrum spreading factor of the new access user According to the condition of the RAB Downsizing Switch RNC will deal with the issue in the corresponding way
For the HSDPA user in the dynamic power allocation mode besides the mentioned system resources such as the power channel code lub transmission resource and CE the admission reject should take into consideration whether the number of H users supported by NodeB and the number of H users supported by the cell are over the regulated threshold or not into consideration
For the HSDPA user when the bandwidth configuration on lub interface is insufficient the admission reject will not happen but the rate will be reduced What is more the AAL2PATHs of HSDPA and R99 are configured respectively and the HSDPA AAL2PATH must be configured to the HSDPA_RT or HSDPA_NRT type If the HSDPA AAL2PATH is configured to RT or NRT of R99 AAL2PATH type the RAB assignment failure will not happen but RNC will establish the HSDPA service as R99 384 Kbps
For the downlink power admission
Besides whether the R99 service load is over the non-HSDPA service threshold DCH service should take into consideration whether non-HSDPA power and HSDPA GBP (the minimum power needed for the guaranteed bit rate) are over the general power threshold of the cell
For the HSDPA service it is necessary to check whether the throughput rate provided by the cell is over the sum of all the usersrsquo GBR thresholds or whether the GBPs of the stream service and the background service are over the HSDPA power of the cell At the same time whether the non-HSDPA power and the HSDPA GBP (the minimum power needed for the guaranteed bit rate) are over the overall power threshold of the cell should be also taken into consideration
For the lub admission
For the DCH service the admission is made according to the multiplication of the peak rate and the service activation factor
For HSDPA service the admission is made according to the GBR
If the lub exceeds the congestion threshold the DCCC rate reduction will be triggered And if the RLC_AM retransmission rate is over a certain threshold the Iub Overbooking switch can be opened to trigger the TF which limits R99 or to reduce the rate of HSDPA service by a certain factor
ZTE Confidential Proprietary copy 2012 ZTE CORPORATION All rights reserved 31
UMTS KPI Optimization Analysis Guide Internal Use Only
4334 RAB Setup Failure Because the UE Fails to Respond to RB Setup
The UE fails to respond to RB setup mainly because of the userrsquos operation
Take the following cases as examples
When the user already has had the downlink 12 K data service he receives RB Setup Request of the VP service (either the originated call in the VP domain or the terminated call in the VP domain) Because the UE does not support the VP and high-speed PS service in the downlink at the same time it directly replies with RB Setup Failure and the cause value is unsupported configuration
Compared with the WCDMA subscriber originating the VP service the terminating subscriber resides in the GSM network and so it does not support the VP service After RNC receives RAB Assignment Request the core network will deliver the Disconnect command right after call proceeding and the cause value is Bearer capability not authorized At this time the UE has just received the RB SETUP command and has no enough time to finish the RB setup So the UE will reply with RB Setup Failure after it receives the Disconnect command and the RNC will reply with RAB Setup Failure with the cause value being failure in radio interface procedure
4335 RAB Setup Failure Because the Uu Interface Fails to Set Up RB
RNC sends the Radio Bearer Setup command to the UE but fails to receive Radio Bearer Setup Compete This kind of situation (RB setup failure) often appears in the cells with weak signals There are two causes of weak signals one is that the UE does not reside in the best server to launch the access and the other is poor coverage
If the UE does not reside in the best server to launch the access it will hope to enter the best server through active set update in the RB setup process (At the same time the fast signal change will drastically weaken the signals in the cell) but the active set update can only be processed after the RB setup is completed because the procedures can not be processed alternately (Neither the network nor the terminal supports it) Therefore RB can only be set up in the cell with weak signals and the setup is easy to fail As for this situation the starting threshold and speed of co-frequency cell reselection should be increased to make the UE reside in the best server and launch the access as soon as possible
RB setup failure may be caused by the poor downlinkuplink coverage If the failure is caused by downlink coverage the UE can not receive the Radio Bearer Setup command which may be caused by the uplink interference and this can be fixed through checking RTWP The poor downlink coverage is partly caused by the bad UE demodulation performance and other causes should be solved by RF optimization
ZTE Confidential Proprietary copy 2012 ZTE CORPORATION All rights reserved 32
UMTS KPI Optimization Analysis Guide Internal Use Only
44 Optimization of Mobility Indicators
Mobility indicators mainly fall into three categories mdash soft handovers hard handovers and inter-RAT handovers The handover problems usually happen in the following cases
The best server changes too fast or there is no best server due to pilot pollution
The handover is not prompt or there are pingpong handovers due to improper parameter configuration
Adjust the engineering parameters for antennas in areas with severe pilot pollution And adjust the handover parameters such as the values of 1A 1B CIO TTT (time to trigger) Hysteresis and so on to solve the problem that the handover is not prompt or there are pingpong handovers This section tries to solve this kind of problems through OMC data analysis and parameter optimization
441 Optimization of Soft Handovers
Missed neighboring cell configuration pilot pollution improper soft handover parameter configuration and equipment malfunctions are the major causes of soft handover failures To confirm the problems the field DTs are required
ZTE Confidential Proprietary copy 2012 ZTE CORPORATION All rights reserved 33
UMTS KPI Optimization Analysis Guide Internal Use Only
4411 Soft Handover Optimization Flowchart
Figure 4-12 Soft handover optimization flowchart
ZTE Confidential Proprietary copy 2012 ZTE CORPORATION All rights reserved 34
UMTS KPI Optimization Analysis Guide Internal Use Only
Extract performance data
TOP Ncell filtering
Analyze a single cell
1 Check NE alarms
2 Associate emergencies
3 Compare parameter
configurations
4 Associate indicators
5 Locate the fault
comprehensive ly
Exist or not
Handle alarms
Solved or not
Yes
Yes
End
No
No
Exist or not
Handle emergencies
Solved or not
Yes
No
No
Exist or not
Correct wrong parameter
configurations
Solved or not
Yes
No
No
List related indicator counters
RTWPResource
limit indicators
Checkamp analysis of interference
Optimization analysis of
resource limitCounters related to intra-frequency
handover failures
C301391101 C301390593C301391102 C301390594C301391103 C301390595C301390586 C301390596C301390587 C301390597C301390588 C301390598C301390589 C301390599C301390590 C301390600C301390591 C301390601C301390592 C301390602
Solved or not
Yes
Yes
No
Drive Test+RNC signaling
trace
Yes
Counters related to soft handover
failures
30055 3005630057 3005830059 3006030061 30062
Cell hand-inhand-out indicators
ZTE Confidential Proprietary copy 2012 ZTE CORPORATION All rights reserved 35
UMTS KPI Optimization Analysis Guide Internal Use Only
4412 Checking Missed Neighboring Cell Configuration
Generally speaking most of the call drops at the beginning of the optimization are caused by missed neighboring cell configuration The following methods are often used to judge whether the call drops are caused by missed configuration of co-frequency neighboring cells
Observe the active set EcIo information recorded by the UE and the Best Server EcIo information recorded by the Scanner before the call drop If the former record is very bad but the latter record is very good then check whether the Best Server scrambling code recorded by the Scanner appears in the latest list of the neighboring cells under intra-frequency measurement control If it does not then the call drop is caused by missed neighboring cell configuration
If the UE re-accesses immediately after the call drop and the cell scrambling codes during the UE reaccess and those during the call drop are different then the call drop may also be caused by missed neighboring cell configuration You can confirm it through measurement control (look backwards from the message of the call drop event for the latest intra-frequency measurement control message and check the neighboring cell list of this message)
Some UE may report the Detected Set information If the corresponding scrambling code appears in the Detected Set information before the call drop then the call drop is caused by missed neighboring cell configuration
4413 Checking Pilot Pollution
Definition of pilot pollution Excessive strong pilot signals exist at a certain point but none of them is strong enough to be the best server To form pilot pollution the following points in this definition should be satisfied
Strong pilot signal The absolute pilot signal strength is used to judge whether the pilot signal is a strong one The pilot signal strength can be evaluated through the pilot RSCP If the pilot RSCP exceeds a threshold it is considered a strong pilot signal The formula is
AbsoluteRSCPThRSCPCPICH __ gt
Excessive The number of pilot signals is used to judge whether there are excessive pilot signals at a certain point If the number exceeds a threshold it is regarded that excessive pilot signals exist at this point The formula is
NThNumberCPICH gt_
None of them is strong enough to be the best server The relative strength of a pilot signal is a key factor in judging whether the pilot signal is strong enough Based on the above definition and formulae if the difference between the strength of the
ZTE Confidential Proprietary copy 2012 ZTE CORPORATION All rights reserved 36
UMTS KPI Optimization Analysis Guide Internal Use Only
strongest pilot signal and that of the )1( +NTh strongest pilot signal at this point is
less than a threshold it is regarded that there is no pilot signal strong enough to be the best server at this point The formula is
lativeRSCPthThbest ThRSCPCPICHRSCPCPICHN Re_)1( )__( ltminus +
According to the above description it is regarded that pilot pollution exists if the following conditions are both satisfied
The number of pilot signals that meet the condition
AbsoluteRSCPThRSCPCPICH __ gt is more than NTh
lativeRSCPthThbest ThRSCPCPICHRSCPCPICHN Re_)1( )__( ltminus +
For example during the network optimization suppose
dBmTh AbsoluteRSCP 95_ minus= 3=NTh and dBTh lativeRSCP 5Re_ = if the following
conditions are both satisfied then it is regarded that pilot pollution exists
The number of the pilot signals that meet the condition
dBmRSCPCPICH 95_ minusgt is more than 3
dBRSCPCPICHRSCPCPICH thbest 5)__( 4 ltminus
4414 Adjusting Soft Handover Algorithm Parameters
You can solve the following kinds of problems by adjusting handover algorithm parameters
1 The handover is not prompt
From the perspective of the CS service signaling flow the symptom of this problem is that the UE cannot receive Active Set Update (physical channel reallocation in the case of the intra-frequency hard handover) because after the UE reports the measurement report the source cell has a fast reduction in EcIo When the RNC sends Active Set Update the UE has closed the transmitter due to the loss of downlink synchronization Viewed from the UE side it cannot receive Active Set Update In the PS services if the UE cannot receive Active Set Update or TRB resets before the handover the handover will also fail
From the perspective of signals the following phenomena may accompany this problem
ZTE Confidential Proprietary copy 2012 ZTE CORPORATION All rights reserved 37
UMTS KPI Optimization Analysis Guide Internal Use Only
minus Corner effect EcIo of the source cell decreases drastically and EcIo of the target cell increases sharply (very high when it appears)
minus Fast fading EcIo of the source cell decreases quickly for a while and then increases and EcIo of the target cell increases for a short while
2 Pingpong handovers The following phenomena may accompany this problem
The best server changes quickly Two or more cells take turns to be the best server But as the best server none of the cells can last long though they has good RSCPs and EcIos
There is no best server There are multiple cells Their RSCPs are normal and similar to each other But EcIo of every cell is very bad
From the perspective of the signaling flow Event 1A is reported immediately after one cell is deleted Because the UE cannot receive Active Set Update from the RNC the handover fails
4415 Equipment Malfunctions
First check the alarm console to see whether there are abnormal alarms and analyze the message traces at the same time Find out in which step the soft handover fails Check the failure message and contact the local product maintaining engineer to confirm whether the equipment has malfunctions
4416 Solutions
Corresponding adjustments should be taken for the confirmed problems
Handover failures caused by pilot pollution Adjust the engineering parameters of a certain antenna to set this antenna as the best server in this interfered location If the power of one of its sectors is reduced then Io of the pilot pollution area will decrease even if the powers of other pilots are not adjusted EcIo will also increase Thereby the EcIo differences with other scrambling codes in the active set will become larger and pilot pollution will be eliminated Through a lot of research ZTE has proved that the reduction in the pilot transmit power will not change cell capacity greatly If condition allows new base stations can be added to cover this area
Equipment malfunctions Consult the customer service engineers and ask them to help check whether there are alarms and whether the transport layer is abnormal If there are alarms coordinate with the customer service engineers and the engineering personnel to solve the problems
Call drops because the handovers are not prompt
ZTE Confidential Proprietary copy 2012 ZTE CORPORATION All rights reserved 38
UMTS KPI Optimization Analysis Guide Internal Use Only
minus Adjust the antenna to expand the handover zone
minus Configure the Event 1A handover parameters to make the handover easier to happen
minus Increase CIO to make the handover happen earlier in the target cell The sum of CIO and the actually measured value is used for judging the UE events including the UE intra-frequency handover CIO helps shift the cell border in the handover algorithm If CIO is configured with a larger value the handover will be easier to happen and there will be more UE in the soft-handover status but more resources will be occupied If CIO is configured with a smaller value the soft handover will be more difficult to happen and the receiving quality may be impaired A CIO of about 5dB is quite good for eliminating the fast fading and the corner effect but this configuration has some side effects such as the increase of handover proportion
Call drops caused by pingpong handovers Adjust the antenna to form a best server in its coverage zone or set the Event 1B handover parameters (increase the threshold of Event 1B the Event 1B hysteresis or the time to trigger Event 1B) to increase the difficulty in deleting the active set
442 Optimization of Hard Handovers
4421 Classification of Hard handovers
Hard handovers mainly fall into two classifications
Intra-frequency hard handovers The intra-frequency hard handover is triggered only when the intra-frequency softsofter handover cannot be performed and it is applicable to the following circumstances
minus Inter-RNC intra-frequency cell handovers when there is no Iur interface
minus Insufficient Iur interface resources though there is the Iur interface
minus Handovers controlled by the threshold of the PS service rate in the handover cell
The intra-frequency softsofter handovers can not be performed (intra-frequency hard handover should be triggered) in the following scenarios
minus When the intra-frequency handover happens the UE is using the transmit diversity in the active set cell but the target cell does not support the transmit diversity
minus The intra-frequency measurement report does not contain OFF and TM of the
ZTE Confidential Proprietary copy 2012 ZTE CORPORATION All rights reserved 39
UMTS KPI Optimization Analysis Guide Internal Use Only
target cell
minus When the intra-frequency handover happens between RNCs the Iur interface is unavailable
minus The UE performs the multiuser detection in the active set cell but the target cell does not support the multiuser detection
minus The target cell and the original cell belong to different classifications (The cells of R99 R5+R99 and R6+R5+R99 belong to the same classification while the cells of R5 and R6+R5 belong to another classification)
Inter-frequency hard handovers The inter-frequency hard handover means a UE connection is handed over from a cell of a UTRAN frequency to a cell of another frequency Many factors including the radio quality the load and the speed of the moving UE may trigger inter-frequency hard handovers
For example the radio quality triggers the inter-frequency hard handover in the following way
When the quality of the UE radio frequency becomes lower the inter-frequency measurement will be triggered and according to the measurement result the UE connection will be handed over to a better frequency
ZTE Confidential Proprietary copy 2012 ZTE CORPORATION All rights reserved 40
UMTS KPI Optimization Analysis Guide Internal Use Only
4422 Hard Handover Optimization Flowchart
Figure 4-13 Hard handover optimization flowchart
ZTE Confidential Proprietary copy 2012 ZTE CORPORATION All rights reserved 41
UMTS KPI Optimization Analysis Guide Internal Use Only
Extract performance data
TOP Ncell filtering
Analyze a single cell
1 Check NE alarms
2 Associate emergencies
3 Compare parameter
configurations
4 Associate indicators
5 Locate the fault
comprehensive ly
Exist or not
Handle alarms
Solved or not
Yes
Yes
End
No
Exist or not
Handle emergencies
Solved or not
YesNo
Exist or not
Correct wrong parameter
configurations
Solved or not
Yes
No
No
List related indicator counters
RTWPResource
limit indicators
Checkamp analysis of interference
Optimization analysis of
resource limit
Counters related to inter-frequency handover failures
C301110489 C301110516C301110499 C301110517C301110500 C301110518C301110501 C301110519C301110502 C301110520C301110503 C301110521C301110504 C301110522C301110505 C301110523
Solved or not
Yes
Yes
No
Drive Test+RNC signaling
trace
Yes
Counters related to hard handover
failures
30041 3004230043 3004430045 3004630047 30048
Cell hand-inhand-out indicators
NoNo
ZTE Confidential Proprietary copy 2012 ZTE CORPORATION All rights reserved 42
UMTS KPI Optimization Analysis Guide Internal Use Only
4423 Hard Handover Optimization Methods
The optimization flow for the hard handover is similar to that of the soft handover The major differences are in the parameter optimization To optimize intra-frequency hard handovers you can properly reduce the Event 1D hysteresis and the time to trigger Event 1D according to the real radio environment to ensure timely handovers
Inter-frequency coverage is often applied to some special scenarios such as indoor coverage and tested through CQT The method of judging whether there is missed configuration of the inter-frequency neighboring cell is almost the same as that of the co-frequency neighboring cell when a call drop occurs the UE fails to measure or report the inter-frequency neighboring cell after the call drop the UE resides in the inter-frequency neighboring cell again
The common hard handover problems are
1 The handover is not prompt The common symptoms are frequent call drops in the hard handovers when the UE moves
Solutions
Increase the threshold of activating the compressing mode The compressing mode is usually activated before the inter-frequency handover or the inter-RAT handover and it is used to measure the quality of the inter-frequency or inter-RAT cell You can set a threshold of the CPICH RSCP or EcIo to activate the compressing mode And the RSCP is widely used
minus Requirements on setting the threshold of activating the compressing mode Before the cell quality becomes low enough to cause a call drop the signal of the target cell should be measured and reported and the handover should be performed
minus Requirement on setting the threshold of deactivating the compression mode Frequent activationdeactivation of the compression mode should be avoided
Increase CIOs of the inter-frequency cell pair
Reduce the threshold of triggering the target frequency handover under the inter-frequency coverage
2 There are pingpong handovers
Solution Increase the hard handover hysteresis and the time to trigger the event
ZTE Confidential Proprietary copy 2012 ZTE CORPORATION All rights reserved 43
UMTS KPI Optimization Analysis Guide Internal Use Only
443 Optimization of Inter-RAT Handovers
4431 Configuring Basic Inter-RAT Parameters
Most of the inter-RAT handover failures are caused by incomplete parameter configuration The following parameters need special attention
Complete RNC parameter configuration for the GSM neighboring cell The 2G system shall provide the 3G system with the correct radio parameters based on negotiation mdash MCC MNC LAC ID (CI) NCC BCC frequency band indicator (900 or 1800) and BCCH
Table 4-3 Parameters That 2G Shall Provide to 3G
MCC MNC LACIDCI
NCC BCCFrequency
band indicator
BCCH
460 2 202 193 0 0 900 102
Complete GSM BSC parameter configuration for the WCDMA neighboring cell The 3G system shall provide the 2G system with the correct radio parameters based on negotiation mdash MCC MNC LAC RNC ID cell ID (C_ID) downlink frequency scrambling code and RAC
Table 4-4 Parameters That 3G Shall Provide to 2G
MCC MNC LACRNC
IDCell IDC_ID
Downlink frequency
Scrambling code
RAC
460 3 20 18 51 10787 51 20
According to the current strategy of one-way inter-RAT handovers if the parameter configuration is complete one probable cause of the inter-RAT handover failure is that the handover is not prompt The common parameter adjustment is to increase CIO the threshold to activatedeactivate the compressing mode and the threshold to trigger the WCDMA-to-GSM handover at the same time
Call drops during the inter-RAT handovers between WCDMA and GSM may be caused by
minus Inconsistent data configuration at the GSM side and the WCDMA side after GSM modifies the configuration data but does not inform WCDMA
minus Missed configuration of neighboring cells which can be solved by the correct configuration of neighboring cells
minus Too fast signal changes
ZTE Confidential Proprietary copy 2012 ZTE CORPORATION All rights reserved 44
UMTS KPI Optimization Analysis Guide Internal Use Only
minus Pingpong reselection
minus Faults with the UE for example the UE fails to respond to the handover or report the inter-RAT measurement report
minus Changes of the best server during the physical channel reallocation
minus Wrong LAC configuration which can be located through data configuration check
ZTE Confidential Proprietary copy 2012 ZTE CORPORATION All rights reserved 45
UMTS KPI Optimization Analysis Guide Internal Use Only
4432 Inter-RAT Handover Optimization Flowchart
Figure 4-14 Inter-RAT handover optimization flowchart
ZTE Confidential Proprietary copy 2012 ZTE CORPORATION All rights reserved 46
UMTS KPI Optimization Analysis Guide Internal Use Only
Extract performance data
TOP Ncell filtering
Analyze a single cell
1 Check NE alarms
2 Associate emergencies
3 Compare parameter
configurations
4 Associate indicators
5 Locate the fault
comprehensive ly
Exist or not
Handle alarms
Solved or not
Yes
Yes
End
No
No
Exist or not
Handle emergencies
Solved or not
Yes
No
No
Exist or not
Correct wrong parameter
configurations
Solved or not
Yes
No
No
List related indicator counters
RTWPResource
limit indicators
Checkamp analysis of interference
Optimization analysis of
resource limitCounters related to inter-RAT handover failures
C301130667 C301130681C301130668 C301130682C301130669 C301130690C301130670 C301130691C301130671 C301130692C301130672 C301130693C301130673 C301130694C301130674 C301130696C301130675 C301130697C301130677 C301130698C301130678 C301130699C301130679 C301130700
C301130680
Solved or not
Yes
Yes
No
Drive Test+RNC signaling
trace
Yes
Counters related to inter-RAT handover
failures
Cell hand-inhand-out indicators
30049 3005030051 3005230053 30054
ZTE Confidential Proprietary copy 2012 ZTE CORPORATION All rights reserved 47
UMTS KPI Optimization Analysis Guide Internal Use Only
45 Optimization of Resource Indicators
The resource indicators directly reflect the system capacity Increasing subscribers will consume more system resources and some resources may be limited for example the code resource may be limited the TCP access request may be rejected and the CE resource usage rate may exceed the threshold Limited system resources have a negative influence on the whole-network indicators and the subscribersrsquo perception for example call drops may frequently happen and more TCP access requests may be rejected during the voice services
Table 4-5 Resource KPIs and Alarm Thresholds
Resource type KPI No and nameAlarm
threshold
TCP
C301320150 Number of rejected services DCH downlink TCP limit
50
PI30167 Average non-HS (SOA) (SOA)DPA TCP 40
PI30092 Maximum Cell TCP () 100
PI30093 Average Cell TCP 70
UL TrafficPI30029 Handover Blocking Rate 05
KPI RTWP (in busy hour) -98 dBm
Code
C301320153 Number of rejected services DCH no code
50
PI30205 Average Cell HSUPA Users 12
PI30172 Cell Average HSDPA Users 16
CE
PI301830006 Maximum use Ratio of Uplink NodeB CE
60
PI301830010 Maximum use Ratio of Downlink NodeB CE
60
ZTE Confidential Proprietary copy 2012 ZTE CORPORATION All rights reserved 48
UMTS KPI Optimization Analysis Guide Internal Use Only
451 Resource Indicator Optimization Flowchart
Figure 4-15 Resource indicator optimization flowchart
ZTE Confidential Proprietary copy 2012 ZTE CORPORATION All rights reserved 49
UMTS KPI Optimization Analysis Guide Internal Use Only
Extract performance data
TOP Ncell filtering
Analyze a single cell
1 Check NE alarms
2 Associate emergencies
3 Compare parameter
configurations
4 Associate indicators
5 Locate the fault
comprehensive ly
Exist or not
Handle alarms
Solved or not
Yes
是
End
No
No
Exist or not
Handle emergencies
Solved or not
Yes
No
No
Exist or not
Correct wrong parameter
configurations
Solved or not
Yes
No
No
List related indicator counters
Code resource indicators
CE resource indicators
TCPadmission
reject counter
C301320150
Solved or not
Yes
Yes
No
Drive Test+RNC signaling
trace
Yes
Counter related to TCP limit
Cell TX power
indicators
30090 3009130092 3009330166 3016730168 3016930170 30171
30163301643016530075
30223302243045030451
Yes
Yes
ZTE Confidential Proprietary copy 2012 ZTE CORPORATION All rights reserved 50
UMTS KPI Optimization Analysis Guide Internal Use Only
452 Code Resource Optimization
The statistics of Number of rejected services and DCH no code the average code resource usage rate and the number of the HSDPA subscribers can be used to judge whether the code resource in a cell is limited If the code resource is limited you can adjust the code resource allocation to alleviate the situation
Based on the system algorithm when Formula 1 is satisfied you can add an HS-PDSCH when Formula 2 is satisfied then an HS-PDSCH is deleted
Formula 1 OcuRateNoHspdsch + OcuRateHspdsch + DpchCodeHy + 32 lt= 512
Formula 2 OcuRateNoHspdsch + OcuRateHspdsch + CodeUptHyA gt 512
OcuRateHspdschHSPDSCH means the number of the codes of SF=512 blocked by the HS-PDSCH OcuRateNoHspdsch means the number of codes of SF=512 blocked by other channels DpchCodeHy means the number of codes of SF=512 reserved for the DPCH and CodeUptHyA is the threshold to decide whether to delete the HSPDSCH
Therefore to ensure the access of the R99 subscribers you can make some adjustment according to Table 4-6 when the code resource is limited though the HSDPA rate may decrease
Table 4-6 Adjusting Code Resource Allocation
AbbreviationParameter
nameRange
and stepCurrent value
Update value
Remark
DpchCodeHy DPCH Code Hysteresis
0512 16 28
To decrease the number of rejected services for DCH no code
CodeUptHyACode Update Hysteresis A
0512 16 28
To decrease the number of rejected services for DCH no code
453 Monitoring CE Resource
The CE resource is mainly monitored through the maximum UE uplinkdownlink usage rate If there is any problem you can solve it by controlling the load or adding more boards
ZTE Confidential Proprietary copy 2012 ZTE CORPORATION All rights reserved 51
UMTS KPI Optimization Analysis Guide Internal Use Only
454 Optimization of Power Control
4541 Monitoring and Optimizing Downlink Power Control
Limited TCP in busy hours will not only increase access failures and call drops in the local cell but also increase soft handover failures and call drops in the neighboring cells Number of rejected services and DCH downlink TCP limit are intuitive KPIs to judge whether TCP is limited Although limited uplink capacity and massive UE moves in the rush hours may also cause call drops the limited TCP is absolutely a key factor
Based on the system algorithm MinHsdpaPower (MinHspaPwrRto) + NoHsPower gtNode B if the safety threshold is used (MinHsdpaPower means the power reserved for HSPA) then it will activate the downlink rate downgrade algorithm flow for the congestion (lower the downlink DCH rate) Although the rate downgrade can ensure access of some subscribers it is an irregular action and will degrade the performance
455 Speeding up Rate Downgrade
Considering that the cells with heavy load reject more access requests you can speed up the rate downgrade during the resource congestion to release the resources as soon as possible and avoid call drops caused by access failures (this method is only applicable to the cells with many PS service users but not those with only CS service users) Table 4-7 is an example of the parameter modification for the rate downgrade
Table 4-7 Example of Parameter Modification for Rate Downgrade
Abbreviation Parameter nameRange and
stepCurrent value
Update value
Remark
UlDnMaxStg Maximum Number of Degraded Uplink Load Steps Every Time
[1 8] 1 2 Downgrade from 384 Kbps to 16 Kbps
DlDnMaxStg Maximum Number of Degraded Downlink Load Steps Every Time
[1 8] 1 3 Downgrade from 384 Kbps to 8 Kbps
456 Monitoring and Optimizing Uplink Capacity
Handover Blocking Rate and RTWP can reflect the uplink capacity of the cell Because interference may also increase RTWP this factor should be distinguished during the RTWP monitoring Another effective indicator is the voice service erl If a cell has over 20 erls in busy hours you should pay special attention to it
ZTE Confidential Proprietary copy 2012 ZTE CORPORATION All rights reserved 52
UMTS KPI Optimization Analysis Guide Internal Use Only
457 Optimization of Uplink Capacity at the Whole Network Level
Case The uplink capacity was limited in a large number of sites after the cutover and the symptoms are a sharp rise of RTWP and a high call drop rate during the rush hours
After the following parameters were modified as shown in Table 4-8 the problem was solved
Table 4-8 Example of Power Control Parameter Modification
AbbreviationParameter
nameRange
Current value
Update value
ULINITSIRUplink Initial SIR target (dB)
UL 34 K136 K signaling UL 122 K AMR
4-5 35
ULMAXSIRMaximum Uplink SIR target (dB)
UL 34 K136 K signaling UL 122 K AMR
15 10
UlSirTargDnStepUplink SIR Target Down Step Size (dB)
UL 34 K136 K signaling UL 122 K AMR
01 02
458 Optimization of Uplink Capacity for a Single Cell
A lot of optimization measures can be taken to bring down the rising RTWP However with increasing subscribers the capacity may still be limited in some area while further modification of SirTarget will obviously degrade the call quality of the whole network and undermine the subscribersrsquo perception In this case you can adjust the power control parameters for a single site that has heavy traffic in the following way add one set of DivPc parameters and use this set of parameters only for this site
Case Table 4-9 shows an example of the power control parameter modification After this modification the call drop rate in the site with heavy traffic decreased to one quarter of the original one
Table 4-9 Example of Power Control Parameter Modification for Heavy-Traffic Cell
SRVTYPE ULINITSIR ULMAXSIR ULMINSIR
0 35-gt15 100-gt35 20-gt10
104 40-gt20 150-gt50 05-gt0
28 35-gt15 100-gt35 05-gt0
50 60-gt20 150-gt50 20-gt0
54 60-gt20 150-gt50 20-gt0
ZTE Confidential Proprietary copy 2012 ZTE CORPORATION All rights reserved 53
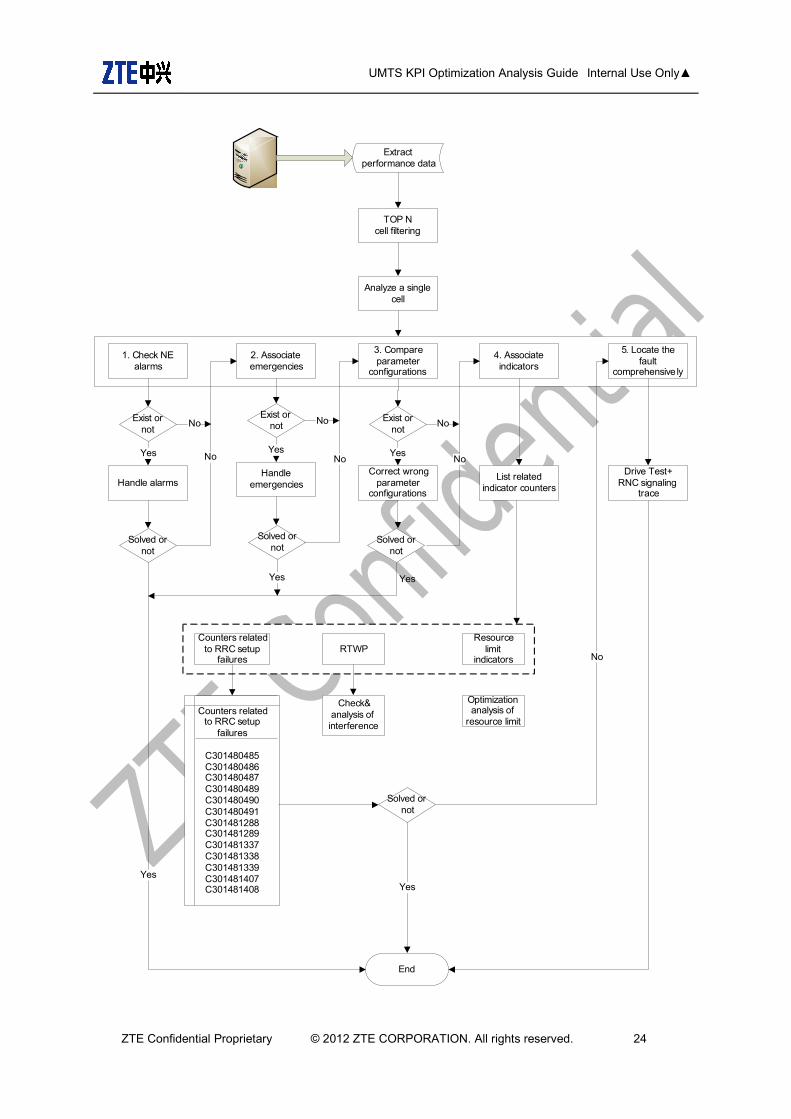
UMTS KPI Optimization Analysis Guide Internal Use Only
Extract performance data
TOP Ncell filtering
Analyze a single cell
1 Check NE alarms
2 Associate emergencies
3 Compare parameter
configurations
4 Associate indicators
5 Locate the fault
comprehensive ly
Exist or not
Handle alarms
Solved or not
Yes
Yes
End
No
No
Exist or not
Handle emergencies
Solved or not
Yes
No
No
Exist or not
Correct wrong parameter
configurations
Solved or not
Yes
No
No
List related indicator counters
Counters related to RRC setup
failuresRTWP
Resource limit
indicators
Checkamp analysis of interference
Optimization analysis of
resource limitCounters related
to RRC setup failures
C301480485C301480486C301480487C301480489C301480490C301480491C301481288C301481289C301481337C301481338C301481339C301481407C301481408
Solved or not
Yes
Yes
No
Drive Test+RNC signaling
trace
Yes
ZTE Confidential Proprietary copy 2012 ZTE CORPORATION All rights reserved 24
UMTS KPI Optimization Analysis Guide Internal Use Only
4322 UE sends RRC Connection Request but RNC does not receive it
If the EcIo of downlink CPICH is relatively low it is the problem of coverage
If the EcIo of downlink CPICH is not very low (for example the value is larger than -14 dB) Usually it is the problem of RACH and the following issues may cause the problem
minus The power of Preamble does not rise to a required value and the rising times of Preamble should be increased
minus The output power of UE is lower than the required value which is caused by poor UE performance In this case the UE should be changed
minus The NodeB equipment has a standing wave and the engineer should check whether NodeB has any SWR alarm
minus The radius of the cell is set improperly If the radius parameter of the cell is set too small the NodeB can not synchronize the UE beyond the range of the radius and the access fails This problem often happens in the places with large coverage such as the rural areas and the suburbs
4323 RNC delivers RRC Connection Reject after receiving RRC Setup Request
When RRC Connection Reject appears the engineer should check the specific reject cause value Usually there are two kinds of causes
The CPU load of RNC control plane board is too heavy and more boards should be added
DCH and FACH admission is rejected However this situation does not always happen
4324 UE does not receive RRC Connection Setup delivered by RNC
This problem may be caused by the following reasons
Poor coverage
Improper parameters of cell selection and reselection
Checking method The engineer should check the EcIo of CPICH If the value is lower than -12 dB (EcIo is -12 dB by default) and there is no cell of better quality in the monitor set the cause of this problem is poor coverage If there is better cell in the monitor set cell reselection may cause this problem
Poor coverage can be improved by coverage enhancement such as adding some sites to cover the places without signal coverage and adjusting the engineering parameters If the coverage can not be improved the engineer can enhance the FACH power according to
ZTE Confidential Proprietary copy 2012 ZTE CORPORATION All rights reserved 25
UMTS KPI Optimization Analysis Guide Internal Use Only
the PCPICH EcIo coverage of the current network For example if all the pilot EcIo values are larger than -12 dB in the coverage area the power proportion of the common channel should be configured on the basis of the situation that the EcIo value is larger than -12 dB And so the success rate of the idle UE assessment can be ensured
As for the access problem caused by cell selection and reselection the engineer can speed up the cell selection and reselection by adjusting the cell selection and reselection parameters and the problem of RRC connection setup failure caused by improper cell selection and reselection parameters can be solved
Note
The RRC Connection Setup message is borne by FACH RRC Connection Request sent by the UE is received by UTRAN at the preamble of PRACH and then it is sent from the RACH channel based on the current preamble power And the transmit power of preamble can rise all the time until the response is received (There is a limitation for the maximum number of preamble retransmissions) Therefore in the areas with poor coverage the RACH coverage and FACH coverage may become unbalanced and as a result UTRAN can receive RRC Connection Request sent by the UE but the UE can not receive RRC Connection Setup sent by RNC
4325 UE receives RRC Connection Setup and does not send RRC Setup Complete
If the downlink signal quality is normal this problem may be caused by the abnormal condition of the cell phone
Another reason of this problem may be the downlink synchronization failure caused by the low initial power of downlink dedicated channel You can solve this problem by adjusting the service downlink EbNo
4326 RNC does not receive RRC Setup Complete sent by UE
Because the uplink initial power control may increase the UE transmit power this kind of problem seldom appears If it appears the engineer can increase the Constant Value of the dedicated channel properly to raise the uplink DPCCH initial transmission power of the UE
At the same time this problem is also relevant with the uplink SIR initial target value configuration because this value may affect the uplink initial synchronization at the initial stage of link setup If the value of the parameter is set too large there will be too much uplink inference brought by the initial setup of the link If the value is set too small the uplink synchronization will take longer time and the initial synchronization may even fail This parameter is an RNC-level parameter which has a great influence on network performance Therefore the engineer should be cautious while adjusting this parameter
ZTE Confidential Proprietary copy 2012 ZTE CORPORATION All rights reserved 26
UMTS KPI Optimization Analysis Guide Internal Use Only
Note
RRC Connection Setup Complete is sent through uplink DPCH and the UE calculates the initial power of uplink DPCCH according to the received IErdquoDPCCH_Power_offsetrdquo and the measured CPICH_RSCP value
DPCCH_Initial_power = DPCCH_Power_offset - CPICH_RSCP
DPCCH_Power_offset = Primary CPICH DL TX Power + UL Interference + Constant Value The Constant Value can be configured in the OMC If this value is set too small the UE may not have enough power to send RRC Connection Setup Complete
433 Analysis on RABRB Setup Failures
When RAB or RB setup fails RNC will send RAB Assignment Fail in the RAB Assignment Response signaling The engineer can find out the specific failure reason from the failure cause value carried in relevant cells The reasons for common RABRB setup failures include
RNC directly rejecting RAB Setup Request because of wrong parameter configuration
Admission reject
RAB setup failure because the UE fails to respond to RB Setup Request
RAB setup failure because the Uu interface fails to set up RB
ZTE Confidential Proprietary copy 2012 ZTE CORPORATION All rights reserved 27
UMTS KPI Optimization Analysis Guide Internal Use Only
4331 Analysis Flowchart of RAB Setup Failures
Figure 4-11 Analysis flowchart of RAB setup failures
ZTE Confidential Proprietary copy 2012 ZTE CORPORATION All rights reserved 28
UMTS KPI Optimization Analysis Guide Internal Use Only
Extract performance data
TOP Ncell filtering
Analyze a single cell
1 Check NE alarms
2 Associate emergencies
3 Compare parameter
configurations
4 Associate indicators
5 Locate the fault
comprehensively
Exist or not
Handle alarms
Solved or not
Yes
Yes
End
No
No
Exist or not
Handle emergencies
Solved or not
Yes
No
No
Exist or not
Correct wrong parameter
configurations
Solved or not
Yes
No
No
List related indicator counters
Counters related to RAB setup failures RTWP
Resource limit
indicators
Checkamp analysis of interference
Optimization analysis of
resource limitCounters related to RAB setup failures
CS domain PS domainC301230290 C301230302C301230291 C301230303C301230292 C301230304C301230293 C301230305C301230294 C301230306C301230295 C301230307C301230296 C301230308C301230297 C301230309C301230298 C301230310C301230299 C301230311C301230300 C301230312C301230301 C301230313
Solved or not
Yes
Yes
No
Drive Test+RNC signaling
trace
Yes
ZTE Confidential Proprietary copy 2012 ZTE CORPORATION All rights reserved 29
UMTS KPI Optimization Analysis Guide Internal Use Only
4332 RNC Directly Rejecting RAB Setup Request Because Of Wrong Parameter Configuration
The case that RNC responds with RAB Setup Failure directly is seldom caused by invalid parameter configuration in the business network Usually this case is caused by special operations of the special users
The main scenario is that the subscription information of the userrsquos PS service is beyond the capability of the UE which leads to the direct refusal from RNC For example a special userrsquos subscription rates of uplink and downlink are 384 K but the maximum uplink rate of the UE is only 64 K The maximum uplink and downlink rates of the QoS message used for activating PDP set by the AT command or mobile terminal software used by the user are 384 K so the RNC will find the maximum uplink rate is beyond the UErsquos capability directly reply with RAB Setup Failure and will not launch the RB setup process when it receives RAB Assignment Request
After the RAB setup fails because the parameter configuration is beyond the UErsquos capability SGSN will negotiate again to launch the new RAB assignment until the UE has the capability to support the assignment and the RAB assignment is finished For the users the PDP activation is still successful and the actual maximum rate is the maximum rate the UE can support
However if the minimum guaranteed bit rate required by the QoS setting in the UErsquos PDP activation request is beyond the UErsquos capability though the network negotiates a lower rate to accept the UErsquos PDP activation request the UE will launch the request of deactivating PDP when it finds that the rate negotiated by the network in PDP activation accept request is lower than the minimum guaranteed bit rate and finally the PDP activation can not be completed
4333 Admission Reject
For the non-HSDPA user if there are insufficient system resources (including power channel code lub transmission resource and CE) the call establishment failure will be caused by the admission reject At this time it is necessary to check the network load code resource lub transmission resource and CE resource occupation to make sure the congestion is caused by the limitation of a certain kind of resource What is more the engineer should plan the corresponding expansion method
If the cell does not support the HSDPA service the R99 user admission is judged according to the fixed R99 admission threshold If the cell supports the HSDPA service and the HSDPA and R99 dynamic power is allocated the uplink admission of non-HSDPA is judged based on RTWP or the equivalent user number If the uplink load is too heavy the non-HSDPA user admission will also fail
If the bandwidth configuration on the lub interface is insufficient the lub interface will reject the R99 data service activation because of limited bandwidth
ZTE Confidential Proprietary copy 2012 ZTE CORPORATION All rights reserved 30
UMTS KPI Optimization Analysis Guide Internal Use Only
The admission control of the NodeB Credit resource is similar to the power admission control Whether the remaining Credit can support the currently requested service or not can be judged according to the spectrum spreading factor of the new access user According to the condition of the RAB Downsizing Switch RNC will deal with the issue in the corresponding way
For the HSDPA user in the dynamic power allocation mode besides the mentioned system resources such as the power channel code lub transmission resource and CE the admission reject should take into consideration whether the number of H users supported by NodeB and the number of H users supported by the cell are over the regulated threshold or not into consideration
For the HSDPA user when the bandwidth configuration on lub interface is insufficient the admission reject will not happen but the rate will be reduced What is more the AAL2PATHs of HSDPA and R99 are configured respectively and the HSDPA AAL2PATH must be configured to the HSDPA_RT or HSDPA_NRT type If the HSDPA AAL2PATH is configured to RT or NRT of R99 AAL2PATH type the RAB assignment failure will not happen but RNC will establish the HSDPA service as R99 384 Kbps
For the downlink power admission
Besides whether the R99 service load is over the non-HSDPA service threshold DCH service should take into consideration whether non-HSDPA power and HSDPA GBP (the minimum power needed for the guaranteed bit rate) are over the general power threshold of the cell
For the HSDPA service it is necessary to check whether the throughput rate provided by the cell is over the sum of all the usersrsquo GBR thresholds or whether the GBPs of the stream service and the background service are over the HSDPA power of the cell At the same time whether the non-HSDPA power and the HSDPA GBP (the minimum power needed for the guaranteed bit rate) are over the overall power threshold of the cell should be also taken into consideration
For the lub admission
For the DCH service the admission is made according to the multiplication of the peak rate and the service activation factor
For HSDPA service the admission is made according to the GBR
If the lub exceeds the congestion threshold the DCCC rate reduction will be triggered And if the RLC_AM retransmission rate is over a certain threshold the Iub Overbooking switch can be opened to trigger the TF which limits R99 or to reduce the rate of HSDPA service by a certain factor
ZTE Confidential Proprietary copy 2012 ZTE CORPORATION All rights reserved 31
UMTS KPI Optimization Analysis Guide Internal Use Only
4334 RAB Setup Failure Because the UE Fails to Respond to RB Setup
The UE fails to respond to RB setup mainly because of the userrsquos operation
Take the following cases as examples
When the user already has had the downlink 12 K data service he receives RB Setup Request of the VP service (either the originated call in the VP domain or the terminated call in the VP domain) Because the UE does not support the VP and high-speed PS service in the downlink at the same time it directly replies with RB Setup Failure and the cause value is unsupported configuration
Compared with the WCDMA subscriber originating the VP service the terminating subscriber resides in the GSM network and so it does not support the VP service After RNC receives RAB Assignment Request the core network will deliver the Disconnect command right after call proceeding and the cause value is Bearer capability not authorized At this time the UE has just received the RB SETUP command and has no enough time to finish the RB setup So the UE will reply with RB Setup Failure after it receives the Disconnect command and the RNC will reply with RAB Setup Failure with the cause value being failure in radio interface procedure
4335 RAB Setup Failure Because the Uu Interface Fails to Set Up RB
RNC sends the Radio Bearer Setup command to the UE but fails to receive Radio Bearer Setup Compete This kind of situation (RB setup failure) often appears in the cells with weak signals There are two causes of weak signals one is that the UE does not reside in the best server to launch the access and the other is poor coverage
If the UE does not reside in the best server to launch the access it will hope to enter the best server through active set update in the RB setup process (At the same time the fast signal change will drastically weaken the signals in the cell) but the active set update can only be processed after the RB setup is completed because the procedures can not be processed alternately (Neither the network nor the terminal supports it) Therefore RB can only be set up in the cell with weak signals and the setup is easy to fail As for this situation the starting threshold and speed of co-frequency cell reselection should be increased to make the UE reside in the best server and launch the access as soon as possible
RB setup failure may be caused by the poor downlinkuplink coverage If the failure is caused by downlink coverage the UE can not receive the Radio Bearer Setup command which may be caused by the uplink interference and this can be fixed through checking RTWP The poor downlink coverage is partly caused by the bad UE demodulation performance and other causes should be solved by RF optimization
ZTE Confidential Proprietary copy 2012 ZTE CORPORATION All rights reserved 32
UMTS KPI Optimization Analysis Guide Internal Use Only
44 Optimization of Mobility Indicators
Mobility indicators mainly fall into three categories mdash soft handovers hard handovers and inter-RAT handovers The handover problems usually happen in the following cases
The best server changes too fast or there is no best server due to pilot pollution
The handover is not prompt or there are pingpong handovers due to improper parameter configuration
Adjust the engineering parameters for antennas in areas with severe pilot pollution And adjust the handover parameters such as the values of 1A 1B CIO TTT (time to trigger) Hysteresis and so on to solve the problem that the handover is not prompt or there are pingpong handovers This section tries to solve this kind of problems through OMC data analysis and parameter optimization
441 Optimization of Soft Handovers
Missed neighboring cell configuration pilot pollution improper soft handover parameter configuration and equipment malfunctions are the major causes of soft handover failures To confirm the problems the field DTs are required
ZTE Confidential Proprietary copy 2012 ZTE CORPORATION All rights reserved 33
UMTS KPI Optimization Analysis Guide Internal Use Only
4411 Soft Handover Optimization Flowchart
Figure 4-12 Soft handover optimization flowchart
ZTE Confidential Proprietary copy 2012 ZTE CORPORATION All rights reserved 34
UMTS KPI Optimization Analysis Guide Internal Use Only
Extract performance data
TOP Ncell filtering
Analyze a single cell
1 Check NE alarms
2 Associate emergencies
3 Compare parameter
configurations
4 Associate indicators
5 Locate the fault
comprehensive ly
Exist or not
Handle alarms
Solved or not
Yes
Yes
End
No
No
Exist or not
Handle emergencies
Solved or not
Yes
No
No
Exist or not
Correct wrong parameter
configurations
Solved or not
Yes
No
No
List related indicator counters
RTWPResource
limit indicators
Checkamp analysis of interference
Optimization analysis of
resource limitCounters related to intra-frequency
handover failures
C301391101 C301390593C301391102 C301390594C301391103 C301390595C301390586 C301390596C301390587 C301390597C301390588 C301390598C301390589 C301390599C301390590 C301390600C301390591 C301390601C301390592 C301390602
Solved or not
Yes
Yes
No
Drive Test+RNC signaling
trace
Yes
Counters related to soft handover
failures
30055 3005630057 3005830059 3006030061 30062
Cell hand-inhand-out indicators
ZTE Confidential Proprietary copy 2012 ZTE CORPORATION All rights reserved 35
UMTS KPI Optimization Analysis Guide Internal Use Only
4412 Checking Missed Neighboring Cell Configuration
Generally speaking most of the call drops at the beginning of the optimization are caused by missed neighboring cell configuration The following methods are often used to judge whether the call drops are caused by missed configuration of co-frequency neighboring cells
Observe the active set EcIo information recorded by the UE and the Best Server EcIo information recorded by the Scanner before the call drop If the former record is very bad but the latter record is very good then check whether the Best Server scrambling code recorded by the Scanner appears in the latest list of the neighboring cells under intra-frequency measurement control If it does not then the call drop is caused by missed neighboring cell configuration
If the UE re-accesses immediately after the call drop and the cell scrambling codes during the UE reaccess and those during the call drop are different then the call drop may also be caused by missed neighboring cell configuration You can confirm it through measurement control (look backwards from the message of the call drop event for the latest intra-frequency measurement control message and check the neighboring cell list of this message)
Some UE may report the Detected Set information If the corresponding scrambling code appears in the Detected Set information before the call drop then the call drop is caused by missed neighboring cell configuration
4413 Checking Pilot Pollution
Definition of pilot pollution Excessive strong pilot signals exist at a certain point but none of them is strong enough to be the best server To form pilot pollution the following points in this definition should be satisfied
Strong pilot signal The absolute pilot signal strength is used to judge whether the pilot signal is a strong one The pilot signal strength can be evaluated through the pilot RSCP If the pilot RSCP exceeds a threshold it is considered a strong pilot signal The formula is
AbsoluteRSCPThRSCPCPICH __ gt
Excessive The number of pilot signals is used to judge whether there are excessive pilot signals at a certain point If the number exceeds a threshold it is regarded that excessive pilot signals exist at this point The formula is
NThNumberCPICH gt_
None of them is strong enough to be the best server The relative strength of a pilot signal is a key factor in judging whether the pilot signal is strong enough Based on the above definition and formulae if the difference between the strength of the
ZTE Confidential Proprietary copy 2012 ZTE CORPORATION All rights reserved 36
UMTS KPI Optimization Analysis Guide Internal Use Only
strongest pilot signal and that of the )1( +NTh strongest pilot signal at this point is
less than a threshold it is regarded that there is no pilot signal strong enough to be the best server at this point The formula is
lativeRSCPthThbest ThRSCPCPICHRSCPCPICHN Re_)1( )__( ltminus +
According to the above description it is regarded that pilot pollution exists if the following conditions are both satisfied
The number of pilot signals that meet the condition
AbsoluteRSCPThRSCPCPICH __ gt is more than NTh
lativeRSCPthThbest ThRSCPCPICHRSCPCPICHN Re_)1( )__( ltminus +
For example during the network optimization suppose
dBmTh AbsoluteRSCP 95_ minus= 3=NTh and dBTh lativeRSCP 5Re_ = if the following
conditions are both satisfied then it is regarded that pilot pollution exists
The number of the pilot signals that meet the condition
dBmRSCPCPICH 95_ minusgt is more than 3
dBRSCPCPICHRSCPCPICH thbest 5)__( 4 ltminus
4414 Adjusting Soft Handover Algorithm Parameters
You can solve the following kinds of problems by adjusting handover algorithm parameters
1 The handover is not prompt
From the perspective of the CS service signaling flow the symptom of this problem is that the UE cannot receive Active Set Update (physical channel reallocation in the case of the intra-frequency hard handover) because after the UE reports the measurement report the source cell has a fast reduction in EcIo When the RNC sends Active Set Update the UE has closed the transmitter due to the loss of downlink synchronization Viewed from the UE side it cannot receive Active Set Update In the PS services if the UE cannot receive Active Set Update or TRB resets before the handover the handover will also fail
From the perspective of signals the following phenomena may accompany this problem
ZTE Confidential Proprietary copy 2012 ZTE CORPORATION All rights reserved 37
UMTS KPI Optimization Analysis Guide Internal Use Only
minus Corner effect EcIo of the source cell decreases drastically and EcIo of the target cell increases sharply (very high when it appears)
minus Fast fading EcIo of the source cell decreases quickly for a while and then increases and EcIo of the target cell increases for a short while
2 Pingpong handovers The following phenomena may accompany this problem
The best server changes quickly Two or more cells take turns to be the best server But as the best server none of the cells can last long though they has good RSCPs and EcIos
There is no best server There are multiple cells Their RSCPs are normal and similar to each other But EcIo of every cell is very bad
From the perspective of the signaling flow Event 1A is reported immediately after one cell is deleted Because the UE cannot receive Active Set Update from the RNC the handover fails
4415 Equipment Malfunctions
First check the alarm console to see whether there are abnormal alarms and analyze the message traces at the same time Find out in which step the soft handover fails Check the failure message and contact the local product maintaining engineer to confirm whether the equipment has malfunctions
4416 Solutions
Corresponding adjustments should be taken for the confirmed problems
Handover failures caused by pilot pollution Adjust the engineering parameters of a certain antenna to set this antenna as the best server in this interfered location If the power of one of its sectors is reduced then Io of the pilot pollution area will decrease even if the powers of other pilots are not adjusted EcIo will also increase Thereby the EcIo differences with other scrambling codes in the active set will become larger and pilot pollution will be eliminated Through a lot of research ZTE has proved that the reduction in the pilot transmit power will not change cell capacity greatly If condition allows new base stations can be added to cover this area
Equipment malfunctions Consult the customer service engineers and ask them to help check whether there are alarms and whether the transport layer is abnormal If there are alarms coordinate with the customer service engineers and the engineering personnel to solve the problems
Call drops because the handovers are not prompt
ZTE Confidential Proprietary copy 2012 ZTE CORPORATION All rights reserved 38
UMTS KPI Optimization Analysis Guide Internal Use Only
minus Adjust the antenna to expand the handover zone
minus Configure the Event 1A handover parameters to make the handover easier to happen
minus Increase CIO to make the handover happen earlier in the target cell The sum of CIO and the actually measured value is used for judging the UE events including the UE intra-frequency handover CIO helps shift the cell border in the handover algorithm If CIO is configured with a larger value the handover will be easier to happen and there will be more UE in the soft-handover status but more resources will be occupied If CIO is configured with a smaller value the soft handover will be more difficult to happen and the receiving quality may be impaired A CIO of about 5dB is quite good for eliminating the fast fading and the corner effect but this configuration has some side effects such as the increase of handover proportion
Call drops caused by pingpong handovers Adjust the antenna to form a best server in its coverage zone or set the Event 1B handover parameters (increase the threshold of Event 1B the Event 1B hysteresis or the time to trigger Event 1B) to increase the difficulty in deleting the active set
442 Optimization of Hard Handovers
4421 Classification of Hard handovers
Hard handovers mainly fall into two classifications
Intra-frequency hard handovers The intra-frequency hard handover is triggered only when the intra-frequency softsofter handover cannot be performed and it is applicable to the following circumstances
minus Inter-RNC intra-frequency cell handovers when there is no Iur interface
minus Insufficient Iur interface resources though there is the Iur interface
minus Handovers controlled by the threshold of the PS service rate in the handover cell
The intra-frequency softsofter handovers can not be performed (intra-frequency hard handover should be triggered) in the following scenarios
minus When the intra-frequency handover happens the UE is using the transmit diversity in the active set cell but the target cell does not support the transmit diversity
minus The intra-frequency measurement report does not contain OFF and TM of the
ZTE Confidential Proprietary copy 2012 ZTE CORPORATION All rights reserved 39
UMTS KPI Optimization Analysis Guide Internal Use Only
target cell
minus When the intra-frequency handover happens between RNCs the Iur interface is unavailable
minus The UE performs the multiuser detection in the active set cell but the target cell does not support the multiuser detection
minus The target cell and the original cell belong to different classifications (The cells of R99 R5+R99 and R6+R5+R99 belong to the same classification while the cells of R5 and R6+R5 belong to another classification)
Inter-frequency hard handovers The inter-frequency hard handover means a UE connection is handed over from a cell of a UTRAN frequency to a cell of another frequency Many factors including the radio quality the load and the speed of the moving UE may trigger inter-frequency hard handovers
For example the radio quality triggers the inter-frequency hard handover in the following way
When the quality of the UE radio frequency becomes lower the inter-frequency measurement will be triggered and according to the measurement result the UE connection will be handed over to a better frequency
ZTE Confidential Proprietary copy 2012 ZTE CORPORATION All rights reserved 40
UMTS KPI Optimization Analysis Guide Internal Use Only
4422 Hard Handover Optimization Flowchart
Figure 4-13 Hard handover optimization flowchart
ZTE Confidential Proprietary copy 2012 ZTE CORPORATION All rights reserved 41
UMTS KPI Optimization Analysis Guide Internal Use Only
Extract performance data
TOP Ncell filtering
Analyze a single cell
1 Check NE alarms
2 Associate emergencies
3 Compare parameter
configurations
4 Associate indicators
5 Locate the fault
comprehensive ly
Exist or not
Handle alarms
Solved or not
Yes
Yes
End
No
Exist or not
Handle emergencies
Solved or not
YesNo
Exist or not
Correct wrong parameter
configurations
Solved or not
Yes
No
No
List related indicator counters
RTWPResource
limit indicators
Checkamp analysis of interference
Optimization analysis of
resource limit
Counters related to inter-frequency handover failures
C301110489 C301110516C301110499 C301110517C301110500 C301110518C301110501 C301110519C301110502 C301110520C301110503 C301110521C301110504 C301110522C301110505 C301110523
Solved or not
Yes
Yes
No
Drive Test+RNC signaling
trace
Yes
Counters related to hard handover
failures
30041 3004230043 3004430045 3004630047 30048
Cell hand-inhand-out indicators
NoNo
ZTE Confidential Proprietary copy 2012 ZTE CORPORATION All rights reserved 42
UMTS KPI Optimization Analysis Guide Internal Use Only
4423 Hard Handover Optimization Methods
The optimization flow for the hard handover is similar to that of the soft handover The major differences are in the parameter optimization To optimize intra-frequency hard handovers you can properly reduce the Event 1D hysteresis and the time to trigger Event 1D according to the real radio environment to ensure timely handovers
Inter-frequency coverage is often applied to some special scenarios such as indoor coverage and tested through CQT The method of judging whether there is missed configuration of the inter-frequency neighboring cell is almost the same as that of the co-frequency neighboring cell when a call drop occurs the UE fails to measure or report the inter-frequency neighboring cell after the call drop the UE resides in the inter-frequency neighboring cell again
The common hard handover problems are
1 The handover is not prompt The common symptoms are frequent call drops in the hard handovers when the UE moves
Solutions
Increase the threshold of activating the compressing mode The compressing mode is usually activated before the inter-frequency handover or the inter-RAT handover and it is used to measure the quality of the inter-frequency or inter-RAT cell You can set a threshold of the CPICH RSCP or EcIo to activate the compressing mode And the RSCP is widely used
minus Requirements on setting the threshold of activating the compressing mode Before the cell quality becomes low enough to cause a call drop the signal of the target cell should be measured and reported and the handover should be performed
minus Requirement on setting the threshold of deactivating the compression mode Frequent activationdeactivation of the compression mode should be avoided
Increase CIOs of the inter-frequency cell pair
Reduce the threshold of triggering the target frequency handover under the inter-frequency coverage
2 There are pingpong handovers
Solution Increase the hard handover hysteresis and the time to trigger the event
ZTE Confidential Proprietary copy 2012 ZTE CORPORATION All rights reserved 43
UMTS KPI Optimization Analysis Guide Internal Use Only
443 Optimization of Inter-RAT Handovers
4431 Configuring Basic Inter-RAT Parameters
Most of the inter-RAT handover failures are caused by incomplete parameter configuration The following parameters need special attention
Complete RNC parameter configuration for the GSM neighboring cell The 2G system shall provide the 3G system with the correct radio parameters based on negotiation mdash MCC MNC LAC ID (CI) NCC BCC frequency band indicator (900 or 1800) and BCCH
Table 4-3 Parameters That 2G Shall Provide to 3G
MCC MNC LACIDCI
NCC BCCFrequency
band indicator
BCCH
460 2 202 193 0 0 900 102
Complete GSM BSC parameter configuration for the WCDMA neighboring cell The 3G system shall provide the 2G system with the correct radio parameters based on negotiation mdash MCC MNC LAC RNC ID cell ID (C_ID) downlink frequency scrambling code and RAC
Table 4-4 Parameters That 3G Shall Provide to 2G
MCC MNC LACRNC
IDCell IDC_ID
Downlink frequency
Scrambling code
RAC
460 3 20 18 51 10787 51 20
According to the current strategy of one-way inter-RAT handovers if the parameter configuration is complete one probable cause of the inter-RAT handover failure is that the handover is not prompt The common parameter adjustment is to increase CIO the threshold to activatedeactivate the compressing mode and the threshold to trigger the WCDMA-to-GSM handover at the same time
Call drops during the inter-RAT handovers between WCDMA and GSM may be caused by
minus Inconsistent data configuration at the GSM side and the WCDMA side after GSM modifies the configuration data but does not inform WCDMA
minus Missed configuration of neighboring cells which can be solved by the correct configuration of neighboring cells
minus Too fast signal changes
ZTE Confidential Proprietary copy 2012 ZTE CORPORATION All rights reserved 44
UMTS KPI Optimization Analysis Guide Internal Use Only
minus Pingpong reselection
minus Faults with the UE for example the UE fails to respond to the handover or report the inter-RAT measurement report
minus Changes of the best server during the physical channel reallocation
minus Wrong LAC configuration which can be located through data configuration check
ZTE Confidential Proprietary copy 2012 ZTE CORPORATION All rights reserved 45
UMTS KPI Optimization Analysis Guide Internal Use Only
4432 Inter-RAT Handover Optimization Flowchart
Figure 4-14 Inter-RAT handover optimization flowchart
ZTE Confidential Proprietary copy 2012 ZTE CORPORATION All rights reserved 46
UMTS KPI Optimization Analysis Guide Internal Use Only
Extract performance data
TOP Ncell filtering
Analyze a single cell
1 Check NE alarms
2 Associate emergencies
3 Compare parameter
configurations
4 Associate indicators
5 Locate the fault
comprehensive ly
Exist or not
Handle alarms
Solved or not
Yes
Yes
End
No
No
Exist or not
Handle emergencies
Solved or not
Yes
No
No
Exist or not
Correct wrong parameter
configurations
Solved or not
Yes
No
No
List related indicator counters
RTWPResource
limit indicators
Checkamp analysis of interference
Optimization analysis of
resource limitCounters related to inter-RAT handover failures
C301130667 C301130681C301130668 C301130682C301130669 C301130690C301130670 C301130691C301130671 C301130692C301130672 C301130693C301130673 C301130694C301130674 C301130696C301130675 C301130697C301130677 C301130698C301130678 C301130699C301130679 C301130700
C301130680
Solved or not
Yes
Yes
No
Drive Test+RNC signaling
trace
Yes
Counters related to inter-RAT handover
failures
Cell hand-inhand-out indicators
30049 3005030051 3005230053 30054
ZTE Confidential Proprietary copy 2012 ZTE CORPORATION All rights reserved 47
UMTS KPI Optimization Analysis Guide Internal Use Only
45 Optimization of Resource Indicators
The resource indicators directly reflect the system capacity Increasing subscribers will consume more system resources and some resources may be limited for example the code resource may be limited the TCP access request may be rejected and the CE resource usage rate may exceed the threshold Limited system resources have a negative influence on the whole-network indicators and the subscribersrsquo perception for example call drops may frequently happen and more TCP access requests may be rejected during the voice services
Table 4-5 Resource KPIs and Alarm Thresholds
Resource type KPI No and nameAlarm
threshold
TCP
C301320150 Number of rejected services DCH downlink TCP limit
50
PI30167 Average non-HS (SOA) (SOA)DPA TCP 40
PI30092 Maximum Cell TCP () 100
PI30093 Average Cell TCP 70
UL TrafficPI30029 Handover Blocking Rate 05
KPI RTWP (in busy hour) -98 dBm
Code
C301320153 Number of rejected services DCH no code
50
PI30205 Average Cell HSUPA Users 12
PI30172 Cell Average HSDPA Users 16
CE
PI301830006 Maximum use Ratio of Uplink NodeB CE
60
PI301830010 Maximum use Ratio of Downlink NodeB CE
60
ZTE Confidential Proprietary copy 2012 ZTE CORPORATION All rights reserved 48
UMTS KPI Optimization Analysis Guide Internal Use Only
451 Resource Indicator Optimization Flowchart
Figure 4-15 Resource indicator optimization flowchart
ZTE Confidential Proprietary copy 2012 ZTE CORPORATION All rights reserved 49
UMTS KPI Optimization Analysis Guide Internal Use Only
Extract performance data
TOP Ncell filtering
Analyze a single cell
1 Check NE alarms
2 Associate emergencies
3 Compare parameter
configurations
4 Associate indicators
5 Locate the fault
comprehensive ly
Exist or not
Handle alarms
Solved or not
Yes
是
End
No
No
Exist or not
Handle emergencies
Solved or not
Yes
No
No
Exist or not
Correct wrong parameter
configurations
Solved or not
Yes
No
No
List related indicator counters
Code resource indicators
CE resource indicators
TCPadmission
reject counter
C301320150
Solved or not
Yes
Yes
No
Drive Test+RNC signaling
trace
Yes
Counter related to TCP limit
Cell TX power
indicators
30090 3009130092 3009330166 3016730168 3016930170 30171
30163301643016530075
30223302243045030451
Yes
Yes
ZTE Confidential Proprietary copy 2012 ZTE CORPORATION All rights reserved 50
UMTS KPI Optimization Analysis Guide Internal Use Only
452 Code Resource Optimization
The statistics of Number of rejected services and DCH no code the average code resource usage rate and the number of the HSDPA subscribers can be used to judge whether the code resource in a cell is limited If the code resource is limited you can adjust the code resource allocation to alleviate the situation
Based on the system algorithm when Formula 1 is satisfied you can add an HS-PDSCH when Formula 2 is satisfied then an HS-PDSCH is deleted
Formula 1 OcuRateNoHspdsch + OcuRateHspdsch + DpchCodeHy + 32 lt= 512
Formula 2 OcuRateNoHspdsch + OcuRateHspdsch + CodeUptHyA gt 512
OcuRateHspdschHSPDSCH means the number of the codes of SF=512 blocked by the HS-PDSCH OcuRateNoHspdsch means the number of codes of SF=512 blocked by other channels DpchCodeHy means the number of codes of SF=512 reserved for the DPCH and CodeUptHyA is the threshold to decide whether to delete the HSPDSCH
Therefore to ensure the access of the R99 subscribers you can make some adjustment according to Table 4-6 when the code resource is limited though the HSDPA rate may decrease
Table 4-6 Adjusting Code Resource Allocation
AbbreviationParameter
nameRange
and stepCurrent value
Update value
Remark
DpchCodeHy DPCH Code Hysteresis
0512 16 28
To decrease the number of rejected services for DCH no code
CodeUptHyACode Update Hysteresis A
0512 16 28
To decrease the number of rejected services for DCH no code
453 Monitoring CE Resource
The CE resource is mainly monitored through the maximum UE uplinkdownlink usage rate If there is any problem you can solve it by controlling the load or adding more boards
ZTE Confidential Proprietary copy 2012 ZTE CORPORATION All rights reserved 51
UMTS KPI Optimization Analysis Guide Internal Use Only
454 Optimization of Power Control
4541 Monitoring and Optimizing Downlink Power Control
Limited TCP in busy hours will not only increase access failures and call drops in the local cell but also increase soft handover failures and call drops in the neighboring cells Number of rejected services and DCH downlink TCP limit are intuitive KPIs to judge whether TCP is limited Although limited uplink capacity and massive UE moves in the rush hours may also cause call drops the limited TCP is absolutely a key factor
Based on the system algorithm MinHsdpaPower (MinHspaPwrRto) + NoHsPower gtNode B if the safety threshold is used (MinHsdpaPower means the power reserved for HSPA) then it will activate the downlink rate downgrade algorithm flow for the congestion (lower the downlink DCH rate) Although the rate downgrade can ensure access of some subscribers it is an irregular action and will degrade the performance
455 Speeding up Rate Downgrade
Considering that the cells with heavy load reject more access requests you can speed up the rate downgrade during the resource congestion to release the resources as soon as possible and avoid call drops caused by access failures (this method is only applicable to the cells with many PS service users but not those with only CS service users) Table 4-7 is an example of the parameter modification for the rate downgrade
Table 4-7 Example of Parameter Modification for Rate Downgrade
Abbreviation Parameter nameRange and
stepCurrent value
Update value
Remark
UlDnMaxStg Maximum Number of Degraded Uplink Load Steps Every Time
[1 8] 1 2 Downgrade from 384 Kbps to 16 Kbps
DlDnMaxStg Maximum Number of Degraded Downlink Load Steps Every Time
[1 8] 1 3 Downgrade from 384 Kbps to 8 Kbps
456 Monitoring and Optimizing Uplink Capacity
Handover Blocking Rate and RTWP can reflect the uplink capacity of the cell Because interference may also increase RTWP this factor should be distinguished during the RTWP monitoring Another effective indicator is the voice service erl If a cell has over 20 erls in busy hours you should pay special attention to it
ZTE Confidential Proprietary copy 2012 ZTE CORPORATION All rights reserved 52
UMTS KPI Optimization Analysis Guide Internal Use Only
457 Optimization of Uplink Capacity at the Whole Network Level
Case The uplink capacity was limited in a large number of sites after the cutover and the symptoms are a sharp rise of RTWP and a high call drop rate during the rush hours
After the following parameters were modified as shown in Table 4-8 the problem was solved
Table 4-8 Example of Power Control Parameter Modification
AbbreviationParameter
nameRange
Current value
Update value
ULINITSIRUplink Initial SIR target (dB)
UL 34 K136 K signaling UL 122 K AMR
4-5 35
ULMAXSIRMaximum Uplink SIR target (dB)
UL 34 K136 K signaling UL 122 K AMR
15 10
UlSirTargDnStepUplink SIR Target Down Step Size (dB)
UL 34 K136 K signaling UL 122 K AMR
01 02
458 Optimization of Uplink Capacity for a Single Cell
A lot of optimization measures can be taken to bring down the rising RTWP However with increasing subscribers the capacity may still be limited in some area while further modification of SirTarget will obviously degrade the call quality of the whole network and undermine the subscribersrsquo perception In this case you can adjust the power control parameters for a single site that has heavy traffic in the following way add one set of DivPc parameters and use this set of parameters only for this site
Case Table 4-9 shows an example of the power control parameter modification After this modification the call drop rate in the site with heavy traffic decreased to one quarter of the original one
Table 4-9 Example of Power Control Parameter Modification for Heavy-Traffic Cell
SRVTYPE ULINITSIR ULMAXSIR ULMINSIR
0 35-gt15 100-gt35 20-gt10
104 40-gt20 150-gt50 05-gt0
28 35-gt15 100-gt35 05-gt0
50 60-gt20 150-gt50 20-gt0
54 60-gt20 150-gt50 20-gt0
ZTE Confidential Proprietary copy 2012 ZTE CORPORATION All rights reserved 53
UMTS KPI Optimization Analysis Guide Internal Use Only
4331 Analysis Flowchart of RAB Setup Failures
Figure 4-11 Analysis flowchart of RAB setup failures
ZTE Confidential Proprietary copy 2012 ZTE CORPORATION All rights reserved 28
UMTS KPI Optimization Analysis Guide Internal Use Only
Extract performance data
TOP Ncell filtering
Analyze a single cell
1 Check NE alarms
2 Associate emergencies
3 Compare parameter
configurations
4 Associate indicators
5 Locate the fault
comprehensively
Exist or not
Handle alarms
Solved or not
Yes
Yes
End
No
No
Exist or not
Handle emergencies
Solved or not
Yes
No
No
Exist or not
Correct wrong parameter
configurations
Solved or not
Yes
No
No
List related indicator counters
Counters related to RAB setup failures RTWP
Resource limit
indicators
Checkamp analysis of interference
Optimization analysis of
resource limitCounters related to RAB setup failures
CS domain PS domainC301230290 C301230302C301230291 C301230303C301230292 C301230304C301230293 C301230305C301230294 C301230306C301230295 C301230307C301230296 C301230308C301230297 C301230309C301230298 C301230310C301230299 C301230311C301230300 C301230312C301230301 C301230313
Solved or not
Yes
Yes
No
Drive Test+RNC signaling
trace
Yes
ZTE Confidential Proprietary copy 2012 ZTE CORPORATION All rights reserved 29
UMTS KPI Optimization Analysis Guide Internal Use Only
4332 RNC Directly Rejecting RAB Setup Request Because Of Wrong Parameter Configuration
The case that RNC responds with RAB Setup Failure directly is seldom caused by invalid parameter configuration in the business network Usually this case is caused by special operations of the special users
The main scenario is that the subscription information of the userrsquos PS service is beyond the capability of the UE which leads to the direct refusal from RNC For example a special userrsquos subscription rates of uplink and downlink are 384 K but the maximum uplink rate of the UE is only 64 K The maximum uplink and downlink rates of the QoS message used for activating PDP set by the AT command or mobile terminal software used by the user are 384 K so the RNC will find the maximum uplink rate is beyond the UErsquos capability directly reply with RAB Setup Failure and will not launch the RB setup process when it receives RAB Assignment Request
After the RAB setup fails because the parameter configuration is beyond the UErsquos capability SGSN will negotiate again to launch the new RAB assignment until the UE has the capability to support the assignment and the RAB assignment is finished For the users the PDP activation is still successful and the actual maximum rate is the maximum rate the UE can support
However if the minimum guaranteed bit rate required by the QoS setting in the UErsquos PDP activation request is beyond the UErsquos capability though the network negotiates a lower rate to accept the UErsquos PDP activation request the UE will launch the request of deactivating PDP when it finds that the rate negotiated by the network in PDP activation accept request is lower than the minimum guaranteed bit rate and finally the PDP activation can not be completed
4333 Admission Reject
For the non-HSDPA user if there are insufficient system resources (including power channel code lub transmission resource and CE) the call establishment failure will be caused by the admission reject At this time it is necessary to check the network load code resource lub transmission resource and CE resource occupation to make sure the congestion is caused by the limitation of a certain kind of resource What is more the engineer should plan the corresponding expansion method
If the cell does not support the HSDPA service the R99 user admission is judged according to the fixed R99 admission threshold If the cell supports the HSDPA service and the HSDPA and R99 dynamic power is allocated the uplink admission of non-HSDPA is judged based on RTWP or the equivalent user number If the uplink load is too heavy the non-HSDPA user admission will also fail
If the bandwidth configuration on the lub interface is insufficient the lub interface will reject the R99 data service activation because of limited bandwidth
ZTE Confidential Proprietary copy 2012 ZTE CORPORATION All rights reserved 30
UMTS KPI Optimization Analysis Guide Internal Use Only
The admission control of the NodeB Credit resource is similar to the power admission control Whether the remaining Credit can support the currently requested service or not can be judged according to the spectrum spreading factor of the new access user According to the condition of the RAB Downsizing Switch RNC will deal with the issue in the corresponding way
For the HSDPA user in the dynamic power allocation mode besides the mentioned system resources such as the power channel code lub transmission resource and CE the admission reject should take into consideration whether the number of H users supported by NodeB and the number of H users supported by the cell are over the regulated threshold or not into consideration
For the HSDPA user when the bandwidth configuration on lub interface is insufficient the admission reject will not happen but the rate will be reduced What is more the AAL2PATHs of HSDPA and R99 are configured respectively and the HSDPA AAL2PATH must be configured to the HSDPA_RT or HSDPA_NRT type If the HSDPA AAL2PATH is configured to RT or NRT of R99 AAL2PATH type the RAB assignment failure will not happen but RNC will establish the HSDPA service as R99 384 Kbps
For the downlink power admission
Besides whether the R99 service load is over the non-HSDPA service threshold DCH service should take into consideration whether non-HSDPA power and HSDPA GBP (the minimum power needed for the guaranteed bit rate) are over the general power threshold of the cell
For the HSDPA service it is necessary to check whether the throughput rate provided by the cell is over the sum of all the usersrsquo GBR thresholds or whether the GBPs of the stream service and the background service are over the HSDPA power of the cell At the same time whether the non-HSDPA power and the HSDPA GBP (the minimum power needed for the guaranteed bit rate) are over the overall power threshold of the cell should be also taken into consideration
For the lub admission
For the DCH service the admission is made according to the multiplication of the peak rate and the service activation factor
For HSDPA service the admission is made according to the GBR
If the lub exceeds the congestion threshold the DCCC rate reduction will be triggered And if the RLC_AM retransmission rate is over a certain threshold the Iub Overbooking switch can be opened to trigger the TF which limits R99 or to reduce the rate of HSDPA service by a certain factor
ZTE Confidential Proprietary copy 2012 ZTE CORPORATION All rights reserved 31
UMTS KPI Optimization Analysis Guide Internal Use Only
4334 RAB Setup Failure Because the UE Fails to Respond to RB Setup
The UE fails to respond to RB setup mainly because of the userrsquos operation
Take the following cases as examples
When the user already has had the downlink 12 K data service he receives RB Setup Request of the VP service (either the originated call in the VP domain or the terminated call in the VP domain) Because the UE does not support the VP and high-speed PS service in the downlink at the same time it directly replies with RB Setup Failure and the cause value is unsupported configuration
Compared with the WCDMA subscriber originating the VP service the terminating subscriber resides in the GSM network and so it does not support the VP service After RNC receives RAB Assignment Request the core network will deliver the Disconnect command right after call proceeding and the cause value is Bearer capability not authorized At this time the UE has just received the RB SETUP command and has no enough time to finish the RB setup So the UE will reply with RB Setup Failure after it receives the Disconnect command and the RNC will reply with RAB Setup Failure with the cause value being failure in radio interface procedure
4335 RAB Setup Failure Because the Uu Interface Fails to Set Up RB
RNC sends the Radio Bearer Setup command to the UE but fails to receive Radio Bearer Setup Compete This kind of situation (RB setup failure) often appears in the cells with weak signals There are two causes of weak signals one is that the UE does not reside in the best server to launch the access and the other is poor coverage
If the UE does not reside in the best server to launch the access it will hope to enter the best server through active set update in the RB setup process (At the same time the fast signal change will drastically weaken the signals in the cell) but the active set update can only be processed after the RB setup is completed because the procedures can not be processed alternately (Neither the network nor the terminal supports it) Therefore RB can only be set up in the cell with weak signals and the setup is easy to fail As for this situation the starting threshold and speed of co-frequency cell reselection should be increased to make the UE reside in the best server and launch the access as soon as possible
RB setup failure may be caused by the poor downlinkuplink coverage If the failure is caused by downlink coverage the UE can not receive the Radio Bearer Setup command which may be caused by the uplink interference and this can be fixed through checking RTWP The poor downlink coverage is partly caused by the bad UE demodulation performance and other causes should be solved by RF optimization
ZTE Confidential Proprietary copy 2012 ZTE CORPORATION All rights reserved 32
UMTS KPI Optimization Analysis Guide Internal Use Only
44 Optimization of Mobility Indicators
Mobility indicators mainly fall into three categories mdash soft handovers hard handovers and inter-RAT handovers The handover problems usually happen in the following cases
The best server changes too fast or there is no best server due to pilot pollution
The handover is not prompt or there are pingpong handovers due to improper parameter configuration
Adjust the engineering parameters for antennas in areas with severe pilot pollution And adjust the handover parameters such as the values of 1A 1B CIO TTT (time to trigger) Hysteresis and so on to solve the problem that the handover is not prompt or there are pingpong handovers This section tries to solve this kind of problems through OMC data analysis and parameter optimization
441 Optimization of Soft Handovers
Missed neighboring cell configuration pilot pollution improper soft handover parameter configuration and equipment malfunctions are the major causes of soft handover failures To confirm the problems the field DTs are required
ZTE Confidential Proprietary copy 2012 ZTE CORPORATION All rights reserved 33
UMTS KPI Optimization Analysis Guide Internal Use Only
4411 Soft Handover Optimization Flowchart
Figure 4-12 Soft handover optimization flowchart
ZTE Confidential Proprietary copy 2012 ZTE CORPORATION All rights reserved 34
UMTS KPI Optimization Analysis Guide Internal Use Only
Extract performance data
TOP Ncell filtering
Analyze a single cell
1 Check NE alarms
2 Associate emergencies
3 Compare parameter
configurations
4 Associate indicators
5 Locate the fault
comprehensive ly
Exist or not
Handle alarms
Solved or not
Yes
Yes
End
No
No
Exist or not
Handle emergencies
Solved or not
Yes
No
No
Exist or not
Correct wrong parameter
configurations
Solved or not
Yes
No
No
List related indicator counters
RTWPResource
limit indicators
Checkamp analysis of interference
Optimization analysis of
resource limitCounters related to intra-frequency
handover failures
C301391101 C301390593C301391102 C301390594C301391103 C301390595C301390586 C301390596C301390587 C301390597C301390588 C301390598C301390589 C301390599C301390590 C301390600C301390591 C301390601C301390592 C301390602
Solved or not
Yes
Yes
No
Drive Test+RNC signaling
trace
Yes
Counters related to soft handover
failures
30055 3005630057 3005830059 3006030061 30062
Cell hand-inhand-out indicators
ZTE Confidential Proprietary copy 2012 ZTE CORPORATION All rights reserved 35
UMTS KPI Optimization Analysis Guide Internal Use Only
4412 Checking Missed Neighboring Cell Configuration
Generally speaking most of the call drops at the beginning of the optimization are caused by missed neighboring cell configuration The following methods are often used to judge whether the call drops are caused by missed configuration of co-frequency neighboring cells
Observe the active set EcIo information recorded by the UE and the Best Server EcIo information recorded by the Scanner before the call drop If the former record is very bad but the latter record is very good then check whether the Best Server scrambling code recorded by the Scanner appears in the latest list of the neighboring cells under intra-frequency measurement control If it does not then the call drop is caused by missed neighboring cell configuration
If the UE re-accesses immediately after the call drop and the cell scrambling codes during the UE reaccess and those during the call drop are different then the call drop may also be caused by missed neighboring cell configuration You can confirm it through measurement control (look backwards from the message of the call drop event for the latest intra-frequency measurement control message and check the neighboring cell list of this message)
Some UE may report the Detected Set information If the corresponding scrambling code appears in the Detected Set information before the call drop then the call drop is caused by missed neighboring cell configuration
4413 Checking Pilot Pollution
Definition of pilot pollution Excessive strong pilot signals exist at a certain point but none of them is strong enough to be the best server To form pilot pollution the following points in this definition should be satisfied
Strong pilot signal The absolute pilot signal strength is used to judge whether the pilot signal is a strong one The pilot signal strength can be evaluated through the pilot RSCP If the pilot RSCP exceeds a threshold it is considered a strong pilot signal The formula is
AbsoluteRSCPThRSCPCPICH __ gt
Excessive The number of pilot signals is used to judge whether there are excessive pilot signals at a certain point If the number exceeds a threshold it is regarded that excessive pilot signals exist at this point The formula is
NThNumberCPICH gt_
None of them is strong enough to be the best server The relative strength of a pilot signal is a key factor in judging whether the pilot signal is strong enough Based on the above definition and formulae if the difference between the strength of the
ZTE Confidential Proprietary copy 2012 ZTE CORPORATION All rights reserved 36
UMTS KPI Optimization Analysis Guide Internal Use Only
strongest pilot signal and that of the )1( +NTh strongest pilot signal at this point is
less than a threshold it is regarded that there is no pilot signal strong enough to be the best server at this point The formula is
lativeRSCPthThbest ThRSCPCPICHRSCPCPICHN Re_)1( )__( ltminus +
According to the above description it is regarded that pilot pollution exists if the following conditions are both satisfied
The number of pilot signals that meet the condition
AbsoluteRSCPThRSCPCPICH __ gt is more than NTh
lativeRSCPthThbest ThRSCPCPICHRSCPCPICHN Re_)1( )__( ltminus +
For example during the network optimization suppose
dBmTh AbsoluteRSCP 95_ minus= 3=NTh and dBTh lativeRSCP 5Re_ = if the following
conditions are both satisfied then it is regarded that pilot pollution exists
The number of the pilot signals that meet the condition
dBmRSCPCPICH 95_ minusgt is more than 3
dBRSCPCPICHRSCPCPICH thbest 5)__( 4 ltminus
4414 Adjusting Soft Handover Algorithm Parameters
You can solve the following kinds of problems by adjusting handover algorithm parameters
1 The handover is not prompt
From the perspective of the CS service signaling flow the symptom of this problem is that the UE cannot receive Active Set Update (physical channel reallocation in the case of the intra-frequency hard handover) because after the UE reports the measurement report the source cell has a fast reduction in EcIo When the RNC sends Active Set Update the UE has closed the transmitter due to the loss of downlink synchronization Viewed from the UE side it cannot receive Active Set Update In the PS services if the UE cannot receive Active Set Update or TRB resets before the handover the handover will also fail
From the perspective of signals the following phenomena may accompany this problem
ZTE Confidential Proprietary copy 2012 ZTE CORPORATION All rights reserved 37
UMTS KPI Optimization Analysis Guide Internal Use Only
minus Corner effect EcIo of the source cell decreases drastically and EcIo of the target cell increases sharply (very high when it appears)
minus Fast fading EcIo of the source cell decreases quickly for a while and then increases and EcIo of the target cell increases for a short while
2 Pingpong handovers The following phenomena may accompany this problem
The best server changes quickly Two or more cells take turns to be the best server But as the best server none of the cells can last long though they has good RSCPs and EcIos
There is no best server There are multiple cells Their RSCPs are normal and similar to each other But EcIo of every cell is very bad
From the perspective of the signaling flow Event 1A is reported immediately after one cell is deleted Because the UE cannot receive Active Set Update from the RNC the handover fails
4415 Equipment Malfunctions
First check the alarm console to see whether there are abnormal alarms and analyze the message traces at the same time Find out in which step the soft handover fails Check the failure message and contact the local product maintaining engineer to confirm whether the equipment has malfunctions
4416 Solutions
Corresponding adjustments should be taken for the confirmed problems
Handover failures caused by pilot pollution Adjust the engineering parameters of a certain antenna to set this antenna as the best server in this interfered location If the power of one of its sectors is reduced then Io of the pilot pollution area will decrease even if the powers of other pilots are not adjusted EcIo will also increase Thereby the EcIo differences with other scrambling codes in the active set will become larger and pilot pollution will be eliminated Through a lot of research ZTE has proved that the reduction in the pilot transmit power will not change cell capacity greatly If condition allows new base stations can be added to cover this area
Equipment malfunctions Consult the customer service engineers and ask them to help check whether there are alarms and whether the transport layer is abnormal If there are alarms coordinate with the customer service engineers and the engineering personnel to solve the problems
Call drops because the handovers are not prompt
ZTE Confidential Proprietary copy 2012 ZTE CORPORATION All rights reserved 38
UMTS KPI Optimization Analysis Guide Internal Use Only
minus Adjust the antenna to expand the handover zone
minus Configure the Event 1A handover parameters to make the handover easier to happen
minus Increase CIO to make the handover happen earlier in the target cell The sum of CIO and the actually measured value is used for judging the UE events including the UE intra-frequency handover CIO helps shift the cell border in the handover algorithm If CIO is configured with a larger value the handover will be easier to happen and there will be more UE in the soft-handover status but more resources will be occupied If CIO is configured with a smaller value the soft handover will be more difficult to happen and the receiving quality may be impaired A CIO of about 5dB is quite good for eliminating the fast fading and the corner effect but this configuration has some side effects such as the increase of handover proportion
Call drops caused by pingpong handovers Adjust the antenna to form a best server in its coverage zone or set the Event 1B handover parameters (increase the threshold of Event 1B the Event 1B hysteresis or the time to trigger Event 1B) to increase the difficulty in deleting the active set
442 Optimization of Hard Handovers
4421 Classification of Hard handovers
Hard handovers mainly fall into two classifications
Intra-frequency hard handovers The intra-frequency hard handover is triggered only when the intra-frequency softsofter handover cannot be performed and it is applicable to the following circumstances
minus Inter-RNC intra-frequency cell handovers when there is no Iur interface
minus Insufficient Iur interface resources though there is the Iur interface
minus Handovers controlled by the threshold of the PS service rate in the handover cell
The intra-frequency softsofter handovers can not be performed (intra-frequency hard handover should be triggered) in the following scenarios
minus When the intra-frequency handover happens the UE is using the transmit diversity in the active set cell but the target cell does not support the transmit diversity
minus The intra-frequency measurement report does not contain OFF and TM of the
ZTE Confidential Proprietary copy 2012 ZTE CORPORATION All rights reserved 39
UMTS KPI Optimization Analysis Guide Internal Use Only
target cell
minus When the intra-frequency handover happens between RNCs the Iur interface is unavailable
minus The UE performs the multiuser detection in the active set cell but the target cell does not support the multiuser detection
minus The target cell and the original cell belong to different classifications (The cells of R99 R5+R99 and R6+R5+R99 belong to the same classification while the cells of R5 and R6+R5 belong to another classification)
Inter-frequency hard handovers The inter-frequency hard handover means a UE connection is handed over from a cell of a UTRAN frequency to a cell of another frequency Many factors including the radio quality the load and the speed of the moving UE may trigger inter-frequency hard handovers
For example the radio quality triggers the inter-frequency hard handover in the following way
When the quality of the UE radio frequency becomes lower the inter-frequency measurement will be triggered and according to the measurement result the UE connection will be handed over to a better frequency
ZTE Confidential Proprietary copy 2012 ZTE CORPORATION All rights reserved 40
UMTS KPI Optimization Analysis Guide Internal Use Only
4422 Hard Handover Optimization Flowchart
Figure 4-13 Hard handover optimization flowchart
ZTE Confidential Proprietary copy 2012 ZTE CORPORATION All rights reserved 41
UMTS KPI Optimization Analysis Guide Internal Use Only
Extract performance data
TOP Ncell filtering
Analyze a single cell
1 Check NE alarms
2 Associate emergencies
3 Compare parameter
configurations
4 Associate indicators
5 Locate the fault
comprehensive ly
Exist or not
Handle alarms
Solved or not
Yes
Yes
End
No
Exist or not
Handle emergencies
Solved or not
YesNo
Exist or not
Correct wrong parameter
configurations
Solved or not
Yes
No
No
List related indicator counters
RTWPResource
limit indicators
Checkamp analysis of interference
Optimization analysis of
resource limit
Counters related to inter-frequency handover failures
C301110489 C301110516C301110499 C301110517C301110500 C301110518C301110501 C301110519C301110502 C301110520C301110503 C301110521C301110504 C301110522C301110505 C301110523
Solved or not
Yes
Yes
No
Drive Test+RNC signaling
trace
Yes
Counters related to hard handover
failures
30041 3004230043 3004430045 3004630047 30048
Cell hand-inhand-out indicators
NoNo
ZTE Confidential Proprietary copy 2012 ZTE CORPORATION All rights reserved 42
UMTS KPI Optimization Analysis Guide Internal Use Only
4423 Hard Handover Optimization Methods
The optimization flow for the hard handover is similar to that of the soft handover The major differences are in the parameter optimization To optimize intra-frequency hard handovers you can properly reduce the Event 1D hysteresis and the time to trigger Event 1D according to the real radio environment to ensure timely handovers
Inter-frequency coverage is often applied to some special scenarios such as indoor coverage and tested through CQT The method of judging whether there is missed configuration of the inter-frequency neighboring cell is almost the same as that of the co-frequency neighboring cell when a call drop occurs the UE fails to measure or report the inter-frequency neighboring cell after the call drop the UE resides in the inter-frequency neighboring cell again
The common hard handover problems are
1 The handover is not prompt The common symptoms are frequent call drops in the hard handovers when the UE moves
Solutions
Increase the threshold of activating the compressing mode The compressing mode is usually activated before the inter-frequency handover or the inter-RAT handover and it is used to measure the quality of the inter-frequency or inter-RAT cell You can set a threshold of the CPICH RSCP or EcIo to activate the compressing mode And the RSCP is widely used
minus Requirements on setting the threshold of activating the compressing mode Before the cell quality becomes low enough to cause a call drop the signal of the target cell should be measured and reported and the handover should be performed
minus Requirement on setting the threshold of deactivating the compression mode Frequent activationdeactivation of the compression mode should be avoided
Increase CIOs of the inter-frequency cell pair
Reduce the threshold of triggering the target frequency handover under the inter-frequency coverage
2 There are pingpong handovers
Solution Increase the hard handover hysteresis and the time to trigger the event
ZTE Confidential Proprietary copy 2012 ZTE CORPORATION All rights reserved 43
UMTS KPI Optimization Analysis Guide Internal Use Only
443 Optimization of Inter-RAT Handovers
4431 Configuring Basic Inter-RAT Parameters
Most of the inter-RAT handover failures are caused by incomplete parameter configuration The following parameters need special attention
Complete RNC parameter configuration for the GSM neighboring cell The 2G system shall provide the 3G system with the correct radio parameters based on negotiation mdash MCC MNC LAC ID (CI) NCC BCC frequency band indicator (900 or 1800) and BCCH
Table 4-3 Parameters That 2G Shall Provide to 3G
MCC MNC LACIDCI
NCC BCCFrequency
band indicator
BCCH
460 2 202 193 0 0 900 102
Complete GSM BSC parameter configuration for the WCDMA neighboring cell The 3G system shall provide the 2G system with the correct radio parameters based on negotiation mdash MCC MNC LAC RNC ID cell ID (C_ID) downlink frequency scrambling code and RAC
Table 4-4 Parameters That 3G Shall Provide to 2G
MCC MNC LACRNC
IDCell IDC_ID
Downlink frequency
Scrambling code
RAC
460 3 20 18 51 10787 51 20
According to the current strategy of one-way inter-RAT handovers if the parameter configuration is complete one probable cause of the inter-RAT handover failure is that the handover is not prompt The common parameter adjustment is to increase CIO the threshold to activatedeactivate the compressing mode and the threshold to trigger the WCDMA-to-GSM handover at the same time
Call drops during the inter-RAT handovers between WCDMA and GSM may be caused by
minus Inconsistent data configuration at the GSM side and the WCDMA side after GSM modifies the configuration data but does not inform WCDMA
minus Missed configuration of neighboring cells which can be solved by the correct configuration of neighboring cells
minus Too fast signal changes
ZTE Confidential Proprietary copy 2012 ZTE CORPORATION All rights reserved 44
UMTS KPI Optimization Analysis Guide Internal Use Only
minus Pingpong reselection
minus Faults with the UE for example the UE fails to respond to the handover or report the inter-RAT measurement report
minus Changes of the best server during the physical channel reallocation
minus Wrong LAC configuration which can be located through data configuration check
ZTE Confidential Proprietary copy 2012 ZTE CORPORATION All rights reserved 45
UMTS KPI Optimization Analysis Guide Internal Use Only
4432 Inter-RAT Handover Optimization Flowchart
Figure 4-14 Inter-RAT handover optimization flowchart
ZTE Confidential Proprietary copy 2012 ZTE CORPORATION All rights reserved 46
UMTS KPI Optimization Analysis Guide Internal Use Only
Extract performance data
TOP Ncell filtering
Analyze a single cell
1 Check NE alarms
2 Associate emergencies
3 Compare parameter
configurations
4 Associate indicators
5 Locate the fault
comprehensive ly
Exist or not
Handle alarms
Solved or not
Yes
Yes
End
No
No
Exist or not
Handle emergencies
Solved or not
Yes
No
No
Exist or not
Correct wrong parameter
configurations
Solved or not
Yes
No
No
List related indicator counters
RTWPResource
limit indicators
Checkamp analysis of interference
Optimization analysis of
resource limitCounters related to inter-RAT handover failures
C301130667 C301130681C301130668 C301130682C301130669 C301130690C301130670 C301130691C301130671 C301130692C301130672 C301130693C301130673 C301130694C301130674 C301130696C301130675 C301130697C301130677 C301130698C301130678 C301130699C301130679 C301130700
C301130680
Solved or not
Yes
Yes
No
Drive Test+RNC signaling
trace
Yes
Counters related to inter-RAT handover
failures
Cell hand-inhand-out indicators
30049 3005030051 3005230053 30054
ZTE Confidential Proprietary copy 2012 ZTE CORPORATION All rights reserved 47
UMTS KPI Optimization Analysis Guide Internal Use Only
45 Optimization of Resource Indicators
The resource indicators directly reflect the system capacity Increasing subscribers will consume more system resources and some resources may be limited for example the code resource may be limited the TCP access request may be rejected and the CE resource usage rate may exceed the threshold Limited system resources have a negative influence on the whole-network indicators and the subscribersrsquo perception for example call drops may frequently happen and more TCP access requests may be rejected during the voice services
Table 4-5 Resource KPIs and Alarm Thresholds
Resource type KPI No and nameAlarm
threshold
TCP
C301320150 Number of rejected services DCH downlink TCP limit
50
PI30167 Average non-HS (SOA) (SOA)DPA TCP 40
PI30092 Maximum Cell TCP () 100
PI30093 Average Cell TCP 70
UL TrafficPI30029 Handover Blocking Rate 05
KPI RTWP (in busy hour) -98 dBm
Code
C301320153 Number of rejected services DCH no code
50
PI30205 Average Cell HSUPA Users 12
PI30172 Cell Average HSDPA Users 16
CE
PI301830006 Maximum use Ratio of Uplink NodeB CE
60
PI301830010 Maximum use Ratio of Downlink NodeB CE
60
ZTE Confidential Proprietary copy 2012 ZTE CORPORATION All rights reserved 48
UMTS KPI Optimization Analysis Guide Internal Use Only
451 Resource Indicator Optimization Flowchart
Figure 4-15 Resource indicator optimization flowchart
ZTE Confidential Proprietary copy 2012 ZTE CORPORATION All rights reserved 49
UMTS KPI Optimization Analysis Guide Internal Use Only
Extract performance data
TOP Ncell filtering
Analyze a single cell
1 Check NE alarms
2 Associate emergencies
3 Compare parameter
configurations
4 Associate indicators
5 Locate the fault
comprehensive ly
Exist or not
Handle alarms
Solved or not
Yes
是
End
No
No
Exist or not
Handle emergencies
Solved or not
Yes
No
No
Exist or not
Correct wrong parameter
configurations
Solved or not
Yes
No
No
List related indicator counters
Code resource indicators
CE resource indicators
TCPadmission
reject counter
C301320150
Solved or not
Yes
Yes
No
Drive Test+RNC signaling
trace
Yes
Counter related to TCP limit
Cell TX power
indicators
30090 3009130092 3009330166 3016730168 3016930170 30171
30163301643016530075
30223302243045030451
Yes
Yes
ZTE Confidential Proprietary copy 2012 ZTE CORPORATION All rights reserved 50
UMTS KPI Optimization Analysis Guide Internal Use Only
452 Code Resource Optimization
The statistics of Number of rejected services and DCH no code the average code resource usage rate and the number of the HSDPA subscribers can be used to judge whether the code resource in a cell is limited If the code resource is limited you can adjust the code resource allocation to alleviate the situation
Based on the system algorithm when Formula 1 is satisfied you can add an HS-PDSCH when Formula 2 is satisfied then an HS-PDSCH is deleted
Formula 1 OcuRateNoHspdsch + OcuRateHspdsch + DpchCodeHy + 32 lt= 512
Formula 2 OcuRateNoHspdsch + OcuRateHspdsch + CodeUptHyA gt 512
OcuRateHspdschHSPDSCH means the number of the codes of SF=512 blocked by the HS-PDSCH OcuRateNoHspdsch means the number of codes of SF=512 blocked by other channels DpchCodeHy means the number of codes of SF=512 reserved for the DPCH and CodeUptHyA is the threshold to decide whether to delete the HSPDSCH
Therefore to ensure the access of the R99 subscribers you can make some adjustment according to Table 4-6 when the code resource is limited though the HSDPA rate may decrease
Table 4-6 Adjusting Code Resource Allocation
AbbreviationParameter
nameRange
and stepCurrent value
Update value
Remark
DpchCodeHy DPCH Code Hysteresis
0512 16 28
To decrease the number of rejected services for DCH no code
CodeUptHyACode Update Hysteresis A
0512 16 28
To decrease the number of rejected services for DCH no code
453 Monitoring CE Resource
The CE resource is mainly monitored through the maximum UE uplinkdownlink usage rate If there is any problem you can solve it by controlling the load or adding more boards
ZTE Confidential Proprietary copy 2012 ZTE CORPORATION All rights reserved 51
UMTS KPI Optimization Analysis Guide Internal Use Only
454 Optimization of Power Control
4541 Monitoring and Optimizing Downlink Power Control
Limited TCP in busy hours will not only increase access failures and call drops in the local cell but also increase soft handover failures and call drops in the neighboring cells Number of rejected services and DCH downlink TCP limit are intuitive KPIs to judge whether TCP is limited Although limited uplink capacity and massive UE moves in the rush hours may also cause call drops the limited TCP is absolutely a key factor
Based on the system algorithm MinHsdpaPower (MinHspaPwrRto) + NoHsPower gtNode B if the safety threshold is used (MinHsdpaPower means the power reserved for HSPA) then it will activate the downlink rate downgrade algorithm flow for the congestion (lower the downlink DCH rate) Although the rate downgrade can ensure access of some subscribers it is an irregular action and will degrade the performance
455 Speeding up Rate Downgrade
Considering that the cells with heavy load reject more access requests you can speed up the rate downgrade during the resource congestion to release the resources as soon as possible and avoid call drops caused by access failures (this method is only applicable to the cells with many PS service users but not those with only CS service users) Table 4-7 is an example of the parameter modification for the rate downgrade
Table 4-7 Example of Parameter Modification for Rate Downgrade
Abbreviation Parameter nameRange and
stepCurrent value
Update value
Remark
UlDnMaxStg Maximum Number of Degraded Uplink Load Steps Every Time
[1 8] 1 2 Downgrade from 384 Kbps to 16 Kbps
DlDnMaxStg Maximum Number of Degraded Downlink Load Steps Every Time
[1 8] 1 3 Downgrade from 384 Kbps to 8 Kbps
456 Monitoring and Optimizing Uplink Capacity
Handover Blocking Rate and RTWP can reflect the uplink capacity of the cell Because interference may also increase RTWP this factor should be distinguished during the RTWP monitoring Another effective indicator is the voice service erl If a cell has over 20 erls in busy hours you should pay special attention to it
ZTE Confidential Proprietary copy 2012 ZTE CORPORATION All rights reserved 52
UMTS KPI Optimization Analysis Guide Internal Use Only
457 Optimization of Uplink Capacity at the Whole Network Level
Case The uplink capacity was limited in a large number of sites after the cutover and the symptoms are a sharp rise of RTWP and a high call drop rate during the rush hours
After the following parameters were modified as shown in Table 4-8 the problem was solved
Table 4-8 Example of Power Control Parameter Modification
AbbreviationParameter
nameRange
Current value
Update value
ULINITSIRUplink Initial SIR target (dB)
UL 34 K136 K signaling UL 122 K AMR
4-5 35
ULMAXSIRMaximum Uplink SIR target (dB)
UL 34 K136 K signaling UL 122 K AMR
15 10
UlSirTargDnStepUplink SIR Target Down Step Size (dB)
UL 34 K136 K signaling UL 122 K AMR
01 02
458 Optimization of Uplink Capacity for a Single Cell
A lot of optimization measures can be taken to bring down the rising RTWP However with increasing subscribers the capacity may still be limited in some area while further modification of SirTarget will obviously degrade the call quality of the whole network and undermine the subscribersrsquo perception In this case you can adjust the power control parameters for a single site that has heavy traffic in the following way add one set of DivPc parameters and use this set of parameters only for this site
Case Table 4-9 shows an example of the power control parameter modification After this modification the call drop rate in the site with heavy traffic decreased to one quarter of the original one
Table 4-9 Example of Power Control Parameter Modification for Heavy-Traffic Cell
SRVTYPE ULINITSIR ULMAXSIR ULMINSIR
0 35-gt15 100-gt35 20-gt10
104 40-gt20 150-gt50 05-gt0
28 35-gt15 100-gt35 05-gt0
50 60-gt20 150-gt50 20-gt0
54 60-gt20 150-gt50 20-gt0
ZTE Confidential Proprietary copy 2012 ZTE CORPORATION All rights reserved 53
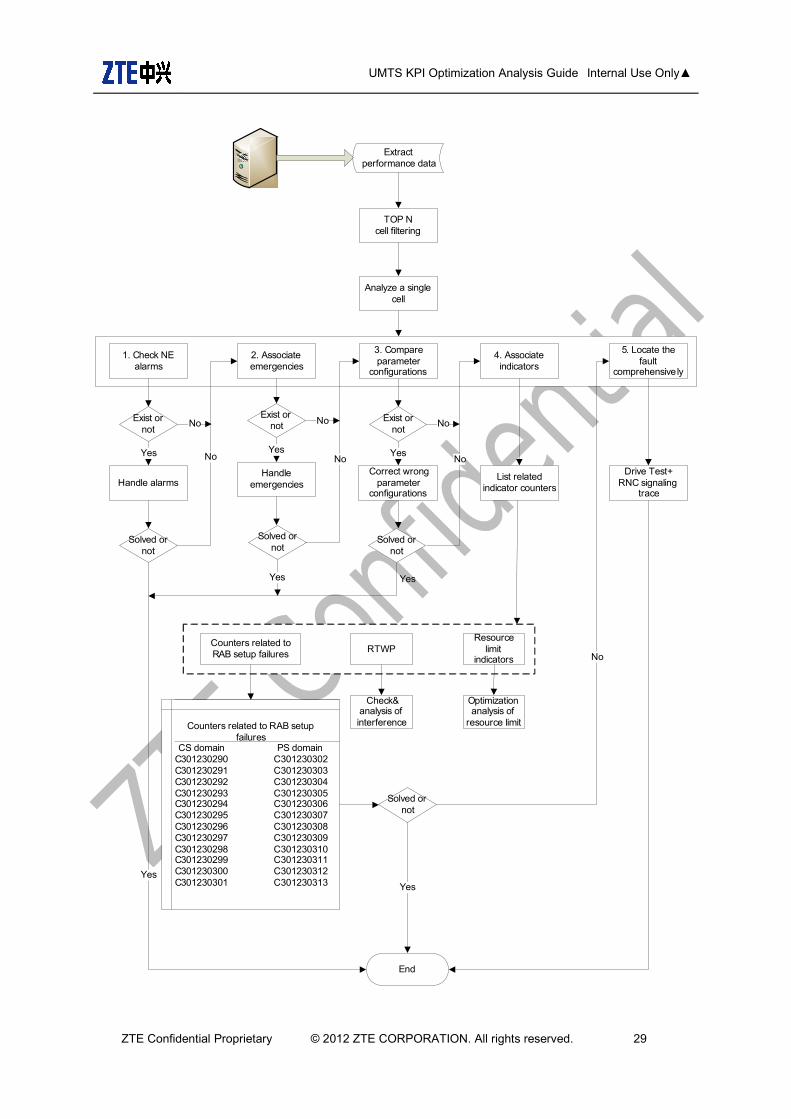
UMTS KPI Optimization Analysis Guide Internal Use Only
Extract performance data
TOP Ncell filtering
Analyze a single cell
1 Check NE alarms
2 Associate emergencies
3 Compare parameter
configurations
4 Associate indicators
5 Locate the fault
comprehensively
Exist or not
Handle alarms
Solved or not
Yes
Yes
End
No
No
Exist or not
Handle emergencies
Solved or not
Yes
No
No
Exist or not
Correct wrong parameter
configurations
Solved or not
Yes
No
No
List related indicator counters
Counters related to RAB setup failures RTWP
Resource limit
indicators
Checkamp analysis of interference
Optimization analysis of
resource limitCounters related to RAB setup failures
CS domain PS domainC301230290 C301230302C301230291 C301230303C301230292 C301230304C301230293 C301230305C301230294 C301230306C301230295 C301230307C301230296 C301230308C301230297 C301230309C301230298 C301230310C301230299 C301230311C301230300 C301230312C301230301 C301230313
Solved or not
Yes
Yes
No
Drive Test+RNC signaling
trace
Yes
ZTE Confidential Proprietary copy 2012 ZTE CORPORATION All rights reserved 29
UMTS KPI Optimization Analysis Guide Internal Use Only
4332 RNC Directly Rejecting RAB Setup Request Because Of Wrong Parameter Configuration
The case that RNC responds with RAB Setup Failure directly is seldom caused by invalid parameter configuration in the business network Usually this case is caused by special operations of the special users
The main scenario is that the subscription information of the userrsquos PS service is beyond the capability of the UE which leads to the direct refusal from RNC For example a special userrsquos subscription rates of uplink and downlink are 384 K but the maximum uplink rate of the UE is only 64 K The maximum uplink and downlink rates of the QoS message used for activating PDP set by the AT command or mobile terminal software used by the user are 384 K so the RNC will find the maximum uplink rate is beyond the UErsquos capability directly reply with RAB Setup Failure and will not launch the RB setup process when it receives RAB Assignment Request
After the RAB setup fails because the parameter configuration is beyond the UErsquos capability SGSN will negotiate again to launch the new RAB assignment until the UE has the capability to support the assignment and the RAB assignment is finished For the users the PDP activation is still successful and the actual maximum rate is the maximum rate the UE can support
However if the minimum guaranteed bit rate required by the QoS setting in the UErsquos PDP activation request is beyond the UErsquos capability though the network negotiates a lower rate to accept the UErsquos PDP activation request the UE will launch the request of deactivating PDP when it finds that the rate negotiated by the network in PDP activation accept request is lower than the minimum guaranteed bit rate and finally the PDP activation can not be completed
4333 Admission Reject
For the non-HSDPA user if there are insufficient system resources (including power channel code lub transmission resource and CE) the call establishment failure will be caused by the admission reject At this time it is necessary to check the network load code resource lub transmission resource and CE resource occupation to make sure the congestion is caused by the limitation of a certain kind of resource What is more the engineer should plan the corresponding expansion method
If the cell does not support the HSDPA service the R99 user admission is judged according to the fixed R99 admission threshold If the cell supports the HSDPA service and the HSDPA and R99 dynamic power is allocated the uplink admission of non-HSDPA is judged based on RTWP or the equivalent user number If the uplink load is too heavy the non-HSDPA user admission will also fail
If the bandwidth configuration on the lub interface is insufficient the lub interface will reject the R99 data service activation because of limited bandwidth
ZTE Confidential Proprietary copy 2012 ZTE CORPORATION All rights reserved 30
UMTS KPI Optimization Analysis Guide Internal Use Only
The admission control of the NodeB Credit resource is similar to the power admission control Whether the remaining Credit can support the currently requested service or not can be judged according to the spectrum spreading factor of the new access user According to the condition of the RAB Downsizing Switch RNC will deal with the issue in the corresponding way
For the HSDPA user in the dynamic power allocation mode besides the mentioned system resources such as the power channel code lub transmission resource and CE the admission reject should take into consideration whether the number of H users supported by NodeB and the number of H users supported by the cell are over the regulated threshold or not into consideration
For the HSDPA user when the bandwidth configuration on lub interface is insufficient the admission reject will not happen but the rate will be reduced What is more the AAL2PATHs of HSDPA and R99 are configured respectively and the HSDPA AAL2PATH must be configured to the HSDPA_RT or HSDPA_NRT type If the HSDPA AAL2PATH is configured to RT or NRT of R99 AAL2PATH type the RAB assignment failure will not happen but RNC will establish the HSDPA service as R99 384 Kbps
For the downlink power admission
Besides whether the R99 service load is over the non-HSDPA service threshold DCH service should take into consideration whether non-HSDPA power and HSDPA GBP (the minimum power needed for the guaranteed bit rate) are over the general power threshold of the cell
For the HSDPA service it is necessary to check whether the throughput rate provided by the cell is over the sum of all the usersrsquo GBR thresholds or whether the GBPs of the stream service and the background service are over the HSDPA power of the cell At the same time whether the non-HSDPA power and the HSDPA GBP (the minimum power needed for the guaranteed bit rate) are over the overall power threshold of the cell should be also taken into consideration
For the lub admission
For the DCH service the admission is made according to the multiplication of the peak rate and the service activation factor
For HSDPA service the admission is made according to the GBR
If the lub exceeds the congestion threshold the DCCC rate reduction will be triggered And if the RLC_AM retransmission rate is over a certain threshold the Iub Overbooking switch can be opened to trigger the TF which limits R99 or to reduce the rate of HSDPA service by a certain factor
ZTE Confidential Proprietary copy 2012 ZTE CORPORATION All rights reserved 31
UMTS KPI Optimization Analysis Guide Internal Use Only
4334 RAB Setup Failure Because the UE Fails to Respond to RB Setup
The UE fails to respond to RB setup mainly because of the userrsquos operation
Take the following cases as examples
When the user already has had the downlink 12 K data service he receives RB Setup Request of the VP service (either the originated call in the VP domain or the terminated call in the VP domain) Because the UE does not support the VP and high-speed PS service in the downlink at the same time it directly replies with RB Setup Failure and the cause value is unsupported configuration
Compared with the WCDMA subscriber originating the VP service the terminating subscriber resides in the GSM network and so it does not support the VP service After RNC receives RAB Assignment Request the core network will deliver the Disconnect command right after call proceeding and the cause value is Bearer capability not authorized At this time the UE has just received the RB SETUP command and has no enough time to finish the RB setup So the UE will reply with RB Setup Failure after it receives the Disconnect command and the RNC will reply with RAB Setup Failure with the cause value being failure in radio interface procedure
4335 RAB Setup Failure Because the Uu Interface Fails to Set Up RB
RNC sends the Radio Bearer Setup command to the UE but fails to receive Radio Bearer Setup Compete This kind of situation (RB setup failure) often appears in the cells with weak signals There are two causes of weak signals one is that the UE does not reside in the best server to launch the access and the other is poor coverage
If the UE does not reside in the best server to launch the access it will hope to enter the best server through active set update in the RB setup process (At the same time the fast signal change will drastically weaken the signals in the cell) but the active set update can only be processed after the RB setup is completed because the procedures can not be processed alternately (Neither the network nor the terminal supports it) Therefore RB can only be set up in the cell with weak signals and the setup is easy to fail As for this situation the starting threshold and speed of co-frequency cell reselection should be increased to make the UE reside in the best server and launch the access as soon as possible
RB setup failure may be caused by the poor downlinkuplink coverage If the failure is caused by downlink coverage the UE can not receive the Radio Bearer Setup command which may be caused by the uplink interference and this can be fixed through checking RTWP The poor downlink coverage is partly caused by the bad UE demodulation performance and other causes should be solved by RF optimization
ZTE Confidential Proprietary copy 2012 ZTE CORPORATION All rights reserved 32
UMTS KPI Optimization Analysis Guide Internal Use Only
44 Optimization of Mobility Indicators
Mobility indicators mainly fall into three categories mdash soft handovers hard handovers and inter-RAT handovers The handover problems usually happen in the following cases
The best server changes too fast or there is no best server due to pilot pollution
The handover is not prompt or there are pingpong handovers due to improper parameter configuration
Adjust the engineering parameters for antennas in areas with severe pilot pollution And adjust the handover parameters such as the values of 1A 1B CIO TTT (time to trigger) Hysteresis and so on to solve the problem that the handover is not prompt or there are pingpong handovers This section tries to solve this kind of problems through OMC data analysis and parameter optimization
441 Optimization of Soft Handovers
Missed neighboring cell configuration pilot pollution improper soft handover parameter configuration and equipment malfunctions are the major causes of soft handover failures To confirm the problems the field DTs are required
ZTE Confidential Proprietary copy 2012 ZTE CORPORATION All rights reserved 33
UMTS KPI Optimization Analysis Guide Internal Use Only
4411 Soft Handover Optimization Flowchart
Figure 4-12 Soft handover optimization flowchart
ZTE Confidential Proprietary copy 2012 ZTE CORPORATION All rights reserved 34
UMTS KPI Optimization Analysis Guide Internal Use Only
Extract performance data
TOP Ncell filtering
Analyze a single cell
1 Check NE alarms
2 Associate emergencies
3 Compare parameter
configurations
4 Associate indicators
5 Locate the fault
comprehensive ly
Exist or not
Handle alarms
Solved or not
Yes
Yes
End
No
No
Exist or not
Handle emergencies
Solved or not
Yes
No
No
Exist or not
Correct wrong parameter
configurations
Solved or not
Yes
No
No
List related indicator counters
RTWPResource
limit indicators
Checkamp analysis of interference
Optimization analysis of
resource limitCounters related to intra-frequency
handover failures
C301391101 C301390593C301391102 C301390594C301391103 C301390595C301390586 C301390596C301390587 C301390597C301390588 C301390598C301390589 C301390599C301390590 C301390600C301390591 C301390601C301390592 C301390602
Solved or not
Yes
Yes
No
Drive Test+RNC signaling
trace
Yes
Counters related to soft handover
failures
30055 3005630057 3005830059 3006030061 30062
Cell hand-inhand-out indicators
ZTE Confidential Proprietary copy 2012 ZTE CORPORATION All rights reserved 35
UMTS KPI Optimization Analysis Guide Internal Use Only
4412 Checking Missed Neighboring Cell Configuration
Generally speaking most of the call drops at the beginning of the optimization are caused by missed neighboring cell configuration The following methods are often used to judge whether the call drops are caused by missed configuration of co-frequency neighboring cells
Observe the active set EcIo information recorded by the UE and the Best Server EcIo information recorded by the Scanner before the call drop If the former record is very bad but the latter record is very good then check whether the Best Server scrambling code recorded by the Scanner appears in the latest list of the neighboring cells under intra-frequency measurement control If it does not then the call drop is caused by missed neighboring cell configuration
If the UE re-accesses immediately after the call drop and the cell scrambling codes during the UE reaccess and those during the call drop are different then the call drop may also be caused by missed neighboring cell configuration You can confirm it through measurement control (look backwards from the message of the call drop event for the latest intra-frequency measurement control message and check the neighboring cell list of this message)
Some UE may report the Detected Set information If the corresponding scrambling code appears in the Detected Set information before the call drop then the call drop is caused by missed neighboring cell configuration
4413 Checking Pilot Pollution
Definition of pilot pollution Excessive strong pilot signals exist at a certain point but none of them is strong enough to be the best server To form pilot pollution the following points in this definition should be satisfied
Strong pilot signal The absolute pilot signal strength is used to judge whether the pilot signal is a strong one The pilot signal strength can be evaluated through the pilot RSCP If the pilot RSCP exceeds a threshold it is considered a strong pilot signal The formula is
AbsoluteRSCPThRSCPCPICH __ gt
Excessive The number of pilot signals is used to judge whether there are excessive pilot signals at a certain point If the number exceeds a threshold it is regarded that excessive pilot signals exist at this point The formula is
NThNumberCPICH gt_
None of them is strong enough to be the best server The relative strength of a pilot signal is a key factor in judging whether the pilot signal is strong enough Based on the above definition and formulae if the difference between the strength of the
ZTE Confidential Proprietary copy 2012 ZTE CORPORATION All rights reserved 36
UMTS KPI Optimization Analysis Guide Internal Use Only
strongest pilot signal and that of the )1( +NTh strongest pilot signal at this point is
less than a threshold it is regarded that there is no pilot signal strong enough to be the best server at this point The formula is
lativeRSCPthThbest ThRSCPCPICHRSCPCPICHN Re_)1( )__( ltminus +
According to the above description it is regarded that pilot pollution exists if the following conditions are both satisfied
The number of pilot signals that meet the condition
AbsoluteRSCPThRSCPCPICH __ gt is more than NTh
lativeRSCPthThbest ThRSCPCPICHRSCPCPICHN Re_)1( )__( ltminus +
For example during the network optimization suppose
dBmTh AbsoluteRSCP 95_ minus= 3=NTh and dBTh lativeRSCP 5Re_ = if the following
conditions are both satisfied then it is regarded that pilot pollution exists
The number of the pilot signals that meet the condition
dBmRSCPCPICH 95_ minusgt is more than 3
dBRSCPCPICHRSCPCPICH thbest 5)__( 4 ltminus
4414 Adjusting Soft Handover Algorithm Parameters
You can solve the following kinds of problems by adjusting handover algorithm parameters
1 The handover is not prompt
From the perspective of the CS service signaling flow the symptom of this problem is that the UE cannot receive Active Set Update (physical channel reallocation in the case of the intra-frequency hard handover) because after the UE reports the measurement report the source cell has a fast reduction in EcIo When the RNC sends Active Set Update the UE has closed the transmitter due to the loss of downlink synchronization Viewed from the UE side it cannot receive Active Set Update In the PS services if the UE cannot receive Active Set Update or TRB resets before the handover the handover will also fail
From the perspective of signals the following phenomena may accompany this problem
ZTE Confidential Proprietary copy 2012 ZTE CORPORATION All rights reserved 37
UMTS KPI Optimization Analysis Guide Internal Use Only
minus Corner effect EcIo of the source cell decreases drastically and EcIo of the target cell increases sharply (very high when it appears)
minus Fast fading EcIo of the source cell decreases quickly for a while and then increases and EcIo of the target cell increases for a short while
2 Pingpong handovers The following phenomena may accompany this problem
The best server changes quickly Two or more cells take turns to be the best server But as the best server none of the cells can last long though they has good RSCPs and EcIos
There is no best server There are multiple cells Their RSCPs are normal and similar to each other But EcIo of every cell is very bad
From the perspective of the signaling flow Event 1A is reported immediately after one cell is deleted Because the UE cannot receive Active Set Update from the RNC the handover fails
4415 Equipment Malfunctions
First check the alarm console to see whether there are abnormal alarms and analyze the message traces at the same time Find out in which step the soft handover fails Check the failure message and contact the local product maintaining engineer to confirm whether the equipment has malfunctions
4416 Solutions
Corresponding adjustments should be taken for the confirmed problems
Handover failures caused by pilot pollution Adjust the engineering parameters of a certain antenna to set this antenna as the best server in this interfered location If the power of one of its sectors is reduced then Io of the pilot pollution area will decrease even if the powers of other pilots are not adjusted EcIo will also increase Thereby the EcIo differences with other scrambling codes in the active set will become larger and pilot pollution will be eliminated Through a lot of research ZTE has proved that the reduction in the pilot transmit power will not change cell capacity greatly If condition allows new base stations can be added to cover this area
Equipment malfunctions Consult the customer service engineers and ask them to help check whether there are alarms and whether the transport layer is abnormal If there are alarms coordinate with the customer service engineers and the engineering personnel to solve the problems
Call drops because the handovers are not prompt
ZTE Confidential Proprietary copy 2012 ZTE CORPORATION All rights reserved 38
UMTS KPI Optimization Analysis Guide Internal Use Only
minus Adjust the antenna to expand the handover zone
minus Configure the Event 1A handover parameters to make the handover easier to happen
minus Increase CIO to make the handover happen earlier in the target cell The sum of CIO and the actually measured value is used for judging the UE events including the UE intra-frequency handover CIO helps shift the cell border in the handover algorithm If CIO is configured with a larger value the handover will be easier to happen and there will be more UE in the soft-handover status but more resources will be occupied If CIO is configured with a smaller value the soft handover will be more difficult to happen and the receiving quality may be impaired A CIO of about 5dB is quite good for eliminating the fast fading and the corner effect but this configuration has some side effects such as the increase of handover proportion
Call drops caused by pingpong handovers Adjust the antenna to form a best server in its coverage zone or set the Event 1B handover parameters (increase the threshold of Event 1B the Event 1B hysteresis or the time to trigger Event 1B) to increase the difficulty in deleting the active set
442 Optimization of Hard Handovers
4421 Classification of Hard handovers
Hard handovers mainly fall into two classifications
Intra-frequency hard handovers The intra-frequency hard handover is triggered only when the intra-frequency softsofter handover cannot be performed and it is applicable to the following circumstances
minus Inter-RNC intra-frequency cell handovers when there is no Iur interface
minus Insufficient Iur interface resources though there is the Iur interface
minus Handovers controlled by the threshold of the PS service rate in the handover cell
The intra-frequency softsofter handovers can not be performed (intra-frequency hard handover should be triggered) in the following scenarios
minus When the intra-frequency handover happens the UE is using the transmit diversity in the active set cell but the target cell does not support the transmit diversity
minus The intra-frequency measurement report does not contain OFF and TM of the
ZTE Confidential Proprietary copy 2012 ZTE CORPORATION All rights reserved 39
UMTS KPI Optimization Analysis Guide Internal Use Only
target cell
minus When the intra-frequency handover happens between RNCs the Iur interface is unavailable
minus The UE performs the multiuser detection in the active set cell but the target cell does not support the multiuser detection
minus The target cell and the original cell belong to different classifications (The cells of R99 R5+R99 and R6+R5+R99 belong to the same classification while the cells of R5 and R6+R5 belong to another classification)
Inter-frequency hard handovers The inter-frequency hard handover means a UE connection is handed over from a cell of a UTRAN frequency to a cell of another frequency Many factors including the radio quality the load and the speed of the moving UE may trigger inter-frequency hard handovers
For example the radio quality triggers the inter-frequency hard handover in the following way
When the quality of the UE radio frequency becomes lower the inter-frequency measurement will be triggered and according to the measurement result the UE connection will be handed over to a better frequency
ZTE Confidential Proprietary copy 2012 ZTE CORPORATION All rights reserved 40
UMTS KPI Optimization Analysis Guide Internal Use Only
4422 Hard Handover Optimization Flowchart
Figure 4-13 Hard handover optimization flowchart
ZTE Confidential Proprietary copy 2012 ZTE CORPORATION All rights reserved 41
UMTS KPI Optimization Analysis Guide Internal Use Only
Extract performance data
TOP Ncell filtering
Analyze a single cell
1 Check NE alarms
2 Associate emergencies
3 Compare parameter
configurations
4 Associate indicators
5 Locate the fault
comprehensive ly
Exist or not
Handle alarms
Solved or not
Yes
Yes
End
No
Exist or not
Handle emergencies
Solved or not
YesNo
Exist or not
Correct wrong parameter
configurations
Solved or not
Yes
No
No
List related indicator counters
RTWPResource
limit indicators
Checkamp analysis of interference
Optimization analysis of
resource limit
Counters related to inter-frequency handover failures
C301110489 C301110516C301110499 C301110517C301110500 C301110518C301110501 C301110519C301110502 C301110520C301110503 C301110521C301110504 C301110522C301110505 C301110523
Solved or not
Yes
Yes
No
Drive Test+RNC signaling
trace
Yes
Counters related to hard handover
failures
30041 3004230043 3004430045 3004630047 30048
Cell hand-inhand-out indicators
NoNo
ZTE Confidential Proprietary copy 2012 ZTE CORPORATION All rights reserved 42
UMTS KPI Optimization Analysis Guide Internal Use Only
4423 Hard Handover Optimization Methods
The optimization flow for the hard handover is similar to that of the soft handover The major differences are in the parameter optimization To optimize intra-frequency hard handovers you can properly reduce the Event 1D hysteresis and the time to trigger Event 1D according to the real radio environment to ensure timely handovers
Inter-frequency coverage is often applied to some special scenarios such as indoor coverage and tested through CQT The method of judging whether there is missed configuration of the inter-frequency neighboring cell is almost the same as that of the co-frequency neighboring cell when a call drop occurs the UE fails to measure or report the inter-frequency neighboring cell after the call drop the UE resides in the inter-frequency neighboring cell again
The common hard handover problems are
1 The handover is not prompt The common symptoms are frequent call drops in the hard handovers when the UE moves
Solutions
Increase the threshold of activating the compressing mode The compressing mode is usually activated before the inter-frequency handover or the inter-RAT handover and it is used to measure the quality of the inter-frequency or inter-RAT cell You can set a threshold of the CPICH RSCP or EcIo to activate the compressing mode And the RSCP is widely used
minus Requirements on setting the threshold of activating the compressing mode Before the cell quality becomes low enough to cause a call drop the signal of the target cell should be measured and reported and the handover should be performed
minus Requirement on setting the threshold of deactivating the compression mode Frequent activationdeactivation of the compression mode should be avoided
Increase CIOs of the inter-frequency cell pair
Reduce the threshold of triggering the target frequency handover under the inter-frequency coverage
2 There are pingpong handovers
Solution Increase the hard handover hysteresis and the time to trigger the event
ZTE Confidential Proprietary copy 2012 ZTE CORPORATION All rights reserved 43
UMTS KPI Optimization Analysis Guide Internal Use Only
443 Optimization of Inter-RAT Handovers
4431 Configuring Basic Inter-RAT Parameters
Most of the inter-RAT handover failures are caused by incomplete parameter configuration The following parameters need special attention
Complete RNC parameter configuration for the GSM neighboring cell The 2G system shall provide the 3G system with the correct radio parameters based on negotiation mdash MCC MNC LAC ID (CI) NCC BCC frequency band indicator (900 or 1800) and BCCH
Table 4-3 Parameters That 2G Shall Provide to 3G
MCC MNC LACIDCI
NCC BCCFrequency
band indicator
BCCH
460 2 202 193 0 0 900 102
Complete GSM BSC parameter configuration for the WCDMA neighboring cell The 3G system shall provide the 2G system with the correct radio parameters based on negotiation mdash MCC MNC LAC RNC ID cell ID (C_ID) downlink frequency scrambling code and RAC
Table 4-4 Parameters That 3G Shall Provide to 2G
MCC MNC LACRNC
IDCell IDC_ID
Downlink frequency
Scrambling code
RAC
460 3 20 18 51 10787 51 20
According to the current strategy of one-way inter-RAT handovers if the parameter configuration is complete one probable cause of the inter-RAT handover failure is that the handover is not prompt The common parameter adjustment is to increase CIO the threshold to activatedeactivate the compressing mode and the threshold to trigger the WCDMA-to-GSM handover at the same time
Call drops during the inter-RAT handovers between WCDMA and GSM may be caused by
minus Inconsistent data configuration at the GSM side and the WCDMA side after GSM modifies the configuration data but does not inform WCDMA
minus Missed configuration of neighboring cells which can be solved by the correct configuration of neighboring cells
minus Too fast signal changes
ZTE Confidential Proprietary copy 2012 ZTE CORPORATION All rights reserved 44
UMTS KPI Optimization Analysis Guide Internal Use Only
minus Pingpong reselection
minus Faults with the UE for example the UE fails to respond to the handover or report the inter-RAT measurement report
minus Changes of the best server during the physical channel reallocation
minus Wrong LAC configuration which can be located through data configuration check
ZTE Confidential Proprietary copy 2012 ZTE CORPORATION All rights reserved 45
UMTS KPI Optimization Analysis Guide Internal Use Only
4432 Inter-RAT Handover Optimization Flowchart
Figure 4-14 Inter-RAT handover optimization flowchart
ZTE Confidential Proprietary copy 2012 ZTE CORPORATION All rights reserved 46
UMTS KPI Optimization Analysis Guide Internal Use Only
Extract performance data
TOP Ncell filtering
Analyze a single cell
1 Check NE alarms
2 Associate emergencies
3 Compare parameter
configurations
4 Associate indicators
5 Locate the fault
comprehensive ly
Exist or not
Handle alarms
Solved or not
Yes
Yes
End
No
No
Exist or not
Handle emergencies
Solved or not
Yes
No
No
Exist or not
Correct wrong parameter
configurations
Solved or not
Yes
No
No
List related indicator counters
RTWPResource
limit indicators
Checkamp analysis of interference
Optimization analysis of
resource limitCounters related to inter-RAT handover failures
C301130667 C301130681C301130668 C301130682C301130669 C301130690C301130670 C301130691C301130671 C301130692C301130672 C301130693C301130673 C301130694C301130674 C301130696C301130675 C301130697C301130677 C301130698C301130678 C301130699C301130679 C301130700
C301130680
Solved or not
Yes
Yes
No
Drive Test+RNC signaling
trace
Yes
Counters related to inter-RAT handover
failures
Cell hand-inhand-out indicators
30049 3005030051 3005230053 30054
ZTE Confidential Proprietary copy 2012 ZTE CORPORATION All rights reserved 47
UMTS KPI Optimization Analysis Guide Internal Use Only
45 Optimization of Resource Indicators
The resource indicators directly reflect the system capacity Increasing subscribers will consume more system resources and some resources may be limited for example the code resource may be limited the TCP access request may be rejected and the CE resource usage rate may exceed the threshold Limited system resources have a negative influence on the whole-network indicators and the subscribersrsquo perception for example call drops may frequently happen and more TCP access requests may be rejected during the voice services
Table 4-5 Resource KPIs and Alarm Thresholds
Resource type KPI No and nameAlarm
threshold
TCP
C301320150 Number of rejected services DCH downlink TCP limit
50
PI30167 Average non-HS (SOA) (SOA)DPA TCP 40
PI30092 Maximum Cell TCP () 100
PI30093 Average Cell TCP 70
UL TrafficPI30029 Handover Blocking Rate 05
KPI RTWP (in busy hour) -98 dBm
Code
C301320153 Number of rejected services DCH no code
50
PI30205 Average Cell HSUPA Users 12
PI30172 Cell Average HSDPA Users 16
CE
PI301830006 Maximum use Ratio of Uplink NodeB CE
60
PI301830010 Maximum use Ratio of Downlink NodeB CE
60
ZTE Confidential Proprietary copy 2012 ZTE CORPORATION All rights reserved 48
UMTS KPI Optimization Analysis Guide Internal Use Only
451 Resource Indicator Optimization Flowchart
Figure 4-15 Resource indicator optimization flowchart
ZTE Confidential Proprietary copy 2012 ZTE CORPORATION All rights reserved 49
UMTS KPI Optimization Analysis Guide Internal Use Only
Extract performance data
TOP Ncell filtering
Analyze a single cell
1 Check NE alarms
2 Associate emergencies
3 Compare parameter
configurations
4 Associate indicators
5 Locate the fault
comprehensive ly
Exist or not
Handle alarms
Solved or not
Yes
是
End
No
No
Exist or not
Handle emergencies
Solved or not
Yes
No
No
Exist or not
Correct wrong parameter
configurations
Solved or not
Yes
No
No
List related indicator counters
Code resource indicators
CE resource indicators
TCPadmission
reject counter
C301320150
Solved or not
Yes
Yes
No
Drive Test+RNC signaling
trace
Yes
Counter related to TCP limit
Cell TX power
indicators
30090 3009130092 3009330166 3016730168 3016930170 30171
30163301643016530075
30223302243045030451
Yes
Yes
ZTE Confidential Proprietary copy 2012 ZTE CORPORATION All rights reserved 50
UMTS KPI Optimization Analysis Guide Internal Use Only
452 Code Resource Optimization
The statistics of Number of rejected services and DCH no code the average code resource usage rate and the number of the HSDPA subscribers can be used to judge whether the code resource in a cell is limited If the code resource is limited you can adjust the code resource allocation to alleviate the situation
Based on the system algorithm when Formula 1 is satisfied you can add an HS-PDSCH when Formula 2 is satisfied then an HS-PDSCH is deleted
Formula 1 OcuRateNoHspdsch + OcuRateHspdsch + DpchCodeHy + 32 lt= 512
Formula 2 OcuRateNoHspdsch + OcuRateHspdsch + CodeUptHyA gt 512
OcuRateHspdschHSPDSCH means the number of the codes of SF=512 blocked by the HS-PDSCH OcuRateNoHspdsch means the number of codes of SF=512 blocked by other channels DpchCodeHy means the number of codes of SF=512 reserved for the DPCH and CodeUptHyA is the threshold to decide whether to delete the HSPDSCH
Therefore to ensure the access of the R99 subscribers you can make some adjustment according to Table 4-6 when the code resource is limited though the HSDPA rate may decrease
Table 4-6 Adjusting Code Resource Allocation
AbbreviationParameter
nameRange
and stepCurrent value
Update value
Remark
DpchCodeHy DPCH Code Hysteresis
0512 16 28
To decrease the number of rejected services for DCH no code
CodeUptHyACode Update Hysteresis A
0512 16 28
To decrease the number of rejected services for DCH no code
453 Monitoring CE Resource
The CE resource is mainly monitored through the maximum UE uplinkdownlink usage rate If there is any problem you can solve it by controlling the load or adding more boards
ZTE Confidential Proprietary copy 2012 ZTE CORPORATION All rights reserved 51
UMTS KPI Optimization Analysis Guide Internal Use Only
454 Optimization of Power Control
4541 Monitoring and Optimizing Downlink Power Control
Limited TCP in busy hours will not only increase access failures and call drops in the local cell but also increase soft handover failures and call drops in the neighboring cells Number of rejected services and DCH downlink TCP limit are intuitive KPIs to judge whether TCP is limited Although limited uplink capacity and massive UE moves in the rush hours may also cause call drops the limited TCP is absolutely a key factor
Based on the system algorithm MinHsdpaPower (MinHspaPwrRto) + NoHsPower gtNode B if the safety threshold is used (MinHsdpaPower means the power reserved for HSPA) then it will activate the downlink rate downgrade algorithm flow for the congestion (lower the downlink DCH rate) Although the rate downgrade can ensure access of some subscribers it is an irregular action and will degrade the performance
455 Speeding up Rate Downgrade
Considering that the cells with heavy load reject more access requests you can speed up the rate downgrade during the resource congestion to release the resources as soon as possible and avoid call drops caused by access failures (this method is only applicable to the cells with many PS service users but not those with only CS service users) Table 4-7 is an example of the parameter modification for the rate downgrade
Table 4-7 Example of Parameter Modification for Rate Downgrade
Abbreviation Parameter nameRange and
stepCurrent value
Update value
Remark
UlDnMaxStg Maximum Number of Degraded Uplink Load Steps Every Time
[1 8] 1 2 Downgrade from 384 Kbps to 16 Kbps
DlDnMaxStg Maximum Number of Degraded Downlink Load Steps Every Time
[1 8] 1 3 Downgrade from 384 Kbps to 8 Kbps
456 Monitoring and Optimizing Uplink Capacity
Handover Blocking Rate and RTWP can reflect the uplink capacity of the cell Because interference may also increase RTWP this factor should be distinguished during the RTWP monitoring Another effective indicator is the voice service erl If a cell has over 20 erls in busy hours you should pay special attention to it
ZTE Confidential Proprietary copy 2012 ZTE CORPORATION All rights reserved 52
UMTS KPI Optimization Analysis Guide Internal Use Only
457 Optimization of Uplink Capacity at the Whole Network Level
Case The uplink capacity was limited in a large number of sites after the cutover and the symptoms are a sharp rise of RTWP and a high call drop rate during the rush hours
After the following parameters were modified as shown in Table 4-8 the problem was solved
Table 4-8 Example of Power Control Parameter Modification
AbbreviationParameter
nameRange
Current value
Update value
ULINITSIRUplink Initial SIR target (dB)
UL 34 K136 K signaling UL 122 K AMR
4-5 35
ULMAXSIRMaximum Uplink SIR target (dB)
UL 34 K136 K signaling UL 122 K AMR
15 10
UlSirTargDnStepUplink SIR Target Down Step Size (dB)
UL 34 K136 K signaling UL 122 K AMR
01 02
458 Optimization of Uplink Capacity for a Single Cell
A lot of optimization measures can be taken to bring down the rising RTWP However with increasing subscribers the capacity may still be limited in some area while further modification of SirTarget will obviously degrade the call quality of the whole network and undermine the subscribersrsquo perception In this case you can adjust the power control parameters for a single site that has heavy traffic in the following way add one set of DivPc parameters and use this set of parameters only for this site
Case Table 4-9 shows an example of the power control parameter modification After this modification the call drop rate in the site with heavy traffic decreased to one quarter of the original one
Table 4-9 Example of Power Control Parameter Modification for Heavy-Traffic Cell
SRVTYPE ULINITSIR ULMAXSIR ULMINSIR
0 35-gt15 100-gt35 20-gt10
104 40-gt20 150-gt50 05-gt0
28 35-gt15 100-gt35 05-gt0
50 60-gt20 150-gt50 20-gt0
54 60-gt20 150-gt50 20-gt0
ZTE Confidential Proprietary copy 2012 ZTE CORPORATION All rights reserved 53
UMTS KPI Optimization Analysis Guide Internal Use Only
4411 Soft Handover Optimization Flowchart
Figure 4-12 Soft handover optimization flowchart
ZTE Confidential Proprietary copy 2012 ZTE CORPORATION All rights reserved 34
UMTS KPI Optimization Analysis Guide Internal Use Only
Extract performance data
TOP Ncell filtering
Analyze a single cell
1 Check NE alarms
2 Associate emergencies
3 Compare parameter
configurations
4 Associate indicators
5 Locate the fault
comprehensive ly
Exist or not
Handle alarms
Solved or not
Yes
Yes
End
No
No
Exist or not
Handle emergencies
Solved or not
Yes
No
No
Exist or not
Correct wrong parameter
configurations
Solved or not
Yes
No
No
List related indicator counters
RTWPResource
limit indicators
Checkamp analysis of interference
Optimization analysis of
resource limitCounters related to intra-frequency
handover failures
C301391101 C301390593C301391102 C301390594C301391103 C301390595C301390586 C301390596C301390587 C301390597C301390588 C301390598C301390589 C301390599C301390590 C301390600C301390591 C301390601C301390592 C301390602
Solved or not
Yes
Yes
No
Drive Test+RNC signaling
trace
Yes
Counters related to soft handover
failures
30055 3005630057 3005830059 3006030061 30062
Cell hand-inhand-out indicators
ZTE Confidential Proprietary copy 2012 ZTE CORPORATION All rights reserved 35
UMTS KPI Optimization Analysis Guide Internal Use Only
4412 Checking Missed Neighboring Cell Configuration
Generally speaking most of the call drops at the beginning of the optimization are caused by missed neighboring cell configuration The following methods are often used to judge whether the call drops are caused by missed configuration of co-frequency neighboring cells
Observe the active set EcIo information recorded by the UE and the Best Server EcIo information recorded by the Scanner before the call drop If the former record is very bad but the latter record is very good then check whether the Best Server scrambling code recorded by the Scanner appears in the latest list of the neighboring cells under intra-frequency measurement control If it does not then the call drop is caused by missed neighboring cell configuration
If the UE re-accesses immediately after the call drop and the cell scrambling codes during the UE reaccess and those during the call drop are different then the call drop may also be caused by missed neighboring cell configuration You can confirm it through measurement control (look backwards from the message of the call drop event for the latest intra-frequency measurement control message and check the neighboring cell list of this message)
Some UE may report the Detected Set information If the corresponding scrambling code appears in the Detected Set information before the call drop then the call drop is caused by missed neighboring cell configuration
4413 Checking Pilot Pollution
Definition of pilot pollution Excessive strong pilot signals exist at a certain point but none of them is strong enough to be the best server To form pilot pollution the following points in this definition should be satisfied
Strong pilot signal The absolute pilot signal strength is used to judge whether the pilot signal is a strong one The pilot signal strength can be evaluated through the pilot RSCP If the pilot RSCP exceeds a threshold it is considered a strong pilot signal The formula is
AbsoluteRSCPThRSCPCPICH __ gt
Excessive The number of pilot signals is used to judge whether there are excessive pilot signals at a certain point If the number exceeds a threshold it is regarded that excessive pilot signals exist at this point The formula is
NThNumberCPICH gt_
None of them is strong enough to be the best server The relative strength of a pilot signal is a key factor in judging whether the pilot signal is strong enough Based on the above definition and formulae if the difference between the strength of the
ZTE Confidential Proprietary copy 2012 ZTE CORPORATION All rights reserved 36
UMTS KPI Optimization Analysis Guide Internal Use Only
strongest pilot signal and that of the )1( +NTh strongest pilot signal at this point is
less than a threshold it is regarded that there is no pilot signal strong enough to be the best server at this point The formula is
lativeRSCPthThbest ThRSCPCPICHRSCPCPICHN Re_)1( )__( ltminus +
According to the above description it is regarded that pilot pollution exists if the following conditions are both satisfied
The number of pilot signals that meet the condition
AbsoluteRSCPThRSCPCPICH __ gt is more than NTh
lativeRSCPthThbest ThRSCPCPICHRSCPCPICHN Re_)1( )__( ltminus +
For example during the network optimization suppose
dBmTh AbsoluteRSCP 95_ minus= 3=NTh and dBTh lativeRSCP 5Re_ = if the following
conditions are both satisfied then it is regarded that pilot pollution exists
The number of the pilot signals that meet the condition
dBmRSCPCPICH 95_ minusgt is more than 3
dBRSCPCPICHRSCPCPICH thbest 5)__( 4 ltminus
4414 Adjusting Soft Handover Algorithm Parameters
You can solve the following kinds of problems by adjusting handover algorithm parameters
1 The handover is not prompt
From the perspective of the CS service signaling flow the symptom of this problem is that the UE cannot receive Active Set Update (physical channel reallocation in the case of the intra-frequency hard handover) because after the UE reports the measurement report the source cell has a fast reduction in EcIo When the RNC sends Active Set Update the UE has closed the transmitter due to the loss of downlink synchronization Viewed from the UE side it cannot receive Active Set Update In the PS services if the UE cannot receive Active Set Update or TRB resets before the handover the handover will also fail
From the perspective of signals the following phenomena may accompany this problem
ZTE Confidential Proprietary copy 2012 ZTE CORPORATION All rights reserved 37
UMTS KPI Optimization Analysis Guide Internal Use Only
minus Corner effect EcIo of the source cell decreases drastically and EcIo of the target cell increases sharply (very high when it appears)
minus Fast fading EcIo of the source cell decreases quickly for a while and then increases and EcIo of the target cell increases for a short while
2 Pingpong handovers The following phenomena may accompany this problem
The best server changes quickly Two or more cells take turns to be the best server But as the best server none of the cells can last long though they has good RSCPs and EcIos
There is no best server There are multiple cells Their RSCPs are normal and similar to each other But EcIo of every cell is very bad
From the perspective of the signaling flow Event 1A is reported immediately after one cell is deleted Because the UE cannot receive Active Set Update from the RNC the handover fails
4415 Equipment Malfunctions
First check the alarm console to see whether there are abnormal alarms and analyze the message traces at the same time Find out in which step the soft handover fails Check the failure message and contact the local product maintaining engineer to confirm whether the equipment has malfunctions
4416 Solutions
Corresponding adjustments should be taken for the confirmed problems
Handover failures caused by pilot pollution Adjust the engineering parameters of a certain antenna to set this antenna as the best server in this interfered location If the power of one of its sectors is reduced then Io of the pilot pollution area will decrease even if the powers of other pilots are not adjusted EcIo will also increase Thereby the EcIo differences with other scrambling codes in the active set will become larger and pilot pollution will be eliminated Through a lot of research ZTE has proved that the reduction in the pilot transmit power will not change cell capacity greatly If condition allows new base stations can be added to cover this area
Equipment malfunctions Consult the customer service engineers and ask them to help check whether there are alarms and whether the transport layer is abnormal If there are alarms coordinate with the customer service engineers and the engineering personnel to solve the problems
Call drops because the handovers are not prompt
ZTE Confidential Proprietary copy 2012 ZTE CORPORATION All rights reserved 38
UMTS KPI Optimization Analysis Guide Internal Use Only
minus Adjust the antenna to expand the handover zone
minus Configure the Event 1A handover parameters to make the handover easier to happen
minus Increase CIO to make the handover happen earlier in the target cell The sum of CIO and the actually measured value is used for judging the UE events including the UE intra-frequency handover CIO helps shift the cell border in the handover algorithm If CIO is configured with a larger value the handover will be easier to happen and there will be more UE in the soft-handover status but more resources will be occupied If CIO is configured with a smaller value the soft handover will be more difficult to happen and the receiving quality may be impaired A CIO of about 5dB is quite good for eliminating the fast fading and the corner effect but this configuration has some side effects such as the increase of handover proportion
Call drops caused by pingpong handovers Adjust the antenna to form a best server in its coverage zone or set the Event 1B handover parameters (increase the threshold of Event 1B the Event 1B hysteresis or the time to trigger Event 1B) to increase the difficulty in deleting the active set
442 Optimization of Hard Handovers
4421 Classification of Hard handovers
Hard handovers mainly fall into two classifications
Intra-frequency hard handovers The intra-frequency hard handover is triggered only when the intra-frequency softsofter handover cannot be performed and it is applicable to the following circumstances
minus Inter-RNC intra-frequency cell handovers when there is no Iur interface
minus Insufficient Iur interface resources though there is the Iur interface
minus Handovers controlled by the threshold of the PS service rate in the handover cell
The intra-frequency softsofter handovers can not be performed (intra-frequency hard handover should be triggered) in the following scenarios
minus When the intra-frequency handover happens the UE is using the transmit diversity in the active set cell but the target cell does not support the transmit diversity
minus The intra-frequency measurement report does not contain OFF and TM of the
ZTE Confidential Proprietary copy 2012 ZTE CORPORATION All rights reserved 39
UMTS KPI Optimization Analysis Guide Internal Use Only
target cell
minus When the intra-frequency handover happens between RNCs the Iur interface is unavailable
minus The UE performs the multiuser detection in the active set cell but the target cell does not support the multiuser detection
minus The target cell and the original cell belong to different classifications (The cells of R99 R5+R99 and R6+R5+R99 belong to the same classification while the cells of R5 and R6+R5 belong to another classification)
Inter-frequency hard handovers The inter-frequency hard handover means a UE connection is handed over from a cell of a UTRAN frequency to a cell of another frequency Many factors including the radio quality the load and the speed of the moving UE may trigger inter-frequency hard handovers
For example the radio quality triggers the inter-frequency hard handover in the following way
When the quality of the UE radio frequency becomes lower the inter-frequency measurement will be triggered and according to the measurement result the UE connection will be handed over to a better frequency
ZTE Confidential Proprietary copy 2012 ZTE CORPORATION All rights reserved 40
UMTS KPI Optimization Analysis Guide Internal Use Only
4422 Hard Handover Optimization Flowchart
Figure 4-13 Hard handover optimization flowchart
ZTE Confidential Proprietary copy 2012 ZTE CORPORATION All rights reserved 41
UMTS KPI Optimization Analysis Guide Internal Use Only
Extract performance data
TOP Ncell filtering
Analyze a single cell
1 Check NE alarms
2 Associate emergencies
3 Compare parameter
configurations
4 Associate indicators
5 Locate the fault
comprehensive ly
Exist or not
Handle alarms
Solved or not
Yes
Yes
End
No
Exist or not
Handle emergencies
Solved or not
YesNo
Exist or not
Correct wrong parameter
configurations
Solved or not
Yes
No
No
List related indicator counters
RTWPResource
limit indicators
Checkamp analysis of interference
Optimization analysis of
resource limit
Counters related to inter-frequency handover failures
C301110489 C301110516C301110499 C301110517C301110500 C301110518C301110501 C301110519C301110502 C301110520C301110503 C301110521C301110504 C301110522C301110505 C301110523
Solved or not
Yes
Yes
No
Drive Test+RNC signaling
trace
Yes
Counters related to hard handover
failures
30041 3004230043 3004430045 3004630047 30048
Cell hand-inhand-out indicators
NoNo
ZTE Confidential Proprietary copy 2012 ZTE CORPORATION All rights reserved 42
UMTS KPI Optimization Analysis Guide Internal Use Only
4423 Hard Handover Optimization Methods
The optimization flow for the hard handover is similar to that of the soft handover The major differences are in the parameter optimization To optimize intra-frequency hard handovers you can properly reduce the Event 1D hysteresis and the time to trigger Event 1D according to the real radio environment to ensure timely handovers
Inter-frequency coverage is often applied to some special scenarios such as indoor coverage and tested through CQT The method of judging whether there is missed configuration of the inter-frequency neighboring cell is almost the same as that of the co-frequency neighboring cell when a call drop occurs the UE fails to measure or report the inter-frequency neighboring cell after the call drop the UE resides in the inter-frequency neighboring cell again
The common hard handover problems are
1 The handover is not prompt The common symptoms are frequent call drops in the hard handovers when the UE moves
Solutions
Increase the threshold of activating the compressing mode The compressing mode is usually activated before the inter-frequency handover or the inter-RAT handover and it is used to measure the quality of the inter-frequency or inter-RAT cell You can set a threshold of the CPICH RSCP or EcIo to activate the compressing mode And the RSCP is widely used
minus Requirements on setting the threshold of activating the compressing mode Before the cell quality becomes low enough to cause a call drop the signal of the target cell should be measured and reported and the handover should be performed
minus Requirement on setting the threshold of deactivating the compression mode Frequent activationdeactivation of the compression mode should be avoided
Increase CIOs of the inter-frequency cell pair
Reduce the threshold of triggering the target frequency handover under the inter-frequency coverage
2 There are pingpong handovers
Solution Increase the hard handover hysteresis and the time to trigger the event
ZTE Confidential Proprietary copy 2012 ZTE CORPORATION All rights reserved 43
UMTS KPI Optimization Analysis Guide Internal Use Only
443 Optimization of Inter-RAT Handovers
4431 Configuring Basic Inter-RAT Parameters
Most of the inter-RAT handover failures are caused by incomplete parameter configuration The following parameters need special attention
Complete RNC parameter configuration for the GSM neighboring cell The 2G system shall provide the 3G system with the correct radio parameters based on negotiation mdash MCC MNC LAC ID (CI) NCC BCC frequency band indicator (900 or 1800) and BCCH
Table 4-3 Parameters That 2G Shall Provide to 3G
MCC MNC LACIDCI
NCC BCCFrequency
band indicator
BCCH
460 2 202 193 0 0 900 102
Complete GSM BSC parameter configuration for the WCDMA neighboring cell The 3G system shall provide the 2G system with the correct radio parameters based on negotiation mdash MCC MNC LAC RNC ID cell ID (C_ID) downlink frequency scrambling code and RAC
Table 4-4 Parameters That 3G Shall Provide to 2G
MCC MNC LACRNC
IDCell IDC_ID
Downlink frequency
Scrambling code
RAC
460 3 20 18 51 10787 51 20
According to the current strategy of one-way inter-RAT handovers if the parameter configuration is complete one probable cause of the inter-RAT handover failure is that the handover is not prompt The common parameter adjustment is to increase CIO the threshold to activatedeactivate the compressing mode and the threshold to trigger the WCDMA-to-GSM handover at the same time
Call drops during the inter-RAT handovers between WCDMA and GSM may be caused by
minus Inconsistent data configuration at the GSM side and the WCDMA side after GSM modifies the configuration data but does not inform WCDMA
minus Missed configuration of neighboring cells which can be solved by the correct configuration of neighboring cells
minus Too fast signal changes
ZTE Confidential Proprietary copy 2012 ZTE CORPORATION All rights reserved 44
UMTS KPI Optimization Analysis Guide Internal Use Only
minus Pingpong reselection
minus Faults with the UE for example the UE fails to respond to the handover or report the inter-RAT measurement report
minus Changes of the best server during the physical channel reallocation
minus Wrong LAC configuration which can be located through data configuration check
ZTE Confidential Proprietary copy 2012 ZTE CORPORATION All rights reserved 45
UMTS KPI Optimization Analysis Guide Internal Use Only
4432 Inter-RAT Handover Optimization Flowchart
Figure 4-14 Inter-RAT handover optimization flowchart
ZTE Confidential Proprietary copy 2012 ZTE CORPORATION All rights reserved 46
UMTS KPI Optimization Analysis Guide Internal Use Only
Extract performance data
TOP Ncell filtering
Analyze a single cell
1 Check NE alarms
2 Associate emergencies
3 Compare parameter
configurations
4 Associate indicators
5 Locate the fault
comprehensive ly
Exist or not
Handle alarms
Solved or not
Yes
Yes
End
No
No
Exist or not
Handle emergencies
Solved or not
Yes
No
No
Exist or not
Correct wrong parameter
configurations
Solved or not
Yes
No
No
List related indicator counters
RTWPResource
limit indicators
Checkamp analysis of interference
Optimization analysis of
resource limitCounters related to inter-RAT handover failures
C301130667 C301130681C301130668 C301130682C301130669 C301130690C301130670 C301130691C301130671 C301130692C301130672 C301130693C301130673 C301130694C301130674 C301130696C301130675 C301130697C301130677 C301130698C301130678 C301130699C301130679 C301130700
C301130680
Solved or not
Yes
Yes
No
Drive Test+RNC signaling
trace
Yes
Counters related to inter-RAT handover
failures
Cell hand-inhand-out indicators
30049 3005030051 3005230053 30054
ZTE Confidential Proprietary copy 2012 ZTE CORPORATION All rights reserved 47
UMTS KPI Optimization Analysis Guide Internal Use Only
45 Optimization of Resource Indicators
The resource indicators directly reflect the system capacity Increasing subscribers will consume more system resources and some resources may be limited for example the code resource may be limited the TCP access request may be rejected and the CE resource usage rate may exceed the threshold Limited system resources have a negative influence on the whole-network indicators and the subscribersrsquo perception for example call drops may frequently happen and more TCP access requests may be rejected during the voice services
Table 4-5 Resource KPIs and Alarm Thresholds
Resource type KPI No and nameAlarm
threshold
TCP
C301320150 Number of rejected services DCH downlink TCP limit
50
PI30167 Average non-HS (SOA) (SOA)DPA TCP 40
PI30092 Maximum Cell TCP () 100
PI30093 Average Cell TCP 70
UL TrafficPI30029 Handover Blocking Rate 05
KPI RTWP (in busy hour) -98 dBm
Code
C301320153 Number of rejected services DCH no code
50
PI30205 Average Cell HSUPA Users 12
PI30172 Cell Average HSDPA Users 16
CE
PI301830006 Maximum use Ratio of Uplink NodeB CE
60
PI301830010 Maximum use Ratio of Downlink NodeB CE
60
ZTE Confidential Proprietary copy 2012 ZTE CORPORATION All rights reserved 48
UMTS KPI Optimization Analysis Guide Internal Use Only
451 Resource Indicator Optimization Flowchart
Figure 4-15 Resource indicator optimization flowchart
ZTE Confidential Proprietary copy 2012 ZTE CORPORATION All rights reserved 49
UMTS KPI Optimization Analysis Guide Internal Use Only
Extract performance data
TOP Ncell filtering
Analyze a single cell
1 Check NE alarms
2 Associate emergencies
3 Compare parameter
configurations
4 Associate indicators
5 Locate the fault
comprehensive ly
Exist or not
Handle alarms
Solved or not
Yes
是
End
No
No
Exist or not
Handle emergencies
Solved or not
Yes
No
No
Exist or not
Correct wrong parameter
configurations
Solved or not
Yes
No
No
List related indicator counters
Code resource indicators
CE resource indicators
TCPadmission
reject counter
C301320150
Solved or not
Yes
Yes
No
Drive Test+RNC signaling
trace
Yes
Counter related to TCP limit
Cell TX power
indicators
30090 3009130092 3009330166 3016730168 3016930170 30171
30163301643016530075
30223302243045030451
Yes
Yes
ZTE Confidential Proprietary copy 2012 ZTE CORPORATION All rights reserved 50
UMTS KPI Optimization Analysis Guide Internal Use Only
452 Code Resource Optimization
The statistics of Number of rejected services and DCH no code the average code resource usage rate and the number of the HSDPA subscribers can be used to judge whether the code resource in a cell is limited If the code resource is limited you can adjust the code resource allocation to alleviate the situation
Based on the system algorithm when Formula 1 is satisfied you can add an HS-PDSCH when Formula 2 is satisfied then an HS-PDSCH is deleted
Formula 1 OcuRateNoHspdsch + OcuRateHspdsch + DpchCodeHy + 32 lt= 512
Formula 2 OcuRateNoHspdsch + OcuRateHspdsch + CodeUptHyA gt 512
OcuRateHspdschHSPDSCH means the number of the codes of SF=512 blocked by the HS-PDSCH OcuRateNoHspdsch means the number of codes of SF=512 blocked by other channels DpchCodeHy means the number of codes of SF=512 reserved for the DPCH and CodeUptHyA is the threshold to decide whether to delete the HSPDSCH
Therefore to ensure the access of the R99 subscribers you can make some adjustment according to Table 4-6 when the code resource is limited though the HSDPA rate may decrease
Table 4-6 Adjusting Code Resource Allocation
AbbreviationParameter
nameRange
and stepCurrent value
Update value
Remark
DpchCodeHy DPCH Code Hysteresis
0512 16 28
To decrease the number of rejected services for DCH no code
CodeUptHyACode Update Hysteresis A
0512 16 28
To decrease the number of rejected services for DCH no code
453 Monitoring CE Resource
The CE resource is mainly monitored through the maximum UE uplinkdownlink usage rate If there is any problem you can solve it by controlling the load or adding more boards
ZTE Confidential Proprietary copy 2012 ZTE CORPORATION All rights reserved 51
UMTS KPI Optimization Analysis Guide Internal Use Only
454 Optimization of Power Control
4541 Monitoring and Optimizing Downlink Power Control
Limited TCP in busy hours will not only increase access failures and call drops in the local cell but also increase soft handover failures and call drops in the neighboring cells Number of rejected services and DCH downlink TCP limit are intuitive KPIs to judge whether TCP is limited Although limited uplink capacity and massive UE moves in the rush hours may also cause call drops the limited TCP is absolutely a key factor
Based on the system algorithm MinHsdpaPower (MinHspaPwrRto) + NoHsPower gtNode B if the safety threshold is used (MinHsdpaPower means the power reserved for HSPA) then it will activate the downlink rate downgrade algorithm flow for the congestion (lower the downlink DCH rate) Although the rate downgrade can ensure access of some subscribers it is an irregular action and will degrade the performance
455 Speeding up Rate Downgrade
Considering that the cells with heavy load reject more access requests you can speed up the rate downgrade during the resource congestion to release the resources as soon as possible and avoid call drops caused by access failures (this method is only applicable to the cells with many PS service users but not those with only CS service users) Table 4-7 is an example of the parameter modification for the rate downgrade
Table 4-7 Example of Parameter Modification for Rate Downgrade
Abbreviation Parameter nameRange and
stepCurrent value
Update value
Remark
UlDnMaxStg Maximum Number of Degraded Uplink Load Steps Every Time
[1 8] 1 2 Downgrade from 384 Kbps to 16 Kbps
DlDnMaxStg Maximum Number of Degraded Downlink Load Steps Every Time
[1 8] 1 3 Downgrade from 384 Kbps to 8 Kbps
456 Monitoring and Optimizing Uplink Capacity
Handover Blocking Rate and RTWP can reflect the uplink capacity of the cell Because interference may also increase RTWP this factor should be distinguished during the RTWP monitoring Another effective indicator is the voice service erl If a cell has over 20 erls in busy hours you should pay special attention to it
ZTE Confidential Proprietary copy 2012 ZTE CORPORATION All rights reserved 52
UMTS KPI Optimization Analysis Guide Internal Use Only
457 Optimization of Uplink Capacity at the Whole Network Level
Case The uplink capacity was limited in a large number of sites after the cutover and the symptoms are a sharp rise of RTWP and a high call drop rate during the rush hours
After the following parameters were modified as shown in Table 4-8 the problem was solved
Table 4-8 Example of Power Control Parameter Modification
AbbreviationParameter
nameRange
Current value
Update value
ULINITSIRUplink Initial SIR target (dB)
UL 34 K136 K signaling UL 122 K AMR
4-5 35
ULMAXSIRMaximum Uplink SIR target (dB)
UL 34 K136 K signaling UL 122 K AMR
15 10
UlSirTargDnStepUplink SIR Target Down Step Size (dB)
UL 34 K136 K signaling UL 122 K AMR
01 02
458 Optimization of Uplink Capacity for a Single Cell
A lot of optimization measures can be taken to bring down the rising RTWP However with increasing subscribers the capacity may still be limited in some area while further modification of SirTarget will obviously degrade the call quality of the whole network and undermine the subscribersrsquo perception In this case you can adjust the power control parameters for a single site that has heavy traffic in the following way add one set of DivPc parameters and use this set of parameters only for this site
Case Table 4-9 shows an example of the power control parameter modification After this modification the call drop rate in the site with heavy traffic decreased to one quarter of the original one
Table 4-9 Example of Power Control Parameter Modification for Heavy-Traffic Cell
SRVTYPE ULINITSIR ULMAXSIR ULMINSIR
0 35-gt15 100-gt35 20-gt10
104 40-gt20 150-gt50 05-gt0
28 35-gt15 100-gt35 05-gt0
50 60-gt20 150-gt50 20-gt0
54 60-gt20 150-gt50 20-gt0
ZTE Confidential Proprietary copy 2012 ZTE CORPORATION All rights reserved 53
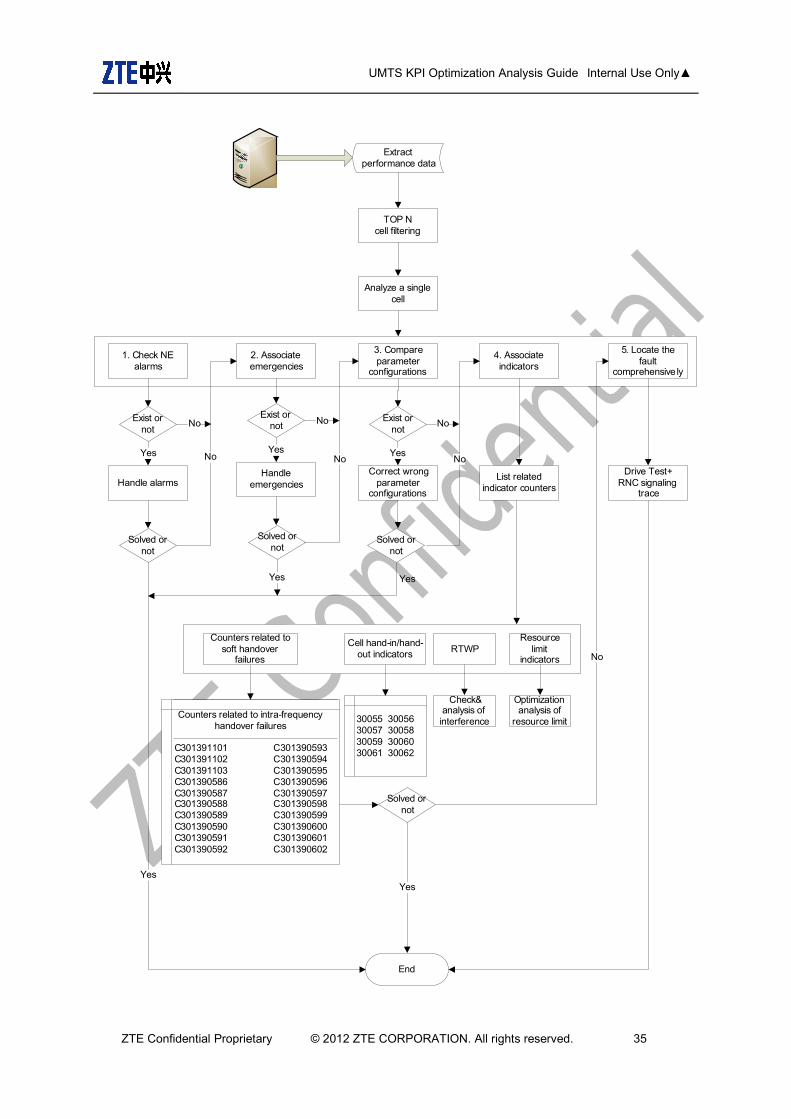
UMTS KPI Optimization Analysis Guide Internal Use Only
Extract performance data
TOP Ncell filtering
Analyze a single cell
1 Check NE alarms
2 Associate emergencies
3 Compare parameter
configurations
4 Associate indicators
5 Locate the fault
comprehensive ly
Exist or not
Handle alarms
Solved or not
Yes
Yes
End
No
No
Exist or not
Handle emergencies
Solved or not
Yes
No
No
Exist or not
Correct wrong parameter
configurations
Solved or not
Yes
No
No
List related indicator counters
RTWPResource
limit indicators
Checkamp analysis of interference
Optimization analysis of
resource limitCounters related to intra-frequency
handover failures
C301391101 C301390593C301391102 C301390594C301391103 C301390595C301390586 C301390596C301390587 C301390597C301390588 C301390598C301390589 C301390599C301390590 C301390600C301390591 C301390601C301390592 C301390602
Solved or not
Yes
Yes
No
Drive Test+RNC signaling
trace
Yes
Counters related to soft handover
failures
30055 3005630057 3005830059 3006030061 30062
Cell hand-inhand-out indicators
ZTE Confidential Proprietary copy 2012 ZTE CORPORATION All rights reserved 35
UMTS KPI Optimization Analysis Guide Internal Use Only
4412 Checking Missed Neighboring Cell Configuration
Generally speaking most of the call drops at the beginning of the optimization are caused by missed neighboring cell configuration The following methods are often used to judge whether the call drops are caused by missed configuration of co-frequency neighboring cells
Observe the active set EcIo information recorded by the UE and the Best Server EcIo information recorded by the Scanner before the call drop If the former record is very bad but the latter record is very good then check whether the Best Server scrambling code recorded by the Scanner appears in the latest list of the neighboring cells under intra-frequency measurement control If it does not then the call drop is caused by missed neighboring cell configuration
If the UE re-accesses immediately after the call drop and the cell scrambling codes during the UE reaccess and those during the call drop are different then the call drop may also be caused by missed neighboring cell configuration You can confirm it through measurement control (look backwards from the message of the call drop event for the latest intra-frequency measurement control message and check the neighboring cell list of this message)
Some UE may report the Detected Set information If the corresponding scrambling code appears in the Detected Set information before the call drop then the call drop is caused by missed neighboring cell configuration
4413 Checking Pilot Pollution
Definition of pilot pollution Excessive strong pilot signals exist at a certain point but none of them is strong enough to be the best server To form pilot pollution the following points in this definition should be satisfied
Strong pilot signal The absolute pilot signal strength is used to judge whether the pilot signal is a strong one The pilot signal strength can be evaluated through the pilot RSCP If the pilot RSCP exceeds a threshold it is considered a strong pilot signal The formula is
AbsoluteRSCPThRSCPCPICH __ gt
Excessive The number of pilot signals is used to judge whether there are excessive pilot signals at a certain point If the number exceeds a threshold it is regarded that excessive pilot signals exist at this point The formula is
NThNumberCPICH gt_
None of them is strong enough to be the best server The relative strength of a pilot signal is a key factor in judging whether the pilot signal is strong enough Based on the above definition and formulae if the difference between the strength of the
ZTE Confidential Proprietary copy 2012 ZTE CORPORATION All rights reserved 36
UMTS KPI Optimization Analysis Guide Internal Use Only
strongest pilot signal and that of the )1( +NTh strongest pilot signal at this point is
less than a threshold it is regarded that there is no pilot signal strong enough to be the best server at this point The formula is
lativeRSCPthThbest ThRSCPCPICHRSCPCPICHN Re_)1( )__( ltminus +
According to the above description it is regarded that pilot pollution exists if the following conditions are both satisfied
The number of pilot signals that meet the condition
AbsoluteRSCPThRSCPCPICH __ gt is more than NTh
lativeRSCPthThbest ThRSCPCPICHRSCPCPICHN Re_)1( )__( ltminus +
For example during the network optimization suppose
dBmTh AbsoluteRSCP 95_ minus= 3=NTh and dBTh lativeRSCP 5Re_ = if the following
conditions are both satisfied then it is regarded that pilot pollution exists
The number of the pilot signals that meet the condition
dBmRSCPCPICH 95_ minusgt is more than 3
dBRSCPCPICHRSCPCPICH thbest 5)__( 4 ltminus
4414 Adjusting Soft Handover Algorithm Parameters
You can solve the following kinds of problems by adjusting handover algorithm parameters
1 The handover is not prompt
From the perspective of the CS service signaling flow the symptom of this problem is that the UE cannot receive Active Set Update (physical channel reallocation in the case of the intra-frequency hard handover) because after the UE reports the measurement report the source cell has a fast reduction in EcIo When the RNC sends Active Set Update the UE has closed the transmitter due to the loss of downlink synchronization Viewed from the UE side it cannot receive Active Set Update In the PS services if the UE cannot receive Active Set Update or TRB resets before the handover the handover will also fail
From the perspective of signals the following phenomena may accompany this problem
ZTE Confidential Proprietary copy 2012 ZTE CORPORATION All rights reserved 37
UMTS KPI Optimization Analysis Guide Internal Use Only
minus Corner effect EcIo of the source cell decreases drastically and EcIo of the target cell increases sharply (very high when it appears)
minus Fast fading EcIo of the source cell decreases quickly for a while and then increases and EcIo of the target cell increases for a short while
2 Pingpong handovers The following phenomena may accompany this problem
The best server changes quickly Two or more cells take turns to be the best server But as the best server none of the cells can last long though they has good RSCPs and EcIos
There is no best server There are multiple cells Their RSCPs are normal and similar to each other But EcIo of every cell is very bad
From the perspective of the signaling flow Event 1A is reported immediately after one cell is deleted Because the UE cannot receive Active Set Update from the RNC the handover fails
4415 Equipment Malfunctions
First check the alarm console to see whether there are abnormal alarms and analyze the message traces at the same time Find out in which step the soft handover fails Check the failure message and contact the local product maintaining engineer to confirm whether the equipment has malfunctions
4416 Solutions
Corresponding adjustments should be taken for the confirmed problems
Handover failures caused by pilot pollution Adjust the engineering parameters of a certain antenna to set this antenna as the best server in this interfered location If the power of one of its sectors is reduced then Io of the pilot pollution area will decrease even if the powers of other pilots are not adjusted EcIo will also increase Thereby the EcIo differences with other scrambling codes in the active set will become larger and pilot pollution will be eliminated Through a lot of research ZTE has proved that the reduction in the pilot transmit power will not change cell capacity greatly If condition allows new base stations can be added to cover this area
Equipment malfunctions Consult the customer service engineers and ask them to help check whether there are alarms and whether the transport layer is abnormal If there are alarms coordinate with the customer service engineers and the engineering personnel to solve the problems
Call drops because the handovers are not prompt
ZTE Confidential Proprietary copy 2012 ZTE CORPORATION All rights reserved 38
UMTS KPI Optimization Analysis Guide Internal Use Only
minus Adjust the antenna to expand the handover zone
minus Configure the Event 1A handover parameters to make the handover easier to happen
minus Increase CIO to make the handover happen earlier in the target cell The sum of CIO and the actually measured value is used for judging the UE events including the UE intra-frequency handover CIO helps shift the cell border in the handover algorithm If CIO is configured with a larger value the handover will be easier to happen and there will be more UE in the soft-handover status but more resources will be occupied If CIO is configured with a smaller value the soft handover will be more difficult to happen and the receiving quality may be impaired A CIO of about 5dB is quite good for eliminating the fast fading and the corner effect but this configuration has some side effects such as the increase of handover proportion
Call drops caused by pingpong handovers Adjust the antenna to form a best server in its coverage zone or set the Event 1B handover parameters (increase the threshold of Event 1B the Event 1B hysteresis or the time to trigger Event 1B) to increase the difficulty in deleting the active set
442 Optimization of Hard Handovers
4421 Classification of Hard handovers
Hard handovers mainly fall into two classifications
Intra-frequency hard handovers The intra-frequency hard handover is triggered only when the intra-frequency softsofter handover cannot be performed and it is applicable to the following circumstances
minus Inter-RNC intra-frequency cell handovers when there is no Iur interface
minus Insufficient Iur interface resources though there is the Iur interface
minus Handovers controlled by the threshold of the PS service rate in the handover cell
The intra-frequency softsofter handovers can not be performed (intra-frequency hard handover should be triggered) in the following scenarios
minus When the intra-frequency handover happens the UE is using the transmit diversity in the active set cell but the target cell does not support the transmit diversity
minus The intra-frequency measurement report does not contain OFF and TM of the
ZTE Confidential Proprietary copy 2012 ZTE CORPORATION All rights reserved 39
UMTS KPI Optimization Analysis Guide Internal Use Only
target cell
minus When the intra-frequency handover happens between RNCs the Iur interface is unavailable
minus The UE performs the multiuser detection in the active set cell but the target cell does not support the multiuser detection
minus The target cell and the original cell belong to different classifications (The cells of R99 R5+R99 and R6+R5+R99 belong to the same classification while the cells of R5 and R6+R5 belong to another classification)
Inter-frequency hard handovers The inter-frequency hard handover means a UE connection is handed over from a cell of a UTRAN frequency to a cell of another frequency Many factors including the radio quality the load and the speed of the moving UE may trigger inter-frequency hard handovers
For example the radio quality triggers the inter-frequency hard handover in the following way
When the quality of the UE radio frequency becomes lower the inter-frequency measurement will be triggered and according to the measurement result the UE connection will be handed over to a better frequency
ZTE Confidential Proprietary copy 2012 ZTE CORPORATION All rights reserved 40
UMTS KPI Optimization Analysis Guide Internal Use Only
4422 Hard Handover Optimization Flowchart
Figure 4-13 Hard handover optimization flowchart
ZTE Confidential Proprietary copy 2012 ZTE CORPORATION All rights reserved 41
UMTS KPI Optimization Analysis Guide Internal Use Only
Extract performance data
TOP Ncell filtering
Analyze a single cell
1 Check NE alarms
2 Associate emergencies
3 Compare parameter
configurations
4 Associate indicators
5 Locate the fault
comprehensive ly
Exist or not
Handle alarms
Solved or not
Yes
Yes
End
No
Exist or not
Handle emergencies
Solved or not
YesNo
Exist or not
Correct wrong parameter
configurations
Solved or not
Yes
No
No
List related indicator counters
RTWPResource
limit indicators
Checkamp analysis of interference
Optimization analysis of
resource limit
Counters related to inter-frequency handover failures
C301110489 C301110516C301110499 C301110517C301110500 C301110518C301110501 C301110519C301110502 C301110520C301110503 C301110521C301110504 C301110522C301110505 C301110523
Solved or not
Yes
Yes
No
Drive Test+RNC signaling
trace
Yes
Counters related to hard handover
failures
30041 3004230043 3004430045 3004630047 30048
Cell hand-inhand-out indicators
NoNo
ZTE Confidential Proprietary copy 2012 ZTE CORPORATION All rights reserved 42
UMTS KPI Optimization Analysis Guide Internal Use Only
4423 Hard Handover Optimization Methods
The optimization flow for the hard handover is similar to that of the soft handover The major differences are in the parameter optimization To optimize intra-frequency hard handovers you can properly reduce the Event 1D hysteresis and the time to trigger Event 1D according to the real radio environment to ensure timely handovers
Inter-frequency coverage is often applied to some special scenarios such as indoor coverage and tested through CQT The method of judging whether there is missed configuration of the inter-frequency neighboring cell is almost the same as that of the co-frequency neighboring cell when a call drop occurs the UE fails to measure or report the inter-frequency neighboring cell after the call drop the UE resides in the inter-frequency neighboring cell again
The common hard handover problems are
1 The handover is not prompt The common symptoms are frequent call drops in the hard handovers when the UE moves
Solutions
Increase the threshold of activating the compressing mode The compressing mode is usually activated before the inter-frequency handover or the inter-RAT handover and it is used to measure the quality of the inter-frequency or inter-RAT cell You can set a threshold of the CPICH RSCP or EcIo to activate the compressing mode And the RSCP is widely used
minus Requirements on setting the threshold of activating the compressing mode Before the cell quality becomes low enough to cause a call drop the signal of the target cell should be measured and reported and the handover should be performed
minus Requirement on setting the threshold of deactivating the compression mode Frequent activationdeactivation of the compression mode should be avoided
Increase CIOs of the inter-frequency cell pair
Reduce the threshold of triggering the target frequency handover under the inter-frequency coverage
2 There are pingpong handovers
Solution Increase the hard handover hysteresis and the time to trigger the event
ZTE Confidential Proprietary copy 2012 ZTE CORPORATION All rights reserved 43
UMTS KPI Optimization Analysis Guide Internal Use Only
443 Optimization of Inter-RAT Handovers
4431 Configuring Basic Inter-RAT Parameters
Most of the inter-RAT handover failures are caused by incomplete parameter configuration The following parameters need special attention
Complete RNC parameter configuration for the GSM neighboring cell The 2G system shall provide the 3G system with the correct radio parameters based on negotiation mdash MCC MNC LAC ID (CI) NCC BCC frequency band indicator (900 or 1800) and BCCH
Table 4-3 Parameters That 2G Shall Provide to 3G
MCC MNC LACIDCI
NCC BCCFrequency
band indicator
BCCH
460 2 202 193 0 0 900 102
Complete GSM BSC parameter configuration for the WCDMA neighboring cell The 3G system shall provide the 2G system with the correct radio parameters based on negotiation mdash MCC MNC LAC RNC ID cell ID (C_ID) downlink frequency scrambling code and RAC
Table 4-4 Parameters That 3G Shall Provide to 2G
MCC MNC LACRNC
IDCell IDC_ID
Downlink frequency
Scrambling code
RAC
460 3 20 18 51 10787 51 20
According to the current strategy of one-way inter-RAT handovers if the parameter configuration is complete one probable cause of the inter-RAT handover failure is that the handover is not prompt The common parameter adjustment is to increase CIO the threshold to activatedeactivate the compressing mode and the threshold to trigger the WCDMA-to-GSM handover at the same time
Call drops during the inter-RAT handovers between WCDMA and GSM may be caused by
minus Inconsistent data configuration at the GSM side and the WCDMA side after GSM modifies the configuration data but does not inform WCDMA
minus Missed configuration of neighboring cells which can be solved by the correct configuration of neighboring cells
minus Too fast signal changes
ZTE Confidential Proprietary copy 2012 ZTE CORPORATION All rights reserved 44
UMTS KPI Optimization Analysis Guide Internal Use Only
minus Pingpong reselection
minus Faults with the UE for example the UE fails to respond to the handover or report the inter-RAT measurement report
minus Changes of the best server during the physical channel reallocation
minus Wrong LAC configuration which can be located through data configuration check
ZTE Confidential Proprietary copy 2012 ZTE CORPORATION All rights reserved 45
UMTS KPI Optimization Analysis Guide Internal Use Only
4432 Inter-RAT Handover Optimization Flowchart
Figure 4-14 Inter-RAT handover optimization flowchart
ZTE Confidential Proprietary copy 2012 ZTE CORPORATION All rights reserved 46
UMTS KPI Optimization Analysis Guide Internal Use Only
Extract performance data
TOP Ncell filtering
Analyze a single cell
1 Check NE alarms
2 Associate emergencies
3 Compare parameter
configurations
4 Associate indicators
5 Locate the fault
comprehensive ly
Exist or not
Handle alarms
Solved or not
Yes
Yes
End
No
No
Exist or not
Handle emergencies
Solved or not
Yes
No
No
Exist or not
Correct wrong parameter
configurations
Solved or not
Yes
No
No
List related indicator counters
RTWPResource
limit indicators
Checkamp analysis of interference
Optimization analysis of
resource limitCounters related to inter-RAT handover failures
C301130667 C301130681C301130668 C301130682C301130669 C301130690C301130670 C301130691C301130671 C301130692C301130672 C301130693C301130673 C301130694C301130674 C301130696C301130675 C301130697C301130677 C301130698C301130678 C301130699C301130679 C301130700
C301130680
Solved or not
Yes
Yes
No
Drive Test+RNC signaling
trace
Yes
Counters related to inter-RAT handover
failures
Cell hand-inhand-out indicators
30049 3005030051 3005230053 30054
ZTE Confidential Proprietary copy 2012 ZTE CORPORATION All rights reserved 47
UMTS KPI Optimization Analysis Guide Internal Use Only
45 Optimization of Resource Indicators
The resource indicators directly reflect the system capacity Increasing subscribers will consume more system resources and some resources may be limited for example the code resource may be limited the TCP access request may be rejected and the CE resource usage rate may exceed the threshold Limited system resources have a negative influence on the whole-network indicators and the subscribersrsquo perception for example call drops may frequently happen and more TCP access requests may be rejected during the voice services
Table 4-5 Resource KPIs and Alarm Thresholds
Resource type KPI No and nameAlarm
threshold
TCP
C301320150 Number of rejected services DCH downlink TCP limit
50
PI30167 Average non-HS (SOA) (SOA)DPA TCP 40
PI30092 Maximum Cell TCP () 100
PI30093 Average Cell TCP 70
UL TrafficPI30029 Handover Blocking Rate 05
KPI RTWP (in busy hour) -98 dBm
Code
C301320153 Number of rejected services DCH no code
50
PI30205 Average Cell HSUPA Users 12
PI30172 Cell Average HSDPA Users 16
CE
PI301830006 Maximum use Ratio of Uplink NodeB CE
60
PI301830010 Maximum use Ratio of Downlink NodeB CE
60
ZTE Confidential Proprietary copy 2012 ZTE CORPORATION All rights reserved 48
UMTS KPI Optimization Analysis Guide Internal Use Only
451 Resource Indicator Optimization Flowchart
Figure 4-15 Resource indicator optimization flowchart
ZTE Confidential Proprietary copy 2012 ZTE CORPORATION All rights reserved 49
UMTS KPI Optimization Analysis Guide Internal Use Only
Extract performance data
TOP Ncell filtering
Analyze a single cell
1 Check NE alarms
2 Associate emergencies
3 Compare parameter
configurations
4 Associate indicators
5 Locate the fault
comprehensive ly
Exist or not
Handle alarms
Solved or not
Yes
是
End
No
No
Exist or not
Handle emergencies
Solved or not
Yes
No
No
Exist or not
Correct wrong parameter
configurations
Solved or not
Yes
No
No
List related indicator counters
Code resource indicators
CE resource indicators
TCPadmission
reject counter
C301320150
Solved or not
Yes
Yes
No
Drive Test+RNC signaling
trace
Yes
Counter related to TCP limit
Cell TX power
indicators
30090 3009130092 3009330166 3016730168 3016930170 30171
30163301643016530075
30223302243045030451
Yes
Yes
ZTE Confidential Proprietary copy 2012 ZTE CORPORATION All rights reserved 50
UMTS KPI Optimization Analysis Guide Internal Use Only
452 Code Resource Optimization
The statistics of Number of rejected services and DCH no code the average code resource usage rate and the number of the HSDPA subscribers can be used to judge whether the code resource in a cell is limited If the code resource is limited you can adjust the code resource allocation to alleviate the situation
Based on the system algorithm when Formula 1 is satisfied you can add an HS-PDSCH when Formula 2 is satisfied then an HS-PDSCH is deleted
Formula 1 OcuRateNoHspdsch + OcuRateHspdsch + DpchCodeHy + 32 lt= 512
Formula 2 OcuRateNoHspdsch + OcuRateHspdsch + CodeUptHyA gt 512
OcuRateHspdschHSPDSCH means the number of the codes of SF=512 blocked by the HS-PDSCH OcuRateNoHspdsch means the number of codes of SF=512 blocked by other channels DpchCodeHy means the number of codes of SF=512 reserved for the DPCH and CodeUptHyA is the threshold to decide whether to delete the HSPDSCH
Therefore to ensure the access of the R99 subscribers you can make some adjustment according to Table 4-6 when the code resource is limited though the HSDPA rate may decrease
Table 4-6 Adjusting Code Resource Allocation
AbbreviationParameter
nameRange
and stepCurrent value
Update value
Remark
DpchCodeHy DPCH Code Hysteresis
0512 16 28
To decrease the number of rejected services for DCH no code
CodeUptHyACode Update Hysteresis A
0512 16 28
To decrease the number of rejected services for DCH no code
453 Monitoring CE Resource
The CE resource is mainly monitored through the maximum UE uplinkdownlink usage rate If there is any problem you can solve it by controlling the load or adding more boards
ZTE Confidential Proprietary copy 2012 ZTE CORPORATION All rights reserved 51
UMTS KPI Optimization Analysis Guide Internal Use Only
454 Optimization of Power Control
4541 Monitoring and Optimizing Downlink Power Control
Limited TCP in busy hours will not only increase access failures and call drops in the local cell but also increase soft handover failures and call drops in the neighboring cells Number of rejected services and DCH downlink TCP limit are intuitive KPIs to judge whether TCP is limited Although limited uplink capacity and massive UE moves in the rush hours may also cause call drops the limited TCP is absolutely a key factor
Based on the system algorithm MinHsdpaPower (MinHspaPwrRto) + NoHsPower gtNode B if the safety threshold is used (MinHsdpaPower means the power reserved for HSPA) then it will activate the downlink rate downgrade algorithm flow for the congestion (lower the downlink DCH rate) Although the rate downgrade can ensure access of some subscribers it is an irregular action and will degrade the performance
455 Speeding up Rate Downgrade
Considering that the cells with heavy load reject more access requests you can speed up the rate downgrade during the resource congestion to release the resources as soon as possible and avoid call drops caused by access failures (this method is only applicable to the cells with many PS service users but not those with only CS service users) Table 4-7 is an example of the parameter modification for the rate downgrade
Table 4-7 Example of Parameter Modification for Rate Downgrade
Abbreviation Parameter nameRange and
stepCurrent value
Update value
Remark
UlDnMaxStg Maximum Number of Degraded Uplink Load Steps Every Time
[1 8] 1 2 Downgrade from 384 Kbps to 16 Kbps
DlDnMaxStg Maximum Number of Degraded Downlink Load Steps Every Time
[1 8] 1 3 Downgrade from 384 Kbps to 8 Kbps
456 Monitoring and Optimizing Uplink Capacity
Handover Blocking Rate and RTWP can reflect the uplink capacity of the cell Because interference may also increase RTWP this factor should be distinguished during the RTWP monitoring Another effective indicator is the voice service erl If a cell has over 20 erls in busy hours you should pay special attention to it
ZTE Confidential Proprietary copy 2012 ZTE CORPORATION All rights reserved 52
UMTS KPI Optimization Analysis Guide Internal Use Only
457 Optimization of Uplink Capacity at the Whole Network Level
Case The uplink capacity was limited in a large number of sites after the cutover and the symptoms are a sharp rise of RTWP and a high call drop rate during the rush hours
After the following parameters were modified as shown in Table 4-8 the problem was solved
Table 4-8 Example of Power Control Parameter Modification
AbbreviationParameter
nameRange
Current value
Update value
ULINITSIRUplink Initial SIR target (dB)
UL 34 K136 K signaling UL 122 K AMR
4-5 35
ULMAXSIRMaximum Uplink SIR target (dB)
UL 34 K136 K signaling UL 122 K AMR
15 10
UlSirTargDnStepUplink SIR Target Down Step Size (dB)
UL 34 K136 K signaling UL 122 K AMR
01 02
458 Optimization of Uplink Capacity for a Single Cell
A lot of optimization measures can be taken to bring down the rising RTWP However with increasing subscribers the capacity may still be limited in some area while further modification of SirTarget will obviously degrade the call quality of the whole network and undermine the subscribersrsquo perception In this case you can adjust the power control parameters for a single site that has heavy traffic in the following way add one set of DivPc parameters and use this set of parameters only for this site
Case Table 4-9 shows an example of the power control parameter modification After this modification the call drop rate in the site with heavy traffic decreased to one quarter of the original one
Table 4-9 Example of Power Control Parameter Modification for Heavy-Traffic Cell
SRVTYPE ULINITSIR ULMAXSIR ULMINSIR
0 35-gt15 100-gt35 20-gt10
104 40-gt20 150-gt50 05-gt0
28 35-gt15 100-gt35 05-gt0
50 60-gt20 150-gt50 20-gt0
54 60-gt20 150-gt50 20-gt0
ZTE Confidential Proprietary copy 2012 ZTE CORPORATION All rights reserved 53
UMTS KPI Optimization Analysis Guide Internal Use Only
4422 Hard Handover Optimization Flowchart
Figure 4-13 Hard handover optimization flowchart
ZTE Confidential Proprietary copy 2012 ZTE CORPORATION All rights reserved 41
UMTS KPI Optimization Analysis Guide Internal Use Only
Extract performance data
TOP Ncell filtering
Analyze a single cell
1 Check NE alarms
2 Associate emergencies
3 Compare parameter
configurations
4 Associate indicators
5 Locate the fault
comprehensive ly
Exist or not
Handle alarms
Solved or not
Yes
Yes
End
No
Exist or not
Handle emergencies
Solved or not
YesNo
Exist or not
Correct wrong parameter
configurations
Solved or not
Yes
No
No
List related indicator counters
RTWPResource
limit indicators
Checkamp analysis of interference
Optimization analysis of
resource limit
Counters related to inter-frequency handover failures
C301110489 C301110516C301110499 C301110517C301110500 C301110518C301110501 C301110519C301110502 C301110520C301110503 C301110521C301110504 C301110522C301110505 C301110523
Solved or not
Yes
Yes
No
Drive Test+RNC signaling
trace
Yes
Counters related to hard handover
failures
30041 3004230043 3004430045 3004630047 30048
Cell hand-inhand-out indicators
NoNo
ZTE Confidential Proprietary copy 2012 ZTE CORPORATION All rights reserved 42
UMTS KPI Optimization Analysis Guide Internal Use Only
4423 Hard Handover Optimization Methods
The optimization flow for the hard handover is similar to that of the soft handover The major differences are in the parameter optimization To optimize intra-frequency hard handovers you can properly reduce the Event 1D hysteresis and the time to trigger Event 1D according to the real radio environment to ensure timely handovers
Inter-frequency coverage is often applied to some special scenarios such as indoor coverage and tested through CQT The method of judging whether there is missed configuration of the inter-frequency neighboring cell is almost the same as that of the co-frequency neighboring cell when a call drop occurs the UE fails to measure or report the inter-frequency neighboring cell after the call drop the UE resides in the inter-frequency neighboring cell again
The common hard handover problems are
1 The handover is not prompt The common symptoms are frequent call drops in the hard handovers when the UE moves
Solutions
Increase the threshold of activating the compressing mode The compressing mode is usually activated before the inter-frequency handover or the inter-RAT handover and it is used to measure the quality of the inter-frequency or inter-RAT cell You can set a threshold of the CPICH RSCP or EcIo to activate the compressing mode And the RSCP is widely used
minus Requirements on setting the threshold of activating the compressing mode Before the cell quality becomes low enough to cause a call drop the signal of the target cell should be measured and reported and the handover should be performed
minus Requirement on setting the threshold of deactivating the compression mode Frequent activationdeactivation of the compression mode should be avoided
Increase CIOs of the inter-frequency cell pair
Reduce the threshold of triggering the target frequency handover under the inter-frequency coverage
2 There are pingpong handovers
Solution Increase the hard handover hysteresis and the time to trigger the event
ZTE Confidential Proprietary copy 2012 ZTE CORPORATION All rights reserved 43
UMTS KPI Optimization Analysis Guide Internal Use Only
443 Optimization of Inter-RAT Handovers
4431 Configuring Basic Inter-RAT Parameters
Most of the inter-RAT handover failures are caused by incomplete parameter configuration The following parameters need special attention
Complete RNC parameter configuration for the GSM neighboring cell The 2G system shall provide the 3G system with the correct radio parameters based on negotiation mdash MCC MNC LAC ID (CI) NCC BCC frequency band indicator (900 or 1800) and BCCH
Table 4-3 Parameters That 2G Shall Provide to 3G
MCC MNC LACIDCI
NCC BCCFrequency
band indicator
BCCH
460 2 202 193 0 0 900 102
Complete GSM BSC parameter configuration for the WCDMA neighboring cell The 3G system shall provide the 2G system with the correct radio parameters based on negotiation mdash MCC MNC LAC RNC ID cell ID (C_ID) downlink frequency scrambling code and RAC
Table 4-4 Parameters That 3G Shall Provide to 2G
MCC MNC LACRNC
IDCell IDC_ID
Downlink frequency
Scrambling code
RAC
460 3 20 18 51 10787 51 20
According to the current strategy of one-way inter-RAT handovers if the parameter configuration is complete one probable cause of the inter-RAT handover failure is that the handover is not prompt The common parameter adjustment is to increase CIO the threshold to activatedeactivate the compressing mode and the threshold to trigger the WCDMA-to-GSM handover at the same time
Call drops during the inter-RAT handovers between WCDMA and GSM may be caused by
minus Inconsistent data configuration at the GSM side and the WCDMA side after GSM modifies the configuration data but does not inform WCDMA
minus Missed configuration of neighboring cells which can be solved by the correct configuration of neighboring cells
minus Too fast signal changes
ZTE Confidential Proprietary copy 2012 ZTE CORPORATION All rights reserved 44
UMTS KPI Optimization Analysis Guide Internal Use Only
minus Pingpong reselection
minus Faults with the UE for example the UE fails to respond to the handover or report the inter-RAT measurement report
minus Changes of the best server during the physical channel reallocation
minus Wrong LAC configuration which can be located through data configuration check
ZTE Confidential Proprietary copy 2012 ZTE CORPORATION All rights reserved 45
UMTS KPI Optimization Analysis Guide Internal Use Only
4432 Inter-RAT Handover Optimization Flowchart
Figure 4-14 Inter-RAT handover optimization flowchart
ZTE Confidential Proprietary copy 2012 ZTE CORPORATION All rights reserved 46
UMTS KPI Optimization Analysis Guide Internal Use Only
Extract performance data
TOP Ncell filtering
Analyze a single cell
1 Check NE alarms
2 Associate emergencies
3 Compare parameter
configurations
4 Associate indicators
5 Locate the fault
comprehensive ly
Exist or not
Handle alarms
Solved or not
Yes
Yes
End
No
No
Exist or not
Handle emergencies
Solved or not
Yes
No
No
Exist or not
Correct wrong parameter
configurations
Solved or not
Yes
No
No
List related indicator counters
RTWPResource
limit indicators
Checkamp analysis of interference
Optimization analysis of
resource limitCounters related to inter-RAT handover failures
C301130667 C301130681C301130668 C301130682C301130669 C301130690C301130670 C301130691C301130671 C301130692C301130672 C301130693C301130673 C301130694C301130674 C301130696C301130675 C301130697C301130677 C301130698C301130678 C301130699C301130679 C301130700
C301130680
Solved or not
Yes
Yes
No
Drive Test+RNC signaling
trace
Yes
Counters related to inter-RAT handover
failures
Cell hand-inhand-out indicators
30049 3005030051 3005230053 30054
ZTE Confidential Proprietary copy 2012 ZTE CORPORATION All rights reserved 47
UMTS KPI Optimization Analysis Guide Internal Use Only
45 Optimization of Resource Indicators
The resource indicators directly reflect the system capacity Increasing subscribers will consume more system resources and some resources may be limited for example the code resource may be limited the TCP access request may be rejected and the CE resource usage rate may exceed the threshold Limited system resources have a negative influence on the whole-network indicators and the subscribersrsquo perception for example call drops may frequently happen and more TCP access requests may be rejected during the voice services
Table 4-5 Resource KPIs and Alarm Thresholds
Resource type KPI No and nameAlarm
threshold
TCP
C301320150 Number of rejected services DCH downlink TCP limit
50
PI30167 Average non-HS (SOA) (SOA)DPA TCP 40
PI30092 Maximum Cell TCP () 100
PI30093 Average Cell TCP 70
UL TrafficPI30029 Handover Blocking Rate 05
KPI RTWP (in busy hour) -98 dBm
Code
C301320153 Number of rejected services DCH no code
50
PI30205 Average Cell HSUPA Users 12
PI30172 Cell Average HSDPA Users 16
CE
PI301830006 Maximum use Ratio of Uplink NodeB CE
60
PI301830010 Maximum use Ratio of Downlink NodeB CE
60
ZTE Confidential Proprietary copy 2012 ZTE CORPORATION All rights reserved 48
UMTS KPI Optimization Analysis Guide Internal Use Only
451 Resource Indicator Optimization Flowchart
Figure 4-15 Resource indicator optimization flowchart
ZTE Confidential Proprietary copy 2012 ZTE CORPORATION All rights reserved 49
UMTS KPI Optimization Analysis Guide Internal Use Only
Extract performance data
TOP Ncell filtering
Analyze a single cell
1 Check NE alarms
2 Associate emergencies
3 Compare parameter
configurations
4 Associate indicators
5 Locate the fault
comprehensive ly
Exist or not
Handle alarms
Solved or not
Yes
是
End
No
No
Exist or not
Handle emergencies
Solved or not
Yes
No
No
Exist or not
Correct wrong parameter
configurations
Solved or not
Yes
No
No
List related indicator counters
Code resource indicators
CE resource indicators
TCPadmission
reject counter
C301320150
Solved or not
Yes
Yes
No
Drive Test+RNC signaling
trace
Yes
Counter related to TCP limit
Cell TX power
indicators
30090 3009130092 3009330166 3016730168 3016930170 30171
30163301643016530075
30223302243045030451
Yes
Yes
ZTE Confidential Proprietary copy 2012 ZTE CORPORATION All rights reserved 50
UMTS KPI Optimization Analysis Guide Internal Use Only
452 Code Resource Optimization
The statistics of Number of rejected services and DCH no code the average code resource usage rate and the number of the HSDPA subscribers can be used to judge whether the code resource in a cell is limited If the code resource is limited you can adjust the code resource allocation to alleviate the situation
Based on the system algorithm when Formula 1 is satisfied you can add an HS-PDSCH when Formula 2 is satisfied then an HS-PDSCH is deleted
Formula 1 OcuRateNoHspdsch + OcuRateHspdsch + DpchCodeHy + 32 lt= 512
Formula 2 OcuRateNoHspdsch + OcuRateHspdsch + CodeUptHyA gt 512
OcuRateHspdschHSPDSCH means the number of the codes of SF=512 blocked by the HS-PDSCH OcuRateNoHspdsch means the number of codes of SF=512 blocked by other channels DpchCodeHy means the number of codes of SF=512 reserved for the DPCH and CodeUptHyA is the threshold to decide whether to delete the HSPDSCH
Therefore to ensure the access of the R99 subscribers you can make some adjustment according to Table 4-6 when the code resource is limited though the HSDPA rate may decrease
Table 4-6 Adjusting Code Resource Allocation
AbbreviationParameter
nameRange
and stepCurrent value
Update value
Remark
DpchCodeHy DPCH Code Hysteresis
0512 16 28
To decrease the number of rejected services for DCH no code
CodeUptHyACode Update Hysteresis A
0512 16 28
To decrease the number of rejected services for DCH no code
453 Monitoring CE Resource
The CE resource is mainly monitored through the maximum UE uplinkdownlink usage rate If there is any problem you can solve it by controlling the load or adding more boards
ZTE Confidential Proprietary copy 2012 ZTE CORPORATION All rights reserved 51
UMTS KPI Optimization Analysis Guide Internal Use Only
454 Optimization of Power Control
4541 Monitoring and Optimizing Downlink Power Control
Limited TCP in busy hours will not only increase access failures and call drops in the local cell but also increase soft handover failures and call drops in the neighboring cells Number of rejected services and DCH downlink TCP limit are intuitive KPIs to judge whether TCP is limited Although limited uplink capacity and massive UE moves in the rush hours may also cause call drops the limited TCP is absolutely a key factor
Based on the system algorithm MinHsdpaPower (MinHspaPwrRto) + NoHsPower gtNode B if the safety threshold is used (MinHsdpaPower means the power reserved for HSPA) then it will activate the downlink rate downgrade algorithm flow for the congestion (lower the downlink DCH rate) Although the rate downgrade can ensure access of some subscribers it is an irregular action and will degrade the performance
455 Speeding up Rate Downgrade
Considering that the cells with heavy load reject more access requests you can speed up the rate downgrade during the resource congestion to release the resources as soon as possible and avoid call drops caused by access failures (this method is only applicable to the cells with many PS service users but not those with only CS service users) Table 4-7 is an example of the parameter modification for the rate downgrade
Table 4-7 Example of Parameter Modification for Rate Downgrade
Abbreviation Parameter nameRange and
stepCurrent value
Update value
Remark
UlDnMaxStg Maximum Number of Degraded Uplink Load Steps Every Time
[1 8] 1 2 Downgrade from 384 Kbps to 16 Kbps
DlDnMaxStg Maximum Number of Degraded Downlink Load Steps Every Time
[1 8] 1 3 Downgrade from 384 Kbps to 8 Kbps
456 Monitoring and Optimizing Uplink Capacity
Handover Blocking Rate and RTWP can reflect the uplink capacity of the cell Because interference may also increase RTWP this factor should be distinguished during the RTWP monitoring Another effective indicator is the voice service erl If a cell has over 20 erls in busy hours you should pay special attention to it
ZTE Confidential Proprietary copy 2012 ZTE CORPORATION All rights reserved 52
UMTS KPI Optimization Analysis Guide Internal Use Only
457 Optimization of Uplink Capacity at the Whole Network Level
Case The uplink capacity was limited in a large number of sites after the cutover and the symptoms are a sharp rise of RTWP and a high call drop rate during the rush hours
After the following parameters were modified as shown in Table 4-8 the problem was solved
Table 4-8 Example of Power Control Parameter Modification
AbbreviationParameter
nameRange
Current value
Update value
ULINITSIRUplink Initial SIR target (dB)
UL 34 K136 K signaling UL 122 K AMR
4-5 35
ULMAXSIRMaximum Uplink SIR target (dB)
UL 34 K136 K signaling UL 122 K AMR
15 10
UlSirTargDnStepUplink SIR Target Down Step Size (dB)
UL 34 K136 K signaling UL 122 K AMR
01 02
458 Optimization of Uplink Capacity for a Single Cell
A lot of optimization measures can be taken to bring down the rising RTWP However with increasing subscribers the capacity may still be limited in some area while further modification of SirTarget will obviously degrade the call quality of the whole network and undermine the subscribersrsquo perception In this case you can adjust the power control parameters for a single site that has heavy traffic in the following way add one set of DivPc parameters and use this set of parameters only for this site
Case Table 4-9 shows an example of the power control parameter modification After this modification the call drop rate in the site with heavy traffic decreased to one quarter of the original one
Table 4-9 Example of Power Control Parameter Modification for Heavy-Traffic Cell
SRVTYPE ULINITSIR ULMAXSIR ULMINSIR
0 35-gt15 100-gt35 20-gt10
104 40-gt20 150-gt50 05-gt0
28 35-gt15 100-gt35 05-gt0
50 60-gt20 150-gt50 20-gt0
54 60-gt20 150-gt50 20-gt0
ZTE Confidential Proprietary copy 2012 ZTE CORPORATION All rights reserved 53
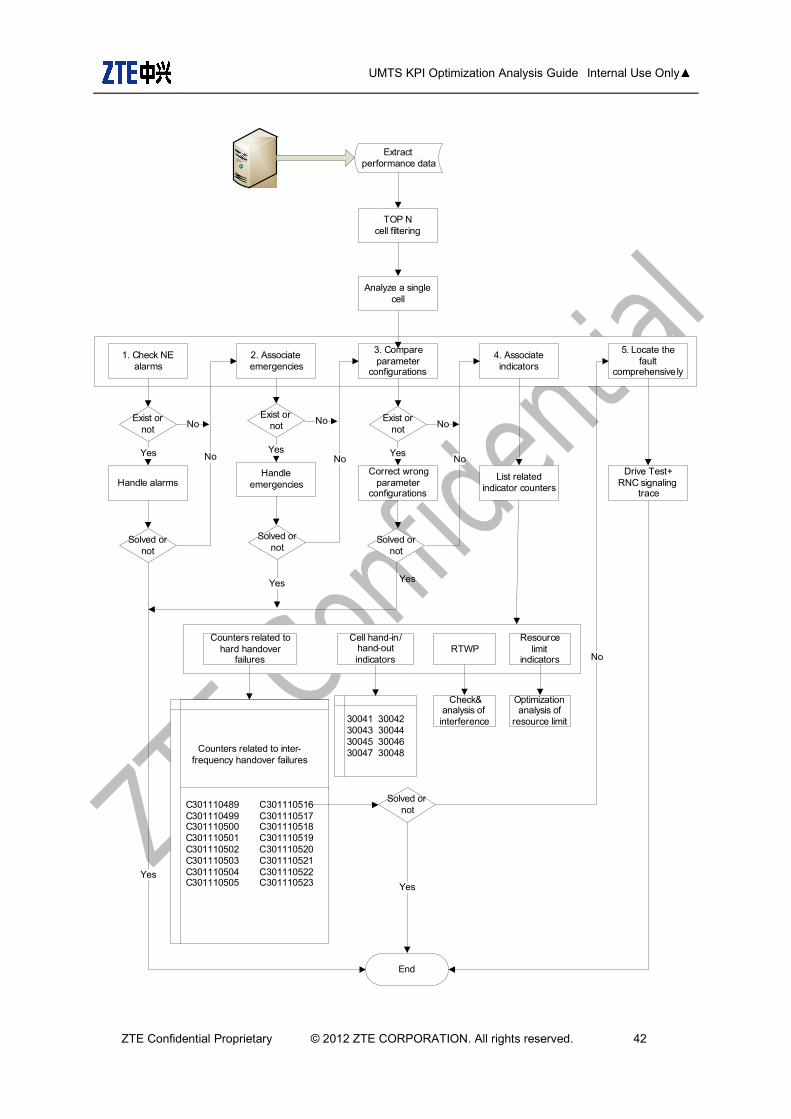
UMTS KPI Optimization Analysis Guide Internal Use Only
Extract performance data
TOP Ncell filtering
Analyze a single cell
1 Check NE alarms
2 Associate emergencies
3 Compare parameter
configurations
4 Associate indicators
5 Locate the fault
comprehensive ly
Exist or not
Handle alarms
Solved or not
Yes
Yes
End
No
Exist or not
Handle emergencies
Solved or not
YesNo
Exist or not
Correct wrong parameter
configurations
Solved or not
Yes
No
No
List related indicator counters
RTWPResource
limit indicators
Checkamp analysis of interference
Optimization analysis of
resource limit
Counters related to inter-frequency handover failures
C301110489 C301110516C301110499 C301110517C301110500 C301110518C301110501 C301110519C301110502 C301110520C301110503 C301110521C301110504 C301110522C301110505 C301110523
Solved or not
Yes
Yes
No
Drive Test+RNC signaling
trace
Yes
Counters related to hard handover
failures
30041 3004230043 3004430045 3004630047 30048
Cell hand-inhand-out indicators
NoNo
ZTE Confidential Proprietary copy 2012 ZTE CORPORATION All rights reserved 42
UMTS KPI Optimization Analysis Guide Internal Use Only
4423 Hard Handover Optimization Methods
The optimization flow for the hard handover is similar to that of the soft handover The major differences are in the parameter optimization To optimize intra-frequency hard handovers you can properly reduce the Event 1D hysteresis and the time to trigger Event 1D according to the real radio environment to ensure timely handovers
Inter-frequency coverage is often applied to some special scenarios such as indoor coverage and tested through CQT The method of judging whether there is missed configuration of the inter-frequency neighboring cell is almost the same as that of the co-frequency neighboring cell when a call drop occurs the UE fails to measure or report the inter-frequency neighboring cell after the call drop the UE resides in the inter-frequency neighboring cell again
The common hard handover problems are
1 The handover is not prompt The common symptoms are frequent call drops in the hard handovers when the UE moves
Solutions
Increase the threshold of activating the compressing mode The compressing mode is usually activated before the inter-frequency handover or the inter-RAT handover and it is used to measure the quality of the inter-frequency or inter-RAT cell You can set a threshold of the CPICH RSCP or EcIo to activate the compressing mode And the RSCP is widely used
minus Requirements on setting the threshold of activating the compressing mode Before the cell quality becomes low enough to cause a call drop the signal of the target cell should be measured and reported and the handover should be performed
minus Requirement on setting the threshold of deactivating the compression mode Frequent activationdeactivation of the compression mode should be avoided
Increase CIOs of the inter-frequency cell pair
Reduce the threshold of triggering the target frequency handover under the inter-frequency coverage
2 There are pingpong handovers
Solution Increase the hard handover hysteresis and the time to trigger the event
ZTE Confidential Proprietary copy 2012 ZTE CORPORATION All rights reserved 43
UMTS KPI Optimization Analysis Guide Internal Use Only
443 Optimization of Inter-RAT Handovers
4431 Configuring Basic Inter-RAT Parameters
Most of the inter-RAT handover failures are caused by incomplete parameter configuration The following parameters need special attention
Complete RNC parameter configuration for the GSM neighboring cell The 2G system shall provide the 3G system with the correct radio parameters based on negotiation mdash MCC MNC LAC ID (CI) NCC BCC frequency band indicator (900 or 1800) and BCCH
Table 4-3 Parameters That 2G Shall Provide to 3G
MCC MNC LACIDCI
NCC BCCFrequency
band indicator
BCCH
460 2 202 193 0 0 900 102
Complete GSM BSC parameter configuration for the WCDMA neighboring cell The 3G system shall provide the 2G system with the correct radio parameters based on negotiation mdash MCC MNC LAC RNC ID cell ID (C_ID) downlink frequency scrambling code and RAC
Table 4-4 Parameters That 3G Shall Provide to 2G
MCC MNC LACRNC
IDCell IDC_ID
Downlink frequency
Scrambling code
RAC
460 3 20 18 51 10787 51 20
According to the current strategy of one-way inter-RAT handovers if the parameter configuration is complete one probable cause of the inter-RAT handover failure is that the handover is not prompt The common parameter adjustment is to increase CIO the threshold to activatedeactivate the compressing mode and the threshold to trigger the WCDMA-to-GSM handover at the same time
Call drops during the inter-RAT handovers between WCDMA and GSM may be caused by
minus Inconsistent data configuration at the GSM side and the WCDMA side after GSM modifies the configuration data but does not inform WCDMA
minus Missed configuration of neighboring cells which can be solved by the correct configuration of neighboring cells
minus Too fast signal changes
ZTE Confidential Proprietary copy 2012 ZTE CORPORATION All rights reserved 44
UMTS KPI Optimization Analysis Guide Internal Use Only
minus Pingpong reselection
minus Faults with the UE for example the UE fails to respond to the handover or report the inter-RAT measurement report
minus Changes of the best server during the physical channel reallocation
minus Wrong LAC configuration which can be located through data configuration check
ZTE Confidential Proprietary copy 2012 ZTE CORPORATION All rights reserved 45
UMTS KPI Optimization Analysis Guide Internal Use Only
4432 Inter-RAT Handover Optimization Flowchart
Figure 4-14 Inter-RAT handover optimization flowchart
ZTE Confidential Proprietary copy 2012 ZTE CORPORATION All rights reserved 46
UMTS KPI Optimization Analysis Guide Internal Use Only
Extract performance data
TOP Ncell filtering
Analyze a single cell
1 Check NE alarms
2 Associate emergencies
3 Compare parameter
configurations
4 Associate indicators
5 Locate the fault
comprehensive ly
Exist or not
Handle alarms
Solved or not
Yes
Yes
End
No
No
Exist or not
Handle emergencies
Solved or not
Yes
No
No
Exist or not
Correct wrong parameter
configurations
Solved or not
Yes
No
No
List related indicator counters
RTWPResource
limit indicators
Checkamp analysis of interference
Optimization analysis of
resource limitCounters related to inter-RAT handover failures
C301130667 C301130681C301130668 C301130682C301130669 C301130690C301130670 C301130691C301130671 C301130692C301130672 C301130693C301130673 C301130694C301130674 C301130696C301130675 C301130697C301130677 C301130698C301130678 C301130699C301130679 C301130700
C301130680
Solved or not
Yes
Yes
No
Drive Test+RNC signaling
trace
Yes
Counters related to inter-RAT handover
failures
Cell hand-inhand-out indicators
30049 3005030051 3005230053 30054
ZTE Confidential Proprietary copy 2012 ZTE CORPORATION All rights reserved 47
UMTS KPI Optimization Analysis Guide Internal Use Only
45 Optimization of Resource Indicators
The resource indicators directly reflect the system capacity Increasing subscribers will consume more system resources and some resources may be limited for example the code resource may be limited the TCP access request may be rejected and the CE resource usage rate may exceed the threshold Limited system resources have a negative influence on the whole-network indicators and the subscribersrsquo perception for example call drops may frequently happen and more TCP access requests may be rejected during the voice services
Table 4-5 Resource KPIs and Alarm Thresholds
Resource type KPI No and nameAlarm
threshold
TCP
C301320150 Number of rejected services DCH downlink TCP limit
50
PI30167 Average non-HS (SOA) (SOA)DPA TCP 40
PI30092 Maximum Cell TCP () 100
PI30093 Average Cell TCP 70
UL TrafficPI30029 Handover Blocking Rate 05
KPI RTWP (in busy hour) -98 dBm
Code
C301320153 Number of rejected services DCH no code
50
PI30205 Average Cell HSUPA Users 12
PI30172 Cell Average HSDPA Users 16
CE
PI301830006 Maximum use Ratio of Uplink NodeB CE
60
PI301830010 Maximum use Ratio of Downlink NodeB CE
60
ZTE Confidential Proprietary copy 2012 ZTE CORPORATION All rights reserved 48
UMTS KPI Optimization Analysis Guide Internal Use Only
451 Resource Indicator Optimization Flowchart
Figure 4-15 Resource indicator optimization flowchart
ZTE Confidential Proprietary copy 2012 ZTE CORPORATION All rights reserved 49
UMTS KPI Optimization Analysis Guide Internal Use Only
Extract performance data
TOP Ncell filtering
Analyze a single cell
1 Check NE alarms
2 Associate emergencies
3 Compare parameter
configurations
4 Associate indicators
5 Locate the fault
comprehensive ly
Exist or not
Handle alarms
Solved or not
Yes
是
End
No
No
Exist or not
Handle emergencies
Solved or not
Yes
No
No
Exist or not
Correct wrong parameter
configurations
Solved or not
Yes
No
No
List related indicator counters
Code resource indicators
CE resource indicators
TCPadmission
reject counter
C301320150
Solved or not
Yes
Yes
No
Drive Test+RNC signaling
trace
Yes
Counter related to TCP limit
Cell TX power
indicators
30090 3009130092 3009330166 3016730168 3016930170 30171
30163301643016530075
30223302243045030451
Yes
Yes
ZTE Confidential Proprietary copy 2012 ZTE CORPORATION All rights reserved 50
UMTS KPI Optimization Analysis Guide Internal Use Only
452 Code Resource Optimization
The statistics of Number of rejected services and DCH no code the average code resource usage rate and the number of the HSDPA subscribers can be used to judge whether the code resource in a cell is limited If the code resource is limited you can adjust the code resource allocation to alleviate the situation
Based on the system algorithm when Formula 1 is satisfied you can add an HS-PDSCH when Formula 2 is satisfied then an HS-PDSCH is deleted
Formula 1 OcuRateNoHspdsch + OcuRateHspdsch + DpchCodeHy + 32 lt= 512
Formula 2 OcuRateNoHspdsch + OcuRateHspdsch + CodeUptHyA gt 512
OcuRateHspdschHSPDSCH means the number of the codes of SF=512 blocked by the HS-PDSCH OcuRateNoHspdsch means the number of codes of SF=512 blocked by other channels DpchCodeHy means the number of codes of SF=512 reserved for the DPCH and CodeUptHyA is the threshold to decide whether to delete the HSPDSCH
Therefore to ensure the access of the R99 subscribers you can make some adjustment according to Table 4-6 when the code resource is limited though the HSDPA rate may decrease
Table 4-6 Adjusting Code Resource Allocation
AbbreviationParameter
nameRange
and stepCurrent value
Update value
Remark
DpchCodeHy DPCH Code Hysteresis
0512 16 28
To decrease the number of rejected services for DCH no code
CodeUptHyACode Update Hysteresis A
0512 16 28
To decrease the number of rejected services for DCH no code
453 Monitoring CE Resource
The CE resource is mainly monitored through the maximum UE uplinkdownlink usage rate If there is any problem you can solve it by controlling the load or adding more boards
ZTE Confidential Proprietary copy 2012 ZTE CORPORATION All rights reserved 51
UMTS KPI Optimization Analysis Guide Internal Use Only
454 Optimization of Power Control
4541 Monitoring and Optimizing Downlink Power Control
Limited TCP in busy hours will not only increase access failures and call drops in the local cell but also increase soft handover failures and call drops in the neighboring cells Number of rejected services and DCH downlink TCP limit are intuitive KPIs to judge whether TCP is limited Although limited uplink capacity and massive UE moves in the rush hours may also cause call drops the limited TCP is absolutely a key factor
Based on the system algorithm MinHsdpaPower (MinHspaPwrRto) + NoHsPower gtNode B if the safety threshold is used (MinHsdpaPower means the power reserved for HSPA) then it will activate the downlink rate downgrade algorithm flow for the congestion (lower the downlink DCH rate) Although the rate downgrade can ensure access of some subscribers it is an irregular action and will degrade the performance
455 Speeding up Rate Downgrade
Considering that the cells with heavy load reject more access requests you can speed up the rate downgrade during the resource congestion to release the resources as soon as possible and avoid call drops caused by access failures (this method is only applicable to the cells with many PS service users but not those with only CS service users) Table 4-7 is an example of the parameter modification for the rate downgrade
Table 4-7 Example of Parameter Modification for Rate Downgrade
Abbreviation Parameter nameRange and
stepCurrent value
Update value
Remark
UlDnMaxStg Maximum Number of Degraded Uplink Load Steps Every Time
[1 8] 1 2 Downgrade from 384 Kbps to 16 Kbps
DlDnMaxStg Maximum Number of Degraded Downlink Load Steps Every Time
[1 8] 1 3 Downgrade from 384 Kbps to 8 Kbps
456 Monitoring and Optimizing Uplink Capacity
Handover Blocking Rate and RTWP can reflect the uplink capacity of the cell Because interference may also increase RTWP this factor should be distinguished during the RTWP monitoring Another effective indicator is the voice service erl If a cell has over 20 erls in busy hours you should pay special attention to it
ZTE Confidential Proprietary copy 2012 ZTE CORPORATION All rights reserved 52
UMTS KPI Optimization Analysis Guide Internal Use Only
457 Optimization of Uplink Capacity at the Whole Network Level
Case The uplink capacity was limited in a large number of sites after the cutover and the symptoms are a sharp rise of RTWP and a high call drop rate during the rush hours
After the following parameters were modified as shown in Table 4-8 the problem was solved
Table 4-8 Example of Power Control Parameter Modification
AbbreviationParameter
nameRange
Current value
Update value
ULINITSIRUplink Initial SIR target (dB)
UL 34 K136 K signaling UL 122 K AMR
4-5 35
ULMAXSIRMaximum Uplink SIR target (dB)
UL 34 K136 K signaling UL 122 K AMR
15 10
UlSirTargDnStepUplink SIR Target Down Step Size (dB)
UL 34 K136 K signaling UL 122 K AMR
01 02
458 Optimization of Uplink Capacity for a Single Cell
A lot of optimization measures can be taken to bring down the rising RTWP However with increasing subscribers the capacity may still be limited in some area while further modification of SirTarget will obviously degrade the call quality of the whole network and undermine the subscribersrsquo perception In this case you can adjust the power control parameters for a single site that has heavy traffic in the following way add one set of DivPc parameters and use this set of parameters only for this site
Case Table 4-9 shows an example of the power control parameter modification After this modification the call drop rate in the site with heavy traffic decreased to one quarter of the original one
Table 4-9 Example of Power Control Parameter Modification for Heavy-Traffic Cell
SRVTYPE ULINITSIR ULMAXSIR ULMINSIR
0 35-gt15 100-gt35 20-gt10
104 40-gt20 150-gt50 05-gt0
28 35-gt15 100-gt35 05-gt0
50 60-gt20 150-gt50 20-gt0
54 60-gt20 150-gt50 20-gt0
ZTE Confidential Proprietary copy 2012 ZTE CORPORATION All rights reserved 53
UMTS KPI Optimization Analysis Guide Internal Use Only
4423 Hard Handover Optimization Methods
The optimization flow for the hard handover is similar to that of the soft handover The major differences are in the parameter optimization To optimize intra-frequency hard handovers you can properly reduce the Event 1D hysteresis and the time to trigger Event 1D according to the real radio environment to ensure timely handovers
Inter-frequency coverage is often applied to some special scenarios such as indoor coverage and tested through CQT The method of judging whether there is missed configuration of the inter-frequency neighboring cell is almost the same as that of the co-frequency neighboring cell when a call drop occurs the UE fails to measure or report the inter-frequency neighboring cell after the call drop the UE resides in the inter-frequency neighboring cell again
The common hard handover problems are
1 The handover is not prompt The common symptoms are frequent call drops in the hard handovers when the UE moves
Solutions
Increase the threshold of activating the compressing mode The compressing mode is usually activated before the inter-frequency handover or the inter-RAT handover and it is used to measure the quality of the inter-frequency or inter-RAT cell You can set a threshold of the CPICH RSCP or EcIo to activate the compressing mode And the RSCP is widely used
minus Requirements on setting the threshold of activating the compressing mode Before the cell quality becomes low enough to cause a call drop the signal of the target cell should be measured and reported and the handover should be performed
minus Requirement on setting the threshold of deactivating the compression mode Frequent activationdeactivation of the compression mode should be avoided
Increase CIOs of the inter-frequency cell pair
Reduce the threshold of triggering the target frequency handover under the inter-frequency coverage
2 There are pingpong handovers
Solution Increase the hard handover hysteresis and the time to trigger the event
ZTE Confidential Proprietary copy 2012 ZTE CORPORATION All rights reserved 43
UMTS KPI Optimization Analysis Guide Internal Use Only
443 Optimization of Inter-RAT Handovers
4431 Configuring Basic Inter-RAT Parameters
Most of the inter-RAT handover failures are caused by incomplete parameter configuration The following parameters need special attention
Complete RNC parameter configuration for the GSM neighboring cell The 2G system shall provide the 3G system with the correct radio parameters based on negotiation mdash MCC MNC LAC ID (CI) NCC BCC frequency band indicator (900 or 1800) and BCCH
Table 4-3 Parameters That 2G Shall Provide to 3G
MCC MNC LACIDCI
NCC BCCFrequency
band indicator
BCCH
460 2 202 193 0 0 900 102
Complete GSM BSC parameter configuration for the WCDMA neighboring cell The 3G system shall provide the 2G system with the correct radio parameters based on negotiation mdash MCC MNC LAC RNC ID cell ID (C_ID) downlink frequency scrambling code and RAC
Table 4-4 Parameters That 3G Shall Provide to 2G
MCC MNC LACRNC
IDCell IDC_ID
Downlink frequency
Scrambling code
RAC
460 3 20 18 51 10787 51 20
According to the current strategy of one-way inter-RAT handovers if the parameter configuration is complete one probable cause of the inter-RAT handover failure is that the handover is not prompt The common parameter adjustment is to increase CIO the threshold to activatedeactivate the compressing mode and the threshold to trigger the WCDMA-to-GSM handover at the same time
Call drops during the inter-RAT handovers between WCDMA and GSM may be caused by
minus Inconsistent data configuration at the GSM side and the WCDMA side after GSM modifies the configuration data but does not inform WCDMA
minus Missed configuration of neighboring cells which can be solved by the correct configuration of neighboring cells
minus Too fast signal changes
ZTE Confidential Proprietary copy 2012 ZTE CORPORATION All rights reserved 44
UMTS KPI Optimization Analysis Guide Internal Use Only
minus Pingpong reselection
minus Faults with the UE for example the UE fails to respond to the handover or report the inter-RAT measurement report
minus Changes of the best server during the physical channel reallocation
minus Wrong LAC configuration which can be located through data configuration check
ZTE Confidential Proprietary copy 2012 ZTE CORPORATION All rights reserved 45
UMTS KPI Optimization Analysis Guide Internal Use Only
4432 Inter-RAT Handover Optimization Flowchart
Figure 4-14 Inter-RAT handover optimization flowchart
ZTE Confidential Proprietary copy 2012 ZTE CORPORATION All rights reserved 46
UMTS KPI Optimization Analysis Guide Internal Use Only
Extract performance data
TOP Ncell filtering
Analyze a single cell
1 Check NE alarms
2 Associate emergencies
3 Compare parameter
configurations
4 Associate indicators
5 Locate the fault
comprehensive ly
Exist or not
Handle alarms
Solved or not
Yes
Yes
End
No
No
Exist or not
Handle emergencies
Solved or not
Yes
No
No
Exist or not
Correct wrong parameter
configurations
Solved or not
Yes
No
No
List related indicator counters
RTWPResource
limit indicators
Checkamp analysis of interference
Optimization analysis of
resource limitCounters related to inter-RAT handover failures
C301130667 C301130681C301130668 C301130682C301130669 C301130690C301130670 C301130691C301130671 C301130692C301130672 C301130693C301130673 C301130694C301130674 C301130696C301130675 C301130697C301130677 C301130698C301130678 C301130699C301130679 C301130700
C301130680
Solved or not
Yes
Yes
No
Drive Test+RNC signaling
trace
Yes
Counters related to inter-RAT handover
failures
Cell hand-inhand-out indicators
30049 3005030051 3005230053 30054
ZTE Confidential Proprietary copy 2012 ZTE CORPORATION All rights reserved 47
UMTS KPI Optimization Analysis Guide Internal Use Only
45 Optimization of Resource Indicators
The resource indicators directly reflect the system capacity Increasing subscribers will consume more system resources and some resources may be limited for example the code resource may be limited the TCP access request may be rejected and the CE resource usage rate may exceed the threshold Limited system resources have a negative influence on the whole-network indicators and the subscribersrsquo perception for example call drops may frequently happen and more TCP access requests may be rejected during the voice services
Table 4-5 Resource KPIs and Alarm Thresholds
Resource type KPI No and nameAlarm
threshold
TCP
C301320150 Number of rejected services DCH downlink TCP limit
50
PI30167 Average non-HS (SOA) (SOA)DPA TCP 40
PI30092 Maximum Cell TCP () 100
PI30093 Average Cell TCP 70
UL TrafficPI30029 Handover Blocking Rate 05
KPI RTWP (in busy hour) -98 dBm
Code
C301320153 Number of rejected services DCH no code
50
PI30205 Average Cell HSUPA Users 12
PI30172 Cell Average HSDPA Users 16
CE
PI301830006 Maximum use Ratio of Uplink NodeB CE
60
PI301830010 Maximum use Ratio of Downlink NodeB CE
60
ZTE Confidential Proprietary copy 2012 ZTE CORPORATION All rights reserved 48
UMTS KPI Optimization Analysis Guide Internal Use Only
451 Resource Indicator Optimization Flowchart
Figure 4-15 Resource indicator optimization flowchart
ZTE Confidential Proprietary copy 2012 ZTE CORPORATION All rights reserved 49
UMTS KPI Optimization Analysis Guide Internal Use Only
Extract performance data
TOP Ncell filtering
Analyze a single cell
1 Check NE alarms
2 Associate emergencies
3 Compare parameter
configurations
4 Associate indicators
5 Locate the fault
comprehensive ly
Exist or not
Handle alarms
Solved or not
Yes
是
End
No
No
Exist or not
Handle emergencies
Solved or not
Yes
No
No
Exist or not
Correct wrong parameter
configurations
Solved or not
Yes
No
No
List related indicator counters
Code resource indicators
CE resource indicators
TCPadmission
reject counter
C301320150
Solved or not
Yes
Yes
No
Drive Test+RNC signaling
trace
Yes
Counter related to TCP limit
Cell TX power
indicators
30090 3009130092 3009330166 3016730168 3016930170 30171
30163301643016530075
30223302243045030451
Yes
Yes
ZTE Confidential Proprietary copy 2012 ZTE CORPORATION All rights reserved 50
UMTS KPI Optimization Analysis Guide Internal Use Only
452 Code Resource Optimization
The statistics of Number of rejected services and DCH no code the average code resource usage rate and the number of the HSDPA subscribers can be used to judge whether the code resource in a cell is limited If the code resource is limited you can adjust the code resource allocation to alleviate the situation
Based on the system algorithm when Formula 1 is satisfied you can add an HS-PDSCH when Formula 2 is satisfied then an HS-PDSCH is deleted
Formula 1 OcuRateNoHspdsch + OcuRateHspdsch + DpchCodeHy + 32 lt= 512
Formula 2 OcuRateNoHspdsch + OcuRateHspdsch + CodeUptHyA gt 512
OcuRateHspdschHSPDSCH means the number of the codes of SF=512 blocked by the HS-PDSCH OcuRateNoHspdsch means the number of codes of SF=512 blocked by other channels DpchCodeHy means the number of codes of SF=512 reserved for the DPCH and CodeUptHyA is the threshold to decide whether to delete the HSPDSCH
Therefore to ensure the access of the R99 subscribers you can make some adjustment according to Table 4-6 when the code resource is limited though the HSDPA rate may decrease
Table 4-6 Adjusting Code Resource Allocation
AbbreviationParameter
nameRange
and stepCurrent value
Update value
Remark
DpchCodeHy DPCH Code Hysteresis
0512 16 28
To decrease the number of rejected services for DCH no code
CodeUptHyACode Update Hysteresis A
0512 16 28
To decrease the number of rejected services for DCH no code
453 Monitoring CE Resource
The CE resource is mainly monitored through the maximum UE uplinkdownlink usage rate If there is any problem you can solve it by controlling the load or adding more boards
ZTE Confidential Proprietary copy 2012 ZTE CORPORATION All rights reserved 51
UMTS KPI Optimization Analysis Guide Internal Use Only
454 Optimization of Power Control
4541 Monitoring and Optimizing Downlink Power Control
Limited TCP in busy hours will not only increase access failures and call drops in the local cell but also increase soft handover failures and call drops in the neighboring cells Number of rejected services and DCH downlink TCP limit are intuitive KPIs to judge whether TCP is limited Although limited uplink capacity and massive UE moves in the rush hours may also cause call drops the limited TCP is absolutely a key factor
Based on the system algorithm MinHsdpaPower (MinHspaPwrRto) + NoHsPower gtNode B if the safety threshold is used (MinHsdpaPower means the power reserved for HSPA) then it will activate the downlink rate downgrade algorithm flow for the congestion (lower the downlink DCH rate) Although the rate downgrade can ensure access of some subscribers it is an irregular action and will degrade the performance
455 Speeding up Rate Downgrade
Considering that the cells with heavy load reject more access requests you can speed up the rate downgrade during the resource congestion to release the resources as soon as possible and avoid call drops caused by access failures (this method is only applicable to the cells with many PS service users but not those with only CS service users) Table 4-7 is an example of the parameter modification for the rate downgrade
Table 4-7 Example of Parameter Modification for Rate Downgrade
Abbreviation Parameter nameRange and
stepCurrent value
Update value
Remark
UlDnMaxStg Maximum Number of Degraded Uplink Load Steps Every Time
[1 8] 1 2 Downgrade from 384 Kbps to 16 Kbps
DlDnMaxStg Maximum Number of Degraded Downlink Load Steps Every Time
[1 8] 1 3 Downgrade from 384 Kbps to 8 Kbps
456 Monitoring and Optimizing Uplink Capacity
Handover Blocking Rate and RTWP can reflect the uplink capacity of the cell Because interference may also increase RTWP this factor should be distinguished during the RTWP monitoring Another effective indicator is the voice service erl If a cell has over 20 erls in busy hours you should pay special attention to it
ZTE Confidential Proprietary copy 2012 ZTE CORPORATION All rights reserved 52
UMTS KPI Optimization Analysis Guide Internal Use Only
457 Optimization of Uplink Capacity at the Whole Network Level
Case The uplink capacity was limited in a large number of sites after the cutover and the symptoms are a sharp rise of RTWP and a high call drop rate during the rush hours
After the following parameters were modified as shown in Table 4-8 the problem was solved
Table 4-8 Example of Power Control Parameter Modification
AbbreviationParameter
nameRange
Current value
Update value
ULINITSIRUplink Initial SIR target (dB)
UL 34 K136 K signaling UL 122 K AMR
4-5 35
ULMAXSIRMaximum Uplink SIR target (dB)
UL 34 K136 K signaling UL 122 K AMR
15 10
UlSirTargDnStepUplink SIR Target Down Step Size (dB)
UL 34 K136 K signaling UL 122 K AMR
01 02
458 Optimization of Uplink Capacity for a Single Cell
A lot of optimization measures can be taken to bring down the rising RTWP However with increasing subscribers the capacity may still be limited in some area while further modification of SirTarget will obviously degrade the call quality of the whole network and undermine the subscribersrsquo perception In this case you can adjust the power control parameters for a single site that has heavy traffic in the following way add one set of DivPc parameters and use this set of parameters only for this site
Case Table 4-9 shows an example of the power control parameter modification After this modification the call drop rate in the site with heavy traffic decreased to one quarter of the original one
Table 4-9 Example of Power Control Parameter Modification for Heavy-Traffic Cell
SRVTYPE ULINITSIR ULMAXSIR ULMINSIR
0 35-gt15 100-gt35 20-gt10
104 40-gt20 150-gt50 05-gt0
28 35-gt15 100-gt35 05-gt0
50 60-gt20 150-gt50 20-gt0
54 60-gt20 150-gt50 20-gt0
ZTE Confidential Proprietary copy 2012 ZTE CORPORATION All rights reserved 53
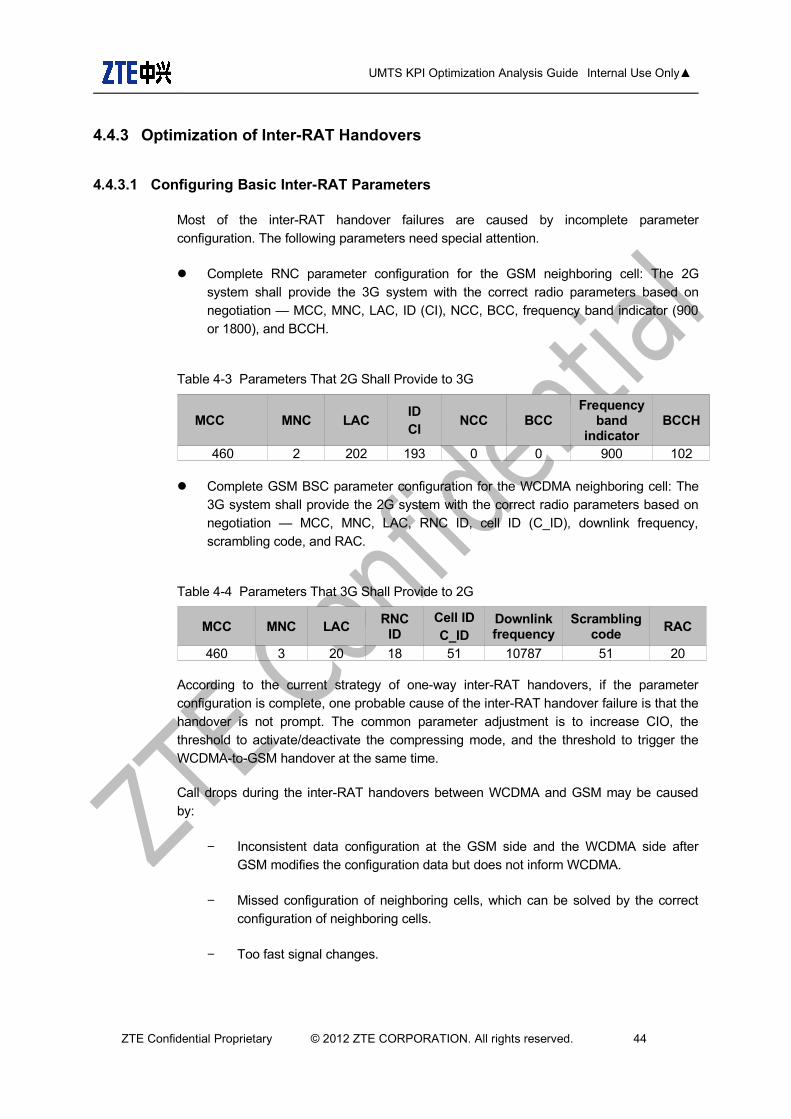
UMTS KPI Optimization Analysis Guide Internal Use Only
443 Optimization of Inter-RAT Handovers
4431 Configuring Basic Inter-RAT Parameters
Most of the inter-RAT handover failures are caused by incomplete parameter configuration The following parameters need special attention
Complete RNC parameter configuration for the GSM neighboring cell The 2G system shall provide the 3G system with the correct radio parameters based on negotiation mdash MCC MNC LAC ID (CI) NCC BCC frequency band indicator (900 or 1800) and BCCH
Table 4-3 Parameters That 2G Shall Provide to 3G
MCC MNC LACIDCI
NCC BCCFrequency
band indicator
BCCH
460 2 202 193 0 0 900 102
Complete GSM BSC parameter configuration for the WCDMA neighboring cell The 3G system shall provide the 2G system with the correct radio parameters based on negotiation mdash MCC MNC LAC RNC ID cell ID (C_ID) downlink frequency scrambling code and RAC
Table 4-4 Parameters That 3G Shall Provide to 2G
MCC MNC LACRNC
IDCell IDC_ID
Downlink frequency
Scrambling code
RAC
460 3 20 18 51 10787 51 20
According to the current strategy of one-way inter-RAT handovers if the parameter configuration is complete one probable cause of the inter-RAT handover failure is that the handover is not prompt The common parameter adjustment is to increase CIO the threshold to activatedeactivate the compressing mode and the threshold to trigger the WCDMA-to-GSM handover at the same time
Call drops during the inter-RAT handovers between WCDMA and GSM may be caused by
minus Inconsistent data configuration at the GSM side and the WCDMA side after GSM modifies the configuration data but does not inform WCDMA
minus Missed configuration of neighboring cells which can be solved by the correct configuration of neighboring cells
minus Too fast signal changes
ZTE Confidential Proprietary copy 2012 ZTE CORPORATION All rights reserved 44
UMTS KPI Optimization Analysis Guide Internal Use Only
minus Pingpong reselection
minus Faults with the UE for example the UE fails to respond to the handover or report the inter-RAT measurement report
minus Changes of the best server during the physical channel reallocation
minus Wrong LAC configuration which can be located through data configuration check
ZTE Confidential Proprietary copy 2012 ZTE CORPORATION All rights reserved 45
UMTS KPI Optimization Analysis Guide Internal Use Only
4432 Inter-RAT Handover Optimization Flowchart
Figure 4-14 Inter-RAT handover optimization flowchart
ZTE Confidential Proprietary copy 2012 ZTE CORPORATION All rights reserved 46
UMTS KPI Optimization Analysis Guide Internal Use Only
Extract performance data
TOP Ncell filtering
Analyze a single cell
1 Check NE alarms
2 Associate emergencies
3 Compare parameter
configurations
4 Associate indicators
5 Locate the fault
comprehensive ly
Exist or not
Handle alarms
Solved or not
Yes
Yes
End
No
No
Exist or not
Handle emergencies
Solved or not
Yes
No
No
Exist or not
Correct wrong parameter
configurations
Solved or not
Yes
No
No
List related indicator counters
RTWPResource
limit indicators
Checkamp analysis of interference
Optimization analysis of
resource limitCounters related to inter-RAT handover failures
C301130667 C301130681C301130668 C301130682C301130669 C301130690C301130670 C301130691C301130671 C301130692C301130672 C301130693C301130673 C301130694C301130674 C301130696C301130675 C301130697C301130677 C301130698C301130678 C301130699C301130679 C301130700
C301130680
Solved or not
Yes
Yes
No
Drive Test+RNC signaling
trace
Yes
Counters related to inter-RAT handover
failures
Cell hand-inhand-out indicators
30049 3005030051 3005230053 30054
ZTE Confidential Proprietary copy 2012 ZTE CORPORATION All rights reserved 47
UMTS KPI Optimization Analysis Guide Internal Use Only
45 Optimization of Resource Indicators
The resource indicators directly reflect the system capacity Increasing subscribers will consume more system resources and some resources may be limited for example the code resource may be limited the TCP access request may be rejected and the CE resource usage rate may exceed the threshold Limited system resources have a negative influence on the whole-network indicators and the subscribersrsquo perception for example call drops may frequently happen and more TCP access requests may be rejected during the voice services
Table 4-5 Resource KPIs and Alarm Thresholds
Resource type KPI No and nameAlarm
threshold
TCP
C301320150 Number of rejected services DCH downlink TCP limit
50
PI30167 Average non-HS (SOA) (SOA)DPA TCP 40
PI30092 Maximum Cell TCP () 100
PI30093 Average Cell TCP 70
UL TrafficPI30029 Handover Blocking Rate 05
KPI RTWP (in busy hour) -98 dBm
Code
C301320153 Number of rejected services DCH no code
50
PI30205 Average Cell HSUPA Users 12
PI30172 Cell Average HSDPA Users 16
CE
PI301830006 Maximum use Ratio of Uplink NodeB CE
60
PI301830010 Maximum use Ratio of Downlink NodeB CE
60
ZTE Confidential Proprietary copy 2012 ZTE CORPORATION All rights reserved 48
UMTS KPI Optimization Analysis Guide Internal Use Only
451 Resource Indicator Optimization Flowchart
Figure 4-15 Resource indicator optimization flowchart
ZTE Confidential Proprietary copy 2012 ZTE CORPORATION All rights reserved 49
UMTS KPI Optimization Analysis Guide Internal Use Only
Extract performance data
TOP Ncell filtering
Analyze a single cell
1 Check NE alarms
2 Associate emergencies
3 Compare parameter
configurations
4 Associate indicators
5 Locate the fault
comprehensive ly
Exist or not
Handle alarms
Solved or not
Yes
是
End
No
No
Exist or not
Handle emergencies
Solved or not
Yes
No
No
Exist or not
Correct wrong parameter
configurations
Solved or not
Yes
No
No
List related indicator counters
Code resource indicators
CE resource indicators
TCPadmission
reject counter
C301320150
Solved or not
Yes
Yes
No
Drive Test+RNC signaling
trace
Yes
Counter related to TCP limit
Cell TX power
indicators
30090 3009130092 3009330166 3016730168 3016930170 30171
30163301643016530075
30223302243045030451
Yes
Yes
ZTE Confidential Proprietary copy 2012 ZTE CORPORATION All rights reserved 50
UMTS KPI Optimization Analysis Guide Internal Use Only
452 Code Resource Optimization
The statistics of Number of rejected services and DCH no code the average code resource usage rate and the number of the HSDPA subscribers can be used to judge whether the code resource in a cell is limited If the code resource is limited you can adjust the code resource allocation to alleviate the situation
Based on the system algorithm when Formula 1 is satisfied you can add an HS-PDSCH when Formula 2 is satisfied then an HS-PDSCH is deleted
Formula 1 OcuRateNoHspdsch + OcuRateHspdsch + DpchCodeHy + 32 lt= 512
Formula 2 OcuRateNoHspdsch + OcuRateHspdsch + CodeUptHyA gt 512
OcuRateHspdschHSPDSCH means the number of the codes of SF=512 blocked by the HS-PDSCH OcuRateNoHspdsch means the number of codes of SF=512 blocked by other channels DpchCodeHy means the number of codes of SF=512 reserved for the DPCH and CodeUptHyA is the threshold to decide whether to delete the HSPDSCH
Therefore to ensure the access of the R99 subscribers you can make some adjustment according to Table 4-6 when the code resource is limited though the HSDPA rate may decrease
Table 4-6 Adjusting Code Resource Allocation
AbbreviationParameter
nameRange
and stepCurrent value
Update value
Remark
DpchCodeHy DPCH Code Hysteresis
0512 16 28
To decrease the number of rejected services for DCH no code
CodeUptHyACode Update Hysteresis A
0512 16 28
To decrease the number of rejected services for DCH no code
453 Monitoring CE Resource
The CE resource is mainly monitored through the maximum UE uplinkdownlink usage rate If there is any problem you can solve it by controlling the load or adding more boards
ZTE Confidential Proprietary copy 2012 ZTE CORPORATION All rights reserved 51
UMTS KPI Optimization Analysis Guide Internal Use Only
454 Optimization of Power Control
4541 Monitoring and Optimizing Downlink Power Control
Limited TCP in busy hours will not only increase access failures and call drops in the local cell but also increase soft handover failures and call drops in the neighboring cells Number of rejected services and DCH downlink TCP limit are intuitive KPIs to judge whether TCP is limited Although limited uplink capacity and massive UE moves in the rush hours may also cause call drops the limited TCP is absolutely a key factor
Based on the system algorithm MinHsdpaPower (MinHspaPwrRto) + NoHsPower gtNode B if the safety threshold is used (MinHsdpaPower means the power reserved for HSPA) then it will activate the downlink rate downgrade algorithm flow for the congestion (lower the downlink DCH rate) Although the rate downgrade can ensure access of some subscribers it is an irregular action and will degrade the performance
455 Speeding up Rate Downgrade
Considering that the cells with heavy load reject more access requests you can speed up the rate downgrade during the resource congestion to release the resources as soon as possible and avoid call drops caused by access failures (this method is only applicable to the cells with many PS service users but not those with only CS service users) Table 4-7 is an example of the parameter modification for the rate downgrade
Table 4-7 Example of Parameter Modification for Rate Downgrade
Abbreviation Parameter nameRange and
stepCurrent value
Update value
Remark
UlDnMaxStg Maximum Number of Degraded Uplink Load Steps Every Time
[1 8] 1 2 Downgrade from 384 Kbps to 16 Kbps
DlDnMaxStg Maximum Number of Degraded Downlink Load Steps Every Time
[1 8] 1 3 Downgrade from 384 Kbps to 8 Kbps
456 Monitoring and Optimizing Uplink Capacity
Handover Blocking Rate and RTWP can reflect the uplink capacity of the cell Because interference may also increase RTWP this factor should be distinguished during the RTWP monitoring Another effective indicator is the voice service erl If a cell has over 20 erls in busy hours you should pay special attention to it
ZTE Confidential Proprietary copy 2012 ZTE CORPORATION All rights reserved 52
UMTS KPI Optimization Analysis Guide Internal Use Only
457 Optimization of Uplink Capacity at the Whole Network Level
Case The uplink capacity was limited in a large number of sites after the cutover and the symptoms are a sharp rise of RTWP and a high call drop rate during the rush hours
After the following parameters were modified as shown in Table 4-8 the problem was solved
Table 4-8 Example of Power Control Parameter Modification
AbbreviationParameter
nameRange
Current value
Update value
ULINITSIRUplink Initial SIR target (dB)
UL 34 K136 K signaling UL 122 K AMR
4-5 35
ULMAXSIRMaximum Uplink SIR target (dB)
UL 34 K136 K signaling UL 122 K AMR
15 10
UlSirTargDnStepUplink SIR Target Down Step Size (dB)
UL 34 K136 K signaling UL 122 K AMR
01 02
458 Optimization of Uplink Capacity for a Single Cell
A lot of optimization measures can be taken to bring down the rising RTWP However with increasing subscribers the capacity may still be limited in some area while further modification of SirTarget will obviously degrade the call quality of the whole network and undermine the subscribersrsquo perception In this case you can adjust the power control parameters for a single site that has heavy traffic in the following way add one set of DivPc parameters and use this set of parameters only for this site
Case Table 4-9 shows an example of the power control parameter modification After this modification the call drop rate in the site with heavy traffic decreased to one quarter of the original one
Table 4-9 Example of Power Control Parameter Modification for Heavy-Traffic Cell
SRVTYPE ULINITSIR ULMAXSIR ULMINSIR
0 35-gt15 100-gt35 20-gt10
104 40-gt20 150-gt50 05-gt0
28 35-gt15 100-gt35 05-gt0
50 60-gt20 150-gt50 20-gt0
54 60-gt20 150-gt50 20-gt0
ZTE Confidential Proprietary copy 2012 ZTE CORPORATION All rights reserved 53
UMTS KPI Optimization Analysis Guide Internal Use Only
4432 Inter-RAT Handover Optimization Flowchart
Figure 4-14 Inter-RAT handover optimization flowchart
ZTE Confidential Proprietary copy 2012 ZTE CORPORATION All rights reserved 46
UMTS KPI Optimization Analysis Guide Internal Use Only
Extract performance data
TOP Ncell filtering
Analyze a single cell
1 Check NE alarms
2 Associate emergencies
3 Compare parameter
configurations
4 Associate indicators
5 Locate the fault
comprehensive ly
Exist or not
Handle alarms
Solved or not
Yes
Yes
End
No
No
Exist or not
Handle emergencies
Solved or not
Yes
No
No
Exist or not
Correct wrong parameter
configurations
Solved or not
Yes
No
No
List related indicator counters
RTWPResource
limit indicators
Checkamp analysis of interference
Optimization analysis of
resource limitCounters related to inter-RAT handover failures
C301130667 C301130681C301130668 C301130682C301130669 C301130690C301130670 C301130691C301130671 C301130692C301130672 C301130693C301130673 C301130694C301130674 C301130696C301130675 C301130697C301130677 C301130698C301130678 C301130699C301130679 C301130700
C301130680
Solved or not
Yes
Yes
No
Drive Test+RNC signaling
trace
Yes
Counters related to inter-RAT handover
failures
Cell hand-inhand-out indicators
30049 3005030051 3005230053 30054
ZTE Confidential Proprietary copy 2012 ZTE CORPORATION All rights reserved 47
UMTS KPI Optimization Analysis Guide Internal Use Only
45 Optimization of Resource Indicators
The resource indicators directly reflect the system capacity Increasing subscribers will consume more system resources and some resources may be limited for example the code resource may be limited the TCP access request may be rejected and the CE resource usage rate may exceed the threshold Limited system resources have a negative influence on the whole-network indicators and the subscribersrsquo perception for example call drops may frequently happen and more TCP access requests may be rejected during the voice services
Table 4-5 Resource KPIs and Alarm Thresholds
Resource type KPI No and nameAlarm
threshold
TCP
C301320150 Number of rejected services DCH downlink TCP limit
50
PI30167 Average non-HS (SOA) (SOA)DPA TCP 40
PI30092 Maximum Cell TCP () 100
PI30093 Average Cell TCP 70
UL TrafficPI30029 Handover Blocking Rate 05
KPI RTWP (in busy hour) -98 dBm
Code
C301320153 Number of rejected services DCH no code
50
PI30205 Average Cell HSUPA Users 12
PI30172 Cell Average HSDPA Users 16
CE
PI301830006 Maximum use Ratio of Uplink NodeB CE
60
PI301830010 Maximum use Ratio of Downlink NodeB CE
60
ZTE Confidential Proprietary copy 2012 ZTE CORPORATION All rights reserved 48
UMTS KPI Optimization Analysis Guide Internal Use Only
451 Resource Indicator Optimization Flowchart
Figure 4-15 Resource indicator optimization flowchart
ZTE Confidential Proprietary copy 2012 ZTE CORPORATION All rights reserved 49
UMTS KPI Optimization Analysis Guide Internal Use Only
Extract performance data
TOP Ncell filtering
Analyze a single cell
1 Check NE alarms
2 Associate emergencies
3 Compare parameter
configurations
4 Associate indicators
5 Locate the fault
comprehensive ly
Exist or not
Handle alarms
Solved or not
Yes
是
End
No
No
Exist or not
Handle emergencies
Solved or not
Yes
No
No
Exist or not
Correct wrong parameter
configurations
Solved or not
Yes
No
No
List related indicator counters
Code resource indicators
CE resource indicators
TCPadmission
reject counter
C301320150
Solved or not
Yes
Yes
No
Drive Test+RNC signaling
trace
Yes
Counter related to TCP limit
Cell TX power
indicators
30090 3009130092 3009330166 3016730168 3016930170 30171
30163301643016530075
30223302243045030451
Yes
Yes
ZTE Confidential Proprietary copy 2012 ZTE CORPORATION All rights reserved 50
UMTS KPI Optimization Analysis Guide Internal Use Only
452 Code Resource Optimization
The statistics of Number of rejected services and DCH no code the average code resource usage rate and the number of the HSDPA subscribers can be used to judge whether the code resource in a cell is limited If the code resource is limited you can adjust the code resource allocation to alleviate the situation
Based on the system algorithm when Formula 1 is satisfied you can add an HS-PDSCH when Formula 2 is satisfied then an HS-PDSCH is deleted
Formula 1 OcuRateNoHspdsch + OcuRateHspdsch + DpchCodeHy + 32 lt= 512
Formula 2 OcuRateNoHspdsch + OcuRateHspdsch + CodeUptHyA gt 512
OcuRateHspdschHSPDSCH means the number of the codes of SF=512 blocked by the HS-PDSCH OcuRateNoHspdsch means the number of codes of SF=512 blocked by other channels DpchCodeHy means the number of codes of SF=512 reserved for the DPCH and CodeUptHyA is the threshold to decide whether to delete the HSPDSCH
Therefore to ensure the access of the R99 subscribers you can make some adjustment according to Table 4-6 when the code resource is limited though the HSDPA rate may decrease
Table 4-6 Adjusting Code Resource Allocation
AbbreviationParameter
nameRange
and stepCurrent value
Update value
Remark
DpchCodeHy DPCH Code Hysteresis
0512 16 28
To decrease the number of rejected services for DCH no code
CodeUptHyACode Update Hysteresis A
0512 16 28
To decrease the number of rejected services for DCH no code
453 Monitoring CE Resource
The CE resource is mainly monitored through the maximum UE uplinkdownlink usage rate If there is any problem you can solve it by controlling the load or adding more boards
ZTE Confidential Proprietary copy 2012 ZTE CORPORATION All rights reserved 51
UMTS KPI Optimization Analysis Guide Internal Use Only
454 Optimization of Power Control
4541 Monitoring and Optimizing Downlink Power Control
Limited TCP in busy hours will not only increase access failures and call drops in the local cell but also increase soft handover failures and call drops in the neighboring cells Number of rejected services and DCH downlink TCP limit are intuitive KPIs to judge whether TCP is limited Although limited uplink capacity and massive UE moves in the rush hours may also cause call drops the limited TCP is absolutely a key factor
Based on the system algorithm MinHsdpaPower (MinHspaPwrRto) + NoHsPower gtNode B if the safety threshold is used (MinHsdpaPower means the power reserved for HSPA) then it will activate the downlink rate downgrade algorithm flow for the congestion (lower the downlink DCH rate) Although the rate downgrade can ensure access of some subscribers it is an irregular action and will degrade the performance
455 Speeding up Rate Downgrade
Considering that the cells with heavy load reject more access requests you can speed up the rate downgrade during the resource congestion to release the resources as soon as possible and avoid call drops caused by access failures (this method is only applicable to the cells with many PS service users but not those with only CS service users) Table 4-7 is an example of the parameter modification for the rate downgrade
Table 4-7 Example of Parameter Modification for Rate Downgrade
Abbreviation Parameter nameRange and
stepCurrent value
Update value
Remark
UlDnMaxStg Maximum Number of Degraded Uplink Load Steps Every Time
[1 8] 1 2 Downgrade from 384 Kbps to 16 Kbps
DlDnMaxStg Maximum Number of Degraded Downlink Load Steps Every Time
[1 8] 1 3 Downgrade from 384 Kbps to 8 Kbps
456 Monitoring and Optimizing Uplink Capacity
Handover Blocking Rate and RTWP can reflect the uplink capacity of the cell Because interference may also increase RTWP this factor should be distinguished during the RTWP monitoring Another effective indicator is the voice service erl If a cell has over 20 erls in busy hours you should pay special attention to it
ZTE Confidential Proprietary copy 2012 ZTE CORPORATION All rights reserved 52
UMTS KPI Optimization Analysis Guide Internal Use Only
457 Optimization of Uplink Capacity at the Whole Network Level
Case The uplink capacity was limited in a large number of sites after the cutover and the symptoms are a sharp rise of RTWP and a high call drop rate during the rush hours
After the following parameters were modified as shown in Table 4-8 the problem was solved
Table 4-8 Example of Power Control Parameter Modification
AbbreviationParameter
nameRange
Current value
Update value
ULINITSIRUplink Initial SIR target (dB)
UL 34 K136 K signaling UL 122 K AMR
4-5 35
ULMAXSIRMaximum Uplink SIR target (dB)
UL 34 K136 K signaling UL 122 K AMR
15 10
UlSirTargDnStepUplink SIR Target Down Step Size (dB)
UL 34 K136 K signaling UL 122 K AMR
01 02
458 Optimization of Uplink Capacity for a Single Cell
A lot of optimization measures can be taken to bring down the rising RTWP However with increasing subscribers the capacity may still be limited in some area while further modification of SirTarget will obviously degrade the call quality of the whole network and undermine the subscribersrsquo perception In this case you can adjust the power control parameters for a single site that has heavy traffic in the following way add one set of DivPc parameters and use this set of parameters only for this site
Case Table 4-9 shows an example of the power control parameter modification After this modification the call drop rate in the site with heavy traffic decreased to one quarter of the original one
Table 4-9 Example of Power Control Parameter Modification for Heavy-Traffic Cell
SRVTYPE ULINITSIR ULMAXSIR ULMINSIR
0 35-gt15 100-gt35 20-gt10
104 40-gt20 150-gt50 05-gt0
28 35-gt15 100-gt35 05-gt0
50 60-gt20 150-gt50 20-gt0
54 60-gt20 150-gt50 20-gt0
ZTE Confidential Proprietary copy 2012 ZTE CORPORATION All rights reserved 53
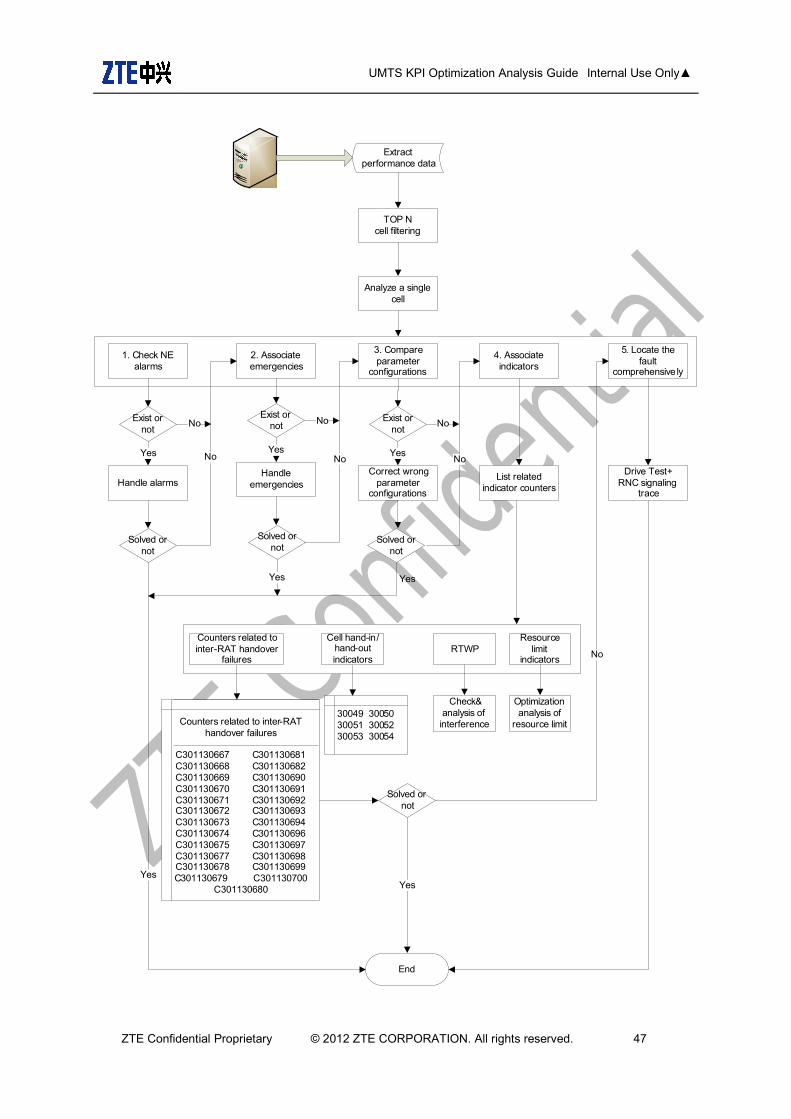
UMTS KPI Optimization Analysis Guide Internal Use Only
Extract performance data
TOP Ncell filtering
Analyze a single cell
1 Check NE alarms
2 Associate emergencies
3 Compare parameter
configurations
4 Associate indicators
5 Locate the fault
comprehensive ly
Exist or not
Handle alarms
Solved or not
Yes
Yes
End
No
No
Exist or not
Handle emergencies
Solved or not
Yes
No
No
Exist or not
Correct wrong parameter
configurations
Solved or not
Yes
No
No
List related indicator counters
RTWPResource
limit indicators
Checkamp analysis of interference
Optimization analysis of
resource limitCounters related to inter-RAT handover failures
C301130667 C301130681C301130668 C301130682C301130669 C301130690C301130670 C301130691C301130671 C301130692C301130672 C301130693C301130673 C301130694C301130674 C301130696C301130675 C301130697C301130677 C301130698C301130678 C301130699C301130679 C301130700
C301130680
Solved or not
Yes
Yes
No
Drive Test+RNC signaling
trace
Yes
Counters related to inter-RAT handover
failures
Cell hand-inhand-out indicators
30049 3005030051 3005230053 30054
ZTE Confidential Proprietary copy 2012 ZTE CORPORATION All rights reserved 47
UMTS KPI Optimization Analysis Guide Internal Use Only
45 Optimization of Resource Indicators
The resource indicators directly reflect the system capacity Increasing subscribers will consume more system resources and some resources may be limited for example the code resource may be limited the TCP access request may be rejected and the CE resource usage rate may exceed the threshold Limited system resources have a negative influence on the whole-network indicators and the subscribersrsquo perception for example call drops may frequently happen and more TCP access requests may be rejected during the voice services
Table 4-5 Resource KPIs and Alarm Thresholds
Resource type KPI No and nameAlarm
threshold
TCP
C301320150 Number of rejected services DCH downlink TCP limit
50
PI30167 Average non-HS (SOA) (SOA)DPA TCP 40
PI30092 Maximum Cell TCP () 100
PI30093 Average Cell TCP 70
UL TrafficPI30029 Handover Blocking Rate 05
KPI RTWP (in busy hour) -98 dBm
Code
C301320153 Number of rejected services DCH no code
50
PI30205 Average Cell HSUPA Users 12
PI30172 Cell Average HSDPA Users 16
CE
PI301830006 Maximum use Ratio of Uplink NodeB CE
60
PI301830010 Maximum use Ratio of Downlink NodeB CE
60
ZTE Confidential Proprietary copy 2012 ZTE CORPORATION All rights reserved 48
UMTS KPI Optimization Analysis Guide Internal Use Only
451 Resource Indicator Optimization Flowchart
Figure 4-15 Resource indicator optimization flowchart
ZTE Confidential Proprietary copy 2012 ZTE CORPORATION All rights reserved 49
UMTS KPI Optimization Analysis Guide Internal Use Only
Extract performance data
TOP Ncell filtering
Analyze a single cell
1 Check NE alarms
2 Associate emergencies
3 Compare parameter
configurations
4 Associate indicators
5 Locate the fault
comprehensive ly
Exist or not
Handle alarms
Solved or not
Yes
是
End
No
No
Exist or not
Handle emergencies
Solved or not
Yes
No
No
Exist or not
Correct wrong parameter
configurations
Solved or not
Yes
No
No
List related indicator counters
Code resource indicators
CE resource indicators
TCPadmission
reject counter
C301320150
Solved or not
Yes
Yes
No
Drive Test+RNC signaling
trace
Yes
Counter related to TCP limit
Cell TX power
indicators
30090 3009130092 3009330166 3016730168 3016930170 30171
30163301643016530075
30223302243045030451
Yes
Yes
ZTE Confidential Proprietary copy 2012 ZTE CORPORATION All rights reserved 50
UMTS KPI Optimization Analysis Guide Internal Use Only
452 Code Resource Optimization
The statistics of Number of rejected services and DCH no code the average code resource usage rate and the number of the HSDPA subscribers can be used to judge whether the code resource in a cell is limited If the code resource is limited you can adjust the code resource allocation to alleviate the situation
Based on the system algorithm when Formula 1 is satisfied you can add an HS-PDSCH when Formula 2 is satisfied then an HS-PDSCH is deleted
Formula 1 OcuRateNoHspdsch + OcuRateHspdsch + DpchCodeHy + 32 lt= 512
Formula 2 OcuRateNoHspdsch + OcuRateHspdsch + CodeUptHyA gt 512
OcuRateHspdschHSPDSCH means the number of the codes of SF=512 blocked by the HS-PDSCH OcuRateNoHspdsch means the number of codes of SF=512 blocked by other channels DpchCodeHy means the number of codes of SF=512 reserved for the DPCH and CodeUptHyA is the threshold to decide whether to delete the HSPDSCH
Therefore to ensure the access of the R99 subscribers you can make some adjustment according to Table 4-6 when the code resource is limited though the HSDPA rate may decrease
Table 4-6 Adjusting Code Resource Allocation
AbbreviationParameter
nameRange
and stepCurrent value
Update value
Remark
DpchCodeHy DPCH Code Hysteresis
0512 16 28
To decrease the number of rejected services for DCH no code
CodeUptHyACode Update Hysteresis A
0512 16 28
To decrease the number of rejected services for DCH no code
453 Monitoring CE Resource
The CE resource is mainly monitored through the maximum UE uplinkdownlink usage rate If there is any problem you can solve it by controlling the load or adding more boards
ZTE Confidential Proprietary copy 2012 ZTE CORPORATION All rights reserved 51
UMTS KPI Optimization Analysis Guide Internal Use Only
454 Optimization of Power Control
4541 Monitoring and Optimizing Downlink Power Control
Limited TCP in busy hours will not only increase access failures and call drops in the local cell but also increase soft handover failures and call drops in the neighboring cells Number of rejected services and DCH downlink TCP limit are intuitive KPIs to judge whether TCP is limited Although limited uplink capacity and massive UE moves in the rush hours may also cause call drops the limited TCP is absolutely a key factor
Based on the system algorithm MinHsdpaPower (MinHspaPwrRto) + NoHsPower gtNode B if the safety threshold is used (MinHsdpaPower means the power reserved for HSPA) then it will activate the downlink rate downgrade algorithm flow for the congestion (lower the downlink DCH rate) Although the rate downgrade can ensure access of some subscribers it is an irregular action and will degrade the performance
455 Speeding up Rate Downgrade
Considering that the cells with heavy load reject more access requests you can speed up the rate downgrade during the resource congestion to release the resources as soon as possible and avoid call drops caused by access failures (this method is only applicable to the cells with many PS service users but not those with only CS service users) Table 4-7 is an example of the parameter modification for the rate downgrade
Table 4-7 Example of Parameter Modification for Rate Downgrade
Abbreviation Parameter nameRange and
stepCurrent value
Update value
Remark
UlDnMaxStg Maximum Number of Degraded Uplink Load Steps Every Time
[1 8] 1 2 Downgrade from 384 Kbps to 16 Kbps
DlDnMaxStg Maximum Number of Degraded Downlink Load Steps Every Time
[1 8] 1 3 Downgrade from 384 Kbps to 8 Kbps
456 Monitoring and Optimizing Uplink Capacity
Handover Blocking Rate and RTWP can reflect the uplink capacity of the cell Because interference may also increase RTWP this factor should be distinguished during the RTWP monitoring Another effective indicator is the voice service erl If a cell has over 20 erls in busy hours you should pay special attention to it
ZTE Confidential Proprietary copy 2012 ZTE CORPORATION All rights reserved 52
UMTS KPI Optimization Analysis Guide Internal Use Only
457 Optimization of Uplink Capacity at the Whole Network Level
Case The uplink capacity was limited in a large number of sites after the cutover and the symptoms are a sharp rise of RTWP and a high call drop rate during the rush hours
After the following parameters were modified as shown in Table 4-8 the problem was solved
Table 4-8 Example of Power Control Parameter Modification
AbbreviationParameter
nameRange
Current value
Update value
ULINITSIRUplink Initial SIR target (dB)
UL 34 K136 K signaling UL 122 K AMR
4-5 35
ULMAXSIRMaximum Uplink SIR target (dB)
UL 34 K136 K signaling UL 122 K AMR
15 10
UlSirTargDnStepUplink SIR Target Down Step Size (dB)
UL 34 K136 K signaling UL 122 K AMR
01 02
458 Optimization of Uplink Capacity for a Single Cell
A lot of optimization measures can be taken to bring down the rising RTWP However with increasing subscribers the capacity may still be limited in some area while further modification of SirTarget will obviously degrade the call quality of the whole network and undermine the subscribersrsquo perception In this case you can adjust the power control parameters for a single site that has heavy traffic in the following way add one set of DivPc parameters and use this set of parameters only for this site
Case Table 4-9 shows an example of the power control parameter modification After this modification the call drop rate in the site with heavy traffic decreased to one quarter of the original one
Table 4-9 Example of Power Control Parameter Modification for Heavy-Traffic Cell
SRVTYPE ULINITSIR ULMAXSIR ULMINSIR
0 35-gt15 100-gt35 20-gt10
104 40-gt20 150-gt50 05-gt0
28 35-gt15 100-gt35 05-gt0
50 60-gt20 150-gt50 20-gt0
54 60-gt20 150-gt50 20-gt0
ZTE Confidential Proprietary copy 2012 ZTE CORPORATION All rights reserved 53
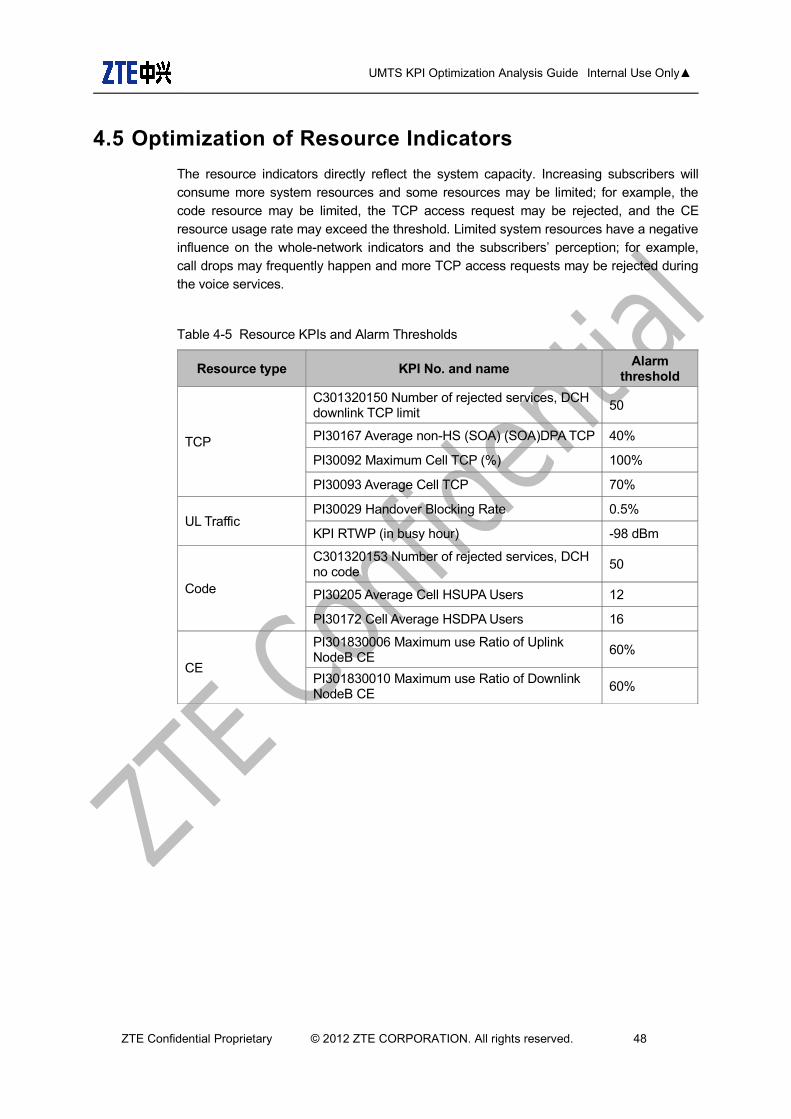
UMTS KPI Optimization Analysis Guide Internal Use Only
451 Resource Indicator Optimization Flowchart
Figure 4-15 Resource indicator optimization flowchart
ZTE Confidential Proprietary copy 2012 ZTE CORPORATION All rights reserved 49
UMTS KPI Optimization Analysis Guide Internal Use Only
Extract performance data
TOP Ncell filtering
Analyze a single cell
1 Check NE alarms
2 Associate emergencies
3 Compare parameter
configurations
4 Associate indicators
5 Locate the fault
comprehensive ly
Exist or not
Handle alarms
Solved or not
Yes
是
End
No
No
Exist or not
Handle emergencies
Solved or not
Yes
No
No
Exist or not
Correct wrong parameter
configurations
Solved or not
Yes
No
No
List related indicator counters
Code resource indicators
CE resource indicators
TCPadmission
reject counter
C301320150
Solved or not
Yes
Yes
No
Drive Test+RNC signaling
trace
Yes
Counter related to TCP limit
Cell TX power
indicators
30090 3009130092 3009330166 3016730168 3016930170 30171
30163301643016530075
30223302243045030451
Yes
Yes
ZTE Confidential Proprietary copy 2012 ZTE CORPORATION All rights reserved 50
UMTS KPI Optimization Analysis Guide Internal Use Only
452 Code Resource Optimization
The statistics of Number of rejected services and DCH no code the average code resource usage rate and the number of the HSDPA subscribers can be used to judge whether the code resource in a cell is limited If the code resource is limited you can adjust the code resource allocation to alleviate the situation
Based on the system algorithm when Formula 1 is satisfied you can add an HS-PDSCH when Formula 2 is satisfied then an HS-PDSCH is deleted
Formula 1 OcuRateNoHspdsch + OcuRateHspdsch + DpchCodeHy + 32 lt= 512
Formula 2 OcuRateNoHspdsch + OcuRateHspdsch + CodeUptHyA gt 512
OcuRateHspdschHSPDSCH means the number of the codes of SF=512 blocked by the HS-PDSCH OcuRateNoHspdsch means the number of codes of SF=512 blocked by other channels DpchCodeHy means the number of codes of SF=512 reserved for the DPCH and CodeUptHyA is the threshold to decide whether to delete the HSPDSCH
Therefore to ensure the access of the R99 subscribers you can make some adjustment according to Table 4-6 when the code resource is limited though the HSDPA rate may decrease
Table 4-6 Adjusting Code Resource Allocation
AbbreviationParameter
nameRange
and stepCurrent value
Update value
Remark
DpchCodeHy DPCH Code Hysteresis
0512 16 28
To decrease the number of rejected services for DCH no code
CodeUptHyACode Update Hysteresis A
0512 16 28
To decrease the number of rejected services for DCH no code
453 Monitoring CE Resource
The CE resource is mainly monitored through the maximum UE uplinkdownlink usage rate If there is any problem you can solve it by controlling the load or adding more boards
ZTE Confidential Proprietary copy 2012 ZTE CORPORATION All rights reserved 51
UMTS KPI Optimization Analysis Guide Internal Use Only
454 Optimization of Power Control
4541 Monitoring and Optimizing Downlink Power Control
Limited TCP in busy hours will not only increase access failures and call drops in the local cell but also increase soft handover failures and call drops in the neighboring cells Number of rejected services and DCH downlink TCP limit are intuitive KPIs to judge whether TCP is limited Although limited uplink capacity and massive UE moves in the rush hours may also cause call drops the limited TCP is absolutely a key factor
Based on the system algorithm MinHsdpaPower (MinHspaPwrRto) + NoHsPower gtNode B if the safety threshold is used (MinHsdpaPower means the power reserved for HSPA) then it will activate the downlink rate downgrade algorithm flow for the congestion (lower the downlink DCH rate) Although the rate downgrade can ensure access of some subscribers it is an irregular action and will degrade the performance
455 Speeding up Rate Downgrade
Considering that the cells with heavy load reject more access requests you can speed up the rate downgrade during the resource congestion to release the resources as soon as possible and avoid call drops caused by access failures (this method is only applicable to the cells with many PS service users but not those with only CS service users) Table 4-7 is an example of the parameter modification for the rate downgrade
Table 4-7 Example of Parameter Modification for Rate Downgrade
Abbreviation Parameter nameRange and
stepCurrent value
Update value
Remark
UlDnMaxStg Maximum Number of Degraded Uplink Load Steps Every Time
[1 8] 1 2 Downgrade from 384 Kbps to 16 Kbps
DlDnMaxStg Maximum Number of Degraded Downlink Load Steps Every Time
[1 8] 1 3 Downgrade from 384 Kbps to 8 Kbps
456 Monitoring and Optimizing Uplink Capacity
Handover Blocking Rate and RTWP can reflect the uplink capacity of the cell Because interference may also increase RTWP this factor should be distinguished during the RTWP monitoring Another effective indicator is the voice service erl If a cell has over 20 erls in busy hours you should pay special attention to it
ZTE Confidential Proprietary copy 2012 ZTE CORPORATION All rights reserved 52
UMTS KPI Optimization Analysis Guide Internal Use Only
457 Optimization of Uplink Capacity at the Whole Network Level
Case The uplink capacity was limited in a large number of sites after the cutover and the symptoms are a sharp rise of RTWP and a high call drop rate during the rush hours
After the following parameters were modified as shown in Table 4-8 the problem was solved
Table 4-8 Example of Power Control Parameter Modification
AbbreviationParameter
nameRange
Current value
Update value
ULINITSIRUplink Initial SIR target (dB)
UL 34 K136 K signaling UL 122 K AMR
4-5 35
ULMAXSIRMaximum Uplink SIR target (dB)
UL 34 K136 K signaling UL 122 K AMR
15 10
UlSirTargDnStepUplink SIR Target Down Step Size (dB)
UL 34 K136 K signaling UL 122 K AMR
01 02
458 Optimization of Uplink Capacity for a Single Cell
A lot of optimization measures can be taken to bring down the rising RTWP However with increasing subscribers the capacity may still be limited in some area while further modification of SirTarget will obviously degrade the call quality of the whole network and undermine the subscribersrsquo perception In this case you can adjust the power control parameters for a single site that has heavy traffic in the following way add one set of DivPc parameters and use this set of parameters only for this site
Case Table 4-9 shows an example of the power control parameter modification After this modification the call drop rate in the site with heavy traffic decreased to one quarter of the original one
Table 4-9 Example of Power Control Parameter Modification for Heavy-Traffic Cell
SRVTYPE ULINITSIR ULMAXSIR ULMINSIR
0 35-gt15 100-gt35 20-gt10
104 40-gt20 150-gt50 05-gt0
28 35-gt15 100-gt35 05-gt0
50 60-gt20 150-gt50 20-gt0
54 60-gt20 150-gt50 20-gt0
ZTE Confidential Proprietary copy 2012 ZTE CORPORATION All rights reserved 53
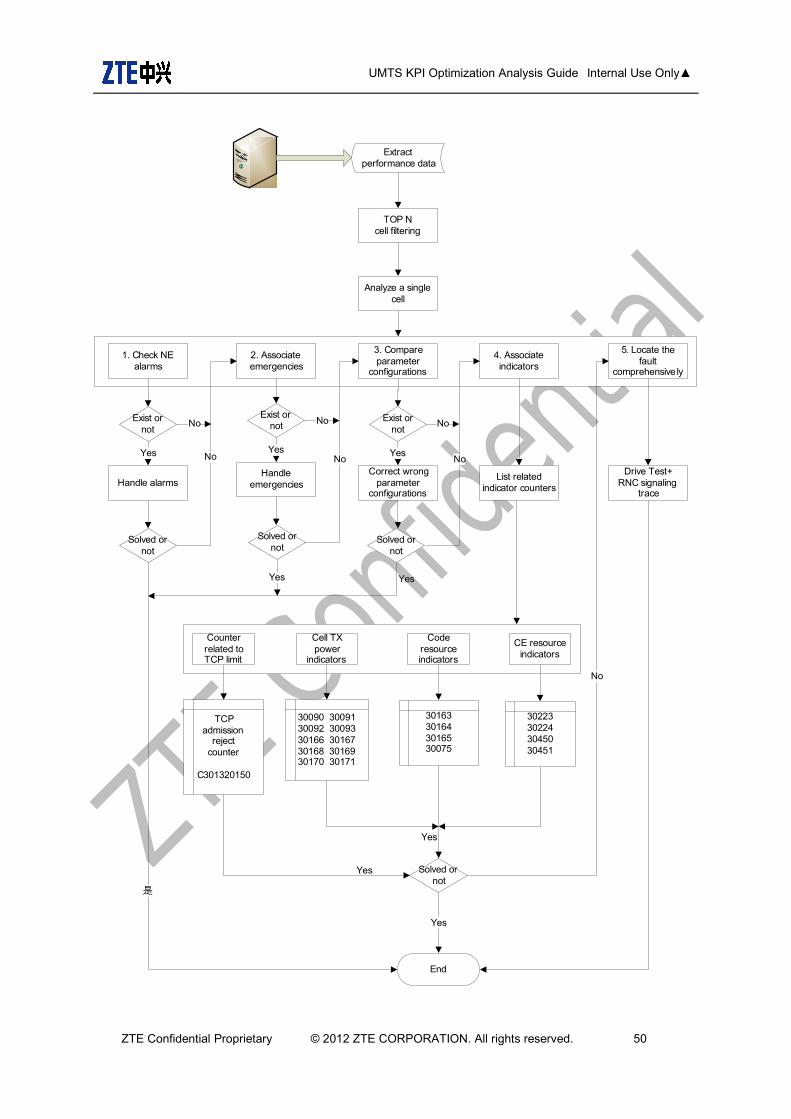
UMTS KPI Optimization Analysis Guide Internal Use Only
Extract performance data
TOP Ncell filtering
Analyze a single cell
1 Check NE alarms
2 Associate emergencies
3 Compare parameter
configurations
4 Associate indicators
5 Locate the fault
comprehensive ly
Exist or not
Handle alarms
Solved or not
Yes
是
End
No
No
Exist or not
Handle emergencies
Solved or not
Yes
No
No
Exist or not
Correct wrong parameter
configurations
Solved or not
Yes
No
No
List related indicator counters
Code resource indicators
CE resource indicators
TCPadmission
reject counter
C301320150
Solved or not
Yes
Yes
No
Drive Test+RNC signaling
trace
Yes
Counter related to TCP limit
Cell TX power
indicators
30090 3009130092 3009330166 3016730168 3016930170 30171
30163301643016530075
30223302243045030451
Yes
Yes
ZTE Confidential Proprietary copy 2012 ZTE CORPORATION All rights reserved 50
UMTS KPI Optimization Analysis Guide Internal Use Only
452 Code Resource Optimization
The statistics of Number of rejected services and DCH no code the average code resource usage rate and the number of the HSDPA subscribers can be used to judge whether the code resource in a cell is limited If the code resource is limited you can adjust the code resource allocation to alleviate the situation
Based on the system algorithm when Formula 1 is satisfied you can add an HS-PDSCH when Formula 2 is satisfied then an HS-PDSCH is deleted
Formula 1 OcuRateNoHspdsch + OcuRateHspdsch + DpchCodeHy + 32 lt= 512
Formula 2 OcuRateNoHspdsch + OcuRateHspdsch + CodeUptHyA gt 512
OcuRateHspdschHSPDSCH means the number of the codes of SF=512 blocked by the HS-PDSCH OcuRateNoHspdsch means the number of codes of SF=512 blocked by other channels DpchCodeHy means the number of codes of SF=512 reserved for the DPCH and CodeUptHyA is the threshold to decide whether to delete the HSPDSCH
Therefore to ensure the access of the R99 subscribers you can make some adjustment according to Table 4-6 when the code resource is limited though the HSDPA rate may decrease
Table 4-6 Adjusting Code Resource Allocation
AbbreviationParameter
nameRange
and stepCurrent value
Update value
Remark
DpchCodeHy DPCH Code Hysteresis
0512 16 28
To decrease the number of rejected services for DCH no code
CodeUptHyACode Update Hysteresis A
0512 16 28
To decrease the number of rejected services for DCH no code
453 Monitoring CE Resource
The CE resource is mainly monitored through the maximum UE uplinkdownlink usage rate If there is any problem you can solve it by controlling the load or adding more boards
ZTE Confidential Proprietary copy 2012 ZTE CORPORATION All rights reserved 51
UMTS KPI Optimization Analysis Guide Internal Use Only
454 Optimization of Power Control
4541 Monitoring and Optimizing Downlink Power Control
Limited TCP in busy hours will not only increase access failures and call drops in the local cell but also increase soft handover failures and call drops in the neighboring cells Number of rejected services and DCH downlink TCP limit are intuitive KPIs to judge whether TCP is limited Although limited uplink capacity and massive UE moves in the rush hours may also cause call drops the limited TCP is absolutely a key factor
Based on the system algorithm MinHsdpaPower (MinHspaPwrRto) + NoHsPower gtNode B if the safety threshold is used (MinHsdpaPower means the power reserved for HSPA) then it will activate the downlink rate downgrade algorithm flow for the congestion (lower the downlink DCH rate) Although the rate downgrade can ensure access of some subscribers it is an irregular action and will degrade the performance
455 Speeding up Rate Downgrade
Considering that the cells with heavy load reject more access requests you can speed up the rate downgrade during the resource congestion to release the resources as soon as possible and avoid call drops caused by access failures (this method is only applicable to the cells with many PS service users but not those with only CS service users) Table 4-7 is an example of the parameter modification for the rate downgrade
Table 4-7 Example of Parameter Modification for Rate Downgrade
Abbreviation Parameter nameRange and
stepCurrent value
Update value
Remark
UlDnMaxStg Maximum Number of Degraded Uplink Load Steps Every Time
[1 8] 1 2 Downgrade from 384 Kbps to 16 Kbps
DlDnMaxStg Maximum Number of Degraded Downlink Load Steps Every Time
[1 8] 1 3 Downgrade from 384 Kbps to 8 Kbps
456 Monitoring and Optimizing Uplink Capacity
Handover Blocking Rate and RTWP can reflect the uplink capacity of the cell Because interference may also increase RTWP this factor should be distinguished during the RTWP monitoring Another effective indicator is the voice service erl If a cell has over 20 erls in busy hours you should pay special attention to it
ZTE Confidential Proprietary copy 2012 ZTE CORPORATION All rights reserved 52
UMTS KPI Optimization Analysis Guide Internal Use Only
457 Optimization of Uplink Capacity at the Whole Network Level
Case The uplink capacity was limited in a large number of sites after the cutover and the symptoms are a sharp rise of RTWP and a high call drop rate during the rush hours
After the following parameters were modified as shown in Table 4-8 the problem was solved
Table 4-8 Example of Power Control Parameter Modification
AbbreviationParameter
nameRange
Current value
Update value
ULINITSIRUplink Initial SIR target (dB)
UL 34 K136 K signaling UL 122 K AMR
4-5 35
ULMAXSIRMaximum Uplink SIR target (dB)
UL 34 K136 K signaling UL 122 K AMR
15 10
UlSirTargDnStepUplink SIR Target Down Step Size (dB)
UL 34 K136 K signaling UL 122 K AMR
01 02
458 Optimization of Uplink Capacity for a Single Cell
A lot of optimization measures can be taken to bring down the rising RTWP However with increasing subscribers the capacity may still be limited in some area while further modification of SirTarget will obviously degrade the call quality of the whole network and undermine the subscribersrsquo perception In this case you can adjust the power control parameters for a single site that has heavy traffic in the following way add one set of DivPc parameters and use this set of parameters only for this site
Case Table 4-9 shows an example of the power control parameter modification After this modification the call drop rate in the site with heavy traffic decreased to one quarter of the original one
Table 4-9 Example of Power Control Parameter Modification for Heavy-Traffic Cell
SRVTYPE ULINITSIR ULMAXSIR ULMINSIR
0 35-gt15 100-gt35 20-gt10
104 40-gt20 150-gt50 05-gt0
28 35-gt15 100-gt35 05-gt0
50 60-gt20 150-gt50 20-gt0
54 60-gt20 150-gt50 20-gt0
ZTE Confidential Proprietary copy 2012 ZTE CORPORATION All rights reserved 53
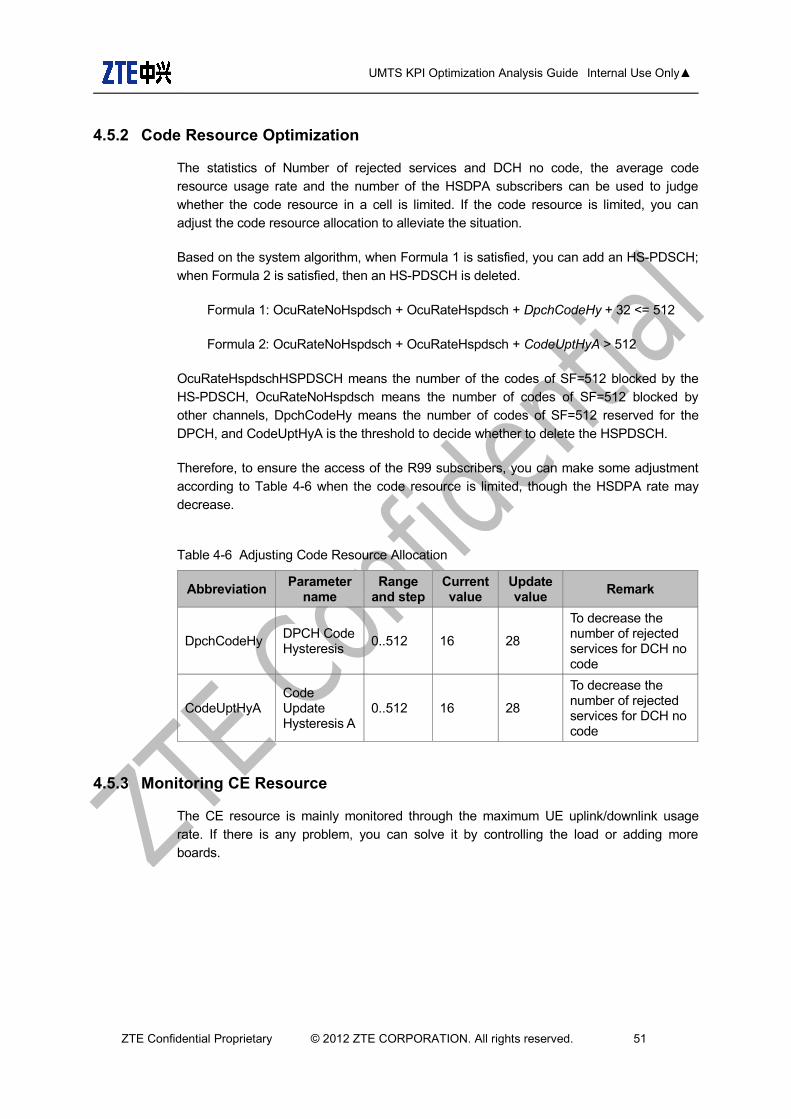
UMTS KPI Optimization Analysis Guide Internal Use Only
452 Code Resource Optimization
The statistics of Number of rejected services and DCH no code the average code resource usage rate and the number of the HSDPA subscribers can be used to judge whether the code resource in a cell is limited If the code resource is limited you can adjust the code resource allocation to alleviate the situation
Based on the system algorithm when Formula 1 is satisfied you can add an HS-PDSCH when Formula 2 is satisfied then an HS-PDSCH is deleted
Formula 1 OcuRateNoHspdsch + OcuRateHspdsch + DpchCodeHy + 32 lt= 512
Formula 2 OcuRateNoHspdsch + OcuRateHspdsch + CodeUptHyA gt 512
OcuRateHspdschHSPDSCH means the number of the codes of SF=512 blocked by the HS-PDSCH OcuRateNoHspdsch means the number of codes of SF=512 blocked by other channels DpchCodeHy means the number of codes of SF=512 reserved for the DPCH and CodeUptHyA is the threshold to decide whether to delete the HSPDSCH
Therefore to ensure the access of the R99 subscribers you can make some adjustment according to Table 4-6 when the code resource is limited though the HSDPA rate may decrease
Table 4-6 Adjusting Code Resource Allocation
AbbreviationParameter
nameRange
and stepCurrent value
Update value
Remark
DpchCodeHy DPCH Code Hysteresis
0512 16 28
To decrease the number of rejected services for DCH no code
CodeUptHyACode Update Hysteresis A
0512 16 28
To decrease the number of rejected services for DCH no code
453 Monitoring CE Resource
The CE resource is mainly monitored through the maximum UE uplinkdownlink usage rate If there is any problem you can solve it by controlling the load or adding more boards
ZTE Confidential Proprietary copy 2012 ZTE CORPORATION All rights reserved 51
UMTS KPI Optimization Analysis Guide Internal Use Only
454 Optimization of Power Control
4541 Monitoring and Optimizing Downlink Power Control
Limited TCP in busy hours will not only increase access failures and call drops in the local cell but also increase soft handover failures and call drops in the neighboring cells Number of rejected services and DCH downlink TCP limit are intuitive KPIs to judge whether TCP is limited Although limited uplink capacity and massive UE moves in the rush hours may also cause call drops the limited TCP is absolutely a key factor
Based on the system algorithm MinHsdpaPower (MinHspaPwrRto) + NoHsPower gtNode B if the safety threshold is used (MinHsdpaPower means the power reserved for HSPA) then it will activate the downlink rate downgrade algorithm flow for the congestion (lower the downlink DCH rate) Although the rate downgrade can ensure access of some subscribers it is an irregular action and will degrade the performance
455 Speeding up Rate Downgrade
Considering that the cells with heavy load reject more access requests you can speed up the rate downgrade during the resource congestion to release the resources as soon as possible and avoid call drops caused by access failures (this method is only applicable to the cells with many PS service users but not those with only CS service users) Table 4-7 is an example of the parameter modification for the rate downgrade
Table 4-7 Example of Parameter Modification for Rate Downgrade
Abbreviation Parameter nameRange and
stepCurrent value
Update value
Remark
UlDnMaxStg Maximum Number of Degraded Uplink Load Steps Every Time
[1 8] 1 2 Downgrade from 384 Kbps to 16 Kbps
DlDnMaxStg Maximum Number of Degraded Downlink Load Steps Every Time
[1 8] 1 3 Downgrade from 384 Kbps to 8 Kbps
456 Monitoring and Optimizing Uplink Capacity
Handover Blocking Rate and RTWP can reflect the uplink capacity of the cell Because interference may also increase RTWP this factor should be distinguished during the RTWP monitoring Another effective indicator is the voice service erl If a cell has over 20 erls in busy hours you should pay special attention to it
ZTE Confidential Proprietary copy 2012 ZTE CORPORATION All rights reserved 52
UMTS KPI Optimization Analysis Guide Internal Use Only
457 Optimization of Uplink Capacity at the Whole Network Level
Case The uplink capacity was limited in a large number of sites after the cutover and the symptoms are a sharp rise of RTWP and a high call drop rate during the rush hours
After the following parameters were modified as shown in Table 4-8 the problem was solved
Table 4-8 Example of Power Control Parameter Modification
AbbreviationParameter
nameRange
Current value
Update value
ULINITSIRUplink Initial SIR target (dB)
UL 34 K136 K signaling UL 122 K AMR
4-5 35
ULMAXSIRMaximum Uplink SIR target (dB)
UL 34 K136 K signaling UL 122 K AMR
15 10
UlSirTargDnStepUplink SIR Target Down Step Size (dB)
UL 34 K136 K signaling UL 122 K AMR
01 02
458 Optimization of Uplink Capacity for a Single Cell
A lot of optimization measures can be taken to bring down the rising RTWP However with increasing subscribers the capacity may still be limited in some area while further modification of SirTarget will obviously degrade the call quality of the whole network and undermine the subscribersrsquo perception In this case you can adjust the power control parameters for a single site that has heavy traffic in the following way add one set of DivPc parameters and use this set of parameters only for this site
Case Table 4-9 shows an example of the power control parameter modification After this modification the call drop rate in the site with heavy traffic decreased to one quarter of the original one
Table 4-9 Example of Power Control Parameter Modification for Heavy-Traffic Cell
SRVTYPE ULINITSIR ULMAXSIR ULMINSIR
0 35-gt15 100-gt35 20-gt10
104 40-gt20 150-gt50 05-gt0
28 35-gt15 100-gt35 05-gt0
50 60-gt20 150-gt50 20-gt0
54 60-gt20 150-gt50 20-gt0
ZTE Confidential Proprietary copy 2012 ZTE CORPORATION All rights reserved 53
UMTS KPI Optimization Analysis Guide Internal Use Only
457 Optimization of Uplink Capacity at the Whole Network Level
Case The uplink capacity was limited in a large number of sites after the cutover and the symptoms are a sharp rise of RTWP and a high call drop rate during the rush hours
After the following parameters were modified as shown in Table 4-8 the problem was solved
Table 4-8 Example of Power Control Parameter Modification
AbbreviationParameter
nameRange
Current value
Update value
ULINITSIRUplink Initial SIR target (dB)
UL 34 K136 K signaling UL 122 K AMR
4-5 35
ULMAXSIRMaximum Uplink SIR target (dB)
UL 34 K136 K signaling UL 122 K AMR
15 10
UlSirTargDnStepUplink SIR Target Down Step Size (dB)
UL 34 K136 K signaling UL 122 K AMR
01 02
458 Optimization of Uplink Capacity for a Single Cell
A lot of optimization measures can be taken to bring down the rising RTWP However with increasing subscribers the capacity may still be limited in some area while further modification of SirTarget will obviously degrade the call quality of the whole network and undermine the subscribersrsquo perception In this case you can adjust the power control parameters for a single site that has heavy traffic in the following way add one set of DivPc parameters and use this set of parameters only for this site
Case Table 4-9 shows an example of the power control parameter modification After this modification the call drop rate in the site with heavy traffic decreased to one quarter of the original one
Table 4-9 Example of Power Control Parameter Modification for Heavy-Traffic Cell
SRVTYPE ULINITSIR ULMAXSIR ULMINSIR
0 35-gt15 100-gt35 20-gt10
104 40-gt20 150-gt50 05-gt0
28 35-gt15 100-gt35 05-gt0
50 60-gt20 150-gt50 20-gt0
54 60-gt20 150-gt50 20-gt0
ZTE Confidential Proprietary copy 2012 ZTE CORPORATION All rights reserved 53