Embed Size (px)
Citation preview
434 Chapter 10 Data Displays
Stem-and-Leaf Plots10.1
How can you use place values to represent
data graphically?
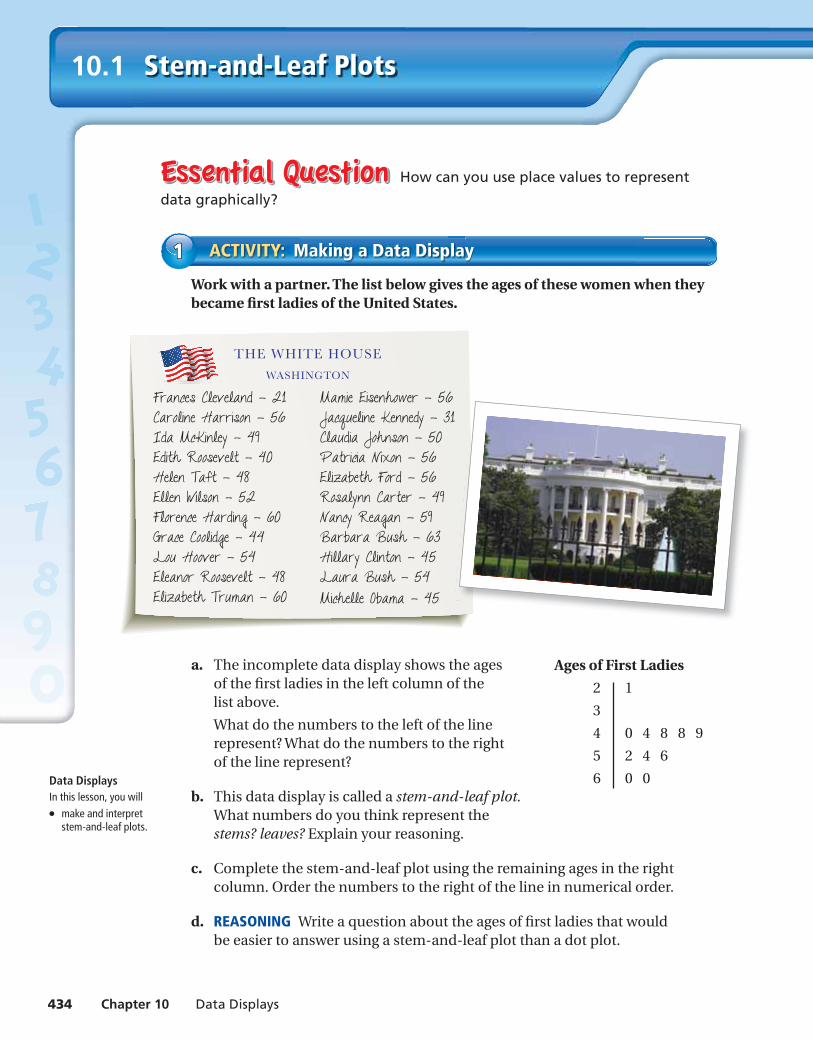
Work with a partner. The list below gives the ages of these women when they became fi rst ladies of the United States.
a. The incomplete data display shows the ages of the fi rst ladies in the left column of the list above.
What do the numbers to the left of the line represent? What do the numbers to the right of the line represent?
b. This data display is called a stem-and-leaf plot. What numbers do you think represent the stems? leaves? Explain your reasoning.
c. Complete the stem-and-leaf plot using the remaining ages in the right column. Order the numbers to the right of the line in numerical order.
d. REASONING Write a question about the ages of fi rst ladies that would be easier to answer using a stem-and-leaf plot than a dot plot.
ACTIVITY: Making a Data Display11
Data DisplaysIn this lesson, you will● make and interpret
stem-and-leaf plots.
Ages of First Ladies
2 1
3
4 0 4 8 8 9
5 2 4 6
6 0 0
ms_green pe_1001.indd 434ms_green pe_1001.indd 434 1/28/15 4:14:08 PM1/28/15 4:14:08 PM
Section 10.1 Stem-and-Leaf Plots 435
4. IN YOUR OWN WORDS How can you use place values to represent data graphically?
5. How can you display data in a stem-and-leaf plot whose values range from 82 through 129?
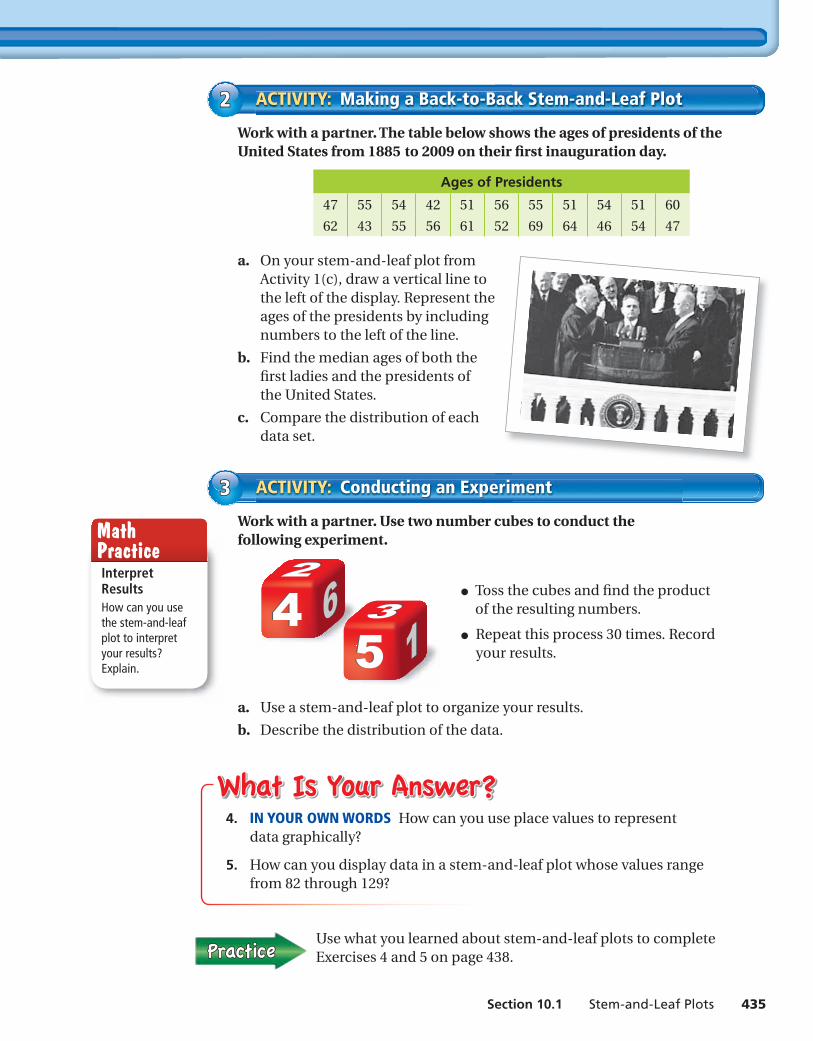
Work with a partner. The table below shows the ages of presidents of the United States from 1885 to 2009 on their fi rst inauguration day.
Ages of Presidents
47 55 54 42 51 56 55 51 54 51 60
62 43 55 56 61 52 69 64 46 54 47
a. On your stem-and-leaf plot from Activity 1(c), draw a vertical line to the left of the display. Represent the ages of the presidents by including numbers to the left of the line.
b. Find the median ages of both the fi rst ladies and the presidents of the United States.
c. Compare the distribution of each data set.
ACTIVITY: Making a Back-to-Back Stem-and-Leaf Plot22
Use what you learned about stem-and-leaf plots to complete Exercises 4 and 5 on page 438.
Work with a partner. Use two number cubes to conduct the following experiment.
● Toss the cubes and fi nd the product of the resulting numbers.
● Repeat this process 30 times. Record your results.
a. Use a stem-and-leaf plot to organize your results.
b. Describe the distribution of the data.
ACTIVITY: Conducting an Experiment33
1
Interpret ResultsHow can you use the stem-and-leaf plot to interpret your results? Explain.
Math Practice
ms_green pe_1001.indd 435ms_green pe_1001.indd 435 1/28/15 4:14:19 PM1/28/15 4:14:19 PM
Lesson Tutorials
436 Chapter 10 Data Displays
Lesson10.1
Key Vocabularystem-and-leaf plot, p. 436stem, p. 436leaf, p. 436
Stem-and-Leaf Plots
A stem-and-leaf plot uses the digits of data values to organize a data set. Each data value is broken into a stem (digit or digits on the left) and a leaf (digit or digits on the right).
A stem-and-leaf plot shows how data are distributed.
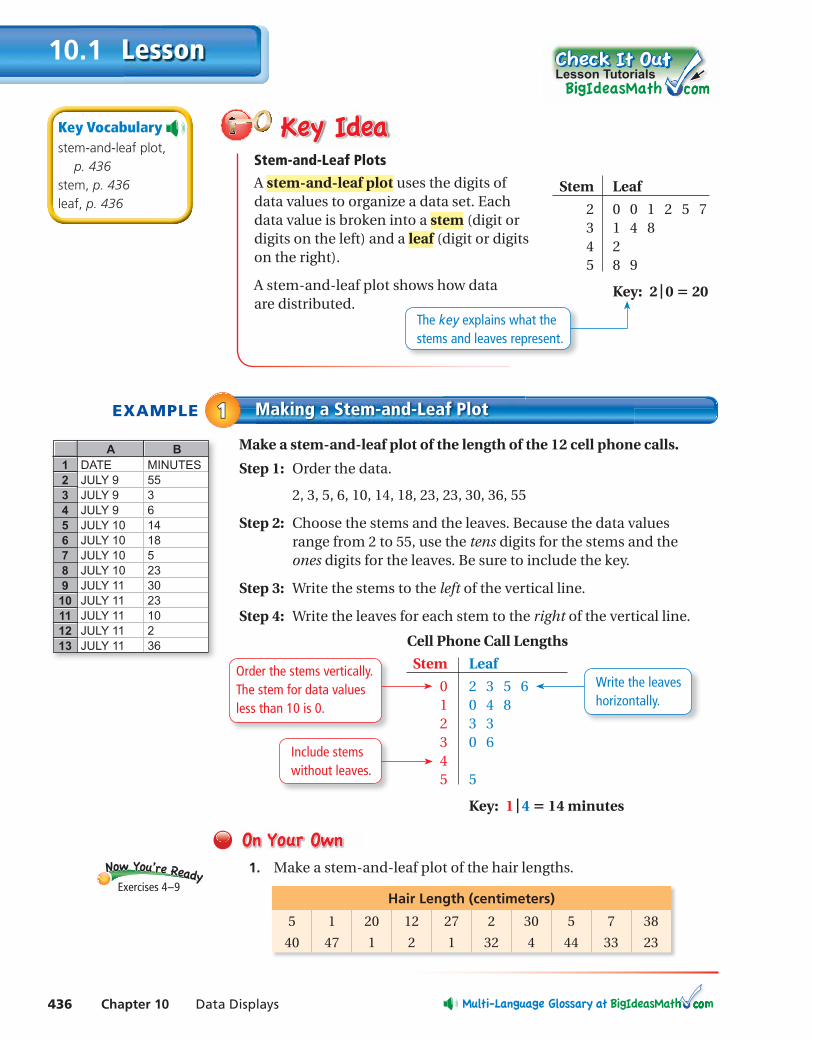
EXAMPLE Making a Stem-and-Leaf Plot11Make a stem-and-leaf plot of the length of the 12 cell phone calls.
Step 1: Order the data.
2, 3, 5, 6, 10, 14, 18, 23, 23, 30, 36, 55
Step 2: Choose the stems and the leaves. Because the data values range from 2 to 55, use the tens digits for the stems and the ones digits for the leaves. Be sure to include the key.
Step 3: Write the stems to the left of the vertical line.
Step 4: Write the leaves for each stem to the right of the vertical line.
1. Make a stem-and-leaf plot of the hair lengths.
Hair Length (centimeters)
5 1 20 12 27 2 30 5 7 38
40 47 1 2 1 32 4 44 33 23
Exercises 4–9
Stem Leaf
2 0 0 1 2 5 7 3 1 4 8 4 2 5 8 9
Key: 2 | 0 = 20
Cell Phone Call Lengths
Stem Leaf
0 2 3 5 6 1 0 4 8 2 3 3 3 0 6 4 5 5
Key: 1 | 4 = 14 minutes
Write the leaves horizontally.
Include stems without leaves.
Order the stems vertically. The stem for data values less than 10 is 0.
The key explains what the stems and leaves represent.
ms_green pe_1001.indd 436ms_green pe_1001.indd 436 1/28/15 4:14:27 PM1/28/15 4:14:27 PM
Section 10.1 Stem-and-Leaf Plots 437
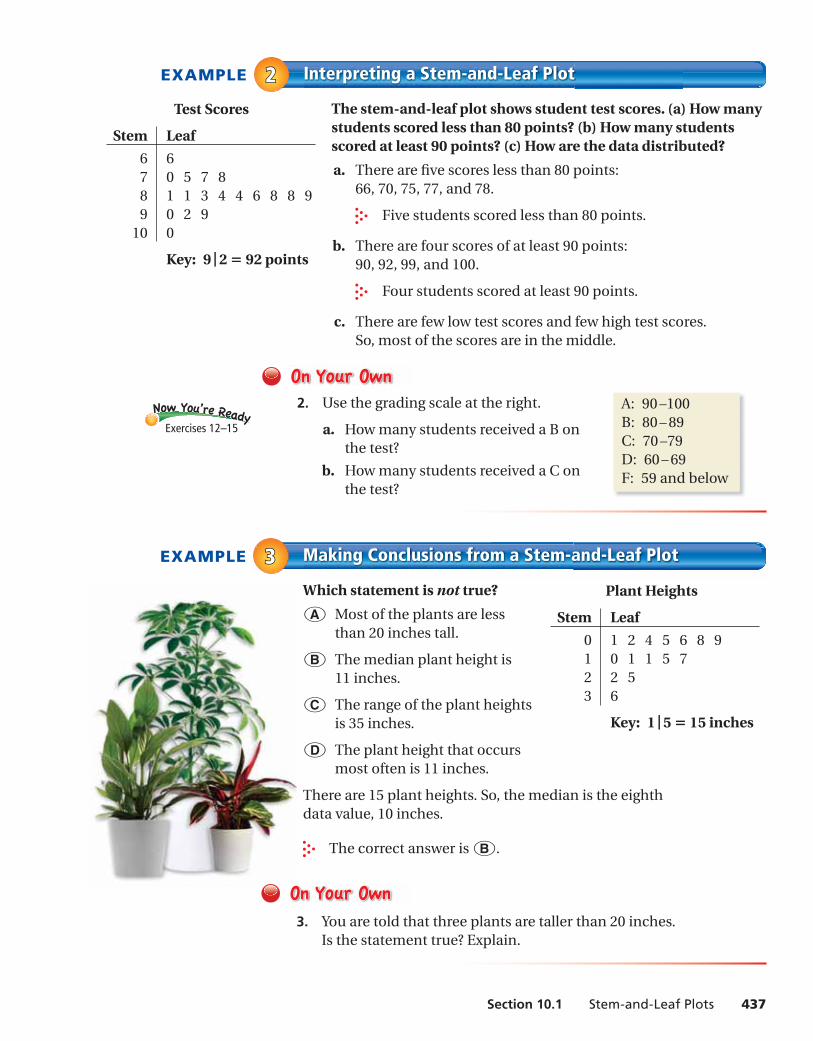
EXAMPLE Interpreting a Stem-and-Leaf Plot22The stem-and-leaf plot shows student test scores. (a) How many students scored less than 80 points? (b) How many students scored at least 90 points? (c) How are the data distributed?
a. There are fi ve scores less than 80 points: 66, 70, 75, 77, and 78.
Five students scored less than 80 points.
b. There are four scores of at least 90 points: 90, 92, 99, and 100.
Four students scored at least 90 points.
c. There are few low test scores and few high test scores. So, most of the scores are in the middle.
2. Use the grading scale at the right.
a. How many students received a B on the test?
b. How many students received a C on the test?
A: 90 –100B: 80 – 89C: 70 –79D: 60 – 69F: 59 and below
EXAMPLE Making Conclusions from a Stem-and-Leaf Plot33Which statement is not true?
○A Most of the plants are less than 20 inches tall.
○B The median plant height is 11 inches.
○C The range of the plant heights is 35 inches.
○D The plant height that occurs most often is 11 inches.
There are 15 plant heights. So, the median is the eighth data value, 10 inches.
The correct answer is ○B .
3. You are told that three plants are taller than 20 inches. Is the statement true? Explain.
Test Scores
Stem Leaf
6 6 7 0 5 7 8 8 1 1 3 4 4 6 8 8 9 9 0 2 9 10 0
Key: 9 | 2 = 92 points
Plant Heights
Stem Leaf
0 1 2 4 5 6 8 9 1 0 1 1 5 7 2 2 5 3 6
Key: 1 | 5 = 15 inches
Exercises 12–15
ms_green pe_1001.indd 437ms_green pe_1001.indd 437 1/28/15 4:14:30 PM1/28/15 4:14:30 PM
Exercises10.1
438 Chapter 10 Data Displays
1. VOCABULARY The key for a stem-and-leaf plot is 3 | 4 = 34. Which number is the stem? Which number is the leaf ?
2. WRITING Describe how to make a stem-and-leaf plot of the data values 14, 22, 9, 13, 30, 8, 25, and 29.
3. WRITING How does a stem-and-leaf plot show the distribution of data?
9+(-6)=3
3+(-3)=
4+(-9)=
9+(-1)=
Make a stem-and-leaf plot of the data.
4. Books Read
26 15 20 9
31 25 29 32
17 26 19 40
5. Hours Online
8 12 21 14
18 6 15 24
12 17 2 0
6. Test Scores (%)
87 82 95 91 69
88 68 87 65 81
97 85 80 90 62
7. Points Scored
58 50 42 71 75
45 51 43 38 71
42 70 56 58 43
8. Bikes Sold
78 112 105 99
86 96 115 100
79 81 99 108
9. Minutes in Line
4.0 2.6 1.9 3.1
3.6 2.2 2.7 3.8
1.6 2.0 3.1 2.9
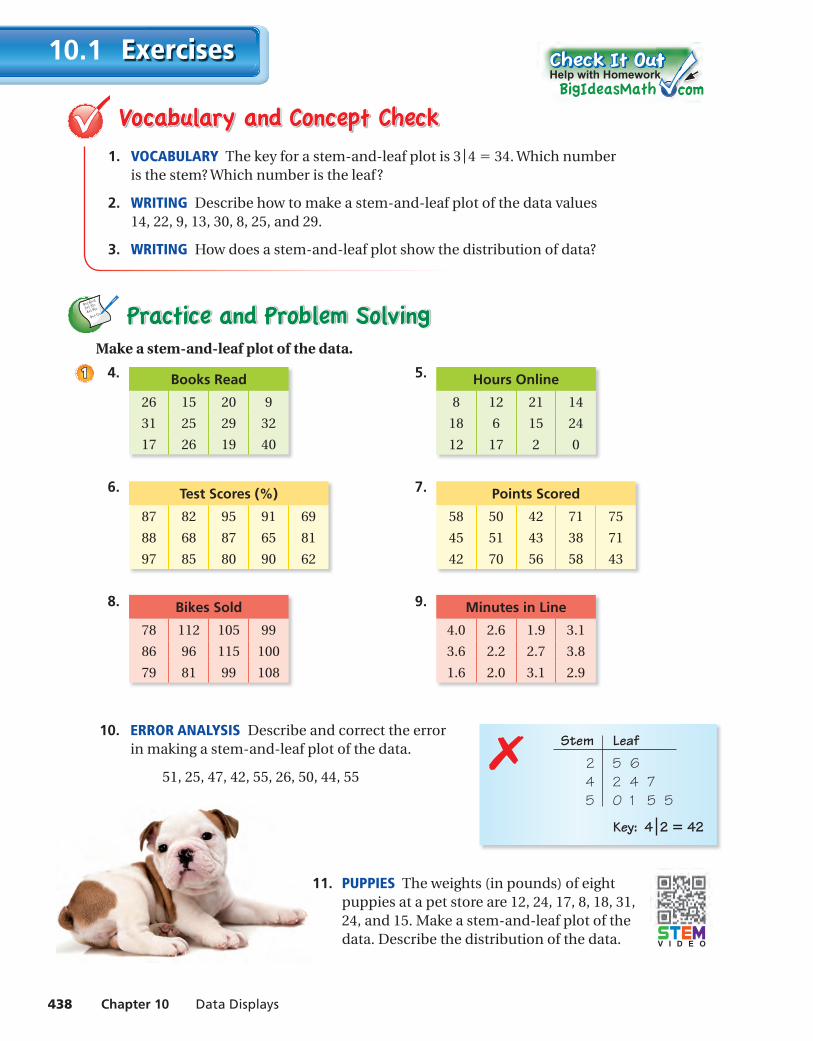
10. ERROR ANALYSIS Describe and correct the errorin making a stem-and-leaf plot of the data.
51, 25, 47, 42, 55, 26, 50, 44, 55
11. PUPPIES The weights (in pounds) of eight puppies at a pet store are 12, 24, 17, 8, 18, 31, 24, and 15. Make a stem-and-leaf plot of the data. Describe the distribution of the data.
11
✗ Stem Leaf 2 5 6 4 2 4 7 5 0 1 5 5
Key: 4 2 = 42
Help with Homework
V I D E O
ms_2017_green_pe_1001.indd 438ms_2017_green_pe_1001.indd 438 7/20/16 9:44:17 AM7/20/16 9:44:17 AM
Section 10.1 Stem-and-Leaf Plots 439
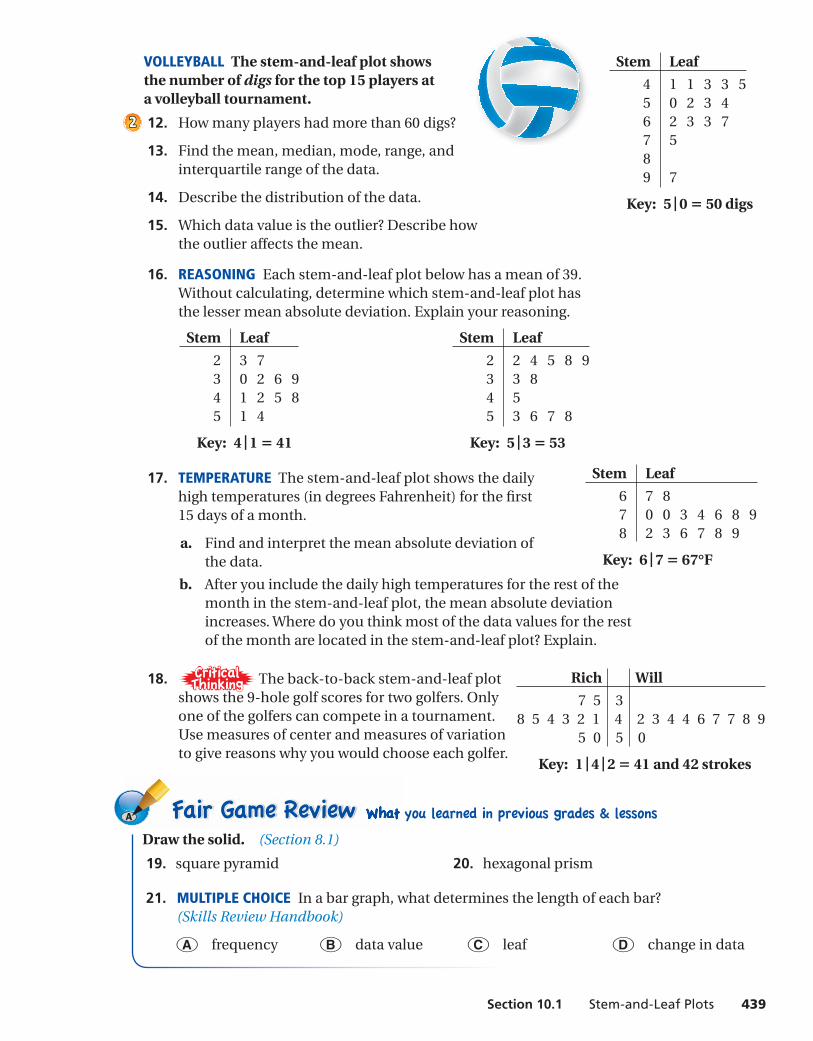
VOLLEYBALL The stem-and-leaf plot shows the number of digs for the top 15 players at a volleyball tournament.
12. How many players had more than 60 digs?
13. Find the mean, median, mode, range, and interquartile range of the data.
14. Describe the distribution of the data.
15. Which data value is the outlier? Describe how the outlier affects the mean.
16. REASONING Each stem-and-leaf plot below has a mean of 39. Without calculating, determine which stem-and-leaf plot has the lesser mean absolute deviation. Explain your reasoning.
17. TEMPERATURE The stem-and-leaf plot shows the daily high temperatures (in degrees Fahrenheit) for the fi rst 15 days of a month.
a. Find and interpret the mean absolute deviation of the data.
b. After you include the daily high temperatures for the rest of the month in the stem-and-leaf plot, the mean absolute deviation increases. Where do you think most of the data values for the rest of the month are located in the stem-and-leaf plot? Explain.
18. The back-to-back stem-and-leaf plot shows the 9-hole golf scores for two golfers. Only one of the golfers can compete in a tournament. Use measures of center and measures of variation to give reasons why you would choose each golfer.
22
Stem Leaf
4 1 1 3 3 5 5 0 2 3 4 6 2 3 3 7 7 5 8 9 7
Key: 5 | 0 = 50 digs
Stem Leaf
6 7 8 7 0 0 3 4 6 8 9 8 2 3 6 7 8 9
Key: 6 | 7 = 67°F
Stem Leaf
2 3 7 3 0 2 6 9 4 1 2 5 8 5 1 4
Key: 4 | 1 = 41
Stem Leaf
2 2 4 5 8 9 3 3 8 4 5 5 3 6 7 8
Key: 5 | 3 = 53
Draw the solid. (Section 8.1)
19. square pyramid 20. hexagonal prism
21. MULTIPLE CHOICE In a bar graph, what determines the length of each bar? (Skills Review Handbook)
○A frequency ○B data value ○C leaf ○D change in data
Rich Will
7 5 38 5 4 3 2 1 4 2 3 4 4 6 7 7 8 9 5 0 5 0
Key: 1 | 4 | 2 = 41 and 42 strokes
ms_green pe_1001.indd 439ms_green pe_1001.indd 439 1/28/15 4:14:34 PM1/28/15 4:14:34 PM