Embed Size (px)
Citation preview
Graphing Parabolas10.1
10.1 OBJECTIVES
1. Find the axis of symmetry2. Find the vertex3. Graph a parabola by the method of translation4. Complete the square of a quadratic function and
graph the parabola5. Graph a parabola that opens to the left or right
746
© 2
001
McG
raw
-Hill
Co
mp
anie
s
In Chapter 4 we discussed the graphs of linear equations in two variables of the form
ax � by � c in which a and b cannot both be 0
The graphs of all the linear equations were straight lines. Suppose that we now allow theterms in x and/or y to be quadratic; that is, we will allow squares in one or both of thoseterms. The graphs of such equations will form a family of curves called the conic sections.Conic sections are curves formed when a plane cuts through, or forms a section of, a cone.The conic sections include four curves—the parabola, circle, ellipse, and hyperbola.Examples of how these curves are formed are shown below.
HyperbolaCircle
EllipseParabola
NOTE The names “ellipse,”“parabola,” and “hyperbola”are attributed to Apollonius, athird-century B.C. Greekmathematician and astronomer.
NOTE The inclination of theplane determines which of thesections is formed.
GRAPHING PARABOLAS SECTION 10.1 747
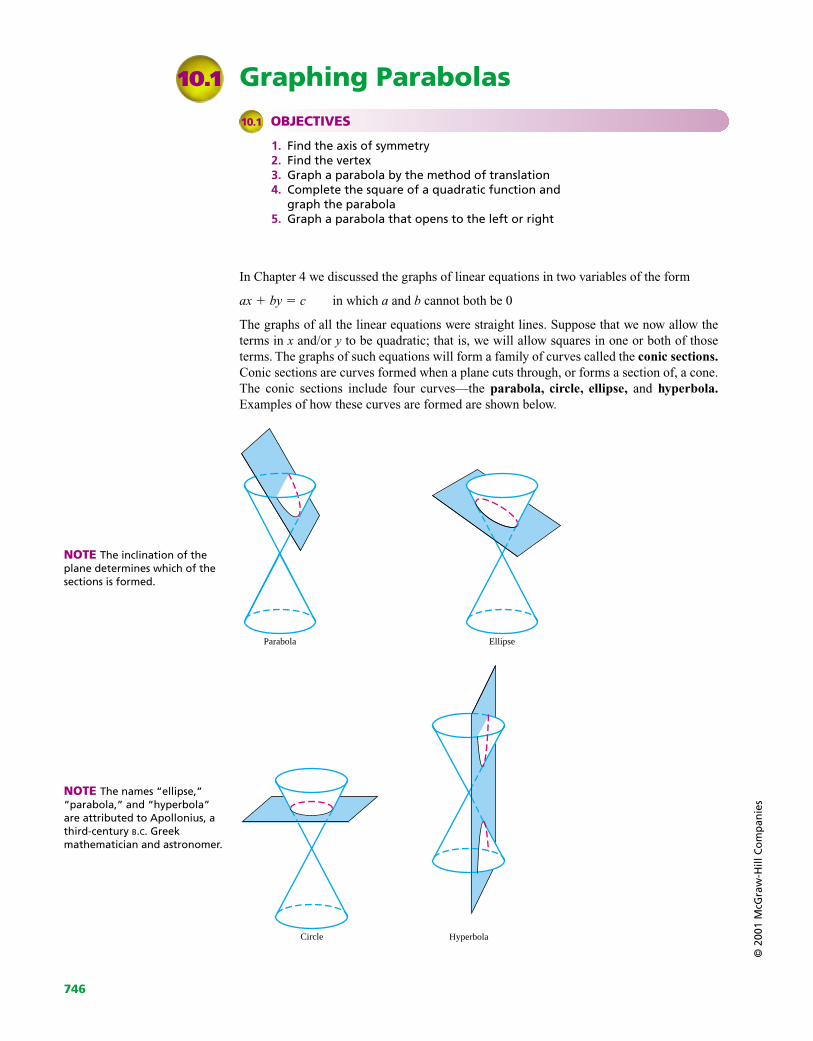
Let’s examine the first of these sections, the parabola. Consider the equation y � x2. Thisequation is quadratic in x and linear in y. Its graph is a parabola. Let’s look at that graph.
© 2
001
McG
raw
-Hill
Co
mp
anie
s
y
x
There are three elements of the graph that should be noted.
1. The graph opens upward.
2. The y axis cuts the graph into two equal parts. A line that does this is called an axisof symmetry.
3. The graph has a minimum point, called the vertex.
Let’s compare that graph to the graph of the equation y � �x2.
Looking at the three elements we examined earlier, we make three observations:
1. The graph opens downward.
2. The y axis is the axis of symmetry.
3. The graph has a maximum point, called the vertex.
It will always be the case that the sign of the coefficient of the x2 term will determine whichway the parabola opens. It will also be the case that a parabola opening upward has a min-imum, and one opening downward has a maximum.
For every equation that is quadratic in x and linear in y, we will look for three things:
1. Does the graph open upward or downward?
2. Where is the axis of symmetry?
3. What are the coordinates of the vertex?
y
x
Example 1
Graphing with a Vertical Translation
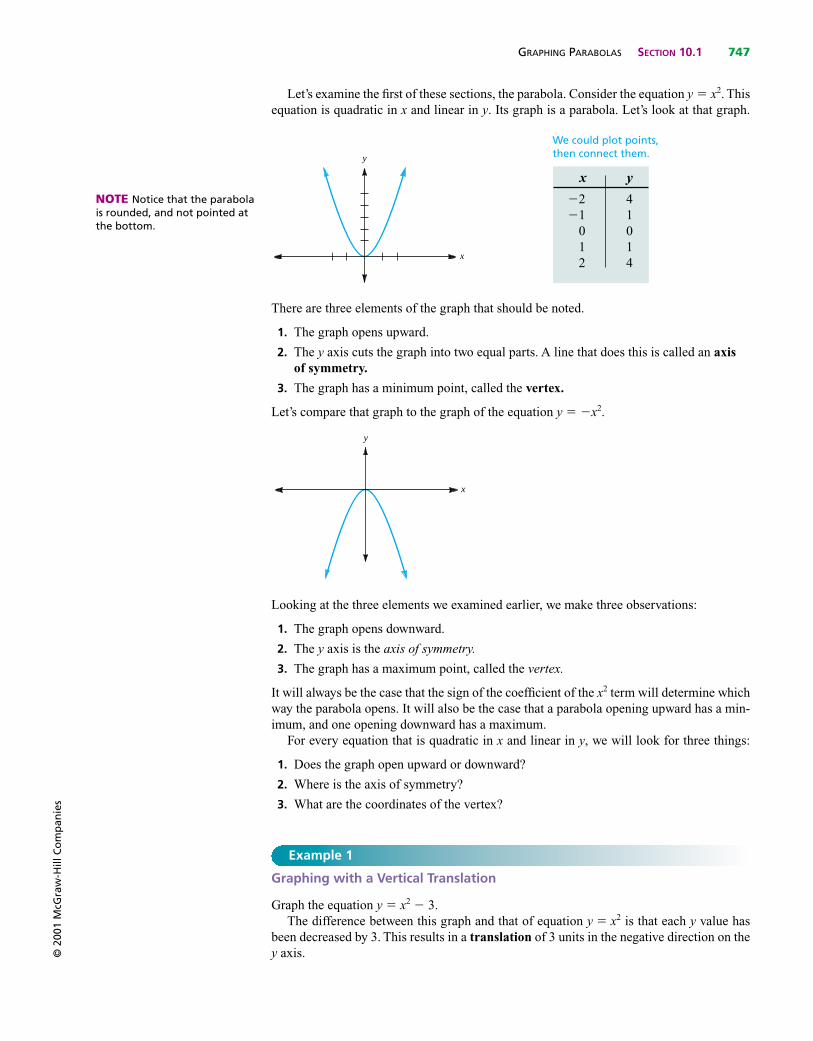
Graph the equation y � x2 � 3.The difference between this graph and that of equation y � x2 is that each y value has
been decreased by 3. This results in a translation of 3 units in the negative direction on they axis.
x y
�2 4�1 1
0 01 12 4
NOTE Notice that the parabolais rounded, and not pointed atthe bottom.
We could plot points,then connect them.
748 CHAPTER 10 GRAPHS OF CONIC SECTIONS
Note that the curve opens upward, the axis of symmetry is x � 0 (the y axis), and the vertexis (0, �3).
y
x
(0, �3)
© 2
001
McG
raw
-Hill
Co
mp
anie
s
C H E C K Y O U R S E L F 2
Graph the equation y � (x � 2)2.
C H E C K Y O U R S E L F 1
Graph the equation y � �x2 � 2.
An equation of the form y � (x � h)2 will be translated along the x axis with the axis ofsymmetry at x � h.
Example 2
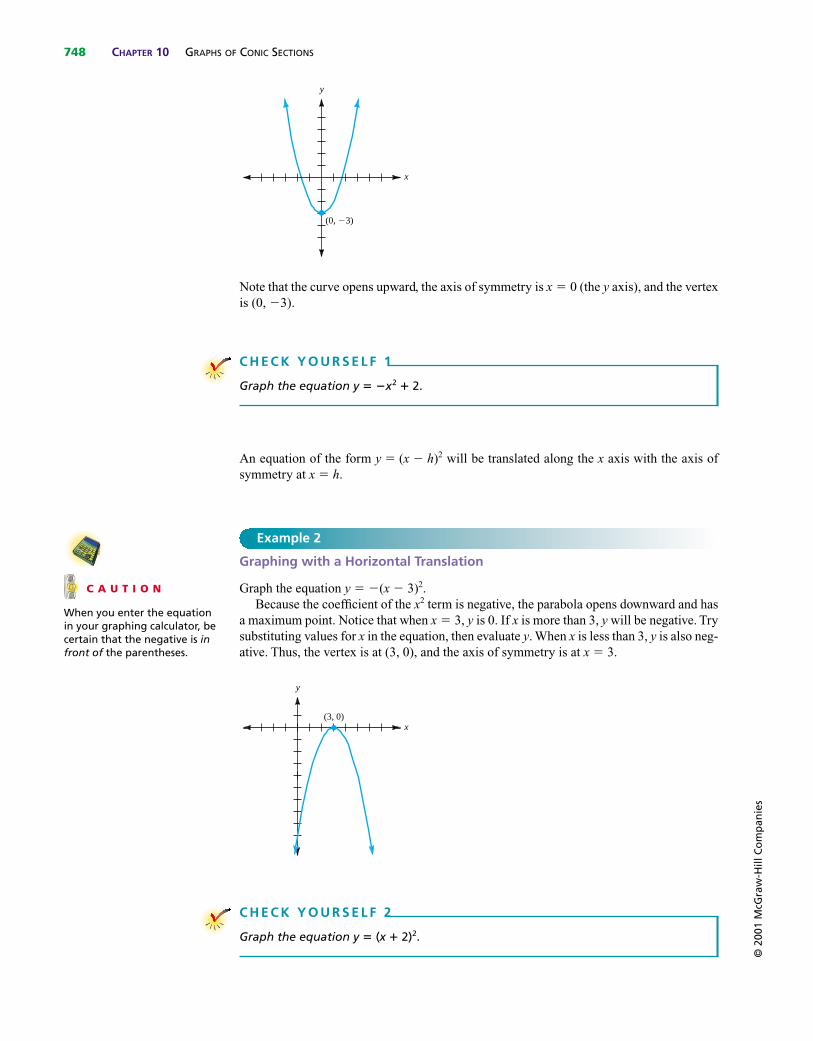
Graphing with a Horizontal Translation
Graph the equation y � �(x � 3)2.Because the coefficient of the x2 term is negative, the parabola opens downward and has
a maximum point. Notice that when x � 3, y is 0. If x is more than 3, y will be negative. Trysubstituting values for x in the equation, then evaluate y. When x is less than 3, y is also neg-ative. Thus, the vertex is at (3, 0), and the axis of symmetry is at x � 3.
y
x(3, 0)
C A U T I O N
When you enter the equationin your graphing calculator, becertain that the negative is infront of the parentheses.
GRAPHING PARABOLAS SECTION 10.1 749
Combining the lessons of the last two examples, we see that the graph of an equation of theform y � (x � h)2 � k is simply the parabola y � x2 translated horizontally h units andvertically k units.
© 2
001
McG
raw
-Hill
Co
mp
anie
s
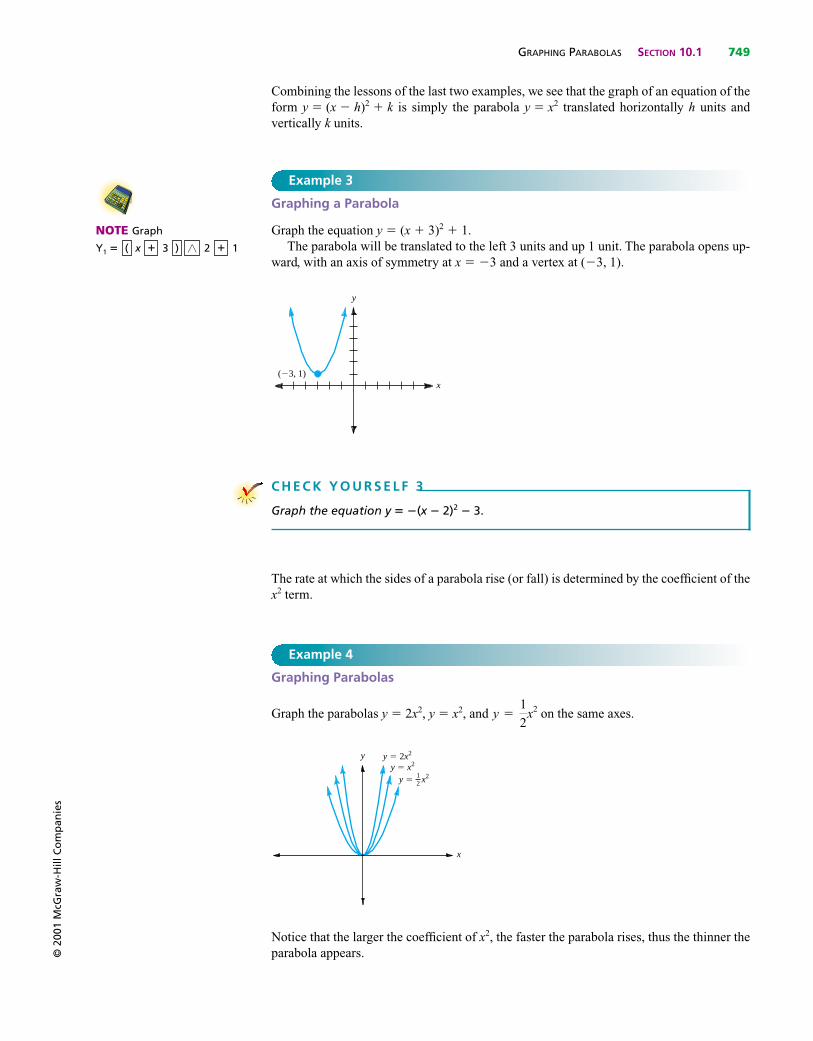
Example 3
Graphing a Parabola
Graph the equation y � (x � 3)2 � 1.The parabola will be translated to the left 3 units and up 1 unit. The parabola opens up-
ward, with an axis of symmetry at x � �3 and a vertex at (�3, 1).
y
x(�3, 1)
NOTE Graph
Y1 � x 3 2 1��)�(
C H E C K Y O U R S E L F 3
Graph the equation y � �(x � 2)2 � 3.
The rate at which the sides of a parabola rise (or fall) is determined by the coefficient of thex2 term.
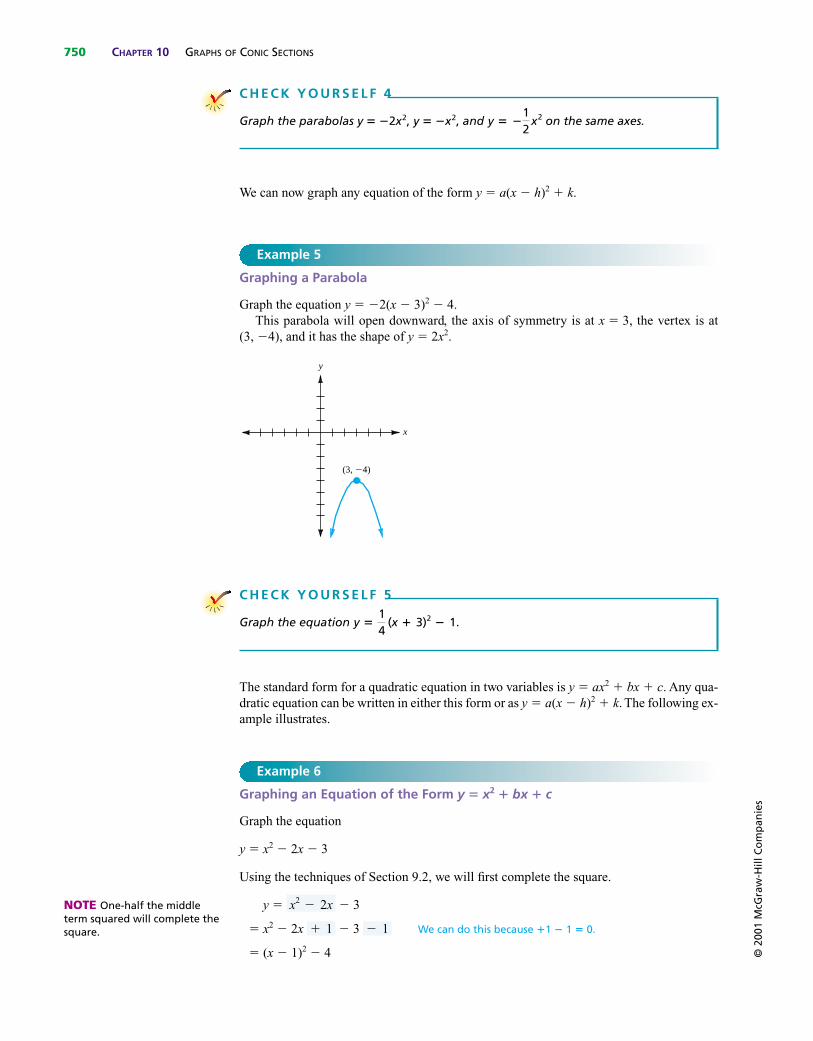
Example 4
Graphing Parabolas
Graph the parabolas y � 2x2, y � x2, and on the same axes.
Notice that the larger the coefficient of x2, the faster the parabola rises, thus the thinner theparabola appears.
x
y
y � x212
y � x2y � 2x2
y �1
2x2
750 CHAPTER 10 GRAPHS OF CONIC SECTIONS
We can now graph any equation of the form y � a(x � h)2 � k.
© 2
001
McG
raw
-Hill
Co
mp
anie
s
C H E C K Y O U R S E L F 4
Graph the parabolas y � �2x2, y � �x2, and on the same axes.y � �12
x2
C H E C K Y O U R S E L F 5
Graph the equation y �14
(x � 3)2 � 1.
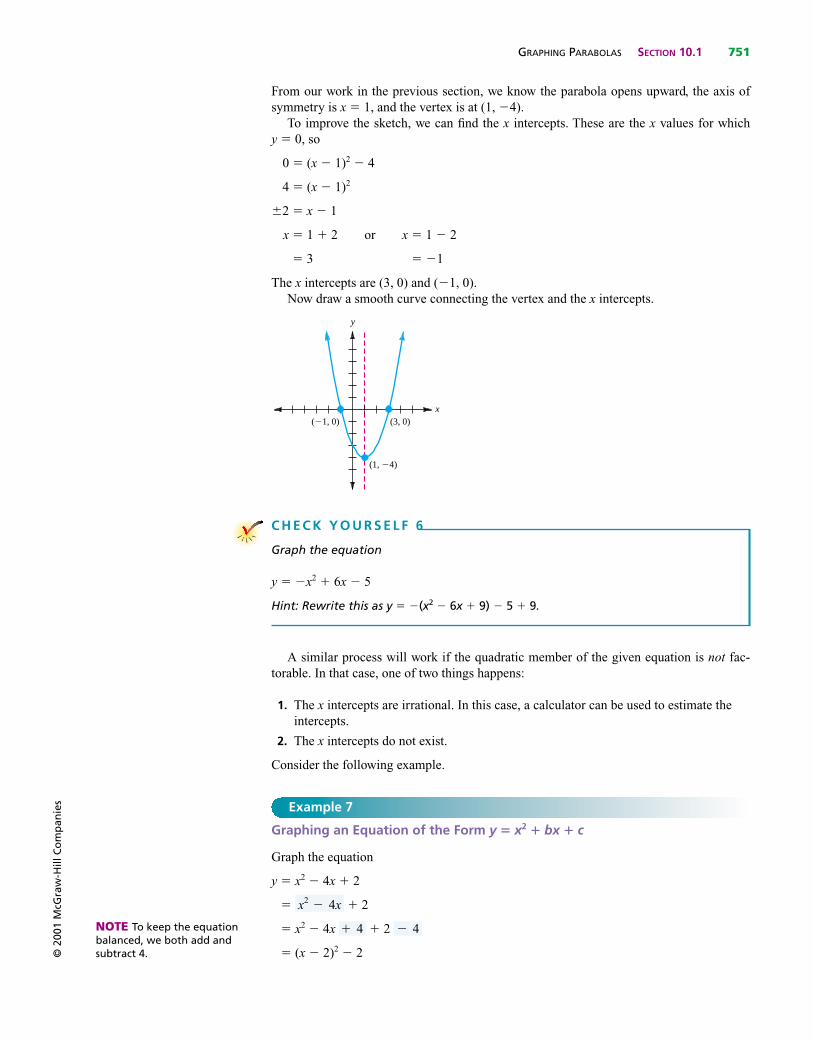
Example 5
Graphing a Parabola
Graph the equation y � �2(x � 3)2 � 4.This parabola will open downward, the axis of symmetry is at x � 3, the vertex is at
(3, �4), and it has the shape of y � 2x2.
y
x
(3, �4)
The standard form for a quadratic equation in two variables is y � ax2 � bx � c. Any qua-dratic equation can be written in either this form or as y � a(x � h)2 � k. The following ex-ample illustrates.
Example 6
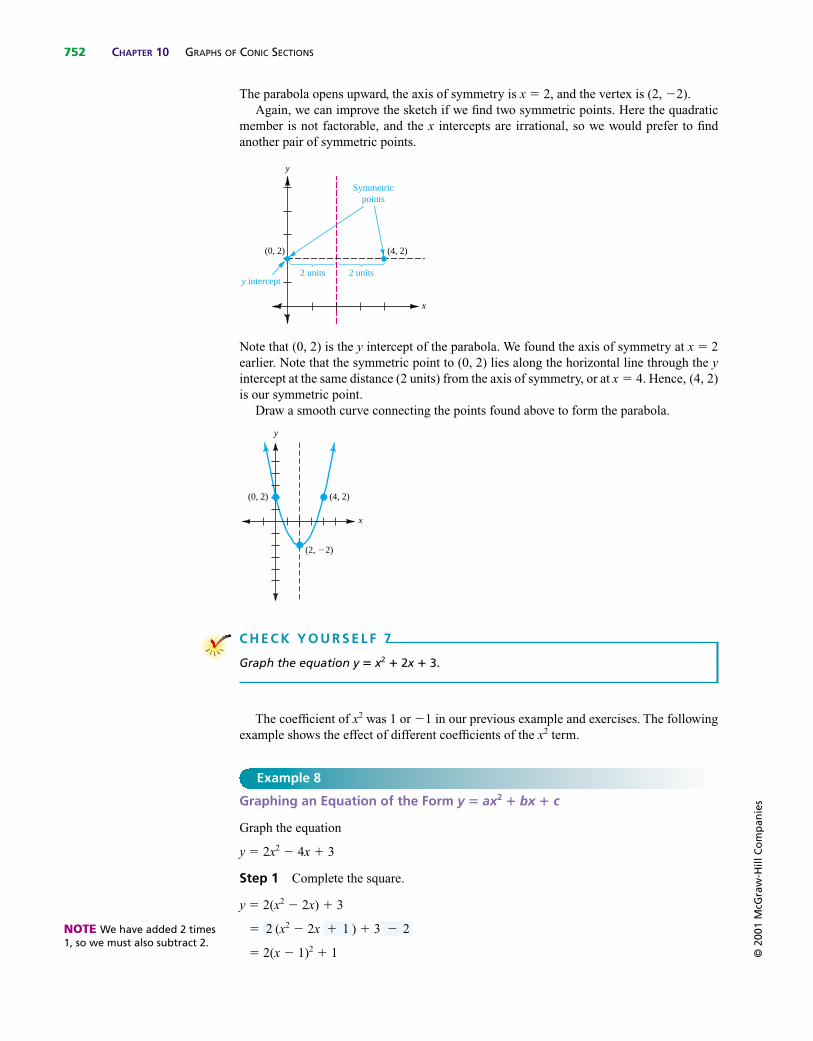
Graphing an Equation of the Form y � x2 � bx � c
Graph the equation
y � x2 � 2x � 3
Using the techniques of Section 9.2, we will first complete the square.
y � � 3
� x2 � 2x � 3 We can do this because �1 � 1 � 0.
� (x � 1)2 � 4
� 1� 1
x2 � 2xNOTE One-half the middleterm squared will complete thesquare.
GRAPHING PARABOLAS SECTION 10.1 751
From our work in the previous section, we know the parabola opens upward, the axis ofsymmetry is x � 1, and the vertex is at (1, �4).
To improve the sketch, we can find the x intercepts. These are the x values for whichy � 0, so
0 � (x � 1)2 � 4
4 � (x � 1)2
�2 � x � 1
x � 1 � 2 or x � 1 � 2
� 3 � �1
The x intercepts are (3, 0) and (�1, 0).Now draw a smooth curve connecting the vertex and the x intercepts.
y
x
(1, �4)
(�1, 0) (3, 0)
© 2
001
McG
raw
-Hill
Co
mp
anie
s
NOTE To keep the equationbalanced, we both add andsubtract 4.
C H E C K Y O U R S E L F 6
Graph the equation
y � �x2 � 6x � 5
Hint: Rewrite this as y � �(x2 � 6x � 9) � 5 � 9.
A similar process will work if the quadratic member of the given equation is not fac-torable. In that case, one of two things happens:
1. The x intercepts are irrational. In this case, a calculator can be used to estimate theintercepts.
2. The x intercepts do not exist.
Consider the following example.
Example 7
Graphing an Equation of the Form y � x2 � bx � c
Graph the equation
y � x2 � 4x � 2
� � 2
� x2 � 4x � 2
� (x � 2)2 � 2
� 4� 4
x2 � 4x
752 CHAPTER 10 GRAPHS OF CONIC SECTIONS
The parabola opens upward, the axis of symmetry is x � 2, and the vertex is (2, �2).Again, we can improve the sketch if we find two symmetric points. Here the quadratic
member is not factorable, and the x intercepts are irrational, so we would prefer to findanother pair of symmetric points.
Note that (0, 2) is the y intercept of the parabola. We found the axis of symmetry at x � 2earlier. Note that the symmetric point to (0, 2) lies along the horizontal line through the yintercept at the same distance (2 units) from the axis of symmetry, or at x � 4. Hence, (4, 2)is our symmetric point.
Draw a smooth curve connecting the points found above to form the parabola.
y
x
(0, 2) (4, 2)
(2, �2)
y
x
(0, 2) (4, 2)
2 units 2 unitsy intercept
Symmetricpoints
© 2
001
McG
raw
-Hill
Co
mp
anie
s
C H E C K Y O U R S E L F 7
Graph the equation y � x2 � 2x � 3.
The coefficient of x2 was 1 or �1 in our previous example and exercises. The followingexample shows the effect of different coefficients of the x2 term.
Example 8
Graphing an Equation of the Form y � ax2 � bx � c
Graph the equation
y � 2x2 � 4x � 3
Step 1 Complete the square.
y � 2(x2 � 2x) � 3
� (x2 � 2x ) � 3
� 2(x � 1)2 � 1
� 2� 12NOTE We have added 2 times1, so we must also subtract 2.
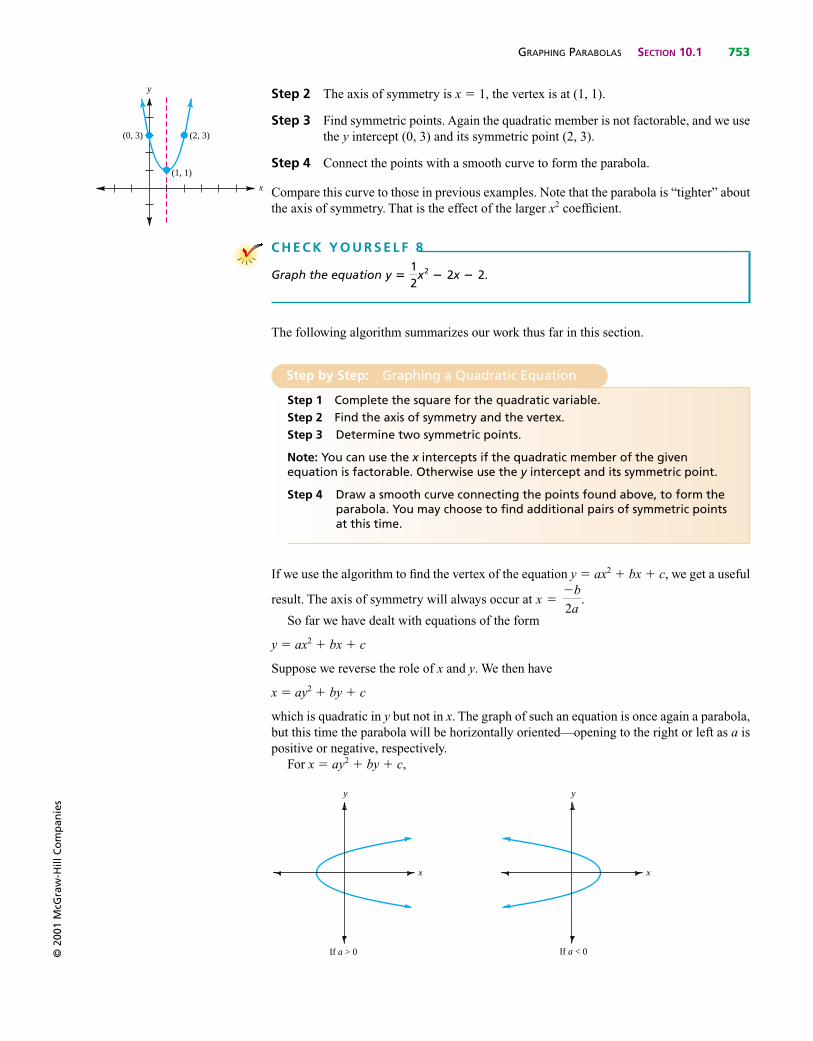
GRAPHING PARABOLAS SECTION 10.1 753
Step 2 The axis of symmetry is x � 1, the vertex is at (1, 1).
Step 3 Find symmetric points. Again the quadratic member is not factorable, and we usethe y intercept (0, 3) and its symmetric point (2, 3).
Step 4 Connect the points with a smooth curve to form the parabola.
Compare this curve to those in previous examples. Note that the parabola is “tighter” aboutthe axis of symmetry. That is the effect of the larger x2 coefficient.
© 2
001
McG
raw
-Hill
Co
mp
anie
s
C H E C K Y O U R S E L F 8
Graph the equation y �12
x2 � 2x � 2.
y
(1, 1)
(2, 3)(0, 3)
x
The following algorithm summarizes our work thus far in this section.
Step 1 Complete the square for the quadratic variable.Step 2 Find the axis of symmetry and the vertex.Step 3 Determine two symmetric points.
Note: You can use the x intercepts if the quadratic member of the givenequation is factorable. Otherwise use the y intercept and its symmetric point.
Step 4 Draw a smooth curve connecting the points found above, to form theparabola. You may choose to find additional pairs of symmetric pointsat this time.
Step by Step: Graphing a Quadratic Equation
If we use the algorithm to find the vertex of the equation y � ax2 � bx � c, we get a useful
result. The axis of symmetry will always occur at
So far we have dealt with equations of the form
y � ax2 � bx � c
Suppose we reverse the role of x and y. We then have
x � ay2 � by � c
which is quadratic in y but not in x. The graph of such an equation is once again a parabola,but this time the parabola will be horizontally oriented—opening to the right or left as a ispositive or negative, respectively.
For x � ay2 � by � c,
y
x
If a < 0
y
x
If a > 0
x ��b
2a.
754 CHAPTER 10 GRAPHS OF CONIC SECTIONS
Much of what we did earlier is easily extended to this new case. The following example willillustrate the changes in the process.
© 2
001
McG
raw
-Hill
Co
mp
anie
s
Example 9
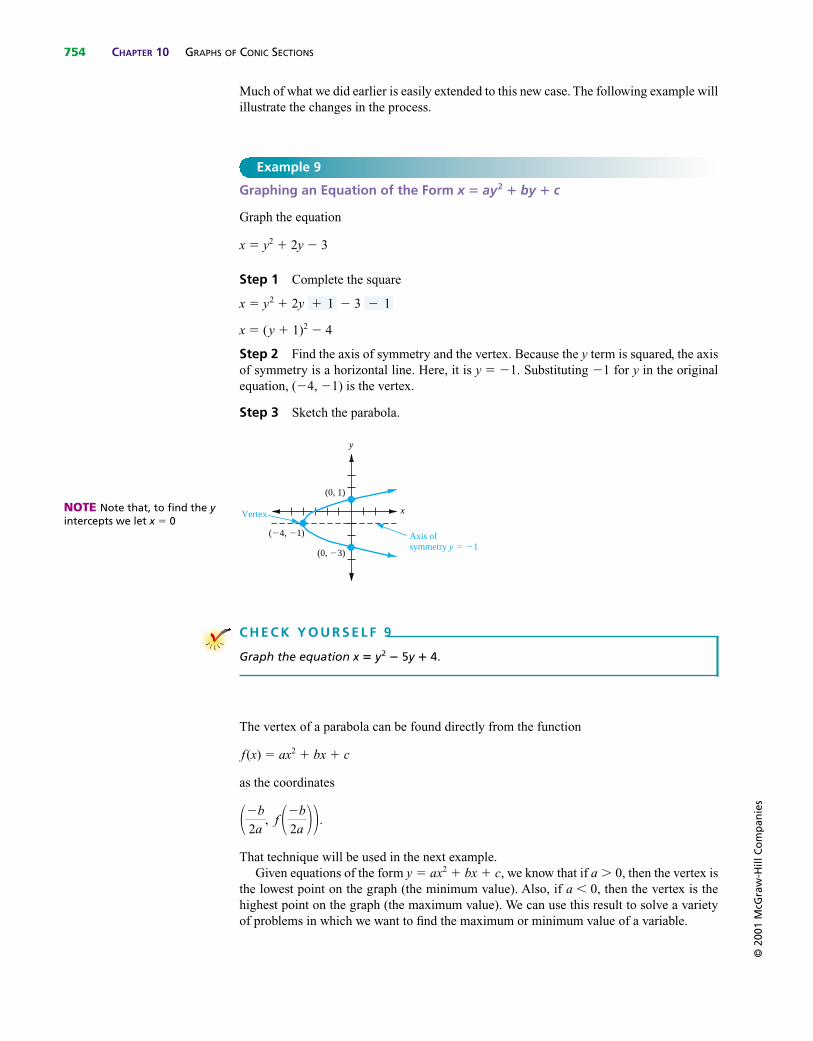
Graphing an Equation of the Form x � ay2 � by � c
Graph the equation
x � y2 � 2y � 3
Step 1 Complete the square
x � y2 � 2y � 3
x � (y � 1)2 � 4
Step 2 Find the axis of symmetry and the vertex. Because the y term is squared, the axisof symmetry is a horizontal line. Here, it is y � �1. Substituting �1 for y in the originalequation, (�4, �1) is the vertex.
Step 3 Sketch the parabola.
y
x
(�4, �1)
(0, 1)
(0, �3)
Axis ofsymmetry y � �1
Vertex
� 1� 1
C H E C K Y O U R S E L F 9
Graph the equation x � y2 � 5y � 4.
The vertex of a parabola can be found directly from the function
f(x) � ax2 � bx � c
as the coordinates
That technique will be used in the next example.Given equations of the form y � ax2 � bx � c, we know that if a � 0, then the vertex is
the lowest point on the graph (the minimum value). Also, if a � 0, then the vertex is thehighest point on the graph (the maximum value). We can use this result to solve a varietyof problems in which we want to find the maximum or minimum value of a variable.
��b
2a, f ��b
2a ��.
NOTE Note that, to find the yintercepts we let x � 0
GRAPHING PARABOLAS SECTION 10.1 755©
200
1 M
cGra
w-H
ill C
om
pan
ies
Example 10
An Application of a Quadratic Function
A software company sells a word processing program for personal computers. They havefound that their monthly profit in dollars P from selling x copies of the program is approx-imated by
P(x) � �0.2x2 � 80x � 1200
Find the number of copies of the program that should be sold to maximize the profit.Because the function is quadratic, the graph must be a parabola. Also because the coef-
ficient of x2 is negative, the parabola must open downward and thus the vertex will give themaximum value for the profit P. To find the vertex,
The maximum profit must then occur when x � 200, and we substitute that value into theoriginal equation:
P(x) � �0.2(200)2 � (80)(200) � 1200
� $6800
The maximum profit will occur when 200 copies are sold per month, and that profit will be$6800.
x ��b
2a�
�80
2(�0.2)�
�80
�0.4� 200
C H E C K Y O U R S E L F 1 0
A company that sells portable radios finds that its weekly profit in dollars P and thenumber of radios sold x are related by
P(x) � �0.1x2 � 20x � 200
Find the number of radios that should be sold to have the largest weekly profit andthe amount of that profit.
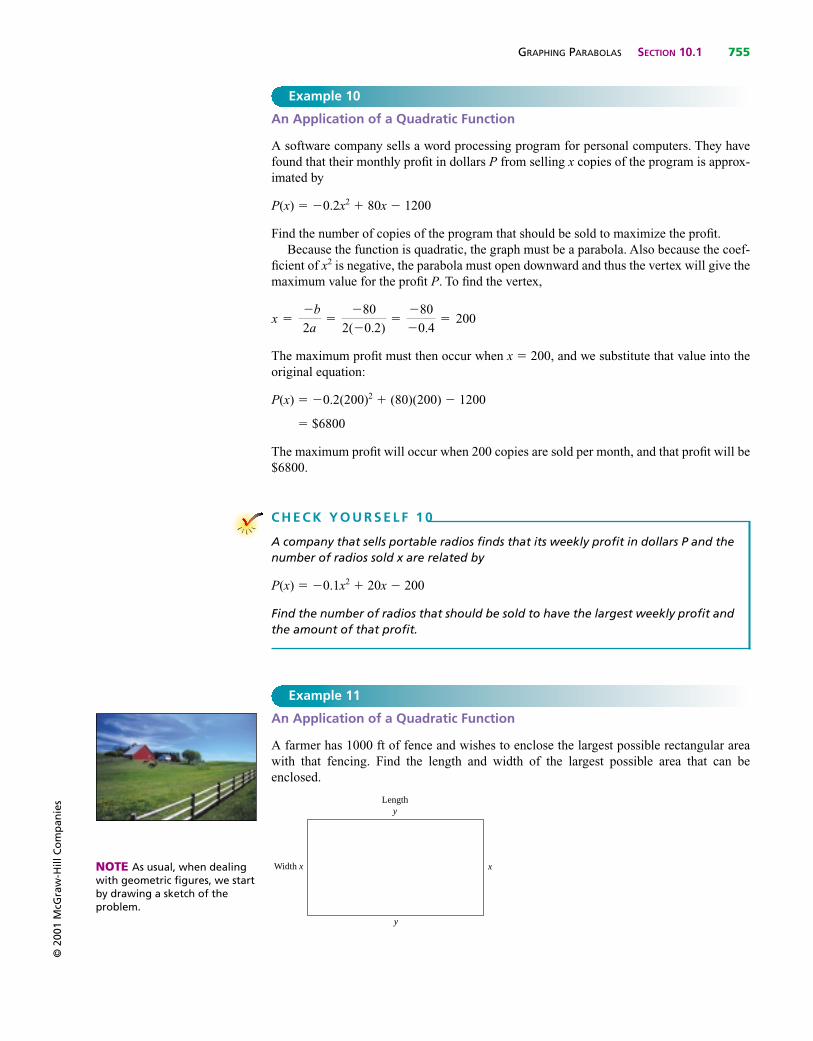
Example 11
An Application of a Quadratic Function
A farmer has 1000 ft of fence and wishes to enclose the largest possible rectangular areawith that fencing. Find the length and width of the largest possible area that can beenclosed.
Lengthy
Width x
y
xNOTE As usual, when dealingwith geometric figures, we startby drawing a sketch of theproblem.
756 CHAPTER 10 GRAPHS OF CONIC SECTIONS
First, we can write the area A as
A � xy (1)
Also because 1000 ft of fence is to be used, we know that
2x � 2y � 1000
2y � 1000 � 2x
y � 500 � x (2)
Substituting for y in Equation (1), we have
A � x(500 � x) � 500x � x2
� �x2 � 500x (3)
Again, the graph for A is a parabola opening downward, and the largest possible area willoccur at the vertex. As before,
and the largest possible area is
A � �(250)2 � 500(250) � 62,500 ft2
x ��500
2(�1)�
�500
�2� 250
© 2
001
McG
raw
-Hill
Co
mp
anie
s
C H E C K Y O U R S E L F 1 1
We want to enclose the largest possible rectangular area by using 400 ft of fence.The fence will be connected to the house, so only three sides of fence will beneeded. What should be the dimensions of the rectangle and what is the largestpossible area?
NOTE The width x is 250 ft.From (2)
y � 500 � 250
� 250 ft
NOTE The length is also 250 ft.The desired region is a square.
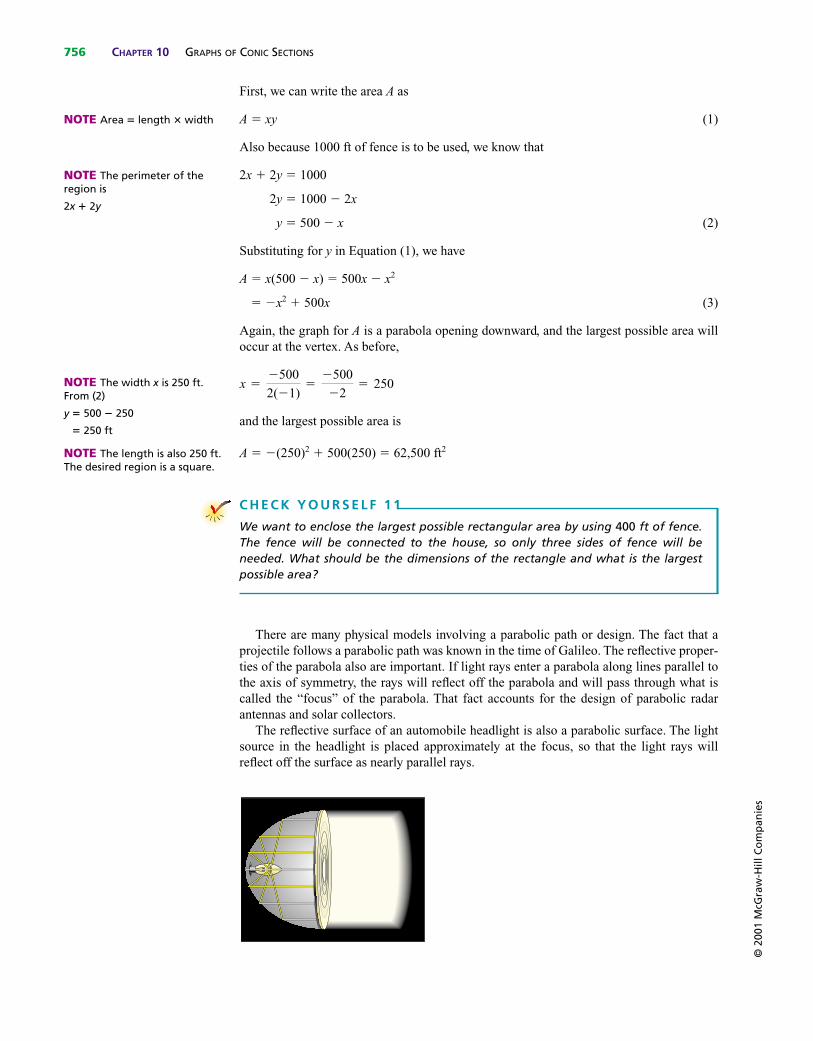
There are many physical models involving a parabolic path or design. The fact that aprojectile follows a parabolic path was known in the time of Galileo. The reflective proper-ties of the parabola also are important. If light rays enter a parabola along lines parallel tothe axis of symmetry, the rays will reflect off the parabola and will pass through what iscalled the “focus” of the parabola. That fact accounts for the design of parabolic radarantennas and solar collectors.
The reflective surface of an automobile headlight is also a parabolic surface. The lightsource in the headlight is placed approximately at the focus, so that the light rays willreflect off the surface as nearly parallel rays.
NOTE Area � length � width
NOTE The perimeter of theregion is
2x � 2y
GRAPHING PARABOLAS SECTION 10.1 757
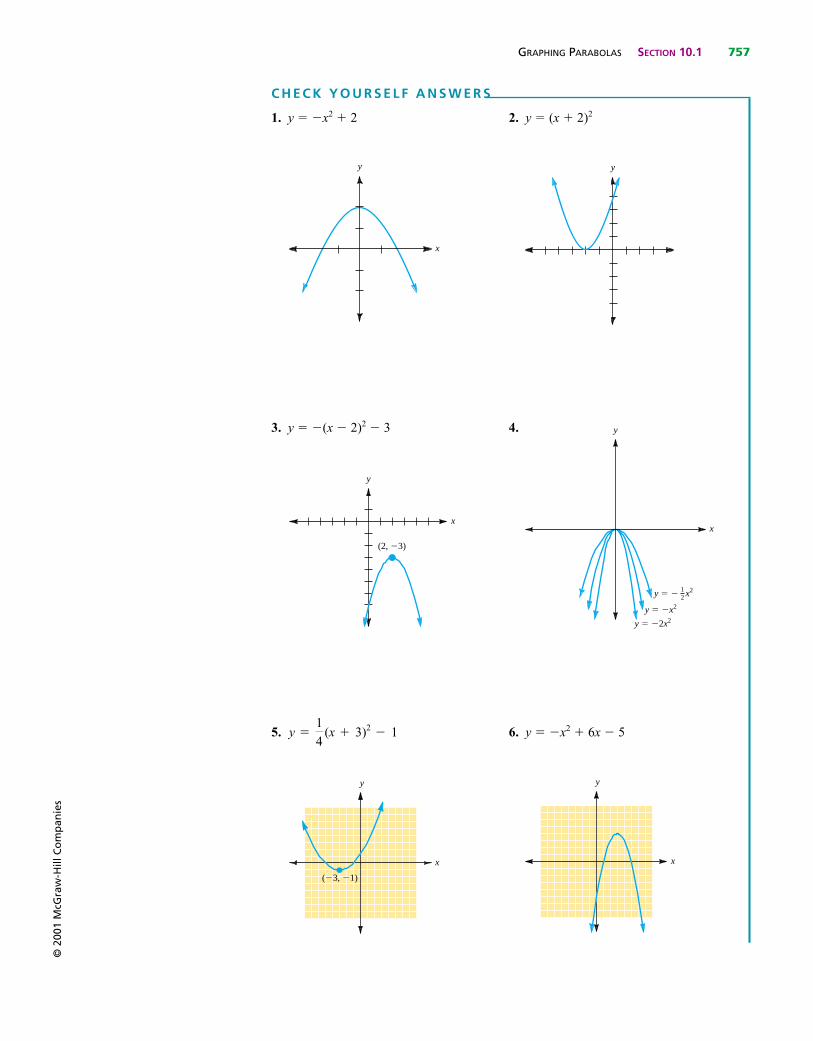
C H E C K Y O U R S E L F A N S W E R S
1. y � �x2 � 2 2. y � (x � 2)2
3. y � �(x � 2)2 � 3 4.
5. 6. y � �x2 � 6x � 5
y
x
y
x
(�3, �1)
y �1
4(x � 3)2 � 1
y � � x212
x
y
y � �x2
y � �2x2
y
x
(2, �3)
y
x
y
© 2
001
McG
raw
-Hill
Co
mp
anie
s
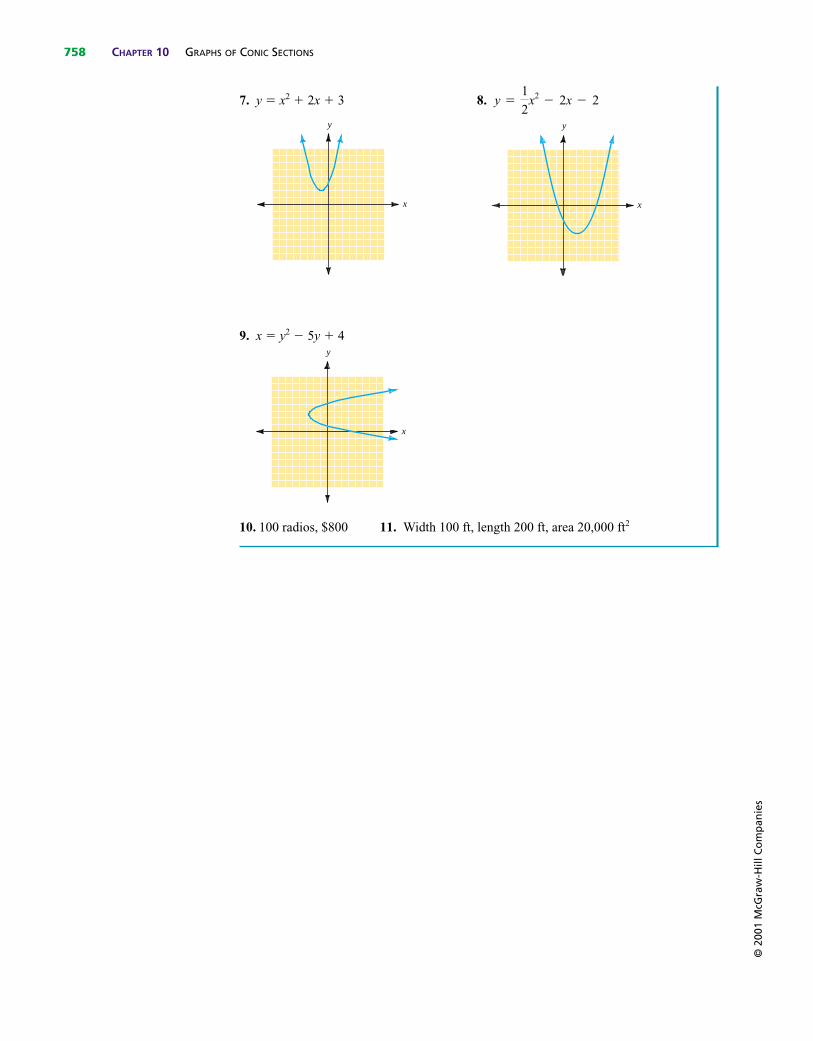
758 CHAPTER 10 GRAPHS OF CONIC SECTIONS
7. y � x2 � 2x � 3 8.
9. x � y2 � 5y � 4
10. 100 radios, $800 11. Width 100 ft, length 200 ft, area 20,000 ft2
y
x
y
x
y
x
y �1
2x2 � 2x � 2
© 2
001
McG
raw
-Hill
Co
mp
anie
s
© 2
001
McG
raw
-Hill
Co
mp
anie
s
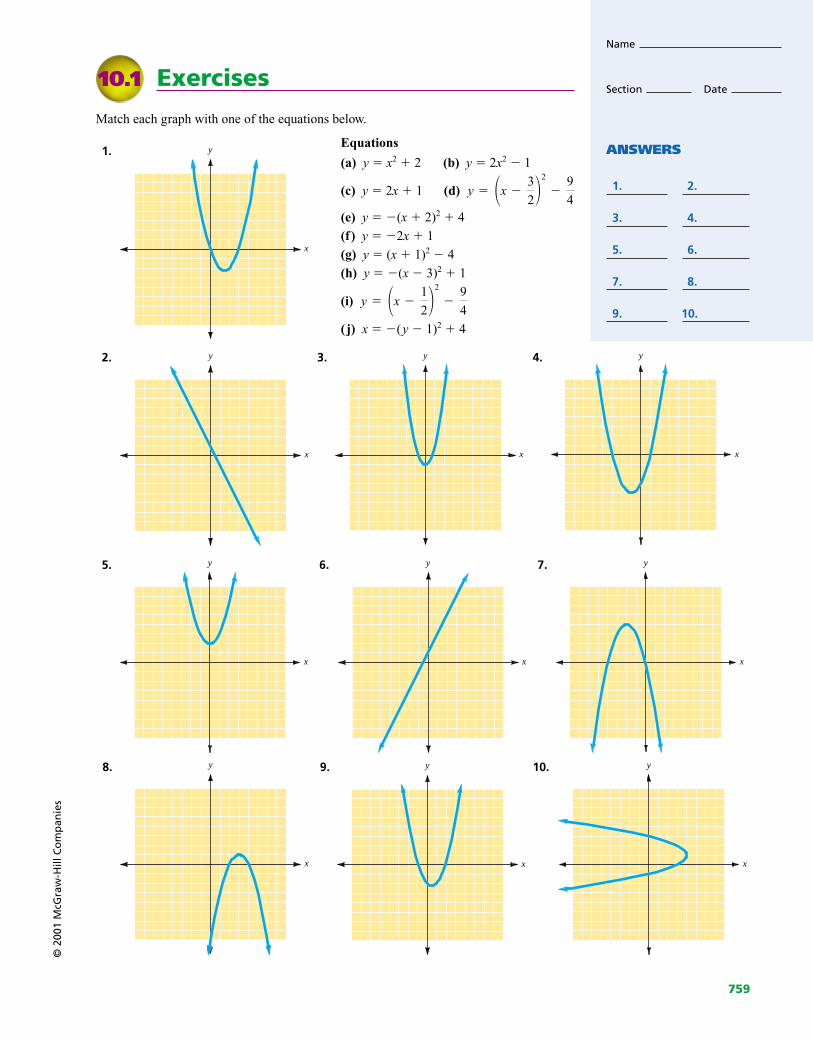
Exercises
Match each graph with one of the equations below.
1.
x
y
10.1
Name
Section Date
ANSWERS
1. 2.
3. 4.
5. 6.
7. 8.
9. 10.
759
Equations
(a) y � x2 � 2 (b) y � 2x2 � 1
(c) y � 2x � 1 (d)
(e) y � �(x � 2)2 � 4
(f) y � �2x � 1
(g) y � (x � 1)2 � 4
(h) y � �(x � 3)2 � 1
(i)
( j) x � �(y � 1)2 � 4
y � �x �1
2�2
�9
4
y � �x �3
2�2
�9
4
2. 3. 4.
5. 6. 7.
8. 9. 10.
x
y
x
y
x
y
x
y
x
y
x
y
x
y
x
y
x
y
© 2
001
McG
raw
-Hill
Co
mp
anie
s
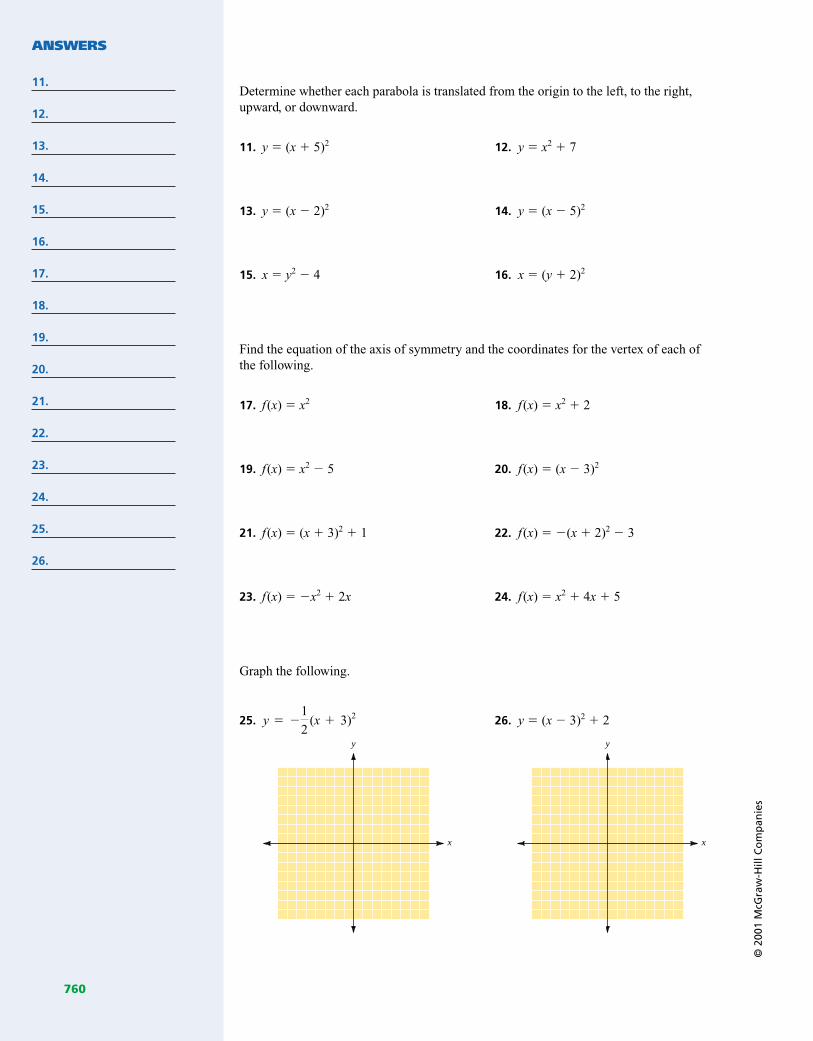
Determine whether each parabola is translated from the origin to the left, to the right,upward, or downward.
11. y � (x � 5)2 12. y � x2 � 7
13. y � (x � 2)2 14. y � (x � 5)2
15. x � y2 � 4 16. x � (y � 2)2
Find the equation of the axis of symmetry and the coordinates for the vertex of each ofthe following.
17. f(x) � x2 18. f(x) � x2 � 2
19. f(x) � x2 � 5 20. f(x) � (x � 3)2
21. f(x) � (x � 3)2 � 1 22. f(x) � �(x � 2)2 � 3
23. f(x) � �x2 � 2x 24. f(x) � x2 � 4x � 5
Graph the following.
25. 26. y � (x � 3)2 � 2
x
y
x
y
y � �1
2(x � 3)2
ANSWERS
11.
12.
13.
14.
15.
16.
17.
18.
19.
20.
21.
22.
23.
24.
25.
26.
760
27. y � �(x � 2)2 � 1 28. y � 2(x � 3)2 � 3
29. y � x2 � 2x 30. y � x2 � 4
31. y � �x2 � 1 32. y � x2 � 4x
x
y
x
y
x
y
x
y
x
y
x
y
© 2
001
McG
raw
-Hill
Co
mp
anie
sANSWERS
27.
28.
29.
30.
31.
32.
761

© 2
001
McG
raw
-Hill
Co
mp
anie
s
33. y � x2 � 2x � 3 34. y � x2 � x � 6
35. y � 2x2 � 4x � 1 36.
37. 38. y � �2x2 � 4x � 3
x
y
x
y
y � �1
3x2 � x � 2
x
y
x
y
y �1
2x2 � x � 2
x
y
x
y
ANSWERS
33.
34.
35.
36.
37.
38.
762
39. y � 3x2 � 6x � 1 40. y � �3x2 � 12x � 5
41. x � y2 � 4y 42. x � y2 � 3y
43. x � y2 � 3y � 4 44. x � �y2 � y � 6
x
y
x
y
x
y
x
y
x
y
x
y
© 2
001
McG
raw
-Hill
Co
mp
anie
sANSWERS
39.
40.
41.
42.
43.
44.
763
© 2
001
McG
raw
-Hill
Co
mp
anie
s
If you wish to check your work on some of the earlier exercises, you can graph x � y2 �3y � 4 using a graphing utility, rewrite the equation as a quadratic equation in y
y2 � 3y � (�x � 4) � 0
Then use the quadratic formula to solve for y and enter the resulting equations.
45. Profit. A company’s weekly profit P is related to the number of items sold byP(x) � �0.2x2 � 40x � 500. Find the number of items that should be sold each weekto maximize the profit. Then find the amount of that weekly profit.
46. Profit. A company’s monthly profit P is related to the number of items sold byP(x) � �0.1x2 � 30x � 1000. How many items should be sold each month to obtainthe largest possible profit? What is that profit?
47. Construction. A builder wants to enclose the largest possible rectangular area with1600 ft of fencing. What should be the dimensions of the rectangle, and what will itsarea be?
48. Construction. A farmer wants to enclose a field along a river on three sides. If1200 ft of fencing is to be used, what dimensions will give the maximum enclosedarea? Find that maximum area.
49. Motion. A ball is thrown upward into the air with an initial velocity of 64 ft/s. If hgives the height of the ball at time t, then the equation relating h and t is
h(t) � �16t2 � 64t
Find the maximum height that the ball will attain.
50. Motion. A ball is thrown upward into the air with an initial velocity of 32 ft/s. If hgives the height of the ball at time t, then the equation relating h and t is
h(t) � �16t2 � 32t
Find the maximum height that the ball will attain.
51. Under what conditions will the graph of x � a(y � k)2 � h have no y intercepts?
52. Discuss similarities and differences between the graphs of y � x2 � 3x � 4 andx � y2 � 3y � 4. Use both graphs in your discussion.
Y2 ��3 � 19 � 4(�x � 4)
4
Y1 ��3 � 19 � 4(�x � 4)
4
ANSWERS
45.
46.
47.
48.
49.
50.
51.
52.
764
Each equation below defines a relation. Write the domain of each relation.(Hint: Determine the vertex, and whether the parabola opens to the left or to the right.)
53. x � y2 � 6y 54. x � y2 � 8y
55. x � �y2 � 6y � 7 56. x � �y2 � 4y � 3
Write the domain and range of each relation.
57. y � 3(x � 2)2 � 1 58. y � (x � 1)2 � 2
59. x � (y � 1)2 � 1 60. x � (y � 2)2 � 4
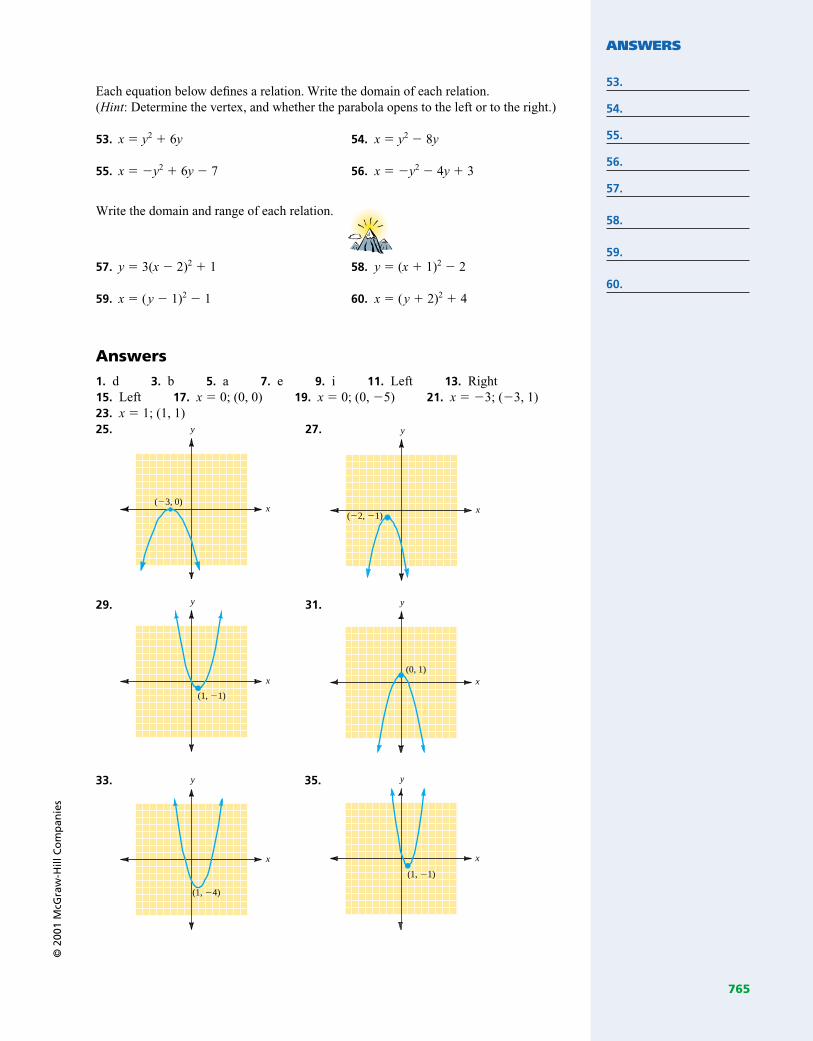
Answers1. d 3. b 5. a 7. e 9. i 11. Left 13. Right15. Left 17. x � 0; (0, 0) 19. x � 0; (0, �5) 21. x � �3; (�3, 1)23. x � 1; (1, 1)25. 27.
29. 31.
33. 35. y
x
(1, �1)
y
x
(1, �4)
y
x(0, 1)
y
x
(1, �1)
y
x(�2, �1)
y
x(�3, 0)
© 2
001
McG
raw
-Hill
Co
mp
anie
sANSWERS
53.
54.
55.
56.
57.
58.
59.
60.
765
© 2
001
McG
raw
-Hill
Co
mp
anie
s
37. 39.
41. 43.
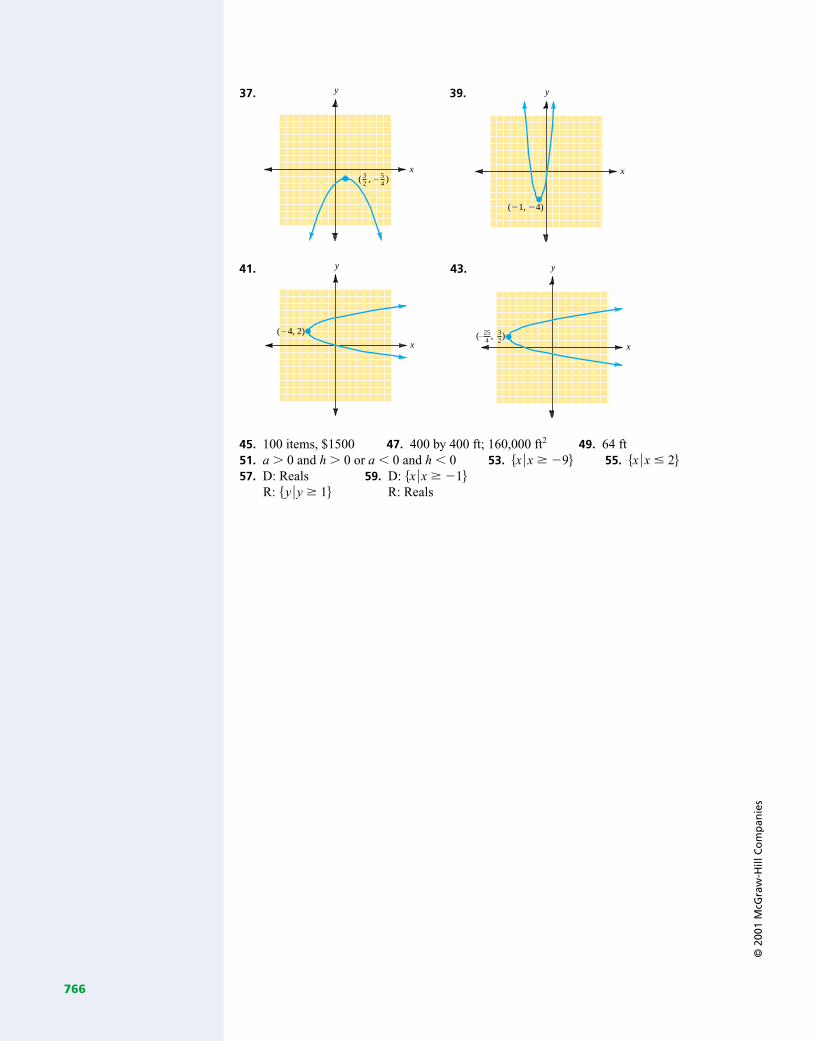
45. 100 items, $1500 47. 400 by 400 ft; 160,000 ft2 49. 64 ft51. a � 0 and h � 0 or a � 0 and h � 0 53. �x �x � �9� 55. �x �x 2�57. D: Reals 59. D: �x �x � �1�
R: �y �y � 1� R: Reals
y
x
254
�( , )32
y
x
(�4, 2)
y
x
(�1, �4)
y
x32
( , )54
�
766