Embed Size (px)
Citation preview
1.01 Government Programs: 1.01 Government Programs: CMS and Pay for CMS and Pay for
Performance: Current IssuesPerformance: Current Issues
David David SaSaÿÿenenCMS Regional AdministratorCMS Regional Administrator
March 2009March 2009
OverviewOverview
Why valueWhy value--based purchasing?based purchasing?What demonstrations are underway?What demonstrations are underway?•• Hospital demonstrationsHospital demonstrations•• Physician demonstrationsPhysician demonstrations•• Other Other
Lessons learnedLessons learnedWhat demonstrations are planned?What demonstrations are planned?
ValueValue--Based Purchasing DriversBased Purchasing Drivers
Focus on improving quality & efficiencyFocus on improving quality & efficiencyGrowing calls for rewarding performance, Growing calls for rewarding performance, demanding value for the dollars Medicare demanding value for the dollars Medicare spendsspends•• Lower costs without reducing quality?Lower costs without reducing quality?•• Better outcomes at same costs?Better outcomes at same costs?ChallengesChallenges•• Diverse & unique needs of 44 million Diverse & unique needs of 44 million
beneficiariesbeneficiaries•• Fragmented delivery system: 700,000 Fragmented delivery system: 700,000
physicians, 5,000 hospitals, etc.physicians, 5,000 hospitals, etc.
ValueValue--Driven DemonstrationsDriven Demonstrations
Hospital quality incentivesHospital quality incentivesPhysician payPhysician pay--forfor--performanceperformanceESRD disease managementESRD disease managementHome health payHome health pay--forfor--performanceperformanceGainsharingGainsharingAcute care episodeAcute care episodeElectronic health recordsElectronic health recordsNursing home valueNursing home value--based based purchasingpurchasing
Hospital Quality Incentive Hospital Quality Incentive Demonstration (HQID)Demonstration (HQID)
Partnership with Premier, Inc.Partnership with Premier, Inc.•• Uses financial incentives to encourage Uses financial incentives to encourage
hospitals to provide high quality hospitals to provide high quality inpatient careinpatient care
•• Test the impact of quality incentivesTest the impact of quality incentives
~250 hospitals in 36 states~250 hospitals in 36 statesImplemented October 2003Implemented October 2003•• Phase II, 2006Phase II, 2006--20092009
HQID GoalsHQID Goals
Test hypothesis that qualityTest hypothesis that quality--based based incentives would raise the entire incentives would raise the entire distribution of hospitalsdistribution of hospitals’’ performance performance on selected quality metricson selected quality metricsEvaluate the impact of incentives on Evaluate the impact of incentives on quality (process and outcomes) and quality (process and outcomes) and cost cost
HQID Hospital ScoringHQID Hospital Scoring
Hospitals scored on quality measures Hospitals scored on quality measures related to 5 conditions (36 measures related to 5 conditions (36 measures and 21 test measures in year 4)and 21 test measures in year 4)RollRoll--up individual measures into up individual measures into overall score for each conditionoverall score for each conditionCategorized into deciles by condition Categorized into deciles by condition to determine top performersto determine top performersIncentives paid separately for each Incentives paid separately for each conditioncondition
Clinical AreasClinical Areas
Heart FailureHeart FailureCommunity Acquired PneumoniaCommunity Acquired PneumoniaAMIAMIHeart BypassHeart BypassHip and Knee ReplacementHip and Knee Replacement
Demonstration Phase II PoliciesDemonstration Phase II Policies
Incentives if exceed baseline meanIncentives if exceed baseline mean•• Two years earlier Two years earlier •• 40% of $$40% of $$Pay for highest 20% attainmentPay for highest 20% attainment•• No difference between deciles No difference between deciles •• 30% of $$30% of $$Pay for 20% highest improvementPay for 20% highest improvement•• Must also exceed baseline mean Must also exceed baseline mean •• 30% of $$30% of $$
HQID Years 1 thru 4HQID Years 1 thru 4
Quality scored improved by an average of Quality scored improved by an average of 17% over 417% over 4--year periodyear period
Incentive payments averaged $8.2 million Incentive payments averaged $8.2 million to ~120 hospitals in each of years 1to ~120 hospitals in each of years 1--33
Incentive payments of $12 million were Incentive payments of $12 million were spread across 225 hospitals in year 4spread across 225 hospitals in year 4
HQID Value AddedHQID Value Added
Demo Demo ““proof of conceptproof of concept”” useful in useful in development of proposal for national development of proposal for national valuevalue--based purchasing programbased purchasing program
Demo hospitals improved care, Demo hospitals improved care, reduced morbidity and mortality for reduced morbidity and mortality for thousands of patientsthousands of patients
Physician Group Practice (PGP) Physician Group Practice (PGP) DemonstrationDemonstration
10 physician groups (10 physician groups (≥≥200 200 physicians)physicians)•• ~ 5,000 physicians~ 5,000 physicians•• ~ 225,000 Medicare fee~ 225,000 Medicare fee--forfor--service service
beneficiariesbeneficiaries
April 2005 implementation (now in April 2005 implementation (now in 55thth year)year)
PGP Goals & ObjectivesPGP Goals & Objectives
Encourage coordination of Medicare Encourage coordination of Medicare Part A & Part B servicesPart A & Part B servicesReward physicians for improving Reward physicians for improving quality and outcomesquality and outcomesPromote efficiencyPromote efficiencyIdentify interventions that yielded Identify interventions that yielded improved outcomes and savingsimproved outcomes and savings
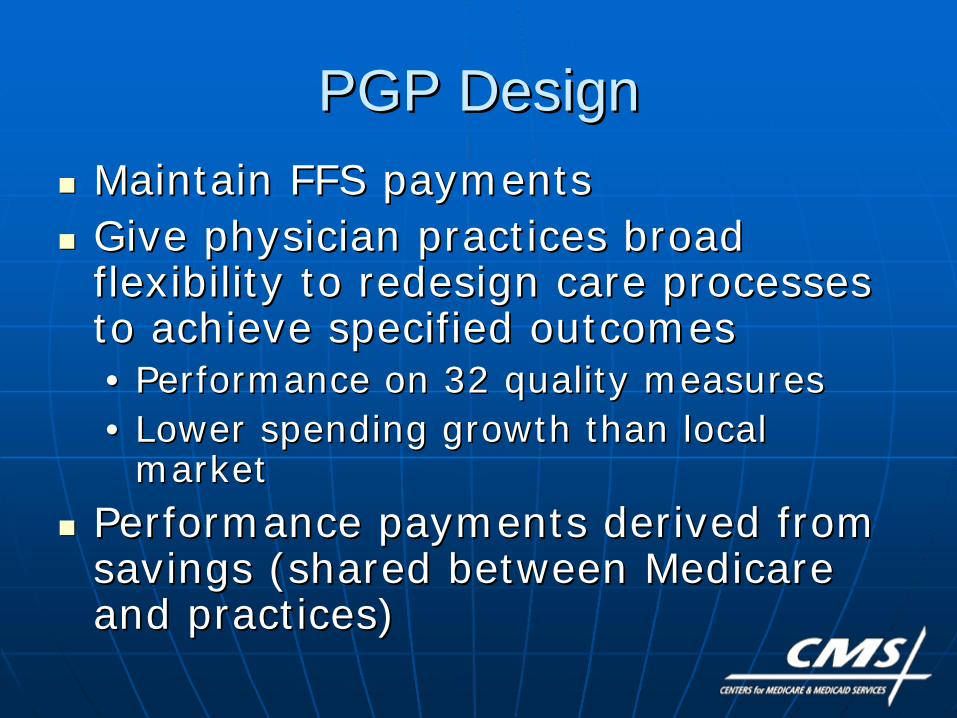
PGP DesignPGP DesignMaintain FFS paymentsMaintain FFS paymentsGive physician practices broad Give physician practices broad flexibility to redesign care processes flexibility to redesign care processes to achieve specified outcomes to achieve specified outcomes •• Performance on 32 quality measuresPerformance on 32 quality measures•• Lower spending growth than local Lower spending growth than local
marketmarketPerformance payments derived from Performance payments derived from savings (shared between Medicare savings (shared between Medicare and practices)and practices)
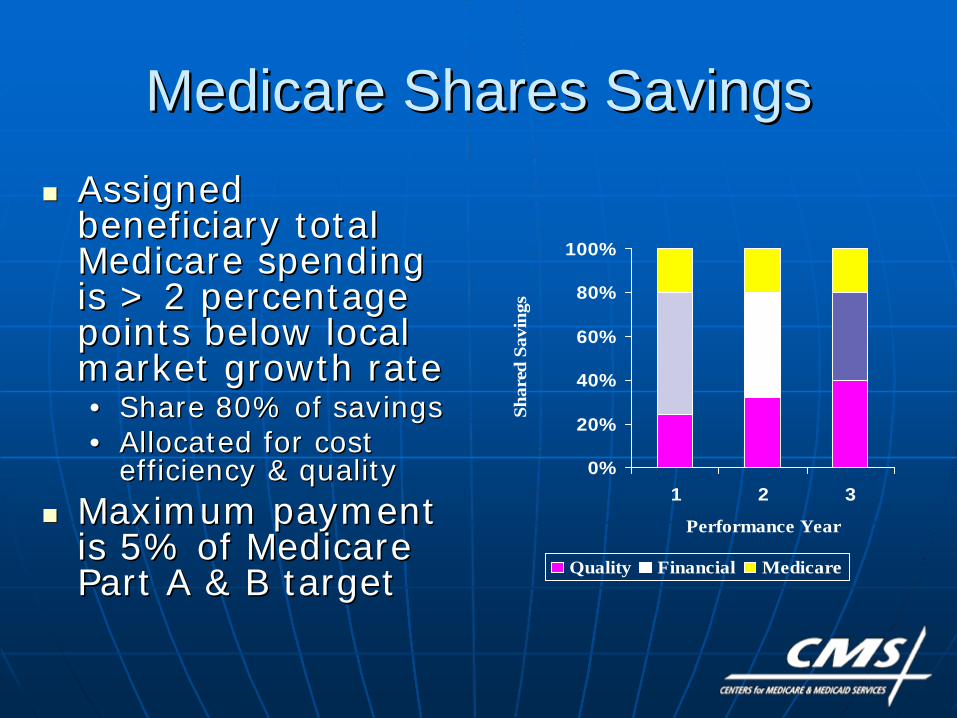
Medicare Shares SavingsMedicare Shares Savings
0%
20%
40%
60%
80%
100%
1 2 3
Performance YearSh
ared
Sav
ings
Quality Financial Medicare
Assigned Assigned beneficiary total beneficiary total Medicare spending Medicare spending is > 2 percentage is > 2 percentage points below local points below local market growth ratemarket growth rate•• Share 80% of savingsShare 80% of savings•• Allocated for cost Allocated for cost
efficiency & qualityefficiency & qualityMaximum payment Maximum payment is 5% of Medicare is 5% of Medicare Part A & B targetPart A & B target
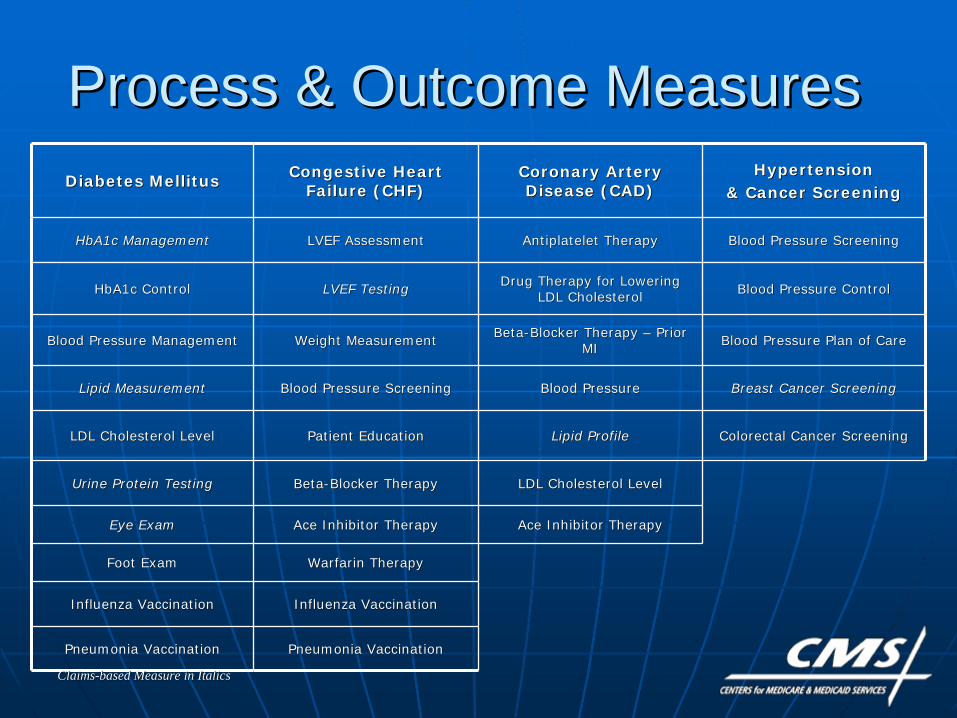
Process & Outcome MeasuresProcess & Outcome MeasuresDiabetes MellitusDiabetes Mellitus Congestive Heart Congestive Heart
Failure (CHF)Failure (CHF)Coronary Artery Coronary Artery Disease (CAD)Disease (CAD)
Hypertension Hypertension & Cancer Screening& Cancer Screening
HbA1c ManagementHbA1c Management LVEF AssessmentLVEF Assessment AntiplateletAntiplatelet TherapyTherapy Blood Pressure ScreeningBlood Pressure Screening
HbA1c ControlHbA1c Control LVEF TestingLVEF Testing Drug Therapy for Lowering Drug Therapy for Lowering LDL CholesterolLDL Cholesterol Blood Pressure ControlBlood Pressure Control
Blood Pressure ManagementBlood Pressure Management Weight MeasurementWeight Measurement BetaBeta--Blocker Therapy Blocker Therapy –– Prior Prior MIMI Blood Pressure Plan of CareBlood Pressure Plan of Care
Lipid MeasurementLipid Measurement Blood Pressure ScreeningBlood Pressure Screening Blood PressureBlood Pressure Breast Cancer ScreeningBreast Cancer Screening
LDL Cholesterol LevelLDL Cholesterol Level Patient EducationPatient Education Lipid ProfileLipid Profile Colorectal Cancer ScreeningColorectal Cancer Screening
Urine Protein TestingUrine Protein Testing BetaBeta--Blocker TherapyBlocker Therapy LDL Cholesterol LevelLDL Cholesterol Level
Eye ExamEye Exam Ace Inhibitor TherapyAce Inhibitor Therapy Ace Inhibitor TherapyAce Inhibitor Therapy
Foot ExamFoot Exam WarfarinWarfarin TherapyTherapy
Influenza VaccinationInfluenza Vaccination Influenza VaccinationInfluenza Vaccination
Pneumonia VaccinationPneumonia Vaccination Pneumonia VaccinationPneumonia Vaccination
ClaimsClaims--based Measure in Italicsbased Measure in Italics
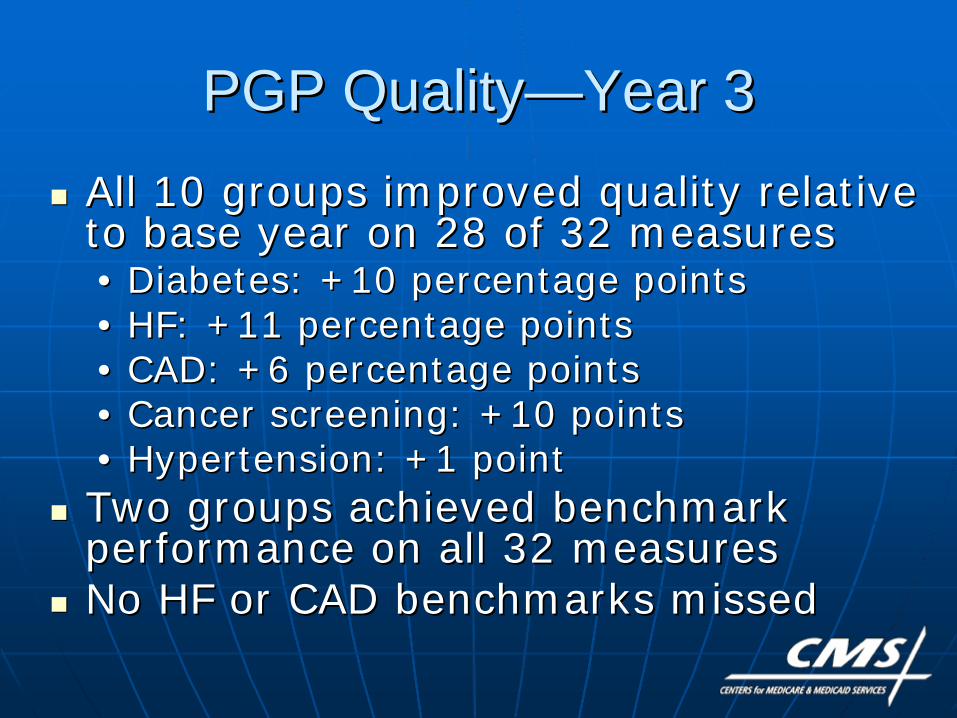
PGP QualityPGP Quality——Year 3Year 3
All 10 groups improved quality relative All 10 groups improved quality relative to base year on 28 of 32 measuresto base year on 28 of 32 measures•• Diabetes: +10 percentage pointsDiabetes: +10 percentage points•• HF: +11 percentage pointsHF: +11 percentage points•• CAD: +6 percentage pointsCAD: +6 percentage points•• Cancer screening: +10 pointsCancer screening: +10 points•• Hypertension: +1 pointHypertension: +1 pointTwo groups achieved benchmark Two groups achieved benchmark performance on all 32 measuresperformance on all 32 measuresNo HF or CAD benchmarks missedNo HF or CAD benchmarks missed
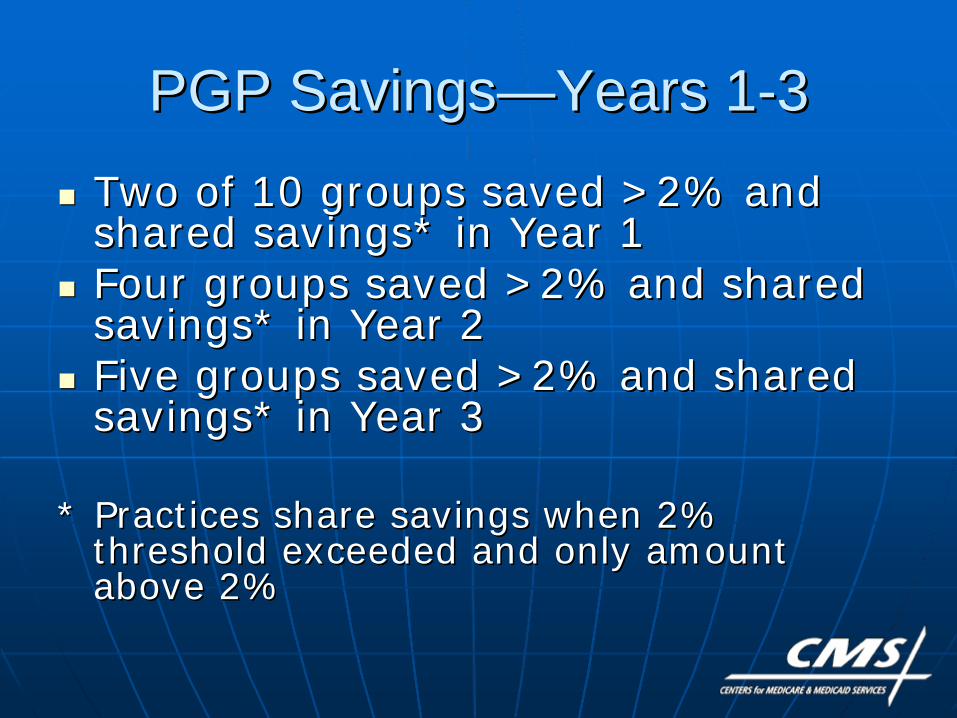
PGP SavingsPGP Savings——Years 1Years 1--33
Two of 10 groups saved >2% and Two of 10 groups saved >2% and shared savings* in Year 1shared savings* in Year 1Four groups saved >2% and shared Four groups saved >2% and shared savings* in Year 2savings* in Year 2Five groups saved >2% and shared Five groups saved >2% and shared savings* in Year 3savings* in Year 3
* Practices share savings when 2% * Practices share savings when 2% threshold exceeded and only amount threshold exceeded and only amount above 2%above 2%
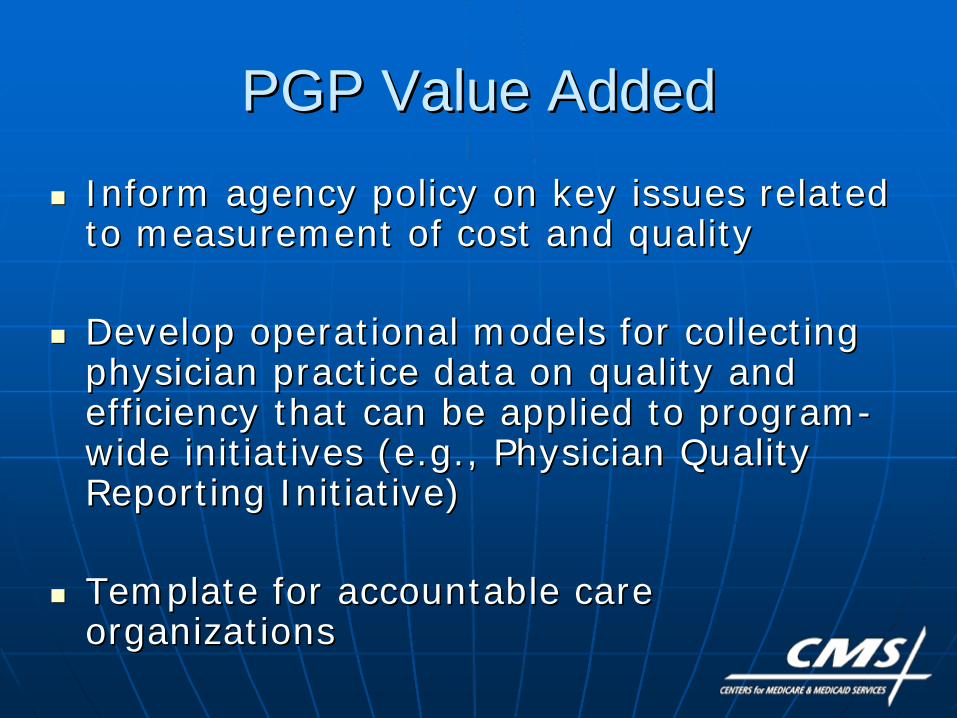
PGP Value AddedPGP Value AddedInform agency policy on key issues related Inform agency policy on key issues related to measurement of cost and qualityto measurement of cost and quality
Develop operational models for collecting Develop operational models for collecting physician practice data on quality and physician practice data on quality and efficiency that can be applied to programefficiency that can be applied to program--wide initiatives (e.g., Physician Quality wide initiatives (e.g., Physician Quality Reporting Initiative)Reporting Initiative)
Template for accountable care Template for accountable care organizationsorganizations
Medicare Care Management Medicare Care Management Performance DemonstrationPerformance Demonstration
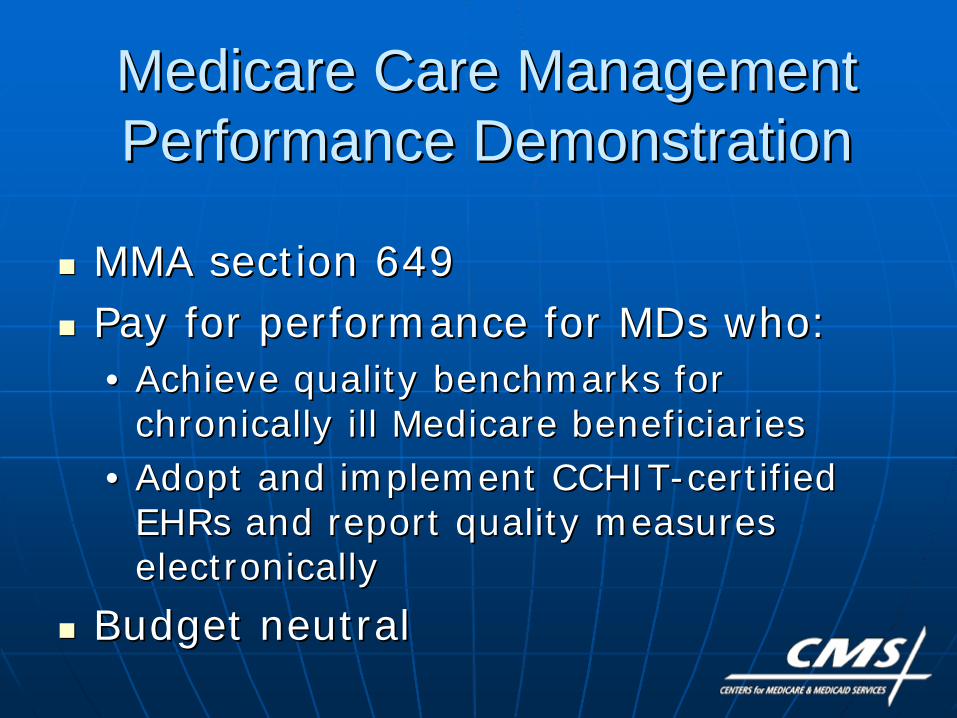
MMA section 649MMA section 649Pay for performance for MDs who: Pay for performance for MDs who: •• Achieve quality benchmarks for Achieve quality benchmarks for
chronically ill Medicare beneficiarieschronically ill Medicare beneficiaries•• Adopt and implement CCHITAdopt and implement CCHIT--certified certified
EHRsEHRs and report quality measures and report quality measures electronicallyelectronically
Budget neutralBudget neutral
MCMP GoalsMCMP Goals
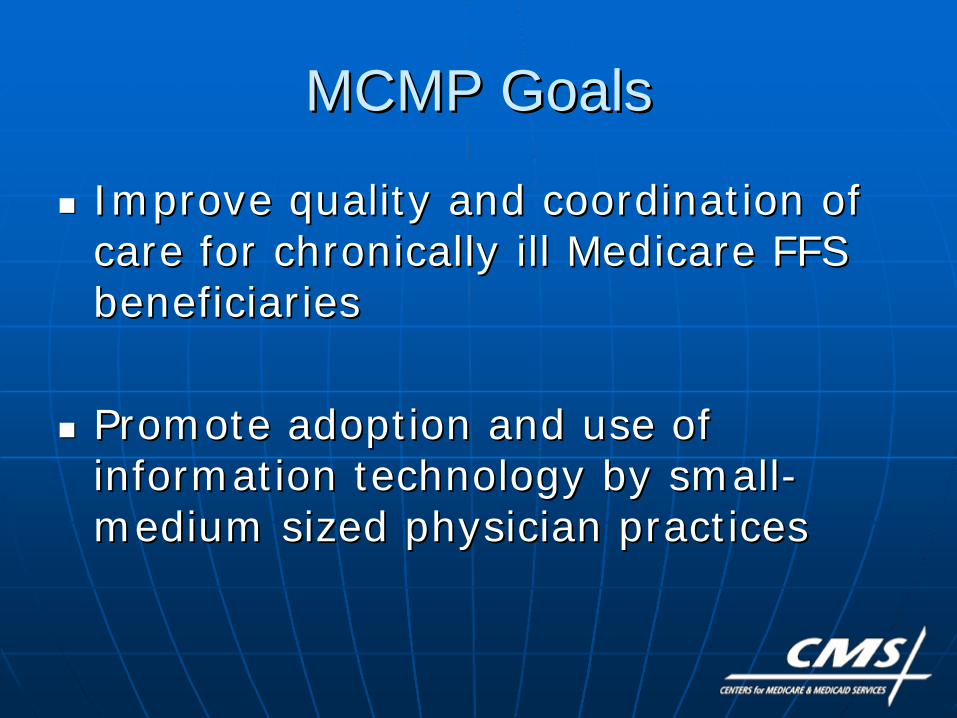
Improve quality and coordination of Improve quality and coordination of care for chronically ill Medicare FFS care for chronically ill Medicare FFS beneficiariesbeneficiaries
Promote adoption and use of Promote adoption and use of information technology by smallinformation technology by small--medium sized physician practicesmedium sized physician practices
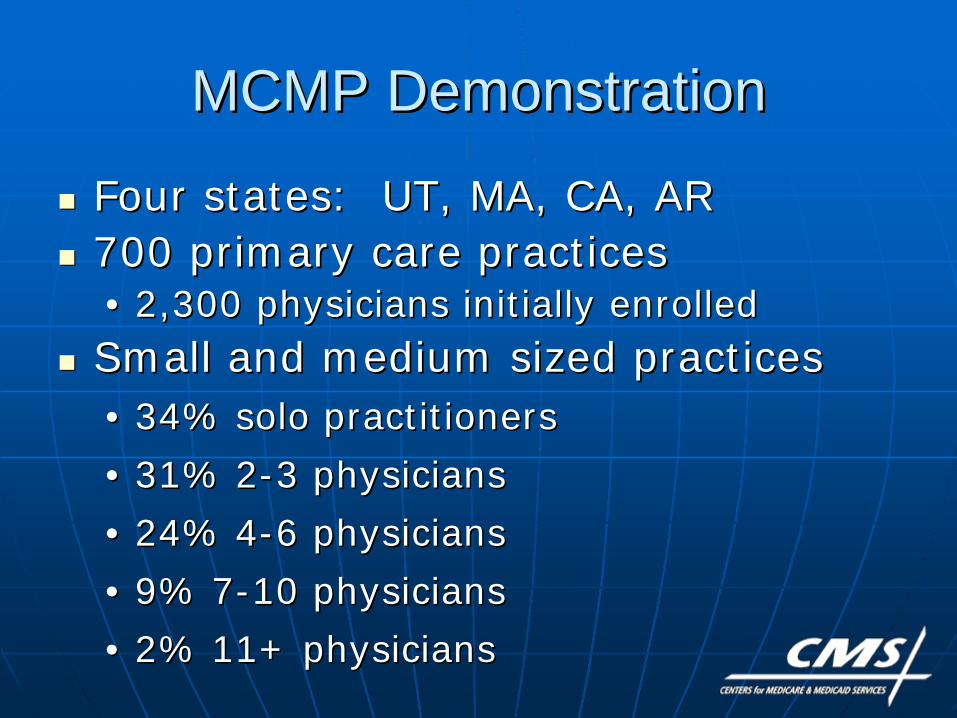
MCMP DemonstrationMCMP Demonstration
Four states: UT, MA, CA, ARFour states: UT, MA, CA, AR700 primary care practices700 primary care practices•• 2,300 physicians initially enrolled 2,300 physicians initially enrolled Small and medium sized practicesSmall and medium sized practices•• 34% solo practitioners34% solo practitioners•• 31% 231% 2--3 physicians3 physicians•• 24% 424% 4--6 physicians6 physicians•• 9% 79% 7--10 physicians10 physicians•• 2% 11+ physicians2% 11+ physicians
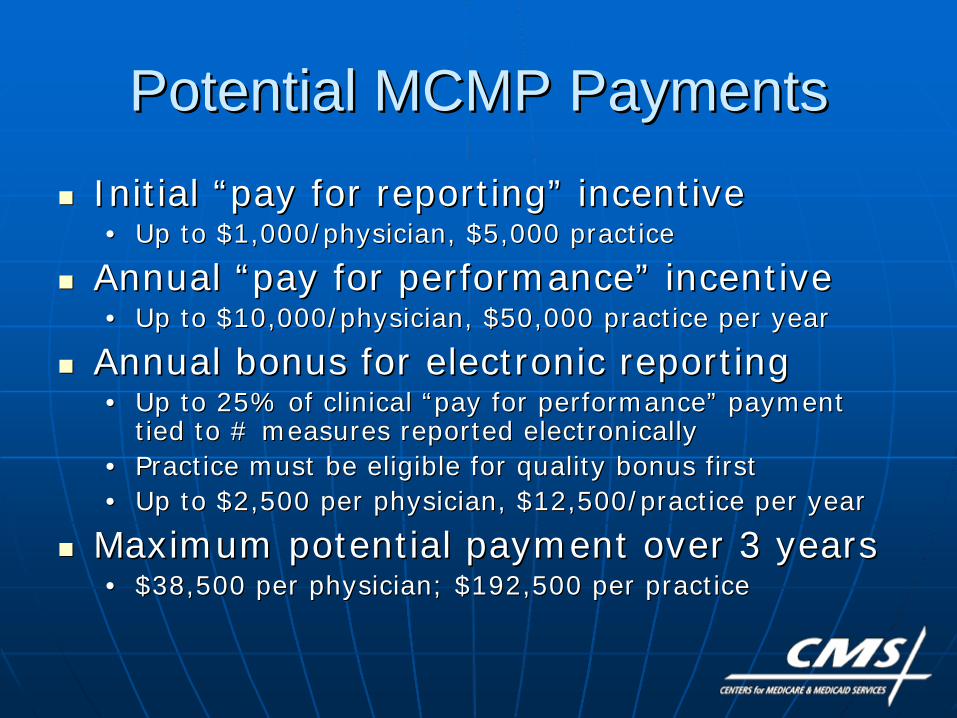
Potential MCMP PaymentsPotential MCMP PaymentsInitial Initial ““pay for reportingpay for reporting”” incentiveincentive•• Up to $1,000/physician, $5,000 practiceUp to $1,000/physician, $5,000 practice
Annual Annual ““pay for performancepay for performance”” incentiveincentive•• Up to $10,000/physician, $50,000 practice per yearUp to $10,000/physician, $50,000 practice per year
Annual bonus for electronic reportingAnnual bonus for electronic reporting•• Up to 25% of clinical Up to 25% of clinical ““pay for performancepay for performance”” payment payment
tied to # measures reported electronicallytied to # measures reported electronically•• Practice must be eligible for quality bonus firstPractice must be eligible for quality bonus first•• Up to $2,500 per physician, $12,500/practice per yearUp to $2,500 per physician, $12,500/practice per year
Maximum potential payment over 3 yearsMaximum potential payment over 3 years•• $38,500 per physician; $192,500 per practice$38,500 per physician; $192,500 per practice
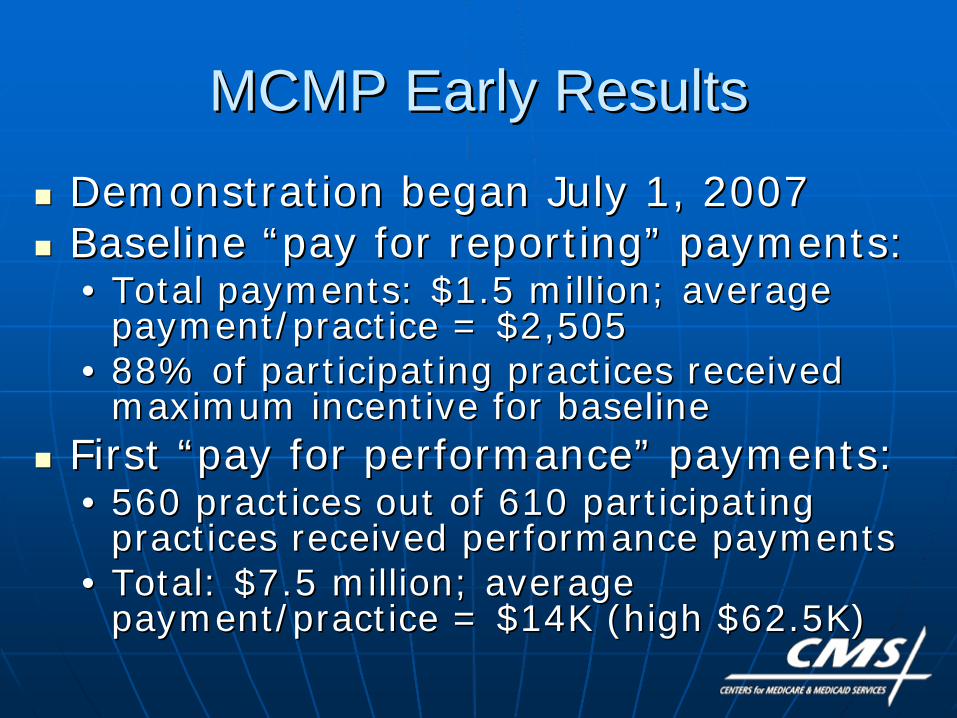
MCMP Early ResultsMCMP Early Results
Demonstration began July 1, 2007Demonstration began July 1, 2007Baseline Baseline ““pay for reportingpay for reporting”” payments:payments:•• Total payments: $1.5 million; average Total payments: $1.5 million; average
payment/practice = $2,505payment/practice = $2,505•• 88% of participating practices received 88% of participating practices received
maximum incentive for baseline maximum incentive for baseline First First ““pay for performancepay for performance”” payments:payments:•• 560 practices out of 610 participating 560 practices out of 610 participating
practices received performance paymentspractices received performance payments•• Total: $7.5 million; average Total: $7.5 million; average
payment/practice = $14K (high $62.5K)payment/practice = $14K (high $62.5K)
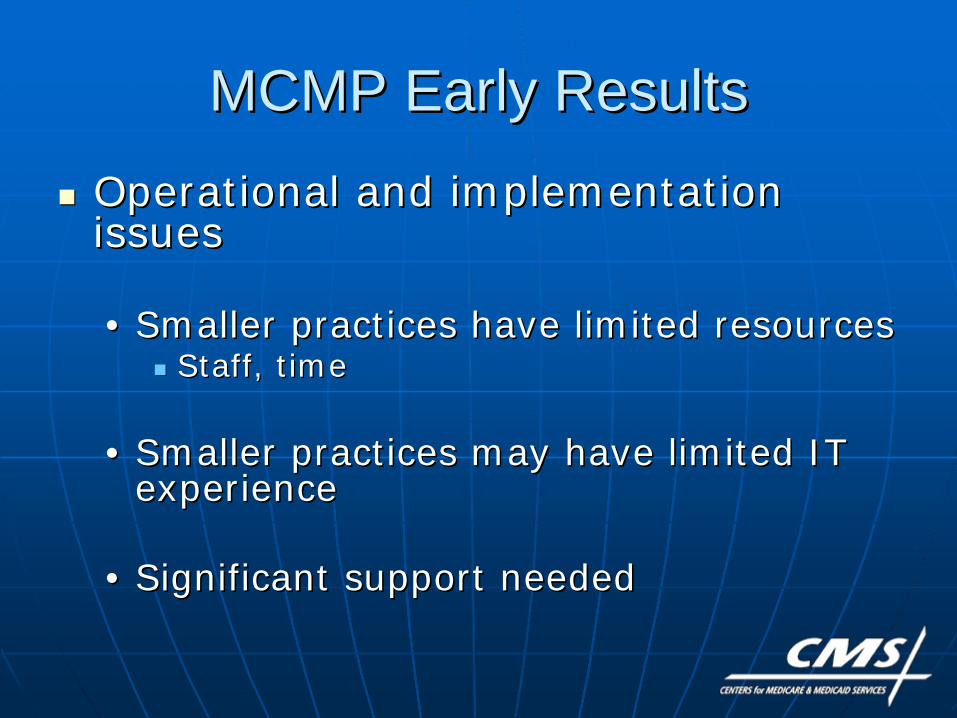
MCMP Early ResultsMCMP Early Results
Operational and implementation Operational and implementation issuesissues
•• Smaller practices have limited resources Smaller practices have limited resources Staff, time Staff, time
•• Smaller practices may have limited IT Smaller practices may have limited IT experience experience
•• Significant support neededSignificant support needed
MCMP Value AddedMCMP Value Added
Establishes foundation for Establishes foundation for accelerated implementation of EHR accelerated implementation of EHR demonstrationdemonstration
Use lessons from MCMP to shape Use lessons from MCMP to shape valuevalue--based initiatives for physician based initiatives for physician services under Medicare (e.g., PQRI, services under Medicare (e.g., PQRI, EHR)EHR)
ESRD Disease Management ESRD Disease Management Demonstration GoalsDemonstration Goals
Test disease management models for Test disease management models for beneficiaries with ESRDbeneficiaries with ESRDEvaluate results in a managed care Evaluate results in a managed care settingsettingPilot test quality incentive payments Pilot test quality incentive payments for ESRD measuresfor ESRD measures
Quality Incentive PaymentQuality Incentive Payment
Five percent of capitation payment Five percent of capitation payment reserved for quality incentive reserved for quality incentive paymentpaymentTwo kinds of quality outcome Two kinds of quality outcome objectivesobjectives•• Improvement over prior year Improvement over prior year
performanceperformance•• Improvement over a national target Improvement over a national target
Clinical IndicatorsClinical Indicators
Adequacy of Adequacy of hemodialysishemodialysisAnemia managementAnemia managementAlbuminAlbumin--corrected serum calciumcorrected serum calciumSerum phosphorusSerum phosphorusVascular accessVascular access•• Percent of patients with catheter in usePercent of patients with catheter in use•• Percent of patients with AV fistula in usePercent of patients with AV fistula in use

What Have We Learned?What Have We Learned?
Lessons LearnedLessons Learned
ValueValue--based purchasing can work: it based purchasing can work: it provides a framework for an provides a framework for an organizational focus on qualityorganizational focus on quality
Potential spillover to overall quality, Potential spillover to overall quality, not just not just ““teach to the testteach to the test””
Jury still out re: public reporting Jury still out re: public reporting alone, savings, unintended alone, savings, unintended consequencesconsequences
Lessons Learned: Lessons Learned: Financial Incentives Financial Incentives
Modest financial incentives can be Modest financial incentives can be adequate to change behavior, yield adequate to change behavior, yield sustained improvement over timesustained improvement over timeMeasurement of savings is highly Measurement of savings is highly sensitive to target setting sensitive to target setting methodology, risk adjustment of methodology, risk adjustment of beneficiary population, size of demo beneficiary population, size of demo populationpopulationGenerating savings or reducing Generating savings or reducing expenditure growth is difficultexpenditure growth is difficult
Lessons Learned:Lessons Learned: Quality Measures Quality Measures
Determining quality measures is difficult Determining quality measures is difficult and requires much developmentand requires much development•• Clearly defined goals, measure Clearly defined goals, measure
specifications and reporting specifications and reporting methodologymethodology
•• Consistent with clinical practice and high Consistent with clinical practice and high quality carequality care——physician/provider buyphysician/provider buy--inin
•• Easier to measure underuse (gaps in Easier to measure underuse (gaps in care) than overuse (unnecessary, care) than overuse (unnecessary, duplicative, futile)duplicative, futile)
Lessons Learned: Lessons Learned: Quality MeasuresQuality Measures
Changing measures frequently creates Changing measures frequently creates provider angstprovider angstProcesses more readily moved than Processes more readily moved than outcomesoutcomes•• Ceiling effect may render some Ceiling effect may render some
measures obsoletemeasures obsolete•• Effect potential continued improvement Effect potential continued improvement
by shift to personby shift to person--level measurement level measurement (appropriate(appropriate--care model)care model)
Lessons Learned: Lessons Learned: Quality Reporting Quality Reporting
Increases awareness and documentation Increases awareness and documentation of care processesof care processes
Outreach and education are important for Outreach and education are important for provider understanding and accurate and provider understanding and accurate and consistent reportingconsistent reporting
Measuring/reporting quality creates Measuring/reporting quality creates opportunity for providers to standardize opportunity for providers to standardize care processes and redesign workflows to care processes and redesign workflows to improve delivery at point of careimprove delivery at point of care
Lessons Learned:Lessons Learned: Organizational ParticipationOrganizational Participation
Leadership, organizational champions and Leadership, organizational champions and dedicated resources are criticaldedicated resources are critical
Providers volunteer to gain experience Providers volunteer to gain experience with initiatives consistent with their with initiatives consistent with their strategic visions and market objectivesstrategic visions and market objectives
Wide distribution of incentives Wide distribution of incentives (improvement and attainment) may help (improvement and attainment) may help maintain interest and supportmaintain interest and support
Administrative, clinical, data (EHR) and Administrative, clinical, data (EHR) and financial integration appears necessary financial integration appears necessary (but not sufficient) to produce savings(but not sufficient) to produce savings

Whither Next?Whither Next?
Home Health PayHome Health Pay--forfor-- Performance DemonstrationPerformance Demonstration
Objective: Objective: Test Test whether performancewhether performance--based based incentives can improve incentives can improve quality and reduce quality and reduce program costs of Medicare home health program costs of Medicare home health beneficiaries. Two year demonstration, beneficiaries. Two year demonstration, ended on Dec. 31, 2009.ended on Dec. 31, 2009.
~ 600 home health agencies in 4 regions ~ 600 home health agencies in 4 regions randomized into intervention and control randomized into intervention and control groupsgroups•• Northeast: Connecticut, MassachusettsNortheast: Connecticut, Massachusetts•• Midwest: IllinoisMidwest: Illinois•• South: Alabama, Georgia, TennesseeSouth: Alabama, Georgia, Tennessee•• West: CaliforniaWest: California
Home Health PayHome Health Pay--forfor-- Performance DemonstrationPerformance Demonstration7 quality measures (A7 quality measures (Acute care cute care hospitalization, Emergent care, Bathing, hospitalization, Emergent care, Bathing, Ambulation/Locomotion, Transferring, Ambulation/Locomotion, Transferring, Management of oral medications, Status Management of oral medications, Status of surgical wounds)of surgical wounds)
Performance scored and incentives paid to Performance scored and incentives paid to HHAsHHAs for each for each measure separatelymeasure separately•• HHAsHHAs w/ top 20% of performance scores w/ top 20% of performance scores •• HHAsHHAs w/ top 20% of improvement gainsw/ top 20% of improvement gains
GainsharingGainsharing OverviewOverview
Means to align incentives between Means to align incentives between hospitals and physicianshospitals and physiciansHospitals pay physicians a share of Hospitals pay physicians a share of savings that result from collaborative savings that result from collaborative efforts between the hospital and the efforts between the hospital and the physician to improve quality and physician to improve quality and efficiencyefficiencyRequires waiver of civil money Requires waiver of civil money penaltiespenalties
Two Two GainsharingGainsharing DemonstrationsDemonstrations
DRA Sec. 5007: Medicare Hospital DRA Sec. 5007: Medicare Hospital GainsharingGainsharing DemonstrationDemonstration•• 2 hospitals 2 hospitals •• October 2008 implementation (ends October 2008 implementation (ends
Dec. 2009)Dec. 2009)MMA Sec. 646: Physician Hospital MMA Sec. 646: Physician Hospital Collaboration DemonstrationCollaboration Demonstration•• Consortium of 12 New Jersey hospitalsConsortium of 12 New Jersey hospitals•• July 2009 implementationJuly 2009 implementation
Demonstration GoalsDemonstration Goals
Improve quality and efficiency of Improve quality and efficiency of care care Encourage physicianEncourage physician--hospital hospital collaboration by permitting hospitals collaboration by permitting hospitals to share internal savingsto share internal savingsCMS open to wide variety of models; CMS open to wide variety of models; projects must be budget neutralprojects must be budget neutral
GainsharingGainsharing PaymentsPayments
No change in Medicare paymentsNo change in Medicare payments to to gainsharinggainsharing hospitals hospitals Must represent share of internal Must represent share of internal hospitalhospital savings and be tied to savings and be tied to quality improvementquality improvementNo payments for referralsNo payments for referralsLimited to 25% of physician fees for Limited to 25% of physician fees for care of patients affected by quality care of patients affected by quality improvement activityimprovement activity
GainsharingGainsharing PaymentsPayments
GainsharingGainsharing must be a transparent must be a transparent arrangement that clearly identifies arrangement that clearly identifies the actions that are expected to the actions that are expected to result in cost savings result in cost savings Incentives must be reviewable, Incentives must be reviewable, auditable, and implemented auditable, and implemented uniformly across physicians uniformly across physicians Payments must be linked to quality Payments must be linked to quality and efficiencyand efficiency
Possible ApproachesPossible ApproachesReduced time to diagnosisReduced time to diagnosisImproved scheduling of OR, ICU Improved scheduling of OR, ICU Reduced duplicate or marginal testsReduced duplicate or marginal testsReduced drug interactions, adverse eventsReduced drug interactions, adverse eventsImproved discharge planning and care Improved discharge planning and care coordinationcoordinationReduced surgical infections and Reduced surgical infections and complicationscomplicationsReduced cost of devices and suppliesReduced cost of devices and supplies
Acute Care Episode (ACE) Acute Care Episode (ACE) Demonstration Demonstration
Tests a discounted global payment Tests a discounted global payment for acute care hospital stay and for acute care hospital stay and corresponding physician servicescorresponding physician servicesIncludes 28 cardiovascular and 9 Includes 28 cardiovascular and 9 orthopedic MSorthopedic MS--DRGsDRGsCovers Medicare feeCovers Medicare fee--forfor--service service admissions at selected sitesadmissions at selected sitesWill use 22 quality measures to Will use 22 quality measures to monitor the programmonitor the program
Demonstration GoalsDemonstration Goals
Improve quality of care through consumer Improve quality of care through consumer and provider understanding of both price and provider understanding of both price and quality informationand quality informationIncrease provider collaborationIncrease provider collaborationReduce Medicare payments for acute care Reduce Medicare payments for acute care services using market mechanismsservices using market mechanismsBuild platform for potential expansionsBuild platform for potential expansions——geography, additional MSgeography, additional MS--DRGsDRGs, post, post--acute care acute care
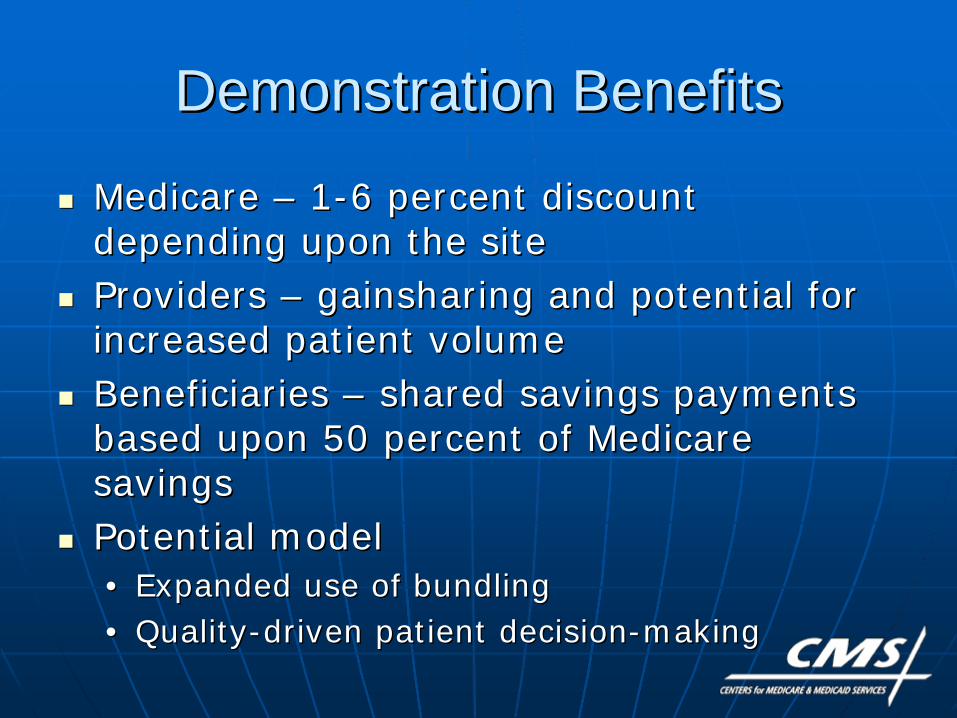
Demonstration BenefitsDemonstration Benefits
Medicare Medicare –– 11--6 percent discount 6 percent discount depending upon the sitedepending upon the siteProviders Providers –– gainsharinggainsharing and potential for and potential for increased patient volumeincreased patient volumeBeneficiaries Beneficiaries –– shared savings payments shared savings payments based upon 50 percent of Medicare based upon 50 percent of Medicare savingssavingsPotential modelPotential model•• Expanded use of bundlingExpanded use of bundling•• QualityQuality--driven patient decisiondriven patient decision--makingmaking
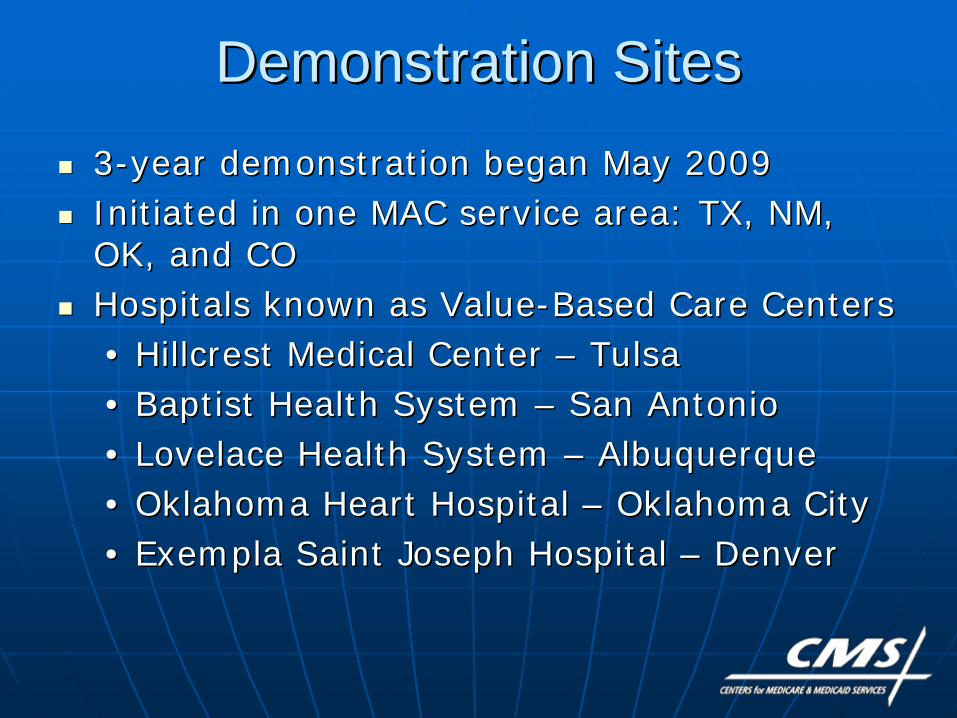
Demonstration SitesDemonstration Sites33--year demonstration began May 2009year demonstration began May 2009Initiated in one MAC service area: TX, NM, Initiated in one MAC service area: TX, NM, OK, and COOK, and COHospitals known as ValueHospitals known as Value--Based Care CentersBased Care Centers•• Hillcrest Medical Center Hillcrest Medical Center –– TulsaTulsa•• Baptist Health System Baptist Health System –– San AntonioSan Antonio•• Lovelace Health System Lovelace Health System –– AlbuquerqueAlbuquerque•• Oklahoma Heart Hospital Oklahoma Heart Hospital –– Oklahoma CityOklahoma City•• Exempla Saint Joseph Hospital Exempla Saint Joseph Hospital –– DenverDenver
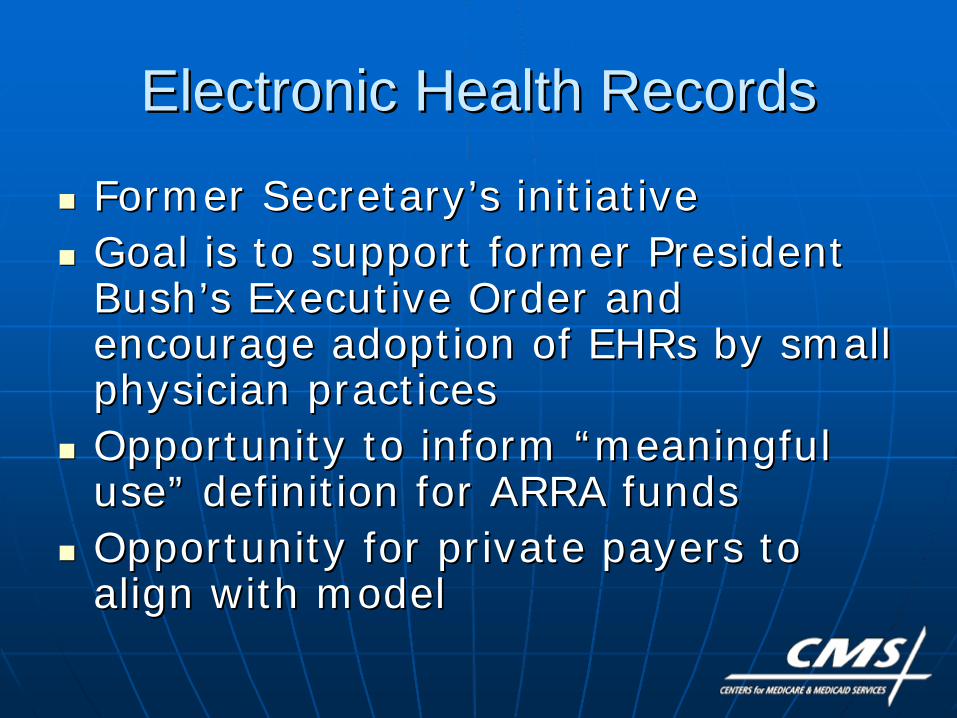
Electronic Health RecordsElectronic Health Records
Former SecretaryFormer Secretary’’s initiatives initiativeGoal is to support former President Goal is to support former President BushBush’’s Executive Order and s Executive Order and encourage adoption of encourage adoption of EHRsEHRs by small by small physician practicesphysician practicesOpportunity to inform Opportunity to inform ““meaningful meaningful useuse”” definition for ARRA fundsdefinition for ARRA fundsOpportunity for private payers to Opportunity for private payers to align with modelalign with model
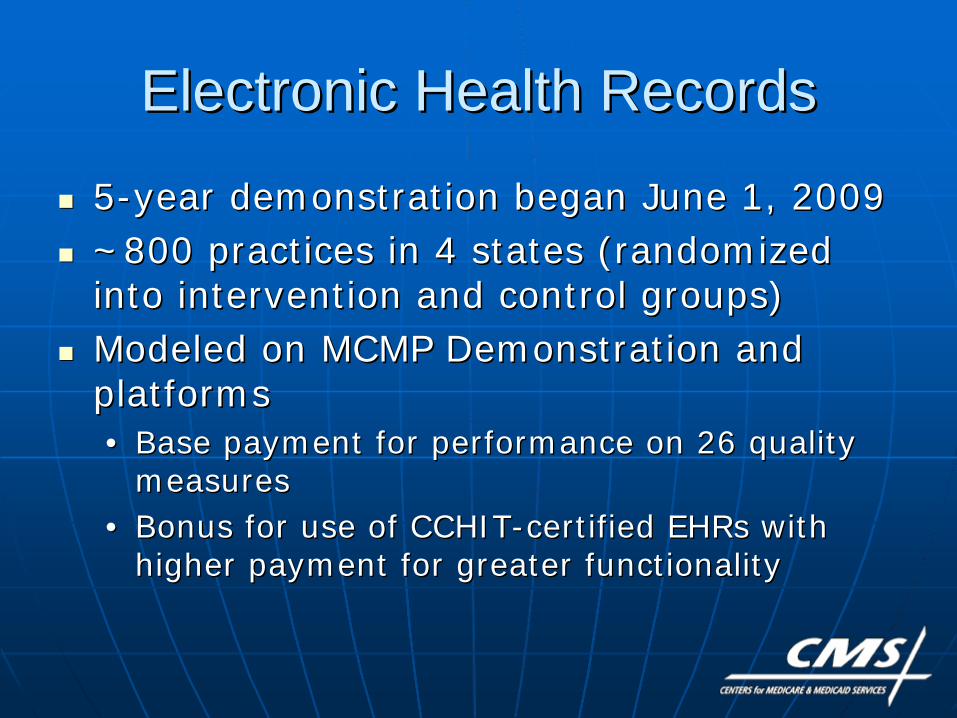
Electronic Health RecordsElectronic Health Records
55--year demonstration began June 1, 2009year demonstration began June 1, 2009~800 practices in 4 states (randomized ~800 practices in 4 states (randomized into intervention and control groups)into intervention and control groups)Modeled on MCMP Demonstration and Modeled on MCMP Demonstration and platformsplatforms•• Base payment for performance on 26 quality Base payment for performance on 26 quality
measuresmeasures•• Bonus for use of CCHITBonus for use of CCHIT--certified certified EHRsEHRs with with
higher payment for greater functionalityhigher payment for greater functionality
Nursing Home ValueNursing Home Value--Based Based Purchasing DemonstrationPurchasing Demonstration
Objective: Improve quality of care Objective: Improve quality of care for all Medicare beneficiaries in for all Medicare beneficiaries in nursing homes (shortnursing homes (short--stay or longstay or long--stay)stay)Performance payments based on Performance payments based on nursing home quality of care in 4 nursing home quality of care in 4 domains:domains:•• Nurse staffing levelsNurse staffing levels•• Hospitalization ratesHospitalization rates•• MDS outcomesMDS outcomes•• Survey deficienciesSurvey deficiencies
Nursing Home ValueNursing Home Value--Based Based Purchasing DemonstrationPurchasing Demonstration
3 states3 states——AZ, NY, WIAZ, NY, WI——selected based on selected based on state interest in state interest in ““hostinghosting”” demodemo~300 nursing homes (100 per state) ~300 nursing homes (100 per state) randomized into intervention and control randomized into intervention and control groupsgroupsBudget neutral: Incentive payments to be Budget neutral: Incentive payments to be made from each statemade from each state’’s s ““savings pool,savings pool,””which will be generated from reductions in which will be generated from reductions in inappropriate hospitalizationsinappropriate hospitalizationsThe demonstration began July 1, 2009.The demonstration began July 1, 2009.
Into the FutureInto the FutureMedical home pilot Medical home pilot –– mixed modelsmixed modelsAccountable care organizationsAccountable care organizationsPaying for episodes of carePaying for episodes of care•• Expand ACE demo Expand ACE demo –– more sites, more more sites, more
DRGsDRGs•• Incorporate postIncorporate post--acute careacute carePreventing readmissionsPreventing readmissionsGuarantees for medical care (Guarantees for medical care (GeisingerGeisinger““Proven CareProven Care”” model)model)
For More InformationFor More Information
Visit the Medicare demonstrations Visit the Medicare demonstrations Web page:Web page:http://http://www.cms.hhs.gov/DemoProjectsEvwww.cms.hhs.gov/DemoProjectsEv
alRpts/MD/list.aspalRpts/MD/list.asp
5656
Thank you!Thank you!
David David SaSaÿÿenen CMS Regional Administrator, CMS Regional Administrator,
San Francisco, Region IXSan Francisco, Region IX
Centers for Medicare & Medicaid Centers for Medicare & Medicaid ServicesServices
90 Seventh Street90 Seventh Street Suite 5Suite 5--300300
San Francisco, CA 94103San Francisco, CA [email protected]@cms.hhs.gov
(415) 744(415) 744--35013501